Embed Size (px)
Citation preview
Supplemental Figure 1. (a) Illustration of climatic water deficit (CWD) calculated as potential (PET) minus actual (AET) evapotranspiration (with monthly values shown), modified from Stephenson (1998) for mixed conifer forest in the Sierra Nevada. Panel (b) depicts simulated soil water content that is field verified on the basis of measured soil water storage at a grassland site in northern California, the Pepperwood Preserve. As seasonal precipitation (supply) diminishes in Mediterranean climates, AET drives the accumulation of deficit (CWD) as soil moisture declines over the season. Field verification is accomplished as the simulated total soil water storage (simulated over approximately 96.5 cm(38”)) matches measured storage.
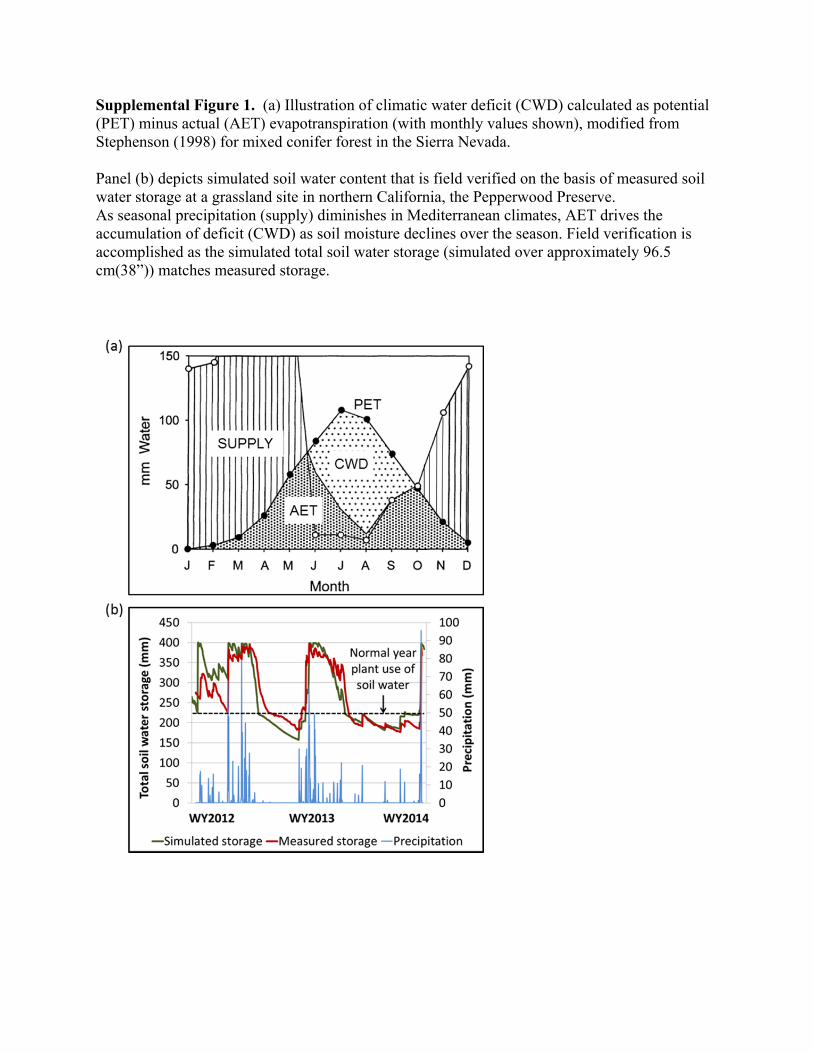
Supplemental Figure 2. Changes in large tree (> 61 cm dbh) density are correlated with changes in forest basal area between historical (1930’s; VTM) and contemporary (2000’s; FIA) forest surveys of California (y= 1.18x -9.7; F1,321=940, P < 0.001). Points represent values of tree density and basal area from rasterized grids (~20 km) in each time period (e.g. Fig. 2).
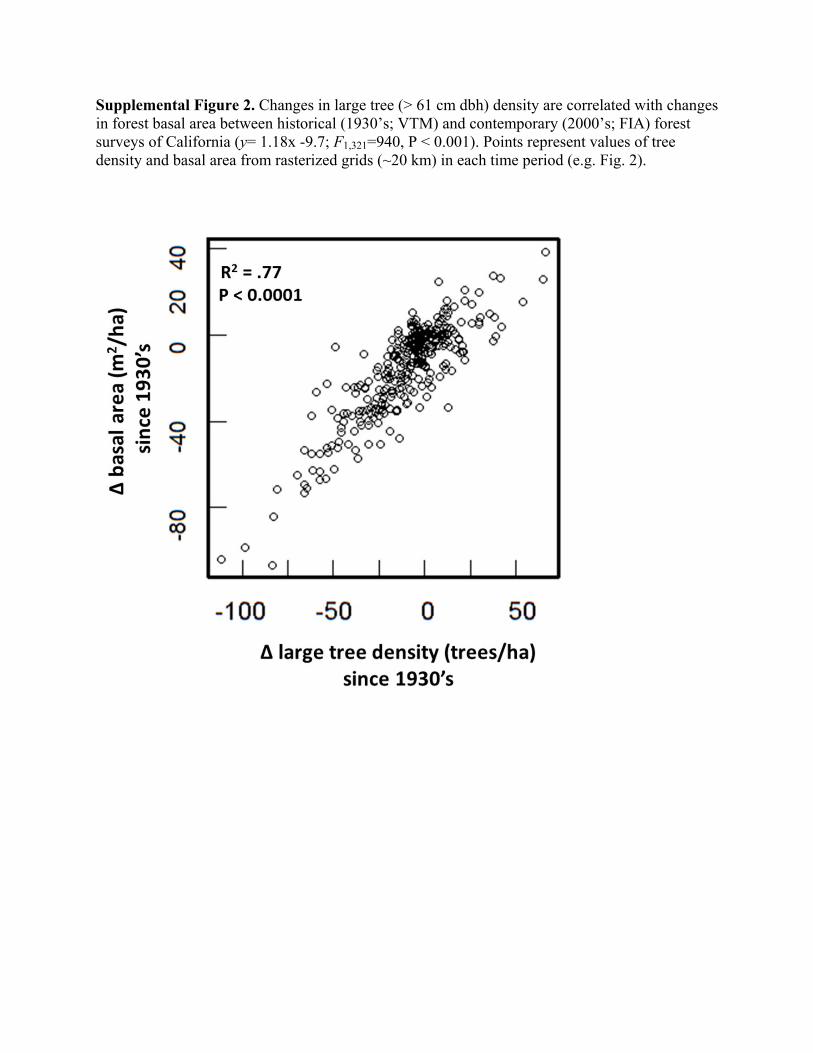
Supplemental Figure 3. Location and number of georeferenced forested plots in the VTM (1929-1936) and Forest Inventory Analysis (2000-2010) surveys within CA. Number and characteristics of plots selected for analyses (those falling within a 5km radius across time periods).
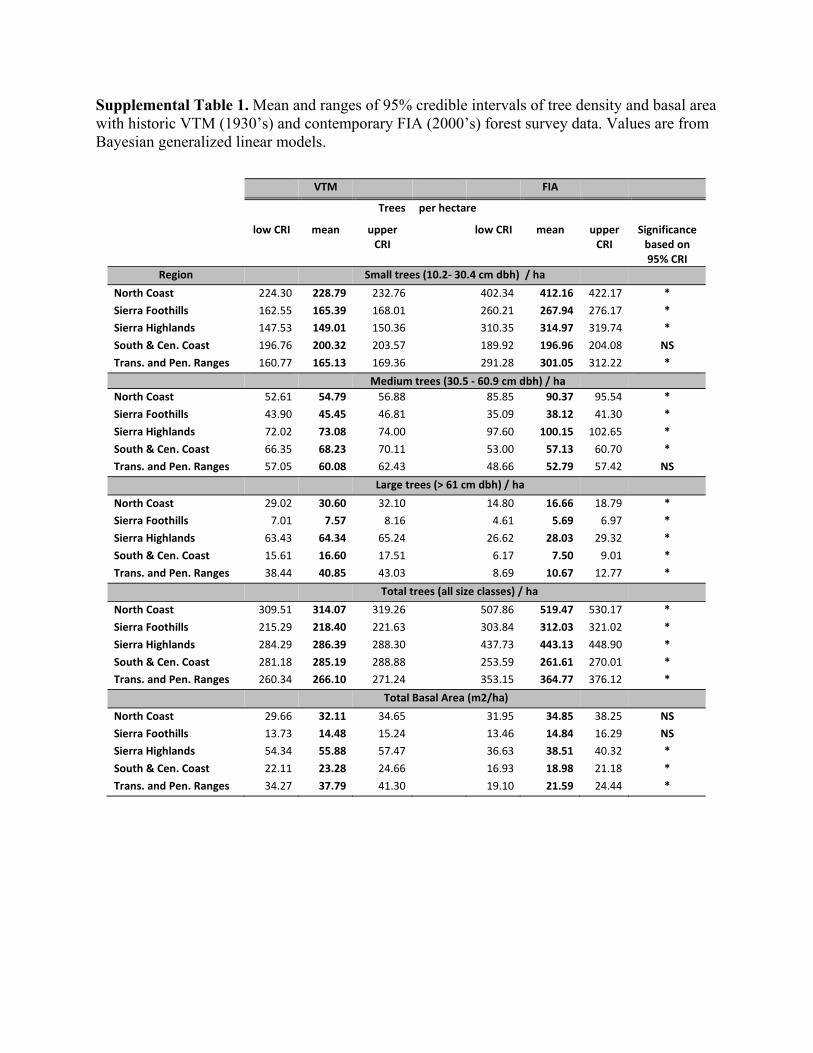
VTM FIA
Trees per hectare
low CRI mean upper CRI
low CRI mean upper CRI
Significance based on 95% CRI
Region Small trees (10.2‐ 30.4 cm dbh) / ha
North Coast 224.30 228.79 232.76 402.34 412.16 422.17 *
Sierra Foothills 162.55 165.39 168.01 260.21 267.94 276.17 *
Sierra Highlands 147.53 149.01 150.36 310.35 314.97 319.74 *
South & Cen. Coast 196.76 200.32 203.57 189.92 196.96 204.08 NS
Trans. and Pen. Ranges 160.77 165.13 169.36 291.28 301.05 312.22 *
Medium trees (30.5 ‐ 60.9 cm dbh) / ha
North Coast 52.61 54.79 56.88 85.85 90.37 95.54 *
Sierra Foothills 43.90 45.45 46.81 35.09 38.12 41.30 *
Sierra Highlands 72.02 73.08 74.00 97.60 100.15 102.65 *
South & Cen. Coast 66.35 68.23 70.11 53.00 57.13 60.70 *
Trans. and Pen. Ranges 57.05 60.08 62.43 48.66 52.79 57.42 NS
Large trees (> 61 cm dbh) / ha
North Coast 29.02 30.60 32.10 14.80 16.66 18.79 *
Sierra Foothills 7.01 7.57 8.16 4.61 5.69 6.97 *
Sierra Highlands 63.43 64.34 65.24 26.62 28.03 29.32 *
South & Cen. Coast 15.61 16.60 17.51 6.17 7.50 9.01 *
Trans. and Pen. Ranges 38.44 40.85 43.03 8.69 10.67 12.77 *
Total trees (all size classes) / ha
North Coast 309.51 314.07 319.26 507.86 519.47 530.17 *
Sierra Foothills 215.29 218.40 221.63 303.84 312.03 321.02 *
Sierra Highlands 284.29 286.39 288.30 437.73 443.13 448.90 *
South & Cen. Coast 281.18 285.19 288.88 253.59 261.61 270.01 *
Trans. and Pen. Ranges 260.34 266.10 271.24 353.15 364.77 376.12 *
Total Basal Area (m2/ha)
North Coast 29.66 32.11 34.65 31.95 34.85 38.25 NS
Sierra Foothills 13.73 14.48 15.24 13.46 14.84 16.29 NS
Sierra Highlands 54.34 55.88 57.47 36.63 38.51 40.32 *
South & Cen. Coast 22.11 23.28 24.66 16.93 18.98 21.18 *
Trans. and Pen. Ranges 34.27 37.79 41.30 19.10 21.59 24.44 *
Supplemental Table 1. Mean and ranges of 95% credible intervals of tree density and basal area with historic VTM (1930’s) and contemporary FIA (2000’s) forest survey data. Values are from Bayesian generalized linear models.
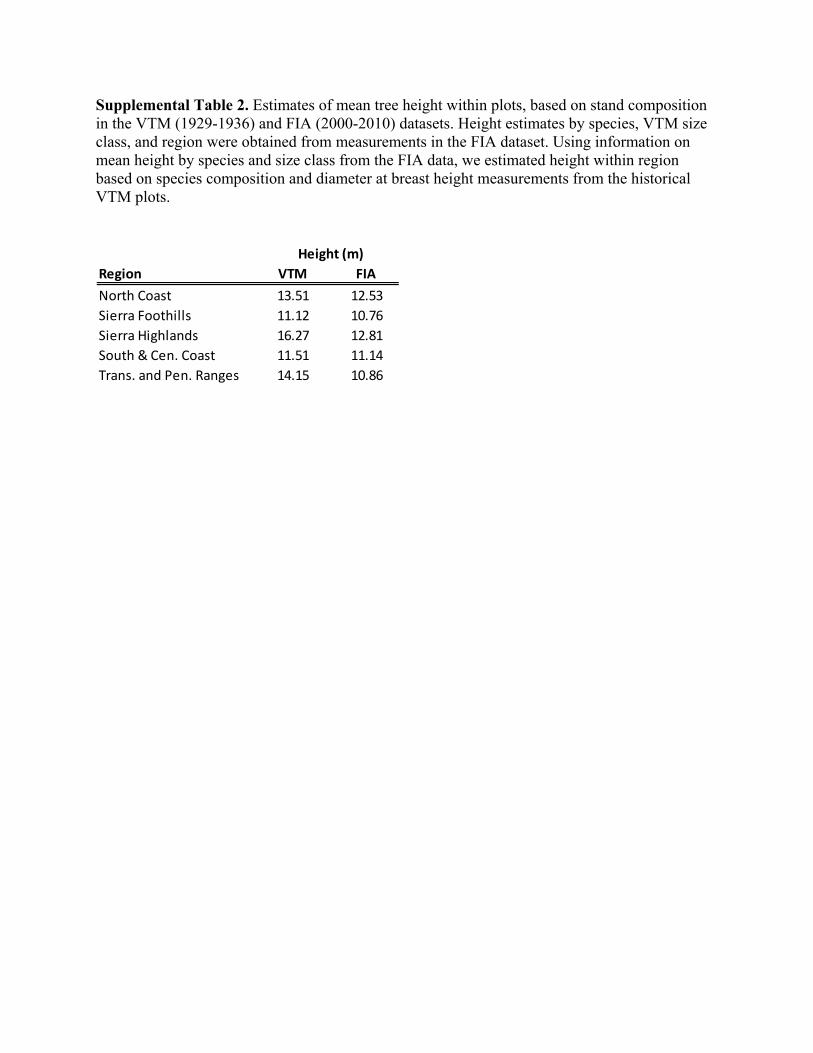
Supplemental Table 2. Estimates of mean tree height within plots, based on stand composition in the VTM (1929-1936) and FIA (2000-2010) datasets. Height estimates by species, VTM size class, and region were obtained from measurements in the FIA dataset. Using information on mean height by species and size class from the FIA data, we estimated height within region based on species composition and diameter at breast height measurements from the historical VTM plots.
Height (m)
Region VTM FIA
North Coast 13.51 12.53
Sierra Foothills 11.12 10.76
Sierra Highlands 16.27 12.81
South & Cen. Coast 11.51 11.14
Trans. and Pen. Ranges 14.15 10.86
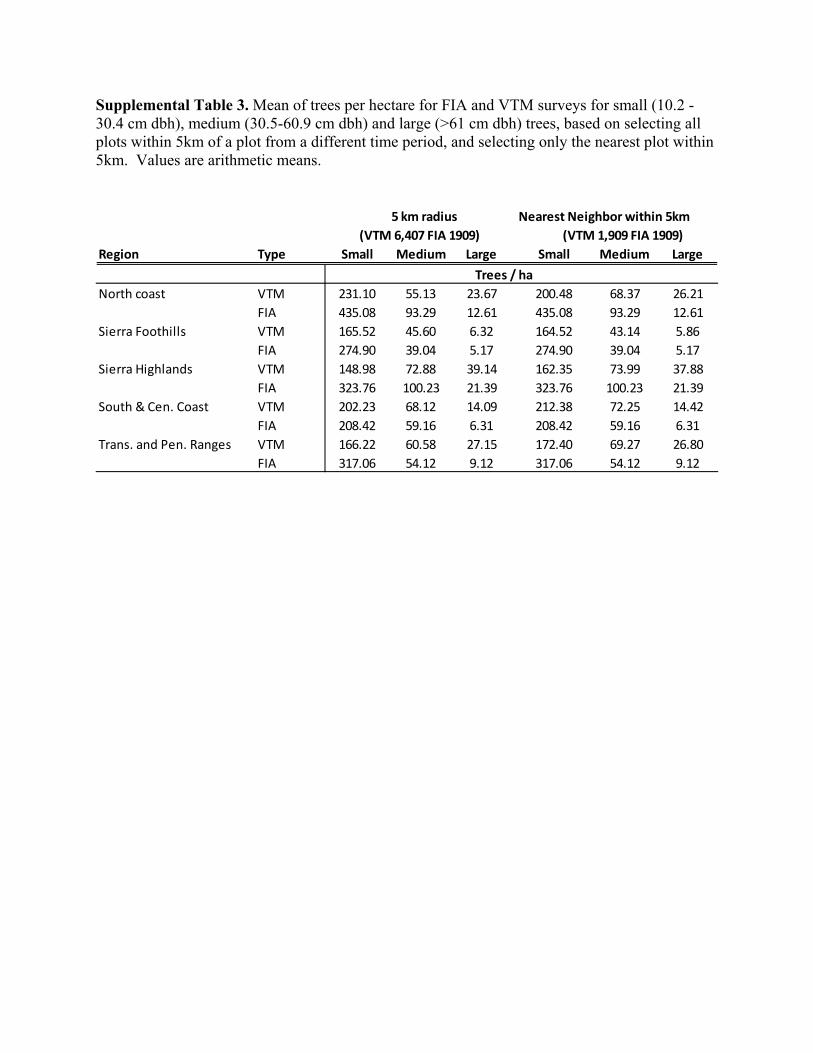
5 km radius Nearest Neighbor within 5km
(VTM 6,407 FIA 1909) (VTM 1,909 FIA 1909)
Region Type Small Medium Large Small Medium Large
Trees / ha
North coast VTM 231.10 55.13 23.67 200.48 68.37 26.21
FIA 435.08 93.29 12.61 435.08 93.29 12.61
Sierra Foothills VTM 165.52 45.60 6.32 164.52 43.14 5.86
FIA 274.90 39.04 5.17 274.90 39.04 5.17
Sierra Highlands VTM 148.98 72.88 39.14 162.35 73.99 37.88
FIA 323.76 100.23 21.39 323.76 100.23 21.39
South & Cen. Coast VTM 202.23 68.12 14.09 212.38 72.25 14.42
FIA 208.42 59.16 6.31 208.42 59.16 6.31
Trans. and Pen. Ranges VTM 166.22 60.58 27.15 172.40 69.27 26.80
FIA 317.06 54.12 9.12 317.06 54.12 9.12
Supplemental Table 3. Mean of trees per hectare for FIA and VTM surveys for small (10.2 -30.4 cm dbh), medium (30.5-60.9 cm dbh) and large (>61 cm dbh) trees, based on selecting all plots within 5km of a plot from a different time period, and selecting only the nearest plot within 5km. Values are arithmetic means.

Supplemental Table 4. Comparison of VTM era plots by burn status (noted to be recently burned or to have signs of burning in notes from the VTM plot data) or without signs of burning, with FIA plots occurring within or outside of at least one known fire based on the California Department of Forestry Fire Perimeter (FRAP; http://frap.fire.ca.gov/) maps from 1950-2010. Although the data are coarse (unclear how long a plot from the VTM era would have evidence of burning, whether plots burned in the period between 1930 to 1950, or what portion of plots may occur in areas with undocumented fires in the FRAP data), there was a signal of reduced density with burning. Furthermore, within burn classes across time period there was a consistent increase in stems per hectare for small trees. For large trees, a decrease in stems per ha across time periods was observed in plots with and without evidence of burning,
VTM FIA
Trees per hectare
low CI mean upper CRI low CRI mean upper CRI
Significance
based on
95% CRI
Burn Status Small trees (10.2‐ 30.4 cm dbh)
unburned 162.20 168.20 174.40 315.70 330.20 344.00 *
burned 112.30 131.90 152.00 255.50 276.20 298.70 *
Large trees (> 61 cm dbh)
unburned 43.04 44.35 45.71 18.60 21.36 24.21 *
burned 21.76 25.98 30.44 7.60 12.61 17.29 *
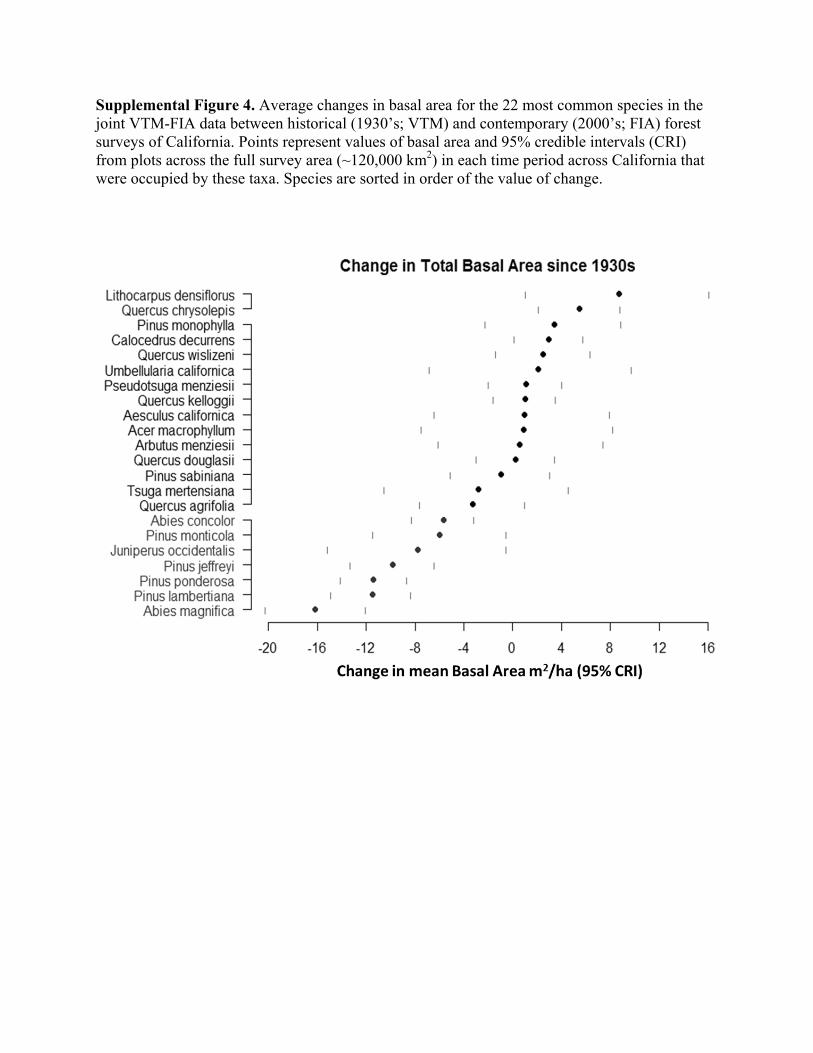
Supplemental Figure 4. Average changes in basal area for the 22 most common species in the joint VTM-FIA data between historical (1930’s; VTM) and contemporary (2000’s; FIA) forest surveys of California. Points represent values of basal area and 95% credible intervals (CRI) from plots across the full survey area (~120,000 km2) in each time period across California that were occupied by these taxa. Species are sorted in order of the value of change.
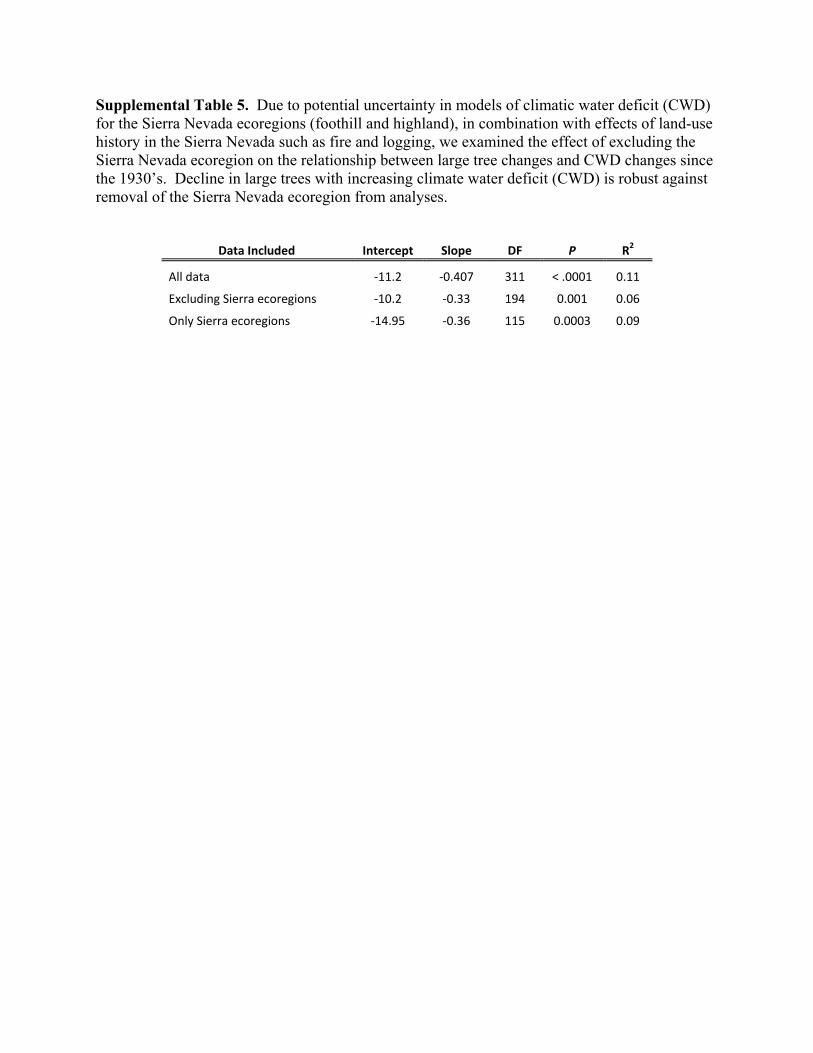
Supplemental Table 5. Due to potential uncertainty in models of climatic water deficit (CWD) for the Sierra Nevada ecoregions (foothill and highland), in combination with effects of land-use history in the Sierra Nevada such as fire and logging, we examined the effect of excluding the Sierra Nevada ecoregion on the relationship between large tree changes and CWD changes since the 1930’s. Decline in large trees with increasing climate water deficit (CWD) is robust against removal of the Sierra Nevada ecoregion from analyses.
Data Included Intercept Slope DF P R2
All data ‐11.2 ‐0.407 311 < .0001 0.11
Excluding Sierra ecoregions ‐10.2 ‐0.33 194 0.001 0.06
Only Sierra ecoregions ‐14.95 ‐0.36 115 0.0003 0.09
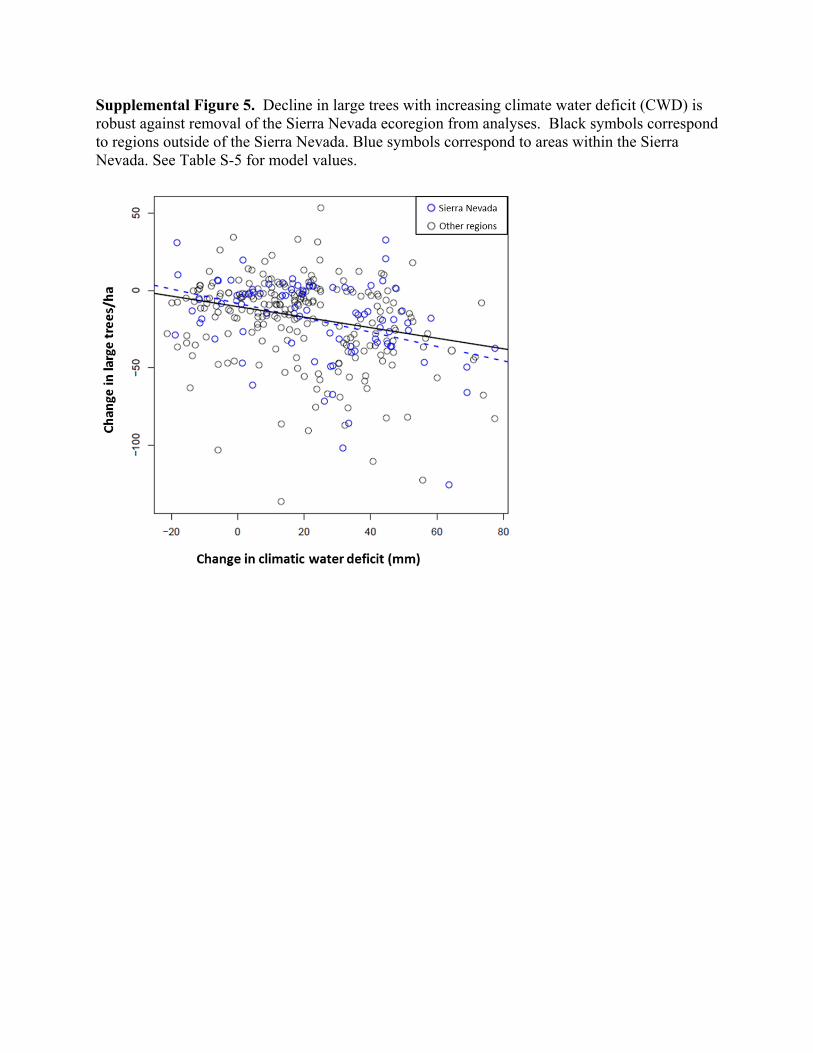
Supplemental Figure 5. Decline in large trees with increasing climate water deficit (CWD) is robust against removal of the Sierra Nevada ecoregion from analyses. Black symbols correspond to regions outside of the Sierra Nevada. Blue symbols correspond to areas within the Sierra Nevada. See Table S-5 for model values.
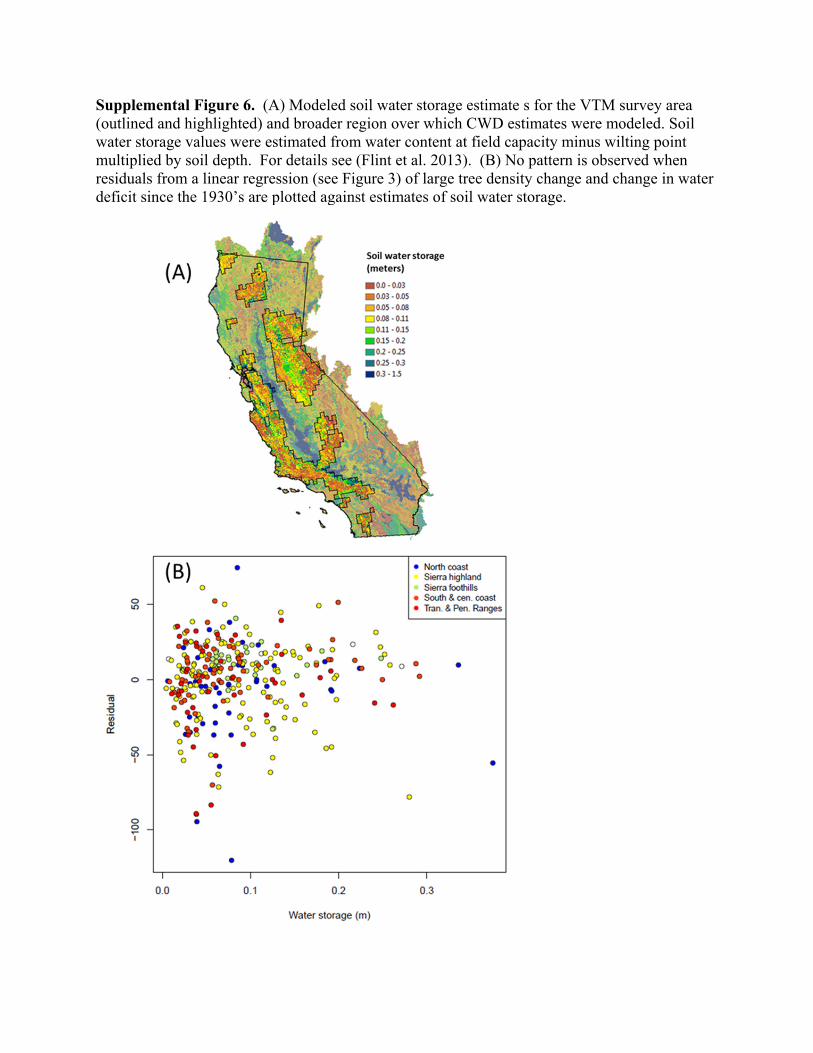
Supplemental Figure 6. (A) Modeled soil water storage estimate s for the VTM survey area (outlined and highlighted) and broader region over which CWD estimates were modeled. Soil water storage values were estimated from water content at field capacity minus wilting point multiplied by soil depth. For details see (Flint et al. 2013). (B) No pattern is observed when residuals from a linear regression (see Figure 3) of large tree density change and change in water deficit since the 1930’s are plotted against estimates of soil water storage.

REFERENCES 1. Stephenson, N (1998) Actual evapotranspiration and deficit: biologically meaningful correlates of vegetation distribution across spatial scales. J Biogeogr 25(5), 855-870.