Embed Size (px)
Citation preview

Supplemental Data. Geng et al. (2013). Plant Cell 10.1105/tpc.113.112896
1
Supplemental Figure 1. Time-lapse imaging system and semi-automated image analysis.
A) Time-lapse imaging system showing rotary stage with six tissue-culture plate holders and
camera.
B) A typical image used for the analysis of growth.
C) Image processed for enhanced edge detection and with a hand-drawn midline along the
length of the root.
D) Algorithm tracks the position of the root tip and translates position onto the midline.
E) Comparative quantitation of growth measured using the position of the root tip alone (red
line) or after translating the root tip position onto the midline to correct for root tip waving
(green line).
Supplemental Data. Geng et al. (2013). Plant Cell 10.1105/tpc.113.112896
2
Supplemental Figure 2. Gene Ontology annotation enrichment in genes expressed during the
salt-stress response in whole roots.
A) Annotations enriched in genes activated by salt stress or repressed (B).
Supplemental Data. Geng et al. (2013). Plant Cell 10.1105/tpc.113.112896
3
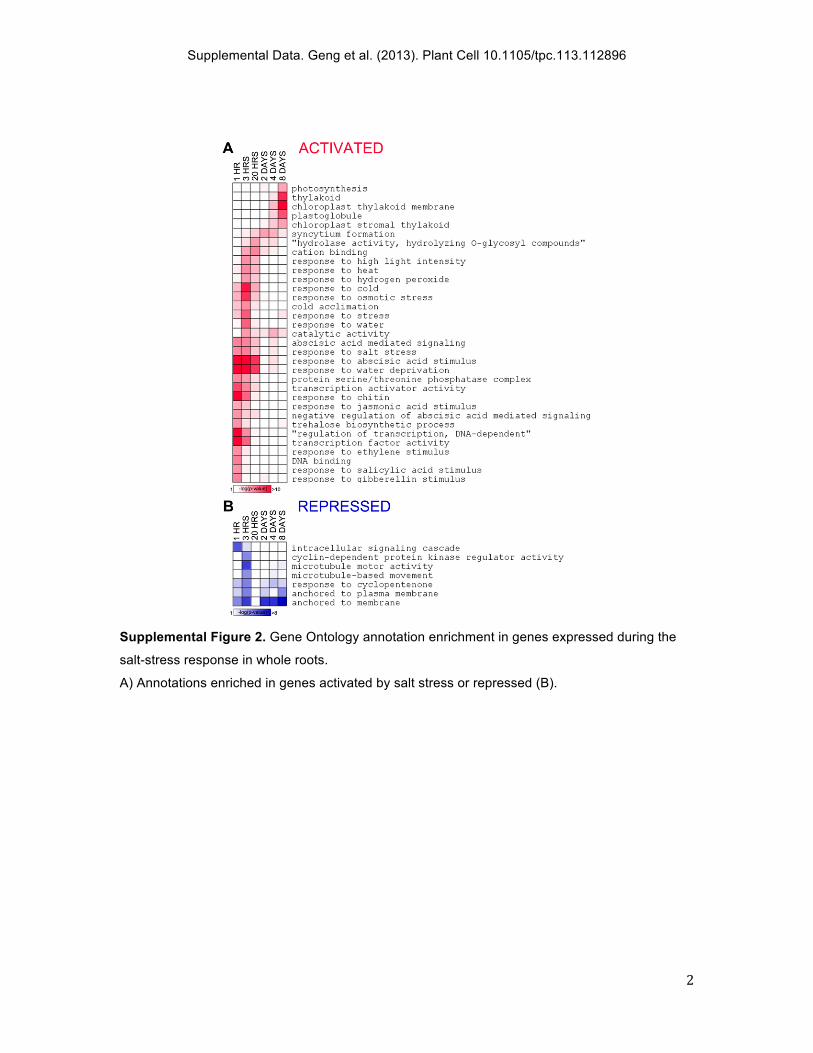
Supplemental Figure 3. Expression of GFP reporter lines used for FACS after prolonged salt
treatment.

Supplemental Data. Geng et al. (2013). Plant Cell 10.1105/tpc.113.112896
4
Supplemental Figure 4. Percent enrichment of GFP-expressing cells after FACS isolation from
protoplasted ProWER:erGFP roots.

Supplemental Data. Geng et al. (2013). Plant Cell 10.1105/tpc.113.112896
5
Supplemental Figure 5. Comparison of gene expression profiles for six genes using qRT-PCR
or microarray-based quantitation.
Expression measured for At1g71000, At4g18430, At2g33380, At4g30460, At3g22570 and
At5g66400 by qRT-PCR from RNA purified from FACS sorted cells of ProWER:erGFP expressing
roots.

Supplemental Data. Geng et al. (2013). Plant Cell 10.1105/tpc.113.112896
6
Supplemental Figure 6. Expression pattern of genes in the spatiotemporal salt response data
set with known tissue-specific expression in roots.
Expression is shown for a collection of genes with known tissue-specific expression patterns.
The expected expression pattern is listed and the actual tissue layer where peak expression is
observed is listed. Note that of the 28 genes examined, only 2 show patterns that disagree with
the expected site of expression.

Supplemental Data. Geng et al. (2013). Plant Cell 10.1105/tpc.113.112896
7
Supplemental Figure 7. Salt responsive genes show cell-type specific changes in expression
throughout the time course.
Graph shows the number of genes identified as differentially expressed in each contrast and the
proportion of these genes regulated in at most 1, 2, 3 or 4 cell layers.

Supplemental Data. Geng et al. (2013). Plant Cell 10.1105/tpc.113.112896
8
Supplemental Figure 8. Fluorol Yellow staining shows an enrichment of suberin deposition
during the salt response; the aba2-sail allele is an RNA null.
(A) Brightfield (top panels) and fluorescence images (bottom panels) of roots stained with
fluorol yellow, which marks suberin deposition in the root. Salt stress treatment (right
panels) show a marked increase in staining compared to roots transferred to standard
conditions (left panels). Scale bar is 100 µm.
(B) Quantitation of fluorol yellow fluorescence in the region of the root that immediately
developed after transfer to treatment conditions.
(C) Classic RT-PCR showing amplification of the full length ABA2 transcript from Col-0 plants,
but not from the aba2-sail T-DNA insertion allele.
Error is SEM.

Supplemental Data. Geng et al. (2013). Plant Cell 10.1105/tpc.113.112896
9
Supplemental Figure 9. The ProRAB18:GFP reporter is activated briefly in the early maturation
zone of the root.
Seedlings were transferred to standard or 140 mM NaCl supplemented media and imaged every
4 hours. For quantification of fluorescence, a small region of interest (yellow outline) in the early
maturation zone was used. GFP fluorescence signal increases only after salt treatment and is
maintained in the early maturation zone between 8-12 hours.

Supplemental Data. Geng et al. (2013). Plant Cell 10.1105/tpc.113.112896
10
Supplemental Figure 10. Inferred expression pattern for JA and BR pathway associated genes.
A) JAI3, which encodes a repressor of JA signaling, showed enriched expression in the EPI
layer. This correlated with an overall low level of induction of JA-regulated genes during
the salt-stress response.
B) The DWF4 gene is a repressed direct target of BZR1 and showed increased expression
in the STE layer peaking at 8 hours during salt treatment. This time point correlated with
the temporary reduction in BRZ1:YFP nuclear accumulation.

Supplemental Data. Geng et al. (2013). Plant Cell 10.1105/tpc.113.112896
11
Supplemental Table 1. Time Table of Salt Treatments for FACS Isolation of Cell Types After Salt
Treatment.
Samples Sterilize and stratify
Sow seeds
Transfer to treatment Sample collect
Batch 1
NaCl-48hours Day 1 Day 3 Day 8, 13:30 Day 10, 13:30 MS-48hours Day 1 Day 3 Day 8, 13:30 Day 10, 13:30 NaCl-1hours Day 3 Day 5 Day 10, 12:30 Day 10, 13:30 MS-1hours Day 3 Day 5 Day 10, 12:30 Day 10, 13:30
Batch 2
NaCl-32hours Day 1' Day 3' Day 8', 5:30 D9', 13:30 NaCl-20hours Day 1' Day 3' Day 8', 17:30 D9', 13:30 NaCl-8hours Day 2' Day 4' Day 9', 5:30 D9', 13:30 NaCl-3hours Day 2' Day 4' Day 9', 10:30 D9', 13:30