Embed Size (px)
Citation preview
SUPPLEMENT TO
REMARKETING MEMORANDUM DATED JULY 27, 2011
relating to
$100,000,000 City of Philadelphia, Pennsylvania
General Obligation Multi-Modal Refunding Bonds Series 2009B
CUSIP: 717813LJ6
This Supplement amends and supplements the Remarketing Memorandum dated July 27, 2011 (the “Remarketing Memorandum”), relating to the above captioned bonds, and must be read together with the Remarketing Memorandum.
The Section of Appendix A of the Remarketing Memorandum entitled “REVENUES OF THE CITY -- Assessment and Collection of Real and Personal Property Taxes” is amended by having the following added at the end of such Section:
“Real estate taxes in the City are imposed on the assessed value of a property, which is generally equal to the established predetermined ratio (the “EPR”) for the City of 32% multiplied by the market value of the property assigned to the property by the Office of Property Assessment. However, in a real estate tax appeal, the taxpayer may request that the assessed value be multiplied instead by the common level ratio (the “CLR”) determined by the State Board of Equalization of Taxes (“STEB”) if it varies from the EPR by a margin of more than 15% of the EPR. STEB recently released the CLR for 2010 (applicable to 2012 real estate tax appeals) for the City of 18.1% which varies from the EPR by more than such 15% margin. Appeals with respect to 2012 real estate taxes must be filed by October 3, 2011. The City is currently evaluating what effect this determination by the STEB may have on the City. The City also currently intends to request reconsideration by the STEB of its determination of the CLR for the City for 2010.”
The date of this Supplement is August 2, 2011.

[ THIS PAGE INTENTIONALLY LEFT BLANK ]
REMARKETING MEMORANDUM DATED JULY 27, 2011
$100,000,000CITY OF PHILADELPHIA, PENNSYLVANIA
GENERAL OBLIGATION MULTI-MODAL REFUNDING BONDSSERIES 2009BCUSIP: 717813LJ6
NOT A NEW ISSUE—BOOK-ENTRY ONLY
Dated: Date of Delivery Next Interest Payment Date: September 1, 2011
On August 13, 2009, Cozen O’Connor and TME Law, 2009 Co-Bond Counsel, each delivered an opinion to the effect that: (i) interest on the 2009B Bonds will be excluded from gross income for federal income tax purposes under existing statutes, regulations, rulings and court decisions, subject to the conditions described in “TAX MATTERS - Opinion of 2009 Bond Counsel” herein; (ii) interest on the 2009B Bonds will not be treated as an item of tax preference under Section 57 of the Internal Revenue Code of 1986, as amended (the “Code”), for purposes of the individual and corporate alternative minimum taxes and is not included in adjusted current earnings under Section 56(g) of the Code when calculating corporate alternative minimum taxable income; and (iii) under the existing laws of the Commonwealth of Pennsylvania, interest on the 2009B Bonds will be free from Pennsylvania personal income taxation and Pennsylvania corporate net income taxation but such exemption does not extend to gift, estate, succession or inheritance taxes or any other taxes not levied or assessed directly on the 2009B Bonds or the interest thereon; all subject to the conditions in the opinion of 2009 Co-Bond Counsel attached hereto as Appendix C-1. In the opinion of Cozen O’Connor and The Law Offices of Ann C. Lebowitz, 2011 Co-Bond Counsel, the replacement of the existing letter of credit with the Letter of Credit, in and of itself, will not adversely affect the exclusion from gross income for federal income tax purposes of interest on any 2009B Bonds under Section 103 of the Code. For a more complete discussion, see “TAX MATTERS” herein.
The $100,000,000 aggregate amount of General Obligation Multi-Modal Refunding Bonds, Series 2009B (the “2009B Bonds”) of the City of Philadelphia (the “City”) were issued as obligations in registered form, while the 2009B Bonds bear interest at a Weekly Rate or a Daily Rate in denominations of $100,000 and any integral multiple of $5,000 in excess thereof (“Authorized Denominations”). Interest on the 2009B Bonds is payable on each 2009B Interest Rate Payment Date, as described herein. Principal or redemption price of the 2009B Bonds is payable at the office of the Fiscal Agent designated herein upon surrender of such 2009B Bonds. The 2009B Bonds will mature on the due date shown above.
The 2009B Bonds currently bear interest at a Weekly Rate, subject to conversion to a Daily Mode, CP Mode, Term Rate Mode or Fixed Rate Mode as further described herein. RBC Capital Markets, LLC, will be the Remarketing Agent for the 2009B Bonds. While the 2009B Bonds bear interest at a Weekly Rate, the interest rate will be determined by the Remarketing Agent. Payments of principal of and interest on the 2009B Bonds will be made by U.S. Bank National Association, as Fiscal Agent, as described herein under “THE 2009B BONDS.” This Remarketing Memorandum only provides information regarding the 2009B Bonds while bearing interest at the Weekly or Daily Rate.
The 2009B Bonds were issued simultaneously with the City’s $237,025,000 General Obligation Fixed Rate Refunding Bonds, Series 2009A, for the purpose of refunding the City’s outstanding General Obligation Multi-Modal Refunding Bonds, Series 2007B, and for the payment of costs relating to the 2009 Bonds, including a termination payment due with respect to a portion of a related swap.
The 2009B Bonds are registered in the name of Cede & Co., as nominee for The Depository Trust Company, New York, New York (“DTC”), which acts as securities depository for the 2009B Bonds. Purchases of beneficial ownership interests in the 2009B Bonds will be made in book-entry only form in Authorized Denominations. Principal of and interest on the 2009B Bonds is payable directly to Cede & Co. for redistribution to DTC Participants and in turn to Beneficial Owners as described herein. Purchasers of the 2009B Bonds will not receive certificates representing their ownership interest in the 2009B Bonds purchased. See “THE 2009B BONDS-Book- Entry System” herein.
The 2009B Bonds are subject to optional and mandatory sinking fund redemption as described herein. While the 2009B Bonds bear interest at a Weekly Rate or a Daily Rate, the 2009B Bonds are subject to optional and mandatory tender as described herein.
The 2009B Bonds are also payable from the proceeds of funds drawn by the Fiscal Agent under an irrevocable, direct-pay letter of credit (the “Letter of Credit”) issued by Royal Bank of Canada (the “Bank”), acting through a New York branch.
The Letter of Credit will permit the Fiscal Agent to draw up to $101,841,096, which amount includes (a) $100,000,000, representing an amount sufficient to pay the principal of the 2009B Bonds or the portion of the purchase price corresponding to principal of the 2009B Bonds, plus (b) $1,841,096, representing an amount equal to 56 days’ interest accrued on the 2009B Bonds, computed at an assumed maximum rate of 12% to pay accrued and unpaid interest on the 2009B Bonds or the portion of the purchase price corresponding to accrued and unpaid interest on the 2009B Bonds. The Letter of Credit will expire on August 4, 2014, unless earlier cancelled, terminated or renewed pursuant to its terms. No premium or amounts other than principal of and interest on the 2009B Bonds (or purchase price corresponding thereto) is payable from the Letter of Credit. Unless the Letter of Credit is extended or replaced in accordance with the terms of the Bond Committee Resolution, the 2009B Bonds will become subject to mandatory tender for purchase prior to the expiration of the Letter of Credit.
The 2009B Bonds are general obligations of the City, and the full faith, credit and taxing power of the City are pledged for the payment thereof.
This cover page contains information for quick reference only. It is not a summary of this issue. Investors must read the entire Remarketing Memorandum, including the Appendices, which are an integral part hereof, to obtain information essential to making an informed investment decision regarding the 2009B Bonds.
Certain legal matters were passed upon in connection with the initial issuance of the 2009B Bonds by Cozen O’Connor and TME Law, Co-Bond Counsel, both of Philadelphia, Pennsylvania. Certain legal matters will be passed upon by Cozen O’Connor and The Law Offices of Ann C. Lebowitz, 2011 Co-Bond Counsel, both of Philadelphia, Pennsylvania. Certain legal matters will be passed upon for the City by the Office of the City Solicitor and for the Bank by Nixon Peabody LLP, New York, New York. It is anticipated that the letter of credit substitution for the 2009B Bonds will take place on or about August 4, 2011.
RATINGS: See “Ratings” herein
Due: August 1, 2031 Price: 100%
THE CITY OF PHILADELPHIA, PENNSYLVANIA
_______________________ MAYOR
HONORABLE MICHAEL A. NUTTER ______________________
_______________________ MAYOR’S INTERIM CHIEF OF STAFF
SUZANNE BIEMILLER ______________________
MAYOR’S CABINET
Richard Negrin, Esquire ................ Deputy Mayor for Administration and Coordination/Managing Director Rob Dubow ...................................................................................................................... Director of Finance Shelley R. Smith ........................................................................................................................ City Solicitor Rina Cutler ............................................................................. Deputy Mayor of Transportation and Utilities Everett A. Gillison ....................................................................................... Deputy Mayor for Public Safety Alan Greenberger ................................ Deputy Mayor for Economic Development and Commerce Director Donald F. Schwarz, M.D. ................. Deputy Mayor for Health and Opportunity and Health Commissioner Michael DiBerardinis .................................... Deputy Mayor for Environmental and Community Resources Thomas Jones ............................................................................................. Acting Chief Information Officer Katherine Gajewski ................................................................................................. Director of Sustainability Terry Gillen ........................................................................................... Director, Federal Legislative Affairs Melanie Johnson ............................................................................................................. City Representative Amy L. Kurland .................................................................................................................. Inspector General Joan L. Markman ........................................................................................................ Chief Integrity Officer Lewis Rosman ........................................................................ Director, Legislative and Government Affairs Lori A. Shorr, Ph.D. .................................................................................................. Chief Education Officer Gary Steuer .................................................................................................................. Chief Cultural Officer David G. Wilson .......................................................................................... First Deputy Managing Director
_______________________ City Treasurer
Nancy E. Winkler ______________________ ______________________
City Controller Alan L. Butkovitz
______________________
No dealer, broker, salesman or other person has been authorized to give any information or to make any representations, other than those contained in this Remarketing Memorandum, and if given or made, such other information or representations must not be relied upon. This Remarketing Memorandum does not constitute an offer to sell or the solicitation of an offer to buy, nor shall there be any sale of the 2009B Bonds by any person in any jurisdiction in which it is unlawful to make such offer, solicitation or sale. This Remarketing Memorandum is not to be construed as a contract or agreement among the City, the Remarketing Agent and the purchasers or owners of any offered 2009B Bonds. The information set forth herein has been obtained from sources that the Remarketing Agent believes to be reliable, but it is not guaranteed as to its accuracy or completeness, and is not to be construed as a representation by the Remarketing Agent. The information and the opinions expressed herein are subject to change without notice and neither the delivery of this Remarketing Memorandum nor any sale made hereunder shall, under any circumstances, create any implication that there has been no change in the operation or financial condition of the City since the date hereof or the date as of which particular information is given, if earlier.
If and when included in this Remarketing Memorandum, the words “expects,” “forecasts,” “projects,” “intends,” “anticipates,” “estimates,” “assumes” and analogous expressions are intended to identify forward-looking statements and any such statements inherently are subject to a variety of risks and uncertainties that could cause actual results to differ materially from those that have been projected. Such risks and uncertainties which could affect the amount of taxes and other revenue collected by the City include, among others, changes in economic conditions and various other events, conditions and circumstances, many of which are beyond the control of the City. Such forward-looking statements speak only as of the date of this Remarketing Memorandum. The City disclaims any obligation or undertaking to release publicly any updates or revisions to any forward-looking statement contained herein to reflect any changes in the City’s expectations with regard thereto or any change in events, conditions or circumstances on which any such statement is based.
The 2009B Bonds are not registered under the Securities Act of 1933, as amended, or listed on any stock or other securities exchange and neither the Securities and Exchange Commission nor any other federal, state, municipal or other governmental entity, other than the City (subject to the limitations set forth herein), has passed upon the accuracy or adequacy of this Remarketing Memorandum. IN MAKING AN INVESTMENT DECISION, INVESTORS MUST RELY ON THEIR OWN EXAMINATION OF THE CITY AND THE TERMS OF THE OFFERING, INCLUDING THE MERITS AND RISKS INVOLVED. THESE SECURITIES HAVE NOT BEEN RECOMMENDED BY ANY FEDERAL OR STATE SECURITIES COMMISSION OR REGULATORY AUTHORITY. FURTHERMORE, THE FOREGOING AUTHORITIES HAVE NOT CONFIRMED THE ACCURACY OR DETERMINED THE ADEQUACY OF THIS REMARKETING MEMORANDUM. ANY REPRESENTATION TO THE CONTRARY IS A CRIMINAL OFFENSE.
No quotations from or summaries or explanations of provision of law and documents herein purport to be complete and reference is made to such laws and documents for full and complete statements of their provisions. This Remarketing Memorandum is not to be construed as a contract or agreement between the City and the purchasers or holders of any of the securities described herein. Any statements made in this Remarketing Memorandum involving estimates or matters of opinion, whether or not expressly so stated, are intended merely as estimates or opinions and not as representations of fact. The cover page hereof, list of officials, this page and the Appendices attached hereto are part of this Remarketing Memorandum.
THE ORDER AND PLACEMENT OF MATERIALS IN THIS REMARKETING MEMORANDUM, INCLUDING THE APPENDICES HERETO AND THE INFORMATION INCORPORATED HEREIN BY REFERENCE, ARE NOT TO BE DEEMED TO BE A DETERMINATION OF RELEVANCE, MATERIALITY OR IMPORTANCE, AND THIS REMARKETING MEMORANDUM, INCLUDING THE APPENDICES AND THE INFORMATION INCORPORATED HEREIN BY REFERENCE, MUST BE CONSIDERED IN ITS ENTIRETY. THE OFFERING OF THE 2009B BONDS IS MADE ONLY BY MEANS OF THIS ENTIRE REMARKETING MEMORANDUM.
Other than with respect to information concerning the Bank, the Letter of Credit and the Reimbursement Agreement contained under the caption “THE REIMBURSEMENT AGREEMENT AND THE LETTER OF CREDIT” and “THE BANK” and in Appendix E – “Certain Information Concerning the Bank” herein, none of the information in this Remarketing Memorandum has been supplied or verified by the Bank, and the Bank makes no representation or warranty, express or implied, as to (i) the accuracy or completeness of such information; (ii) the validity of the 2009B Bonds; or (iii) the tax-exempt status of the interest on the 2009B Bonds.
The CUSIP (Committee on Uniform Securities Identification Procedures) number shown on the cover hereof has been assigned by an organization not affiliated with the City or the Remarketing Agent, and such parties are not responsible for the selection or use of the CUSIP number. The CUSIP number is included solely for the convenience of bondholders and no representation is made as to the correctness of such CUSIP number. CUSIP numbers assigned to securities may be changed during the term of such securities based on a number of factors including, but not limited to, the refunding or defeasance of such issue or the use of secondary market financial products. Neither the City nor the Remarketing Agent have agreed to, and there is no duty or obligation to, update this Remarketing Memorandum to reflect any change or correction in the CUSIP number set forth on the front cover hereof.
TABLE OF CONTENTS
Page
INTRODUCTION ........................................................................................................................................ 1
PLAN OF FINANCE AND SOURCES AND USES OF FUNDS ............................................................... 2
THE 2009B BONDS ..................................................................................................................................... 3
THE REIMBURSEMENT AGREEMENT AND THE LETTER OF CREDIT ........................................ 16
THE BANK ................................................................................................................................................ 20
REMARKETING AGENT ......................................................................................................................... 20
FISCAL YEAR DEBT SERVICE REQUIREMENTS .............................................................................. 22
LEGALITY FOR INVESTMENT .............................................................................................................. 23
RATINGS ................................................................................................................................................... 23
TAX MATTERS ......................................................................................................................................... 23
CERTAIN LEGAL MATTERS.................................................................................................................. 25
NO LITIGATION ....................................................................................................................................... 25
CONTINUING DISCLOSURE .................................................................................................................. 25
CERTAIN RELATIONSHIPS ................................................................................................................... 25
MISCELLANEOUS ................................................................................................................................... 25
APPENDIX A Information Regarding the City of Philadelphia APPENDIX B Comprehensive Annual Financial Report of the City of Philadelphia for the Year
Ended June 30, 2010 APPENDIX C-1 Form of 2009 Co-Bond Counsel Opinion APPENDIX C-2 Proposed Form of 2011 Co-Bond Counsel Opinion APPENDIX D Form of Continuing Disclosure Agreement APPENDIX E Certain Information Concerning the Bank
REMARKETING MEMORANDUM
relating to
$100,000,000 City of Philadelphia, Pennsylvania
General Obligation Multi-Modal Refunding Bonds, Series 2009B
INTRODUCTION
General
This Remarketing Memorandum, including the cover page and Appendices hereto, provides information with respect to the $100,000,000 aggregate principal amount of General Obligation Multi-Modal Refunding Bonds, Series 2009B (the “2009B Bonds”) issued by The City of Philadelphia (the “City”). This introduction is a brief description of certain matters set forth in this Remarketing Memorandum and is qualified by reference to the entire Remarketing Memorandum, including the Appendices hereto. This Remarketing Memorandum only provides information regarding the 2009B Bonds while bearing interest at the Weekly or Daily Rate.
Simultaneously with the issuance of the 2009B Bonds, the City issued its General Obligation Fixed Rate Refunding Bonds, Series 2009A in the aggregate principal amount of $237,025,000 (the “2009A Bonds,” and together with the 2009B Bonds, the “2009 Bonds”).
Reference should be made to the material under the caption “THE 2009B BONDS” for a description of the 2009B Bonds, including the book-entry system applicable thereto. Appendix A provides information regarding the City, including relevant statutory provisions, financial information, litigation information, the relationship with the Pennsylvania Intergovernmental Cooperation Authority (“PICA”), a summary of the City’s current five-year plan approved by PICA, as well as socio-economic and demographic information about the City. Appendix B contains the Audited Comprehensive Annual Financial Report of the City for the fiscal year ended June 30, 2010. Certain other information contained herein is for periods prior to or subsequent to June 30, 2010. As a result, certain of the information in Appendix B is, at times, at variance with corresponding information concerning the City in Appendix A. Appendix C-1 contains the form of opinion of 2009 Co-Bond Counsel with regard to the 2009B Bonds, and Appendix C-2 contains the proposed form of opinion of 2011 Co-Bond Counsel with regard to the 2009B Bonds. Appendix D contains the form of Continuing Disclosure Agreement with respect to the 2009B Bonds. Appendix E contains additional information regarding Royal Bank of Canada (the “Bank”), acting through a New York branch.
As further described under “THE REIMBURSEMENT AGREEMENT AND THE LETTER OF CREDIT,” the Bank will issue its irrevocable, direct-pay letter of credit (the “Letter of Credit”) to secure the payment of interest on and principal of the 2009B Bonds when due and to pay the purchase price of 2009B Bonds which are tendered for purchase. The Letter of Credit and any replacement thereof permitted by the Bond Committee Resolution (defined below) which provides credit support for the 2009B Bonds (an “Alternate Credit Facility”) is referred to herein as the “Credit Facility,” and the Bank and any provider of an Alternate Credit Facility are referred to herein as the “Credit Provider.” The Letter of Credit and any replacement thereof permitted by the Bond Committee Resolution which provides liquidity support for the 2009B Bonds (an “Alternate Liquidity Facility”) is referred to herein as the “Liquidity Facility,” and the Bank and any provider of an Alternate Liquidity Facility are referred to herein as the “Liquidity Provider.”
-2-
Certain factors that may affect an investment decision concerning the 2009B Bonds are described throughout this Remarketing Memorandum. Persons considering a purchase of the 2009B Bonds should read this Remarketing Memorandum, including the cover page and Appendices, which are an integral part hereof, in its entirety. All estimates and assumptions of financial and other information are based on information currently available, are believed to be reasonable and are not to be construed as assurances of actual outcomes. All estimates of future performance or events constituting “forward looking statements” may or may not be realized because of a wide variety of economic and other circumstances. Included in such forward looking statements are numbers and other information from adopted and proposed budgets of the City, including the City’s current five-year plan. Accordingly, no assurance is given that any projected future results will be achieved.
The quotations from and summaries and explanations of the Constitution and laws of the Commonwealth of Pennsylvania (the “Commonwealth”) and ordinances and resolutions of the City contained herein do not purport to be complete and are qualified in their entirety by reference to the official compilations thereof, and all descriptions and summaries of the 2009B Bonds are qualified in their entirety by reference to the definitive form of the 2009B Bonds. Capitalized terms used but not defined herein shall have the meanings ascribed to them in the Bond Committee Resolution.
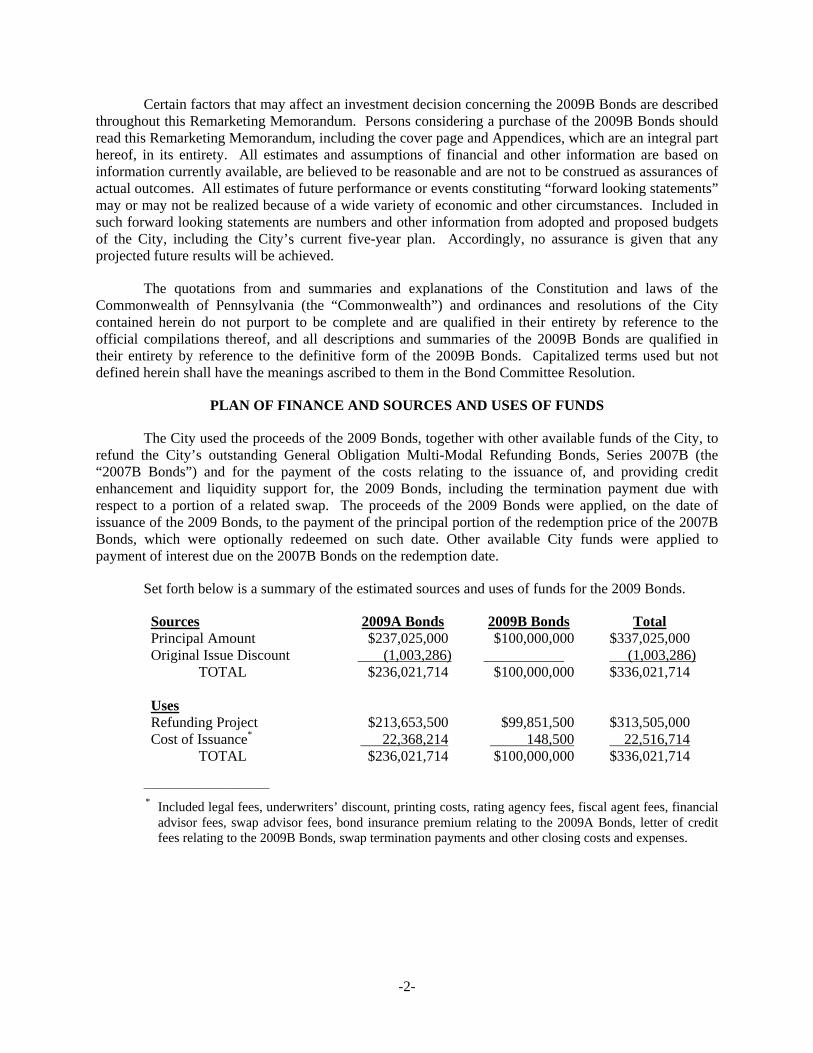
PLAN OF FINANCE AND SOURCES AND USES OF FUNDS
The City used the proceeds of the 2009 Bonds, together with other available funds of the City, to refund the City’s outstanding General Obligation Multi-Modal Refunding Bonds, Series 2007B (the “2007B Bonds”) and for the payment of the costs relating to the issuance of, and providing credit enhancement and liquidity support for, the 2009 Bonds, including the termination payment due with respect to a portion of a related swap. The proceeds of the 2009 Bonds were applied, on the date of issuance of the 2009 Bonds, to the payment of the principal portion of the redemption price of the 2007B Bonds, which were optionally redeemed on such date. Other available City funds were applied to payment of interest due on the 2007B Bonds on the redemption date.
Set forth below is a summary of the estimated sources and uses of funds for the 2009 Bonds.
Sources 2009A Bonds 2009B Bonds Total Principal Amount $237,025,000 $100,000,000 $337,025,000 Original Issue Discount (1,003,286) (1,003,286) TOTAL $236,021,714 $100,000,000 $336,021,714 Uses Refunding Project $213,653,500 $99,851,500 $313,505,000 Cost of Issuance* 22,368,214 148,500 22,516,714 TOTAL $236,021,714 $100,000,000 $336,021,714
___________________________
* Included legal fees, underwriters’ discount, printing costs, rating agency fees, fiscal agent fees, financial advisor fees, swap advisor fees, bond insurance premium relating to the 2009A Bonds, letter of credit fees relating to the 2009B Bonds, swap termination payments and other closing costs and expenses.
-3-
THE 2009B BONDS
General Information Relating to the 2009B Bonds
The following is a summary of certain provisions of the 2009B Bonds while the 2009B Bonds are in the Weekly or Daily Mode, as hereinafter described. The interest rate on the 2009B Bonds may be converted from time to time from the Weekly Mode or Daily Mode to another Mode, upon certain terms and conditions. This Remarketing Memorandum is not intended to serve as a description of the provisions of the 2009B Bonds in any Mode other that the Weekly Mode or Daily Mode. Reference is made to the 2009B Bonds and to the Bond Committee Resolution for the detailed description of the 2009B Bonds.
The 2009B Bonds will be issuable in fully registered, book-entry only, form in the authorized denomination of $100,000 and any integral multiple of $5,000 in excess thereof (“Authorized Denominations”). Purchasers of the 2009B Bonds will not receive certificates representing their interests in the 2009B Bonds.
The principal or redemption price of the 2009B Bonds is payable upon presentation and surrender thereof at the designated corporate trust office of U.S. Bank National Association, currently located at 50 South 16th Street, Philadelphia, Pennsylvania, as Fiscal Agent (the “Fiscal Agent”). Interest on 2009B Bonds shall be payable on each 2009B Interest Payment Date (defined below) to the persons in whose names the 2009B Bonds are registered in the bond registration books of the City maintained by the Fiscal Agent (the “Bond Register”) at the close of business on the last business day immediately preceding the applicable 2009B Interest Payment Date (the “Record Date”); provided, however, that any interest on the 2009B Bonds which is payable but is not punctually paid or duly provided for on a 2009B Interest Payment Date shall cease to be payable to the persons in whose names the 2009B Bonds are registered on the relevant Record Date and such defaulted interest will be paid to the persons in whose names such 2009B Bonds are registered at the close of business on a special record date which shall be fixed by the Fiscal Agent. The Fiscal Agent shall cause notice of the date and amount of the proposed payment of defaulted interest and the special record date therefor to be mailed to each registered owner of the 2009B Bonds, at their respective addresses appearing in the Bond Register, not less than ten (10) days prior to the special record date.
Interest on the 2009B Bonds shall be paid by check drawn on the Fiscal Agent and mailed to each registered owner of the 2009B Bonds at the address as it appears on the Bond Register or at such other address as is furnished to the Fiscal Agent in writing by any such registered owner, or by wire transfer to a designated account within the continental United States upon receipt by the Fiscal Agent, at least two (2) business days prior to the applicable Record Date, of the written request of a registered owner of $1,000,000 or more aggregate principal amount of 2009B Bonds.
The 2009B Interest Payment Dates for interest accrued on the 2009B Bonds during the Weekly Mode or the Daily Mode are the first Business Day of each month (each a “2009B Interest Payment Date”). For 2009B Bonds purchased with funds drawn on or advanced under a Liquidity Facility (“Bank Bonds”), accrued interest will be paid on each day set forth in the Liquidity Facility or other governing agreement, as applicable.
Interest on the 2009B Bonds shall accrue from each 2009B Interest Payment Date through and including the day immediately preceding the next 2009B Interest Payment Date.
So long as Cede & Co., or any other nominee of DTC, is the registered owner of the 2009B Bonds, payment of principal of, redemption premium, if any, and interest on the 2009B Bonds, and the
-4-
purchase price of 2009B Bonds, when due, are to be made to DTC, and all such payments shall be valid and effective to satisfy fully and to discharge the obligations of the City with respect to, and to the extent of, principal, redemption premium, if any, and interest or purchase price so paid.
The 2009B Bonds will bear interest at a Weekly Rate unless and until converted (a “Conversion”) from time to time by the City to a different Mode as permitted under the Bond Committee Resolution. The permitted Modes are the “Daily Mode,” the “CP Mode,” the “Weekly Mode,” the “Term Rate Mode” and the “Fixed Rate Mode”. The interest rates in each Mode shall be determined by the Remarketing Agent appointed under the Bond Committee Resolution, provided that the interest rate on the 2009B Bonds shall not exceed 12% per annum, and with respect to Bank Bonds, the rate specified in the Credit Facility but in no event exceeding the highest rate allowed by law.
While in the Daily Mode or the Weekly Mode, the 2009B Bonds may be issued only in denominations of $100,000 and any larger denomination constituting an integral multiple of $5,000.
The Fiscal Agent has been appointed as Tender Agent (the “Tender Agent”) for the 2009B Bonds under the Bond Committee Resolution. The payment office of the Fiscal Agent as of the date hereof is 50 South 16th Street, Philadelphia, Pennsylvania. RBC Capital Markets, LLC (the “Remarketing Agent”) will act as Remarketing Agent for the 2009B Bonds pursuant to a Remarketing Agreement with the City (the “Remarketing Agreement”) effective August 1, 2011. The Remarketing Agent may be removed at any time by the City, as set forth in the Remarketing Agreement, upon 30 days’ prior notice (or such shorter notice as is acceptable to the Remarketing Agent, in its sole discretion) to the Fiscal Agent, the Credit Provider, the Tender Agent and the Remarketing Agent. The Remarketing Agent may resign upon 30 days’ prior notice (or such shorter notice as is acceptable to the City, in its sole discretion) to the City, the Fiscal Agent, the Credit Provider and the Tender Agent.
Determination of Interest Rates
The interest rate for the 2009B Bonds in the Daily Mode or Weekly Mode shall be the rate of interest per annum determined by the Remarketing Agent on and as of the applicable Rate Determination Date (defined below) as the minimum rate of interest which, in the opinion of the Remarketing Agent under then-existing market conditions, would result in the sale of the 2009B Bonds in the Daily Rate Period or Weekly Rate Period, as applicable, at a price equal to the principal amount thereof, plus interest, if any, accrued through the Rate Determination Date during the then current Interest Accrual Period (defined below). Interest on the 2009B Bonds accruing at the Daily Rate and the Weekly Rate will be computed on the basis of a 365- or 366-day year for the actual number of days elapsed.
While the 2009B Bonds bear interest at the Weekly Rate (the “Weekly Mode”), the Remarketing Agent shall establish the Weekly Rate by 4:00 P.M. on each Rate Determination Date. The Weekly Rate shall be in effect during the applicable Weekly Rate Period (defined below). The Remarketing Agent shall make the Weekly Rate available no later than 5:00 P.M. on the business day following the Rate Determination Date by electronic means to any beneficial owner requesting such Weekly Rate.
While the 2009B Bonds bear interest at the Daily Rate (the “Daily Mode”), the Remarketing Agent shall establish the Daily Rate by 10:00 A.M. on each Rate Determination Date. The Daily Rate for any day during the Daily Mode which is not a Business Day shall be the Daily Rate established on the immediately preceding Rate Determination Date. The Remarketing Agent shall make the Daily Rate available no less frequently than 10:00 A.M. of each day by Electronic Means to any Beneficial Owner requesting such Daily Rate.
-5-
“Daily Rate Period” means for 2009B Bonds in the Daily Mode, the period from a business day on which a Daily Rate is set, to but not including the next succeeding business day.
“Interest Accrual Period” means the period during which a 2009B Bond accrues interest payable on the next 2009B Interest Payment Date applicable thereto. Each Interest Accrual Period shall commence on (and include) the last 2009B Interest Payment Date to which interest has been paid to, but not including, the 2009B Interest Payment Date on which interest is to be paid. If, at the time of authentication of any 2009B Bond, interest is in default or overdue on the 2009B Bonds, such 2009B Bond shall bear interest from the date to which interest has previously been paid in full or made available for payment in full on outstanding 2009B Bonds.
“Rate Determination Date” means any date on which the interest rate on any 2009B Bonds shall be determined, which in the case of the Weekly Mode, shall be each Wednesday or, if Wednesday is not a business day, then the business day next preceding such Wednesday and in the case of the Daily Mode shall be each business day commencing with the first day (which must be a business day) the 2009B Bonds become subject to the Daily Mode.
“Weekly Rate Period” means the period during which a 2009B Bond in the Weekly Mode shall bear interest at a Weekly Rate, which shall be the period commencing on Thursday of each week to and including Wednesday of the following week, except the first Weekly Rate Period which shall be from the date of change in Mode (a "Mode Change Date") or the date of initial issuance of the 2009B Bonds, as applicable, to and including the Wednesday of the following week and the last Weekly Rate Period which shall be from and including the Thursday of the week prior to the Mode Change Date to and including the day next preceding the Mode Change Date or the final maturity date of the 2009B Bonds.
Failure of the Remarketing Agent to Determine the Interest Rate
In the event (i) the Remarketing Agent fails or is unable to determine the interest rate or Interest Period for the 2009B Bonds in a Weekly Mode or a Daily Mode, (ii) the method by which the Remarketing Agent determines the interest rate or Interest Period with respect to the 2009B Bonds shall be held to be unenforceable by a court of law of competent jurisdiction or (iii) the Remarketing Agent suspends its remarketing efforts in accordance with the Remarketing Agreement, the 2009B Bonds shall bear interest during each subsequent Weekly Rate Period or Daily Rate Period, as applicable, at the Alternate Rate in effect on the first day of such Interest Period until such time as such event is no longer applicable to the 2009B Bonds. These provisions shall continue to apply until such time as the Remarketing Agent (or the City, if applicable) again makes such determinations. In the case of clause (ii) above, the Remarketing Agent (or the City, if applicable) shall again make such determination at such time as there is delivered to the Remarketing Agent and the City an opinion of bond counsel to the effect that there are no longer any legal prohibitions against such determinations.
“Alternate Rate” means on any Rate Determination Date, a rate per annum equal to (a) the SIFMA Municipal Swap Index maintained by Municipal Market Data (as such term is defined in the 2000 ISDA U.S. Municipal Counterparty Definitions) (the “SIFMA Rate”) most recently available as of the date of determination, or (b) if such index is no longer available, or if the SIFMA Rate is no longer published, the Kenny Index (as such term is defined in the 2000 ISDA U.S. Municipal Counterparty Definitions), or (c) if neither the SIFMA Rate nor the Kenny Index is published, the index determined by the Remarketing Agent to equal the prevailing rate for tax-exempt state and local government bonds meeting criteria determined in good faith by the Remarketing Agent to be comparable under the circumstances to the criteria used by the Bond Market Association to determine the SIFMA Rate just prior to when the Bond Market Association stopped publishing the SIFMA Rate. If there is no Remarketing Agent, if the Remarketing Agent fails to make any such determination or if the Remarketing
-6-
Agent has suspended its remarketing efforts in accordance with the Remarketing Agreement, then the Director of Finance or the City Treasurer shall appoint another person to make the determinations required by clauses (a), (b) and (c) of this definition.
Conversions of Rate Periods for the 2009B Bonds
The City may elect to convert in whole or in part the 2009B Bonds from the Weekly Rate Period to another type of Rate Period if it satisfies the conditions precedent to such conversion set forth in the Bond Committee Resolution. The conditions to conversion include delivery of a conversion notice and, if converting from a short-term to a long-term rate, delivery of an opinion of counsel to the effect that the proposed conversion will not adversely affect the tax-exempt status of the 2009B Bonds to be converted.
Upon a partial conversion of the 2009B Bonds to another Mode, the City may or if any portion of the 2009B Bonds will be secured with a Credit Facility or Liquidity Facility shall designate separate subseries of 2009B Bonds corresponding to the 2009B Bonds in each Mode following such conversion and exchange the 2009B Bonds currently held by the registered owner thereof for a 2009B Bond reflecting such change in Mode and designation of separate subseries.
If the conditions to the conversion of the 2009B Bonds bearing interest at a Weekly Rate or a Daily Rate to another Rate Period (except a conversion from a Weekly Rate to a Daily Rate or from a Daily Rate to a Weekly Rate after which the then-current Credit Facility, if any, and Liquidity Facility, if any, will remain in place for the Mode to which the 2009B Bonds are being converted) are satisfied, then the 2009B Bonds to be converted will be subject to mandatory tender on the effective date of the conversion, as described under “Mandatory Tender for Purchase.” If the conditions to a conversion are not satisfied, then the conversion will not occur, the 2009B Bonds to be converted will not be subject to mandatory tender (unless notice of such mandatory tender has been sent to the registered owners of the 2009B Bonds) and the Weekly Rate or Daily Rate, as applicable, for such 2009B Bonds will continue to apply.
The City may rescind any election by it to change a Mode as described above prior to the Mode Change Date by giving written notice thereof to the Fiscal Agent, the Tender Agent, the Remarketing Agent, the Credit Provider, if any, and the Liquidity Provider prior to such Mode Change Date. If the Tender Agent receives notice of such rescission prior to the time the Tender Agent has given notice to the holders of the Series 2009B Bonds, then such notice of change in Mode shall be of no force and effect. If the Tender Agent receives notice from the City of rescission of a Mode change after the Tender Agent has given notice thereof to the holders of the Series 2009B Bonds, then if the proposed Mode Change Date would have been a Mandatory Purchase Date, such date shall continue to be a Mandatory Purchase Date. For a proposed change in Mode from the Daily Mode or Weekly Mode, the Series 2009B Bonds shall remain in the Daily Mode or the Weekly Mode, as applicable.
A failure or cancellation of a conversion of the Rate Period for the 2009B Bonds from Weekly Rates or Daily Rates will not constitute an Event of Default.
Optional Tender for Purchase
The owners of 2009B Bonds in a Weekly Mode or a Daily Mode may elect to have their 2009B Bonds (or portions of those 2009B Bonds in amounts equal to Authorized Denominations) purchased on any Business Day at a price equal to the Purchase Price, upon delivery of a notice to the Tender Agent specifying (i) the principal amount of the 2009B Bonds to be purchased, (ii) the purchase date on which such 2009B Bonds are to be purchased, (iii) the applicable payment instructions with respect to the 2009B Bonds to be purchased and (iv) an irrevocable demand for such purchase by the Tender Notice Deadline,
-7-
which is (A) during the Daily Mode, 9:00 A.M. on any Business Day and (B) during the Weekly Mode, 5:00 P.M. on the Business Day seven days prior to the applicable purchase date. Promptly, but during the Daily Mode by no later than 9:15 AM, upon receipt of such notice, the Tender Agent shall notify the Remarketing Agent and provide the Remarketing Agent with a copy of such notice. “Purchase Price” shall mean the principal amount of such 2009B Bonds purchased on any purchase date, plus accrued interest to the purchase date (unless such purchase date is a 2009B Interest Payment Date, in which case the Purchase Price shall not include accrued interest, which shall be paid in the normal course.)
Mandatory Tender for Purchase
The 2009B Bonds in a Weekly Mode or a Daily Mode are subject to mandatory purchase on each Mandatory Purchase Date (defined below), in each case at a purchase price (the “Purchase Price”) equal to the principal amount thereof, without premium, plus accrued interest to the Mandatory Purchase Date. The Tender Agent shall give notice of such mandatory purchase by mail to the owners of the 2009B Bonds subject to mandatory purchase no less than fifteen (15) days (seven (7) days in the case of a Mandatory Purchase Date described in clause (iv) of the definition thereof) prior to the Mandatory Purchase Date. Any notice shall state the Mandatory Purchase Date, the Purchase Price, that interest on 2009B Bonds subject to mandatory purchase shall cease to accrue from and after the Mandatory Purchase Date and, if pursuant to clause (v) of the definition of Mandatory Purchase Date, the aggregate principal amount of 2009B Bonds subject thereto. The failure to mail such notice with respect to any 2009B Bond shall not affect the validity of the mandatory purchase of any other 2009B Bond with respect to which notice was so mailed. Any notice mailed will be conclusively presumed to have been given, whether or not actually received by any Owner or Beneficial Owner.
“Mandatory Purchase Date” for 2009B Bonds in the Weekly Mode or Daily Mode means: (i) any Mode Change Date (except a change in Mode between the Daily Mode and the Weekly Mode after which the then-current Credit Facility, if any, and Liquidity Facility, if any, will remain in place for the Mode to which the 2009B Bonds are being converted) with respect to the 2009B Bonds to be converted to a new Mode or a new Term Rate Period, (ii) any date an Alternate Credit Facility or an Alternate Liquidity Facility is substituted for the existing Credit Facility or Liquidity Facility, as applicable, (iii) the fifth Business Day prior to the expiration date of the Liquidity Facility or Credit Facility, (iv) the date specified by the Fiscal Agent following the occurrence of an event of default (other than an Automatic Termination Event) under the Liquidity Facility or Credit Facility, which date shall be a Business Day not later than twelve (12) days after the Fiscal Agent’s receipt of written notice of such event of default from the Credit Provider or the Liquidity Provider and in no event later than the business day preceding the termination date specified in a written notice by the Credit Provider or the Liquidity Provider and (v) with respect to all or part of the 2009B Bonds, any business day specified in a written notice by the City (which, if in part, shall also state the aggregate principal amount of 2009B Bonds subject to such tender) not less than 20 days after the Fiscal Agent’s and Tender Agent’s receipt of such notice.
“Automatic Termination Event” means an event of default set forth in the Liquidity Facility which would result in the immediate termination of the Liquidity Facility prior to its stated expiration date without prior notice from the Liquidity Provider to the Tender Agent.
The Bond Committee Resolution provides that the City may provide an Alternate Liquidity Facility or Alternate Credit Facility to replace the Liquidity Facility or Credit Facility, as applicable, then in effect. As described above, the 2009B Bonds will be subject to mandatory tender for purchase in connection with the substitution of any Alternate Liquidity Facility for the Liquidity Facility then in effect or Alternate Credit Facility for the Credit Facility then in effect.
-8-
Payment of Purchase Price; Delivery of 2009B Bonds
On each date on which a 2009B Bond is to be purchased, the Tender Agent shall draw on the Liquidity Facility (or cause the Fiscal Agent to so draw if the Fiscal Agent is the beneficiary of the Liquidity Facility, or if no Liquidity Facility is in effect, request funds from the City) by 11:00 A.M. in an amount equal to the difference between (i) the Purchase Price of all tendered 2009B Bonds for which the Liquidity Facility is then in effect (other than Bank Bonds and City Bonds) and (ii) the amount of remarketing proceeds delivered to the Tender Agent resulting from a partial remarketing. If a Liquidity Facility is in effect and funds on deposit in the Remarketing Proceeds Account and the Liquidity Facility Purchase Account are insufficient to pay the Purchase Price of 2009B Bonds tendered on such Purchase Date, the Fiscal Agent shall give notice to the City by 2:00 P.M. on the Purchase Date of the amount of such deficiency.
By 2:30 P.M. on the date on which a 2009B Bond is to be purchased, the Tender Agent shall purchase tendered 2009B Bonds from the tendering owners at the applicable Purchase Price by wire transfer in immediately available funds. Funds for the payment of such Purchase Price shall be derived solely from the following sources in the order of priority indicated and none of the Tender Agent, the Fiscal Agent nor the Remarketing Agent shall be obligated to provide funds from any other source: (a) immediately available funds on deposit in the Remarketing Proceeds Account; (b) immediately available funds on deposit in the Liquidity Facility Purchase Account resulting from a drawing on the Liquidity Facility; and (c) moneys of the City, if any, on deposit in the City Purchase Account.
If no Liquidity Facility is in effect, then the City shall be obligated to deposit amounts into the City Purchase Account sufficient to pay the Purchase Price to the extent that amounts on deposit in the Remarketing Proceeds Account are insufficient therefor. If a Liquidity Facility is in effect, then the City may, but shall not be obligated to, deposit amounts into the City Purchase Account sufficient to pay the Purchase Price to the extent that amounts on deposit in the Remarketing Proceeds Account and the Liquidity Facility Purchase Account are insufficient therefor.
All tenders for purchase during any period in which the 2009B Bonds are registered in the name of Cede & Co. (or the nominee of any successor to DTC) shall be subject to the terms and conditions set forth in the Letter of Representations and to any regulations promulgated by DTC (or any successor to DTC). For so long as the 2009B Bonds are registered in the name of Cede & Co., as nominee for DTC, the tender option rights of holders of 2009B Bonds may be exercised only by DTC by giving notice of its election to tender 2009B Bonds or portions thereof at the times and in the manner described above. Beneficial Owners will not have any rights to tender 2009B Bonds directly to the Tender Agent. Procedures under which a Beneficial Owner may direct a Direct Participant of DTC, or an Indirect Participant of DTC acting through a Direct Participant of DTC, to exercise a tender option right in respect of 2009B Bonds or portions thereof in an amount equal to all or a portion of such Beneficial Owner’s beneficial ownership interest therein shall be governed by standing instructions and customary practices determined by such Direct Participant or Indirect Participant. For so long as the 2009B Bonds are registered in the name of Cede & Co., as nominee for DTC, delivery of 2009B Bonds required to be tendered for purchase shall be effected by the transfer on the applicable Purchase Date of a book-entry credit to the account of the Tender Agent of a beneficial interest in such 2009B Bonds.
Remarketing of the 2009B Bonds
Upon receipt by the Remarketing Agent from the Tender Agent of notice of any optional tender of 2009B Bonds, as required under the Bond Committee Resolution, or if the 2009B Bonds become subject to mandatory purchase, the Remarketing Agent (subject to the provisions of the Bond Committee Resolution and the Remarketing Agreement) will use its best efforts to sell such 2009B Bonds, at a
-9-
purchase price equal to the principal amount thereof plus accrued interest, if any, to the Purchase Date. Subject to the provisions of the Remarketing Agreement and the Bond Committee Resolution, the Remarketing Agent also will use its best efforts to sell any Bank Bonds, at a purchase price equal to the principal amount thereof plus accrued interest to the sale date. See “REMARKETING AGENT” herein.
Redemption of the 2009B Bonds
Optional Redemption During the Weekly Mode and the Daily Mode. The 2009B Bonds bearing interest at a Weekly Rate or a Daily Rate are subject to optional redemption by the City, in whole or in part, in Authorized Denominations on any Business Day, at a redemption price equal to the principal amount thereof, plus accrued interest, if any, to the redemption date.
Each optional redemption of 2009B Bonds shall be conditional and of no effect unless there are on deposit with the Fiscal Agent, as of the redemption date, sufficient funds to effect any such proposed redemption in full.
In the case of a 2009B Bond in a denomination larger than the minimum Authorized Denomination, a portion of such 2009B Bond may be redeemed, provided that the remaining portion of such 2009B Bond shall be in an Authorized Denomination.
If less than all of the 2009B Bonds are subject to optional redemption at any time, the particular 2009B Bonds or portions thereof to be redeemed shall be selected by the Fiscal Agent within a maturity by lot or by such other method as the Fiscal Agent in its discretion shall deem fair and reasonable; provided, however, Bank Bonds shall be redeemed prior to any other 2009B Bonds.
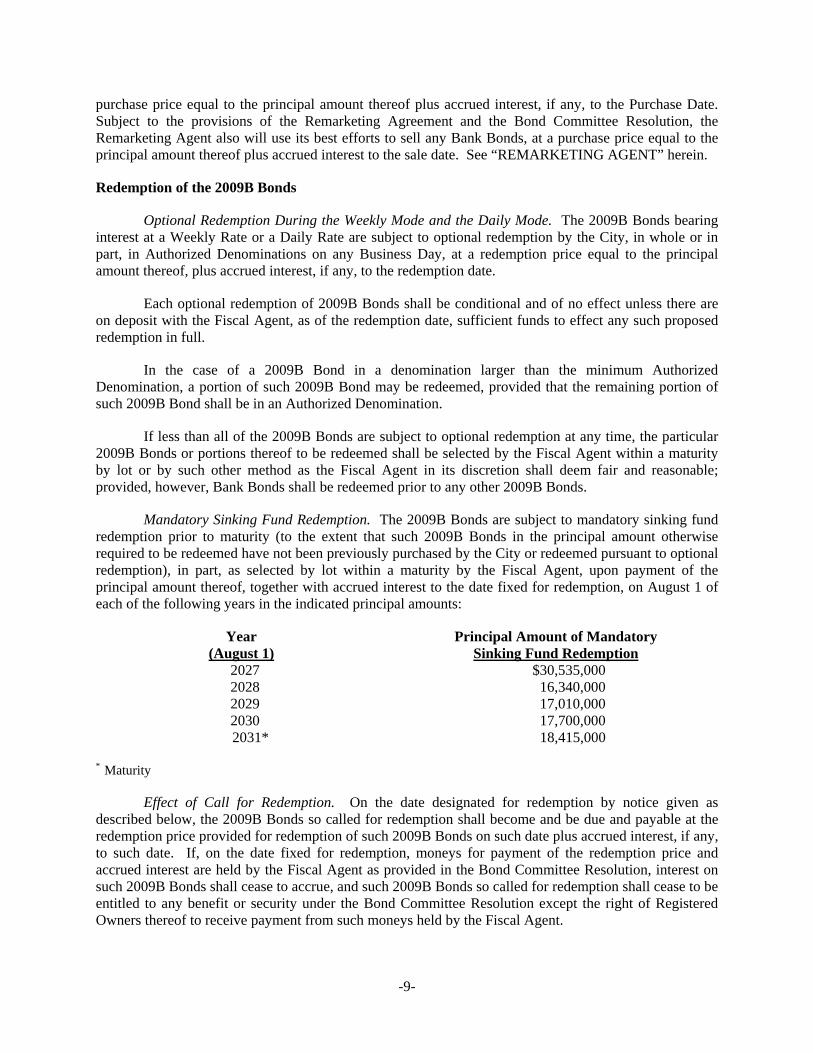
Mandatory Sinking Fund Redemption. The 2009B Bonds are subject to mandatory sinking fund redemption prior to maturity (to the extent that such 2009B Bonds in the principal amount otherwise required to be redeemed have not been previously purchased by the City or redeemed pursuant to optional redemption), in part, as selected by lot within a maturity by the Fiscal Agent, upon payment of the principal amount thereof, together with accrued interest to the date fixed for redemption, on August 1 of each of the following years in the indicated principal amounts:
Year (August 1)
Principal Amount of Mandatory Sinking Fund Redemption
2027 $30,535,000 2028 16,340,000 2029 17,010,000 2030 17,700,000
2031* 18,415,000 * Maturity
Effect of Call for Redemption. On the date designated for redemption by notice given as described below, the 2009B Bonds so called for redemption shall become and be due and payable at the redemption price provided for redemption of such 2009B Bonds on such date plus accrued interest, if any, to such date. If, on the date fixed for redemption, moneys for payment of the redemption price and accrued interest are held by the Fiscal Agent as provided in the Bond Committee Resolution, interest on such 2009B Bonds shall cease to accrue, and such 2009B Bonds so called for redemption shall cease to be entitled to any benefit or security under the Bond Committee Resolution except the right of Registered Owners thereof to receive payment from such moneys held by the Fiscal Agent.
-10-
Notice of Redemption. Notice of redemption identifying the 2009B Bonds to be redeemed shall be mailed by first class mail, postage prepaid, to the registered owners of the 2009B Bonds selected for redemption by the Fiscal Agent not less than thirty (30) nor more than sixty (60) days prior to the date set for redemption. Such notice shall be mailed to the respective addresses of the registered owners of the 2009B Bonds to be redeemed as the same shall appear in the Bond Register. Such notice shall be given in the name of the City, shall identify the 2009B Bonds to be redeemed by certificate number, unless all of the 2009B Bonds are being redeemed whereupon certificate numbers need not be identified, series, CUSIP number, date of issue, interest rate, maturity date and any other identifying information (and in the case of a partial redemption of any 2009B Bonds, the respective principal amount thereof to be redeemed and the numbers, including CUSIP numbers if applicable, of the 2009B Bonds, or portions thereof, to be redeemed which may, if appropriate, be expressed in designated blocks of numbers), shall specify the redemption date, the redemption price and the Fiscal Agent’s name and address, and shall state that on the redemption date, the 2009B Bonds called for redemption will be payable at the designated corporate trust office of the Fiscal Agent and that, from the date of redemption, interest will cease to accrue; provided, however, that the registered owners of 2009B Bonds to be redeemed may file written waivers of notice with the Fiscal Agent and, if so waived, such 2009B Bonds may be redeemed without the requirement of written notice to such registered owner.
Any notice mailed in the manner herein provided shall be conclusively presumed to have been duly given, whether or not received by the registered owner. Failure to so mail any such notice to a registered owner or any defect therein shall not affect the validity of the proceedings for such redemption as to any other Registered Owner to whom proper notice has been mailed.
Each notice of redemption with respect to an optional redemption pursuant to the provisions above shall specify that, to the extent that funds on deposit with the Fiscal Agent as of the redemption date are insufficient to provide funds to effect any such proposed redemption in full, then such call for redemption shall be of no effect.
No notice of redemption is required to be given for a redemption occurring on a Mandatory Purchase Date for a 2009B Bond.
Transfer and Exchange
2009B Bonds may be surrendered for registration of transfer or for exchange to the Fiscal Agent, as bond registrar, duly endorsed, or accompanied by a written instrument of transfer in form and with guaranty of signature satisfactory to the bond registrar and executed by the registered owner or the registered owner’s attorney-in-fact. The Fiscal Agent is required to execute and deliver to and in the name of the designated transferee one or more new fully registered 2009B Bonds of the same maturity and stated interest rate, in authorized denominations and of the same aggregate principal amount as the 2009B Bonds so surrendered. No service charge will be made for any transfer or exchange, except that the registered owner requesting the transfer or exchange shall be required to pay any tax or governmental charge payable in connection herewith. When the book-entry system is in effect, transfers of Beneficial Owners’ interests in the 2009B Bonds will be accomplished by book entries made by DTC and, in turn, by the DTC Participants who act on behalf of the Beneficial Owners. See “Book-Entry System” hereinafter.
Constitutional Debt Limit
General obligation debt of the City is of two types: (i) debt (herein called “Tax-Supported”) which is subject to the limitation of the Constitution of the Commonwealth (the aggregate limit on such debt equals 13.5% of the average annual assessed value of taxable real property in the City during the ten
-11-
(10) years immediately preceding the year in which debt is incurred (of which no more than 3% may be non-electoral debt)); and (ii) debt (herein called “Self-Supporting”) which, having been incurred for revenue producing facilities reasonably expected to yield revenue in excess of operating expenses sufficient to pay the interest and sinking fund charges thereon, is excluded from the computation of debt for the purposes of the constitutional debt limit. The amount of such Self-Supporting general obligation debt to be so excluded must be determined by the Court of Common Pleas of Philadelphia County upon petition by the City. Self-Supporting debt is general obligation debt of the City and ranks equally in all respects with tax-supported general obligation debt, the only distinction being that it is not used in the calculation of the constitutional debt limit and revenues are expected to be generated by the facilities in amounts sufficient to cover their debt service. Self-Supporting debt, however, is not secured by a lien on any particular revenues. See “DEBT OF THE CITY” in Appendix A hereto.
As of July 1, 2011: (i) the constitutional debt limitation for tax-supported general obligation debt was approximately $1,571,939,000 (based upon a formula of 13.5% of the assessed value of taxable real estate within the City on a ten (10) year rolling average); (ii) the City’s total amount of authorized general obligation debt was $1,830,000,000, which includes approximately $355,381,000 of Self-Supporting debt and the legally authorized deductions shown below, which do not count against the constitutional debt limit; (iii) $1,434,080,000 of general obligation debt subject to the constitutional debt limit was authorized, and of this authorized amount, $1,370,696,000 was issued and outstanding; (iv) a balance of $459,304,000 remained authorized and unissued (as described below under “Authorizations”); and (v) after legally authorized deductions for appropriations of approximately $40,539,000 for fiscal year 2011 maturing serial bonds, there remained a balance of $137,859,000 available for future authorization and issuance.
The City is also authorized to issue revenue bonds pursuant to The First Class City Revenue Bond Act of 1972. Currently, the City issues revenue bonds to support the Division of Aviation, the Water Department and the Philadelphia Gas Works. Bonds so issued are excluded for purposes of the calculation of the constitutional debt limit. See “Security” herein.
Authorization
Under Article 9, Section 12 of the Constitution of the Commonwealth and the Acts of General Assembly of the Commonwealth of June 25, 1919, P.L. 581, as amended and June 11, 1941, P.L. 113, amended December 8, 1985, P.L. 324 (together, the “Act”), the City is authorized to issue bonds to refund bonds previously issued to secure indebtedness of the City. Pursuant to the Act, the Council of the City enacted an Ordinance (Bill No. 090324) on June 4, 2009 (the “Ordinance”) authorizing borrowings by the issuance and sale of bonds (including the 2009B Bonds) for the purpose of refunding the 2007B Bonds.
The Ordinance, which was signed by the Mayor on June 15, 2009, authorized the Mayor, City Controller and the City Solicitor, or a majority of them (the “Bond Committee”), to issue and sell on behalf of the City up to $320,000,000 aggregate principal amount (exclusive of costs of issuance of the 2009 Bonds, including, but not limited to, underwriters’ discount, swap termination fees, costs of liquidity and/or credit enhancement, original issue discount or redemption premiums, if any, on the 2007B Bonds or similar items) of general obligation bonds of the City in one or more series, for the purpose of refunding the 2007B Bonds.
By the Bond Committee Resolution adopted on July 28, 2009 (the “2009 Bond Committee Resolution”), the Bond Committee authorized the issuance of $100,000,000 principal amount of the 2009B Bonds, and determined the terms of the 2009B Bonds, including the interest rates, maturity dates and redemption provisions. Further, by the Bond Committee Resolution adopted on July 27, 2011 (together with the 2009 Bond Committee Resolution, the “Bond Committee Resolution”), the Bond
-12-
Committee authorized the replacement of the letter of credit for the 2009B Bonds with the Letter of Credit and the replacement of the Remarketing Agent for the 2009B Bonds. Copies of the Bond Committee Resolution are available from the Remarketing Agent upon request.
Book-Entry System
The information in this section has been obtained from materials provided by DTC for such purpose. The City and the Fiscal Agent do not guaranty the accuracy or completeness of such information and such information is not to be construed as a representation of the City or the Fiscal Agent.
Currently, the 2009B Bonds are available only in book-entry form, and purchasers of the 2009B Bonds will not receive certificates representing their interests in the 2009B Bonds purchased.
The Depository Trust Company (“DTC”) acts as securities depository for the 2009B Bonds. The 2009B Bonds were issued as fully-registered securities registered in the name of Cede & Co. (DTC’s partnership nominee) or such other name as may be requested by an authorized representative of DTC. One fully-registered 2009B Bond certificate was issued for the 2009B Bonds, in the aggregate principal amount of the 2009B Bonds, and deposited with DTC.
DTC, the world’s largest depository, is a limited-purpose trust company organized under the New York Banking Law, a “banking organization” within the meaning of the New York Banking Law, a member of the Federal Reserve System, a “clearing corporation” within the meaning of the New York Uniform Commercial Code, and a “clearing agency” registered pursuant to the provision of Section 17A of the Securities Exchange Act of 1934. DTC holds and provides asset servicing for over 3.5 million issues of U.S. and non-U.S. equity issues, corporate and municipal debt issues, and money market instruments from over 100 countries that DTC’s participants (“Direct Participants”) deposit with DTC. DTC also facilitates the post-trade settlement among Direct Participants of sales and other securities transactions in deposited securities, through electronic computerized book-entry transfers and pledges between Direct Participants’ accounts. This eliminates the need for physical movement of securities certificates. Direct Participants include both U.S. and non-U.S. securities brokers and dealers, banks, trust companies, clearing corporations, and certain other organizations. DTC is a wholly-owned subsidiary of The Depository Trust & Clearing Corporation (“DTCC”). DTCC, in turn, is owned by a number of Direct Participants of DTC and Members of the National Securities Clearing Corporation, Fixed Income Clearing Corporation, and Emerging Markets Clearing Corporation, (NSCC, FICC, and EMCC, also subsidiaries of DTCC), as well as by the New York Stock Exchange, Inc., the American Stock Exchange LLC, and the National Association of Securities Dealers, Inc. Access to the DTC system is also available to others such as both U.S. and non-U.S. securities brokers and dealers, banks, trust companies, and clearing corporations that clear through or maintain a custodial relationship with a Direct Participant, either directly or indirectly (“Indirect Participants”). DTC has Standard & Poor’s highest rating: AAA. The DTC Rules applicable to its Participants are on file with the Securities and Exchange Commission. More information about DTC can be found at www.dtcc.com and www.dtc.org.
Purchases of the 2009B Bonds under the DTC system must be made by or through Direct Participants, which will receive a credit for the 2009B Bonds on DTC’s records. The ownership interest of each actual purchaser of 2009B Bonds (“Beneficial Owner”) is in turn to be recorded on the Direct and Indirect Participants’ records. Beneficial Owners will not receive written confirmation from DTC of their purchase. Beneficial Owners are, however, expected to receive written confirmations providing details of the transaction, as well as periodic statements of their holdings, from the Direct or Indirect Participant through which the Beneficial Owners entered into the transaction. Transfers of ownership interests in the 2009B Bonds are to be accomplished by entries made on the books of Direct and Indirect Participants
-13-
acting on behalf of Beneficial Owners. Beneficial Owners will not receive certificates representing their ownership interests in the 2009B Bonds, except in the event that use of the book-entry system for the 2009B Bonds is discontinued.
To facilitate subsequent transfers, all 2009B Bonds deposited by Direct Participants with DTC are registered in the name of DTC’s partnership nominee, Cede & Co., or such other name as may be requested by an authorized representative of DTC. The deposit of 2009B Bonds with DTC and their registration in the name of Cede & Co. or such other DTC nominee do not effect any change in beneficial ownership. DTC has no knowledge of the actual Beneficial Owners of the 2009B Bonds; DTC’s records reflect only the identity of the Direct Participants to whose accounts such 2009B Bonds are credited, which may or may not be the Beneficial Owners. The Direct and Indirect Participants will remain responsible for keeping account of their holdings on behalf of their customers.
Conveyance of notices and other communications by DTC to Direct Participants, by Direct Participants to Indirect Participants, and by Direct Participants and Indirect Participants to Beneficial Owners will be governed by arrangements among them, subject to any statutory or regulatory requirements as may be in effect from time to time. Beneficial Owners of 2009B Bonds may wish to take certain steps to augment the transmission to them of notices of significant events with respect to the 2009B Bonds, such as redemptions, tenders, defaults, and proposed amendments to the security documents. For example, Beneficial Owners of 2009B Bonds may wish to ascertain that the nominee holding the 2009B Bonds for their benefit has agreed to obtain and transmit notices to Beneficial Owners. In the alternative, Beneficial Owners may wish to provide their names and addresses to the Fiscal Agent and request that copies of notices be provided directly to them.
Redemption notices shall be sent to DTC. If less than all the 2009B Bonds are being redeemed, DTC’s practice is to determine by lot the amount of the interest of each Direct Participant to be redeemed.
Neither DTC nor Cede & Co. (nor any other DTC nominee) will consent or vote with respect to the 2009B Bonds unless authorized by a Direct Participant in accordance with DTC’s Procedures. Under its usual procedures, DTC mails an Omnibus Proxy to the City as soon as possible after the record date. The Omnibus Proxy assigns Cede & Co.’s consenting or voting rights to those Direct Participants to whose accounts the 2009B Bonds are credited on the record date (identified in a listing attached to the Omnibus Proxy).
Principal and interest payments on the 2009B Bonds, payment of proceeds of redemption of 2009B Bonds and payments of the purchase price for 2009B Bonds tendered for purchase will be made to Cede & Co., or such other nominee as may be requested by an authorized representative of DTC. DTC’s practice is to credit Direct Participants’ accounts upon DTC’s receipt of funds and corresponding detail information from the City or the Fiscal Agent on payable date in accordance with their respective holdings shown on DTC’s records. Payments by Participants to Beneficial Owners will be governed by standing instructions and customary practices, as is the case with securities held for the accounts of customers in bearer form or registered in “street name,” and will be the responsibility of such Participant and not of DTC nor its nominee, the City or the Fiscal Agent, subject to any statutory or regulatory requirements as may be in effect from time to time. Payments of principal and interest, redemption proceeds and purchase price with respect to the 2009B Bonds to Cede & Co. (or such other nominee as may be requested by an authorized representative of DTC) is the responsibility of the City or the Fiscal Agent, disbursement of such payments to Direct Participants will be the responsibility of DTC, and disbursement of such payments to the Beneficial Owners will be the responsibility of Direct and Indirect Participants.
-14-
A Beneficial Owner shall give notice to elect to have its 2009B Bonds purchased or tendered, through its Participant, to the Tender Agent or Remarketing Agent, and shall effect delivery of such 2009B Bonds by causing the Direct Participant to transfer the Participant’s interest in the 2009B Bonds, on DTC’s records, to the Tender Agent. The requirement for physical delivery of 2009B Bonds in connection with an optional tender or a mandatory purchase will be deemed satisfied when the ownership rights in the 2009B Bonds are transferred to Direct Participants on DTC’s records and followed by a book-entry credit of tendered 2009B Bonds to the Tender Agent’s account.
DTC may discontinue providing its services as securities depository with respect to the 2009B Bonds at any time by giving reasonable notice to the City or the Fiscal Agent. Under such circumstances, in the event that a successor securities depository is not obtained, 2009B Bond certificates are required to be printed and delivered.
The City may decide to discontinue use of the system of book-entry transfers through DTC (or a successor securities depository). In that event, 2009B Bond certificates will be printed and delivered.
THE CITY, THE FISCAL AGENT, TENDER AGENT AND THE REMARKETING AGENT CANNOT AND DO NOT GIVE ANY ASSURANCES THAT DTC WILL DISTRIBUTE TO ITS PARTICIPANTS OR THAT DIRECT PARTICIPANTS OR INDIRECT PARTICIPANTS WILL DISTRIBUTE TO BENEFICIAL OWNERS OF THE 2009B BONDS (i) PAYMENTS OF THE PRINCIPAL AND REDEMPTION PRICE OF AND INTEREST ON THE 2009B BONDS, OR (ii) CONFIRMATION OF OWNERSHIP INTERESTS IN THE 2009B BONDS, OR (iii) REDEMPTION OR OTHER NOTICES OR THAT THEY WILL DO SO ON A TIMELY BASIS, OR THAT DTC DIRECT PARTICIPANTS OR INDIRECT PARTICIPANTS WILL SERVE AND ACT IN THE MANNER DESCRIBED IN THIS REMARKETING MEMORANDUM. THE CURRENT “RULES” APPLICABLE TO DTC ARE ON FILE WITH THE SEC AND THE CURRENT “PROCEDURES” OF DTC TO BE FOLLOWED IN DEALING WITH ITS PARTICIPANTS ARE ON FILE WITH DTC.
NEITHER THE CITY, THE FISCAL AGENT NOR THE REMARKETING AGENT WILL HAVE ANY RESPONSIBILITY OR OBLIGATION TO DTC, DIRECT PARTICIPANTS, INDIRECT PARTICIPANTS OR BENEFICIAL OWNERS OF THE 2009B BONDS WITH RESPECT TO (i) THE ACCURACY OF ANY RECORDS MAINTAINED BY DTC, ANY DIRECT PARTICIPANT OR ANY INDIRECT PARTICIPANT; (ii) THE PAYMENT BY DTC TO ANY DIRECT PARTICIPANT OR BY ANY DIRECT PARTICIPANT OR INDIRECT PARTICIPANT OF ANY AMOUNT DUE TO ANY BENEFICIAL OWNER IN RESPECT OF THE PRINCIPAL, PURCHASE PRICE OR REDEMPTION PRICE OF OR INTEREST ON THE 2009B BONDS; (iii) THE DELIVERY OR TIMELINESS OF ANY NOTICE BY DTC, ANY DIRECT PARTICIPANT OR ANY INDIRECT PARTICIPANT; (iv) THE SELECTION OF THE BENEFICIAL OWNERS TO RECEIVE PAYMENT IN THE EVENT OF ANY PARTIAL REDEMPTION OF THE 2009B BONDS, OR (v) ANY OTHER ACTION TAKEN BY DTC, ANY DIRECT PARTICIPANT OR ANY INDIRECT PARTICIPANT.
Security
The 2009B Bonds are general obligations of the City, payable from taxes and other general revenues of the City. The full faith, credit and taxing power of the City are irrevocably pledged for the prompt and full payment, when due, of the principal of and interest and premium, if any, on the 2009B Bonds and all other general obligation debt of the City. See “DEBT OF THE CITY” in Appendix A. The City is also empowered by statute to issue revenue bonds and, as of June 30, 2011, had outstanding $1,813,367,000 aggregate principal amount of Water and Wastewater Revenue Bonds, $1,228,335,000 aggregate principal amount of Gas Works Revenue Bonds, and $1,423,300,000 aggregate principal
-15-
amount of Airport Revenue Bonds. Such revenue bonds are secured by a pledge of the revenues of the City’s water and sewer system, revenues of the Philadelphia Gas Works and revenues of the City’s airport system, respectively, constituting a first lien on such revenues. The City also issued certain general obligation bonds to fund water and sewer and airport facilities which have been determined to be Self-Supporting. Subject to such priority in application of revenues as is required by law for such revenue bonds and to covenants made with respect to revenue bonds, and excluding grants in aid, trust funds and sinking funds designated for application to specific purposes, all revenues and funds of the City support its general obligation debt, including the 2009B Bonds. See Appendix A for information regarding the City and Appendix B for the City’s Comprehensive Annual Financial Report for the fiscal year ended June 30, 2010. The 2009B Bonds are also secured by the Letter of Credit. See “THE REIMBURSEMENT AGREEMENT AND THE LETTER OF CREDIT” herein.
Remedies of Bondholders
Should a Registered Owner fail to receive payment of principal and interest when due and payable, a suit may be brought by such Registered Owner against the City to seek a judgment for the unpaid amount.
No writ of execution may be issued on such judgment against the real or personal property of the City, but under the Act of April 15, 1834, P.L. 537, Section 6, a judgment creditor may cause the court to issue a writ commanding the City Treasurer to cause the judgment to be paid out of any unappropriated monies of the City, and if there be no such monies, out of the first monies that shall be received for the account of the General Fund of the City. This statute was repealed by the Act of April 28, 1978, P.L. 202, effective June 27, 1980 (the “Judiciary Act Repealer Act”), which provides that general rules of the Supreme Court of Pennsylvania were to be substituted for the practice and procedure set forth in the repealed statute. Since no rules have been issued in substitution of the repealed statute, the Judiciary Act Repealer Act provides that the repealed statute shall continue in full force and effect, as part of the common law of the Commonwealth, until general rules are promulgated. Furthermore, the 1951 Philadelphia Home Rule Charter (the “Home Rule Charter”) requires that, if any obligations of the City are not paid or provided for within the fiscal year in which such obligations are payable, the annual operating budget ordinance for the following fiscal year shall provide for discharging the resulting deficit.
The rights and remedies of bondholders could be limited by the provisions of Chapter 9 of the United States Bankruptcy Code, which permits, under prescribed circumstances, a public agency or instrumentality of a state to file a petition for relief, in the nature of an adjustment in the repayment of debts, in a bankruptcy court of the United States, other reorganization and insolvency proceedings, and general principles of equity, whether asserted in a proceeding at law or in equity.
The Pennsylvania Intergovernmental Cooperation Authority Act for Cities of the First Class, Act No. 1991 - 6, approved June 5, 1991 (the “PICA Act”), prohibits the City from filing a petition for relief under Chapter 9 of the United States Bankruptcy Code as long as the Pennsylvania Intergovernmental Cooperation Authority (“PICA”) has outstanding any bonds issued pursuant to the PICA Act. As of June 30, 2011, PICA had $494,710,000 aggregate principal amount of bonds outstanding. If no such bonds were outstanding, the PICA Act requires approval in writing by the Governor of the Commonwealth for a filing under Chapter 9 by the City. If the provisions of the PICA Act relating to the authorization by the Governor for the City to file a petition under Chapter 9 of the United States Bankruptcy Code were invoked, such provisions could limit the enforcement of bondholders’ rights and remedies. See “PENNSYLVANIA INTERGOVERNMENTAL COOPERATION AUTHORITY” in Appendix A hereto.
-16-
THE REIMBURSEMENT AGREEMENT AND THE LETTER OF CREDIT
General
The Bank has agreed to issue the Letter of Credit in favor of the Fiscal Agent on behalf of the owners of the 2009B Bonds and pursuant to the Reimbursement Agreement.
Under the Reimbursement Agreement, the City has agreed to pay to the Bank an amount equal to all amounts drawn under the Letter of Credit, together with interest on any such amounts from the date of the drawing to the day of repayment. The City has also agreed to pay certain fees and expenses of the Bank in connection with the issuance of the Letter of Credit.
Each of the Letter of Credit and the Reimbursement Agreement contains various provisions, covenants and conditions, certain of which are summarized below and each of which is qualified in its entirety by reference to the Letter of Credit and the Reimbursement Agreement. Various words or terms used in the following summary are defined elsewhere in this Remarketing Memorandum, the Letter of Credit or the Reimbursement Agreement, and reference is made thereto for a full understanding of their import. The full text of the Reimbursement Agreement and the Letter of Credit may be obtained from the Remarketing Agent.
The Letter of Credit
The Letter of Credit will be issued in an amount equal to $101,841,096 (the “Stated Amount”), of which up to $100,000,000 is available for the payment of the unpaid principal of the 2009B Bonds and up to $1,841,096 is available for the payment of unpaid interest accrued on the 2009B Bonds. The Letter of Credit will permit the Fiscal Agent to draw an amount sufficient to pay (i) the maturing principal of the 2009B Bonds and (ii) the interest coming due on the 2009B Bonds up to 56 days’ interest at a maximum rate of 12% per annum calculated on the basis of a 365-day year, all as described in and subject to certain limitations and other terms set forth in the Letter of Credit. The Letter of Credit is an irrevocable transferable direct pay obligation of the Bank to pay to the Fiscal Agent, upon timely demand and in accordance with the terms thereof, the Stated Amount of the Letter of Credit, as said Stated Amount may be reduced and reinstated as provided therein.
The Letter of Credit will be effective upon remarketing of the 2009B Bonds. The Letter of Credit will terminate on the earliest of (a) the payment by the Bank of the final Drawing available to be made under the Letter of Credit which is not subject to reinstatement, (b) August 4, 2014 (the “Stated Expiration Date”), (c) the Bank’s receipt of the Fiscal Agent’s certificate to the effect that the Letter of Credit is being replaced by an Alternate Credit Facility and/or an Alternate Liquidity Facility, and (d) the twelfth (12th) calendar day (or the next Business Day if such twelfth day is not a Business Day) after the date the Fiscal Agent provides notice of a mandatory tender following written notice from the Bank to the effect that an Event of Default under the Reimbursement Agreement has occurred and the Bank has requested that the 2009B Bonds be subject to a mandatory tender (any such date being referred to herein as the “Letter of Credit Termination Date”). Prior to the Letter of Credit Termination Date, the Bank may extend the Stated Expiration Date from time to time at the request of the City as provided in the Reimbursement Agreement.
The Letter of Credit may only be drawn on by the Fiscal Agent or by a transferee that has succeeded to the duties of the Fiscal Agent and to which the Letter of Credit has been properly transferred in accordance with its terms.
-17-
Events of Default Under the Reimbursement Agreement
The occurrence of any of the following events is an “Event of Default” under the Reimbursement Agreement:
(a) failure of the City to (i) repay a Credit Advance, in full, on the date of the related Drawing or (ii) make timely payments of principal and interest on the Bank Bonds, in the amounts and on the dates, when due;
(b) default in the payment of (i) any fee required to be paid when and as due as provided in the Reimbursement Agreement or in the Fee Letter or (ii) except as described in paragraph (a) under “Remedies” below, any other Obligation required to be paid or reimbursed to the Bank under the Reimbursement Agreement or the Fee Letter when and as due, and such default in payment shall continue for four (4) calendar days;
(c) any representation or warranty made by the City in (or incorporated by reference in) the Reimbursement Agreement or in any other Related Document or in any certificate, agreement, instrument or statement contemplated by or made or delivered pursuant to or in connection therewith, shall prove to have been false or misleading when made or when effective or when reaffirmed, as the case may be;
(d) any default or event of default (as defined respectively in the Related Documents) shall have occurred under any of the other Related Documents, other than any such default or event of default premised on any occurrence described in paragraph (i) below;
(e) default in the due observance or performance of certain covenants set forth in the Reimbursement Agreement;
(f) default in the due observance or performance of any term, covenant or agreement set forth in the Reimbursement Agreement or the Fee Letter (other than as described in paragraphs (a), (b) or (e) above and paragraph (i)(1) below) for a period of thirty (30) days after written notice, specifying such default and requesting that it be remedied, is given to the City by the Bank; provided, that if such default does not entail the payment of money and cannot reasonably be cured within thirty (30) days, it shall not constitute an Event of Default if the City commences to cure such default within said thirty (30) days and diligently pursues same to completion within ninety (90) days after such written notice;
(g) (i) the Reimbursement Agreement, the Fee Letter, the Ordinance, the Resolution or the 2009B Bonds or any provision thereof relating to the obligation of the City to make payments on the 2009B Bonds (including Bank Bonds), or any provision of any ordinance, resolution, indenture or other contract authorizing and securing any Parity Debt that if void, invalid or unenforceable would adversely affect the obligation of the City to make payments on the 2009B Bonds (including Bank Bonds), shall, at any time and for any reason, cease to be valid and binding on the City or shall be declared null and void or its validity or enforceability shall be contested by the City or any Governmental Authority having jurisdiction over the City, in a judicial proceeding or any official action, or (ii) any material provision of the Charter relating to the obligation of the City to make payments on the 2009B Bonds (including Bank Bonds) shall be declared null and void by any appellate court of the Commonwealth; or (iii) (A) the City or any Governmental Authority having jurisdiction over the City, as applicable, repudiates or otherwise denies, in writing, in a judicial or administrative proceeding that the City has any further liability or obligation under the Reimbursement Agreement or the Fee Letter or with respect to the 2009B Bonds, (B) the City or any Governmental Authority having jurisdiction over the City, as applicable, shall have taken or permitted to be taken any action, or the Commonwealth has duly
-18-
enacted any statute, which would materially adversely affect the enforceability of the 2009B Bonds or (C) the City or any Governmental Authority having jurisdiction over the City, as applicable, contests, in a judicial or administrative proceeding, the validity or enforceability of any material provision of the Reimbursement Agreement, the Fee Letter, the Ordinance, the Resolution or the 2009B Bonds or any provision thereof relating to the obligation of the City to make payments on the 2009B Bonds (including Bank Bonds), or any provision of any ordinance, resolution, indenture or other contract authorizing and securing any Parity Debt that adversely affects the obligation of the City to make payments on the 2009B Bonds (including Bank Bonds);
(h) the City or any Governmental Authority having jurisdiction over the City makes an assignment for the benefit of creditors, files a petition in bankruptcy, is unable generally to pay its debts as they come due, or is adjudicated insolvent or bankrupt or there is entered any order or decree granting relief in any involuntary case commenced against it under any applicable bankruptcy, insolvency or similar law now or hereafter in effect; or the City or any Governmental Authority having jurisdiction over the City petitions or applies to any tribunal for any receiver, trustee, liquidator, assignee, custodian, sequestrator or other similar official of it, or of any substantial part of its properties, or commences any proceeding in a court of law for a reorganization, readjustment of debt, dissolution, liquidation or other similar procedure under the law or statutes of any jurisdiction, whether now or hereafter in effect; or there is commenced against the City any such proceeding in a court of law which remains undismissed or shall not be discharged, vacated or stayed within sixty (60) days after commencement; or the City or any Governmental Authority having jurisdiction over the City by any act indicates its consent to, approval of or acquiescence in any such proceeding in a court of law, or to an order for relief in an involuntary case commenced against the City under any such law, or to the appointment of any receiver, trustee, liquidator, assignee, custodian, sequestrator or other similar official for the City or a substantial part of the City’s properties; or the City or any Governmental Authority having jurisdiction over the City suffers any such receivership, trusteeship, liquidation, assignment, custodianship, sequestration or other similar procedure to continue undischarged for a period of sixty (60) days after commencement; or the City or any Governmental Authority having jurisdiction over the City takes any action for the purposes of effecting any of the foregoing;
(i) (1) any default in the payment when due of the principal, premium, if any, or interest payable on any Parity Debt, or (2) any default under any provision of any ordinance, resolution, indenture or other contract authorizing and securing any Parity Debt which results in the acceleration of such Parity Debt or which enables (or, with the giving of notice or lapse of time, or both, would enable) the holder of such Parity Debt to accelerate the maturity thereof, in either case at a time earlier than that which is described in paragraph (a) under “Remedies” below;
(j) any amendment to the Constitution of the Commonwealth or any amendment to the Charter or any other statute is enacted which materially adversely affects the enforceability of the Reimbursement Agreement, the Fee Letter, the Ordinance, the Resolution or the 2009B Bonds against the City, or (ii) the City takes or permits to be taken any action which materially adversely affects the ability of the City to repay its Obligations under the Reimbursement Agreement or the Fee Letter or limits or restricts the sources to which the Bank may look for the payment of such Obligations;
(k) the entry of one or more judgments for the payment of money and not fully covered by insurance (including self-insurance to the extent evidenced by reserves in the form of liquid assets) which, individually or in the aggregate, equal or exceed $10,000,000, which judgment or judgments shall not have been appealed or shall remain unpaid, unstayed, undischarged, unbonded or undismissed for a period of ninety (90) days; or
-19-
(l) the long-term rating assigned by any one of the Rating Agencies to any unenhanced long-term Parity Debt of the City shall be (i) withdrawn or suspended for credit-related reasons or (ii) reduced below Investment Grade.
Remedies
Upon the occurrence and continuance of an Event of Default, and notice thereof to the City and the Fiscal Agent, the Bank may, in its sole discretion, but shall not be obligated to, exercise any or all of the following remedies:
(a) by written, electronic or telephonic notice (promptly confirmed in writing) give notice of such Event of Default (a “Mandatory Tender Notice”), whereupon the Fiscal Agent shall immediately declare all 2009B Bonds then outstanding subject to mandatory purchase in accordance with the Resolution. The City hereby agrees to pay or cause to be paid to the Bank a sum equal to the amount drawn against the Letter of Credit pursuant to a Mandatory Tender Notice in two (2) substantially equal installments, the first of said installments being payable on the first anniversary of the Mandatory Purchase Date and the second of said installments being payable on the second anniversary of the Mandatory Purchase Date. Interest shall accrue at the Default Rate on all such amounts not repaid to the Bank in full when due pursuant to the Reimbursement Agreement. Interest on such amounts shall be calculated on the basis of a 365-day year, counting the actual number of days elapsed, and shall be payable on the first Business Day of each month, commencing on the first such day to occur after the applicable due date, and on the date that the final installment of principal is paid as described in the immediately preceding sentence. The amounts payable pursuant to this paragraph (a) may be prepaid at any time at the option of the City and shall become immediately due and payable on the first to occur of (i) the date the 2009B Bonds purchased by the Bank have been remarketed, (ii) the date the 2009B Bonds are refinanced, redeemed, prepaid or canceled pursuant to the terms of the Ordinance and the Resolution and (iii) the Maturity Date. In no event shall the delivery of a Mandatory Tender Notice be deemed to extend the maturity date of any Term Loan;
(b) exercise all or any of its rights and remedies as it may otherwise have under Applicable Law, the Reimbursement Agreement and the Resolution or otherwise by such suits, actions, or special proceedings in equity or at law, or by proceedings in the office of any board or other jurisdiction, for specific performance of any covenant or agreement contained in the Resolution or the Reimbursement Agreement, in aid or execution of any power therein granted or for the enforcement of any proper legal or equitable remedy; and
(c) declare all amounts payable under the Reimbursement Agreement (other than principal of and interest on Liquidity Advances, Term Loans and the 2009B Bonds except as provided in paragraph (a) above) and under the Fee Letter to be, whereupon the same shall become, immediately due and payable without presentment, demand, protest or other notice of any kind, all of which are hereby waived by the City; provided that, in the case of any Event of Default specified in paragraph (h) above, all amounts payable under the Reimbursement Agreement (other than principal of and interest on Liquidity Advances, Term Loans and the 2009B Bonds except as provided in paragraph (a) above) and under the Fee Letter shall be immediately due and payable without the giving of any notice to the City or the taking of any other action by any Person.
Special Mandatory Redemption of Bank Bonds
Bank Bonds shall be subject to special mandatory redemption at the times, and in the principal amounts, and on such other terms as set forth in the Reimbursement Agreement.
-20-
THE BANK
See Appendix E for a statement of certain information concerning the Bank.
REMARKETING AGENT
Special Considerations Relating to the 2009B Bonds
The Remarketing Agent is Paid By the City. The Remarketing Agent's responsibilities include determining the interest rate from time to time and remarketing the 2009B Bonds that are optionally or mandatorily tendered by the owners thereof (subject, in each case, to the terms of the Remarketing Agreement), all as further described in this Remarketing Memorandum. The Remarketing Agent is appointed by the City and is paid by the City for its services. As a result, the interests of the Remarketing Agent may differ from those of existing Holders and potential purchasers of the 2009B Bonds.
The Remarketing Agent Routinely Purchases 2009B Bonds for its Own Account. The Remarketing Agent acts as remarketing agent for a variety of variable rate demand obligations and, in its sole discretion, routinely purchases such obligations for its own account. The Remarketing Agent is permitted, but not obligated, to purchase tendered 2009B Bonds for its own account and, in its sole discretion, may routinely acquire such tendered 2009B Bonds in order to achieve a successful remarketing of the 2009B Bonds (i.e., because there otherwise are not enough buyers to purchase the 2009B Bonds) or for other reasons. However, the Remarketing Agent is not obligated to purchase 2009B Bonds, and may cease doing so at any time without notice. The Remarketing Agent may also make a market in the 2009B Bonds by routinely purchasing and selling 2009B Bonds other than in connection with an optional or mandatory tender and remarketing. Such purchases and sales may be at or below par. However, the Remarketing Agent is not required to make a market in the 2009B Bonds. The Remarketing Agent may also sell any 2009B Bonds it has purchased to one or more affiliated investment vehicles for collective ownership or enter into derivative arrangements with affiliates or others in order to reduce its exposure to the 2009B Bonds. The purchase of 2009B Bonds by the Remarketing Agent may create the appearance that there is greater third party demand for the 2009B Bonds in the market than is actually the case. The practices described above also may result in fewer 2009B Bonds being tendered in a remarketing.
2009B Bonds May be Offered at Different Prices on Any Date Including an Interest Rate Determination Date. Pursuant to the Remarketing Agreement, the Remarketing Agent is required to determine the applicable rate of interest that, in its judgment, is the lowest rate that would permit the sale of the 2009B Bonds bearing interest at the applicable interest rate at par plus accrued interest, if any, on and as of the applicable interest rate determination date. The interest rate will reflect, among other factors, the level of market demand for the 2009B Bonds (including whether the Remarketing Agent is willing to purchase 2009B Bonds for its own account). There may or may not be 2009B Bonds tendered and remarketed on an interest rate determination date, the Remarketing Agent may or may not be able to remarket any 2009B Bonds tendered for purchase on such date at par and the Remarketing Agent may sell 2009B Bonds at varying prices to different investors on such date or any other date. The Remarketing Agent is not obligated to advise purchasers in a remarketing if it does not have third party buyers for all of the 2009B Bonds at the remarketing price. In the event a Remarketing Agent owns any 2009B Bonds for its own account, it may, in its sole discretion in a secondary market transaction outside the tender process, offer such 2009B Bonds on any date, including the interest rate determination date, at a discount to par to some investors.

-21-
The Ability to Sell the 2009B Bonds Other Than Through the Tender Process May Be Limited. The Remarketing Agent may buy and sell 2009B Bonds other than through the tender process. However, it is not obligated to do so and may cease doing so at any time without notice and may require Holders that wish to tender their 2009B Bonds to do so through the Tender Agent with appropriate notice. Thus, investors who purchase the 2009B Bonds, whether in a remarketing or otherwise, should not assume that they will be able to sell their 2009B Bonds other than by tendering the 2009B Bonds in accordance with the tender process.
[REMAINDER OF PAGE INTENTIONALLY LEFT BLANK]
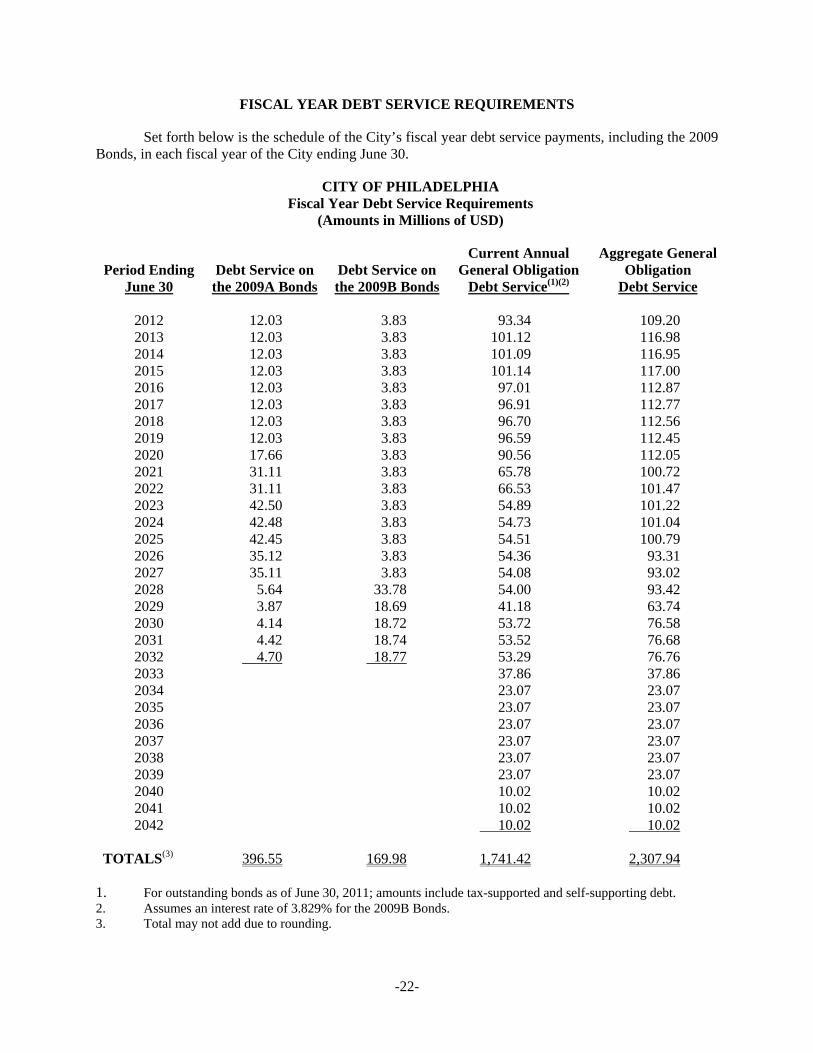
-22-
FISCAL YEAR DEBT SERVICE REQUIREMENTS
Set forth below is the schedule of the City’s fiscal year debt service payments, including the 2009 Bonds, in each fiscal year of the City ending June 30.
CITY OF PHILADELPHIA Fiscal Year Debt Service Requirements
(Amounts in Millions of USD)
Period Ending
June 30
Debt Service on
the 2009A Bonds
Debt Service on the 2009B Bonds
Current Annual General Obligation
Debt Service(1)(2)
Aggregate General Obligation
Debt Service
2012 12.03 3.83 93.34 109.20 2013 12.03 3.83 101.12 116.98 2014 12.03 3.83 101.09 116.95 2015 12.03 3.83 101.14 117.00 2016 12.03 3.83 97.01 112.87 2017 12.03 3.83 96.91 112.77 2018 12.03 3.83 96.70 112.56 2019 12.03 3.83 96.59 112.45 2020 17.66 3.83 90.56 112.05 2021 31.11 3.83 65.78 100.72 2022 31.11 3.83 66.53 101.47 2023 42.50 3.83 54.89 101.22 2024 42.48 3.83 54.73 101.04 2025 42.45 3.83 54.51 100.79 2026 35.12 3.83 54.36 93.31 2027 35.11 3.83 54.08 93.02 2028 5.64 33.78 54.00 93.42 2029 3.87 18.69 41.18 63.74 2030 4.14 18.72 53.72 76.58 2031 4.42 18.74 53.52 76.68 2032 4.70 18.77 53.29 76.76 2033 37.86 37.86 2034 23.07 23.07 2035 23.07 23.07 2036 23.07 23.07 2037 23.07 23.07 2038 23.07 23.07 2039 23.07 23.07 2040 10.02 10.02 2041 10.02 10.02 2042 10.02 10.02
TOTALS(3) 396.55 169.98 1,741.42 2,307.94
1. For outstanding bonds as of June 30, 2011; amounts include tax-supported and self-supporting debt. 2. Assumes an interest rate of 3.829% for the 2009B Bonds. 3. Total may not add due to rounding.
-23-
LEGALITY FOR INVESTMENT
Under the Pennsylvania Probate, Estates and Fiduciaries Code, the 2009B Bonds are authorized investments for fiduciaries, as defined in that code, within the Commonwealth. The 2009B Bonds are legal investments for Pennsylvania savings banks, banks, trust companies and insurance companies and are acceptable as security for deposits of funds of the Commonwealth.
RATINGS
Moody’s Investors Service (“Moody’s”) and Standard & Poor's Ratings Services, a Standard & Poor's Financial Services LLC business (“Standard & Poor’s”), are expected to assign the 2009B Bonds ratings of “Aa1/VMIG 1” and “AAA / A-1+”, respectively, upon the replacement of the current letter of credit for the 2009B Bonds with the Letter of Credit. The Moody’s and Standard & Poor’s long term ratings are based upon (i) the long term ratings of the Bank, (ii) the long term ratings of the City and (iii) Moody’s and Standard & Poor’s credit correlation of the ratings of the Bank and the City. The Bank’s long term ratings from Moody’s and Standard & Poor’s are “Aa1” and “AA-”, respectively. The City’s underlying ratings on the 2009B Bonds from Moody’s and Standard & Poor’s are “A2” and “BBB”, respectively.
An explanation of the significance of such credit ratings may be obtained from the applicable credit rating agency.
A rating is not a recommendation to buy, sell or hold securities. There is no assurance that any such credit rating will continue for any given period of time or that it will not be revised or withdrawn entirely by such credit rating agency if, in its judgment, circumstances so warrant. Neither the City nor the Remarketing Agent has undertaken any responsibility to assure the maintenance of any rating. The City has agreed, in the Continuing Disclosure Agreement, to report actual rating changes on the 2009B Bonds. See “CONTINUING DISCLOSURE” herein and Appendix D. Any such downward change in or withdrawal of such credit rating may have an adverse effect on the marketability or market price of the 2009B Bonds.
TAX MATTERS
Opinion of 2009 Co-Bond Counsel
On August 13, 2009, Cozen O'Connor and TME Law, 2009 Co-Bond Counsel, each delivered its approving opinion in connection with the original issuance of the 2009B Bonds (the “Original Bond Counsel Opinion”). A copy of the Original Bond Counsel Opinion is included as Appendix C-1 hereto but such inclusion is not to be considered as a reissuance or update of such opinion which speaks only as of the date thereof.
The following is taken from the “Tax Matters” section of the Official Statement dated July 29, 2009, prepared in connection with the original issuance of the 2009B Bonds which describes and summarizes certain tax matters and certain portions of the Original Bond Counsel Opinion but such inclusion herein is not to be considered as an update of such disclosure which speaks only as of the date of issuance of the 2009B Bonds.
Federal Tax Exemption
The Internal Revenue Code of 1986, as amended (the “Code”) contains provisions relating to the tax-exempt status of interest on obligations issued by governmental entities which
-24-
apply to the 2009 Bonds. These provisions include, but are not limited to, requirements relating to the use and investment of the proceeds of the 2009 Bonds and the rebate of certain investment earnings derived from such proceeds to the United States Treasury Department on a periodic basis. These and other requirements of the Code must be met by the City subsequent to the issuance and delivery of the 2009B Bonds in order for interest thereon to be and remain excludable from gross income for purposes of federal income taxation. The City has covenanted to comply with such requirements.
In the opinion of Co-Bond Counsel, interest on the 2009B Bonds will be excluded from gross income for purposes of federal income taxation under existing statutes, regulations, rulings and court decisions. The opinion of Co-Bond Counsel is subject to the condition that the City complies with all applicable federal income tax law requirements that must be satisfied subsequent to the issuance of the 2009B Bonds in order that interest thereon continues to be excluded from gross income. The City has covenanted to comply with all such requirements. Failure to comply with certain of such requirements could cause the interest on the 2009B Bonds to be includable in gross income retroactive to the date of issuance of the 2009B Bonds. Interest on the 2009B Bonds is not treated as an item of tax preference under Section 57 of the Code for purposes of the individual and corporate alternative minimum taxes and is not included in adjusted current earnings under Section 56(g) of the Code when calculating corporate alternative minimum taxable income.
In addition to the matters addressed above, prospective purchasers of the 2009B Bonds should be aware that ownership of the 2009B Bonds may result in collateral tax consequences to certain taxpayers, including, but not limited to, foreign corporations, certain S corporations, recipients of social security and railroad retirement benefits, financial institutions and property or casualty insurance companies. Co-Bond Counsel expresses no opinion regarding any other federal tax consequences relating to the 2009B Bonds or the receipt of interest thereon.
State Tax Exemption
The Original Bond Counsel Opinion stated that, under the existing laws of the Commonwealth, the interest on the 2009B Bonds is free from Pennsylvania personal income taxation and Pennsylvania corporate net income taxation, but such exemption does not extend to gift, estate, succession or inheritance taxes or any other taxes not levied or assessed directly on the 2009B Bonds or the interest thereon. Profits, gains or income derived from the sale, exchange or other disposition of the 2009B Bonds are subject to state and local taxation within the Commonwealth.
Opinion of 2011 Co-Bond Counsel
In connection with the letter of credit substitution with respect to the 2009B Bonds, Cozen O'Connor and The Law Offices of Ann C. Lebowitz, 2011 Co-Bond Counsel, will each deliver its opinion that the substitution of the Letter of Credit for the current letter of credit will not, in and of itself, adversely affect the exclusion from gross income for Federal income tax purposes of the interest on the 2009B Bonds under the Code. The proposed form of opinion to be delivered by 2011 Co-Bond Counsel upon the letter of credit substitution with respect to the 2009B Bonds is attached hereto as Appendix C-2.
This summary is based on laws, regulations, rulings and decisions now in effect, all of which may change. Any change could apply retroactively and could affect the continued validity of this summary. Prospective purchasers should consult their tax advisors about the consequences of purchasing or holding the 2009B Bonds.

-25-
CERTAIN LEGAL MATTERS
Certain legal matters were passed upon in connection with the initial issuance of the 2009B Bonds by Cozen O’Connor and TME Law, Co-Bond Counsel, both of Philadelphia, Pennsylvania. Certain legal matters will be passed upon by Cozen O'Connor and The Law Offices of Ann C. Lebowitz, 2011 Co-Bond Counsel, both of Philadelphia, Pennsylvania. Certain legal matters will be passed upon for the City by the Office of the City Solicitor and for the Bank by Nixon Peabody LLP, New York, New York.
The various legal opinions delivered concurrently with the delivery of the 2009B Bonds and to be delivered in connection with the substitution of the letter of credit for the 2009B Bonds by the Letter of Credit express the professional judgment of the attorneys rendering the opinions as to the legal issues explicitly addressed therein. In rendering a legal opinion, the attorney does not become an insurer or guarantor of that expression of professional judgment, of the transaction opined upon, or of the future performance of parties to the transaction. Nor does the rendering of an opinion guarantee the outcome of any legal dispute that may arise out of the transaction.
NO LITIGATION
There is no litigation or other legal proceeding pending in any court or, to the best of the City’s knowledge, threatened in writing, challenging the validity of the proceedings of the City with respect to the authorization, issuance, sale and provision for payment of the 2009B Bonds or in any way contesting the validity or enforceability of the 2009B Bonds.
CONTINUING DISCLOSURE
In connection with the remarketing of the 2009B Bonds, the City will enter into a new Continuing Disclosure Agreement in compliance with the requirement of Rule 15c2-12 promulgated by the Securities and Exchange Commission under the Securities Exchange Act of 1934, as amended, with Digital Assurance Certification, L.L.C., as dissemination agent for the benefit of the Registered Owners (as defined in such agreement) from time to time of the 2009B Bonds, dated the date of original delivery and payment for the Bonds, the form of which is annexed hereto as Appendix D. The City is currently in compliance with all of its existing continuing disclosure obligations.
CERTAIN RELATIONSHIPS
Royal Bank of Canada, the provider of the Letter of Credit, is the parent company of RBC Capital Markets, LLC, the Remarketing Agent.
MISCELLANEOUS
This Remarketing Memorandum is not to be construed as a contract or agreement between the City and the purchasers or owners of any of the 2009B Bonds. Any statements made in this Remarketing Memorandum involving matters of opinion, whether or not expressly so stated, are intended merely as opinions and not as representations of fact. No representation is made that any of the opinions or estimates will be realized. The information and expressions of opinion herein are subject to change without notice, and neither the delivery of this Remarketing Memorandum nor any sale made hereunder shall, under any circumstances, create any implication that there is no change in the affairs of the City since the date hereof.
The attached Appendices are integral parts of this Remarketing Memorandum and should be read in their entirety together with the foregoing statements.
The City makes no representations or warranties to investors as to the accuracy or timeliness of any other information available on its website, nor any hyperlinks referenced therein.
The City has authorized the execution and distribution of this Remarketing Memorandum. This Remarketing Memorandum has been duly executed and delivered by the following officers, constituting a majority of the Bond Committee, on behalf of the City of Philadelphia.
CITY OF PHILADELPHIA By: /s/ Michael A. Nutter Name: Michael A. Nutter Title: Mayor By: /s/ Alan L. Butkovitz Name: Alan L. Butkovitz Title: City Controller By: /s/ Shelley R. Smith Name: Shelley R. Smith Title: City Solicitor
Approved:
By: /s/ Rob Dubow Name: Rob Dubow Title: Director of Finance

APPENDIX A
Information Regarding the City of Philadelphia

[ THIS PAGE INTENTIONALLY LEFT BLANK ]
TABLE OF CONTENTS
THE GOVERNMENT OF THE CITY OF PHILADELPHIA ....................................................................... 1 General ...................................................................................................................................................... 1 Government Services ................................................................................................................................ 1 Local Government Agencies .................................................................................................................... 2 School District .......................................................................................................................................... 3
SUMMARY FINANCIAL INFORMATION ................................................................................................. 4 DISCUSSION OF FINANCIAL OPERATIONS ........................................................................................... 6
Impact of Economic Downturn................................................................................................................. 6 Fiscal Year 2012 Proposed Budget ........................................................................................................... 6 Fiscal Year 2011 Budget .......................................................................................................................... 7 Fiscal Year 2011 Current Estimate ........................................................................................................... 7 Fiscal Year 2010 Budget .......................................................................................................................... 7 Fiscal Year 2010 Results .......................................................................................................................... 7
CITY FINANCIAL PROCEDURES .............................................................................................................. 8 Independent Audit and Opinion of the City Controller ............................................................................ 8 Pennsylvania Intergovernmental Cooperation Authority ......................................................................... 8 Principal Operations ................................................................................................................................. 8 Fund Accounting ...................................................................................................................................... 8 Basis of Accounting and Measurement Focus .......................................................................................... 9 Legal Compliance ................................................................................................................................... 10 Budget Procedure .................................................................................................................................... 11 Awards .................................................................................................................................................... 11
REVENUES OF THE CITY ......................................................................................................................... 12 General .................................................................................................................................................... 12 Major Revenue Sources .......................................................................................................................... 12 Revenues from City-Owned Systems ..................................................................................................... 18 Philadelphia Parking Authority .............................................................................................................. 19 Assessment and Collection of Real and Personal Property Taxes .......................................................... 19
EXPENDITURES OF THE CITY ................................................................................................................ 22 Personal Services (Personnel) ................................................................................................................. 22 Labor Agreements .................................................................................................................................. 23 Employee Benefits .................................................................................................................................. 24 Municipal Pension Fund (Related to All Funds) .................................................................................... 25 Other Post-Employment Benefits ........................................................................................................... 26 Purchase of Services ............................................................................................................................... 27 City Payments to School District ............................................................................................................ 27 Annual Payments to PGW ...................................................................................................................... 28 Fiscal Year 2011 PGW Payment to City ................................................................................................ 28 City Payments to SEPTA ........................................................................................................................ 28
CITY CASH MANAGEMENT AND INVESTMENT POLICIES ............................................................. 28 Consolidated Cash .................................................................................................................................. 28 Investment Practices ............................................................................................................................... 29 General Fund Cash Flow ........................................................................................................................ 30
DEBT OF THE CITY ................................................................................................................................... 30 Short-Term Debt ..................................................................................................................................... 31 Long-Term Debt ..................................................................................................................................... 31 Other Long-Term Debt Related Obligations .......................................................................................... 33
Swap Information ................................................................................................................................... 34 Letter of Credit and Liquidity Agreements ............................................................................................. 35 Recent and Upcoming Financings .......................................................................................................... 35
CITY CAPITAL IMPROVEMENT PROGRAM ......................................................................................... 36 LITIGATION ................................................................................................................................................ 37 ELECTED AND APPOINTED OFFICIALS ............................................................................................... 39 PENNSYLVANIA INTERGOVERNMENTAL COOPERATION AUTHORITY ..................................... 42
General .................................................................................................................................................... 42 Five-Year Plans of the City .................................................................................................................... 43 Quarterly Reporting to PICA .................................................................................................................. 43 PICA Bonds ............................................................................................................................................ 44
ADDITIONAL INFORMATION ................................................................................................................. 46 Current City Practices ............................................................................................................................. 46
CITY SOCIOECONOMIC INFORMATION .............................................................................................. 47 Introduction............................................................................................................................................. 47 Quality of Life ........................................................................................................................................ 47 Hospitals and Medical Centers ............................................................................................................... 47 Demographics ......................................................................................................................................... 49 The Economy .......................................................................................................................................... 51 Employment ............................................................................................................................................ 53 Income .................................................................................................................................................... 57 Retail Sales ............................................................................................................................................. 58 Transportation ......................................................................................................................................... 58 Water and Wastewater Systems .............................................................................................................. 59 Municipal Solid Waste Disposal............................................................................................................. 59 Housing ................................................................................................................................................... 60 Promoting Economic Development ........................................................................................................ 60 Mission ................................................................................................................................................... 60 Background ............................................................................................................................................. 60 Strategic Location ................................................................................................................................... 61 Affordability ........................................................................................................................................... 61 Arts, Culture, Recreation, and Sports ..................................................................................................... 61 Educational Attainment .......................................................................................................................... 62 Real Estate Market .................................................................................................................................. 62 Major Industry Sectors ........................................................................................................................... 62 Knowledge Industry: Poised for Growth ................................................................................................ 63 Philadelphia International Airport .......................................................................................................... 64 Philadelphia Industrial Development Corporation ................................................................................. 65 Financing Programs ................................................................................................................................ 65 Real Estate Services ................................................................................................................................ 66 The Navy Yard ....................................................................................................................................... 66 Additional Projects under Construction .................................................................................................. 69
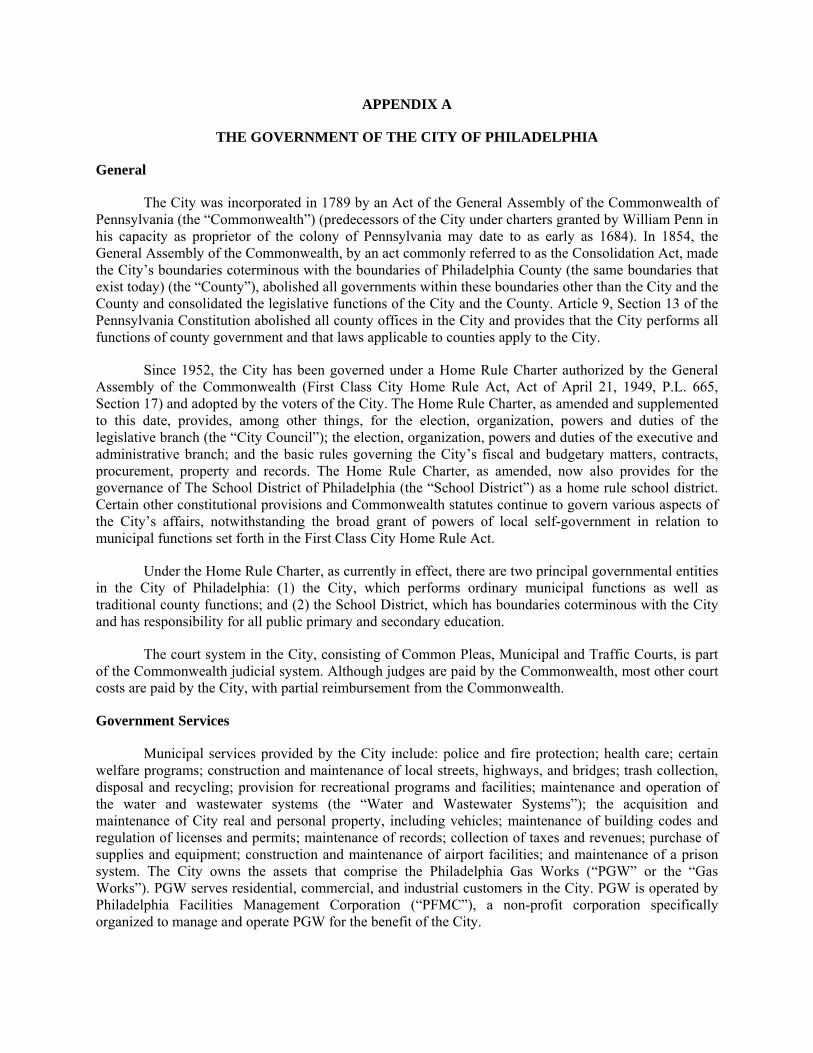
APPENDIX A
THE GOVERNMENT OF THE CITY OF PHILADELPHIA
General
The City was incorporated in 1789 by an Act of the General Assembly of the Commonwealth of Pennsylvania (the “Commonwealth”) (predecessors of the City under charters granted by William Penn in his capacity as proprietor of the colony of Pennsylvania may date to as early as 1684). In 1854, the General Assembly of the Commonwealth, by an act commonly referred to as the Consolidation Act, made the City’s boundaries coterminous with the boundaries of Philadelphia County (the same boundaries that exist today) (the “County”), abolished all governments within these boundaries other than the City and the County and consolidated the legislative functions of the City and the County. Article 9, Section 13 of the Pennsylvania Constitution abolished all county offices in the City and provides that the City performs all functions of county government and that laws applicable to counties apply to the City.
Since 1952, the City has been governed under a Home Rule Charter authorized by the General Assembly of the Commonwealth (First Class City Home Rule Act, Act of April 21, 1949, P.L. 665, Section 17) and adopted by the voters of the City. The Home Rule Charter, as amended and supplemented to this date, provides, among other things, for the election, organization, powers and duties of the legislative branch (the “City Council”); the election, organization, powers and duties of the executive and administrative branch; and the basic rules governing the City’s fiscal and budgetary matters, contracts, procurement, property and records. The Home Rule Charter, as amended, now also provides for the governance of The School District of Philadelphia (the “School District”) as a home rule school district. Certain other constitutional provisions and Commonwealth statutes continue to govern various aspects of the City’s affairs, notwithstanding the broad grant of powers of local self-government in relation to municipal functions set forth in the First Class City Home Rule Act.
Under the Home Rule Charter, as currently in effect, there are two principal governmental entities in the City of Philadelphia: (1) the City, which performs ordinary municipal functions as well as traditional county functions; and (2) the School District, which has boundaries coterminous with the City and has responsibility for all public primary and secondary education.
The court system in the City, consisting of Common Pleas, Municipal and Traffic Courts, is part of the Commonwealth judicial system. Although judges are paid by the Commonwealth, most other court costs are paid by the City, with partial reimbursement from the Commonwealth.
Government Services
Municipal services provided by the City include: police and fire protection; health care; certain welfare programs; construction and maintenance of local streets, highways, and bridges; trash collection, disposal and recycling; provision for recreational programs and facilities; maintenance and operation of the water and wastewater systems (the “Water and Wastewater Systems”); the acquisition and maintenance of City real and personal property, including vehicles; maintenance of building codes and regulation of licenses and permits; maintenance of records; collection of taxes and revenues; purchase of supplies and equipment; construction and maintenance of airport facilities; and maintenance of a prison system. The City owns the assets that comprise the Philadelphia Gas Works (“PGW” or the “Gas Works”). PGW serves residential, commercial, and industrial customers in the City. PGW is operated by Philadelphia Facilities Management Corporation (“PFMC”), a non-profit corporation specifically organized to manage and operate PGW for the benefit of the City.
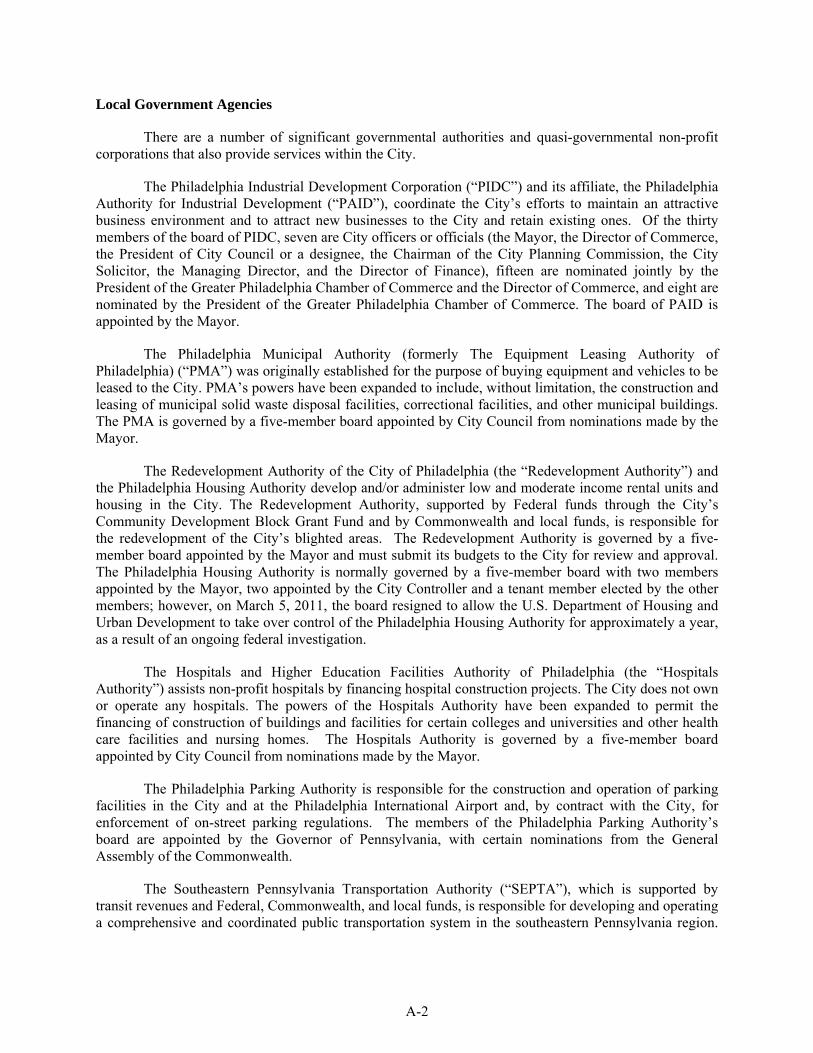
A-2
Local Government Agencies
There are a number of significant governmental authorities and quasi-governmental non-profit corporations that also provide services within the City.
The Philadelphia Industrial Development Corporation (“PIDC”) and its affiliate, the Philadelphia Authority for Industrial Development (“PAID”), coordinate the City’s efforts to maintain an attractive business environment and to attract new businesses to the City and retain existing ones. Of the thirty members of the board of PIDC, seven are City officers or officials (the Mayor, the Director of Commerce, the President of City Council or a designee, the Chairman of the City Planning Commission, the City Solicitor, the Managing Director, and the Director of Finance), fifteen are nominated jointly by the President of the Greater Philadelphia Chamber of Commerce and the Director of Commerce, and eight are nominated by the President of the Greater Philadelphia Chamber of Commerce. The board of PAID is appointed by the Mayor.
The Philadelphia Municipal Authority (formerly The Equipment Leasing Authority of Philadelphia) (“PMA”) was originally established for the purpose of buying equipment and vehicles to be leased to the City. PMA’s powers have been expanded to include, without limitation, the construction and leasing of municipal solid waste disposal facilities, correctional facilities, and other municipal buildings. The PMA is governed by a five-member board appointed by City Council from nominations made by the Mayor.
The Redevelopment Authority of the City of Philadelphia (the “Redevelopment Authority”) and the Philadelphia Housing Authority develop and/or administer low and moderate income rental units and housing in the City. The Redevelopment Authority, supported by Federal funds through the City’s Community Development Block Grant Fund and by Commonwealth and local funds, is responsible for the redevelopment of the City’s blighted areas. The Redevelopment Authority is governed by a five-member board appointed by the Mayor and must submit its budgets to the City for review and approval. The Philadelphia Housing Authority is normally governed by a five-member board with two members appointed by the Mayor, two appointed by the City Controller and a tenant member elected by the other members; however, on March 5, 2011, the board resigned to allow the U.S. Department of Housing and Urban Development to take over control of the Philadelphia Housing Authority for approximately a year, as a result of an ongoing federal investigation.
The Hospitals and Higher Education Facilities Authority of Philadelphia (the “Hospitals Authority”) assists non-profit hospitals by financing hospital construction projects. The City does not own or operate any hospitals. The powers of the Hospitals Authority have been expanded to permit the financing of construction of buildings and facilities for certain colleges and universities and other health care facilities and nursing homes. The Hospitals Authority is governed by a five-member board appointed by City Council from nominations made by the Mayor.
The Philadelphia Parking Authority is responsible for the construction and operation of parking facilities in the City and at the Philadelphia International Airport and, by contract with the City, for enforcement of on-street parking regulations. The members of the Philadelphia Parking Authority’s board are appointed by the Governor of Pennsylvania, with certain nominations from the General Assembly of the Commonwealth.
The Southeastern Pennsylvania Transportation Authority (“SEPTA”), which is supported by transit revenues and Federal, Commonwealth, and local funds, is responsible for developing and operating a comprehensive and coordinated public transportation system in the southeastern Pennsylvania region.
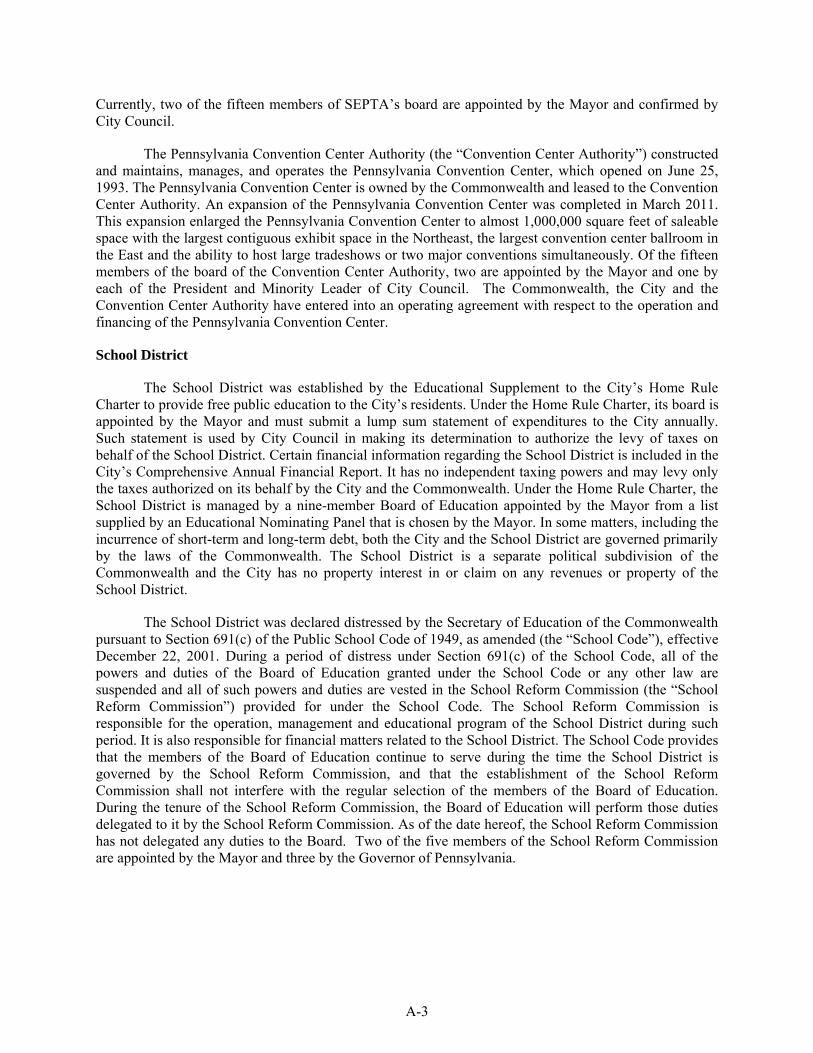
A-3
Currently, two of the fifteen members of SEPTA’s board are appointed by the Mayor and confirmed by City Council.
The Pennsylvania Convention Center Authority (the “Convention Center Authority”) constructed and maintains, manages, and operates the Pennsylvania Convention Center, which opened on June 25, 1993. The Pennsylvania Convention Center is owned by the Commonwealth and leased to the Convention Center Authority. An expansion of the Pennsylvania Convention Center was completed in March 2011. This expansion enlarged the Pennsylvania Convention Center to almost 1,000,000 square feet of saleable space with the largest contiguous exhibit space in the Northeast, the largest convention center ballroom in the East and the ability to host large tradeshows or two major conventions simultaneously. Of the fifteen members of the board of the Convention Center Authority, two are appointed by the Mayor and one by each of the President and Minority Leader of City Council. The Commonwealth, the City and the Convention Center Authority have entered into an operating agreement with respect to the operation and financing of the Pennsylvania Convention Center.
School District
The School District was established by the Educational Supplement to the City’s Home Rule Charter to provide free public education to the City’s residents. Under the Home Rule Charter, its board is appointed by the Mayor and must submit a lump sum statement of expenditures to the City annually. Such statement is used by City Council in making its determination to authorize the levy of taxes on behalf of the School District. Certain financial information regarding the School District is included in the City’s Comprehensive Annual Financial Report. It has no independent taxing powers and may levy only the taxes authorized on its behalf by the City and the Commonwealth. Under the Home Rule Charter, the School District is managed by a nine-member Board of Education appointed by the Mayor from a list supplied by an Educational Nominating Panel that is chosen by the Mayor. In some matters, including the incurrence of short-term and long-term debt, both the City and the School District are governed primarily by the laws of the Commonwealth. The School District is a separate political subdivision of the Commonwealth and the City has no property interest in or claim on any revenues or property of the School District.
The School District was declared distressed by the Secretary of Education of the Commonwealth pursuant to Section 691(c) of the Public School Code of 1949, as amended (the “School Code”), effective December 22, 2001. During a period of distress under Section 691(c) of the School Code, all of the powers and duties of the Board of Education granted under the School Code or any other law are suspended and all of such powers and duties are vested in the School Reform Commission (the “School Reform Commission”) provided for under the School Code. The School Reform Commission is responsible for the operation, management and educational program of the School District during such period. It is also responsible for financial matters related to the School District. The School Code provides that the members of the Board of Education continue to serve during the time the School District is governed by the School Reform Commission, and that the establishment of the School Reform Commission shall not interfere with the regular selection of the members of the Board of Education. During the tenure of the School Reform Commission, the Board of Education will perform those duties delegated to it by the School Reform Commission. As of the date hereof, the School Reform Commission has not delegated any duties to the Board. Two of the five members of the School Reform Commission are appointed by the Mayor and three by the Governor of Pennsylvania.
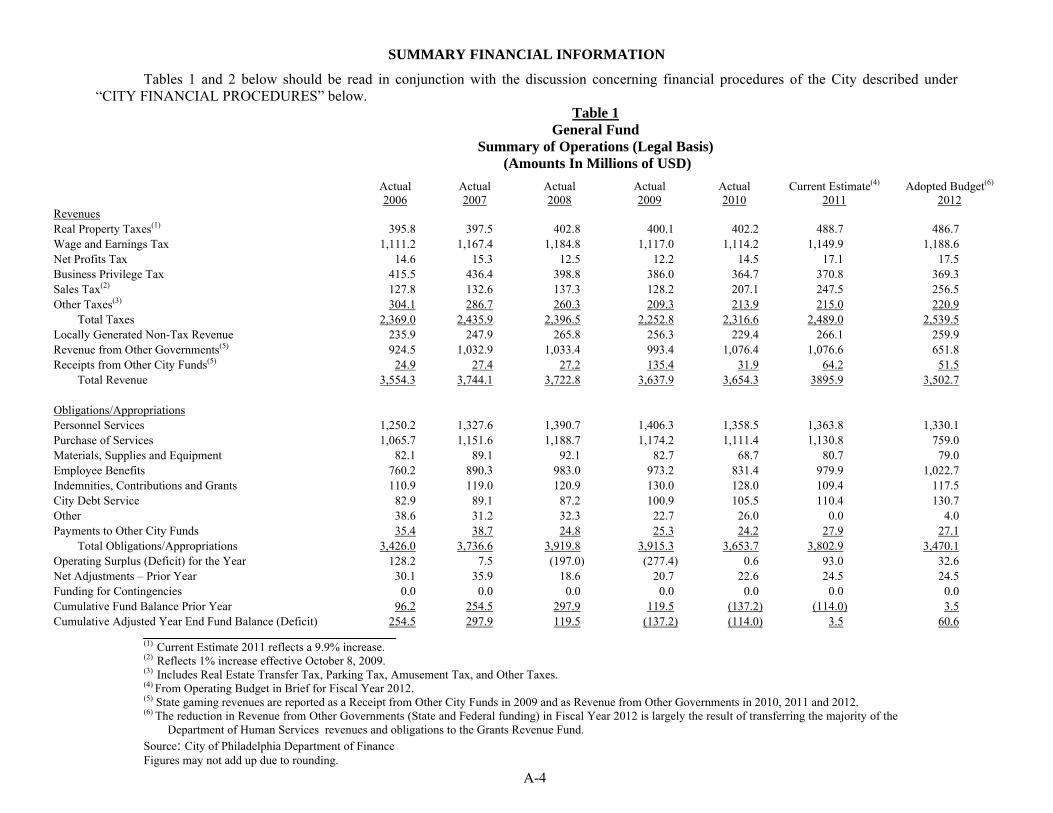
A-4
SUMMARY FINANCIAL INFORMATION
Tables 1 and 2 below should be read in conjunction with the discussion concerning financial procedures of the City described under “CITY FINANCIAL PROCEDURES” below.
Table 1 General Fund
Summary of Operations (Legal Basis) (Amounts In Millions of USD)
Actual Actual Actual Actual Actual Current Estimate(4) Adopted Budget(6) 2006 2007 2008 2009 2010 2011 2012 Revenues Real Property Taxes(1) 395.8 397.5 402.8 400.1 402.2 488.7 486.7 Wage and Earnings Tax 1,111.2 1,167.4 1,184.8 1,117.0 1,114.2 1,149.9 1,188.6 Net Profits Tax 14.6 15.3 12.5 12.2 14.5 17.1 17.5 Business Privilege Tax 415.5 436.4 398.8 386.0 364.7 370.8 369.3 Sales Tax(2) 127.8 132.6 137.3 128.2 207.1 247.5 256.5 Other Taxes(3) 304.1 286.7 260.3 209.3 213.9 215.0 220.9 Total Taxes 2,369.0 2,435.9 2,396.5 2,252.8 2,316.6 2,489.0 2,539.5 Locally Generated Non-Tax Revenue 235.9 247.9 265.8 256.3 229.4 266.1 259.9 Revenue from Other Governments(5) 924.5 1,032.9 1,033.4 993.4 1,076.4 1,076.6 651.8 Receipts from Other City Funds(5) 24.9 27.4 27.2 135.4 31.9 64.2 51.5 Total Revenue 3,554.3 3,744.1 3,722.8 3,637.9 3,654.3 3895.9 3,502.7 Obligations/Appropriations Personnel Services 1,250.2 1,327.6 1,390.7 1,406.3 1,358.5 1,363.8 1,330.1 Purchase of Services 1,065.7 1,151.6 1,188.7 1,174.2 1,111.4 1,130.8 759.0 Materials, Supplies and Equipment 82.1 89.1 92.1 82.7 68.7 80.7 79.0 Employee Benefits 760.2 890.3 983.0 973.2 831.4 979.9 1,022.7 Indemnities, Contributions and Grants 110.9 119.0 120.9 130.0 128.0 109.4 117.5 City Debt Service 82.9 89.1 87.2 100.9 105.5 110.4 130.7 Other 38.6 31.2 32.3 22.7 26.0 0.0 4.0 Payments to Other City Funds 35.4 38.7 24.8 25.3 24.2 27.9 27.1 Total Obligations/Appropriations 3,426.0 3,736.6 3,919.8 3,915.3 3,653.7 3,802.9 3,470.1 Operating Surplus (Deficit) for the Year 128.2 7.5 (197.0) (277.4) 0.6 93.0 32.6 Net Adjustments – Prior Year 30.1 35.9 18.6 20.7 22.6 24.5 24.5 Funding for Contingencies 0.0 0.0 0.0 0.0 0.0 0.0 0.0 Cumulative Fund Balance Prior Year 96.2 254.5 297.9 119.5 (137.2) (114.0) 3.5 Cumulative Adjusted Year End Fund Balance (Deficit) 254.5 297.9 119.5 (137.2) (114.0) 3.5 60.6
(1) Current Estimate 2011 reflects a 9.9% increase. (2) Reflects 1% increase effective October 8, 2009. (3) Includes Real Estate Transfer Tax, Parking Tax, Amusement Tax, and Other Taxes. (4) From Operating Budget in Brief for Fiscal Year 2012. (5) State gaming revenues are reported as a Receipt from Other City Funds in 2009 and as Revenue from Other Governments in 2010, 2011 and 2012.
(6) The reduction in Revenue from Other Governments (State and Federal funding) in Fiscal Year 2012 is largely the result of transferring the majority of the Department of Human Services revenues and obligations to the Grants Revenue Fund.
Source: City of Philadelphia Department of Finance Figures may not add up due to rounding.
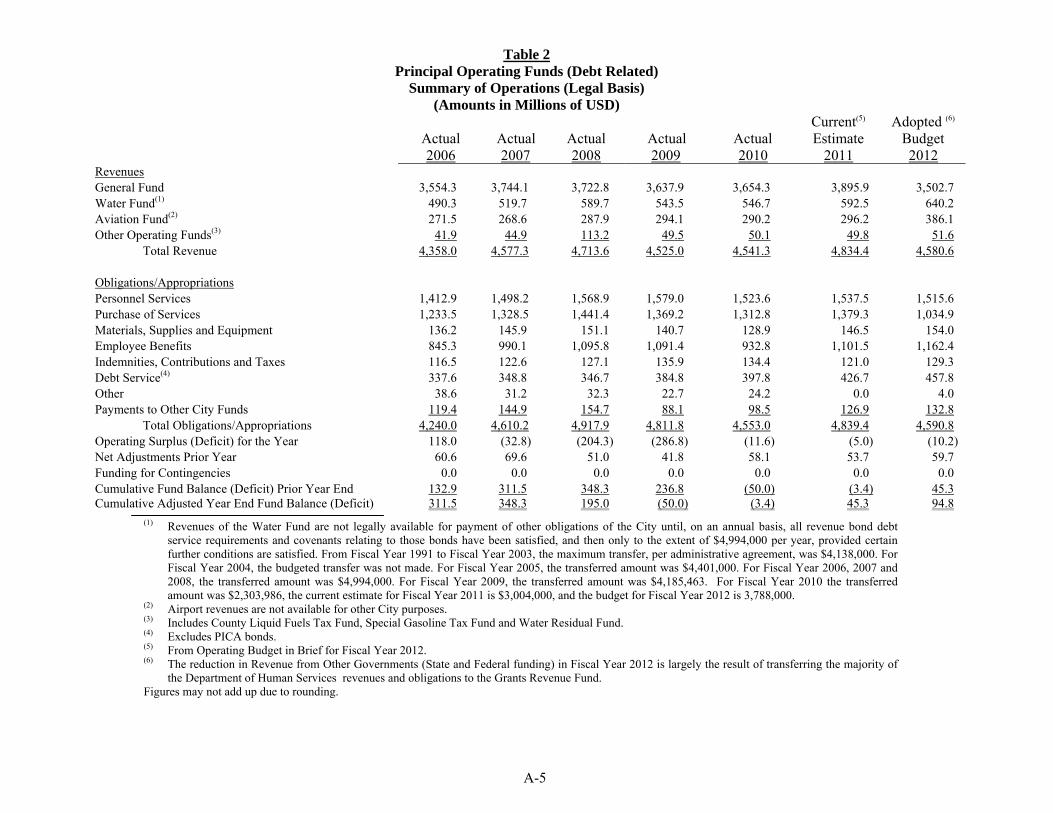
A-5
Table 2 Principal Operating Funds (Debt Related)
Summary of Operations (Legal Basis) (Amounts in Millions of USD)
Actual Actual Actual Actual
Actual
Current(5) Estimate
Adopted (6) Budget
2006 2007 2008 2009 2010 2011 2012 Revenues General Fund 3,554.3 3,744.1 3,722.8 3,637.9 3,654.3 3,895.9 3,502.7 Water Fund(1) 490.3 519.7 589.7 543.5 546.7 592.5 640.2 Aviation Fund(2) 271.5 268.6 287.9 294.1 290.2 296.2 386.1 Other Operating Funds(3) 41.9 44.9 113.2 49.5 50.1 49.8 51.6 Total Revenue 4,358.0 4,577.3 4,713.6 4,525.0 4,541.3 4,834.4 4,580.6 Obligations/Appropriations Personnel Services 1,412.9 1,498.2 1,568.9 1,579.0 1,523.6 1,537.5 1,515.6 Purchase of Services 1,233.5 1,328.5 1,441.4 1,369.2 1,312.8 1,379.3 1,034.9 Materials, Supplies and Equipment 136.2 145.9 151.1 140.7 128.9 146.5 154.0 Employee Benefits 845.3 990.1 1,095.8 1,091.4 932.8 1,101.5 1,162.4 Indemnities, Contributions and Taxes 116.5 122.6 127.1 135.9 134.4 121.0 129.3 Debt Service(4) 337.6 348.8 346.7 384.8 397.8 426.7 457.8 Other 38.6 31.2 32.3 22.7 24.2 0.0 4.0 Payments to Other City Funds 119.4 144.9 154.7 88.1 98.5 126.9 132.8 Total Obligations/Appropriations 4,240.0 4,610.2 4,917.9 4,811.8 4,553.0 4,839.4 4,590.8 Operating Surplus (Deficit) for the Year 118.0 (32.8) (204.3) (286.8) (11.6) (5.0) (10.2) Net Adjustments Prior Year 60.6 69.6 51.0 41.8 58.1 53.7 59.7 Funding for Contingencies 0.0 0.0 0.0 0.0 0.0 0.0 0.0 Cumulative Fund Balance (Deficit) Prior Year End 132.9 311.5 348.3 236.8 (50.0) (3.4) 45.3 Cumulative Adjusted Year End Fund Balance (Deficit) 311.5 348.3 195.0 (50.0) (3.4) 45.3 94.8
(1) Revenues of the Water Fund are not legally available for payment of other obligations of the City until, on an annual basis, all revenue bond debt service requirements and covenants relating to those bonds have been satisfied, and then only to the extent of $4,994,000 per year, provided certain further conditions are satisfied. From Fiscal Year 1991 to Fiscal Year 2003, the maximum transfer, per administrative agreement, was $4,138,000. For Fiscal Year 2004, the budgeted transfer was not made. For Fiscal Year 2005, the transferred amount was $4,401,000. For Fiscal Year 2006, 2007 and 2008, the transferred amount was $4,994,000. For Fiscal Year 2009, the transferred amount was $4,185,463. For Fiscal Year 2010 the transferred amount was $2,303,986, the current estimate for Fiscal Year 2011 is $3,004,000, and the budget for Fiscal Year 2012 is 3,788,000.
(2) Airport revenues are not available for other City purposes. (3) Includes County Liquid Fuels Tax Fund, Special Gasoline Tax Fund and Water Residual Fund. (4) Excludes PICA bonds. (5) From Operating Budget in Brief for Fiscal Year 2012. (6) The reduction in Revenue from Other Governments (State and Federal funding) in Fiscal Year 2012 is largely the result of transferring the majority of
the Department of Human Services revenues and obligations to the Grants Revenue Fund. Figures may not add up due to rounding.
A-6
DISCUSSION OF FINANCIAL OPERATIONS
Impact of Economic Downturn
Since October of 2008, the City has implemented significant actions to balance the budget and its five-year plans, including reducing overtime costs, reducing General Fund full and part time employee headcount by 1,600 (from June 30, 2008 to December 31, 2010), implementing a temporary five year sales tax increase and a 9.9% Real Estate Tax increase in Fiscal Year 2011, pension funding changes, freezing City funded and business privilege tax reductions until Fiscal Year 2014, increasing fees, and instituting spending cuts throughout the government. During this period of time, the City has improved its public safety results due to important changes in policing and has maintained delivery of its services.
The City undertook these measures as a result of the impact of the national and global recession. Beginning in August 2008, the City began to experience adverse budgetary performance for Fiscal Year 2009 as a result of the recession. In November 2008, the City projected a $1 billion gap over the five year period of the Seventeenth Five-Year Plan, and the City took a series of measures to close the projected gap for Fiscal Year 2009 and over the period of the Seventeenth Five-Year Plan. However, the economy deteriorated further and revenues declined at a greater pace than had been projected, leaving the City with a Fiscal Year 2009 operating deficit of $286.8 million resulting in a deficit of $236.8 million after prior year net adjustments of $41.8 million. Tax receipts continued to display weakness in Fiscal Year 2010, increasing the projected gap for both Fiscal Year 2010 and the period of the Eighteenth Five-Year Plan. In total during the six year period Fiscal Years 2009-2014, the projected shortfall reached $2.4 billion. The actions taken by the City, described above, are currently anticipated to close these projected gaps.
Fiscal Year 2012 Adopted Budget
The City’s Fiscal Year 2012 budget was presented to City Council on March 3, 2011, was approved by City Council on June 23, 2011, and signed by the Mayor on June 24, 2011. The process and required timing for the approval of the budget is described under “CITY FINANCIAL PROCEDURES-Budget Procedures” herein. The budget projects estimated revenues of $3.503 billion, obligations of $3.470 billion, an operating surplus of $57.1 million and an ending fund balance of $60.6 million on the legally enacted basis.
The Fiscal Year 2012 budget conforms to the Twentieth Five-Year Plan (hereinafter defined) which was submitted to PICA (hereinafter defined) on July 7, 2011, and approved by PICA on July 26, 2011.
For the past several years, the financial position of the City’s General Fund has been distorted by the timing of the receipt of reimbursements from the Commonwealth for the Department of Human Services. For a variety of reasons, those reimbursements have not been received in the same year as the costs were incurred. As a result, the costs are reflected in the City’s fund balances, but the reimbursements are not, leading to fund balances that are distorted and artificially low. In some years, the late receipt of reimbursements has led to changes of tens of millions of dollars in the City’s fund balance.
The Fiscal Year 2012 budget moves reimbursed costs and corresponding revenues for services provided by the Department of Human Services of approximately $495.1 million to the Grants Revenue Fund. As a result of this change the City’s General Fund balance will better reflect the City’s financial condition.
A-7
Fiscal Year 2011 Budget
The City’s Fiscal Year 2011 budget was presented to City Council on March 4, 2010, was approved by City Council on May 20, 2010, and signed by the Mayor on June 1, 2010. The budget projects estimated revenues of $3.909 billion, obligations of $3.853 billion, an operating surplus of $80.5 million and an ending fund balance of $42.6 million after discharging the Fiscal Year 2010 fund balance deficit on the legally enacted basis. The budget includes a 9.9% Real Estate Tax increase which is estimated to yield $86 million. The Nineteenth Five-Year Plan (hereinafter defined) was approved by PICA on August 10, 2010.
Fiscal Year 2011 Current Estimate
The Operating Budget in Brief for Fiscal Year 2012 contains revised estimates for Fiscal Year 2011. Revenue estimates have been revised downward by $32.8 million versus the March 31, 2011 Quarterly City Manager’s Report, largely as the result of delayed receipts of prior year Department of Human Services reimbursements, lower collections of Real Estate Transfer Tax and trash collection fees which are being partially off-set by higher than projected tax collections for Business Privilege Taxes, PICA Taxes and forfeited bail fees. The revised estimate of obligations includes $31 million in lower than projected obligations including lower costs for child welfare services of $15 million, debt service of $13 million and demolition of buildings of $3 million as compared to the March 31, 2011 Quarterly City Manager’s Report. The revised estimate projects revenues for Fiscal Year 2011 of $3.895 billion, obligations of $3.803 billion, an operating surplus of $117.5 million, and an ending fund balance of $3.5 million after discharging the Fiscal Year 2010 fund balance deficit on the legally enacted basis.
As presented in this Appendix A, unless otherwise noted, current estimates for Fiscal Year 2011 are based on the Operating Budget in Brief for Fiscal Year 2012 as approved by the Council on June 23, 2011.
Fiscal Year 2010 Budget
The City’s Fiscal Year 2010 budget was presented to City Council on March 19, 2009, was approved by City Council on May 21, 2009, and signed by the Mayor on May 27, 2009. The budget projected estimated revenues of $3.815 billion, obligations of $3.694 billion and an ending fund balance of $85.3 million after discharging the Fiscal Year 2009 fund balance deficit on the legally enacted basis. The budget included a temporary one percent City Sales Tax increase which was estimated to yield $97 million in Fiscal Year 2010 increasing to an estimated $121 million in Fiscal Year 2014. The Sales Tax increase became effective on October 8, 2009. With the delay in Commonwealth approval of the temporary Sales Tax increase, reduced child welfare funding, revisions to the pension amortization schedule and other reductions and delays in implementation of revenue initiatives, the City revised the Fiscal Year 2010 budget and Eighteenth Five-Year Plan and submitted the revision to PICA on September 1, 2009. PICA approved the revised Eighteenth Five-Year Plan on September 16, 2009. Such revised Eighteenth Five-Year Plan was based upon Fiscal Year 2010 estimated projected revenues of $3.789 billion, obligations of $3.727 billion and an ending funds balance on the legally enacted basis of negative $51.7 million.
Fiscal Year 2010 Results
For Fiscal Year 2010, the City had revenues of $3.654 billion, obligations of $3.653 billion and an ending fund balance on the legally enacted basis of negative $114 million. The decrease in such ending fund balance from the projection used in the revised Eighteenth Five-Year Plan was the result of
A-8
the delayed reimbursement of Department of Human Services costs from the federal and state governments.
CITY FINANCIAL PROCEDURES
Except as otherwise noted, the financial statements, tables, statistics, and other information shown below have been prepared by the Office of the Director of Finance and can be reconciled to the financial statements in the City’s Comprehensive Annual Financial Report and Notes therein.
Independent Audit and Opinion of the City Controller
The City Controller has examined and expressed opinions on the basic financial statements of the City of Philadelphia contained in the City’s Comprehensive Annual Financial Report for the Fiscal Year ended June 30, 2010 (the “Fiscal Year 2010 Comprehensive Annual Financial Report”).
The City Controller has not participated in the preparation of this Remarketing Memorandum nor in the preparation of the budget estimates and projections and cash flow statements and forecasts set forth in various tables contained in this Remarketing Memorandum. Consequently, the City Controller expresses no opinion with respect to any of the data contained in this Remarketing Memorandum other than what is contained in the Fiscal Year 2010 Comprehensive Annual Financial Report.
Pennsylvania Intergovernmental Cooperation Authority
The City is required to develop an annual five-year financial plan and obtain annual approval of such five-year financial plan from the Pennsylvania Intergovernmental Cooperation Authority (“PICA”); the City is also required to prepare and submit quarterly reports to PICA. See “PENNSYLVANIA INTERGOVERNMENTAL COOPERATION AUTHORITY” for a further discussion of PICA, its relationship to the City and its financial oversight role.
Principal Operations
The major operations of the City are conducted through the General Fund. In addition to the General Fund, operations of the City are conducted through two other major governmental funds and 12 minor governmental funds. The two major governmental funds and three of the minor governmental funds are financed solely through grants from the Commonwealth and Federal government. The City’s Debt Service Fund and Capital Projects Fund are also included with the minor governmental funds. The Fiscal Year 2012 Operating Budget moves the activities of the Department of Human Services from the General Fund to the Grants Revenue Fund.
Fund Accounting
Funds are groupings of activities that enable the City to maintain control over resources that have been segregated for particular purposes or objectives. All of the funds of the City can be divided into three categories: governmental funds, proprietary funds and fiduciary funds.
Governmental Funds. The governmental funds are used to account for the financial activity of the City’s basic services, such as: general government; economic and neighborhood development; public health, welfare and safety; cultural and recreational; and streets, highways and sanitation. The funds’ financial activities focus on a short-term view of the inflows and outflows of spendable resources, as well as on the balances of spendable resources available at the end of the fiscal year. The financial information presented for the governmental funds is useful in evaluating the City’s short term financing requirements.
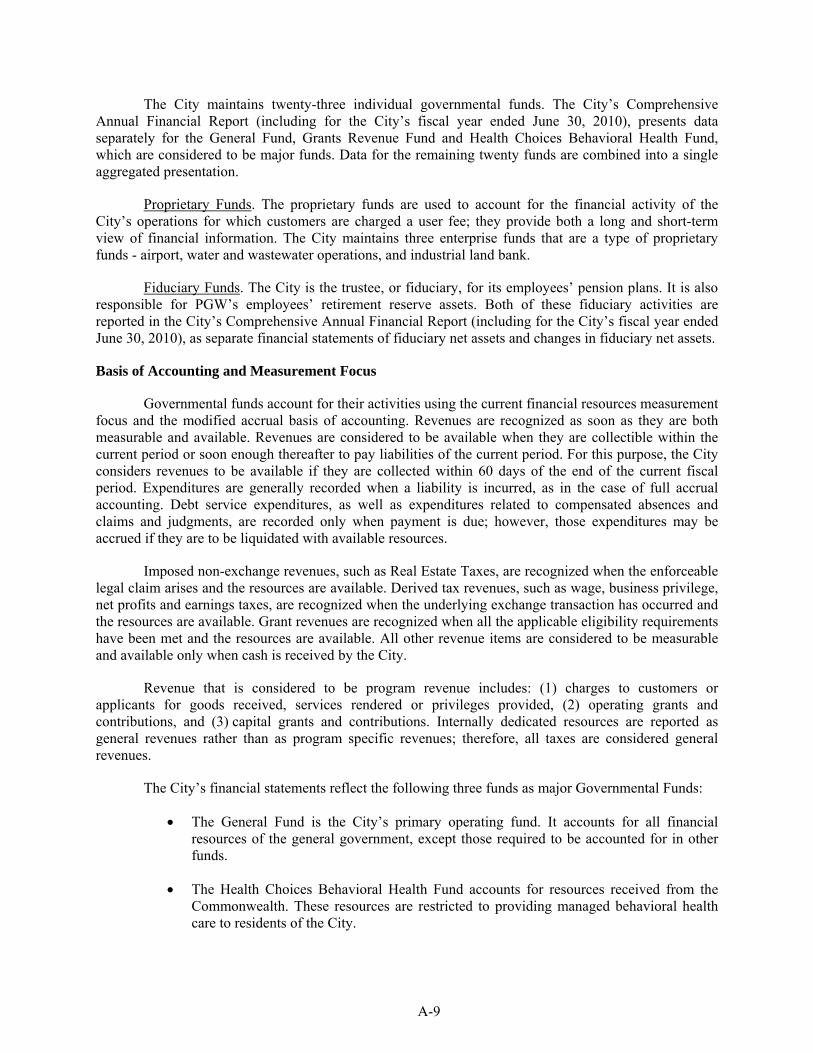
A-9
The City maintains twenty-three individual governmental funds. The City’s Comprehensive Annual Financial Report (including for the City’s fiscal year ended June 30, 2010), presents data separately for the General Fund, Grants Revenue Fund and Health Choices Behavioral Health Fund, which are considered to be major funds. Data for the remaining twenty funds are combined into a single aggregated presentation.
Proprietary Funds. The proprietary funds are used to account for the financial activity of the City’s operations for which customers are charged a user fee; they provide both a long and short-term view of financial information. The City maintains three enterprise funds that are a type of proprietary funds - airport, water and wastewater operations, and industrial land bank.
Fiduciary Funds. The City is the trustee, or fiduciary, for its employees’ pension plans. It is also responsible for PGW’s employees’ retirement reserve assets. Both of these fiduciary activities are reported in the City’s Comprehensive Annual Financial Report (including for the City’s fiscal year ended June 30, 2010), as separate financial statements of fiduciary net assets and changes in fiduciary net assets.
Basis of Accounting and Measurement Focus
Governmental funds account for their activities using the current financial resources measurement focus and the modified accrual basis of accounting. Revenues are recognized as soon as they are both measurable and available. Revenues are considered to be available when they are collectible within the current period or soon enough thereafter to pay liabilities of the current period. For this purpose, the City considers revenues to be available if they are collected within 60 days of the end of the current fiscal period. Expenditures are generally recorded when a liability is incurred, as in the case of full accrual accounting. Debt service expenditures, as well as expenditures related to compensated absences and claims and judgments, are recorded only when payment is due; however, those expenditures may be accrued if they are to be liquidated with available resources.
Imposed non-exchange revenues, such as Real Estate Taxes, are recognized when the enforceable legal claim arises and the resources are available. Derived tax revenues, such as wage, business privilege, net profits and earnings taxes, are recognized when the underlying exchange transaction has occurred and the resources are available. Grant revenues are recognized when all the applicable eligibility requirements have been met and the resources are available. All other revenue items are considered to be measurable and available only when cash is received by the City.
Revenue that is considered to be program revenue includes: (1) charges to customers or applicants for goods received, services rendered or privileges provided, (2) operating grants and contributions, and (3) capital grants and contributions. Internally dedicated resources are reported as general revenues rather than as program specific revenues; therefore, all taxes are considered general revenues.
The City’s financial statements reflect the following three funds as major Governmental Funds:
The General Fund is the City’s primary operating fund. It accounts for all financial resources of the general government, except those required to be accounted for in other funds.
The Health Choices Behavioral Health Fund accounts for resources received from the Commonwealth. These resources are restricted to providing managed behavioral health care to residents of the City.
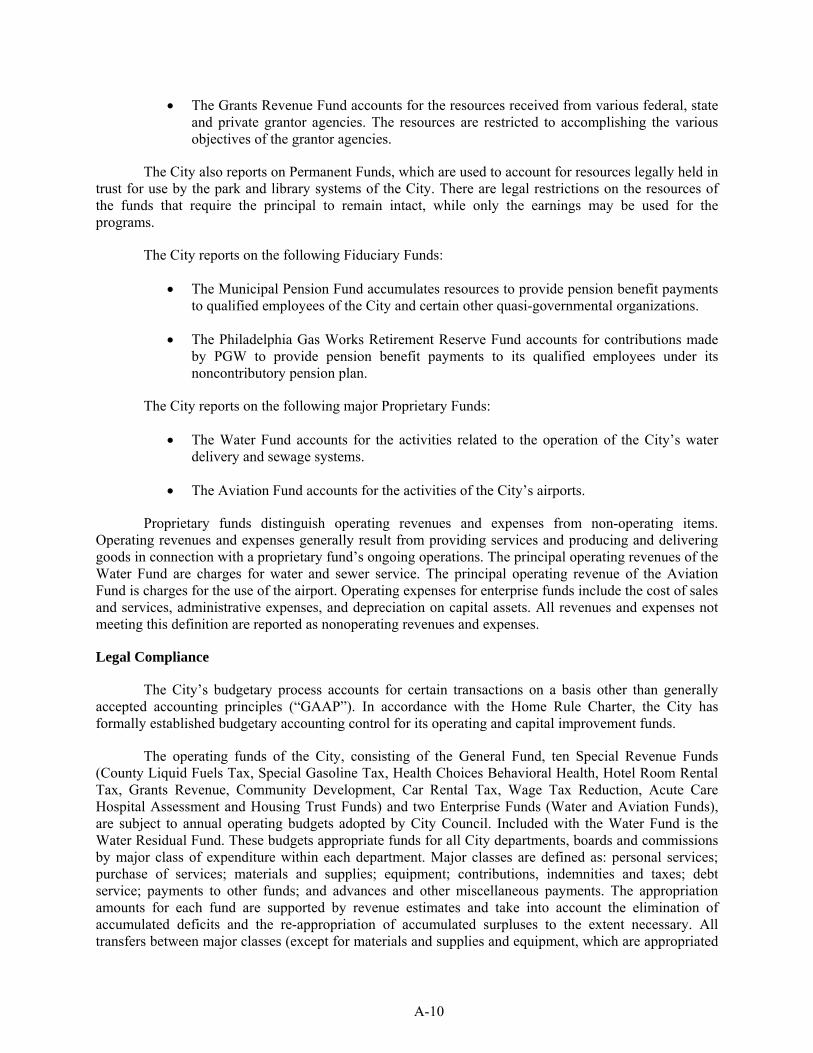
A-10
The Grants Revenue Fund accounts for the resources received from various federal, state and private grantor agencies. The resources are restricted to accomplishing the various objectives of the grantor agencies.
The City also reports on Permanent Funds, which are used to account for resources legally held in trust for use by the park and library systems of the City. There are legal restrictions on the resources of the funds that require the principal to remain intact, while only the earnings may be used for the programs.
The City reports on the following Fiduciary Funds:
The Municipal Pension Fund accumulates resources to provide pension benefit payments to qualified employees of the City and certain other quasi-governmental organizations.
The Philadelphia Gas Works Retirement Reserve Fund accounts for contributions made by PGW to provide pension benefit payments to its qualified employees under its noncontributory pension plan.
The City reports on the following major Proprietary Funds:
The Water Fund accounts for the activities related to the operation of the City’s water delivery and sewage systems.
The Aviation Fund accounts for the activities of the City’s airports.
Proprietary funds distinguish operating revenues and expenses from non-operating items. Operating revenues and expenses generally result from providing services and producing and delivering goods in connection with a proprietary fund’s ongoing operations. The principal operating revenues of the Water Fund are charges for water and sewer service. The principal operating revenue of the Aviation Fund is charges for the use of the airport. Operating expenses for enterprise funds include the cost of sales and services, administrative expenses, and depreciation on capital assets. All revenues and expenses not meeting this definition are reported as nonoperating revenues and expenses.
Legal Compliance
The City’s budgetary process accounts for certain transactions on a basis other than generally accepted accounting principles (“GAAP”). In accordance with the Home Rule Charter, the City has formally established budgetary accounting control for its operating and capital improvement funds.
The operating funds of the City, consisting of the General Fund, ten Special Revenue Funds (County Liquid Fuels Tax, Special Gasoline Tax, Health Choices Behavioral Health, Hotel Room Rental Tax, Grants Revenue, Community Development, Car Rental Tax, Wage Tax Reduction, Acute Care Hospital Assessment and Housing Trust Funds) and two Enterprise Funds (Water and Aviation Funds), are subject to annual operating budgets adopted by City Council. Included with the Water Fund is the Water Residual Fund. These budgets appropriate funds for all City departments, boards and commissions by major class of expenditure within each department. Major classes are defined as: personal services; purchase of services; materials and supplies; equipment; contributions, indemnities and taxes; debt service; payments to other funds; and advances and other miscellaneous payments. The appropriation amounts for each fund are supported by revenue estimates and take into account the elimination of accumulated deficits and the re-appropriation of accumulated surpluses to the extent necessary. All transfers between major classes (except for materials and supplies and equipment, which are appropriated
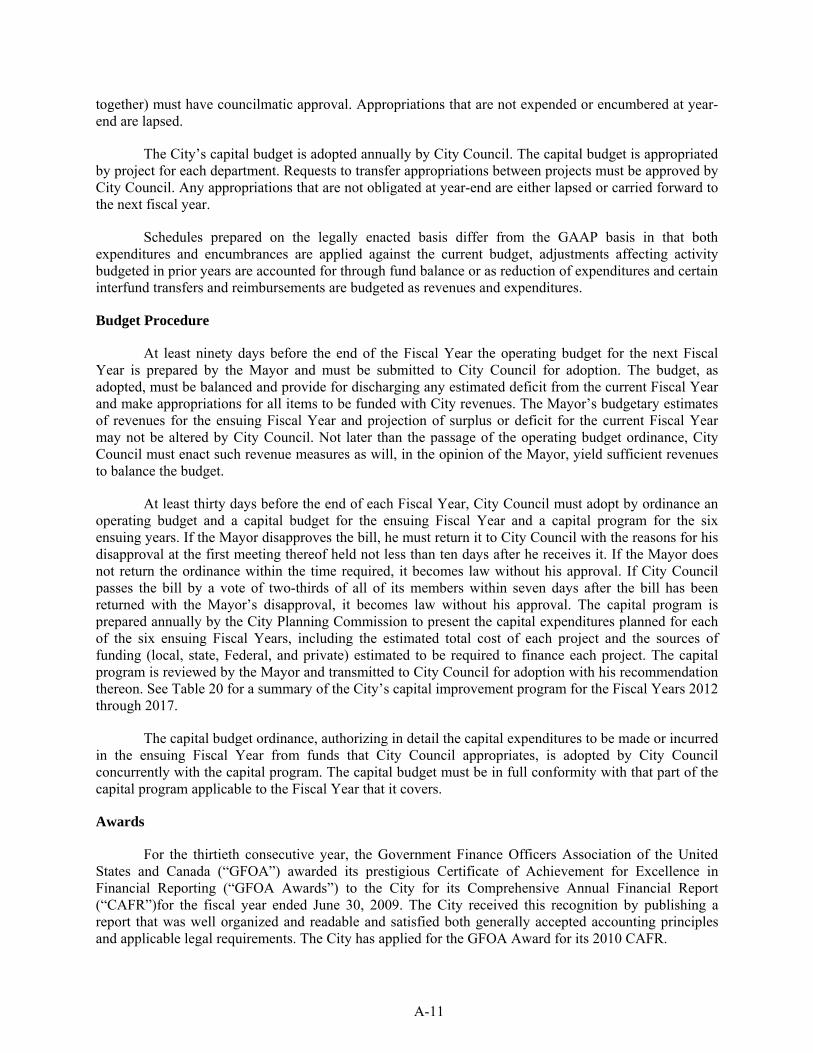
A-11
together) must have councilmatic approval. Appropriations that are not expended or encumbered at year-end are lapsed.
The City’s capital budget is adopted annually by City Council. The capital budget is appropriated by project for each department. Requests to transfer appropriations between projects must be approved by City Council. Any appropriations that are not obligated at year-end are either lapsed or carried forward to the next fiscal year.
Schedules prepared on the legally enacted basis differ from the GAAP basis in that both expenditures and encumbrances are applied against the current budget, adjustments affecting activity budgeted in prior years are accounted for through fund balance or as reduction of expenditures and certain interfund transfers and reimbursements are budgeted as revenues and expenditures.
Budget Procedure
At least ninety days before the end of the Fiscal Year the operating budget for the next Fiscal Year is prepared by the Mayor and must be submitted to City Council for adoption. The budget, as adopted, must be balanced and provide for discharging any estimated deficit from the current Fiscal Year and make appropriations for all items to be funded with City revenues. The Mayor’s budgetary estimates of revenues for the ensuing Fiscal Year and projection of surplus or deficit for the current Fiscal Year may not be altered by City Council. Not later than the passage of the operating budget ordinance, City Council must enact such revenue measures as will, in the opinion of the Mayor, yield sufficient revenues to balance the budget.
At least thirty days before the end of each Fiscal Year, City Council must adopt by ordinance an operating budget and a capital budget for the ensuing Fiscal Year and a capital program for the six ensuing years. If the Mayor disapproves the bill, he must return it to City Council with the reasons for his disapproval at the first meeting thereof held not less than ten days after he receives it. If the Mayor does not return the ordinance within the time required, it becomes law without his approval. If City Council passes the bill by a vote of two-thirds of all of its members within seven days after the bill has been returned with the Mayor’s disapproval, it becomes law without his approval. The capital program is prepared annually by the City Planning Commission to present the capital expenditures planned for each of the six ensuing Fiscal Years, including the estimated total cost of each project and the sources of funding (local, state, Federal, and private) estimated to be required to finance each project. The capital program is reviewed by the Mayor and transmitted to City Council for adoption with his recommendation thereon. See Table 20 for a summary of the City’s capital improvement program for the Fiscal Years 2012 through 2017.
The capital budget ordinance, authorizing in detail the capital expenditures to be made or incurred in the ensuing Fiscal Year from funds that City Council appropriates, is adopted by City Council concurrently with the capital program. The capital budget must be in full conformity with that part of the capital program applicable to the Fiscal Year that it covers.
Awards
For the thirtieth consecutive year, the Government Finance Officers Association of the United States and Canada (“GFOA”) awarded its prestigious Certificate of Achievement for Excellence in Financial Reporting (“GFOA Awards”) to the City for its Comprehensive Annual Financial Report (“CAFR”)for the fiscal year ended June 30, 2009. The City received this recognition by publishing a report that was well organized and readable and satisfied both generally accepted accounting principles and applicable legal requirements. The City has applied for the GFOA Award for its 2010 CAFR.
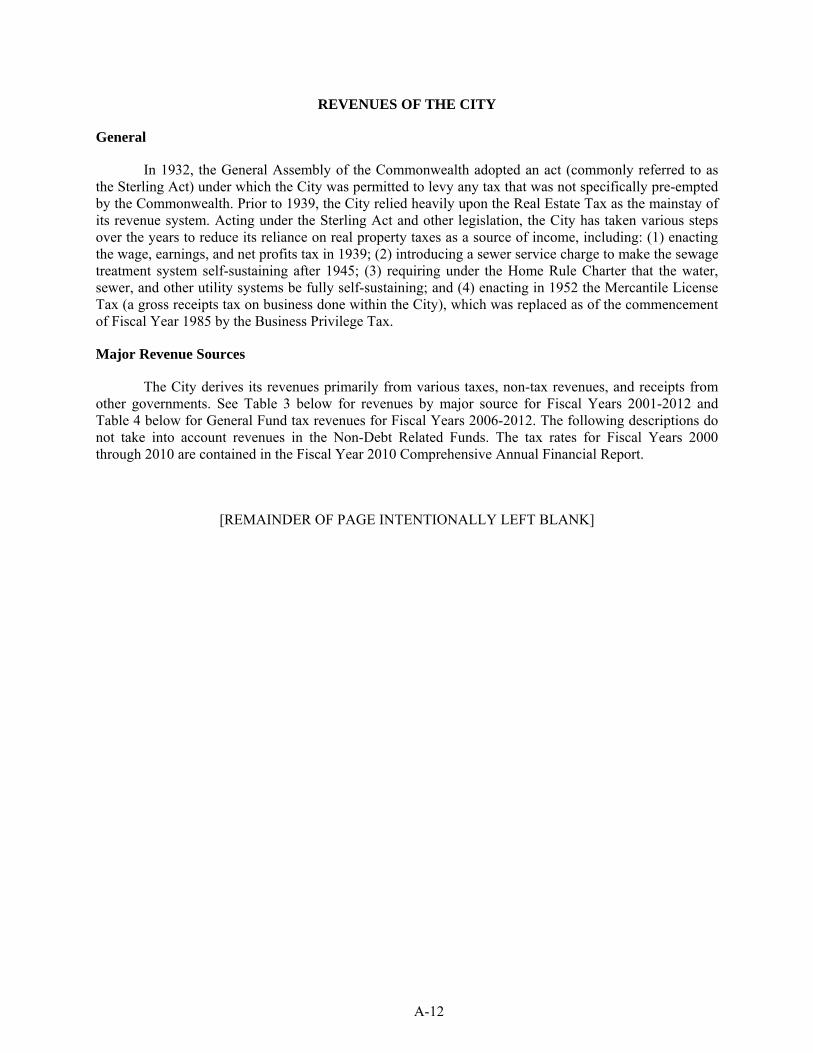
A-12
REVENUES OF THE CITY
General
In 1932, the General Assembly of the Commonwealth adopted an act (commonly referred to as the Sterling Act) under which the City was permitted to levy any tax that was not specifically pre-empted by the Commonwealth. Prior to 1939, the City relied heavily upon the Real Estate Tax as the mainstay of its revenue system. Acting under the Sterling Act and other legislation, the City has taken various steps over the years to reduce its reliance on real property taxes as a source of income, including: (1) enacting the wage, earnings, and net profits tax in 1939; (2) introducing a sewer service charge to make the sewage treatment system self-sustaining after 1945; (3) requiring under the Home Rule Charter that the water, sewer, and other utility systems be fully self-sustaining; and (4) enacting in 1952 the Mercantile License Tax (a gross receipts tax on business done within the City), which was replaced as of the commencement of Fiscal Year 1985 by the Business Privilege Tax.
Major Revenue Sources
The City derives its revenues primarily from various taxes, non-tax revenues, and receipts from other governments. See Table 3 below for revenues by major source for Fiscal Years 2001-2012 and Table 4 below for General Fund tax revenues for Fiscal Years 2006-2012. The following descriptions do not take into account revenues in the Non-Debt Related Funds. The tax rates for Fiscal Years 2000 through 2010 are contained in the Fiscal Year 2010 Comprehensive Annual Financial Report.
[REMAINDER OF PAGE INTENTIONALLY LEFT BLANK]
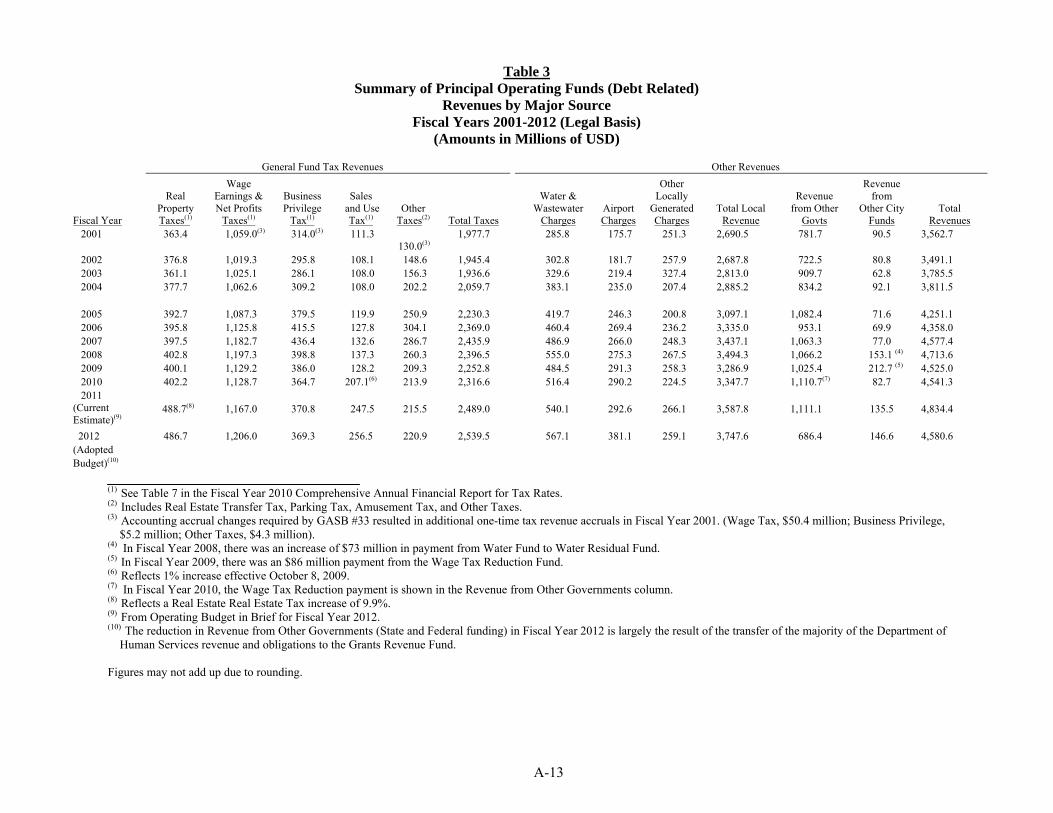
A-13
Table 3 Summary of Principal Operating Funds (Debt Related)
Revenues by Major Source Fiscal Years 2001-2012 (Legal Basis)
(Amounts in Millions of USD)
General Fund Tax Revenues Other Revenues
Fiscal Year
Real
Property Taxes(1)
Wage Earnings & Net Profits
Taxes(1)
Business Privilege
Tax(1)
Sales
and Use Tax(1)
Other Taxes(2)
Total Taxes
Water &
WastewaterCharges
Airport Charges
Other Locally
Generated Charges
Total Local Revenue
Revenue
from Other Govts
Revenue from
Other City Funds
Total Revenues
2001 363.4 1,059.0(3) 314.0(3) 111.3 130.0(3)
1,977.7 285.8 175.7 251.3 2,690.5 781.7 90.5 3,562.7
2002 376.8 1,019.3 295.8 108.1 148.6 1,945.4 302.8 181.7 257.9 2,687.8 722.5 80.8 3,491.1 2003 361.1 1,025.1 286.1 108.0 156.3 1,936.6 329.6 219.4 327.4 2,813.0 909.7 62.8 3,785.5 2004 377.7 1,062.6 309.2 108.0 202.2 2,059.7 383.1 235.0 207.4 2,885.2 834.2 92.1 3,811.5 2005 392.7 1,087.3 379.5 119.9 250.9 2,230.3 419.7 246.3 200.8 3,097.1 1,082.4 71.6 4,251.1 2006 395.8 1,125.8 415.5 127.8 304.1 2,369.0 460.4 269.4 236.2 3,335.0 953.1 69.9 4,358.0 2007 397.5 1,182.7 436.4 132.6 286.7 2,435.9 486.9 266.0 248.3 3,437.1 1,063.3 77.0 4,577.4 2008 402.8 1,197.3 398.8 137.3 260.3 2,396.5 555.0 275.3 267.5 3,494.3 1,066.2 153.1 (4) 4,713.6 2009 400.1 1,129.2 386.0 128.2 209.3 2,252.8 484.5 291.3 258.3 3,286.9 1,025.4 212.7 (5) 4,525.0 2010 2011 (Current Estimate)(9)
402.2
488.7(8)
1,128.7
1,167.0
364.7
370.8
207.1(6)
247.5
213.9
215.5
2,316.6
2,489.0
516.4
540.1
290.2
292.6
224.5
266.1
3,347.7
3,587.8
1,110.7(7)
1,111.1
82.7
135.5
4,541.3
4,834.4
2012 (Adopted Budget)(10)
486.7 1,206.0 369.3 256.5 220.9 2,539.5 567.1 381.1 259.1 3,747.6 686.4 146.6 4,580.6
(1) See Table 7 in the Fiscal Year 2010 Comprehensive Annual Financial Report for Tax Rates. (2) Includes Real Estate Transfer Tax, Parking Tax, Amusement Tax, and Other Taxes. (3) Accounting accrual changes required by GASB #33 resulted in additional one-time tax revenue accruals in Fiscal Year 2001. (Wage Tax, $50.4 million; Business Privilege,
$5.2 million; Other Taxes, $4.3 million). (4) In Fiscal Year 2008, there was an increase of $73 million in payment from Water Fund to Water Residual Fund. (5) In Fiscal Year 2009, there was an $86 million payment from the Wage Tax Reduction Fund. (6) Reflects 1% increase effective October 8, 2009. (7) In Fiscal Year 2010, the Wage Tax Reduction payment is shown in the Revenue from Other Governments column. (8) Reflects a Real Estate Real Estate Tax increase of 9.9%. (9) From Operating Budget in Brief for Fiscal Year 2012. (10) The reduction in Revenue from Other Governments (State and Federal funding) in Fiscal Year 2012 is largely the result of the transfer of the majority of the Department of
Human Services revenue and obligations to the Grants Revenue Fund.
Figures may not add up due to rounding.
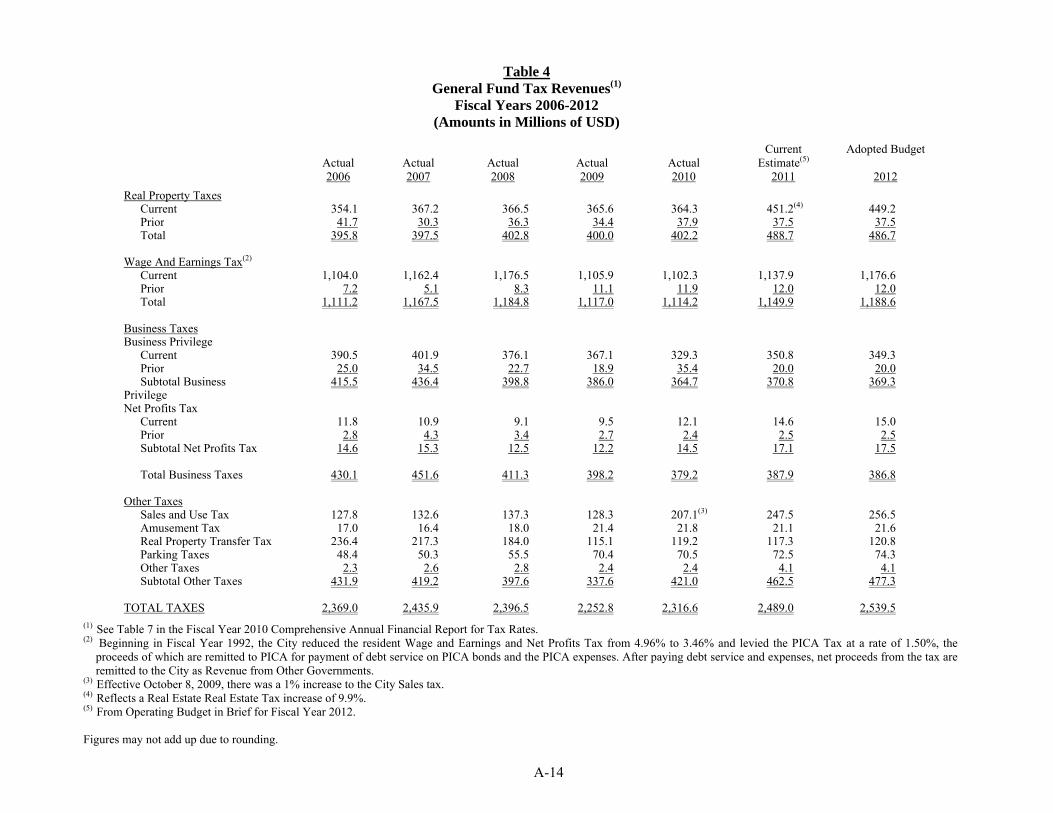
A-14
Table 4 General Fund Tax Revenues(1)
Fiscal Years 2006-2012 (Amounts in Millions of USD)
Actual Actual Actual Actual Actual
Current Estimate(5)
Adopted Budget
2006 2007 2008 2009 2010 2011 2012
Real Property Taxes Current 354.1 367.2 366.5 365.6 364.3 451.2(4) 449.2 Prior 41.7 30.3 36.3 34.4 37.9 37.5 37.5 Total 395.8 397.5 402.8 400.0 402.2 488.7 486.7
Wage And Earnings Tax(2)
Current 1,104.0 1,162.4 1,176.5 1,105.9 1,102.3 1,137.9 1,176.6 Prior 7.2 5.1 8.3 11.1 11.9 12.0 12.0 Total 1,111.2 1,167.5 1,184.8 1,117.0 1,114.2 1,149.9 1,188.6
Business Taxes Business Privilege Current 390.5 401.9 376.1 367.1 329.3 350.8 349.3 Prior 25.0 34.5 22.7 18.9 35.4 20.0 20.0 Subtotal Business Privilege
415.5 436.4 398.8 386.0 364.7 370.8 369.3
Net Profits Tax Current 11.8 10.9 9.1 9.5 12.1 14.6 15.0 Prior 2.8 4.3 3.4 2.7 2.4 2.5 2.5 Subtotal Net Profits Tax 14.6 15.3 12.5 12.2 14.5 17.1 17.5
Total Business Taxes 430.1 451.6 411.3 398.2 379.2 387.9 386.8
Other Taxes Sales and Use Tax 127.8 132.6 137.3 128.3 207.1(3) 247.5 256.5 Amusement Tax 17.0 16.4 18.0 21.4 21.8 21.1 21.6 Real Property Transfer Tax 236.4 217.3 184.0 115.1 119.2 117.3 120.8 Parking Taxes 48.4 50.3 55.5 70.4 70.5 72.5 74.3 Other Taxes 2.3 2.6 2.8 2.4 2.4 4.1 4.1 Subtotal Other Taxes 431.9 419.2 397.6 337.6 421.0 462.5 477.3
TOTAL TAXES 2,369.0 2,435.9 2,396.5 2,252.8 2,316.6 2,489.0 2,539.5(1) See Table 7 in the Fiscal Year 2010 Comprehensive Annual Financial Report for Tax Rates. (2) Beginning in Fiscal Year 1992, the City reduced the resident Wage and Earnings and Net Profits Tax from 4.96% to 3.46% and levied the PICA Tax at a rate of 1.50%, the
proceeds of which are remitted to PICA for payment of debt service on PICA bonds and the PICA expenses. After paying debt service and expenses, net proceeds from the tax are remitted to the City as Revenue from Other Governments.
(3) Effective October 8, 2009, there was a 1% increase to the City Sales tax. (4) Reflects a Real Estate Real Estate Tax increase of 9.9%. (5) From Operating Budget in Brief for Fiscal Year 2012. Figures may not add up due to rounding.
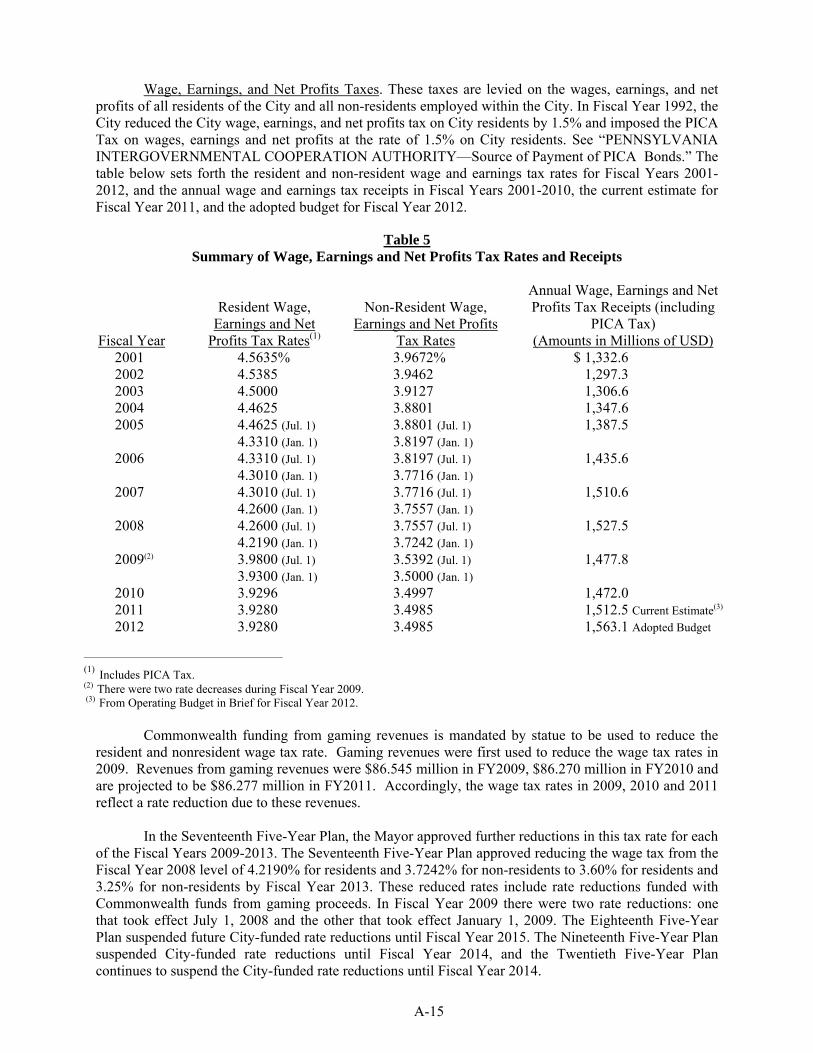
A-15
Wage, Earnings, and Net Profits Taxes. These taxes are levied on the wages, earnings, and net profits of all residents of the City and all non-residents employed within the City. In Fiscal Year 1992, the City reduced the City wage, earnings, and net profits tax on City residents by 1.5% and imposed the PICA Tax on wages, earnings and net profits at the rate of 1.5% on City residents. See “PENNSYLVANIA INTERGOVERNMENTAL COOPERATION AUTHORITY—Source of Payment of PICA Bonds.” The table below sets forth the resident and non-resident wage and earnings tax rates for Fiscal Years 2001-2012, and the annual wage and earnings tax receipts in Fiscal Years 2001-2010, the current estimate for Fiscal Year 2011, and the adopted budget for Fiscal Year 2012.
Table 5 Summary of Wage, Earnings and Net Profits Tax Rates and Receipts
Fiscal Year
Resident Wage, Earnings and Net
Profits Tax Rates(1)
Non-Resident Wage, Earnings and Net Profits
Tax Rates
Annual Wage, Earnings and Net Profits Tax Receipts (including
PICA Tax) (Amounts in Millions of USD)
2001 4.5635% 3.9672% $ 1,332.6 2002 4.5385 3.9462 1,297.3 2003 4.5000 3.9127 1,306.6 2004 4.4625 3.8801 1,347.6 2005 4.4625 (Jul. 1)
4.3310 (Jan. 1) 3.8801 (Jul. 1)
3.8197 (Jan. 1) 1,387.5
2006 4.3310 (Jul. 1)
4.3010 (Jan. 1) 3.8197 (Jul. 1)
3.7716 (Jan. 1) 1,435.6
2007 4.3010 (Jul. 1) 4.2600 (Jan. 1)
3.7716 (Jul. 1) 3.7557 (Jan. 1)
1,510.6
2008 4.2600 (Jul. 1) 4.2190 (Jan. 1)
3.7557 (Jul. 1)
3.7242 (Jan. 1) 1,527.5
2009(2) 3.9800 (Jul. 1)
3.9300 (Jan. 1) 3.5392 (Jul. 1) 3.5000 (Jan. 1)
1,477.8
2010 3.9296 3.4997 1,472.0 2011 3.9280 3.4985 1,512.5 Current Estimate(3) 2012 3.9280 3.4985 1,563.1 Adopted Budget
______________________________________________
(1) Includes PICA Tax. (2) There were two rate decreases during Fiscal Year 2009. (3) From Operating Budget in Brief for Fiscal Year 2012.
Commonwealth funding from gaming revenues is mandated by statue to be used to reduce the
resident and nonresident wage tax rate. Gaming revenues were first used to reduce the wage tax rates in 2009. Revenues from gaming revenues were $86.545 million in FY2009, $86.270 million in FY2010 and are projected to be $86.277 million in FY2011. Accordingly, the wage tax rates in 2009, 2010 and 2011 reflect a rate reduction due to these revenues.
In the Seventeenth Five-Year Plan, the Mayor approved further reductions in this tax rate for each
of the Fiscal Years 2009-2013. The Seventeenth Five-Year Plan approved reducing the wage tax from the Fiscal Year 2008 level of 4.2190% for residents and 3.7242% for non-residents to 3.60% for residents and 3.25% for non-residents by Fiscal Year 2013. These reduced rates include rate reductions funded with Commonwealth funds from gaming proceeds. In Fiscal Year 2009 there were two rate reductions: one that took effect July 1, 2008 and the other that took effect January 1, 2009. The Eighteenth Five-Year Plan suspended future City-funded rate reductions until Fiscal Year 2015. The Nineteenth Five-Year Plan suspended City-funded rate reductions until Fiscal Year 2014, and the Twentieth Five-Year Plan continues to suspend the City-funded rate reductions until Fiscal Year 2014.
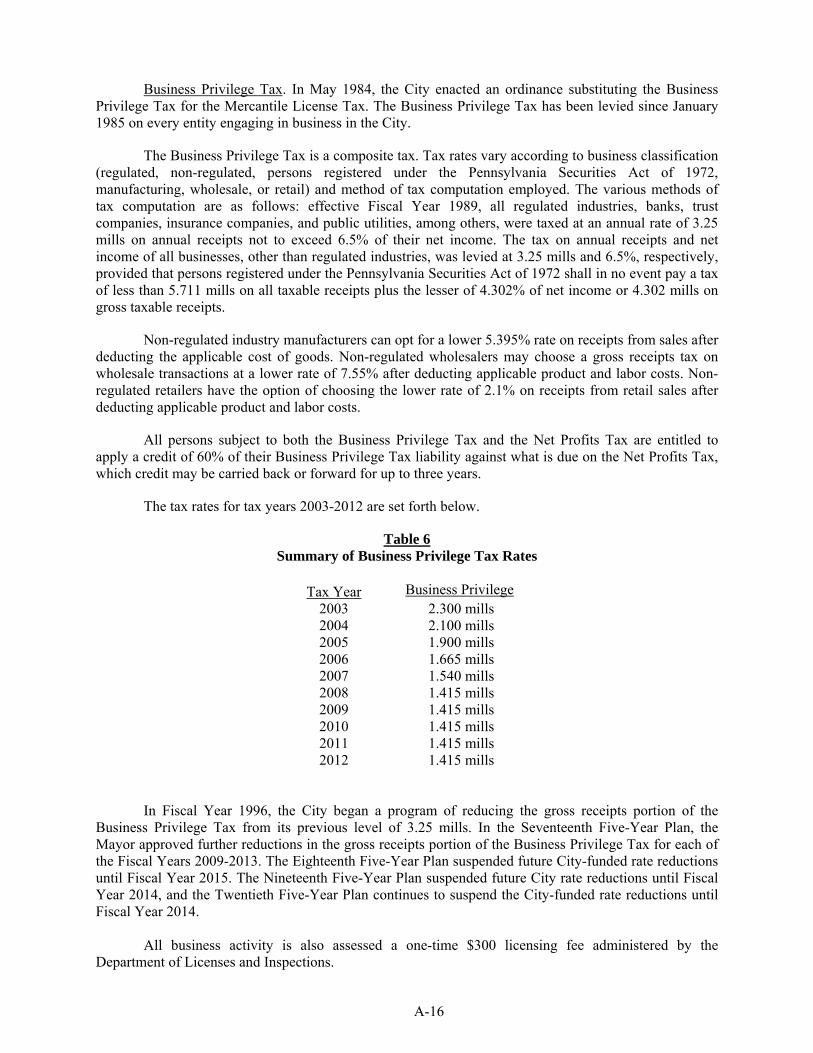
A-16
Business Privilege Tax. In May 1984, the City enacted an ordinance substituting the Business Privilege Tax for the Mercantile License Tax. The Business Privilege Tax has been levied since January 1985 on every entity engaging in business in the City.
The Business Privilege Tax is a composite tax. Tax rates vary according to business classification (regulated, non-regulated, persons registered under the Pennsylvania Securities Act of 1972, manufacturing, wholesale, or retail) and method of tax computation employed. The various methods of tax computation are as follows: effective Fiscal Year 1989, all regulated industries, banks, trust companies, insurance companies, and public utilities, among others, were taxed at an annual rate of 3.25 mills on annual receipts not to exceed 6.5% of their net income. The tax on annual receipts and net income of all businesses, other than regulated industries, was levied at 3.25 mills and 6.5%, respectively, provided that persons registered under the Pennsylvania Securities Act of 1972 shall in no event pay a tax of less than 5.711 mills on all taxable receipts plus the lesser of 4.302% of net income or 4.302 mills on gross taxable receipts.
Non-regulated industry manufacturers can opt for a lower 5.395% rate on receipts from sales after deducting the applicable cost of goods. Non-regulated wholesalers may choose a gross receipts tax on wholesale transactions at a lower rate of 7.55% after deducting applicable product and labor costs. Non-regulated retailers have the option of choosing the lower rate of 2.1% on receipts from retail sales after deducting applicable product and labor costs.
All persons subject to both the Business Privilege Tax and the Net Profits Tax are entitled to apply a credit of 60% of their Business Privilege Tax liability against what is due on the Net Profits Tax, which credit may be carried back or forward for up to three years.
The tax rates for tax years 2003-2012 are set forth below.
Table 6 Summary of Business Privilege Tax Rates
Tax Year Business Privilege
2003 2.300 mills 2004 2.100 mills 2005 1.900 mills 2006 1.665 mills 2007 1.540 mills 2008 1.415 mills 2009 1.415 mills 2010 1.415 mills 2011 1.415 mills 2012 1.415 mills
In Fiscal Year 1996, the City began a program of reducing the gross receipts portion of the Business Privilege Tax from its previous level of 3.25 mills. In the Seventeenth Five-Year Plan, the Mayor approved further reductions in the gross receipts portion of the Business Privilege Tax for each of the Fiscal Years 2009-2013. The Eighteenth Five-Year Plan suspended future City-funded rate reductions until Fiscal Year 2015. The Nineteenth Five-Year Plan suspended future City rate reductions until Fiscal Year 2014, and the Twentieth Five-Year Plan continues to suspend the City-funded rate reductions until Fiscal Year 2014.
All business activity is also assessed a one-time $300 licensing fee administered by the
Department of Licenses and Inspections.
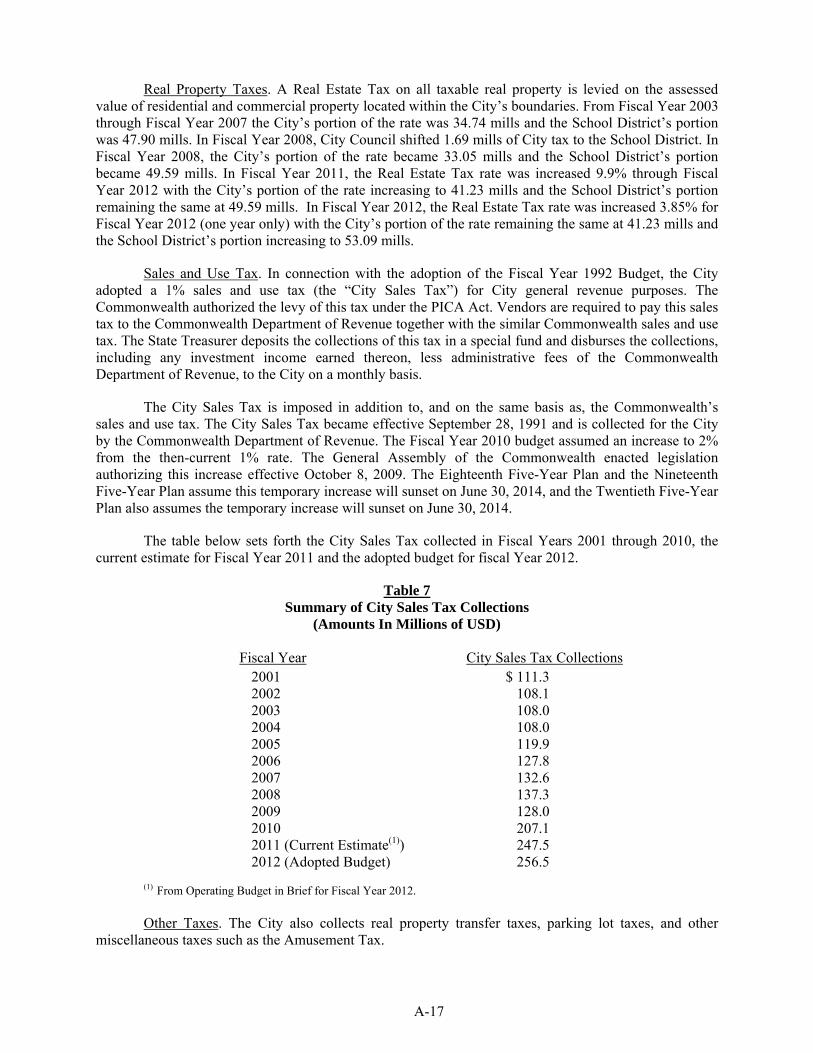
A-17
Real Property Taxes. A Real Estate Tax on all taxable real property is levied on the assessed value of residential and commercial property located within the City’s boundaries. From Fiscal Year 2003 through Fiscal Year 2007 the City’s portion of the rate was 34.74 mills and the School District’s portion was 47.90 mills. In Fiscal Year 2008, City Council shifted 1.69 mills of City tax to the School District. In Fiscal Year 2008, the City’s portion of the rate became 33.05 mills and the School District’s portion became 49.59 mills. In Fiscal Year 2011, the Real Estate Tax rate was increased 9.9% through Fiscal Year 2012 with the City’s portion of the rate increasing to 41.23 mills and the School District’s portion remaining the same at 49.59 mills. In Fiscal Year 2012, the Real Estate Tax rate was increased 3.85% for Fiscal Year 2012 (one year only) with the City’s portion of the rate remaining the same at 41.23 mills and the School District’s portion increasing to 53.09 mills.
Sales and Use Tax. In connection with the adoption of the Fiscal Year 1992 Budget, the City adopted a 1% sales and use tax (the “City Sales Tax”) for City general revenue purposes. The Commonwealth authorized the levy of this tax under the PICA Act. Vendors are required to pay this sales tax to the Commonwealth Department of Revenue together with the similar Commonwealth sales and use tax. The State Treasurer deposits the collections of this tax in a special fund and disburses the collections, including any investment income earned thereon, less administrative fees of the Commonwealth Department of Revenue, to the City on a monthly basis.
The City Sales Tax is imposed in addition to, and on the same basis as, the Commonwealth’s sales and use tax. The City Sales Tax became effective September 28, 1991 and is collected for the City by the Commonwealth Department of Revenue. The Fiscal Year 2010 budget assumed an increase to 2% from the then-current 1% rate. The General Assembly of the Commonwealth enacted legislation authorizing this increase effective October 8, 2009. The Eighteenth Five-Year Plan and the Nineteenth Five-Year Plan assume this temporary increase will sunset on June 30, 2014, and the Twentieth Five-Year Plan also assumes the temporary increase will sunset on June 30, 2014.
The table below sets forth the City Sales Tax collected in Fiscal Years 2001 through 2010, the current estimate for Fiscal Year 2011 and the adopted budget for fiscal Year 2012.
Table 7 Summary of City Sales Tax Collections
(Amounts In Millions of USD)
Fiscal Year City Sales Tax Collections 2001 $ 111.3 2002 108.1 2003 108.0 2004 108.0 2005 119.9 2006 127.8 2007 132.6 2008 137.3 2009 128.0 2010 207.1 2011 (Current Estimate(1)) 247.5
2012 (Adopted Budget) 256.5
(1) From Operating Budget in Brief for Fiscal Year 2012. Other Taxes. The City also collects real property transfer taxes, parking lot taxes, and other
miscellaneous taxes such as the Amusement Tax.
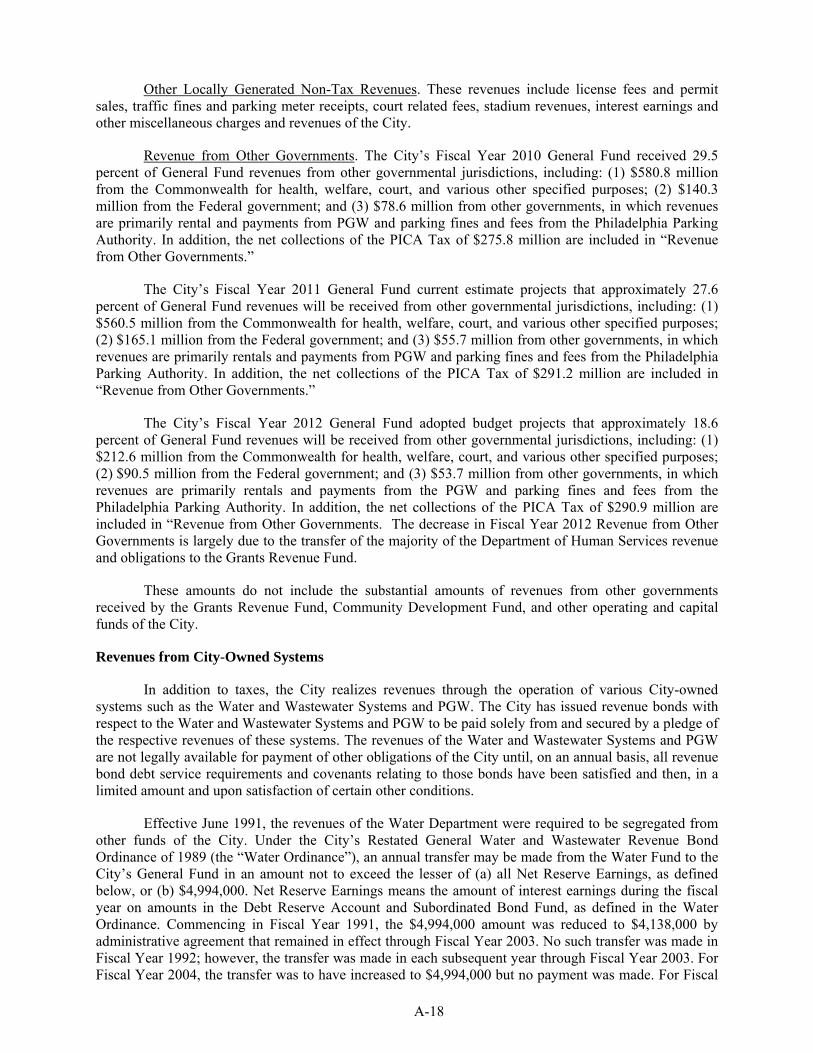
A-18
Other Locally Generated Non-Tax Revenues. These revenues include license fees and permit sales, traffic fines and parking meter receipts, court related fees, stadium revenues, interest earnings and other miscellaneous charges and revenues of the City.
Revenue from Other Governments. The City’s Fiscal Year 2010 General Fund received 29.5 percent of General Fund revenues from other governmental jurisdictions, including: (1) $580.8 million from the Commonwealth for health, welfare, court, and various other specified purposes; (2) $140.3 million from the Federal government; and (3) $78.6 million from other governments, in which revenues are primarily rental and payments from PGW and parking fines and fees from the Philadelphia Parking Authority. In addition, the net collections of the PICA Tax of $275.8 million are included in “Revenue from Other Governments.”
The City’s Fiscal Year 2011 General Fund current estimate projects that approximately 27.6 percent of General Fund revenues will be received from other governmental jurisdictions, including: (1) $560.5 million from the Commonwealth for health, welfare, court, and various other specified purposes; (2) $165.1 million from the Federal government; and (3) $55.7 million from other governments, in which revenues are primarily rentals and payments from PGW and parking fines and fees from the Philadelphia Parking Authority. In addition, the net collections of the PICA Tax of $291.2 million are included in “Revenue from Other Governments.”
The City’s Fiscal Year 2012 General Fund adopted budget projects that approximately 18.6 percent of General Fund revenues will be received from other governmental jurisdictions, including: (1) $212.6 million from the Commonwealth for health, welfare, court, and various other specified purposes; (2) $90.5 million from the Federal government; and (3) $53.7 million from other governments, in which revenues are primarily rentals and payments from the PGW and parking fines and fees from the Philadelphia Parking Authority. In addition, the net collections of the PICA Tax of $290.9 million are included in “Revenue from Other Governments. The decrease in Fiscal Year 2012 Revenue from Other Governments is largely due to the transfer of the majority of the Department of Human Services revenue and obligations to the Grants Revenue Fund.
These amounts do not include the substantial amounts of revenues from other governments received by the Grants Revenue Fund, Community Development Fund, and other operating and capital funds of the City.
Revenues from City-Owned Systems
In addition to taxes, the City realizes revenues through the operation of various City-owned systems such as the Water and Wastewater Systems and PGW. The City has issued revenue bonds with respect to the Water and Wastewater Systems and PGW to be paid solely from and secured by a pledge of the respective revenues of these systems. The revenues of the Water and Wastewater Systems and PGW are not legally available for payment of other obligations of the City until, on an annual basis, all revenue bond debt service requirements and covenants relating to those bonds have been satisfied and then, in a limited amount and upon satisfaction of certain other conditions.
Effective June 1991, the revenues of the Water Department were required to be segregated from other funds of the City. Under the City’s Restated General Water and Wastewater Revenue Bond Ordinance of 1989 (the “Water Ordinance”), an annual transfer may be made from the Water Fund to the City’s General Fund in an amount not to exceed the lesser of (a) all Net Reserve Earnings, as defined below, or (b) $4,994,000. Net Reserve Earnings means the amount of interest earnings during the fiscal year on amounts in the Debt Reserve Account and Subordinated Bond Fund, as defined in the Water Ordinance. Commencing in Fiscal Year 1991, the $4,994,000 amount was reduced to $4,138,000 by administrative agreement that remained in effect through Fiscal Year 2003. No such transfer was made in Fiscal Year 1992; however, the transfer was made in each subsequent year through Fiscal Year 2003. For Fiscal Year 2004, the transfer was to have increased to $4,994,000 but no payment was made. For Fiscal
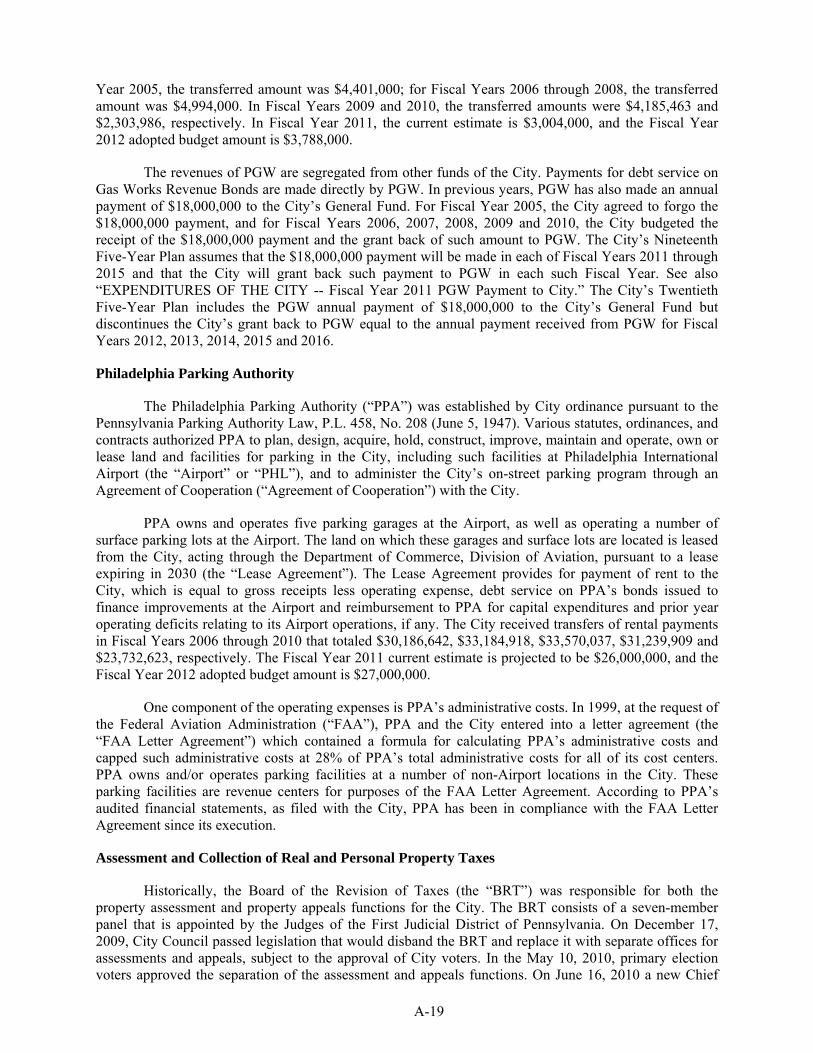
A-19
Year 2005, the transferred amount was $4,401,000; for Fiscal Years 2006 through 2008, the transferred amount was $4,994,000. In Fiscal Years 2009 and 2010, the transferred amounts were $4,185,463 and $2,303,986, respectively. In Fiscal Year 2011, the current estimate is $3,004,000, and the Fiscal Year 2012 adopted budget amount is $3,788,000.
The revenues of PGW are segregated from other funds of the City. Payments for debt service on Gas Works Revenue Bonds are made directly by PGW. In previous years, PGW has also made an annual payment of $18,000,000 to the City’s General Fund. For Fiscal Year 2005, the City agreed to forgo the $18,000,000 payment, and for Fiscal Years 2006, 2007, 2008, 2009 and 2010, the City budgeted the receipt of the $18,000,000 payment and the grant back of such amount to PGW. The City’s Nineteenth Five-Year Plan assumes that the $18,000,000 payment will be made in each of Fiscal Years 2011 through 2015 and that the City will grant back such payment to PGW in each such Fiscal Year. See also “EXPENDITURES OF THE CITY -- Fiscal Year 2011 PGW Payment to City.” The City’s Twentieth Five-Year Plan includes the PGW annual payment of $18,000,000 to the City’s General Fund but discontinues the City’s grant back to PGW equal to the annual payment received from PGW for Fiscal Years 2012, 2013, 2014, 2015 and 2016.
Philadelphia Parking Authority
The Philadelphia Parking Authority (“PPA”) was established by City ordinance pursuant to the Pennsylvania Parking Authority Law, P.L. 458, No. 208 (June 5, 1947). Various statutes, ordinances, and contracts authorized PPA to plan, design, acquire, hold, construct, improve, maintain and operate, own or lease land and facilities for parking in the City, including such facilities at Philadelphia International Airport (the “Airport” or “PHL”), and to administer the City’s on-street parking program through an Agreement of Cooperation (“Agreement of Cooperation”) with the City.
PPA owns and operates five parking garages at the Airport, as well as operating a number of surface parking lots at the Airport. The land on which these garages and surface lots are located is leased from the City, acting through the Department of Commerce, Division of Aviation, pursuant to a lease expiring in 2030 (the “Lease Agreement”). The Lease Agreement provides for payment of rent to the City, which is equal to gross receipts less operating expense, debt service on PPA’s bonds issued to finance improvements at the Airport and reimbursement to PPA for capital expenditures and prior year operating deficits relating to its Airport operations, if any. The City received transfers of rental payments in Fiscal Years 2006 through 2010 that totaled $30,186,642, $33,184,918, $33,570,037, $31,239,909 and $23,732,623, respectively. The Fiscal Year 2011 current estimate is projected to be $26,000,000, and the Fiscal Year 2012 adopted budget amount is $27,000,000.
One component of the operating expenses is PPA’s administrative costs. In 1999, at the request of the Federal Aviation Administration (“FAA”), PPA and the City entered into a letter agreement (the “FAA Letter Agreement”) which contained a formula for calculating PPA’s administrative costs and capped such administrative costs at 28% of PPA’s total administrative costs for all of its cost centers. PPA owns and/or operates parking facilities at a number of non-Airport locations in the City. These parking facilities are revenue centers for purposes of the FAA Letter Agreement. According to PPA’s audited financial statements, as filed with the City, PPA has been in compliance with the FAA Letter Agreement since its execution.
Assessment and Collection of Real and Personal Property Taxes
Historically, the Board of the Revision of Taxes (the “BRT”) was responsible for both the property assessment and property appeals functions for the City. The BRT consists of a seven-member panel that is appointed by the Judges of the First Judicial District of Pennsylvania. On December 17, 2009, City Council passed legislation that would disband the BRT and replace it with separate offices for assessments and appeals, subject to the approval of City voters. In the May 10, 2010, primary election voters approved the separation of the assessment and appeals functions. On June 16, 2010 a new Chief
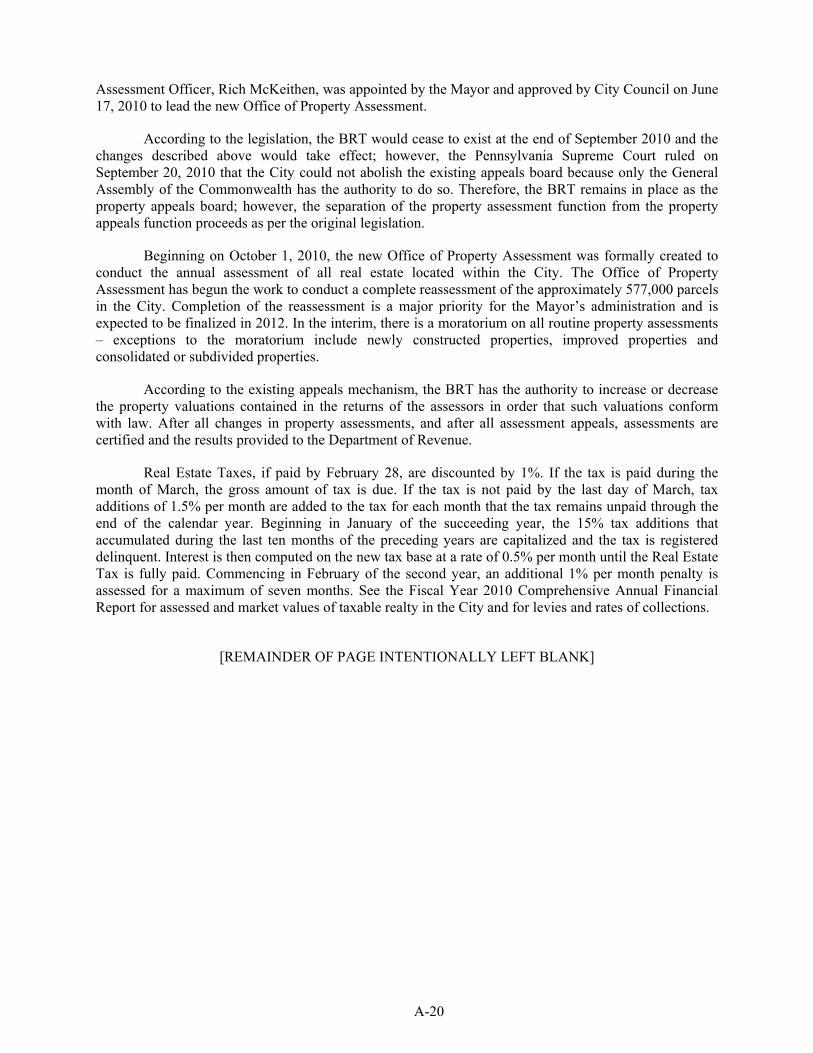
A-20
Assessment Officer, Rich McKeithen, was appointed by the Mayor and approved by City Council on June 17, 2010 to lead the new Office of Property Assessment.
According to the legislation, the BRT would cease to exist at the end of September 2010 and the changes described above would take effect; however, the Pennsylvania Supreme Court ruled on September 20, 2010 that the City could not abolish the existing appeals board because only the General Assembly of the Commonwealth has the authority to do so. Therefore, the BRT remains in place as the property appeals board; however, the separation of the property assessment function from the property appeals function proceeds as per the original legislation.
Beginning on October 1, 2010, the new Office of Property Assessment was formally created to conduct the annual assessment of all real estate located within the City. The Office of Property Assessment has begun the work to conduct a complete reassessment of the approximately 577,000 parcels in the City. Completion of the reassessment is a major priority for the Mayor’s administration and is expected to be finalized in 2012. In the interim, there is a moratorium on all routine property assessments – exceptions to the moratorium include newly constructed properties, improved properties and consolidated or subdivided properties.
According to the existing appeals mechanism, the BRT has the authority to increase or decrease the property valuations contained in the returns of the assessors in order that such valuations conform with law. After all changes in property assessments, and after all assessment appeals, assessments are certified and the results provided to the Department of Revenue.
Real Estate Taxes, if paid by February 28, are discounted by 1%. If the tax is paid during the month of March, the gross amount of tax is due. If the tax is not paid by the last day of March, tax additions of 1.5% per month are added to the tax for each month that the tax remains unpaid through the end of the calendar year. Beginning in January of the succeeding year, the 15% tax additions that accumulated during the last ten months of the preceding years are capitalized and the tax is registered delinquent. Interest is then computed on the new tax base at a rate of 0.5% per month until the Real Estate Tax is fully paid. Commencing in February of the second year, an additional 1% per month penalty is assessed for a maximum of seven months. See the Fiscal Year 2010 Comprehensive Annual Financial Report for assessed and market values of taxable realty in the City and for levies and rates of collections.
[REMAINDER OF PAGE INTENTIONALLY LEFT BLANK]
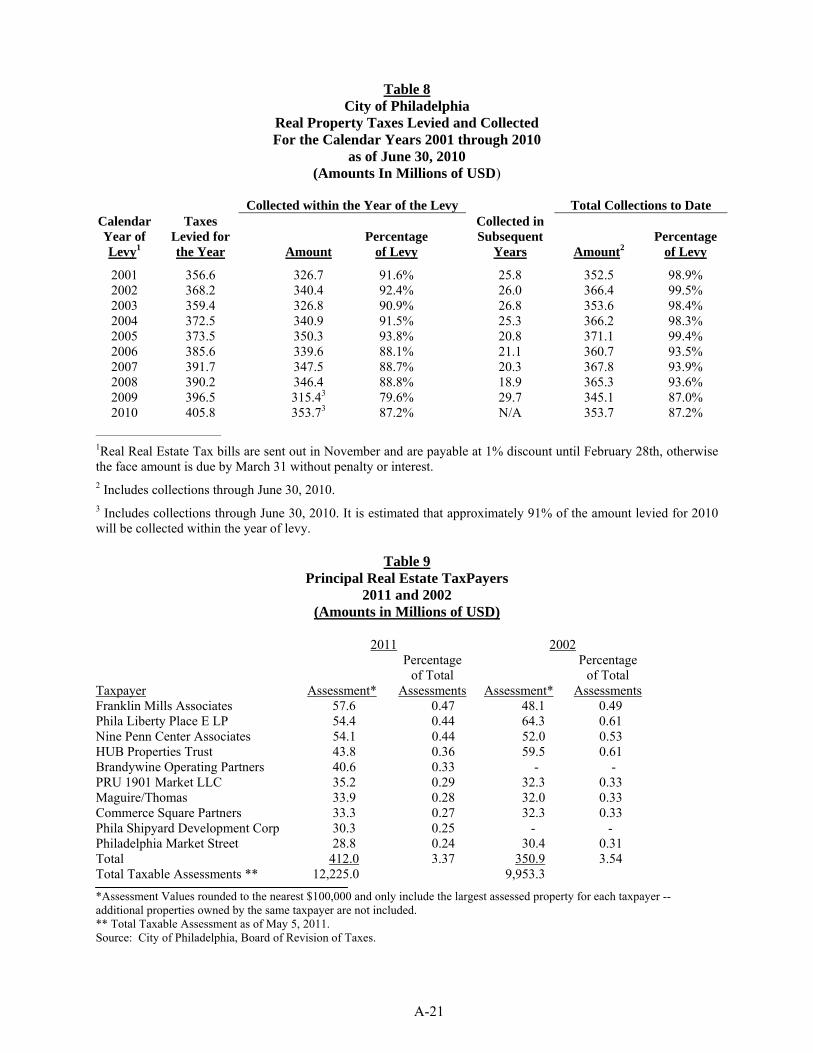
A-21
Table 8 City of Philadelphia
Real Property Taxes Levied and Collected For the Calendar Years 2001 through 2010
as of June 30, 2010 (Amounts In Millions of USD)
Collected within the Year of the Levy Total Collections to Date Calendar Year of Levy1
Taxes Levied for the Year
Amount Percentage
of Levy
Collected in Subsequent
Years Amount2 Percentage
of Levy
2001 356.6 326.7 91.6% 25.8 352.5 98.9% 2002 368.2 340.4 92.4% 26.0 366.4 99.5% 2003 359.4 326.8 90.9% 26.8 353.6 98.4% 2004 372.5 340.9 91.5% 25.3 366.2 98.3% 2005 373.5 350.3 93.8% 20.8 371.1 99.4% 2006 385.6 339.6 88.1% 21.1 360.7 93.5% 2007 391.7 347.5 88.7% 20.3 367.8 93.9% 2008 390.2 346.4 88.8% 18.9 365.3 93.6% 2009 396.5 315.43 79.6% 29.7 345.1 87.0% 2010 405.8 353.73 87.2% N/A 353.7 87.2%
_____________________________
1Real Real Estate Tax bills are sent out in November and are payable at 1% discount until February 28th, otherwise the face amount is due by March 31 without penalty or interest. 2 Includes collections through June 30, 2010. 3 Includes collections through June 30, 2010. It is estimated that approximately 91% of the amount levied for 2010 will be collected within the year of levy.
Table 9
Principal Real Estate TaxPayers 2011 and 2002
(Amounts in Millions of USD)
2011 2002 Percentage Percentage of Total of Total Taxpayer Assessment* Assessments Assessment* Assessments Franklin Mills Associates 57.6 0.47 48.1 0.49 Phila Liberty Place E LP 54.4 0.44 64.3 0.61 Nine Penn Center Associates 54.1 0.44 52.0 0.53 HUB Properties Trust 43.8 0.36 59.5 0.61 Brandywine Operating Partners 40.6 0.33 - - PRU 1901 Market LLC 35.2 0.29 32.3 0.33 Maguire/Thomas 33.9 0.28 32.0 0.33 Commerce Square Partners 33.3 0.27 32.3 0.33 Phila Shipyard Development Corp 30.3 0.25 - - Philadelphia Market Street 28.8 0.24 30.4 0.31 Total 412.0 3.37 350.9 3.54 Total Taxable Assessments ** 12,225.0 9,953.3
*Assessment Values rounded to the nearest $100,000 and only include the largest assessed property for each taxpayer -- additional properties owned by the same taxpayer are not included. ** Total Taxable Assessment as of May 5, 2011. Source: City of Philadelphia, Board of Revision of Taxes.
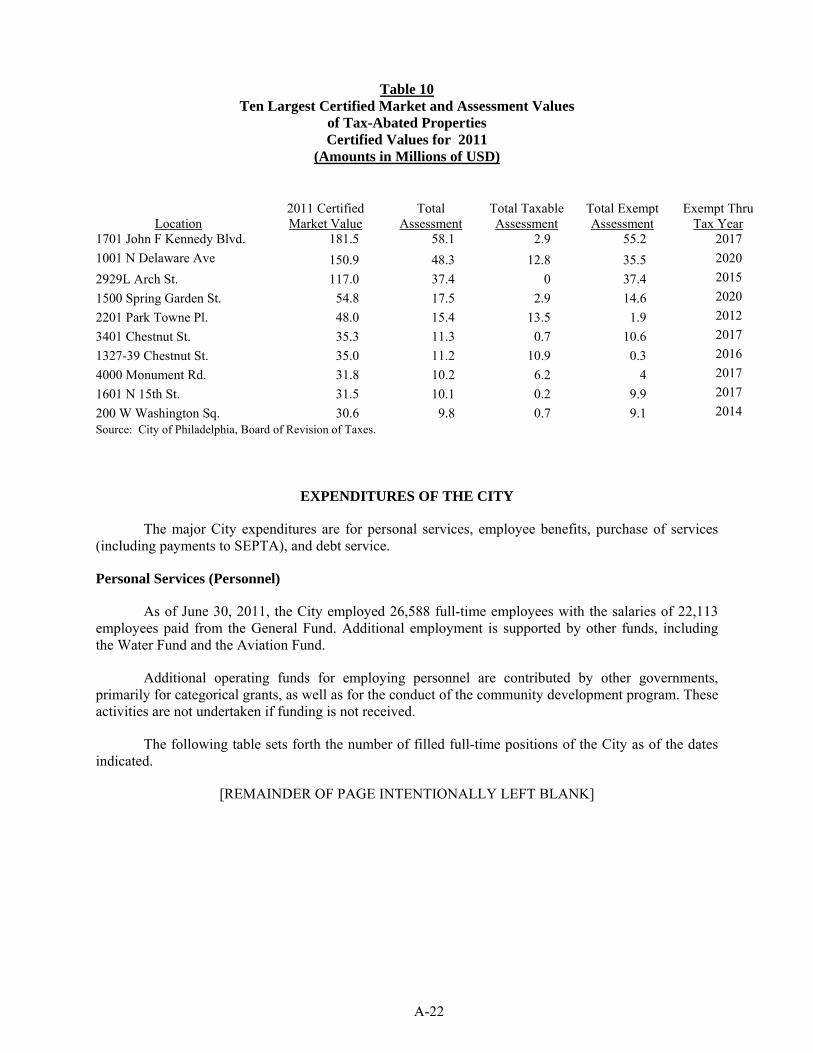
A-22
Table 10 Ten Largest Certified Market and Assessment Values
of Tax-Abated Properties Certified Values for 2011
(Amounts in Millions of USD)
Location
2011 Certified Market Value
Total Assessment
Total Taxable Assessment
Total Exempt Assessment
Exempt Thru
Tax Year 1701 John F Kennedy Blvd. 181.5 58.1 2.9 55.2 2017
1001 N Delaware Ave 150.9 48.3 12.8 35.5 2020
2929L Arch St. 117.0 37.4 0 37.4 2015
1500 Spring Garden St. 54.8 17.5 2.9 14.6 2020
2201 Park Towne Pl. 48.0 15.4 13.5 1.9 2012
3401 Chestnut St. 35.3 11.3 0.7 10.6 2017
1327-39 Chestnut St. 35.0 11.2 10.9 0.3 2016
4000 Monument Rd. 31.8 10.2 6.2 4 2017
1601 N 15th St. 31.5 10.1 0.2 9.9 2017
200 W Washington Sq. 30.6 9.8 0.7 9.1 2014 Source: City of Philadelphia, Board of Revision of Taxes.
EXPENDITURES OF THE CITY
The major City expenditures are for personal services, employee benefits, purchase of services (including payments to SEPTA), and debt service.
Personal Services (Personnel)
As of June 30, 2011, the City employed 26,588 full-time employees with the salaries of 22,113 employees paid from the General Fund. Additional employment is supported by other funds, including the Water Fund and the Aviation Fund.
Additional operating funds for employing personnel are contributed by other governments, primarily for categorical grants, as well as for the conduct of the community development program. These activities are not undertaken if funding is not received.
The following table sets forth the number of filled full-time positions of the City as of the dates indicated.
[REMAINDER OF PAGE INTENTIONALLY LEFT BLANK]
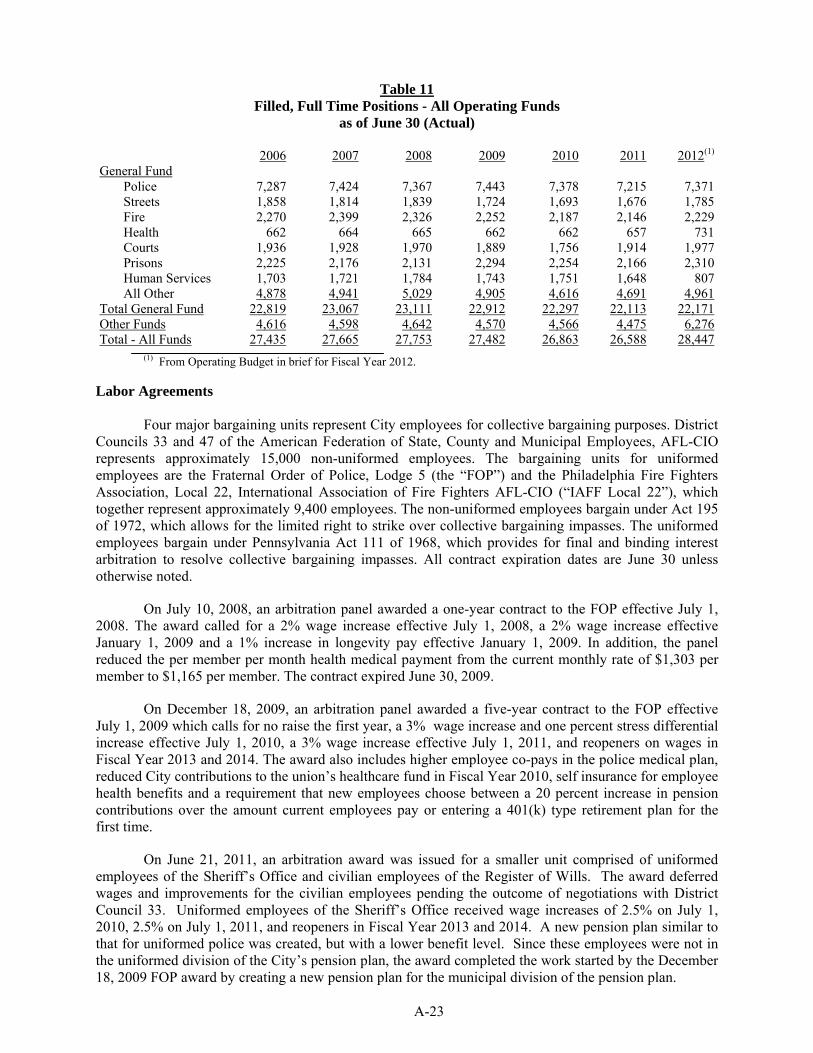
A-23
Table 11 Filled, Full Time Positions - All Operating Funds
as of June 30 (Actual)
2006 2007 2008 2009 2010 2011 2012(1) General Fund
Police 7,287 7,424 7,367 7,443 7,378 7,215 7,371 Streets 1,858 1,814 1,839 1,724 1,693 1,676 1,785 Fire 2,270 2,399 2,326 2,252 2,187 2,146 2,229 Health 662 664 665 662 662 657 731 Courts 1,936 1,928 1,970 1,889 1,756 1,914 1,977 Prisons 2,225 2,176 2,131 2,294 2,254 2,166 2,310 Human Services 1,703 1,721 1,784 1,743 1,751 1,648 807 All Other 4,878 4,941 5,029 4,905 4,616 4,691 4,961
Total General Fund 22,819 23,067 23,111 22,912 22,297 22,113 22,171 Other Funds 4,616 4,598 4,642 4,570 4,566 4,475 6,276 Total - All Funds 27,435 27,665 27,753 27,482 26,863 26,588 28,447
(1) From Operating Budget in brief for Fiscal Year 2012.
Labor Agreements Four major bargaining units represent City employees for collective bargaining purposes. District
Councils 33 and 47 of the American Federation of State, County and Municipal Employees, AFL-CIO represents approximately 15,000 non-uniformed employees. The bargaining units for uniformed employees are the Fraternal Order of Police, Lodge 5 (the “FOP”) and the Philadelphia Fire Fighters Association, Local 22, International Association of Fire Fighters AFL-CIO (“IAFF Local 22”), which together represent approximately 9,400 employees. The non-uniformed employees bargain under Act 195 of 1972, which allows for the limited right to strike over collective bargaining impasses. The uniformed employees bargain under Pennsylvania Act 111 of 1968, which provides for final and binding interest arbitration to resolve collective bargaining impasses. All contract expiration dates are June 30 unless otherwise noted.
On July 10, 2008, an arbitration panel awarded a one-year contract to the FOP effective July 1, 2008. The award called for a 2% wage increase effective July 1, 2008, a 2% wage increase effective January 1, 2009 and a 1% increase in longevity pay effective January 1, 2009. In addition, the panel reduced the per member per month health medical payment from the current monthly rate of $1,303 per member to $1,165 per member. The contract expired June 30, 2009.
On December 18, 2009, an arbitration panel awarded a five-year contract to the FOP effective July 1, 2009 which calls for no raise the first year, a 3% wage increase and one percent stress differential increase effective July 1, 2010, a 3% wage increase effective July 1, 2011, and reopeners on wages in Fiscal Year 2013 and 2014. The award also includes higher employee co-pays in the police medical plan, reduced City contributions to the union’s healthcare fund in Fiscal Year 2010, self insurance for employee health benefits and a requirement that new employees choose between a 20 percent increase in pension contributions over the amount current employees pay or entering a 401(k) type retirement plan for the first time.
On June 21, 2011, an arbitration award was issued for a smaller unit comprised of uniformed employees of the Sheriff’s Office and civilian employees of the Register of Wills. The award deferred wages and improvements for the civilian employees pending the outcome of negotiations with District Council 33. Uniformed employees of the Sheriff’s Office received wage increases of 2.5% on July 1, 2010, 2.5% on July 1, 2011, and reopeners in Fiscal Year 2013 and 2014. A new pension plan similar to that for uniformed police was created, but with a lower benefit level. Since these employees were not in the uniformed division of the City’s pension plan, the award completed the work started by the December 18, 2009 FOP award by creating a new pension plan for the municipal division of the pension plan.
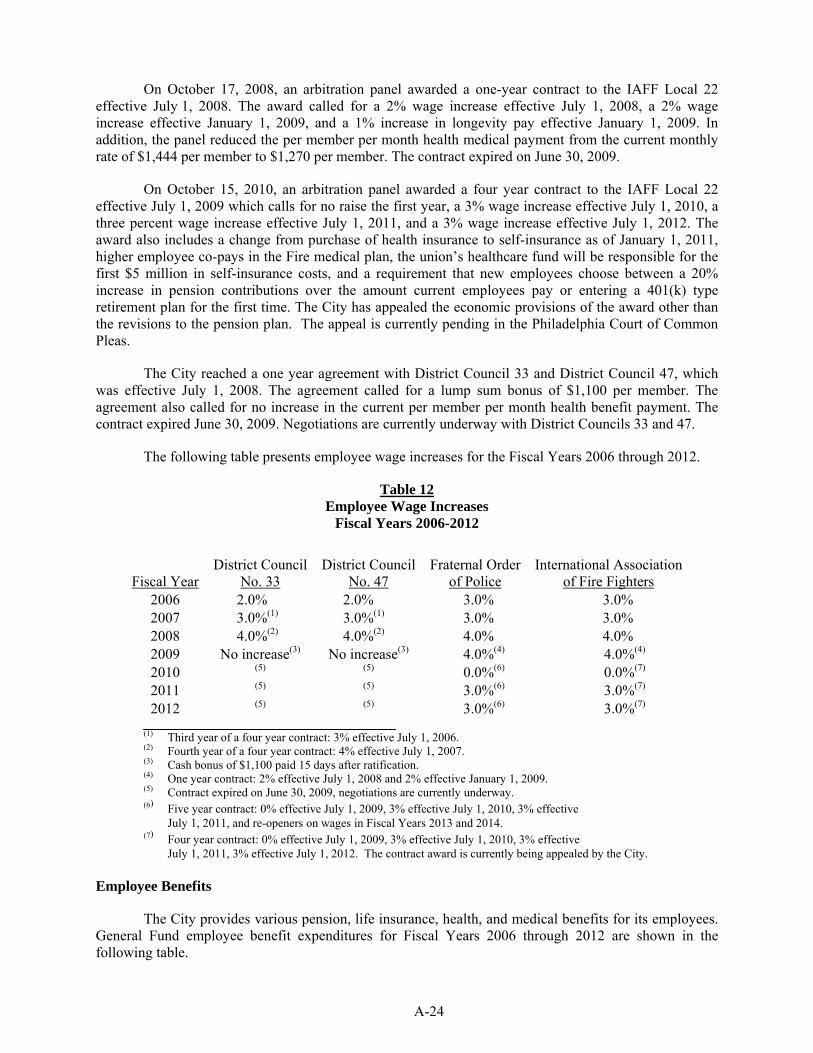
A-24
On October 17, 2008, an arbitration panel awarded a one-year contract to the IAFF Local 22 effective July 1, 2008. The award called for a 2% wage increase effective July 1, 2008, a 2% wage increase effective January 1, 2009, and a 1% increase in longevity pay effective January 1, 2009. In addition, the panel reduced the per member per month health medical payment from the current monthly rate of $1,444 per member to $1,270 per member. The contract expired on June 30, 2009.
On October 15, 2010, an arbitration panel awarded a four year contract to the IAFF Local 22 effective July 1, 2009 which calls for no raise the first year, a 3% wage increase effective July 1, 2010, a three percent wage increase effective July 1, 2011, and a 3% wage increase effective July 1, 2012. The award also includes a change from purchase of health insurance to self-insurance as of January 1, 2011, higher employee co-pays in the Fire medical plan, the union’s healthcare fund will be responsible for the first $5 million in self-insurance costs, and a requirement that new employees choose between a 20% increase in pension contributions over the amount current employees pay or entering a 401(k) type retirement plan for the first time. The City has appealed the economic provisions of the award other than the revisions to the pension plan. The appeal is currently pending in the Philadelphia Court of Common Pleas.
The City reached a one year agreement with District Council 33 and District Council 47, which was effective July 1, 2008. The agreement called for a lump sum bonus of $1,100 per member. The agreement also called for no increase in the current per member per month health benefit payment. The contract expired June 30, 2009. Negotiations are currently underway with District Councils 33 and 47.
The following table presents employee wage increases for the Fiscal Years 2006 through 2012.
Table 12 Employee Wage Increases
Fiscal Years 2006-2012
Fiscal Year
District Council No. 33
District Council No. 47
Fraternal Order
of Police International Association
of Fire Fighters 2006 2.0% 2.0% 3.0% 3.0% 2007 3.0%(1) 3.0%(1) 3.0% 3.0% 2008 4.0%(2) 4.0%(2) 4.0% 4.0% 2009 2010 2011
No increase(3)
(5)
(5)
No increase(3)
(5)
(5)
4.0%(4) 0.0%(6)
3.0%(6)
4.0%(4)
0.0%(7) 3.0%(7)
2012 (5) (5) 3.0%(6) 3.0%(7) (1) Third year of a four year contract: 3% effective July 1, 2006. (2) Fourth year of a four year contract: 4% effective July 1, 2007. (3) Cash bonus of $1,100 paid 15 days after ratification. (4) One year contract: 2% effective July 1, 2008 and 2% effective January 1, 2009. (5) Contract expired on June 30, 2009, negotiations are currently underway. (6) Five year contract: 0% effective July 1, 2009, 3% effective July 1, 2010, 3% effective July 1, 2011, and re-openers on wages in Fiscal Years 2013 and 2014. (7) Four year contract: 0% effective July 1, 2009, 3% effective July 1, 2010, 3% effective
July 1, 2011, 3% effective July 1, 2012. The contract award is currently being appealed by the City. Employee Benefits
The City provides various pension, life insurance, health, and medical benefits for its employees. General Fund employee benefit expenditures for Fiscal Years 2006 through 2012 are shown in the following table.
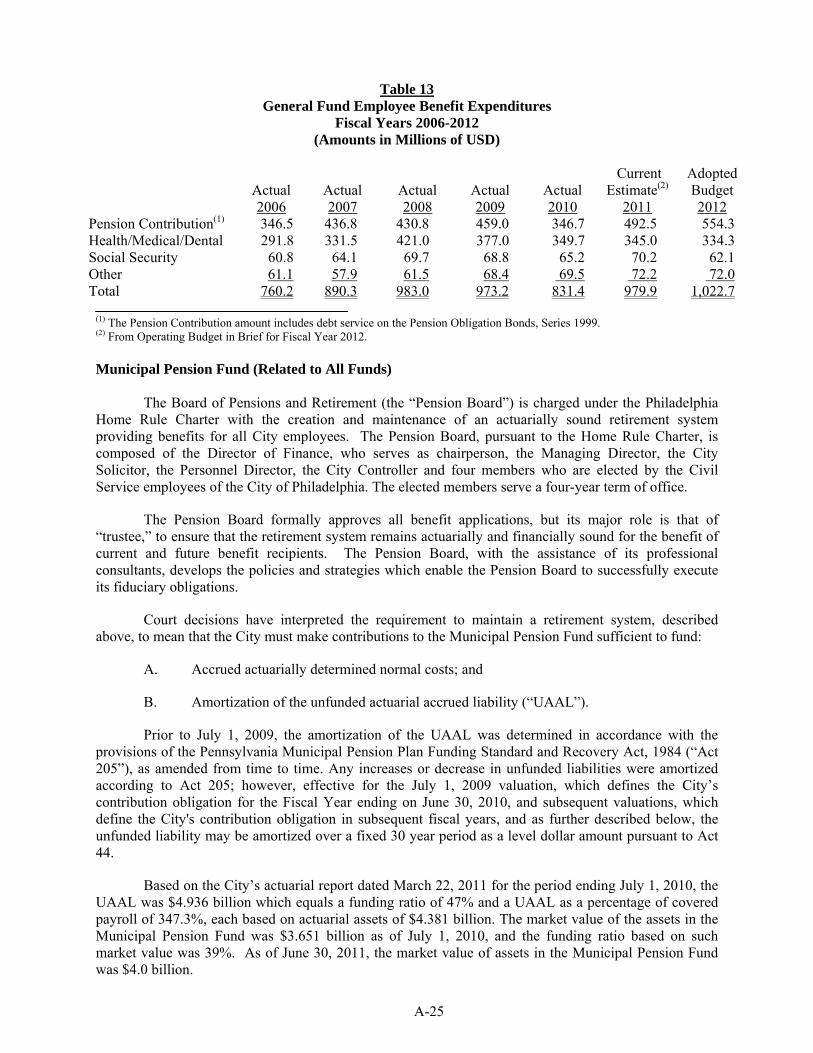
A-25
Table 13 General Fund Employee Benefit Expenditures
Fiscal Years 2006-2012 (Amounts in Millions of USD)
Actual Actual Actual
Actual
Actual Current
Estimate(2) Adopted Budget
2006 2007 2008 2009 2010 2011 2012 Pension Contribution(1) 346.5 436.8 430.8 459.0 346.7 492.5 554.3 Health/Medical/Dental 291.8 331.5 421.0 377.0 349.7 345.0 334.3 Social Security 60.8 64.1 69.7 68.8 65.2 70.2 62.1 Other 61.1 57.9 61.5 68.4 69.5 72.2 72.0 Total 760.2 890.3 983.0 973.2 831.4 979.9 1,022.7
(1) The Pension Contribution amount includes debt service on the Pension Obligation Bonds, Series 1999. (2) From Operating Budget in Brief for Fiscal Year 2012. Municipal Pension Fund (Related to All Funds)
The Board of Pensions and Retirement (the “Pension Board”) is charged under the Philadelphia
Home Rule Charter with the creation and maintenance of an actuarially sound retirement system providing benefits for all City employees. The Pension Board, pursuant to the Home Rule Charter, is composed of the Director of Finance, who serves as chairperson, the Managing Director, the City Solicitor, the Personnel Director, the City Controller and four members who are elected by the Civil Service employees of the City of Philadelphia. The elected members serve a four-year term of office.
The Pension Board formally approves all benefit applications, but its major role is that of “trustee,” to ensure that the retirement system remains actuarially and financially sound for the benefit of current and future benefit recipients. The Pension Board, with the assistance of its professional consultants, develops the policies and strategies which enable the Pension Board to successfully execute its fiduciary obligations.
Court decisions have interpreted the requirement to maintain a retirement system, described above, to mean that the City must make contributions to the Municipal Pension Fund sufficient to fund:
A. Accrued actuarially determined normal costs; and
B. Amortization of the unfunded actuarial accrued liability (“UAAL”).
Prior to July 1, 2009, the amortization of the UAAL was determined in accordance with the provisions of the Pennsylvania Municipal Pension Plan Funding Standard and Recovery Act, 1984 (“Act 205”), as amended from time to time. Any increases or decrease in unfunded liabilities were amortized according to Act 205; however, effective for the July 1, 2009 valuation, which defines the City’s contribution obligation for the Fiscal Year ending on June 30, 2010, and subsequent valuations, which define the City's contribution obligation in subsequent fiscal years, and as further described below, the unfunded liability may be amortized over a fixed 30 year period as a level dollar amount pursuant to Act 44.
Based on the City’s actuarial report dated March 22, 2011 for the period ending July 1, 2010, the UAAL was $4.936 billion which equals a funding ratio of 47% and a UAAL as a percentage of covered payroll of 347.3%, each based on actuarial assets of $4.381 billion. The market value of the assets in the Municipal Pension Fund was $3.651 billion as of July 1, 2010, and the funding ratio based on such market value was 39%. As of June 30, 2011, the market value of assets in the Municipal Pension Fund was $4.0 billion.
A-26
As part of Act 44, which provided for a new method of determining municipal distress levels and alternative funding relief in response to the 2008/2009 market decline, the City adopted the fresh start amortization alternative of 30 years (previously 20 years) and lowered the assumed rate of interest for funding valuation purposes from 8.75% to 8.25%.† Additionally, the legislation allowed the City to defer a portion of its pension payment in the amount of $150 million in Fiscal Year 2010 and $80 million in Fiscal Year 2011 to be paid back (including interest) over a four-year period ending in Fiscal Year 2014. The change in amortization period and the partial deferral were approved by the Pennsylvania General Assembly.
A schedule of funding progress as of June 30, 2010, a comparative schedule of operations of the City’s Municipal Pension Fund for Fiscal Years 2001 through 2010, the City’s annual pension cost and net pension obligation for Fiscal Years 2008, 2009 and 2010, and the actuarial valuation method for determining the City’s contributions (subject to the changes described above), among other items, are contained in the Fiscal Year 2010 Comprehensive Annual Financial Report, attached to this Remarketing Memorandum as Appendix B.
Non-uniformed employees become vested in the Municipal Pension Plan upon the completion of ten years of service. Upon retirement, non-uniformed employees may receive up to 80% of their average final compensation depending upon their years of credited service. Generally, uniformed employees become vested in the Municipal Pension Plan upon the completion of ten years of service. Upon retirement, uniformed employees may receive up to 100% of their average final compensation depending upon their years of credited service. City employees participate in arrangements set forth under one of two municipal pensions programs know as Plan 67 or Plan 87 (except as described for certain police employees below), depending, primarily, on such employee’s date of hire. The retirement age differs for Plan 67 (age 55) and Plan 87 (age 60) for non-uniformed employees and also for Plan 67 (age 45) and Plan 87 (age 50) for uniformed employees.
Police employees hired on or after January 1, 2010 will have the option to participate in a defined benefit plan with a different benefit calculation formula and eligibility and vesting rules and a defined contribution plan with eligibility for City matching contributions, or enter Plan 87 but with an increased employee contribution rate of 6.0% instead of 5.0%.
Other Post-Employment Benefits
The City self-administers a single employer, defined benefit plan and provides health care for five years subsequent to separation for eligible retirees. Certain union represented employees may defer their coverage until a later date but the amount that the City pays for their health care is limited to the amount that the City would have paid at the date of their retirement. The City also provides lifetime insurance coverage for all eligible retirees. Firefighters are entitled to $7,500 coverage and all other employees receive $6,000 in coverage.
The City funds its retiree benefits on a pay-as-you-go basis. To provide health care coverage, the City pays a negotiated monthly premium for retirees covered by union contracts (other than police) and is self insured for nonunion employees and union police employees.
The City’s annual other post employment benefit (“OPEB”) expense is calculated based on the annual required contribution of the employer (“ARC”), an amount actuarially determined in accordance with the parameters of Governmental Accounting Standards Board Statement No. 45. The ARC represents a level of funding, which if paid on an ongoing basis, is projected to cover normal cost each year and amortize any unfunded actuarial liabilities over a period not to exceed thirty (30) years.
For Fiscal Year 2010, the City’s ARC was $93.6 million and it contributed $71.7 million for OPEB expense; its net OPEB obligation for Fiscal Year 2010 was $43.3 million. † On October 28, 2010, the Pension Board voted to further lower the pension fund’s annual earnings assumption from 8.25% to 8.15%.
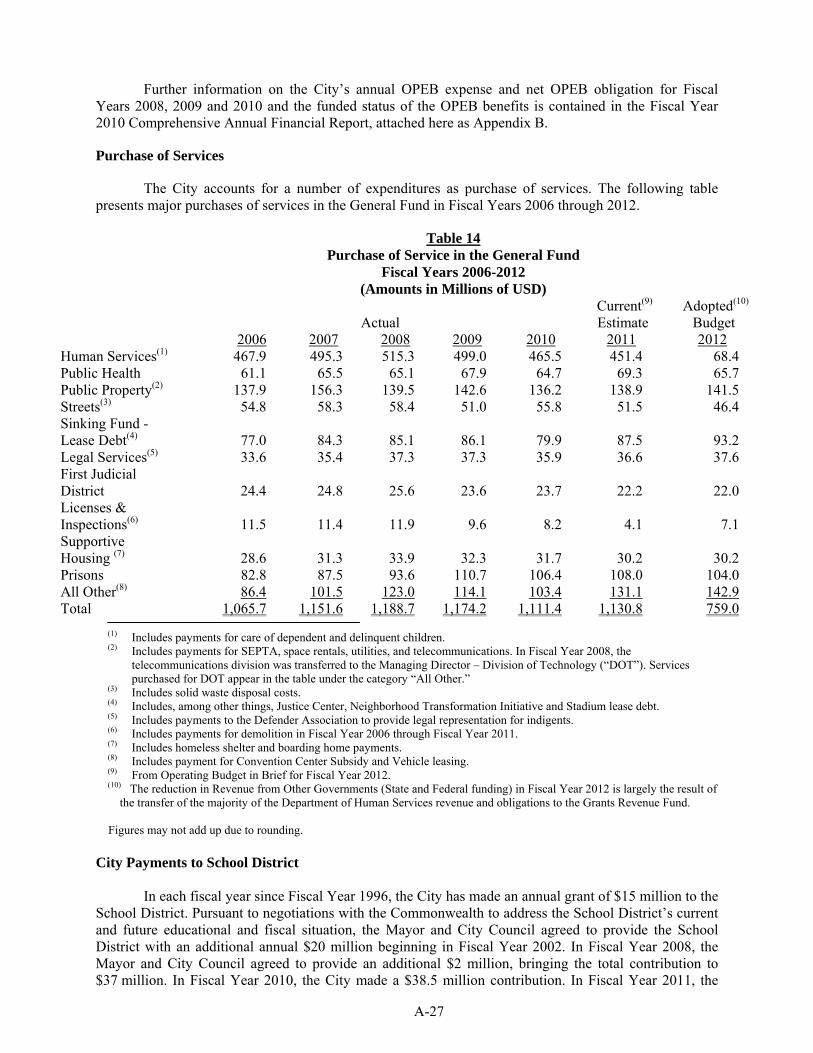
A-27
Further information on the City’s annual OPEB expense and net OPEB obligation for Fiscal Years 2008, 2009 and 2010 and the funded status of the OPEB benefits is contained in the Fiscal Year 2010 Comprehensive Annual Financial Report, attached here as Appendix B.
Purchase of Services
The City accounts for a number of expenditures as purchase of services. The following table presents major purchases of services in the General Fund in Fiscal Years 2006 through 2012.
Table 14
Purchase of Service in the General Fund
Fiscal Years 2006-2012
(Amounts in Millions of USD)
Actual
Current(9) Estimate
Adopted(10) Budget
2006 2007 2008 2009 2010 2011 2012 Human Services(1) 467.9 495.3 515.3 499.0 465.5 451.4 68.4 Public Health 61.1 65.5 65.1 67.9 64.7 69.3 65.7 Public Property(2) 137.9 156.3 139.5 142.6 136.2 138.9 141.5 Streets(3) 54.8 58.3 58.4 51.0 55.8 51.5 46.4 Sinking Fund - Lease Debt(4) 77.0 84.3 85.1 86.1 79.9 87.5 93.2 Legal Services(5) 33.6 35.4 37.3 37.3 35.9 36.6 37.6 First Judicial District
24.4
24.8
25.6
23.6
23.7
22.2
22.0
Licenses & Inspections(6)
11.5
11.4
11.9
9.6
8.2
4.1
7.1
Supportive Housing (7)
28.6
31.3
33.9
32.3
31.7
30.2
30.2
Prisons 82.8 87.5 93.6 110.7 106.4 108.0 104.0 All Other(8) 86.4 101.5 123.0 114.1 103.4 131.1 142.9 Total 1,065.7 1,151.6 1,188.7 1,174.2 1,111.4 1,130.8 759.0
(1) Includes payments for care of dependent and delinquent children. (2) Includes payments for SEPTA, space rentals, utilities, and telecommunications. In Fiscal Year 2008, the
telecommunications division was transferred to the Managing Director – Division of Technology (“DOT”). Services purchased for DOT appear in the table under the category “All Other.”
(3) Includes solid waste disposal costs. (4) Includes, among other things, Justice Center, Neighborhood Transformation Initiative and Stadium lease debt. (5) Includes payments to the Defender Association to provide legal representation for indigents. (6) Includes payments for demolition in Fiscal Year 2006 through Fiscal Year 2011. (7) Includes homeless shelter and boarding home payments. (8) Includes payment for Convention Center Subsidy and Vehicle leasing. (9) From Operating Budget in Brief for Fiscal Year 2012. (10) The reduction in Revenue from Other Governments (State and Federal funding) in Fiscal Year 2012 is largely the result of
the transfer of the majority of the Department of Human Services revenue and obligations to the Grants Revenue Fund. Figures may not add up due to rounding.
City Payments to School District
In each fiscal year since Fiscal Year 1996, the City has made an annual grant of $15 million to the
School District. Pursuant to negotiations with the Commonwealth to address the School District’s current and future educational and fiscal situation, the Mayor and City Council agreed to provide the School District with an additional annual $20 million beginning in Fiscal Year 2002. In Fiscal Year 2008, the Mayor and City Council agreed to provide an additional $2 million, bringing the total contribution to $37 million. In Fiscal Year 2010, the City made a $38.5 million contribution. In Fiscal Year 2011, the
A-28
City made a $38.6 million contribution. The Fiscal Year 2012 adopted budget includes an additional contribution of $10 million, bringing the total contribution to $48.6 million.
Annual Payments to PGW
In order to assist PGW, (i) the City agreed to forgo the $18 million annual payment in Fiscal Year 2004, (ii) for Fiscal Years 2005, 2006, 2007, 2008, 2009 and 2010 the City made a grant to PGW equal to the annual payment received from PGW in such fiscal years, and (iii) the City’s Nineteenth Five-Year Plan contemplates that in each of the Fiscal Years 2011 through 2015, the City will make a grant to PGW equal to the annual payment received from PGW in such Fiscal Years. See also “Fiscal Year 2011 PGW Payment to City.” The City’s Twentieth Five-Year Plan includes the PGW annual payment of $18,000,000 to the City’s General Fund but discontinues the City’s grant back to PGW equal to the annual payment received from PGW for Fiscal Years 2012, 2013, 2014, 2015 and 2016.
Fiscal Year 2011 PGW Payment to City
On June 20, 2011, PGW paid the City $18,000,000 and the City granted $1,700,000 back to PGW resulting in a net payment of $16,300,000 to the City.
City Payments to SEPTA
The City made operating subsidy payments to SEPTA in Fiscal Years 2008, 2009, 2010 and 2011 of $61.3 million, $62.9 million, $64.2, and $65.9 million, respectively. The Fiscal Year 2012 budget projects operating subsidy payments to SEPTA of $66.3 million. The proposed Twentieth Five-Year Plan provides that the City’s contribution to SEPTA will increase to $74.8 million by Fiscal Year 2016.
CITY CASH MANAGEMENT AND INVESTMENT POLICIES
Consolidated Cash
The Act of the General Assembly of the Commonwealth of June 25, 1919, P.L. 581, Art. XVII, § 6, gives the City the authority to make temporary inter-fund loans between operating and capital funds.
The Consolidated Cash Account provides for the physical commingling of the cash of all City Funds, except those which, for legal or contractual reasons, cannot be commingled (e.g., the Municipal Pension Fund, sinking funds, sinking fund reserves, funds of PGW, the Water Fund, the Aviation Fund and certain other restricted purpose funds). A separate accounting is maintained for the equity of each member fund in the Consolidated Cash Account. The City manages the Consolidated Cash Account pursuant to the following procedures:
To the extent that any member fund temporarily experiences the equivalent of a cash deficiency, the required advance is made from the Consolidated Cash Account, in the amount necessary to result in a zero balance in the cash equivalent account of the borrowing fund. All subsequent net receipts of a borrowing fund are applied in repayment of the advance.
All advances are made within the budgetary constraints of the borrowing funds. Within the General Fund, this system of inter-fund advances has historically resulted in the temporary use of tax revenues or other operating revenues for capital purposes and the temporary use of capital funds for operating purposes.
Procedures governing the City’s cash management operations require the General Fund-related operating fund to borrow initially from the General Fund-related capital fund, and only to the extent there is a deficiency in such fund may the General Fund-related operating fund borrow money from any other funds in the Consolidated Cash Account.
A-29
Investment Practices
Cash balances in each of the City’s funds are managed to maintain daily liquidity to pay expenses, and make investments that preserve principal while striving to obtain the maximum rate of return. In accordance with the Home Rule Charter, the City Treasurer is the City Official responsible for managing cash collected into the City Treasury. The available cash balances in excess of daily expenses are placed in demand accounts, swept into money market mutual funds, or used to make investments directed by professional money managers. These investments are held in segregated trust accounts at a separate financial institution. Cash balances related to Revenue Bonds for Water and Sewer and the Airport are directly deposited and held separately in trust. A Fiscal Agent manages these cash balances per the related bond documents and the investment practice is guided by administrative direction of the City Treasurer per the Investment Committee and the Investment Policy. In addition, certain operating cash deposits (such as Community Behavioral Health, Special Gas/County Liquid and “911” surcharge) of the City are restricted by purpose and required to be segregated into accounts in compliance with Federal or State reporting.
Investment guidelines for the City are embodied in legislation approved by City Council appearing in the Philadelphia City Code, Chapter 19-202. In furtherance of the City, State, and Federal legislative guidelines, the Director of Finance adopted a written Investment Policy (the “Policy”) that first went into effect in August 1994 and most recently was revised in January 2011. The Policy supplements other legal requirements and establishes a comprehensive investment policy for the overall administration and effective management of all monetary funds (except the Municipal Pension Fund and PGW Retirement Reserve Fund).
The Policy delineates the authorized investments as approved by City Council Ordinance and the funds to which the Policy applies. The authorized investments include U.S. government securities, U.S. treasuries, U.S. agencies, repurchase agreements, commercial paper, corporate bonds, money market mutual funds, obligations of the Commonwealth, collateralized banker’s acceptances and certificates of deposit, and collateralized mortgage obligations and pass-through securities directly issued by a federal agency of the United States, all of investment grade rating or better.
U.S. government treasury and agency securities carry no limitation as to the percent of the total portfolio. Repurchase agreements, money market mutual funds, commercial paper, and corporate bonds are limited to investment of no more than 25% of the total portfolio. Obligations of the Commonwealth and collateralized banker’s acceptances and certificates of deposit are limited to no more than 15% of the total portfolio. Collateralized mortgage obligations and pass-through securities directly issued by a federal agency of the United States are limited to no more than 5% of the total portfolio.
U.S. government treasury and agency securities carry no limitation as to the percent of the total portfolio per issuer. Repurchase agreements and money market mutual funds are limited to no more than 10% of the total portfolio per issuer. Commercial paper, corporate bonds, obligations of the Commonwealth, collateralized banker’s acceptances and certificates of deposit, and collateralized mortgage obligations and pass-through securities directly issued by a federal agency of the United States are limited to no more than 3% of the total portfolio per issuer.
The Policy also restricts investments to those having a maximum maturity of two years. Daily liquidity is maintained through the use of SEC-registered money market mutual funds with the balance of funds invested by the City or money managers in accordance with the Policy.
The Policy provides for an ad hoc Investment Committee consisting of the Director of Finance and the City Treasurer with ex-officio membership of a representative of each of the principal operating and capital funds, i.e., Water Fund, Aviation Fund, PGW and PMA. The Investment Committee meets quarterly with each of the investment managers to review each manager’s performance to date and to plan
A-30
for the next quarter. Investment managers are given any changes in investment instructions at these meetings. The Investment Committee approves all modifications to the Policy.
The Policy expressly forbids the use of any derivative investment product as well as investments in any security whose yield or market value does not follow the normal swings in interest rates. Examples of these types of securities include, but are not limited to: structured notes, floating rate or inverse floating rate instruments, securities that could result in zero interest accrual if held to maturity, and mortgage derived interest and principal only strips. The City currently makes no investments in derivatives.
General Fund Cash Flow
Because the receipts of General Fund revenues lag behind expenditures during most of each fiscal year, the City issues notes in anticipation of General Fund revenues and makes payments from the Consolidated Cash Account to finance its on-going operations. The City has issued notes in anticipation of the receipt of income by the General Fund in each fiscal year since Fiscal Year 1972 (with a single exception). Each issue was repaid when due, prior to the end of the fiscal year.
The timing imbalance referred to above results from a number of factors, principally the following: (1) real property, business privilege tax and certain other taxes are not due until the latter part of the fiscal year; and (2) the City experiences lags in reimbursement from other governmental entities for expenditures initially made by the City in connection with programs funded by other governments.
The City issued $285 million of Tax and Revenue Anticipation Notes in July 2010. These notes were repaid on June 30, 2011. The Twentieth Five-Year Plan projects Tax and Revenue Anticipation Notes in the amount of $250 million to be issued in Fiscal Year 2012.
DEBT OF THE CITY
The Constitution of the Commonwealth provides that the authorized debt of the City “may be increased in such amount that the total debt of said City shall not exceed 13.5% of the average of the annual assessed valuations of the taxable realty therein, during the ten years immediately preceding the year in which such increase is made, but said City shall not increase its indebtedness to an amount exceeding 3.0% upon such average assessed valuation of realty, without the consent of the electors thereof at a public election held in such manner as shall be provided by law.” It has been judicially determined that bond authorizations once approved by the voters will not be reduced as a result of a subsequent decline in the average assessed value of City property.
The Constitution of the Commonwealth further provides that there shall be excluded from the computation of debt for purposes of the Constitutional debt limit, debt (herein called “self-supporting debt”) incurred for revenue-producing capital improvements that may reasonably be expected to yield revenue in excess of operating expenses sufficient to pay interest and sinking fund charges thereon. In the case of general obligation debt, the amount of such self-supporting debt to be so excluded must be determined by the Court of Common Pleas of Philadelphia County upon petition by the City. Self-supporting debt is general obligation debt of the City, with the only distinction from tax-supported debt being that it is not used in the calculation of the Constitutional debt limit. Self-supporting debt has no lien on any particular revenues.
As of July 1, 2011, the Constitutional debt limitation for tax-supported general obligation debt was approximately $1,571,939,000. This amount is based upon a formula of 13.5% of the assessed value of taxable real estate within the City on a 10 year rolling average. The total amount of authorized debt applicable to the debt limit was $1,434,080,000, leaving a legal debt margin of $137,859,000. The calculation of the legal debt margin is as follows:
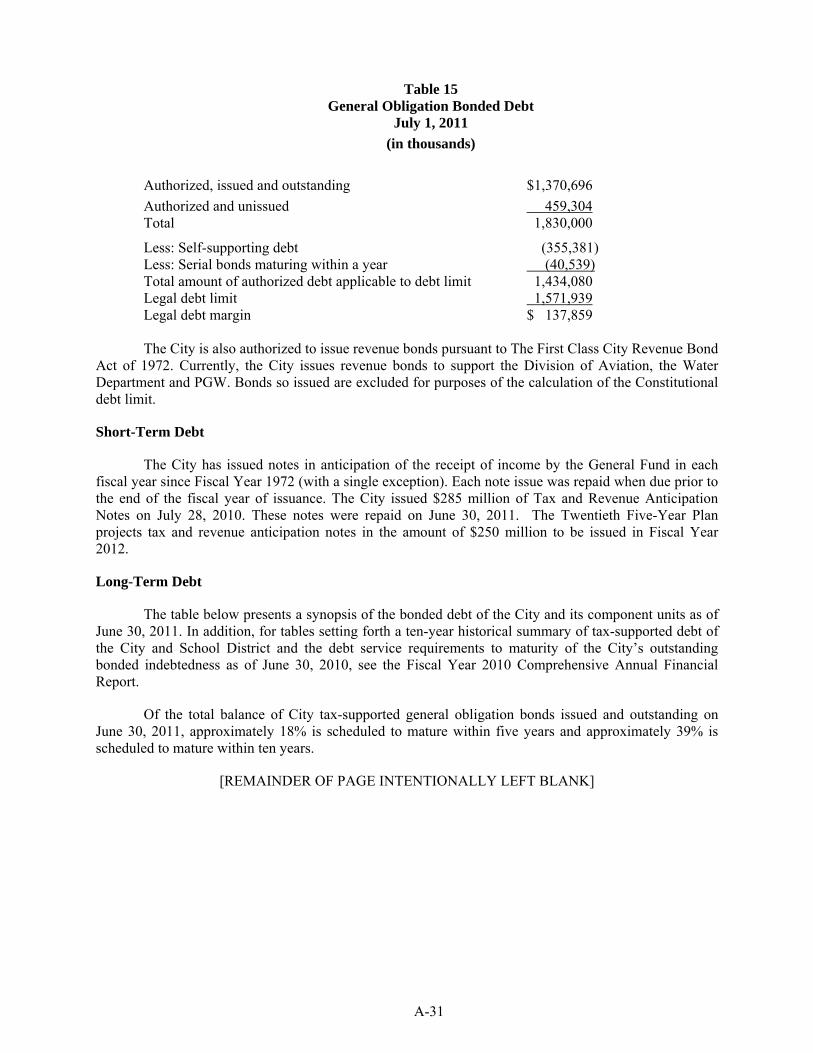
A-31
Table 15 General Obligation Bonded Debt
July 1, 2011
(in thousands)
Authorized, issued and outstanding $1,370,696
Authorized and unissued 459,304 Total 1,830,000
Less: Self-supporting debt (355,381) Less: Serial bonds maturing within a year (40,539) Total amount of authorized debt applicable to debt limit 1,434,080 Legal debt limit 1,571,939 Legal debt margin $ 137,859
The City is also authorized to issue revenue bonds pursuant to The First Class City Revenue Bond
Act of 1972. Currently, the City issues revenue bonds to support the Division of Aviation, the Water Department and PGW. Bonds so issued are excluded for purposes of the calculation of the Constitutional debt limit.
Short-Term Debt
The City has issued notes in anticipation of the receipt of income by the General Fund in each fiscal year since Fiscal Year 1972 (with a single exception). Each note issue was repaid when due prior to the end of the fiscal year of issuance. The City issued $285 million of Tax and Revenue Anticipation Notes on July 28, 2010. These notes were repaid on June 30, 2011. The Twentieth Five-Year Plan projects tax and revenue anticipation notes in the amount of $250 million to be issued in Fiscal Year 2012.
Long-Term Debt
The table below presents a synopsis of the bonded debt of the City and its component units as of June 30, 2011. In addition, for tables setting forth a ten-year historical summary of tax-supported debt of the City and School District and the debt service requirements to maturity of the City’s outstanding bonded indebtedness as of June 30, 2010, see the Fiscal Year 2010 Comprehensive Annual Financial Report.
Of the total balance of City tax-supported general obligation bonds issued and outstanding on June 30, 2011, approximately 18% is scheduled to mature within five years and approximately 39% is scheduled to mature within ten years.
[REMAINDER OF PAGE INTENTIONALLY LEFT BLANK]
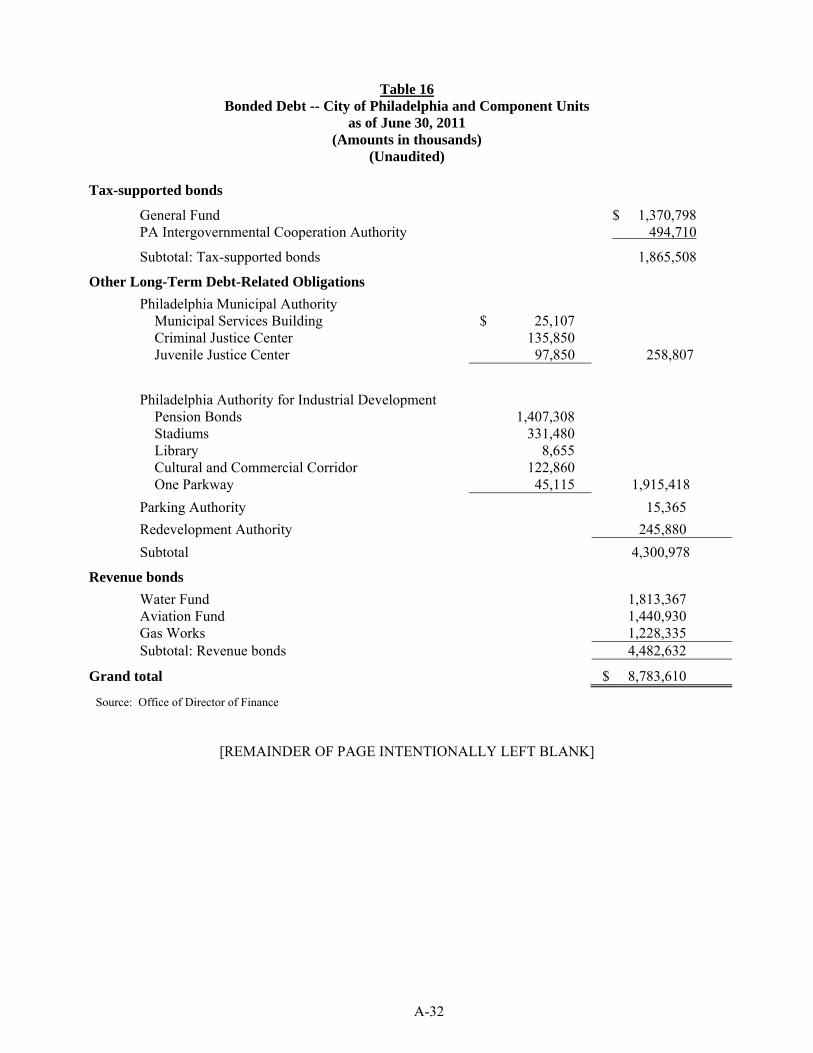
A-32
Table 16 Bonded Debt -- City of Philadelphia and Component Units
as of June 30, 2011 (Amounts in thousands)
(Unaudited) Tax-supported bonds
General Fund $ 1,370,798 PA Intergovernmental Cooperation Authority 494,710
Subtotal: Tax-supported bonds 1,865,508
Other Long-Term Debt-Related Obligations
Philadelphia Municipal Authority Municipal Services Building $ 25,107 Criminal Justice Center 135,850 Juvenile Justice Center 97,850 258,807
Philadelphia Authority for Industrial Development Pension Bonds 1,407,308 Stadiums 331,480 Library 8,655 Cultural and Commercial Corridor 122,860 One Parkway 45,115 1,915,418
Parking Authority 15,365
Redevelopment Authority 245,880
Subtotal 4,300,978
Revenue bonds
Water Fund 1,813,367 Aviation Fund 1,440,930 Gas Works 1,228,335 Subtotal: Revenue bonds 4,482,632
Grand total $ 8,783,610
Source: Office of Director of Finance
[REMAINDER OF PAGE INTENTIONALLY LEFT BLANK]
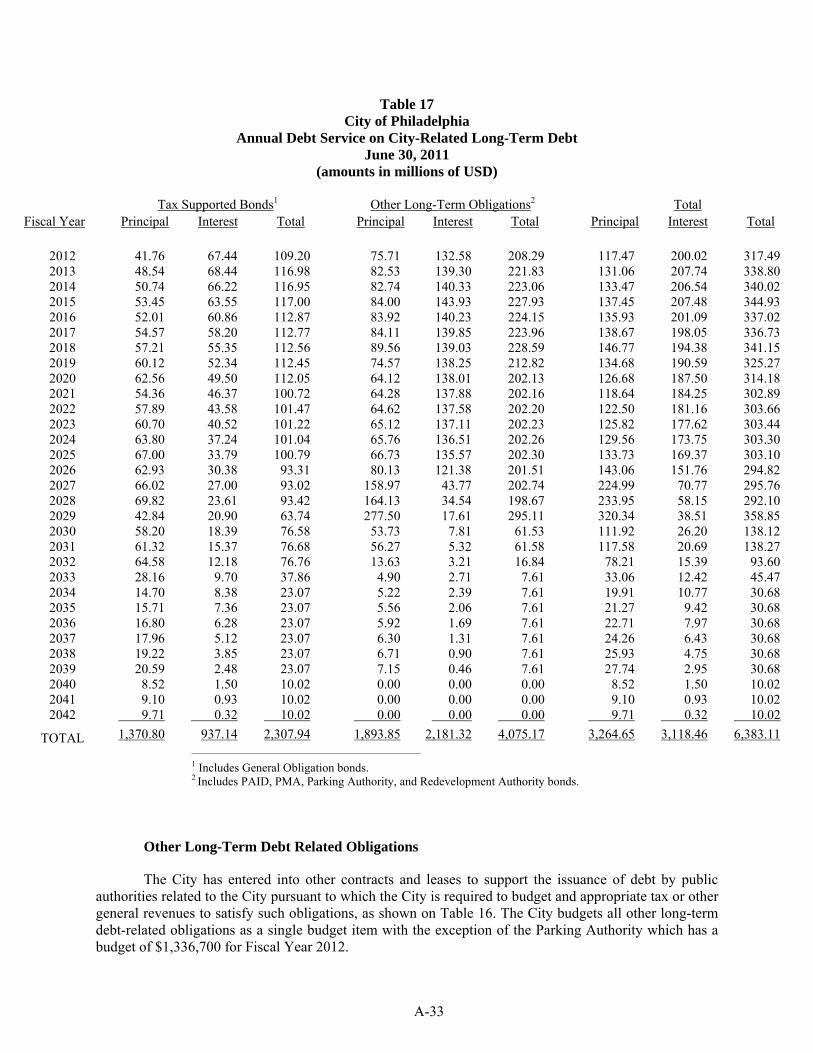
A-33
Table 17 City of Philadelphia
Annual Debt Service on City-Related Long-Term Debt June 30, 2011
(amounts in millions of USD)
Tax Supported Bonds1 Other Long-Term Obligations2 Total Fiscal Year Principal Interest Total Principal Interest Total Principal Interest Total
2012 41.76 67.44 109.20 75.71 132.58 208.29 117.47 200.02 317.49 2013 48.54 68.44 116.98 82.53 139.30 221.83 131.06 207.74 338.80 2014 50.74 66.22 116.95 82.74 140.33 223.06 133.47 206.54 340.02 2015 53.45 63.55 117.00 84.00 143.93 227.93 137.45 207.48 344.93 2016 52.01 60.86 112.87 83.92 140.23 224.15 135.93 201.09 337.02 2017 54.57 58.20 112.77 84.11 139.85 223.96 138.67 198.05 336.73 2018 57.21 55.35 112.56 89.56 139.03 228.59 146.77 194.38 341.15 2019 60.12 52.34 112.45 74.57 138.25 212.82 134.68 190.59 325.27 2020 62.56 49.50 112.05 64.12 138.01 202.13 126.68 187.50 314.18 2021 54.36 46.37 100.72 64.28 137.88 202.16 118.64 184.25 302.89 2022 57.89 43.58 101.47 64.62 137.58 202.20 122.50 181.16 303.66 2023 60.70 40.52 101.22 65.12 137.11 202.23 125.82 177.62 303.44 2024 63.80 37.24 101.04 65.76 136.51 202.26 129.56 173.75 303.30 2025 67.00 33.79 100.79 66.73 135.57 202.30 133.73 169.37 303.10 2026 62.93 30.38 93.31 80.13 121.38 201.51 143.06 151.76 294.82 2027 66.02 27.00 93.02 158.97 43.77 202.74 224.99 70.77 295.76 2028 69.82 23.61 93.42 164.13 34.54 198.67 233.95 58.15 292.10 2029 42.84 20.90 63.74 277.50 17.61 295.11 320.34 38.51 358.85 2030 58.20 18.39 76.58 53.73 7.81 61.53 111.92 26.20 138.12 2031 61.32 15.37 76.68 56.27 5.32 61.58 117.58 20.69 138.27 2032 64.58 12.18 76.76 13.63 3.21 16.84 78.21 15.39 93.60 2033 28.16 9.70 37.86 4.90 2.71 7.61 33.06 12.42 45.47 2034 14.70 8.38 23.07 5.22 2.39 7.61 19.91 10.77 30.68 2035 15.71 7.36 23.07 5.56 2.06 7.61 21.27 9.42 30.68 2036 16.80 6.28 23.07 5.92 1.69 7.61 22.71 7.97 30.68 2037 17.96 5.12 23.07 6.30 1.31 7.61 24.26 6.43 30.68 2038 19.22 3.85 23.07 6.71 0.90 7.61 25.93 4.75 30.68 2039 20.59 2.48 23.07 7.15 0.46 7.61 27.74 2.95 30.68 2040 8.52 1.50 10.02 0.00 0.00 0.00 8.52 1.50 10.02 2041 9.10 0.93 10.02 0.00 0.00 0.00 9.10 0.93 10.02 2042 9.71 0.32 10.02 0.00 0.00 0.00 9.71 0.32 10.02
TOTAL 1,370.80 937.14 2,307.94 1,893.85 2,181.32 4,075.17 3,264.65 3,118.46 6,383.11 _____________________________________________________
1 Includes General Obligation bonds. 2 Includes PAID, PMA, Parking Authority, and Redevelopment Authority bonds.
Other Long-Term Debt Related Obligations
The City has entered into other contracts and leases to support the issuance of debt by public authorities related to the City pursuant to which the City is required to budget and appropriate tax or other general revenues to satisfy such obligations, as shown on Table 16. The City budgets all other long-term debt-related obligations as a single budget item with the exception of the Parking Authority which has a budget of $1,336,700 for Fiscal Year 2012.
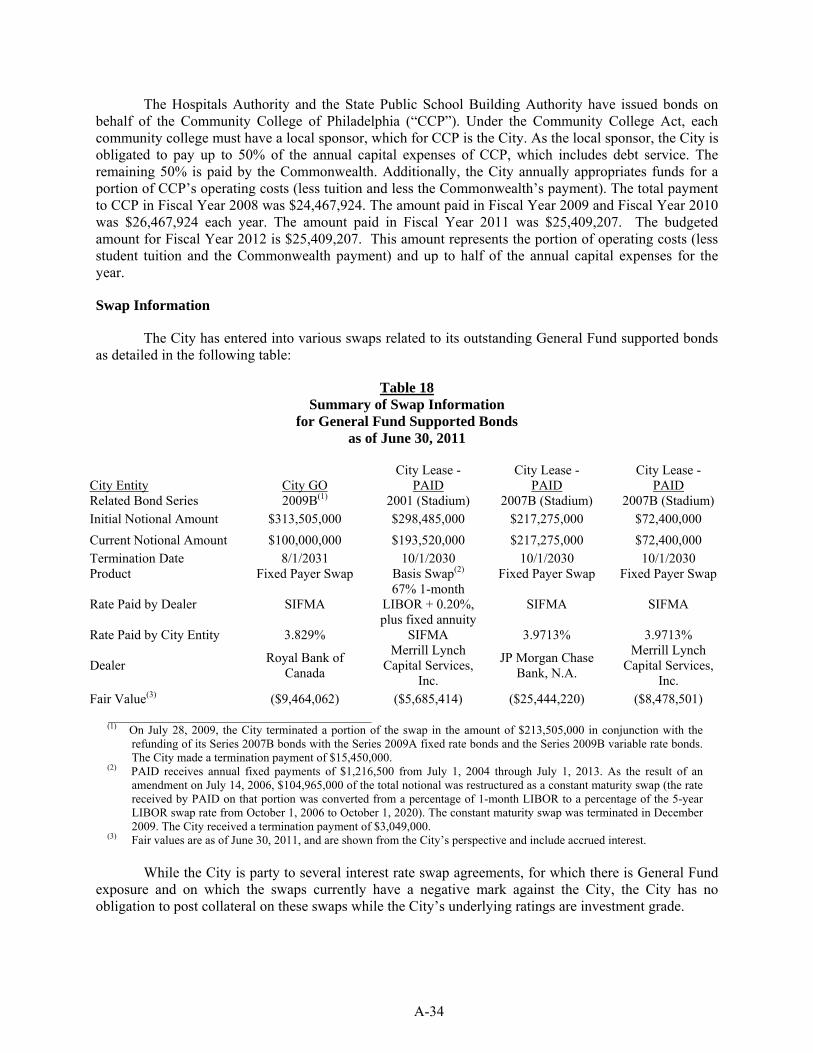
A-34
The Hospitals Authority and the State Public School Building Authority have issued bonds on behalf of the Community College of Philadelphia (“CCP”). Under the Community College Act, each community college must have a local sponsor, which for CCP is the City. As the local sponsor, the City is obligated to pay up to 50% of the annual capital expenses of CCP, which includes debt service. The remaining 50% is paid by the Commonwealth. Additionally, the City annually appropriates funds for a portion of CCP’s operating costs (less tuition and less the Commonwealth’s payment). The total payment to CCP in Fiscal Year 2008 was $24,467,924. The amount paid in Fiscal Year 2009 and Fiscal Year 2010 was $26,467,924 each year. The amount paid in Fiscal Year 2011 was $25,409,207. The budgeted amount for Fiscal Year 2012 is $25,409,207. This amount represents the portion of operating costs (less student tuition and the Commonwealth payment) and up to half of the annual capital expenses for the year.
Swap Information
The City has entered into various swaps related to its outstanding General Fund supported bonds as detailed in the following table:
Table 18 Summary of Swap Information
for General Fund Supported Bonds as of June 30, 2011
City Entity
City GO City Lease -
PAID City Lease -
PAID City Lease -
PAID Related Bond Series 2009B(1) 2001 (Stadium) 2007B (Stadium) 2007B (Stadium) Initial Notional Amount $313,505,000 $298,485,000 $217,275,000 $72,400,000
Current Notional Amount $100,000,000 $193,520,000 $217,275,000 $72,400,000 Termination Date 8/1/2031 10/1/2030 10/1/2030 10/1/2030 Product Fixed Payer Swap Basis Swap(2) Fixed Payer Swap Fixed Payer Swap
Rate Paid by Dealer SIFMA 67% 1-month
LIBOR + 0.20%, plus fixed annuity
SIFMA SIFMA
Rate Paid by City Entity 3.829% SIFMA 3.9713% 3.9713%
Dealer Royal Bank of
Canada
Merrill Lynch Capital Services,
Inc.
JP Morgan Chase Bank, N.A.
Merrill Lynch Capital Services,
Inc. Fair Value(3) ($9,464,062) ($5,685,414) ($25,444,220) ($8,478,501)
____________________________________________ (1) On July 28, 2009, the City terminated a portion of the swap in the amount of $213,505,000 in conjunction with the
refunding of its Series 2007B bonds with the Series 2009A fixed rate bonds and the Series 2009B variable rate bonds. The City made a termination payment of $15,450,000.
(2) PAID receives annual fixed payments of $1,216,500 from July 1, 2004 through July 1, 2013. As the result of an amendment on July 14, 2006, $104,965,000 of the total notional was restructured as a constant maturity swap (the rate received by PAID on that portion was converted from a percentage of 1-month LIBOR to a percentage of the 5-year LIBOR swap rate from October 1, 2006 to October 1, 2020). The constant maturity swap was terminated in December 2009. The City received a termination payment of $3,049,000.
(3) Fair values are as of June 30, 2011, and are shown from the City’s perspective and include accrued interest. While the City is party to several interest rate swap agreements, for which there is General Fund
exposure and on which the swaps currently have a negative mark against the City, the City has no obligation to post collateral on these swaps while the City’s underlying ratings are investment grade.
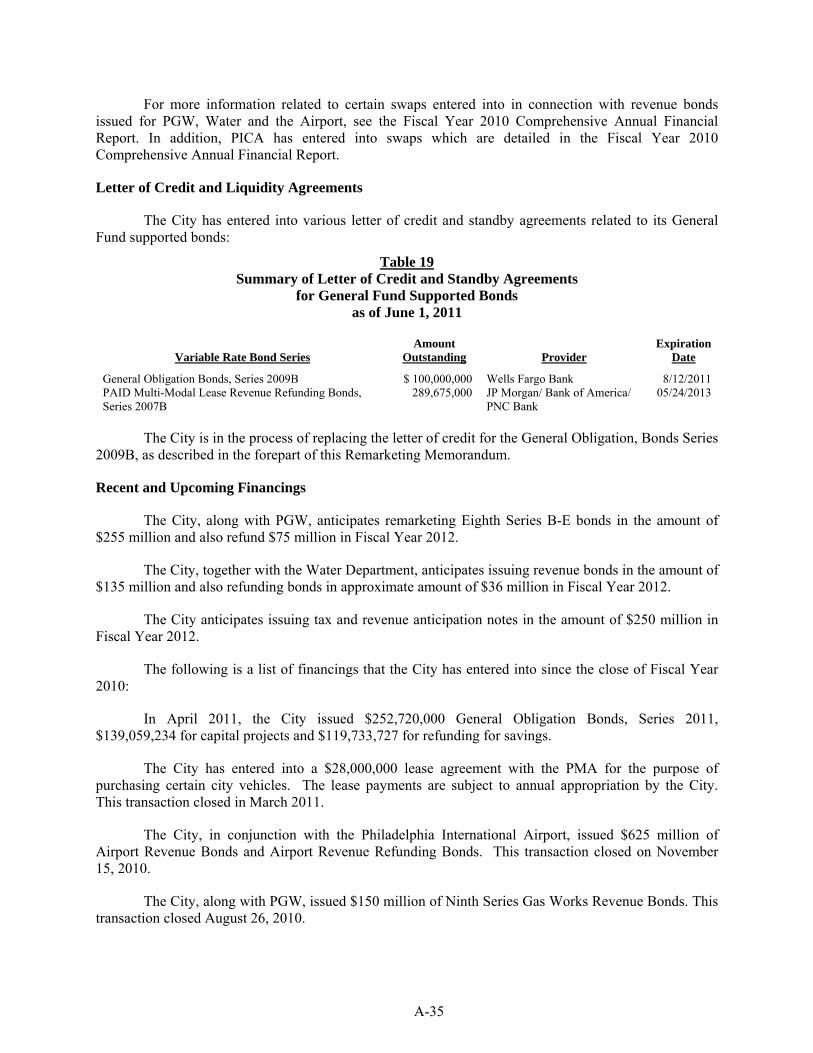
A-35
For more information related to certain swaps entered into in connection with revenue bonds issued for PGW, Water and the Airport, see the Fiscal Year 2010 Comprehensive Annual Financial Report. In addition, PICA has entered into swaps which are detailed in the Fiscal Year 2010 Comprehensive Annual Financial Report.
Letter of Credit and Liquidity Agreements
The City has entered into various letter of credit and standby agreements related to its General Fund supported bonds:
Table 19 Summary of Letter of Credit and Standby Agreements
for General Fund Supported Bonds as of June 1, 2011
Variable Rate Bond Series Amount
Outstanding Provider Expiration
Date
General Obligation Bonds, Series 2009B $ 100,000,000 Wells Fargo Bank 8/12/2011 PAID Multi-Modal Lease Revenue Refunding Bonds, Series 2007B
289,675,000 JP Morgan/ Bank of America/ PNC Bank
05/24/2013
The City is in the process of replacing the letter of credit for the General Obligation, Bonds Series 2009B, as described in the forepart of this Remarketing Memorandum.
Recent and Upcoming Financings
The City, along with PGW, anticipates remarketing Eighth Series B-E bonds in the amount of $255 million and also refund $75 million in Fiscal Year 2012.
The City, together with the Water Department, anticipates issuing revenue bonds in the amount of $135 million and also refunding bonds in approximate amount of $36 million in Fiscal Year 2012.
The City anticipates issuing tax and revenue anticipation notes in the amount of $250 million in Fiscal Year 2012.
The following is a list of financings that the City has entered into since the close of Fiscal Year 2010:
In April 2011, the City issued $252,720,000 General Obligation Bonds, Series 2011, $139,059,234 for capital projects and $119,733,727 for refunding for savings.
The City has entered into a $28,000,000 lease agreement with the PMA for the purpose of purchasing certain city vehicles. The lease payments are subject to annual appropriation by the City. This transaction closed in March 2011.
The City, in conjunction with the Philadelphia International Airport, issued $625 million of Airport Revenue Bonds and Airport Revenue Refunding Bonds. This transaction closed on November 15, 2010.
The City, along with PGW, issued $150 million of Ninth Series Gas Works Revenue Bonds. This transaction closed August 26, 2010.
A-36
The City, together with the Water Department, issued $185 million of new money water and wastewater bonds for capital projects. This transaction closed August 5, 2010.
In July 2010, the City issued the Tax and Revenue Anticipation Notes, Series A of 2010-2011 in the principal amount of $285 million.
The City is continually monitoring refunding opportunities for its outstanding debt and may undertake certain refundings depending on market conditions.
CITY CAPITAL IMPROVEMENT PROGRAM
The Capital Improvement Program for Fiscal Years 2012-2017 contemplates a total budget of $8,990,983,000 of which $1,972,365,000 is to be provided from Federal, Commonwealth, and other sources and the remainder through City funding. The following table shows the amounts budgeted each year from various sources of funds for capital projects. City Council adopted the Capital Improvement Program for Fiscal Years 2012-2017 on June 23, 2011.
[REMAINDER OF PAGE INTENTIONALLY LEFT BLANK]
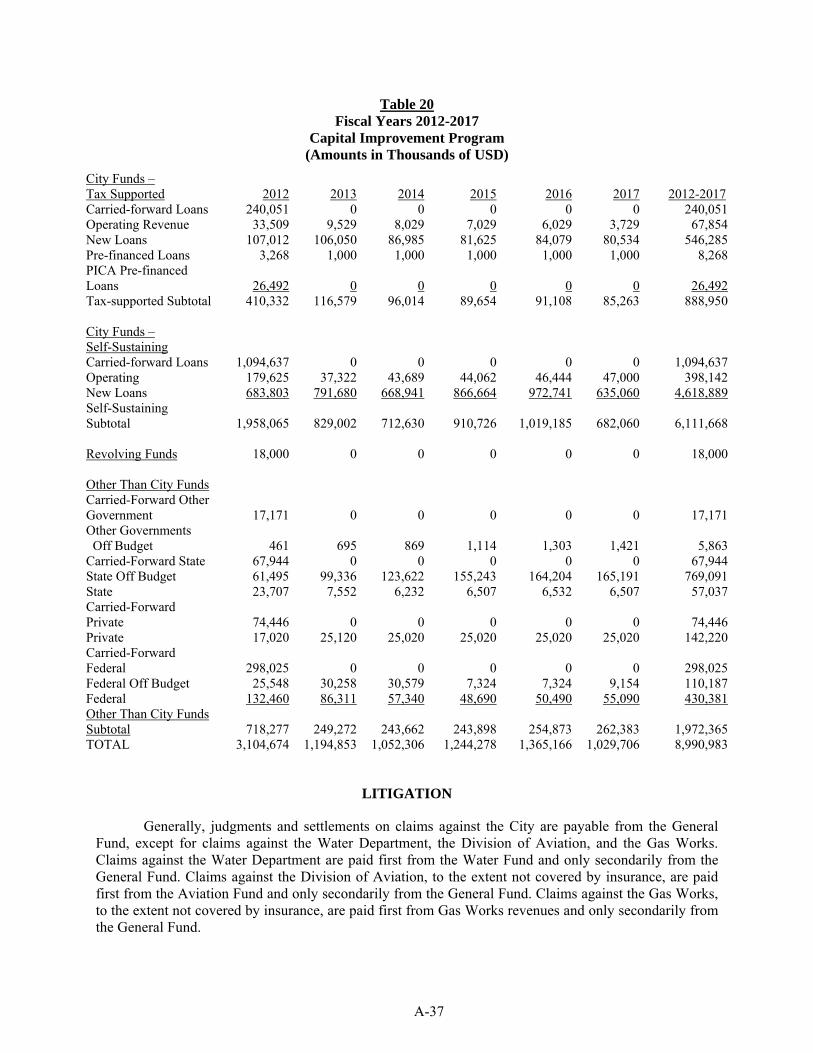
A-37
Table 20 Fiscal Years 2012-2017
Capital Improvement Program (Amounts in Thousands of USD)
City Funds – Tax Supported 2012 2013 2014 2015 2016 2017 2012-2017 Carried-forward Loans 240,051 0 0 0 0 0 240,051 Operating Revenue 33,509 9,529 8,029 7,029 6,029 3,729 67,854 New Loans 107,012 106,050 86,985 81,625 84,079 80,534 546,285 Pre-financed Loans 3,268 1,000 1,000 1,000 1,000 1,000 8,268 PICA Pre-financed Loans 26,492 0 0 0 0 0 26,492 Tax-supported Subtotal 410,332 116,579 96,014 89,654 91,108 85,263 888,950 City Funds – Self-Sustaining Carried-forward Loans 1,094,637 0 0 0 0 0 1,094,637 Operating 179,625 37,322 43,689 44,062 46,444 47,000 398,142 New Loans 683,803 791,680 668,941 866,664 972,741 635,060 4,618,889 Self-Sustaining Subtotal 1,958,065 829,002 712,630 910,726 1,019,185 682,060 6,111,668 Revolving Funds 18,000 0 0 0 0 0 18,000 Other Than City Funds Carried-Forward Other Government 17,171 0 0 0 0 0 17,171 Other Governments Off Budget 461 695 869 1,114 1,303 1,421 5,863 Carried-Forward State 67,944 0 0 0 0 0 67,944 State Off Budget 61,495 99,336 123,622 155,243 164,204 165,191 769,091 State 23,707 7,552 6,232 6,507 6,532 6,507 57,037 Carried-Forward Private 74,446 0 0 0 0 0 74,446 Private 17,020 25,120 25,020 25,020 25,020 25,020 142,220 Carried-Forward Federal 298,025 0 0 0 0 0 298,025 Federal Off Budget 25,548 30,258 30,579 7,324 7,324 9,154 110,187 Federal 132,460 86,311 57,340 48,690 50,490 55,090 430,381 Other Than City Funds Subtotal 718,277 249,272 243,662 243,898 254,873 262,383 1,972,365 TOTAL 3,104,674 1,194,853 1,052,306 1,244,278 1,365,166 1,029,706 8,990,983
LITIGATION
Generally, judgments and settlements on claims against the City are payable from the General Fund, except for claims against the Water Department, the Division of Aviation, and the Gas Works. Claims against the Water Department are paid first from the Water Fund and only secondarily from the General Fund. Claims against the Division of Aviation, to the extent not covered by insurance, are paid first from the Aviation Fund and only secondarily from the General Fund. Claims against the Gas Works, to the extent not covered by insurance, are paid first from Gas Works revenues and only secondarily from the General Fund.
A-38
The Act of October 5, 1980, P.L. 693, No. 142, known as the “Political Subdivision Tort Claims Act,” (the “Tort Claims Act”) establishes a $500,000 aggregate limitation on damages for injury to a person or property arising from the same cause of action or transaction or occurrence or series of causes of action, transactions or occurrences with respect to governmental units in the Commonwealth such as the City. The constitutionality of that aggregate limitation has been repeatedly upheld by the Pennsylvania Supreme Court. In February 1987, an appeal of a decision upholding such constitutionality to the United States Supreme Court was dismissed for want of jurisdiction. However, under Pennsylvania Rule of Civil Procedure 238, delay damages in State Court cases are not subject to the $500,000 limitation. Moreover, the limit on damages is inapplicable to any suit against the City which does not arise under state tort law such as claims made against the City under Federal civil rights laws.
The aggregate loss resulting from general and special litigation claims was $30.2 million for Fiscal Year 2001, $30.0 million for Fiscal Year 2002, $24.1 million for Fiscal Year 2003, $24.5 million for Fiscal Year 2004, $27.5 million for Fiscal Year 2005, $23.0 million for Fiscal Year 2006, $26.6 million for Fiscal Year 2007, $29.8 million for Fiscal Year 2008, $34.5 million for Fiscal Year 2009, $32.7 million for Fiscal Year 2010, and $33.7 million for Fiscal Year 2011. Estimates of settlements and judgments from the General Fund are $33.12 million for each of the Fiscal Years 2012 through 2016, respectively (based on the Twentieth Five-Year Plan). In budgeting for settlements and judgments in the annual Operating Budget and projecting settlements and judgments for each Five-Year Plan, the City bases its estimates on past experience and on an analysis of estimated potential liabilities and the timing of outcomes, to the extent a proceeding is sufficiently advanced to permit a projection of the timing of a result. General and special litigation claims are budgeted separately from back-pay awards and similar settlements relating to labor disputes. Usually, some of the costs arising from labor litigation are reported as part of current payroll expenses. For Fiscal Year 2011, payments for claims arising from labor settlements in the General Fund were $1.31 million of which $1.3 million were paid from the Indemnities account, and $6,000 from the Operating budgets of the affected departments. For Fiscal Year 2010, payments for claims arising from labor settlements in the General Fund were $1.4 million of which $1.38 million was paid from the Indemnities account, and $13,000 from the operating budgets of the affected departments. Actual claims paid out from the General Fund for settlements and judgments averaged $31.5 million per year over the five years from Fiscal Year 2007 through Fiscal Year 2011.
In addition to routine litigation incidental to performance of the City’s governmental functions and litigation arising in the ordinary course relating to contract and tort claims and alleged violations of law, certain special litigation matters are currently being litigated and/or appealed and adverse final outcomes of such litigation could have a substantial or long-term adverse effect on the City’s General Fund. These proceedings involve: environmental-related actions and proceedings in which it has been or may be alleged that the City is liable for damages, including but not limited to property damage and bodily injury, or that the City should pay fines or penalties or the costs of response or remediation, because of the alleged generation, transport, or disposal of toxic or otherwise hazardous substances by the City, or the alleged disposal of such substances on or to City-owned property; a class action suit alleging that the City failed to properly oversee management of funds in the deferred compensation plan of City employees; civil rights claims; and a pay dispute with former and current paramedics. The ultimate outcome and fiscal impact, if any, on the City’s General Fund of the claims and proceedings described in this paragraph are not currently predictable.
Various claims in addition to the lawsuits described in the preceding paragraph have been asserted against the Water Department and in some cases lawsuits have been instituted. Many of these Water Department claims have been reduced to judgment or otherwise settled in a manner requiring payment by the Water Department. The aggregate loss for Fiscal Year 2009 which resulted from these claims and lawsuits was $5.0 million, and $4.9 million in Fiscal Year 2010. The aggregate loss for Fiscal Year 2011 was $5.4 million. The Water Fund’s budget for Fiscal Year 2012 contains an appropriation for
A-39
Water Department claims in the amount of $6.5 million, although the current estimate, based on the prior three fiscal years’ expenditures, is for only $5.1 million in Fiscal Year 2012. The Water Fund is the first source of payment for any of the claims against the Water Department.
In addition, various claims have been asserted against the Division of Aviation and in some cases lawsuits have been instituted. Many of these Division of Aviation claims have been reduced to judgment or otherwise settled in a manner requiring payment by the Division of Aviation. The aggregate loss for Fiscal Year 2009 which resulted from these claims and lawsuits was $430,000 and $881,600 for Fiscal Year 2010. The aggregate loss for Fiscal Year 2011 was $1,685,000. The Indemnities budget for Aviation Fund claims for Fiscal Year 2012 contains an appropriation in the amount of $2.5 million, although the current estimate, based on the prior three fiscal years’ expenditures, is only $889,000 in Fiscal Year 2012. The Division of Aviation is the first source of payment for any of the claims against the Division of Aviation.
ELECTED AND APPOINTED OFFICIALS
The Mayor is elected for a term of four years and is eligible to succeed himself for one term. Each of the seventeen members of the City Council is also elected for a four-year term which runs concurrently with that of the Mayor. There is no limitation on the number of terms that may be served by members of the City Council. Of the members of the City Council, ten are elected from districts and seven are elected at-large, with a minimum of two of the seven representing a party or parties other than the majority party. The District Attorney and the City Controller are elected at the mid-point of the terms of the Mayor and City Council.
The City Controller’s responsibilities derive from the Home Rule Charter, various City ordinances and state and federal statutes, and contractual arrangements with auditees. The City Controller must follow Generally Accepted Government Auditing Standards (“GAGAS”) established by the federal Government Accountability Office (formerly known as the General Accounting Office), and GAAS, Generally Accepted Auditing Standards promulgated by the American Institute of Certified Public Accountants. As of June 30, 2011, the Office of the City Controller had 113 employees, including 66 auditors, 24 of whom were certified public accountants.
The City Controller post-audits and reports on the City’s and the School District’s comprehensive Annual Financial Reports, federal assistance received by the City and the performance of City departments. The City Controller also conducts a pre-audit program of expenditure documents required to be submitted for approval, such as invoices, payment vouchers, purchase orders and contracts. Documents are selected for audit by category and statistical basis. The Pre-Audit Division verifies that expenditures are authorized and accurate in accordance with the Home Rule Charter and other pertinent legal and contractual requirements before any moneys are paid by the City Treasurer. The Pre-Audit Technical Unit, consisting of auditing and engineering staff, inspects and audits capital project design, construction and related expenditures. Other responsibilities of the City Controller include investigation of allegations of fraud, preparation of economic reports, certification of the City’s debt capacity and the capital nature and useful life of the capital projects, and opining to PICA on the reasonableness of the assumptions and estimates in the City’s five-year financial plans.
The principal officers of the City’s government appointed by the Mayor are the Managing Director of the City (the “Managing Director”), the Director of Finance of the City (the “Director of Finance”), the City Solicitor (the “City Solicitor”), the Deputy Mayor for Planning and Economic Development and Director of Commerce (the “Director of Commerce”) and the City Representative (the “City Representative”). These officials, together with the Mayor and the other members of the Mayor’s cabinet, constitute the major policy-making group in the City’s government.
A-40
The Managing Director is responsible for supervising the operating departments and agencies of the City that render the City’s various municipal services. The Director of Commerce is charged with the responsibility of promoting and developing commerce and industry. The City Representative is the Ceremonial Representative of the City and especially of the Mayor. The City Representative is charged with the responsibility of giving wide publicity to any items of interest reflecting the activities of the City, its inhabitants and for the marketing and promotion of the image of the City.
The City Solicitor is head of the Law Department and acts as legal advisor to the Mayor, the City Council, and all of the agencies of the City government. The City Solicitor is also responsible for all of the City’s contracts and bonds, for assisting City Council, the Mayor, and City agencies in the preparation of ordinances for introduction in City Council, and for the conduct of litigation involving the City.
The Director of Finance is the chief financial and budget officer of the City and is selected from three names submitted to the Mayor by a Finance Panel. The Director of Finance is responsible for the financial functions of the City including development of the annual operating budget, the capital budget, and capital program; the City’s program for temporary and long-term borrowing; supervision of the operating budget’s execution; the collection of revenues through the Department of Revenue; and the oversight of pension administration as Chairperson of the Board of Pensions and Retirement. The Director of Finance is also responsible for the appointment and supervision of the City Treasurer, whose office manages the City’s debt program and serves as the disbursing agent for the distribution of checks and electronic payments from the City Treasury and the management of cash resources.
The following are brief biographies of Mayor Nutter, his chief of staff, his cabinet, as defined in the City Charter, the City Controller and the City Treasurer:
Michael A. Nutter, Mayor, was sworn in as the City’s 98th Mayor on January 7, 2008. He won the Democratic nomination in a five-way primary election. Elected to Philadelphia City Council in 1992, the Mayor represented the City’s Fourth Councilmatic District for nearly fifteen years. During his time in City Council, he engineered groundbreaking ethics reform legislation, led successful efforts to pass a citywide smoking ban, worked to lower taxes for Philadelphians and to reform the City’s tax structure, and labored to increase the number of Philadelphia police officers patrolling the streets and to create a Police Advisory Board to provide a forum for discussion between citizens and the Police Department. Mayor Nutter received his B.A. from the Wharton School of Business at the University of Pennsylvania in 1979.
Alan L. Butkovitz is serving his second term as the City’s elected City Controller, an office independent of the Mayor. Prior to his election as City Controller, Mr. Butkovitz served 15 years in the Pennsylvania House of Representatives, representing the 174th Legislative District in Northeast Philadelphia where he served on the Veterans Affairs and Urban Affairs Committees as well as committees on Aging and Older Adults, Children and Youth and Insurance. Mr. Butkovitz was widely praised for leading the bi-partisan investigation into violence in Philadelphia public schools. He authored legislation creating the Office of the Safe Schools Advocate, the first of its kind in the nation. Mr. Butkovitz was born and raised in the City. He is an attorney and received his Juris Doctor degree from Temple University Law School in 1976 and a bachelor’s degree from Temple University in 1973.
Suzanne Biemiller, Interim Chief of Staff, was appointed the City of Philadelphia’s Interim Chief of Staff by Mayor Michael A. Nutter on June 13, 2011. She had worked as Director of Policy, Planning and Coordination for the Mayor since January 2010. Previously, Ms. Biemiller worked as a consultant in the Mayor’s Office of Sustainability, where she was the principle author and producer of Greenworks Philadelphia, the Administration’s sustainability strategy. Prior to joining the Nutter Administration, Biemiller worked for The Pew Charitable Trusts as a senior program officer. While
A-41
there, she managed the creation of the Philadelphia Research Initiative and produced a number of reports on the city’s prospects and challenges. Ms. Biemiller also oversaw the start-ups of a number of local and national initiatives including the Transitional Work Corporation, Electionline.org, SoundAbout Philly and a Pennsylvania-based rural economic development effort. From 2003 to 2005, she took a leave from Pew to serve as the executive director of the Chestnut Hill Business Association. Ms. Biemiller has also worked as a legislative aide to former U.S. Representative Marjorie Margolies and as a project manager with the Philadelphia Industrial Development Corporation’s Navy Yard redevelopment effort. Ms. Biemiller graduated from Williams College with a Bachelor of Arts in American Studies and has a Masters in Public Policy degree from Harvard University’s Kennedy School of Government.
Richard Negrin, Deputy Mayor for Administration and Coordination and Managing Director, was appointed in July 2010. This Cabinet position has direct management responsibility over the City’s key infrastructure departments and coordinates across all City government to provide oversight and support to ensure optimal performance. In December 2009, Mr. Negrin was appointed by Mayor Nutter to serve as Executive Director of the Board of Revision of Taxes to provide strong leadership and to revitalize, restructure and reform the embattled agency. From November 2006 through December 2009, Mr. Negrin served as Vice-Chair of the independent Philadelphia Board of Ethics which helped to change the culture of government by providing guidance, education and training on ethics rules to the entire City workforce as well as to promote greater transparency in government by overseeing financial disclosures by City officials and having oversight related to campaign finance limits and disclosures. Prior to joining the City, Mr. Negrin was Vice President, Associate General Counsel, and a member of the Executive Leadership Council of ARAMARK Corporation. Prior to joining ARAMARK, Mr. Negrin was a litigator with the law firm of Morgan, Lewis & Bockius LLP and was a prosecutor in the Major Trials Unit of the Philadelphia District Attorney’s Office. Mr. Negrin is a graduate of Rutgers University School of Law, where he was the recipient of the Richard L. Barbour, Jr. Memorial Award. He received his Bachelor’s degree in political science from Wagner College where he received the Pre-Law Prize for academic excellence. During college, Mr. Negrin was a consensus football all-American and served as captain of the football team, helping to lead them to the small college National Championship in 1987. After college, Mr. Negrin played briefly in the National Football League, signing contracts with the Cleveland Browns in 1988 and the New York Jets in 1989.
Rob Dubow, Director of Finance, was appointed on January 7, 2008. The Director of Finance is the Chief Financial Officer of the City. Prior to his appointment, Mr. Dubow was the Executive Director of PICA. He served as Chief Financial Officer of the Commonwealth from 2004 to 2005. From 2000 to 2004, he served as Budget Director for the City, where he had also been a Deputy Budget Director and Assistant Budget Director. Before working for the City, Mr. Dubow was a Senior Financial Analyst for PICA. He also served as a Research Associate at the Pennsylvania Economy League and was a reporter for the Associated Press. Mr. Dubow earned a Masters in Business Administration degree from the Wharton School of Business and a Bachelor of Arts degree from the University of Pennsylvania.
Shelley R. Smith, City Solicitor, was appointed on January 7, 2008. The City Solicitor of the City of Philadelphia is the City’s chief legal officer, the head of the City’s Law Department, and a member of the Mayor’s Cabinet. Prior to her appointment, Ms. Smith was the Associate General Counsel for Regulatory Affairs - East at Exelon Corporation. Prior to joining Exelon, Ms. Smith was with Ballard Spahr as Of Counsel in the Labor, Employment & Immigration Group. Ms. Smith also spent more than a decade with the City’s Law Department where she was trial attorney and supervisor in the Civil Rights Unit, Chief of the Affirmative Litigation and Labor and Employment Units, and, finally, Chair of the Corporate and Tax Group.
Alan Greenberger, Deputy Mayor for Planning and Economic Development and Director of Commerce, was appointed on June 30, 2009. Mr. Greenberger is also the Executive Director of the City
A-42
Planning Commission where he chairs the Philadelphia Zoning Code Commission. A native of New York City, he moved to the City in 1974 to join Mitchell/Giurgola Architects. He became an associate of Mitchell/Giurgola in 1980, moved to Australia to join Mitchell/Giurgola & Thorpe, architects for the Australian Parliament House, and rejoined Mitchell/Giurgola in the City as a partner in 1986. In 1990, he and several partners at M/G changed the name of the firm to MGA Partners, where he practiced through 2008. He has been the lead designer on numerous MGA projects including the Department of State National Foreign Affairs Training Center, the West Chester University School of Music and Performing Arts Center, America on Wheels Museum, Lehigh University Linderman Library Renovation, Mann Center for the Performing Arts Master Plan and Pavilions, and the Centennial District Master Plan.
Melanie Johnson, City Representative, was appointed on January 7, 2008. The City Representative will promote and give wide publicity to items of interest reflecting the accomplishments of the City and its inhabitants and the growth and development of its commerce and industry. Ms. Johnson had served as the Director of Communications for the Nutter for Mayor Campaign since August of 2006. Prior experience includes her time as Press Secretary to Former Mayor Ed Rendell, Director of Communication for Multicultural Affairs Congress at Philadelphia Convention and Visitors Bureau, and Senior Account Executive at Beach Advertising.
Nancy E. Winkler, City Treasurer, was appointed City Treasurer effective January 31, 2011. Her responsibilities include oversight of all activities related to the issuance of debt by the City, managing the investment of approximately $2.0 billion of operating and bond funds as well as managing the City’s depository banking. Prior to her tenure with the City, Ms. Winkler worked for over twenty-eight years with Public Financial Management (the PFM Group), from 1990 to 2011 as Managing Director, with responsibility to manage the firm’s municipal, state and authority practices in New York and Maryland. Ms. Winkler holds a B.A. in American Studies and Economics from Georgetown University, where she was a George F. Baker Scholar.
PENNSYLVANIA INTERGOVERNMENTAL COOPERATION AUTHORITY
General
The Pennsylvania Intergovernmental Cooperation Authority (“PICA”) was created on June 5, 1991 by the Pennsylvania Intergovernmental Cooperation Authority Act for Cities of the First Class (the “PICA Act”). PICA was established to provide financial assistance to cities of the first class. The City is the only city of the first class in the Commonwealth. The Governor of Pennsylvania, the President pro tempore of the Pennsylvania Senate, the Minority Leader of the Pennsylvania Senate, the Speaker of the Pennsylvania House of Representatives and the Minority Leader of the Pennsylvania House of Representatives each appoints one voting member of PICA’s board. The Secretary of the Budget of the Commonwealth and the Director of Finance of the City serve as ex officio members of PICA’s board with no voting rights.
The PICA Act provides that, upon request by the City to PICA for financial assistance and for so long as any bonds issued by PICA remain outstanding, PICA shall have certain financial and oversight functions. PICA has the power, in its oversight capacity, to exercise certain advisory and review procedures with respect to the City’s financial affairs, including the power to review and approve five-year financial plans prepared at least annually by the City, and to certify non-compliance by the City with the then-existing five-year plan adopted by the City pursuant to the PICA Act. PICA is also required to certify non-compliance if, among other things, no approved five-year plan is in place; and PICA is required to certify non-compliance with an approved five-year plan if the City has failed to file mandatory revisions to an approved five-year plan. Under the PICA Act, any such certification of non-compliance would require the Secretary of the Budget of the Commonwealth to withhold payments due to the City
A-43
from the Commonwealth or any of its agencies (including, with certain exceptions, all grants, loans, entitlements and payment of the portion of the PICA Tax, hereinafter described, otherwise payable to the City). See “PICA Bonds” below. Under the PICA Act, the City is required to make quarterly financial reports to PICA, as further described under “Quarterly Reporting to PICA” below.
Five-Year Plans of the City
The PICA Act requires the City to annually develop a five-year financial plan and obtain PICA’s approval of it. The original five-year plan, which covered Fiscal Years 1992 through 1996, was prepared by the Mayor, approved by City Council on April 29, 1992 and by PICA on May 18, 1992. In each subsequent year, the City updated the previous year’s five-year plan, each of which was approved by PICA.
The City’s Eighteenth Five-Year Plan (the “Eighteenth Five-Year Plan”), covering Fiscal Years 2010-2014, included a one percent City Sales Tax increase through Fiscal Year 2014 and a partial deferral of the City’s pension payment in Fiscal Year 2010 ($150 million) and Fiscal Year 2011 ($80 million) to be paid back in full by Fiscal Year 2014, as permitted under Act 44 of 2009 of the General Assembly of the Commonwealth (“Act 44”). In addition to the deferrals, the City changed the amortization period from 20 years to 30 years and lowered the interest rate assumption from 8.75% to 8.25%.1 At PICA’s request, the Eighteenth Five-Year Plan was revised to include at least $25 million in additional savings or recurring revenues in each year of the Eighteenth Five-Year Plan. PICA approved the revised Eighteenth Five-Year Plan on September 16, 2009, subject to the enactment of the legislation authorizing the increase in the City’s sales tax and change in the City’s pension fund payments. The Commonwealth enacted such legislation on September 18, 2009.
The Mayor presented the Nineteenth Five-Year Plan (the “Nineteenth Five-Year Plan”) to City Council on March 4, 2010. City Council approved the Fiscal Year 2011 Budget on May 20, 2010, and the Mayor signed it on June 1, 2010. The Nineteenth Five-Year Plan was approved by PICA on August 10, 2010. The Nineteenth Five-Year Plan includes a temporary 9.9% Real Estate Tax increase through Fiscal Year 2012, which is estimated to generate $94.4 million in Fiscal Year 2011.
The Mayor presented the Twentieth Five-Year Plan (the “Twentieth Five-Year Plan”) to City Council on March 3, 2011. The adopted Fiscal Year 2012 Operating Budget conforms to the Twentieth Five-Year Plan. The Twentieth Five-Year Plan was approved by PICA on July 26, 2011.
Quarterly Reporting to PICA
The PICA Act requires the City to prepare and submit quarterly reports to PICA so that PICA may determine whether the City is in compliance with the then-current Five-Year Plan. Under the PICA Act, a “variance” is deemed to have occurred as of the end of a reporting period if (i) a net adverse change in the fund balance of a covered fund of more than 1% of the revenues budgeted for such fund for that fiscal year is reasonably projected to occur, such projection to be calculated from the beginning of the fiscal year for the entire fiscal year, or (ii) the actual net cash flows of the City for a covered fund are reasonably projected to be less than 95% of the net cash flows of the City for such covered fund for that fiscal year originally forecast at the time of adoption of the budget, such projection to be calculated from the beginning of the fiscal year for the entire fiscal year. The Mayor is required to provide a report to PICA that describes actual or current estimates of revenues, expenditures, and cash flows by covered funds compared to budgeted revenues, expenditures, and cash flows by covered funds for each month in
1 On October 28, 2010, the City’s Board of Pensions and Retirement voted to further lower the pension fund’s annual earnings assumption from 8.25% to 8.15%. This is reflected in subsequent five-year plans.
A-44
the previous quarter and for the year-to-date period from the beginning of the then-current fiscal year of the City to the last day of the fiscal quarter or month, as the case may be, just ended. Each such report is required to explain any variance existing as of such last day.
PICA may not take any action with respect to the City for variances if the City (i) provides a written explanation of the variance that PICA deems reasonable; (ii) proposes remedial action that PICA believes will restore overall compliance with the then-current Five-Year Plan; (iii) provides information in the immediately succeeding quarterly financial report demonstrating to the reasonable satisfaction of PICA that the City is taking remedial action and otherwise complying with the then-current Five-Year Plan; and (iv) submits monthly supplemental reports as required by the PICA Act. PICA last declared a variance in February 2009. It has since been removed and there are no current variances.
PICA Bonds
PICA has previously issued eleven series of bonds. Under the PICA Act, PICA no longer has the authority to issue bonds for new money purposes, but may refund bonds previously issued by it. Two series of bonds remain outstanding: (i) Special Tax Revenue Refunding Bonds (City of Philadelphia Funding Program), Series of 2009 issued in the original aggregate principal amount of $354,925,000, having a final stated maturity date of June 15, 2023 and (ii) Special Tax Revenue Refunding Bonds (City of Philadelphia Funding Program), Series of 2010 in the original principal amount of $206,960,000, having a final stated maturity date of June 15, 2022. As of the close of business on June 30, 2011, the principal amount of PICA bonds outstanding was $494,710,000.
The proceeds of the previous series of bonds issued by PICA were used (a) to make grants to the City to fund General Fund deficits of the City, to fund the costs of certain capital projects undertaken by the City, to provide other financial assistance to the City to enhance productivity in the operation of City government, and to defease certain general obligation bonds of the City, (b) to refund other bonds of PICA and (c) to pay costs of issuance.
The PICA Act authorized the City to impose a tax for the sole and exclusive purposes of PICA. In connection with the adoption of the Fiscal Year 1992 budget and the adoption of the first Five-Year Plan, the City reduced the wage, earnings, and net profits tax on City residents by 1.5% and enacted a PICA Tax of 1.5% tax on wages, earnings and net profits of City residents (the “PICA Tax”). Proceeds of the PICA Tax are solely the property of PICA. The PICA Tax, collected by the City’s Department of Revenue, is deposited in the “Pennsylvania Intergovernmental Cooperation Authority Tax Fund” (the “PICA Tax Fund”) of which the State Treasurer is custodian. The PICA Tax Fund is not subject to appropriation by City Council or the General Assembly of the Commonwealth.
The PICA Act authorizes PICA to pledge the PICA Tax to secure its bonds and prohibits the Commonwealth and the City from repealing the PICA Tax or reducing the rate of the PICA Tax while any bonds secured by the PICA Tax are outstanding. PICA bonds are payable from the PICA revenues, including the PICA Tax, pledged to secure PICA’s bonds, the Bond Payment Account (as described below) and any debt service reserve fund established for such bonds and have no claim on any revenues of the Commonwealth or the City.
The PICA Act requires that proceeds of the PICA Tax in excess of amounts required for (i) debt service, (ii) replenishment of any debt service reserve fund for bonds issued by PICA, and (iii) certain PICA operating expenses, be deposited in a trust fund established pursuant to the PICA Act exclusively for the benefit of the City and designated the “City Account.” Amounts in the City Account are required to be remitted to the City not less often than monthly, but are subject to withholding if PICA certifies the City’s non-compliance with the then-current five-year plan.
A-45
The PICA Act establishes a “Bond Payment Account” for PICA as a trust fund for the benefit of PICA bondholders and authorizes the creation of a debt service reserve fund for bonds issued by PICA. Since PICA has issued bonds secured by the PICA Tax, the PICA Act requires that the State Treasurer pay the proceeds of the PICA Tax held in the PICA Tax Fund directly to the Bond Payment Account, the debt service reserve fund created for bonds issued by PICA and the City Account.
The total amount of PICA Tax remitted to PICA by the State Treasurer (which is net of the costs of the State Treasurer in collecting the PICA Tax) for each of the Fiscal Years 2001 through 2010, current estimate for Fiscal Year 2011 and the adopted budget for Fiscal Year 2012 are set forth below.
[REMAINDER OF PAGE INTENTIONALLY LEFT BLANK]
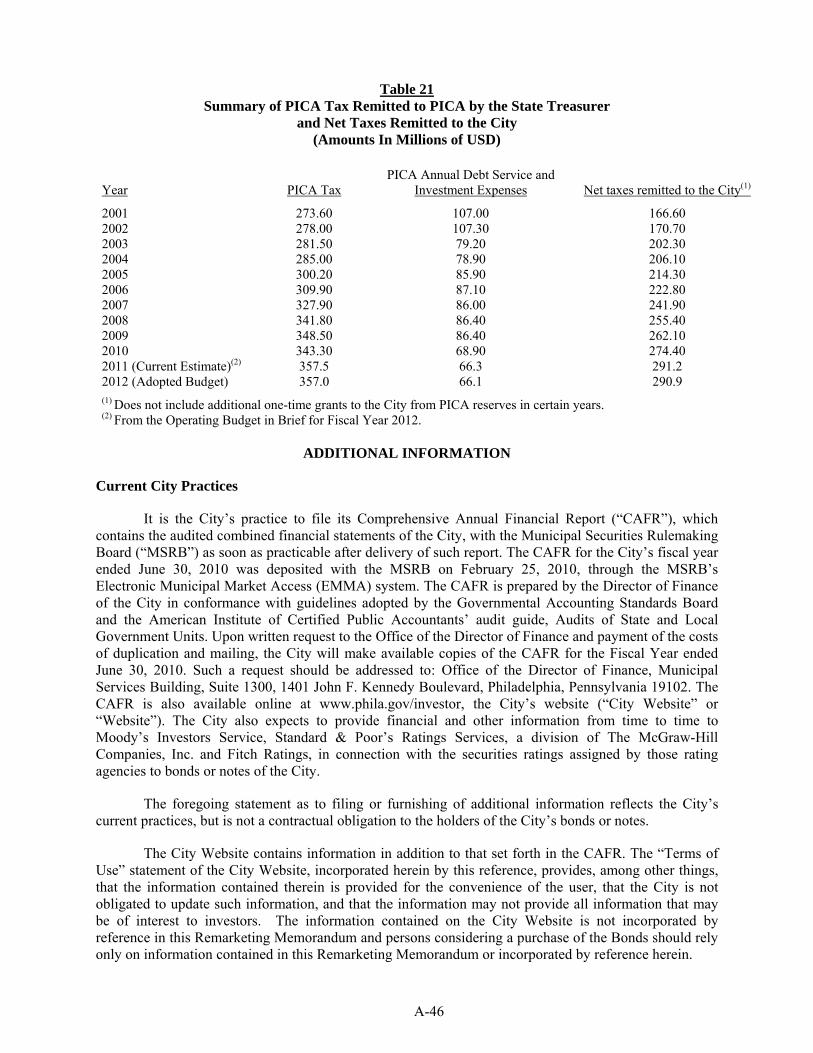
A-46
Table 21 Summary of PICA Tax Remitted to PICA by the State Treasurer
and Net Taxes Remitted to the City (Amounts In Millions of USD)
Year PICA Tax PICA Annual Debt Service and
Investment Expenses Net taxes remitted to the City(1)
2001 273.60 107.00 166.60 2002 278.00 107.30 170.70 2003 281.50 79.20 202.30 2004 285.00 78.90 206.10 2005 300.20 85.90 214.30 2006 309.90 87.10 222.80 2007 327.90 86.00 241.90 2008 341.80 86.40 255.40 2009 348.50 86.40 262.10 2010 343.30 68.90 274.40 2011 (Current Estimate)(2) 357.5 66.3 291.2 2012 (Adopted Budget) 357.0 66.1 290.9 (1) Does not include additional one-time grants to the City from PICA reserves in certain years. (2) From the Operating Budget in Brief for Fiscal Year 2012.
ADDITIONAL INFORMATION
Current City Practices
It is the City’s practice to file its Comprehensive Annual Financial Report (“CAFR”), which contains the audited combined financial statements of the City, with the Municipal Securities Rulemaking Board (“MSRB”) as soon as practicable after delivery of such report. The CAFR for the City’s fiscal year ended June 30, 2010 was deposited with the MSRB on February 25, 2010, through the MSRB’s Electronic Municipal Market Access (EMMA) system. The CAFR is prepared by the Director of Finance of the City in conformance with guidelines adopted by the Governmental Accounting Standards Board and the American Institute of Certified Public Accountants’ audit guide, Audits of State and Local Government Units. Upon written request to the Office of the Director of Finance and payment of the costs of duplication and mailing, the City will make available copies of the CAFR for the Fiscal Year ended June 30, 2010. Such a request should be addressed to: Office of the Director of Finance, Municipal Services Building, Suite 1300, 1401 John F. Kennedy Boulevard, Philadelphia, Pennsylvania 19102. The CAFR is also available online at www.phila.gov/investor, the City’s website (“City Website” or “Website”). The City also expects to provide financial and other information from time to time to Moody’s Investors Service, Standard & Poor’s Ratings Services, a division of The McGraw-Hill Companies, Inc. and Fitch Ratings, in connection with the securities ratings assigned by those rating agencies to bonds or notes of the City.
The foregoing statement as to filing or furnishing of additional information reflects the City’s current practices, but is not a contractual obligation to the holders of the City’s bonds or notes.
The City Website contains information in addition to that set forth in the CAFR. The “Terms of Use” statement of the City Website, incorporated herein by this reference, provides, among other things, that the information contained therein is provided for the convenience of the user, that the City is not obligated to update such information, and that the information may not provide all information that may be of interest to investors. The information contained on the City Website is not incorporated by reference in this Remarketing Memorandum and persons considering a purchase of the Bonds should rely only on information contained in this Remarketing Memorandum or incorporated by reference herein.
A-47
CITY SOCIOECONOMIC INFORMATION
Introduction
The City includes within its boundaries an area of approximately 130 square miles and a resident population of approximately 1.526 million according to the U.S. Census Bureau, 2010 Population Estimates. The City is in the heart of the eleven-county Philadelphia–Camden–Wilmington metropolitan statistical area with approximately six million residents. Air, rail, highway, and water routes provide easy access to the City.
The City, the fifth largest in the United States, is strategically located on the east coast with easy access to markets, resources, government centers, and transportation. The City’s metropolitan area is the nation’s fourth largest retail market with over 2,500 retail stores in Center City Philadelphia.
Quality of Life
The City is rich in history, art, architecture, and entertainment. World-class cultural and historic attractions include the Philadelphia Museum of Art (which houses the third largest art collection in the United States), the Philadelphia Orchestra, Academy of Music, Pennsylvania Ballet, the Constitution Center, the Kimmel Center, Pennsylvania Academy of Fine Arts, Franklin Institute, Mann Music Center, Opera Company of Philadelphia, and the Rodin Museum. The South Philadelphia sports complex, currently consisting of Lincoln Financial Field, Citizens Bank Park and the Wells Fargo Center, is home to the Philadelphia 76ers, Flyers, Phillies and Eagles. The City also offers its residents and visitors America’s most historic square mile, which includes Independence Hall and the Liberty Bell, as well as Fairmount Park, which spans 8,000 acres and includes Pennypack Park and the country’s first zoo.
The City is a center for health, education, and science facilities with the nation’s largest concentration of healthcare resources within a 100-mile radius. There are presently more than 30 hospitals, seven medical schools, two dental schools, two pharmacy schools, as well as schools of optometry, podiatry and veterinary medicine, and the Philadelphia Center for Health Care Sciences in West Philadelphia. The City is one of the largest health care and health care education centers in the world, and a number of the nation’s largest pharmaceutical companies are located in the Philadelphia area.
The City has the second largest concentration of students on the East Coast with eighty degree granting institutions of higher education and a total enrollment of over 300,000 students. Included among these institutions are the University of Pennsylvania, Temple University, Drexel University, St. Joseph’s University, and LaSalle University. Within a short drive from the City are such schools as Villanova University, Bryn Mawr College, Haverford College, Swarthmore College, Lincoln University, and the Camden Campus of Rutgers University. The undergraduate and graduate programs at these institutions help provide a well-educated and trained work force to the Philadelphia community.
Hospitals and Medical Centers
The City also has major research facilities, including those located at its universities, the medical schools, The Wistar Institute, the Fox Chase Cancer Center, and the University City Science Center. The Children’s Hospital of Philadelphia has recently completed the construction of a new $400 million biomedical research facility located within the Philadelphia Center for Health Care Sciences in West Philadelphia. A Comprehensive Cancer Center is also located at the University of Pennsylvania.
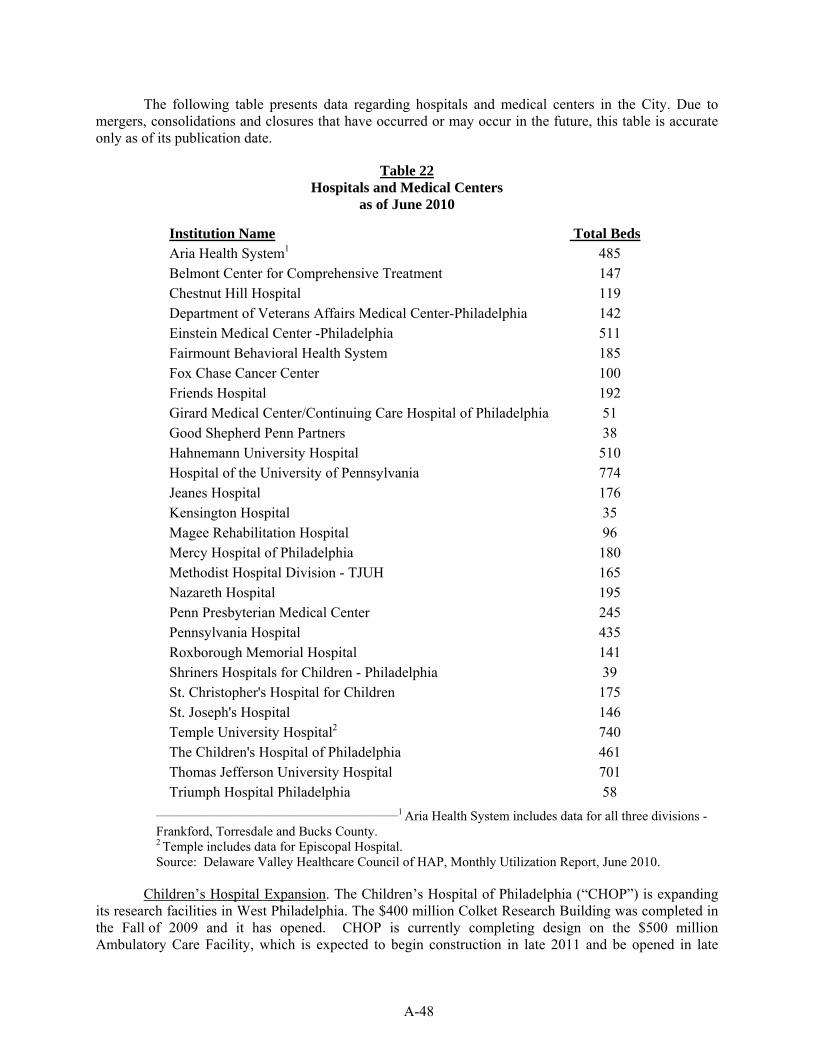
A-48
The following table presents data regarding hospitals and medical centers in the City. Due to mergers, consolidations and closures that have occurred or may occur in the future, this table is accurate only as of its publication date.
Table 22 Hospitals and Medical Centers
as of June 2010
Institution Name Total Beds Aria Health System1 485 Belmont Center for Comprehensive Treatment 147 Chestnut Hill Hospital 119 Department of Veterans Affairs Medical Center-Philadelphia 142 Einstein Medical Center -Philadelphia 511 Fairmount Behavioral Health System 185 Fox Chase Cancer Center 100 Friends Hospital 192 Girard Medical Center/Continuing Care Hospital of Philadelphia 51 Good Shepherd Penn Partners 38 Hahnemann University Hospital 510 Hospital of the University of Pennsylvania 774 Jeanes Hospital 176 Kensington Hospital 35 Magee Rehabilitation Hospital 96 Mercy Hospital of Philadelphia 180 Methodist Hospital Division - TJUH 165 Nazareth Hospital 195 Penn Presbyterian Medical Center 245 Pennsylvania Hospital 435 Roxborough Memorial Hospital 141 Shriners Hospitals for Children - Philadelphia 39 St. Christopher's Hospital for Children 175 St. Joseph's Hospital 146 Temple University Hospital2 740 The Children's Hospital of Philadelphia 461 Thomas Jefferson University Hospital 701 Triumph Hospital Philadelphia 58
________________________________________________________1 Aria Health System includes data for all three divisions - Frankford, Torresdale and Bucks County. 2 Temple includes data for Episcopal Hospital. Source: Delaware Valley Healthcare Council of HAP, Monthly Utilization Report, June 2010.
Children’s Hospital Expansion. The Children’s Hospital of Philadelphia (“CHOP”) is expanding its research facilities in West Philadelphia. The $400 million Colket Research Building was completed in the Fall of 2009 and it has opened. CHOP is currently completing design on the $500 million Ambulatory Care Facility, which is expected to begin construction in late 2011 and be opened in late
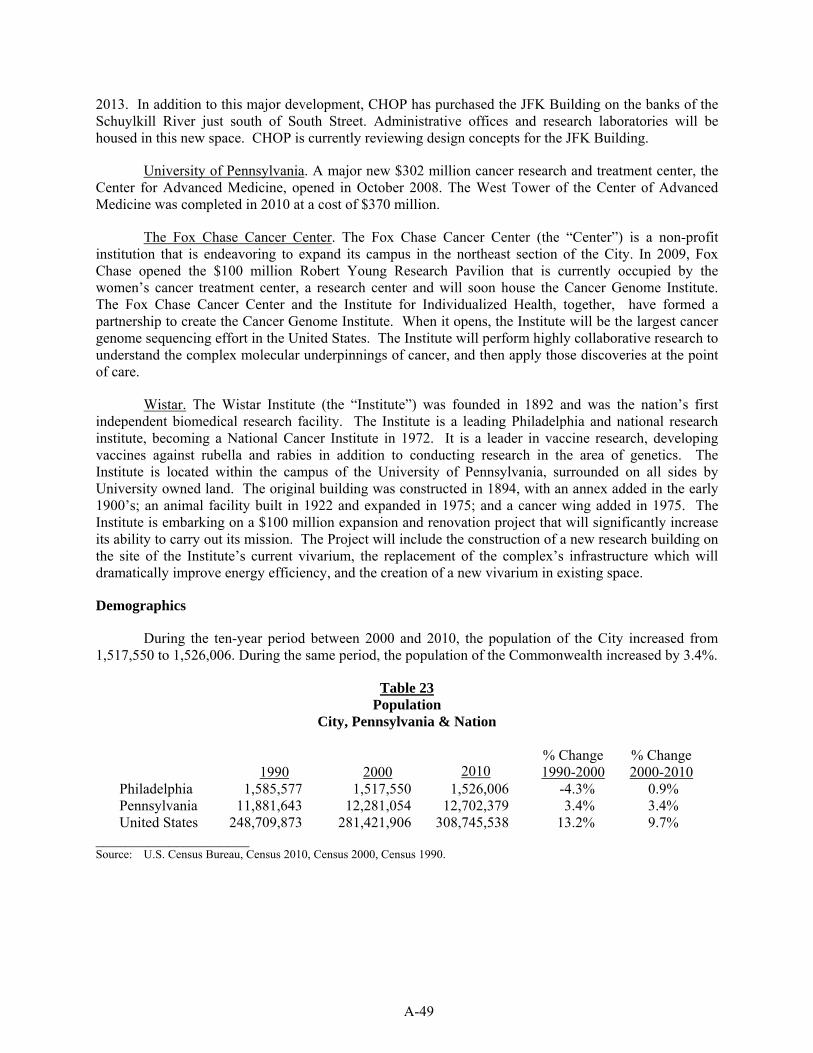
A-49
2013. In addition to this major development, CHOP has purchased the JFK Building on the banks of the Schuylkill River just south of South Street. Administrative offices and research laboratories will be housed in this new space. CHOP is currently reviewing design concepts for the JFK Building.
University of Pennsylvania. A major new $302 million cancer research and treatment center, the Center for Advanced Medicine, opened in October 2008. The West Tower of the Center of Advanced Medicine was completed in 2010 at a cost of $370 million.
The Fox Chase Cancer Center. The Fox Chase Cancer Center (the “Center”) is a non-profit institution that is endeavoring to expand its campus in the northeast section of the City. In 2009, Fox Chase opened the $100 million Robert Young Research Pavilion that is currently occupied by the women’s cancer treatment center, a research center and will soon house the Cancer Genome Institute. The Fox Chase Cancer Center and the Institute for Individualized Health, together, have formed a partnership to create the Cancer Genome Institute. When it opens, the Institute will be the largest cancer genome sequencing effort in the United States. The Institute will perform highly collaborative research to understand the complex molecular underpinnings of cancer, and then apply those discoveries at the point of care.
Wistar. The Wistar Institute (the “Institute”) was founded in 1892 and was the nation’s first independent biomedical research facility. The Institute is a leading Philadelphia and national research institute, becoming a National Cancer Institute in 1972. It is a leader in vaccine research, developing vaccines against rubella and rabies in addition to conducting research in the area of genetics. The Institute is located within the campus of the University of Pennsylvania, surrounded on all sides by University owned land. The original building was constructed in 1894, with an annex added in the early 1900’s; an animal facility built in 1922 and expanded in 1975; and a cancer wing added in 1975. The Institute is embarking on a $100 million expansion and renovation project that will significantly increase its ability to carry out its mission. The Project will include the construction of a new research building on the site of the Institute’s current vivarium, the replacement of the complex’s infrastructure which will dramatically improve energy efficiency, and the creation of a new vivarium in existing space.
Demographics
During the ten-year period between 2000 and 2010, the population of the City increased from 1,517,550 to 1,526,006. During the same period, the population of the Commonwealth increased by 3.4%.
Table 23 Population
City, Pennsylvania & Nation
1990 2000 2010 % Change 1990-2000
% Change 2000-2010
Philadelphia 1,585,577 1,517,550 1,526,006 -4.3% 0.9% Pennsylvania 11,881,643 12,281,054 12,702,379 3.4% 3.4% United States 248,709,873 281,421,906 308,745,538 13.2% 9.7%
_____________________ Source: U.S. Census Bureau, Census 2010, Census 2000, Census 1990.
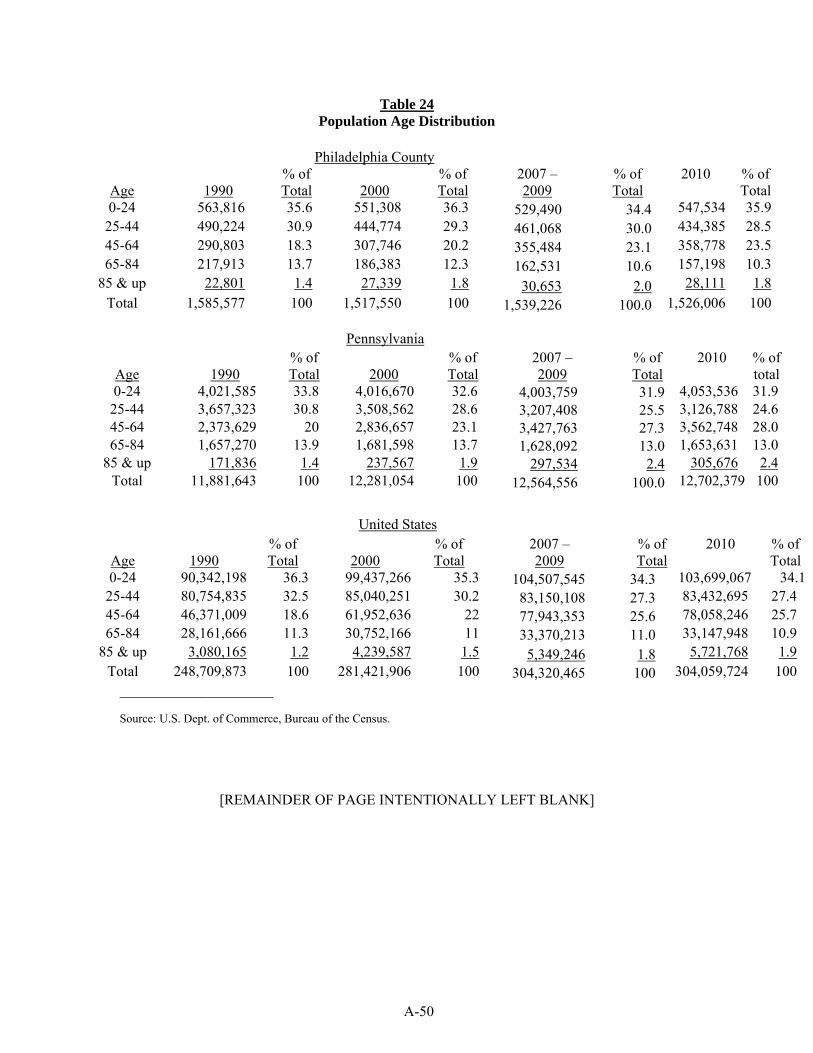
A-50
Table 24 Population Age Distribution
Philadelphia County
Age
1990 % of
Total
2000 % of
Total 2007 – 2009
% of Total
2010 % of Total
0-24 563,816 35.6 551,308 36.3 529,490 34.4 547,534 35.925-44 490,224 30.9 444,774 29.3 461,068 30.0 434,385 28.545-64 290,803 18.3 307,746 20.2 355,484 23.1 358,778 23.565-84 217,913 13.7 186,383 12.3 162,531 10.6 157,198 10.3
85 & up 22,801 1.4 27,339 1.8 30,653 2.0 28,111 1.8Total 1,585,577 100 1,517,550 100 1,539,226 100.0 1,526,006 100
Pennsylvania
Age
1990
% of Total
2000
% of Total
2007 – 2009
% of Total
2010 % of total
0-24 4,021,585 33.8 4,016,670 32.6 4,003,759 31.9 4,053,536 31.925-44 3,657,323 30.8 3,508,562 28.6 3,207,408 25.5 3,126,788 24.645-64 2,373,629 20 2,836,657 23.1 3,427,763 27.3 3,562,748 28.065-84 1,657,270 13.9 1,681,598 13.7 1,628,092 13.0 1,653,631 13.0
85 & up 171,836 1.4 237,567 1.9 297,534 2.4 305,676 2.4Total 11,881,643 100 12,281,054 100 12,564,556 100.0 12,702,379 100
United States
Age
1990 % of
Total
2000 % of
Total 2007 – 2009
% of Total
2010 % of Total
0-24 90,342,198 36.3 99,437,266 35.3 104,507,545 34.3 103,699,067 34.1 25-44 80,754,835 32.5 85,040,251 30.2 83,150,108 27.3 83,432,695 27.4 45-64 46,371,009 18.6 61,952,636 22 77,943,353 25.6 78,058,246 25.7 65-84 28,161,666 11.3 30,752,166 11 33,370,213 11.0 33,147,948 10.9
85 & up 3,080,165 1.2 4,239,587 1.5 5,349,246 1.8 5,721,768 1.9 Total 248,709,873 100 281,421,906 100 304,320,465 100 304,059,724 100
_____________________ Source: U.S. Dept. of Commerce, Bureau of the Census.
[REMAINDER OF PAGE INTENTIONALLY LEFT BLANK]
A-51
The Economy
The City’s economy is composed of diverse industries, with virtually all classes of industrial and commercial businesses represented. The City is a major business and personal service center with strengths in insurance, law, finance, health, education, and utilities.
The cost of living in the City is relatively moderate compared to other major metropolitan areas. The City, as one of the country’s education centers, offers the business community a large, diverse, and industrious labor pool.
[REMAINDER OF PAGE INTENTIONALLY LEFT BLANK]
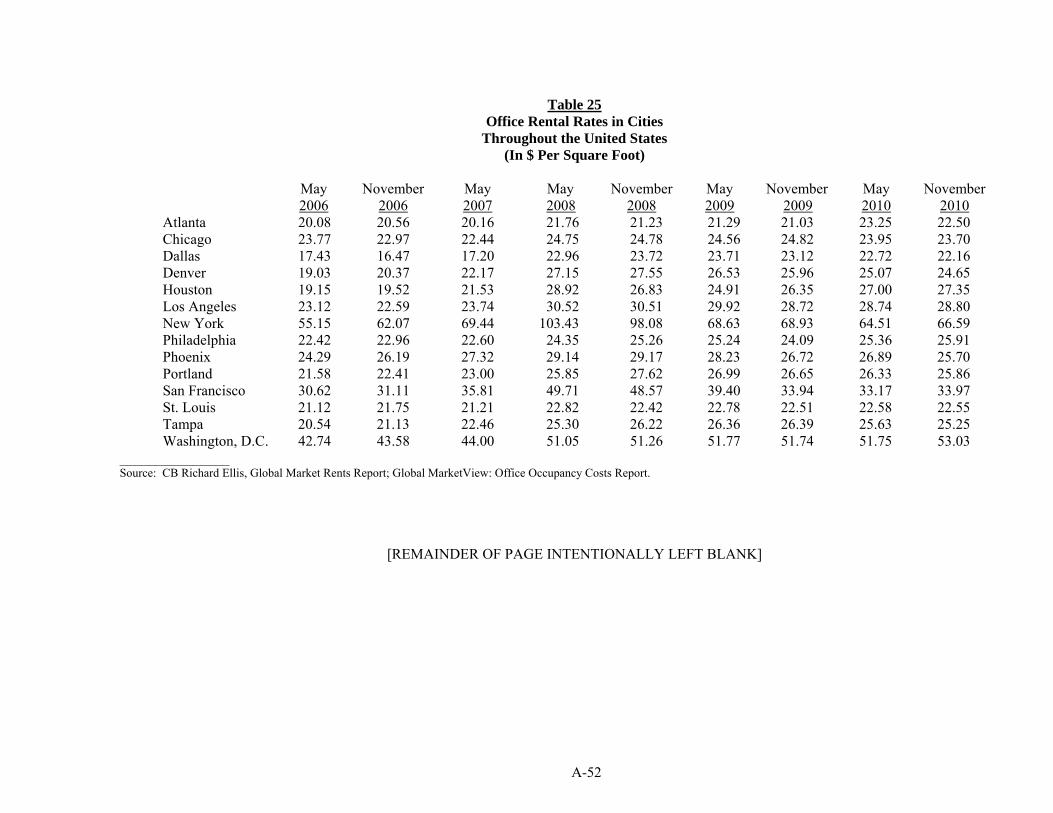
A-52
Table 25 Office Rental Rates in Cities
Throughout the United States (In $ Per Square Foot)
May
2006 November
2006 May 2007
May 2008
November 2008
May 2009
November 2009
May 2010
November 2010
Atlanta 20.08 20.56 20.16 21.76 21.23 21.29 21.03 23.25 22.50 Chicago 23.77 22.97 22.44 24.75 24.78 24.56 24.82 23.95 23.70 Dallas 17.43 16.47 17.20 22.96 23.72 23.71 23.12 22.72 22.16 Denver 19.03 20.37 22.17 27.15 27.55 26.53 25.96 25.07 24.65 Houston 19.15 19.52 21.53 28.92 26.83 24.91 26.35 27.00 27.35 Los Angeles 23.12 22.59 23.74 30.52 30.51 29.92 28.72 28.74 28.80 New York 55.15 62.07 69.44 103.43 98.08 68.63 68.93 64.51 66.59 Philadelphia 22.42 22.96 22.60 24.35 25.26 25.24 24.09 25.36 25.91 Phoenix 24.29 26.19 27.32 29.14 29.17 28.23 26.72 26.89 25.70 Portland 21.58 22.41 23.00 25.85 27.62 26.99 26.65 26.33 25.86 San Francisco 30.62 31.11 35.81 49.71 48.57 39.40 33.94 33.17 33.97 St. Louis 21.12 21.75 21.21 22.82 22.42 22.78 22.51 22.58 22.55 Tampa 20.54 21.13 22.46 25.30 26.22 26.36 26.39 25.63 25.25 Washington, D.C. 42.74 43.58 44.00 51.05 51.26 51.77 51.74 51.75 53.03
_______________ Source: CB Richard Ellis, Global Market Rents Report; Global MarketView: Office Occupancy Costs Report.
[REMAINDER OF PAGE INTENTIONALLY LEFT BLANK]
A-53
Employment
The employment and unemployment rates and the total number of jobs within the City are reflected in Tables 26 and 27, respectively.
Overall, the employment base has undergone a gradual shift over the last decade, most notably marked by growth in leisure/hospitality and education/health services sector employment. However the overall gap between local and national unemployment remains due to market conditions brought on by the nation’s financial crisis. The City’s and region’s economies are diversified, with strong representation in the health care, government, and education sectors but without the domination of any single employer or industry.
The employment changes within the City principally have been due to declines in the manufacturing sector and the relatively stronger performance of the service economy. Although the jobs report is mixed, Philadelphia has recovered nearly 7,000 jobs since 2009 and the City’s job levels are consistent with average levels dating from 2004. As reflected in the Table 28, total employment has generally trended upwards in education/healthcare and leisure/hospitality over the entire period shown, while overall growth decreased slightly in 2009 and continues to be sluggish.
In March 2000, PAID assumed ownership of more than 1,200 acres at the site of the former Philadelphia Navy Shipyard, Naval Station, Naval Hospital and Defense Supply Center and began implementing an aggressive redevelopment campaign. To date, at least 115 companies and three Navy operations have leased or purchased in excess of 5.5 million square feet of facilities at the complex, now known as The Navy Yard. The Navy has retained more than two million square feet of facilities. Together, the private and Navy facilities employ more than 8,000 people. The Navy Yard’s long-term development plans call for more than ten million square feet of developed industrial and commercial space and employment ranging between 15,000-25,000 persons.
[REMAINDER OF PAGE INTENTIONALLY LEFT BLANK]
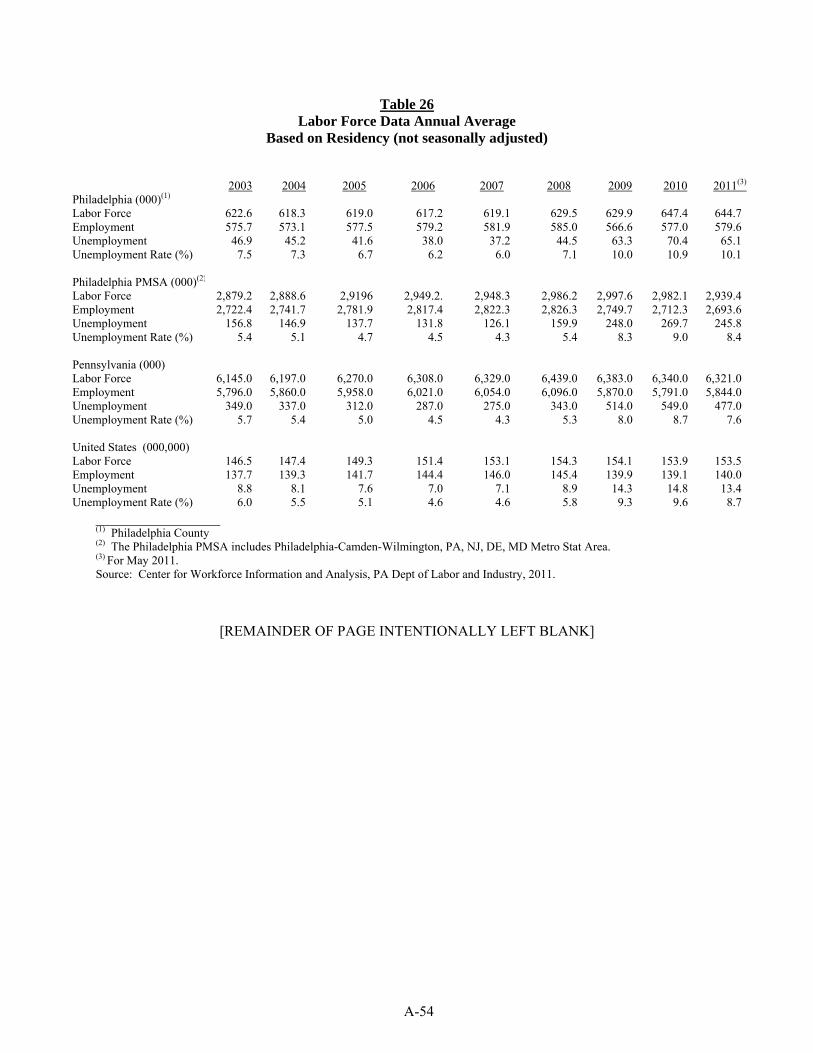
A-54
Table 26 Labor Force Data Annual Average
Based on Residency (not seasonally adjusted)
2003 2004 2005 2006 2007 2008 2009 2010 2011(3)
Philadelphia (000)(1) Labor Force 622.6 618.3 619.0 617.2 619.1 629.5 629.9 647.4 644.7 Employment 575.7 573.1 577.5 579.2 581.9 585.0 566.6 577.0 579.6 Unemployment 46.9 45.2 41.6 38.0 37.2 44.5 63.3 70.4 65.1 Unemployment Rate (%) 7.5 7.3 6.7 6.2 6.0 7.1 10.0 10.9 10.1 Philadelphia PMSA (000)(2) Labor Force 2,879.2 2,888.6 2,9196 2,949.2. 2,948.3 2,986.2 2,997.6 2,982.1 2,939.4 Employment 2,722.4 2,741.7 2,781.9 2,817.4 2,822.3 2,826.3 2,749.7 2,712.3 2,693.6 Unemployment 156.8 146.9 137.7 131.8 126.1 159.9 248.0 269.7 245.8 Unemployment Rate (%) 5.4 5.1 4.7 4.5 4.3 5.4 8.3 9.0 8.4 Pennsylvania (000) Labor Force 6,145.0 6,197.0 6,270.0 6,308.0 6,329.0 6,439.0 6,383.0 6,340.0 6,321.0 Employment 5,796.0 5,860.0 5,958.0 6,021.0 6,054.0 6,096.0 5,870.0 5,791.0 5,844.0 Unemployment 349.0 337.0 312.0 287.0 275.0 343.0 514.0 549.0 477.0 Unemployment Rate (%) 5.7 5.4 5.0 4.5 4.3 5.3 8.0 8.7 7.6 United States (000,000) Labor Force 146.5 147.4 149.3 151.4 153.1 154.3 154.1 153.9 153.5 Employment 137.7 139.3 141.7 144.4 146.0 145.4 139.9 139.1 140.0 Unemployment 8.8 8.1 7.6 7.0 7.1 8.9 14.3 14.8 13.4 Unemployment Rate (%) 6.0 5.5 5.1 4.6 4.6 5.8 9.3 9.6 8.7
_________________ (1) Philadelphia County (2) The Philadelphia PMSA includes Philadelphia-Camden-Wilmington, PA, NJ, DE, MD Metro Stat Area. (3) For May 2011. Source: Center for Workforce Information and Analysis, PA Dept of Labor and Industry, 2011.
[REMAINDER OF PAGE INTENTIONALLY LEFT BLANK]
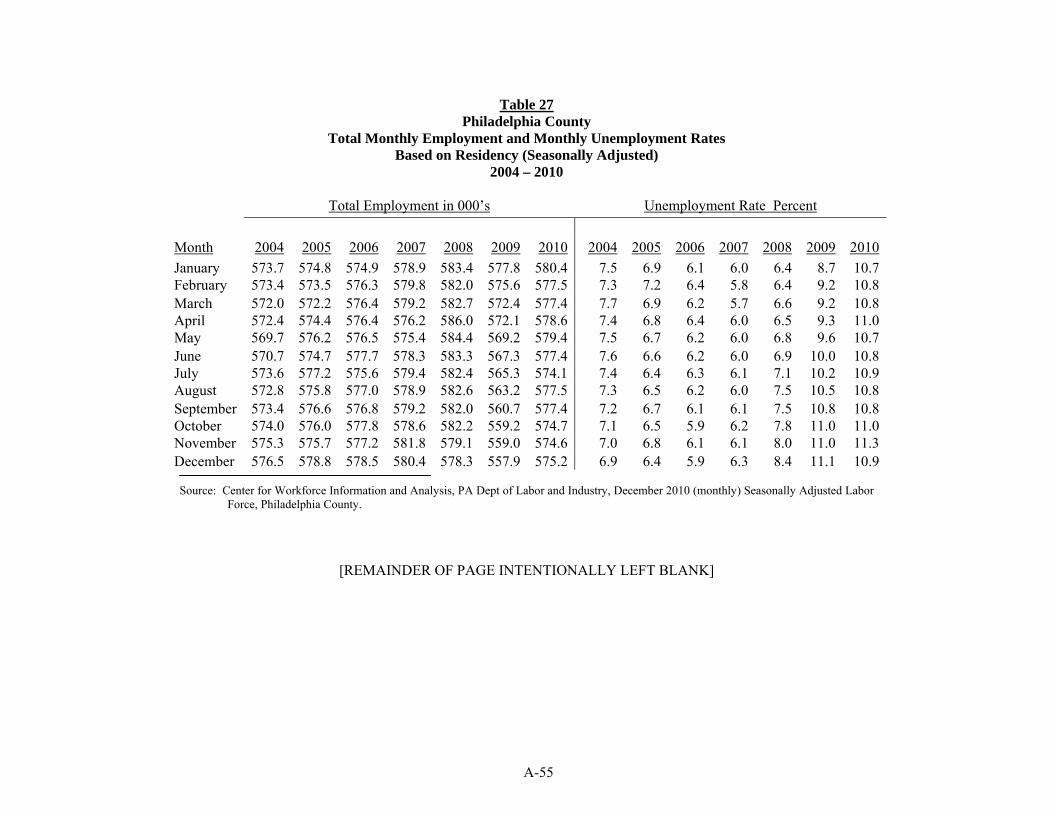
A-55
Table 27 Philadelphia County
Total Monthly Employment and Monthly Unemployment Rates Based on Residency (Seasonally Adjusted)
2004 – 2010
Total Employment in 000’s Unemployment Rate Percent
Month 2004 2005 2006 2007 2008 2009 2010 2004 2005 2006 2007 2008 2009 2010
January 573.7 574.8 574.9 578.9 583.4 577.8 580.4 7.5 6.9 6.1 6.0 6.4 8.7 10.7February 573.4 573.5 576.3 579.8 582.0 575.6 577.5 7.3 7.2 6.4 5.8 6.4 9.2 10.8March 572.0 572.2 576.4 579.2 582.7 572.4 577.4 7.7 6.9 6.2 5.7 6.6 9.2 10.8April 572.4 574.4 576.4 576.2 586.0 572.1 578.6 7.4 6.8 6.4 6.0 6.5 9.3 11.0May 569.7 576.2 576.5 575.4 584.4 569.2 579.4 7.5 6.7 6.2 6.0 6.8 9.6 10.7June 570.7 574.7 577.7 578.3 583.3 567.3 577.4 7.6 6.6 6.2 6.0 6.9 10.0 10.8July 573.6 577.2 575.6 579.4 582.4 565.3 574.1 7.4 6.4 6.3 6.1 7.1 10.2 10.9August 572.8 575.8 577.0 578.9 582.6 563.2 577.5 7.3 6.5 6.2 6.0 7.5 10.5 10.8September 573.4 576.6 576.8 579.2 582.0 560.7 577.4 7.2 6.7 6.1 6.1 7.5 10.8 10.8October 574.0 576.0 577.8 578.6 582.2 559.2 574.7 7.1 6.5 5.9 6.2 7.8 11.0 11.0November 575.3 575.7 577.2 581.8 579.1 559.0 574.6 7.0 6.8 6.1 6.1 8.0 11.0 11.3December 576.5 578.8 578.5 580.4 578.3 557.9 575.2 6.9 6.4 5.9 6.3 8.4 11.1 10.9
Source: Center for Workforce Information and Analysis, PA Dept of Labor and Industry, December 2010 (monthly) Seasonally Adjusted Labor
Force, Philadelphia County.
[REMAINDER OF PAGE INTENTIONALLY LEFT BLANK]
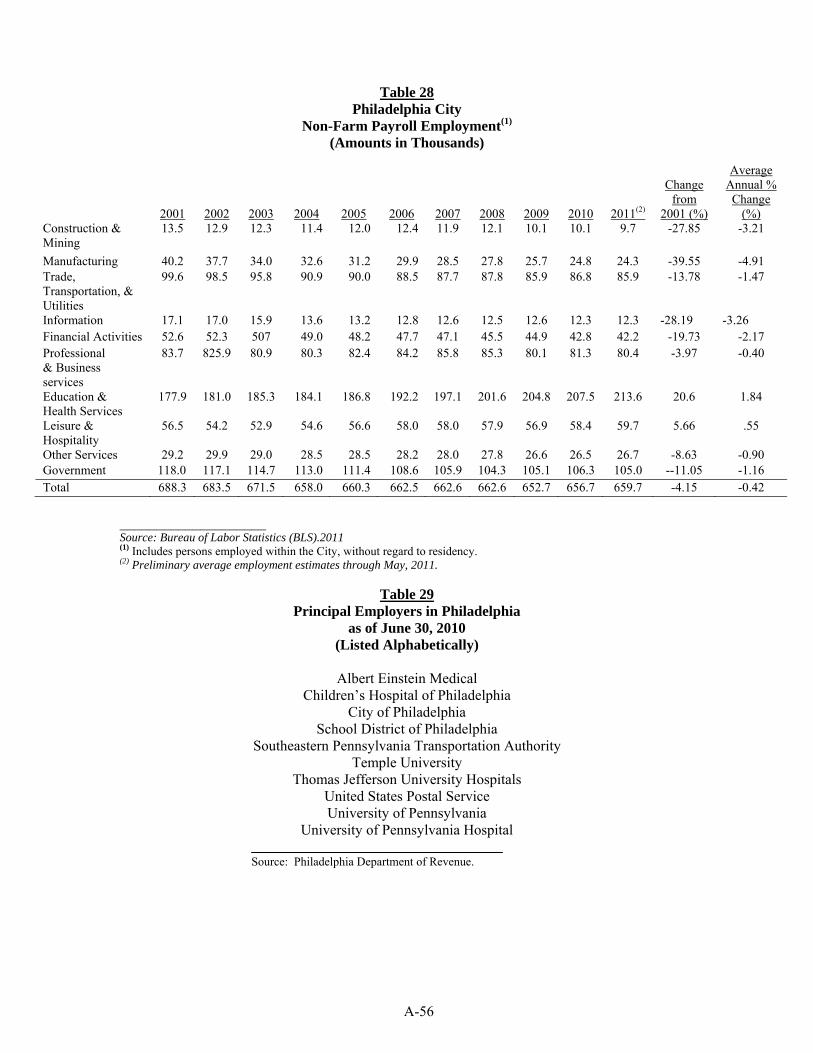
A-56
Table 28 Philadelphia City
Non-Farm Payroll Employment(1) (Amounts in Thousands)
____________________ Source: Bureau of Labor Statistics (BLS).2011
(1) Includes persons employed within the City, without regard to residency. (2) Preliminary average employment estimates through May, 2011.
Table 29 Principal Employers in Philadelphia
as of June 30, 2010 (Listed Alphabetically)
Albert Einstein Medical
Children’s Hospital of Philadelphia City of Philadelphia
School District of Philadelphia Southeastern Pennsylvania Transportation Authority
Temple University Thomas Jefferson University Hospitals
United States Postal Service University of Pennsylvania
University of Pennsylvania Hospital
Source: Philadelphia Department of Revenue.
2001 2002 2003 2004 2005 2006 2007 2008 2009 2010 2011(2)
Change from
2001 (%)
Average Annual % Change
(%) Construction & Mining
13.5 12.9 12.3 11.4 12.0 12.4 11.9 12.1 10.1 10.1 9.7 -27.85 -3.21
Manufacturing 40.2 37.7 34.0 32.6 31.2 29.9 28.5 27.8 25.7 24.8 24.3 -39.55 -4.91 Trade, Transportation, & Utilities
99.6 98.5 95.8 90.9 90.0 88.5 87.7 87.8 85.9 86.8 85.9 -13.78 -1.47
Information 17.1 17.0 15.9 13.6 13.2 12.8 12.6 12.5 12.6 12.3 12.3 -28.19 -3.26 Financial Activities 52.6 52.3 507 49.0 48.2 47.7 47.1 45.5 44.9 42.8 42.2 -19.73 -2.17 Professional & Business services
83.7 825.9 80.9 80.3 82.4 84.2 85.8 85.3 80.1 81.3 80.4 -3.97 -0.40
Education & Health Services
177.9 181.0 185.3 184.1 186.8 192.2 197.1 201.6 204.8 207.5 213.6 20.6 1.84
Leisure & Hospitality
56.5 54.2 52.9 54.6 56.6 58.0 58.0 57.9 56.9 58.4 59.7 5.66 .55
Other Services 29.2 29.9 29.0 28.5 28.5 28.2 28.0 27.8 26.6 26.5 26.7 -8.63 -0.90 Government 118.0 117.1 114.7 113.0 111.4 108.6 105.9 104.3 105.1 106.3 105.0 --11.05 -1.16 Total 688.3 683.5 671.5 658.0 660.3 662.5 662.6 662.6 652.7 656.7 659.7 -4.15 -0.42
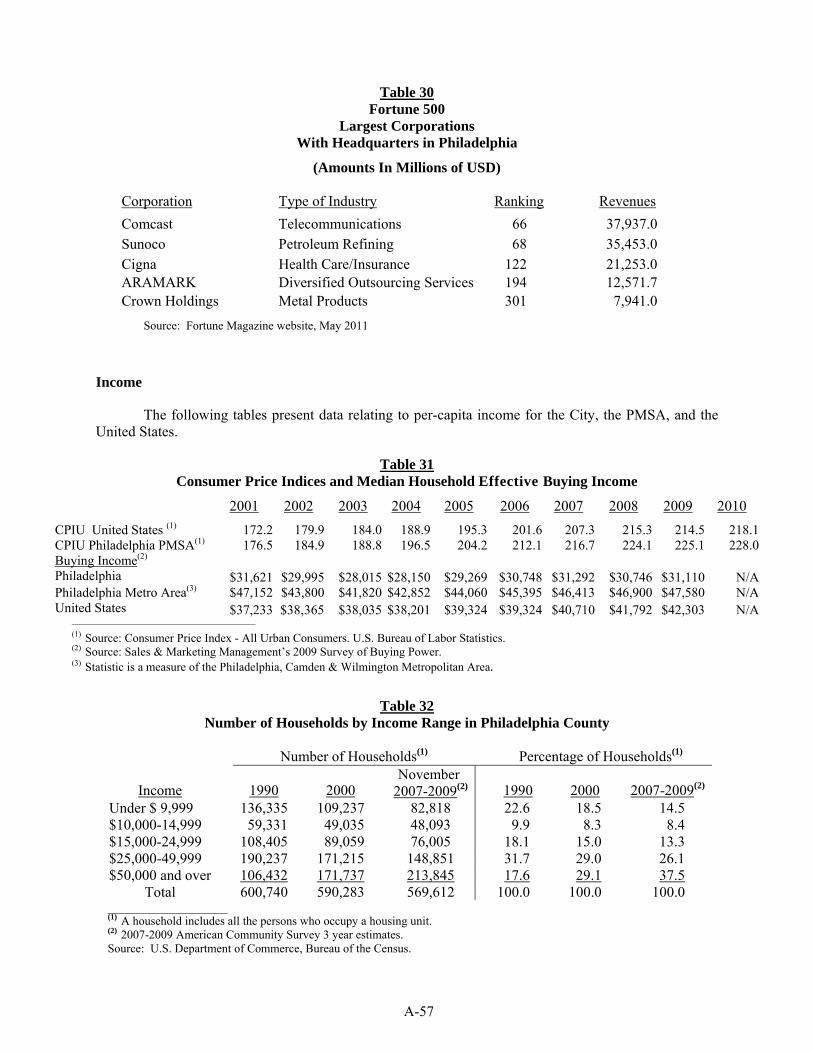
A-57
Table 30 Fortune 500
Largest Corporations With Headquarters in Philadelphia
(Amounts In Millions of USD)
Corporation Type of Industry Ranking Revenues
Comcast Telecommunications 66 37,937.0 Sunoco Petroleum Refining 68 35,453.0 Cigna Health Care/Insurance 122 21,253.0 ARAMARK Diversified Outsourcing Services 194 12,571.7 Crown Holdings Metal Products 301 7,941.0
Source: Fortune Magazine website, May 2011
Income
The following tables present data relating to per-capita income for the City, the PMSA, and the United States.
Table 31 Consumer Price Indices and Median Household Effective Buying Income
2001 2002 2003 2004 2005 2006 2007 2008 2009 2010
CPIU United States (1) 172.2 179.9 184.0 188.9 195.3 201.6 207.3 215.3 214.5 218.1CPIU Philadelphia PMSA(1) 176.5 184.9 188.8 196.5 204.2 212.1 216.7 224.1 225.1 228.0Buying Income(2) Philadelphia $31,621 $29,995 $28,015 $28,150 $29,269 $30,748 $31,292 $30,746 $31,110 N/APhiladelphia Metro Area(3) $47,152 $43,800 $41,820 $42,852 $44,060 $45,395 $46,413 $46,900 $47,580 N/AUnited States $37,233 $38,365 $38,035 $38,201 $39,324 $39,324 $40,710 $41,792 $42,303 N/A
______________________________________________
(1) Source: Consumer Price Index - All Urban Consumers. U.S. Bureau of Labor Statistics. (2) Source: Sales & Marketing Management’s 2009 Survey of Buying Power. (3) Statistic is a measure of the Philadelphia, Camden & Wilmington Metropolitan Area.
Table 32
Number of Households by Income Range in Philadelphia County
Number of Households(1) Percentage of Households(1)
Income 1990 2000 November
2007-2009(2)
1990 2000 2007-2009(2) Under $ 9,999 136,335 109,237 82,818 22.6 18.5 14.5 $10,000-14,999 59,331 49,035 48,093 9.9 8.3 8.4 $15,000-24,999 108,405 89,059 76,005 18.1 15.0 13.3 $25,000-49,999 190,237 171,215 148,851 31.7 29.0 26.1 $50,000 and over 106,432 171,737 213,845 17.6 29.1 37.5
Total 600,740 590,283 569,612 100.0 100.0 100.0 ____________________ (1) A household includes all the persons who occupy a housing unit. (2) 2007-2009 American Community Survey 3 year estimates. Source: U.S. Department of Commerce, Bureau of the Census.
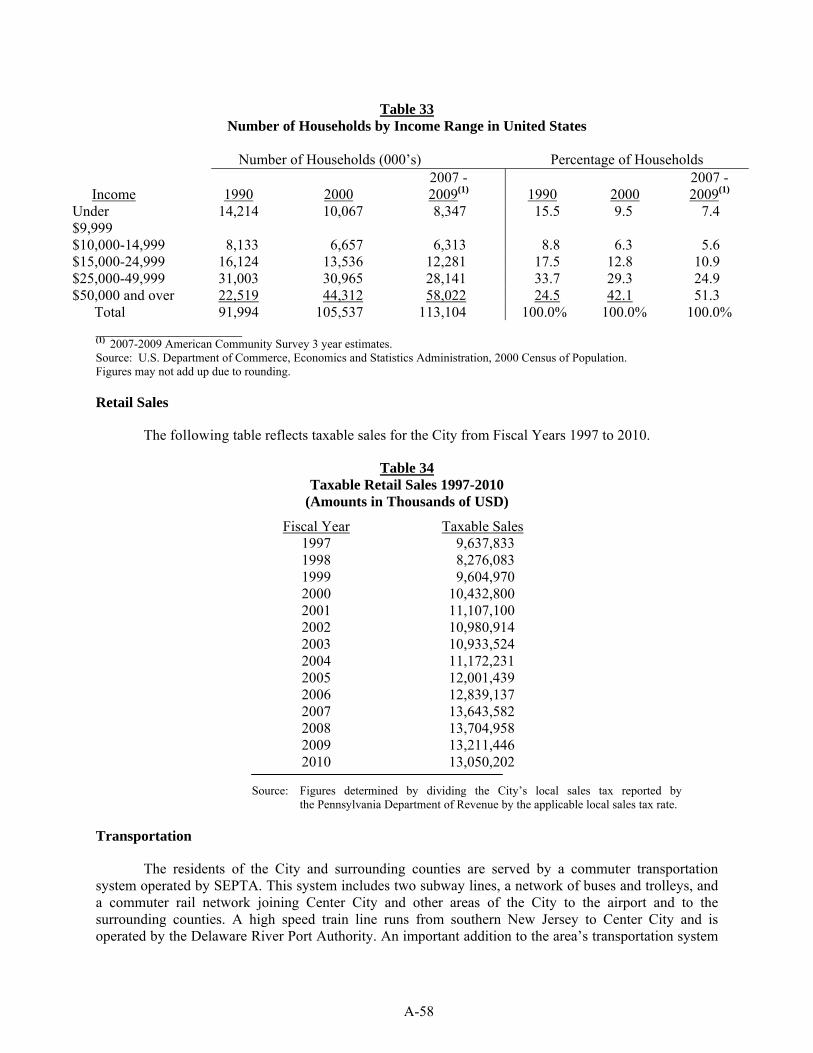
A-58
Table 33
Number of Households by Income Range in United States
Number of Households (000’s) Percentage of Households
Income
1990
2000 2007 -
2009(1)
1990
2000 2007 -
2009(1) Under $9,999
14,214 10,067 8,347 15.5 9.5 7.4
$10,000-14,999 8,133 6,657 6,313 8.8 6.3 5.6 $15,000-24,999 16,124 13,536 12,281 17.5 12.8 10.9 $25,000-49,999 31,003 30,965 28,141 33.7 29.3 24.9 $50,000 and over 22,519 44,312 58,022 24.5 42.1 51.3 Total 91,994 105,537 113,104 100.0% 100.0% 100.0%
____________________ (1) 2007-2009 American Community Survey 3 year estimates. Source: U.S. Department of Commerce, Economics and Statistics Administration, 2000 Census of Population. Figures may not add up due to rounding. Retail Sales
The following table reflects taxable sales for the City from Fiscal Years 1997 to 2010.
Table 34 Taxable Retail Sales 1997-2010
(Amounts in Thousands of USD)
Fiscal Year Taxable Sales 1997 9,637,833 1998 8,276,083 1999 9,604,970 2000 10,432,800 2001 11,107,100 2002 10,980,914 2003 10,933,524 2004 11,172,231 2005 12,001,439 2006 12,839,137 2007 13,643,582 2008 2009
13,704,958 13,211,446
2010 13,050,202
Source: Figures determined by dividing the City’s local sales tax reported by the Pennsylvania Department of Revenue by the applicable local sales tax rate.
Transportation
The residents of the City and surrounding counties are served by a commuter transportation system operated by SEPTA. This system includes two subway lines, a network of buses and trolleys, and a commuter rail network joining Center City and other areas of the City to the airport and to the surrounding counties. A high speed train line runs from southern New Jersey to Center City and is operated by the Delaware River Port Authority. An important addition to the area’s transportation system
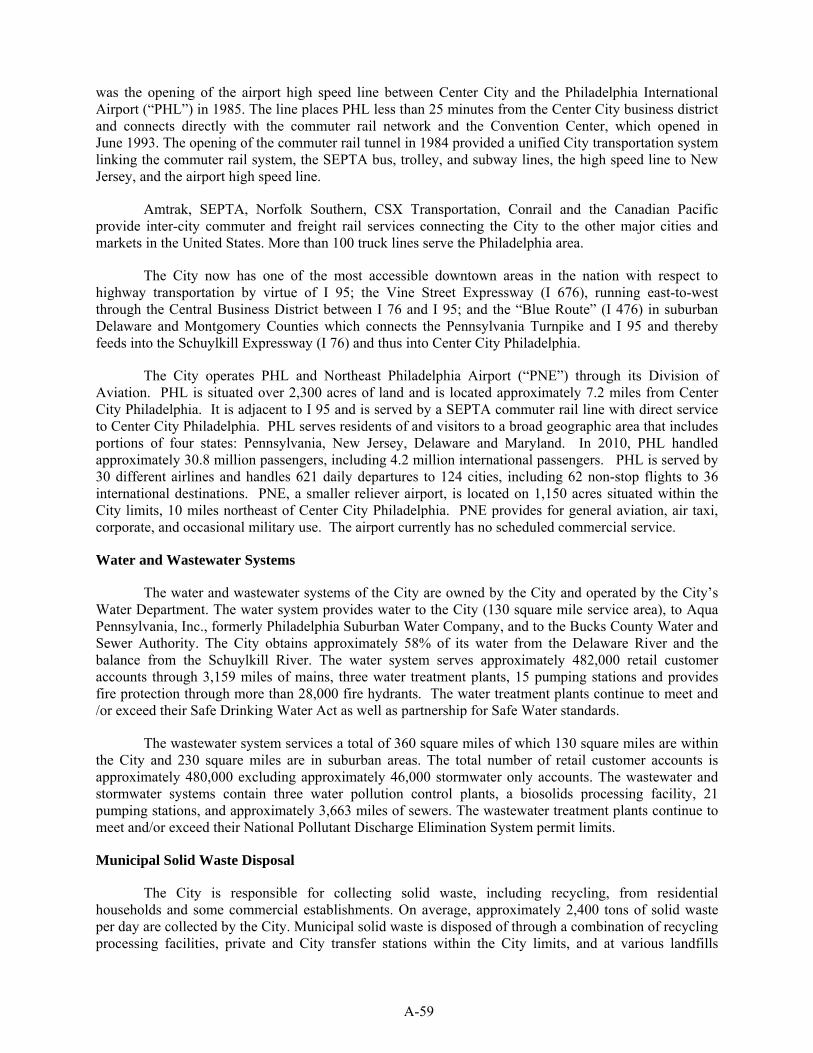
A-59
was the opening of the airport high speed line between Center City and the Philadelphia International Airport (“PHL”) in 1985. The line places PHL less than 25 minutes from the Center City business district and connects directly with the commuter rail network and the Convention Center, which opened in June 1993. The opening of the commuter rail tunnel in 1984 provided a unified City transportation system linking the commuter rail system, the SEPTA bus, trolley, and subway lines, the high speed line to New Jersey, and the airport high speed line.
Amtrak, SEPTA, Norfolk Southern, CSX Transportation, Conrail and the Canadian Pacific provide inter-city commuter and freight rail services connecting the City to the other major cities and markets in the United States. More than 100 truck lines serve the Philadelphia area.
The City now has one of the most accessible downtown areas in the nation with respect to highway transportation by virtue of I 95; the Vine Street Expressway (I 676), running east-to-west through the Central Business District between I 76 and I 95; and the “Blue Route” (I 476) in suburban Delaware and Montgomery Counties which connects the Pennsylvania Turnpike and I 95 and thereby feeds into the Schuylkill Expressway (I 76) and thus into Center City Philadelphia.
The City operates PHL and Northeast Philadelphia Airport (“PNE”) through its Division of Aviation. PHL is situated over 2,300 acres of land and is located approximately 7.2 miles from Center City Philadelphia. It is adjacent to I 95 and is served by a SEPTA commuter rail line with direct service to Center City Philadelphia. PHL serves residents of and visitors to a broad geographic area that includes portions of four states: Pennsylvania, New Jersey, Delaware and Maryland. In 2010, PHL handled approximately 30.8 million passengers, including 4.2 million international passengers. PHL is served by 30 different airlines and handles 621 daily departures to 124 cities, including 62 non-stop flights to 36 international destinations. PNE, a smaller reliever airport, is located on 1,150 acres situated within the City limits, 10 miles northeast of Center City Philadelphia. PNE provides for general aviation, air taxi, corporate, and occasional military use. The airport currently has no scheduled commercial service.
Water and Wastewater Systems
The water and wastewater systems of the City are owned by the City and operated by the City’s Water Department. The water system provides water to the City (130 square mile service area), to Aqua Pennsylvania, Inc., formerly Philadelphia Suburban Water Company, and to the Bucks County Water and Sewer Authority. The City obtains approximately 58% of its water from the Delaware River and the balance from the Schuylkill River. The water system serves approximately 482,000 retail customer accounts through 3,159 miles of mains, three water treatment plants, 15 pumping stations and provides fire protection through more than 28,000 fire hydrants. The water treatment plants continue to meet and /or exceed their Safe Drinking Water Act as well as partnership for Safe Water standards.
The wastewater system services a total of 360 square miles of which 130 square miles are within the City and 230 square miles are in suburban areas. The total number of retail customer accounts is approximately 480,000 excluding approximately 46,000 stormwater only accounts. The wastewater and stormwater systems contain three water pollution control plants, a biosolids processing facility, 21 pumping stations, and approximately 3,663 miles of sewers. The wastewater treatment plants continue to meet and/or exceed their National Pollutant Discharge Elimination System permit limits.
Municipal Solid Waste Disposal
The City is responsible for collecting solid waste, including recycling, from residential households and some commercial establishments. On average, approximately 2,400 tons of solid waste per day are collected by the City. Municipal solid waste is disposed of through a combination of recycling processing facilities, private and City transfer stations within the City limits, and at various landfills
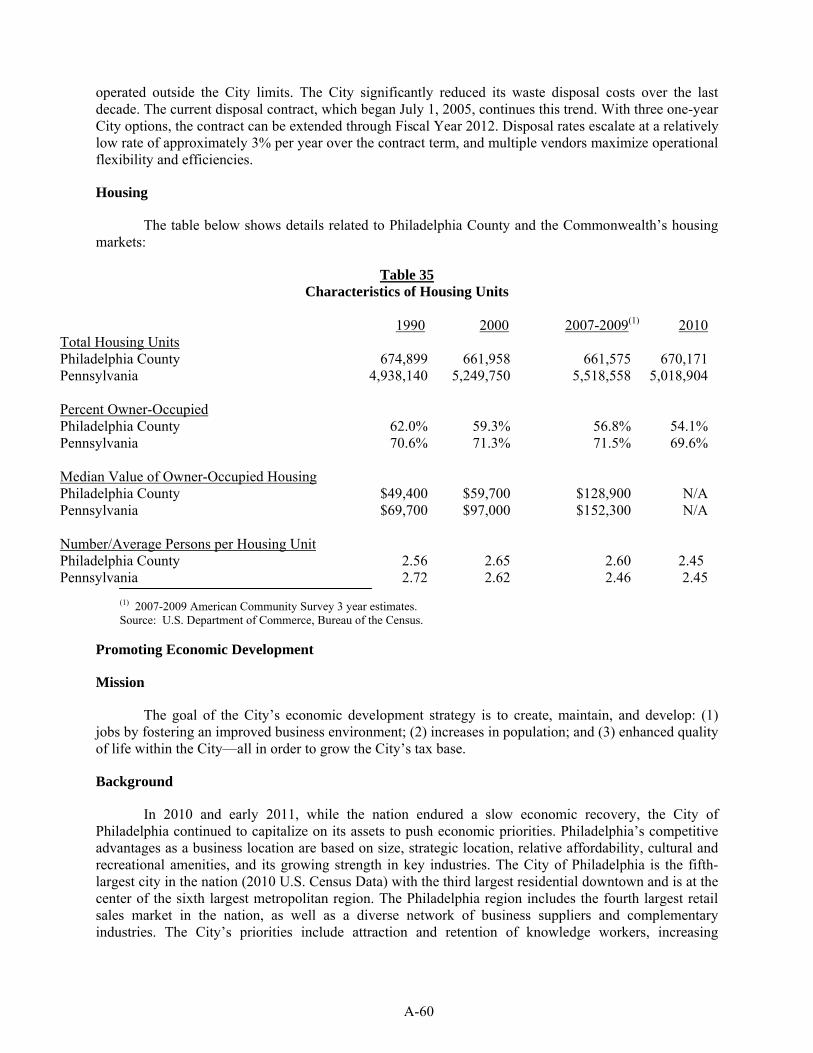
A-60
operated outside the City limits. The City significantly reduced its waste disposal costs over the last decade. The current disposal contract, which began July 1, 2005, continues this trend. With three one-year City options, the contract can be extended through Fiscal Year 2012. Disposal rates escalate at a relatively low rate of approximately 3% per year over the contract term, and multiple vendors maximize operational flexibility and efficiencies.
Housing
The table below shows details related to Philadelphia County and the Commonwealth’s housing markets:
Table 35 Characteristics of Housing Units
1990 2000 2007-2009(1) 2010 Total Housing Units Philadelphia County 674,899 661,958 661,575 670,171 Pennsylvania 4,938,140 5,249,750 5,518,558 5,018,904 Percent Owner-Occupied Philadelphia County 62.0% 59.3% 56.8% 54.1% Pennsylvania 70.6% 71.3% 71.5% 69.6% Median Value of Owner-Occupied Housing Philadelphia County $49,400 $59,700 $128,900 N/A Pennsylvania $69,700 $97,000 $152,300 N/A Number/Average Persons per Housing Unit Philadelphia County Pennsylvania
2.56 2.72
2.65 2.62
2.60 2.46
2.45 2.45
(1) 2007-2009 American Community Survey 3 year estimates. Source: U.S. Department of Commerce, Bureau of the Census.
Promoting Economic Development
Mission
The goal of the City’s economic development strategy is to create, maintain, and develop: (1) jobs by fostering an improved business environment; (2) increases in population; and (3) enhanced quality of life within the City—all in order to grow the City’s tax base.
Background
In 2010 and early 2011, while the nation endured a slow economic recovery, the City of Philadelphia continued to capitalize on its assets to push economic priorities. Philadelphia’s competitive advantages as a business location are based on size, strategic location, relative affordability, cultural and recreational amenities, and its growing strength in key industries. The City of Philadelphia is the fifth-largest city in the nation (2010 U.S. Census Data) with the third largest residential downtown and is at the center of the sixth largest metropolitan region. The Philadelphia region includes the fourth largest retail sales market in the nation, as well as a diverse network of business suppliers and complementary industries. The City’s priorities include attraction and retention of knowledge workers, increasing
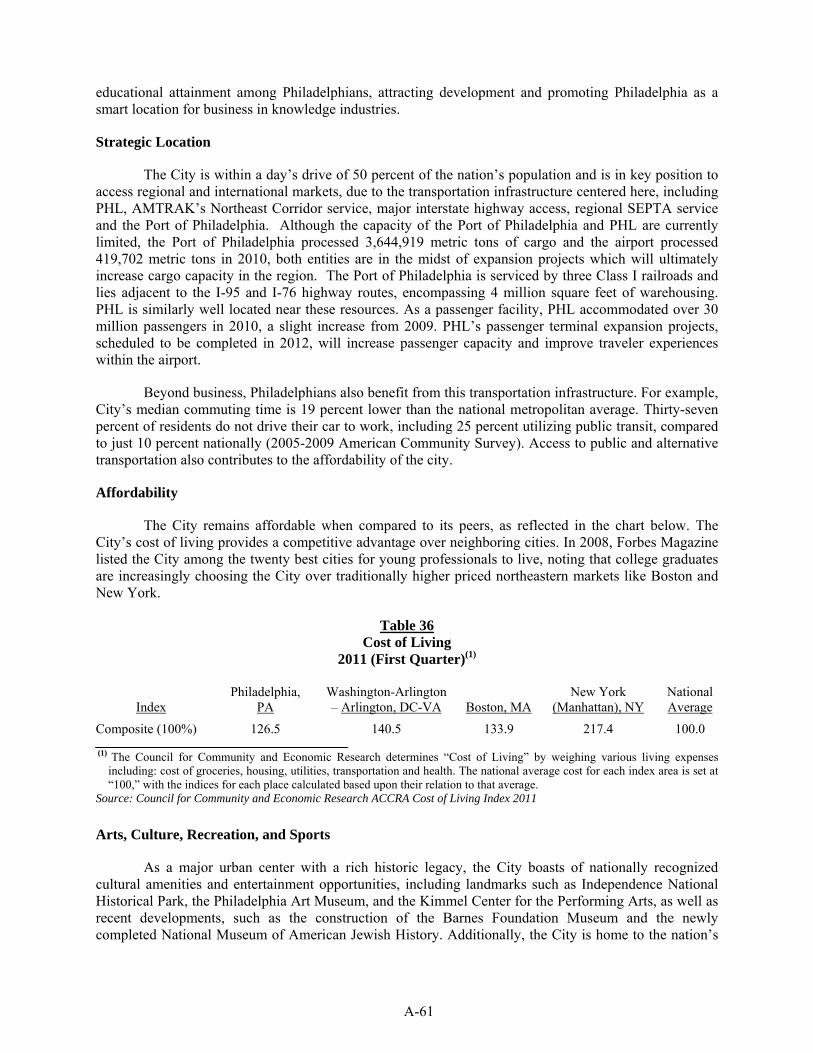
A-61
educational attainment among Philadelphians, attracting development and promoting Philadelphia as a smart location for business in knowledge industries.
Strategic Location
The City is within a day’s drive of 50 percent of the nation’s population and is in key position to access regional and international markets, due to the transportation infrastructure centered here, including PHL, AMTRAK’s Northeast Corridor service, major interstate highway access, regional SEPTA service and the Port of Philadelphia. Although the capacity of the Port of Philadelphia and PHL are currently limited, the Port of Philadelphia processed 3,644,919 metric tons of cargo and the airport processed 419,702 metric tons in 2010, both entities are in the midst of expansion projects which will ultimately increase cargo capacity in the region. The Port of Philadelphia is serviced by three Class I railroads and lies adjacent to the I-95 and I-76 highway routes, encompassing 4 million square feet of warehousing. PHL is similarly well located near these resources. As a passenger facility, PHL accommodated over 30 million passengers in 2010, a slight increase from 2009. PHL’s passenger terminal expansion projects, scheduled to be completed in 2012, will increase passenger capacity and improve traveler experiences within the airport.
Beyond business, Philadelphians also benefit from this transportation infrastructure. For example, City’s median commuting time is 19 percent lower than the national metropolitan average. Thirty-seven percent of residents do not drive their car to work, including 25 percent utilizing public transit, compared to just 10 percent nationally (2005-2009 American Community Survey). Access to public and alternative transportation also contributes to the affordability of the city.
Affordability
The City remains affordable when compared to its peers, as reflected in the chart below. The City’s cost of living provides a competitive advantage over neighboring cities. In 2008, Forbes Magazine listed the City among the twenty best cities for young professionals to live, noting that college graduates are increasingly choosing the City over traditionally higher priced northeastern markets like Boston and New York.
Table 36 Cost of Living
2011 (First Quarter)(1)
Index Philadelphia,
PA Washington-Arlington – Arlington, DC-VA
Boston, MA
New York (Manhattan), NY
National Average
Composite (100%) 126.5 140.5 133.9 217.4 100.0 (1) The Council for Community and Economic Research determines “Cost of Living” by weighing various living expenses
including: cost of groceries, housing, utilities, transportation and health. The national average cost for each index area is set at “100,” with the indices for each place calculated based upon their relation to that average.
Source: Council for Community and Economic Research ACCRA Cost of Living Index 2011
Arts, Culture, Recreation, and Sports
As a major urban center with a rich historic legacy, the City boasts of nationally recognized cultural amenities and entertainment opportunities, including landmarks such as Independence National Historical Park, the Philadelphia Art Museum, and the Kimmel Center for the Performing Arts, as well as recent developments, such as the construction of the Barnes Foundation Museum and the newly completed National Museum of American Jewish History. Additionally, the City is home to the nation’s
A-62
first “Percent for Art” Public Art Program, and the award winning Mural Arts Program, allowing arts access to all residents. Philadelphia is also home to the nation’s largest urban park, 9,200 acre Fairmount Park. The City continues to add green space as it embarks on redevelopment of trails and recreational areas along the Delaware and Schuylkill rivers.
Beyond recreation, the City offers a robust nightlife. The central business district (“CBD”) has experienced a 234 percent increase in fine dining restaurants since 1992 with 217 locations, and offers nearly as many outdoor cafes. The success of first-class sports facilities in South Philadelphia adds to the many recreation and entertainment options open to Philadelphians, regional residents and visitors.
Educational Attainment
The City captures a significant portion of the region’s educational employment and enrollment because of its major colleges and universities. Among a much larger regional network of universities representing approximately 300,000 students, 18 institutions of higher education have campuses in the City. Forty percent of those students live in the City during their studies. More recently, the Philadelphia region has retained a stronger share of native graduates than in previous years, with 71% retained in 2010 versus 64% in 2004. Also, among students not from the area, 48% stayed in the region in 2010 while only 29% stayed in 2004. On average, the region’s workforce over age 25 is better educated (with four-year college degrees) than those in other metropolitan areas across the U.S. (32%, compared to 27%).
Real Estate Market
Despite challenges in the national economy, the City’s central business district (the “CBD”), which encompasses 43.7 million rentable square feet, shows stable office market conditions. In the first quarter of 2011, the CBD posted a modest 21,000 square feet of positive net absorption during the first quarter, while the vacancy rate stayed flat at 12.5 percent, and average asking rental rates for class A space remain at $27.64 per-square-foot. While overall leasing velocity is below historical norms, the CBD has enjoyed two consecutive quarters of increases in overall occupancy, albeit modest increases.
Additional real estate opportunities will become available in the CBD in the upcoming year as GlaxoSmithKline relocates its 1,300-person Center City workforce to a 205,000 square-foot build-to-suit project in the Navy Yard in late 2012. The former GlaxoSmithKline site, among others, is under consideration for new hotel capacity for the City’s recently expanded Pennsylvania Convention Center. Other future development activity in the CBD includes a 125,000 square-foot tower near East Market Street, slated to be developed for the University of Pennsylvania Health System. Leasing activities are also underway for two additional projects in University City, the 90,000 square-foot 2.0 University Place project and the Science Center's next planned development, 3737 Market.
Major Industry Sectors
When compared to the average sector concentration in Pennsylvania counties, the City has a higher concentration of employment in six sectors, as noted in the chart below.
[REMAINDER OF PAGE INTENTIONALLY LEFT BLANK]
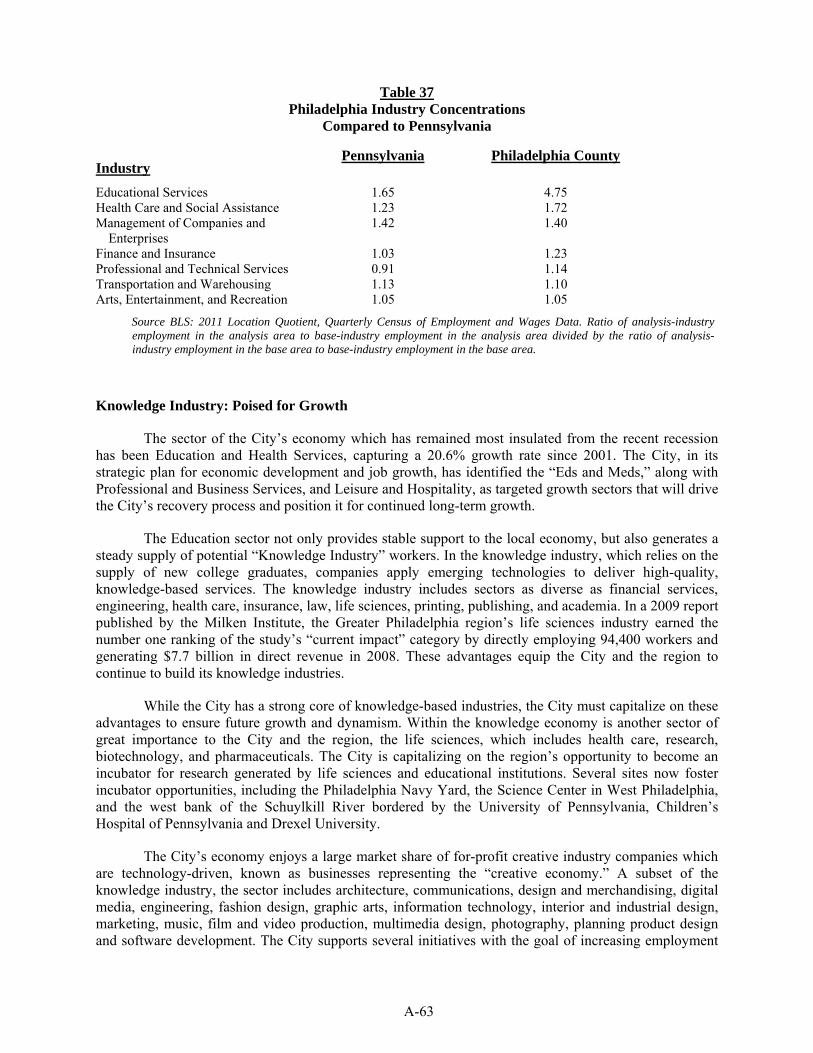
A-63
Table 37 Philadelphia Industry Concentrations
Compared to Pennsylvania
Industry Pennsylvania Philadelphia County
Educational Services 1.65 4.75 Health Care and Social Assistance 1.23 1.72 Management of Companies and
Enterprises 1.42 1.40
Finance and Insurance 1.03 1.23 Professional and Technical Services 0.91 1.14 Transportation and Warehousing 1.13 1.10 Arts, Entertainment, and Recreation 1.05 1.05
Source BLS: 2011 Location Quotient, Quarterly Census of Employment and Wages Data. Ratio of analysis-industry employment in the analysis area to base-industry employment in the analysis area divided by the ratio of analysis-industry employment in the base area to base-industry employment in the base area.
Knowledge Industry: Poised for Growth
The sector of the City’s economy which has remained most insulated from the recent recession has been Education and Health Services, capturing a 20.6% growth rate since 2001. The City, in its strategic plan for economic development and job growth, has identified the “Eds and Meds,” along with Professional and Business Services, and Leisure and Hospitality, as targeted growth sectors that will drive the City’s recovery process and position it for continued long-term growth.
The Education sector not only provides stable support to the local economy, but also generates a steady supply of potential “Knowledge Industry” workers. In the knowledge industry, which relies on the supply of new college graduates, companies apply emerging technologies to deliver high-quality, knowledge-based services. The knowledge industry includes sectors as diverse as financial services, engineering, health care, insurance, law, life sciences, printing, publishing, and academia. In a 2009 report published by the Milken Institute, the Greater Philadelphia region’s life sciences industry earned the number one ranking of the study’s “current impact” category by directly employing 94,400 workers and generating $7.7 billion in direct revenue in 2008. These advantages equip the City and the region to continue to build its knowledge industries.
While the City has a strong core of knowledge-based industries, the City must capitalize on these advantages to ensure future growth and dynamism. Within the knowledge economy is another sector of great importance to the City and the region, the life sciences, which includes health care, research, biotechnology, and pharmaceuticals. The City is capitalizing on the region’s opportunity to become an incubator for research generated by life sciences and educational institutions. Several sites now foster incubator opportunities, including the Philadelphia Navy Yard, the Science Center in West Philadelphia, and the west bank of the Schuylkill River bordered by the University of Pennsylvania, Children’s Hospital of Pennsylvania and Drexel University.
The City’s economy enjoys a large market share of for-profit creative industry companies which are technology-driven, known as businesses representing the “creative economy.” A subset of the knowledge industry, the sector includes architecture, communications, design and merchandising, digital media, engineering, fashion design, graphic arts, information technology, interior and industrial design, marketing, music, film and video production, multimedia design, photography, planning product design and software development. The City supports several initiatives with the goal of increasing employment
A-64
in this sector and fostering population growth in the City as a result. The City’s population has increased 0.6% since 2000 according to the U.S. Census Bureau’s 2010 figures. The City’s official population is now recorded as 1,526,006.
Notably in the 2010 Census, several neighborhoods in the City experienced a significant increase of residents in their 20s and 30s. Six neighborhoods are now majority “young adult.” This residential shift is also responsible for increasing wealth within those neighborhoods. For example, average household income increased 61 percent in Southeast Center City, and 57 percent in Northern Liberties.
Philadelphia International Airport
PHL is situated on over 2,300 acres of land located partly in the southwestern section of the City and partly in the northeastern section of Delaware County, about 7.2 miles southwest of Center City Philadelphia. PHL has four runways and seven terminal buildings, is served by 30 different airlines and handles 621 daily departures to 124 cities, including 62 non-stop flights to 36 international destinations. Currently, PHL accounts for over 141,000 jobs within the region and has a regional economic impact of $14.4 billion annually.
In calendar year 2010, PHL served 30.8 million passengers, including 4.2 million international travelers. PHL is ranked the ninth busiest airport in the nation and eleventh busiest in the world for aircraft operations (take-offs and landings). Since 2001, PHL has added two new terminals, one regional and one international, to its complex. This development, along with other terminal expansion, has more than doubled the size of the Airport terminal complex from 1.4 million to 3.1 million square feet and expanded the number of boarding gates by 94% from 65 to 126. Demand for air travel, spurred by low-fare competition with the entrance of Southwest Airlines in 2004, increased passenger traffic from 24.9 million in 2000 to 30.8 million in 2010. In addition, PHL serves as a key-connecting hub for US Airways.
Airport system capital improvements have been financed primarily through Federal and Commonwealth grants-in-aid, Passenger Facility Charge (PFC) revenues, general obligation bonds and Airport Revenue Bonds. The City currently has $1,470,385,000 of Airport Revenue Bonds outstanding. No general obligation bonds of the City issued to finance capital improvements to the Airport System are currently outstanding or contemplated. In November 2010, the City completed the sale of its Series 2010A Airport Revenue Bonds and 2010B, C, and D Airport Revenue Refunding Bonds totaling approximately $625 million in principal amount. The 2010A Airport Revenue Bonds financed several new capital projects, including expansion of the commuter terminal, Terminal B/C expansion design, taxiway design and construction, runway resurfacing, and infrastructure and terminal improvements. The 2010B, 2010C and 2010D Airport Revenue Bonds refunded the City’s Series 1997B Airport Revenue Bonds, a portion of the 1998A Airport Revenue Bonds, and a portion of the 1998B Airport Revenue Bonds respectively.
PHL recently culminated a 10-year planning process and a 7-year environmental review process in January 2011 with the Federal Aviation Administration (the “FAA”) issuing a Record of Decision approving the Airport's Capacity Enhancement Program (the “CEP”). Receipt of this final document enables PHL to proceed with the next steps required to expand and make critically needed improvements. The preferred alternative, as selected by the FAA, and known as "Alternative A," provides for a new runway, which will allow independent simultaneous aircraft operations in all weather conditions, to significantly reduce delays; two runway extensions (one of which will provide the necessary runway length to accommodate non-stop, long haul flights to reach around the world); enlarging and reconfiguring the existing terminal complex; relocating several off-airport facilities; developing a centralized ground transportation center; constructing an automated people mover for transport of passengers between terminals; and additional parking facilities that would also interface with the existing
A-65
SEPTA rail line. The cost of the CEP is estimated to be $6.4 billion in 2010 dollars and the total period for the phased construction would be approximately 13 calendar years, or between 2013 and 2025. The funding of this longer-term capital program will require the issuance of additional airport revenue bonds.
PHL’s four-year Airport-Airline Use and Lease Agreement (the “Airline Agreement”) expired on June 30, 2011. It established procedures for the annual review and adjustment of airlines rentals, fees and charges for airlines operating at PHL. PHL and the airlines have agreed upon a two-year extension to the Airline Agreement. As part of the extension, the airlines granted approval to PHL to proceed with projects totaling approximately $250 million. During the two-year extension, PHL and tenant airlines will discuss a longer-term agreement to cover the CEP period. It is anticipated that the PHL will issue bonds in October 2011 to initially fund a portion of the approved projects.
Philadelphia Industrial Development Corporation
PIDC is a private, not-for-profit Pennsylvania corporation, founded in 1958 as a joint venture between the City and the Greater Philadelphia Chamber of Commerce, with the mission of implementing the City’s economic development initiatives. PIDC is governed by a 30-member Board of Directors appointed by the Mayor and the President of the Greater Philadelphia Chamber of Commerce. PIDC provides financing programs and real estate services to business and not-for-profit corporations throughout the City as well as coordinates workforce development and developer assistance programs offered by the City and the Commonwealth. PIDC manages the PAID, which serves as a conduit for the issuance of tax-exempt debt and other economic development initiatives. PIDC also is responsible for the redevelopment of the former Philadelphia Naval Shipyard and Naval Station, now collectively known as The Navy Yard, described further below under the section titled “The Navy Yard.”
Financing Programs
PIDC offers a variety of financing programs, including direct loans, grants and tax-exempt financing, designed to encourage economic growth in the City.
PIDC Loan Programs: Largely funded by federal, state, and local government sources, PIDC loan programs generally offer subordinated financing and below-market interest rates. Eligible uses of PIDC loans include infrastructure costs, land acquisition, building construction, machinery/equipment purchase, or working capital. During 2010, PIDC settled seventy loan transactions and provided in excess of $50 million of funding to projects valued at approximately $416 million. During the first half of 2011, PIDC settled 31 loans totaling approximately $20 million.
PIDC and PAID Grant Programs: PIDC and PAID administer a number of federal, state and local grant programs, targeted to non-profit organizations in the City. The Commonwealth's Redevelopment Assistance Capital Program and the City's Cultural and Commercial Corridors grant program are important sources of capital funding to local cultural institutions, health-care organizations, universities and community development corporations. During 2010, 85 grant transactions totaling $167.3 million were closed through PIDC and PAID. During the first half of 2011, forty three grants totaling $200 million closed through PIDC and PAID.
PAID Tax-Exempt Programs: PAID issues, as a conduit, tax-exempt bonds for qualified manufacturing and not-for-profit organizations. PAID is also a conduit for taxable issues. During calendar year 2010, PAID settled ten tax-exempt financings for approximately $120 million for project costs totaling $147.5 million. During the first half of 2011, PAID has settled three tax-exempt bonds totaling $36 million.
A-66
Real Estate Services
On behalf of the City, PIDC is responsible for managing the City’s industrial land inventory by acquiring, improving and selling industrial and commercial land throughout the City. Over the years, PIDC has successfully acquired, improved and sold more than 2,800 acres of such land in 18 industrial parks in the City.
● Industrial Land: PIDC’s parcels are competitively priced, zoned and ready for development, as well as fully improved with roads and utilities. Many of these sites are located in established Northeast, West, and Southwest Philadelphia industrial parks with excellent access to transportation and workforce. The other industrial sites are situated in redeveloping commercial neighborhood corridors.
Most of PIDC’s properties are in designated incentive areas, which include specific entitlements to tax abatements, low interest loans and other benefits. Of particular note are the Keystone Opportunity Zones (KOZs), which abate business taxes for varying terms.
PIDC is seeking opportunities to replenish the City’s inventory of industrial land by purchasing distressed or underutilized industrially-zoned sites to improve and sell on behalf of the City. During the first half of 2011, there have been no industrial land sales. This reflects the impact of the overall slowdown in the national and regional economy and the shortage of quality industrial sites in the City. PIDC is negotiating two acquisitions of industrially-zoned sites, which if successful, will settle in 2011 or early 2012.
In September 2010, PIDC published the Industrial Land and Marketing Strategy, along with the City Commerce Department and the City Planning Commission, which provides a comprehensive review of the City’s industrial land inventory, and develops a new industrial land policy to serve as a guide for the nature, location and scale of industrial land acquisition and development for the foreseeable future. PIDC along with the City’s Commerce Department and the Planning Commission will commence a comprehensive planning study of the Lower Schuylkill River, with the objective of revitalizing this heavily industrial portion of the City.
● Public Property Sales: In 2005, PIDC entered into an agreement with the City’s Department of Public Property to market the City’s surplus real estate. Since this effort began, PIDC has completed the sale of 34 properties resulting in approximately $17 million for the City’s General Fund. PIDC completed five transactions in 2010 totaling $1,993,800 in sales. There have not been any property sales during the first half of 2011.
● Developer Selection: PIDC also manages developer selection and sales of key real estate assets in the City utilizing conventional RFQ/RFP methodology. PIDC recently selected a developer for development of a location on the Avenue of the Arts at Broad a& South Streets and expects to settle on this property during the last quarter of 2012.
The Navy Yard
During the past decade, the United States Department of Defense has downsized significantly in the Philadelphia area, resulting in substantial excess real estate in the City. PIDC is responsible for converting the former military property at The Navy Yard to civilian use. The Navy Yard, the largest former Defense Department asset with 1,200 acres and 6.5 million square feet of existing industrial and office space, is located on the Delaware River at the south end of Broad Street.
A-67
Since the ownership transfer in March 2000, PIDC has been responsible for planning, operations and development of this massive property. Initial development emphasis was on infrastructure and $25 million was invested on upgrades to the roads and utilities systems. The development of the Aker Philadelphia Shipyard, a $300 million state-of-the-art facility, was funded by federal, state, and local sources. To-date more than 115 companies and three Navy operations occupy in excess of 5.5 million square feet of space and employ more than 8,000 people.
In September 2004, PIDC and the City released an updated Navy Yard Master Plan, which focuses on mixed use development on 400 acres east of Broad Street and envisions over $2 billion of private investment in office, research, retail, residential, and recreational projects. To date, major progress has been achieved in implementation of the Master Plan:
● Industrial Anchors: The Navy Yard continues to be a vital industrial and manufacturing center, with the Aker Philadelphia Shipyard as a major anchor. Aker employs in excess of 600 persons in its commercial shipbuilding operation and has completed $2 billion worth of ship orders. During February of 2011, the Commonwealth announced the investment of $42 million (subject to various conditions) to allow Aker to compete for future orders of commercial ships.
There are also a number of supplier and related industrial and manufacturing companies located at The Navy Yard. The US Navy also retains significant industrial facilities to support its foundry and propeller shop with nearly 800 employees. Building on the skilled workforce and range of industrial supplier companies located at The Navy Yard, Philadelphia Ship Repair and Rhoads Industries each lease a dry-dock, pier and related facilities to support commercial and military ship repair activity. Tasty Baking Company opened a 350,000 SF bakery and distribution center at The Navy Yard in 2010. This facility, along with an additional 200,000 square feet of speculative flex and industrial space, is being developed in the Navy Yard Commerce Center by Liberty Property Trust and Synterra Partners.
● Navy Yard Corporate Center: In 2003, PIDC selected a team led by Liberty Property Trust and Synterra Partners to develop 72 acres with 1.4 million square feet of Class A office space. Liberty/Synterra has developed three buildings, all of which are fully leased: (i) a 77,000-square-foot, multi-tenant speculative building, (ii) a 47,000 square foot build-to-suit headquarters for Unique Industries and (iii) a 95,000 square foot office building completed in the second quarter of 2009. PIDC and Liberty/Synterra are in pre-development for the next phase of speculative office construction.
● Additional Corporate Office Activity: The Navy Yard’s shift from a federal, industrial property to a private sector business park is underscored by the number of headquarter relocations including the relocations of Vitetta Architects and Engineers, Unique Industries, and Barthco International. In 2006, Urban Outfitters (“Urban”), a major retailer of clothing, furnishings and accessories completed its $115 million corporate campus, an award-winning historic conversion of approximately 300,000 square feet of former industrial facilities. Urban has grown their headquarters workforce to more than 1,200 employees since relocating to The Navy Yard and completed work on a $20 million, 50,000 square feet expansion in June 2010. Urban exercised their options on additional space with the announcement of expansion plans which will add an additional 1,000 employees once completed in three years. In 2011, the pharmaceutical company GlaxoSmithKline announced the relocation of its operations and 1,300 employees from Center City Philadelphia to The Navy Yard. The brand new, 205,000 square foot, Class A office space facility represents $80 million dollars of private investment. The relocation of GlaxoSmithKline is currently anticipated to occur between fourth quarter 2012 and first quarter 2013.
A-68
● Research and Development: In addition to the development of general corporate office facilities, The Navy Yard has established an important market segment in technology and R&D activity. This activity is anchored by the Naval Ship Systems Engineering Station, an 1,800 person federal research lab that houses the Navy’s premier research organization focusing on power, energy, fuel cells, propulsion, IT and systems integration. In order to complement and expand this research base, the Commonwealth designated the Navy Yard as a Keystone Innovation Zone (KIZ), providing access to a variety of state incentives for technology development. The KIZ team led by PIDC includes the U.S. Navy, Penn State University, the Delaware Valley Industrial Resource Center (DVIRC), the City of Philadelphia and the Ben Franklin Technology Partners of Southeastern Pennsylvania.
● Green Technology: In 2009, PIDC established the Navy Yard Clean Energy Campus as the identity of Navy Yard R&D activity. Early initiatives of the Clean Energy Campus have resulted in Penn State establishing a Navy Yard location for its graduate level engineering program; the relocation of Ben Franklin Technology Partners’ Corporate Office to The Navy Yard; the development of the Building 100 Innovation Center by Ben Franklin, DVIRC and PIDC to house early stage technology companies focused on power and energy related research; and a cadre of twelve related companies with offices at The Navy Yard.
PIDC and its Navy Yard Clean Energy Campus partners also continue to pursue significant federal funding for research, education and commercialization facilities. The Navy has commenced development on a new, $20 million energy test center. Penn State University was recently awarded $10 million in grants from the Department of Energy (“DOE”) to establish regional, Mid Atlantic Centers at The Navy Yard for Solar Training and Resources, Clean Energy Applications and Smart Grid Development. These activities commenced in 2011. PIDC, Penn State University and nearly 100 partners have been awarded a $130 million grant from the Department of Energy to study new technology around energy efficient buildings at The Navy Yard.
In 2009, significant private investments in the Clean Energy Campus were announced. The first was the development of a seven-acre, 1.5 mega watt solar array to be developed by a partnership of Conergy and Exelon Power Generation. This facility is expected to be under construction in 2011. The second project is the development of a 350,000 square feet, $400 million thin film, solar panel manufacturing facility by Heliospehra USA. This facility is proposed for a start of construction during 2011.
● Life Sciences: The Navy Yard also supports a significant and growing life sciences community. In 2004, AppTec Laboratory Services, a Minneapolis based provider of contract testing and manufacturing services to the pharmaceutical sector, developed a new, 75,000 square feet office and lab facility at The Navy Yard. AppTec, which started with 40 employees, was subsequently acquired by WuXi Pharmaceuticals and now the resultant firm employs 150 persons at The Navy Yard. This facility was recently acquired by Charles River Laboratories, North America’s largest contract manufacturing operation. Phoenix IP Ventures, an intellectual property Merchant Bank focused in the life sciences area, established its corporate headquarters at The Navy Yard.
[REMAINDER OF PAGE INTENTIONALLY LEFT BLANK]
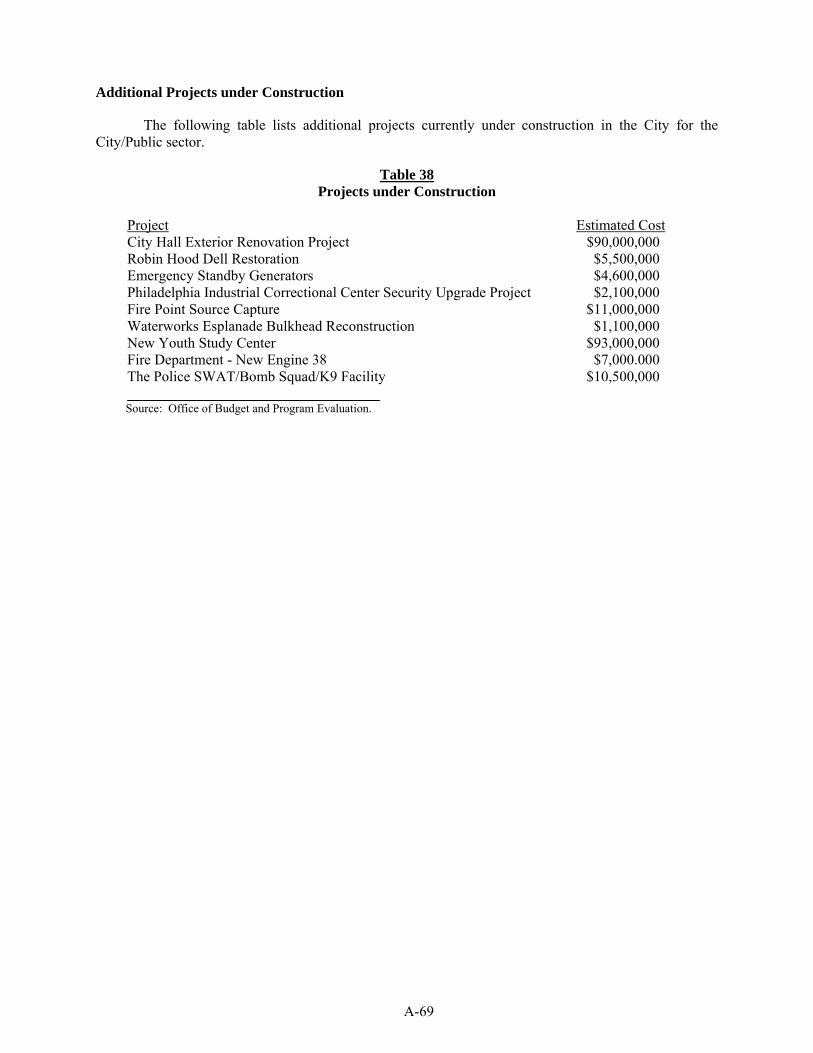
A-69
Additional Projects under Construction
The following table lists additional projects currently under construction in the City for the City/Public sector.
Table 38 Projects under Construction
Project Estimated Cost City Hall Exterior Renovation Project $90,000,000Robin Hood Dell Restoration Emergency Standby Generators
$5,500,000 $4,600,000
Philadelphia Industrial Correctional Center Security Upgrade Project $2,100,000Fire Point Source Capture Waterworks Esplanade Bulkhead Reconstruction New Youth Study Center Fire Department - New Engine 38 The Police SWAT/Bomb Squad/K9 Facility
$11,000,000 $1,100,000
$93,000,000 $7,000.000
$10,500,000
Source: Office of Budget and Program Evaluation.

[ THIS PAGE INTENTIONALLY LEFT BLANK ]

APPENDIX B
Comprehensive Annual Financial Report of the City of Philadelphia for the Year Ended June 30, 2010

[ THIS PAGE INTENTIONALLY LEFT BLANK ]
City of Philadelphia P E N N S Y L V A N I A
Independence Hall
Comprehensive Annual Report Fiscal Year Ended June 30, 2010

PAGE LEFT INTENTIONALLY BLANK
City of Philadelphia P E N N S Y L V A N I A
Comprehensive Annual Financial Report
Fiscal Year Ended June 30, 2010
Michael Nutter Mayor
Prepared by:
Office of the Director of Finance
Rob Dubow Director of Finance
Michael J. Kauffman
Accounting Director

Office of the Director of Finance • 1330 MSB • Philadelphia, PA 19102
City of Philadelphia Comprehensive Annual Financial Report For the Fiscal Year Ended June 30, 2010
- I -
Table of Contents
Introductory Section
Letter of Transmittal..................................................................................................................1 GFOA Certificate of Achievement ............................................................................................6 Organizational Chart.................................................................................................................7 List of Elected and Appointed Officials .....................................................................................8
Financial Section
Independent Auditor’s Report..............................................................................................11
Management’s Discussion and Analysis .............................................................................13
Basic Financial Statements Government Wide Financial Statements
Exhibit I Statement of Net Assets .................................................................................................28 Exhibit II Statement of Activities ....................................................................................................29
Fund Financial Statements Governmental Funds Financial Statements
Exhibit III Balance Sheet ..........................................................................................................30 Exhibit IV Statement of Revenues, Expenditures and Changes in Fund Balances .................31 Exhibit V Reconciliation of the Statement of Revenues, Expenditures and Changes in Fund Balances of Governmental Funds to the Statement of Activities ...............32
Proprietary Funds Financial Statements Exhibit VI Statement of Fund Net Assets .................................................................................33 Exhibit VII Statement of Revenues, Expenses and Changes in Fund Net Assets....................34 Exhibit VIII Statement of Cash Flows .........................................................................................35
Fiduciary Funds Financial Statements Exhibit IX Statement of Net Assets...........................................................................................36 Exhibit X Statement of Changes in Net Assets .......................................................................37
Component Units Financial Statements Exhibit XI Statement of Net Assets...........................................................................................38 Exhibit XII Statement of Activities ..............................................................................................39
Exhibit XIII Notes to the Financial Statements ................................................................................41
Required Supplementary Information Other than Management’s Discussion and Analysis Budgetary Comparison Schedules-Major Funds
Exhibit XIV General Fund............................................................................................................122 Exhibit XV HealthChoices Behavioral Health Fund ...................................................................123 Exhibit XVI Grants Revenue Fund ..............................................................................................124 Exhibit XVII Pension Plans and Other Post Employment Benefits – Schedule of Funding Progress....................................................................................125 Exhibit XVIII Notes to Required Supplementary Information...............................................................126
City of Philadelphia Comprehensive Annual Financial Report For the Fiscal Year Ended June 30, 2010
- II -
Financial Section(Continued)
Other Supplementary Information
Schedule I Combining Balance Sheet - Non-Major Governmental Funds .......................................130 Schedule II Combining Statement of Revenues, Expenditures and Changes in
Fund Balances - Non-Major Governmental Funds...................................................132 Schedule III Combining Statement of Fiduciary Net Assets – Pension Trust Funds..........................134 Schedule IV Combining Statement of Changes in Fiduciary Net Assets–Pension Trust Funds ........135 Schedule V Combining Statement of Fiduciary Net Assets - Agency Funds.....................................136 Schedule VI Statement of Changes in Fiduciary Net Assets - Agency Funds....................................137 Schedule VII City Related Schedule of Bonded Debt Outstanding......................................................138 Schedule VIII Budgetary Comparison Schedule - Water Operating Fund ............................................140 Schedule IX Budgetary Comparison Schedule - Water Residual Fund..............................................141 Schedule X Budgetary Comparison Schedule - County Liquid Fuels Tax Fund................................142 Schedule XI Budgetary Comparison Schedule - Special Gasoline Tax Fund ....................................143 Schedule XII Budgetary Comparison Schedule - Hotel Room Rental Tax Fund .................................144 Schedule XIII Budgetary Comparison Schedule - Aviation Operating Fund.........................................145 Schedule XIV Budgetary Comparison Schedule - Community Development Fund ..............................146 Schedule XV Budgetary Comparison Schedule - Car Rental Tax Fund ..............................................147 Schedule XVI Budgetary Comparison Schedule - Housing Trust Fund ................................................148 Schedule XVII Budgetary Comparison Schedule - General Capital Improvement Funds......................149 Schedule XVIII Budgetary Comparison Schedule – Acute Care Hospital Assessment Fund..………….150 Schedule XIX Schedule of Budgetary Actual and Estimated Revenues and Obligations – General Fund .........................................................................................151 Schedule XX Schedule of Budgetary Actual and Estimated Revenues and Obligations – Water Operating Fund ...........................................................................154 Schedule XXI Schedule of Budgetary Actual and Estimated Revenues and Obligations – Aviation Operating Fund........................................................................155 Statistical Section
Table 1 Net Assets by Component ..............................................................................................159 Table 2 Changes in Net Assets ...................................................................................................160 Table 3 Fund Balances-Governmental Funds .............................................................................162 Table 4 Changes in Fund Balances-Governmental Funds..........................................................163 Table 5 Comparative Schedule of Operations-Municipal Pension Fund .....................................164 Table 6 Wage and Earnings Tax Taxable Income.......................................................................165 Table 7 Direct and Overlapping Tax Rates..................................................................................166 Table 8 Principal Wage and Earnings Tax Remitters ..................................................................168 Table 9 Assessed Value and Estimated Value of Taxable Property ...........................................169 Table 10 Principal Property Tax Payers ........................................................................................170 Table 11 Real Property Taxes Levied and Collected ....................................................................171 Table 12 Ratios of Outstanding Debt by Type...............................................................................172 Table 13 Ratios of General Bonded Debt Outstanding .................................................................173 Table 14 Direct and Overlapping Governmental Activities Debt....................................................174 Table 15 Legal Debt Margin Information........................................................................................175 Table 16 Pledged Revenue Coverage...........................................................................................176 Table 17 Demographic and Economic Statistics ...........................................................................177 Table 18 Principal Employers ........................................................................................................178 Table 19 Full Time Employees by Function...................................................................................179 Table 20 Operating Indicators by Function ....................................................................................180 Table 21 Capital Assets Statistics by Function..............................................................................181
Cover photo courtesy of B. Kirst, Greater Philadelphia Tourism Marketing Corp.
www.phila.gov
City of Philadelphia OFFICE OF THE DIRECTOR OF FINANCE ROB DUBOW 1401 John F. Kennedy Blvd. Director of Finance Suite 1330, Municipal Services Bldg. Philadelphia, Pennsylvania 19102-1693 February 22, 2011
To the Honorable Mayor, Members of City Council and the People of the City of Philadelphia:
The Comprehensive Annual Financial Report of the City of Philadelphia for the fiscal year ended June 30, 2010 is hereby submitted. The financial statements were prepared in accordance with Generally Accepted Accounting Principles in the United States of America (GAAP). Responsibility for both the accuracy of the data, and the completeness and fairness of the presentation, including all disclosures, rests with the City.
The Philadelphia Home Rule Charter (Charter) requires an annual audit of all City accounts by the City Controller, an independently elected official. The Charter further requires that the City Controller appoint a Certified Public Accountant in charge of auditing. These requirements have been complied with and the audit done in accordance with Generally Accepted Governmental Auditing Standards (GAGAS).
Management has provided a narrative to accompany the basic financial statements. This narrative is known as Management’s Discussion and Analysis (MD&A). This letter of transmittal is designed to complement MD&A and should be read in conjunction with it.
PROFILE OF THE GOVERNMENT
The City of Philadelphia was founded in 1682 and was merged with the County of Philadelphia in 1854. The City currently occupies an area of 129 square miles along the Delaware River, serves a population in excess of 1.5 million and is the hub of a five county metropolitan area including Bucks, Chester, Delaware and Montgomery Counties in southeast Pennsylvania. The City is governed largely under the Home Rule Charter, which was adopted by the Electors of the City of Philadelphia on April 17, 1951 and became effective on the first Monday of January, 1952. However, in some matters, including the issuance of short-term and long-term debt, the City is governed by the laws of the Commonwealth of Pennsylvania. The Charter provides for a strong mayoral form of government with the Mayor and the seventeen members of the City Council, ten (10) from districts and seven (7) from the City at large, elected every four years. Minority representation is assured by the requirement that no more than five (5) candidates may be elected for Council-at-large by any one party or political body. The Mayor is prohibited from serving more than two consecutive terms.
-2-
www.phila.gov
This report includes all the funds of the City as well as its component units. The Philadelphia Municipal Authority’s and the Pennsylvania Intergovernmental Cooperation Authority’s statements are blended with the City’s statements. The Philadelphia Gas Works’, the Redevelopment Authority of Philadelphia’s, the Philadelphia Parking Authority’s, the School District of Philadelphia’s, the Community College of Philadelphia’s, Community Behavioral Health, Inc.’s, the Pennsylvania Convention Center Authority’s, the Delaware River Waterfront Corporation’s, and the Philadelphia Authority for Industrial Development’s statements are presented discretely. A component unit is considered to be part of the City’s reporting entity when it is concluded that the City is financially accountable for the entity or that the nature and significance of the relationship between the City and the entity is such that exclusion would cause the City’s financial statements to be misleading or incomplete. The relationship between the City and its component units is explained further in the Notes to the Financial Statements. Reflected in this report is the extensive range of services provided by the City of Philadelphia. These services include police and fire protection, emergency medical services, sanitation services, streets maintenance, recreational activities and cultural events, and traditional county functions such as health and human services, as well as the activities of the previously mentioned public agencies and authorities. The City operates water and wastewater systems that service the citizens of Philadelphia and the City operates two airports, Philadelphia International Airport which handles in excess of 30 million passengers annually as well as cargo and Northeast Philadelphia Airport which handles private aircraft and some cargo.
City government is responsible for establishing and maintaining internal controls designed to protect the assets of the City from loss, theft or misuse and to ensure that adequate accounting data are compiled to allow for the preparation of financial statements in conformity with GAAP. This internal control is subject to periodic evaluation by management and the City Controller’s Office in order to determine its adequacy. The concept of reasonable assurance recognizes that: (1) the cost of a control should not exceed the benefits likely to be derived; and (2) the valuation of costs and benefits requires estimates and judgments by management.
The City maintains budgetary controls to ensure compliance with legal provisions embodied in the annual appropriated budget proposed by the Mayor and approved by City Council for the fiscal year beginning July 1st. Activities of the General Fund, City Related Special Revenue Funds and the City Capital Improvement Funds are budgeted annually. The level of budgetary control (that is, the level at which expenditures cannot legally exceed the appropriated amount) is established by major class within an individual department and fund for the operating funds and by project within department and fund for the Capital Improvement Funds. The City also maintains an encumbrance accounting system for control purposes. Encumbered amounts that have not been expended at year-end are carried forward into the succeeding year but appropriations that have not been expended or encumbered at year-end are lapsed.
FACTORS AFFECTING FINANCIAL CONDITION
The information presented in this report is best understood in the context of the environment in which the City of Philadelphia operates. A more comprehensive analysis of these factors is available in the City’s Five-Year Financial Plan which is presented by the Mayor each year pursuant to the Pennsylvania Intergovernmental Cooperation Authority Act and can be obtained online at www.phila.gov/finance/.
Local Economy
Philadelphia is showing progress on several fronts, despite continued fiscal challenges that arise from the demographic and economic changes that have occurred over the last half century. After 50 years of losing residents to the suburbs, the City has experienced new investment in many of its neighborhoods spurred by the relative affordability of housing and the City’s extensive array of cultural amenities. Still, significant challenges remain. While fewer people live and work here than in previous decades, social needs continue to grow just as the cost of providing services are rising considerably.
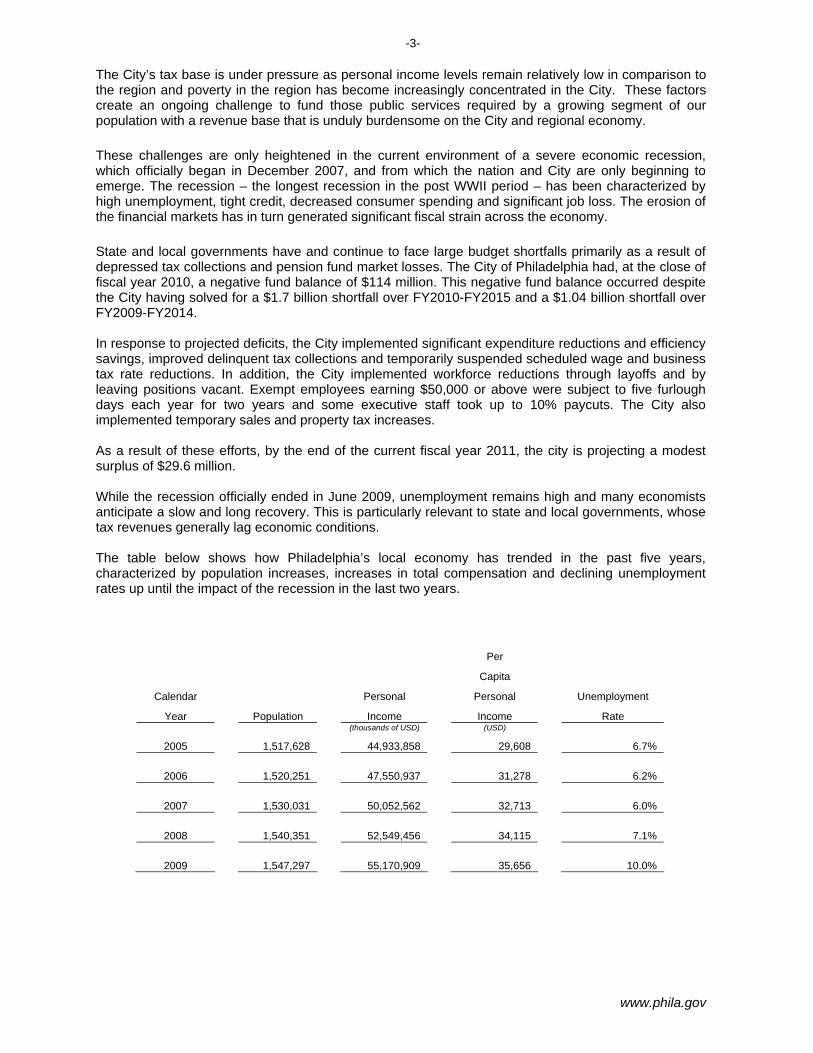
-3-
www.phila.gov
The City’s tax base is under pressure as personal income levels remain relatively low in comparison to the region and poverty in the region has become increasingly concentrated in the City. These factors create an ongoing challenge to fund those public services required by a growing segment of our population with a revenue base that is unduly burdensome on the City and regional economy. These challenges are only heightened in the current environment of a severe economic recession, which officially began in December 2007, and from which the nation and City are only beginning to emerge. The recession – the longest recession in the post WWII period – has been characterized by high unemployment, tight credit, decreased consumer spending and significant job loss. The erosion of the financial markets has in turn generated significant fiscal strain across the economy. State and local governments have and continue to face large budget shortfalls primarily as a result of depressed tax collections and pension fund market losses. The City of Philadelphia had, at the close of fiscal year 2010, a negative fund balance of $114 million. This negative fund balance occurred despite the City having solved for a $1.7 billion shortfall over FY2010-FY2015 and a $1.04 billion shortfall over FY2009-FY2014. In response to projected deficits, the City implemented significant expenditure reductions and efficiency savings, improved delinquent tax collections and temporarily suspended scheduled wage and business tax rate reductions. In addition, the City implemented workforce reductions through layoffs and by leaving positions vacant. Exempt employees earning $50,000 or above were subject to five furlough days each year for two years and some executive staff took up to 10% paycuts. The City also implemented temporary sales and property tax increases. As a result of these efforts, by the end of the current fiscal year 2011, the city is projecting a modest surplus of $29.6 million. While the recession officially ended in June 2009, unemployment remains high and many economists anticipate a slow and long recovery. This is particularly relevant to state and local governments, whose tax revenues generally lag economic conditions. The table below shows how Philadelphia’s local economy has trended in the past five years, characterized by population increases, increases in total compensation and declining unemployment rates up until the impact of the recession in the last two years.
Per
Capita
Calendar Personal Personal Unemployment
Year Population
Income
Income Rate (thousands of USD) (USD)
2005 1,517,628 44,933,858 29,608 6.7%
2006 1,520,251 47,550,937 31,278 6.2%
2007 1,530,031 50,052,562 32,713 6.0%
2008 1,540,351 52,549,456 34,115 7.1%
2009 1,547,297 55,170,909 35,656 10.0%
-4-
www.phila.gov
Long Term Financial Planning
Long term financial planning for the City and for businesses and governments around the world has been made much more challenging with the sudden and dramatic rate of deterioration in the economy in the past two and a half years. As discussed above, the City has made significant changes to its budget and five-year plan to compensate for projected deficits and will continue to make those adjustments as necessary. Some of the largest and fastest growing expenditures in the City’s budget include employee health and pension benefits. Between fiscal year 2000 and fiscal year 2010 employee health benefits costs rose 119% and pension costs increased 109%, whereas total City revenues only increased 32%. In order to address the challenges these long term structural costs present, the City is seeking changes to its health and pension benefits by reducing the cost to the City, implementing efficiency savings and seeking increased employee contributions and risk sharing. Some of these changes are already being made to the City-administered programs and those related to the Fraternal Order of Police (FOP) as a result of the December 18, 2009 Act 111 arbitration award. Additionally, the City was awarded similar pension changes in the October 12, 2010 Act 111 arbitration award with the International Association of Fire Fighters (IAFF). While the economic provisions of the award are being appealed by the City, the award’s pension provisions are not under appeal by the City or the IAFF. The City is seeking similar changes with the remaining bargaining units whose contracts expired in July of 2009. Despite the immediate economic challenges facing the City, some planned initiatives must take place if the City is to be positioned for economic recovery in the long run. Some of those initiatives include:
o Greenworks Philadelphia. The City is committed to becoming the greenest city in the U.S. by 2015. In order to achieve that goal the City has created a detailed work plan and begun implementation of Greenworks Philadelphia, which outlines those goals and initiatives the City will engage in to limit its environmental footprint and capitalize on its competitive advantages in the emerging green economy.
o Healthy Philadelphia Initiative. The City’s Department of Public Health in conjunction with
other City agencies, non profit organizations and academic institutions will implement a multi year plan for combating obesity by making healthy foods available to Philadelphians, decreasing the availability and consumption of non healthy foods and promoting physical activity in daily life.
o PhillyGoes2College. Improving educational outcomes is necessary in order to improve the
overall well being of Philadelphia residents. As a way of increasing access to higher education the City has opened a new PhillyGoes2College office to assist residents to and through college as well as help them find scholarships to finance their education.
o Investments in Technology. Despite the significant budget cuts departments have endured
over the course of the past two and a half years, the City is devoting resources to long-needed technology investments across government. These investments will help streamline operations and reduce costs in the long-term.
o Jobs and Workforce Development. Through Way to Work Philadelphia! The City and its
partners leveraged federal stimulus dollars to provide wage subsidies for 14,000 part- and full-time jobs in Philadelphia - jobs for people who may otherwise have been unemployed. In addition, the City continues to work in partnership with economic development stakeholders to build work-readiness skills to youth ages 14-21, through paid summer job placements. In 2010 the program provided over 12,000 summer job opportunities.

-5-
www.phila.gov
AWARDS AND ACKNOWLEDGEMENTS
The Government Finance Officers Association of the United States and Canada (GFOA) awarded its prestigious Certificate of Achievement for Excellence in Financial Reporting to the City for its Comprehensive Annual Financial Report for the fiscal year ended June 30, 2009. This was the thirtieth consecutive year that the City of Philadelphia has received this prestigious award. The City received this recognition by publishing a report that was well organized and readable and satisfied both generally accepted accounting principles and applicable legal requirements.
The preparation of the Comprehensive Annual Financial Report on a timely basis was made possible by the dedicated service of the entire staff of the Office of the Director of Finance as well as various City departments and component units. Each has my sincere appreciation for their valuable contributions.
Respectfully submitted,
ROB DUBOW Director of Finance
6
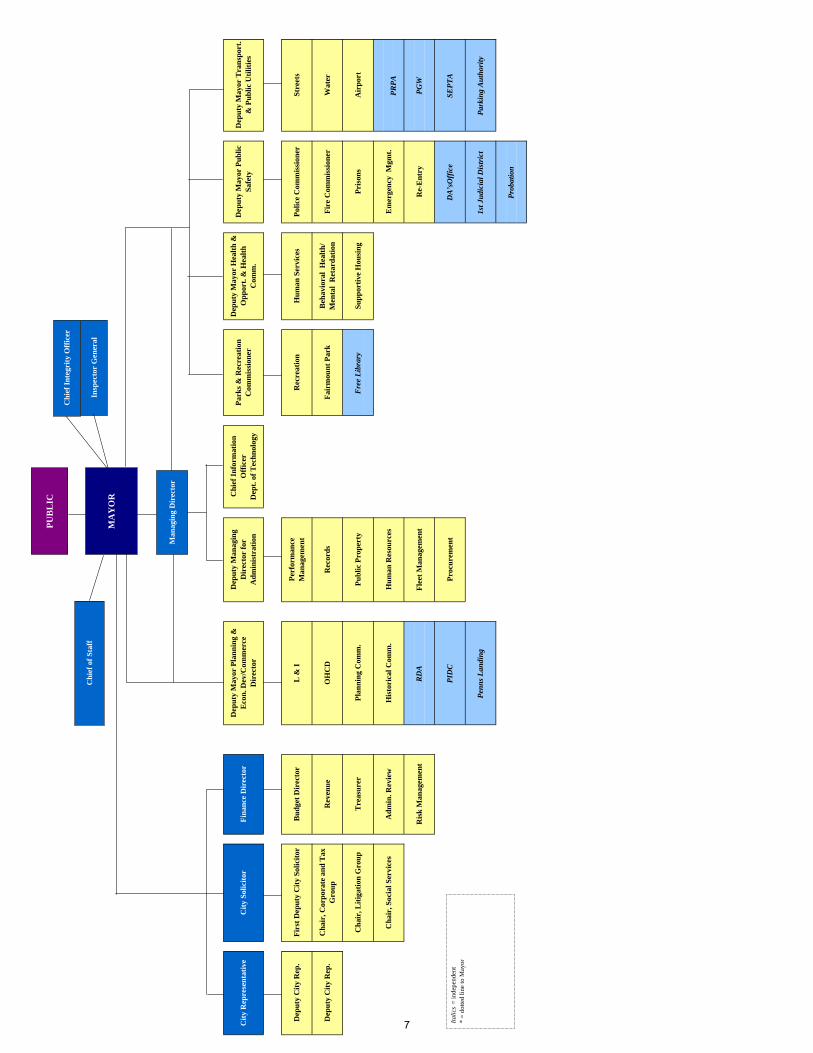
PR
PA
PG
W
SE
PT
A
Par
kin
g A
uth
orit
y
Dep
uty
May
or T
ran
spor
t.
& P
ub
lic
Uti
liti
es
Str
eets
Wat
er
Air
por
t
Re-
En
try
DA
’sO
ffic
e
1st J
udi
cial
Dis
tric
t
Pro
bati
on
Pol
ice
Com
mis
sion
er
Fir
e C
omm
issi
oner
Pri
son
s
Em
erge
ncy
Mgm
t.
Pro
cure
men
t
Hu
man
Ser
vice
s
Fre
e L
ibra
ry
Fai
rmou
nt
Par
k
Su
pp
orti
ve H
ousi
ng
Rec
reat
ion
Beh
avio
ral
Hea
lth
/M
enta
l R
etar
dat
ion
PID
C
Pen
ns
Lan
din
g
Per
form
ance
M
anag
emen
t
Rec
ord
s
Pu
bli
c P
rop
erty
Hu
man
Res
ourc
es
Fle
et M
anag
emen
tR
isk
Man
agem
ent
Dep
uty
May
or P
lan
nin
g &
E
con
. Dev
/Com
mer
ce
Dir
ecto
r
L &
I
Dep
uty
Man
agin
g D
irec
tor
for
Ad
min
istr
atio
n
OH
CD
Pla
nn
ing
Com
m.
His
tori
cal C
omm
.
RD
A
Ch
air,
Lit
igat
ion
Gro
up
Ch
air,
Soc
ial S
ervi
ces
Fin
ance
Dir
ecto
r
Bu
dge
t D
irec
tor
Rev
enu
e
Tre
asu
rer
Ad
min
. Rev
iew
Dep
uty
Cit
y R
ep.
Cit
y S
olic
itor
Fir
st D
epu
ty C
ity
Sol
icit
or
Ch
air,
Cor
por
ate
and
Tax
G
rou
pD
epu
ty C
ity
Rep
.
Cit
y R
epre
sen
tati
veD
epu
ty M
ayor
Hea
lth
&
Op
por
t. &
Hea
lth
C
omm
.
Dep
uty
May
or P
ub
lic
Saf
ety
Ch
ief
Info
rmat
ion
O
ffic
erD
ept.
of
Tec
hn
olog
y
Par
ks
& R
ecre
atio
n
Com
mis
sion
er
Ital
ics
= in
depe
nden
t*
= d
otte
d li
ne to
May
or
Man
agin
g D
irec
tor
MA
YO
R
PU
BL
IC
Ch
ief
of S
taff
Ch
ief
Inte
grit
y O
ffic
er
Insp
ecto
r G
ener
al
7
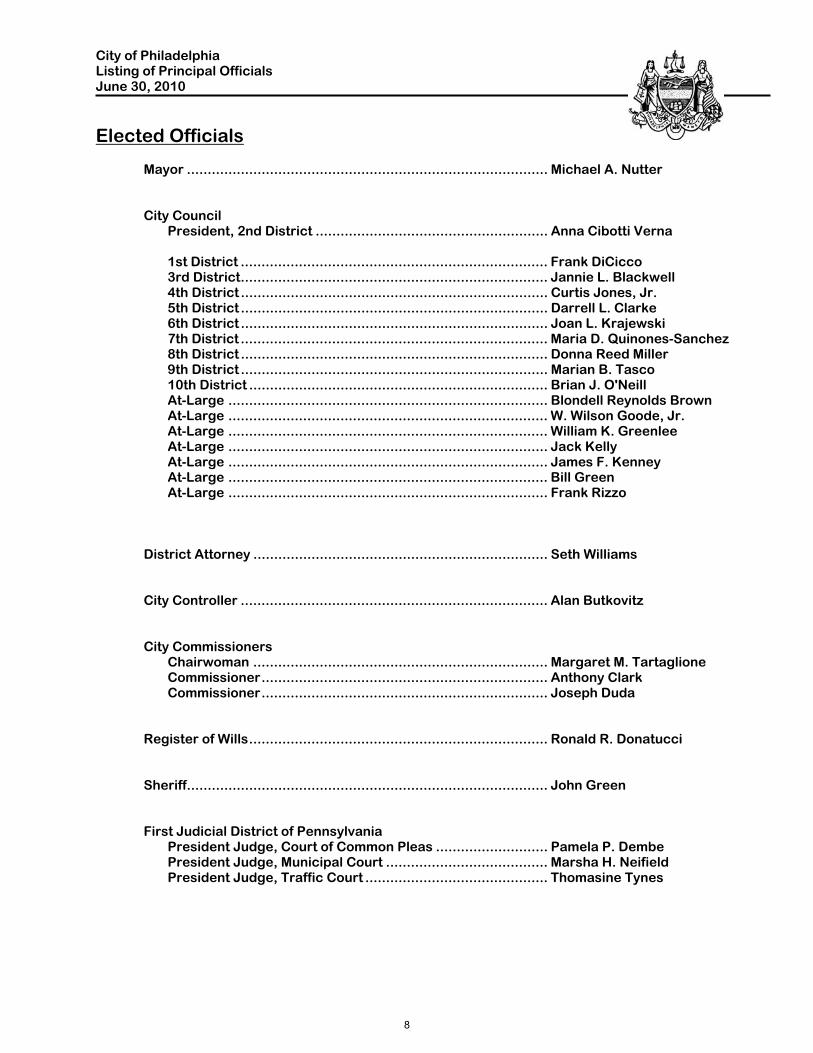
City of Philadelphia Listing of Principal Officials June 30, 2010
Elected Officials Mayor ....................................................................................... Michael A. Nutter City Council
President, 2nd District ........................................................ Anna Cibotti Verna 1st District .......................................................................... Frank DiCicco 3rd District.......................................................................... Jannie L. Blackwell 4th District .......................................................................... Curtis Jones, Jr. 5th District .......................................................................... Darrell L. Clarke 6th District .......................................................................... Joan L. Krajewski 7th District .......................................................................... Maria D. Quinones-Sanchez 8th District .......................................................................... Donna Reed Miller 9th District .......................................................................... Marian B. Tasco 10th District ........................................................................ Brian J. O'Neill At-Large ............................................................................. Blondell Reynolds Brown At-Large ............................................................................. W. Wilson Goode, Jr. At-Large ............................................................................. William K. Greenlee At-Large ............................................................................. Jack Kelly At-Large ............................................................................. James F. Kenney At-Large ............................................................................. Bill Green At-Large ............................................................................. Frank Rizzo
District Attorney ....................................................................... Seth Williams City Controller .......................................................................... Alan Butkovitz City Commissioners
Chairwoman ....................................................................... Margaret M. Tartaglione Commissioner..................................................................... Anthony Clark Commissioner..................................................................... Joseph Duda
Register of Wills........................................................................ Ronald R. Donatucci Sheriff....................................................................................... John Green First Judicial District of Pennsylvania
President Judge, Court of Common Pleas ........................... Pamela P. Dembe President Judge, Municipal Court ....................................... Marsha H. Neifield President Judge, Traffic Court ............................................ Thomasine Tynes
8
City of Philadelphia Listing of Principal Officials June 30, 2010
Appointed Officials Managing Director ........................................................................................... Camille Cates Barnett, Ph.D.
Director of Finance .......................................................................................... Rob Dubow
City Solicitor .................................................................................................... Shelley A. Smith
City Representative ......................................................................................... Melanie Johnson
Chief of Staff .................................................................................................... Clarence Armbrister
Deputy Mayor for Public Safety ........................................................................ Everett A. Gillison
Deputy Mayor for Health & Opportunity/Health Commissioner.......................... Donald R. Schwarz, MD
Deputy Mayor for Planning & Economic Development/Commerce Director....... Alan Greenberger
Chief Integrity Officer ...................................................................................... Joan L. Markman
Inspector General ............................................................................................ Amy L. Kurland
Chief Education Advisor to the Mayor............................................................... Lori A. Shorr, Ph.D.
Senior Advisor to the Mayor ............................................................................. Pauline Abernathy
Chief Information Officer.................................................................................. Allan Frank
Deputy Mayor for Economic Development ....................................................... Alan Greenberger
City Treasurer.................................................................................................. Rebecca Rhynhart
Revenue Commissioner ................................................................................... Keith Richardson
Procurement Commissioner............................................................................. Hugh Ortman
Police Commissioner ....................................................................................... Charles Ramsey
Prisons Commissioner ..................................................................................... Louis Giorla
Streets Commissioner...................................................................................... Clarena Tolson
Fire Commissioner........................................................................................... Lloyd Ayers
Commissioner of Parks and Recreation............................................................ Michael DiBerardinis
Public Property Commissioner......................................................................... Joan Schlotterbeck
Director of the Office of Behavioral Health ....................................................... Arthur C. Evans, MD
Department of Human Services Commissioner................................................. Anne Marie Ambrose
Licenses and Inspections Commissioner.......................................................... Fran Burns
Water Commissioner........................................................................................ Bernard Brunwasser
Records Commissioner.................................................................................... Joan T. Decker
Human Resources Director.............................................................................. Albert L. D’Attilio
Executive Director of the Board of Pensions & Retirement ............................... Francis X. Bielli
Executive Director of the Sinking Fund Commission ......................................... Carl P. Coin
Director of Aviation.......................................................................................... Mark Gale
Director of the Office of Labor Relations .......................................................... Joseph Tolan
9

10
13
City of Philadelphia P E N N S Y L V A N I A
Management’s Discussion & Analysis
This narrative overview and analysis of the financial statements of the City of Philadelphia, Pennsylvania for the fiscal year ended June 30, 2010 has been prepared by the city’s management. The information presented here should be read in conjunction with additional information contained in our letter of transmittal, which can be found beginning on page 1, and the city’s financial statements immediately following this discussion and analysis. Financial Highlights At the end of the current fiscal year, the City of Philadelphia’s net liabilities were $197.7 million
resulting from an excess of its liabilities over its assets. Its unrestricted net assets showed a deficit of $2,164.7 million. This deficiency will have to be funded from resources generated in future years. During the current fiscal year the city’s total net assets decreased by $436.6 million. The
governmental activities of the city experienced a decrease of $483.4 million, while the business type activities had an increase of $46.8 million. For the current fiscal year, the city’s governmental funds reported a combined ending fund balance of
$541.9 million, a decrease of $117.5 million from last year. Primarily, this was due to Other Governmental funds which experienced a decrease in Fund Balance of $86.5 million. The unreserved fund balance of the governmental funds ended the fiscal year with a deficit of $44.7 million, an increase of $30.6 million from last year. The overall unreserved fund balance of the city’s General fund ended the fiscal year with a deficit of
$251.8 million, an increase from last year of $22.7 million. This is due to a decrease in expenditures of $360.4 million, a 5.1% decrease over the previous year. On the legally enacted budgetary basis, the city’s general fund ended the fiscal year with a deficit
fund balance of $114.0 million, as compared to a deficit of $137.2 million last year. This increase of $23.2 million was due to cost containment efforts which created an operating surplus of $0.6 million and the cancellations of prior year obligations further increased the fund balance. Overview of the Financial Statements This discussion and analysis are intended to serve as an introduction and overview of the City of Philadelphia’s basic financial statements. The city’s basic financial statements are comprised of: Government-wide financial statements which provide both long-term and short-term information about
the city’s overall financial condition. Fund financial statements which provide a more detailed look at major individual portions, or funds, of
the city. Notes to the financial statements which explain some of the information contained in the financial
statements and provide more detailed data. Other supplementary information which further explains and supports the information in the financial
statements.
City of Philadelphia Management’s Discussion & Analysis Fiscal Year Ended June 30, 2010
14
Government-wide financial statements. The government-wide financial statements report information about the city as a whole using accounting methods similar to those used by a private-sector business. The two statements presented are: The statement of net assets which includes all of the city’s assets and liabilities, with the difference between the two reported as net assets. Over time, increases or decreases in net assets are an indicator of whether the city’s financial position is improving or deteriorating. The statement of activities presents revenues and expenses and their effect on the change in the city’s net assets during the current fiscal year. These changes in net assets are recorded as soon as the underlying event giving rise to the change occurs, regardless of when cash is received or paid. The government-wide financial statements of the city are reflected in three distinct categories: Governmental activities are primarily supported by taxes and state and federal grants. The governmental
activities include general government; economic and neighborhood development; public health, welfare and safety; cultural and recreational; streets, highways and sanitation; and the financing activities of the city’s two blended component units - the Pennsylvania Intergovernmental Cooperation Authority and Philadelphia Municipal Authority. Business-type activities are supported by user fees and charges which are intended to recover all or a
significant portion of their costs. The city’s water and waste water systems, airport and industrial land bank are all included as business type activities. These two activities comprise the primary government of Philadelphia. Component units are legally separate entities for which the City of Philadelphia is financially accountable
or has oversight responsibility. Financial information for these component units is reported separately from the financial information presented for the primary government. The city’s government-wide financial statements contain nine distinct component units; the Philadelphia School District, Community College of Philadelphia, Community Behavioral Health, the Convention Center Authority, Gas Works, Parking Authority, Delaware River Waterfront Corporation, Philadelphia Authority for Industrial Development and the Redevelopment Authority. Fund financial statements. The fund financial statements provide detailed information about the city’s most significant funds, not the city as a whole. Funds are groupings of activities that enable the city to maintain control over resources that have been segregated for particular purposes or objectives. All of the funds of the City of Philadelphia can be divided into three categories: governmental funds, proprietary funds and fiduciary funds. Governmental funds. The governmental funds are used to account for the financial activity of the city’s
basic services, similar to those described for the governmental activities in the government-wide financial statements. However, unlike the government-wide statements which provide a long-term focus of the city, the fund financial statements focus on a short term view of the inflows and outflows of expendable resources, as well as on the balances of expendable resources available at the end of the fiscal year. The financial information presented for the governmental funds are useful in evaluating the city’s short term financing requirements. To help the readers of the financial statements better understand the relationships and differences between the long term view of the government-wide financial statements from the short term view of the fund financial statements, reconciliations are presented between the fund financial statements and the government-wide statements.
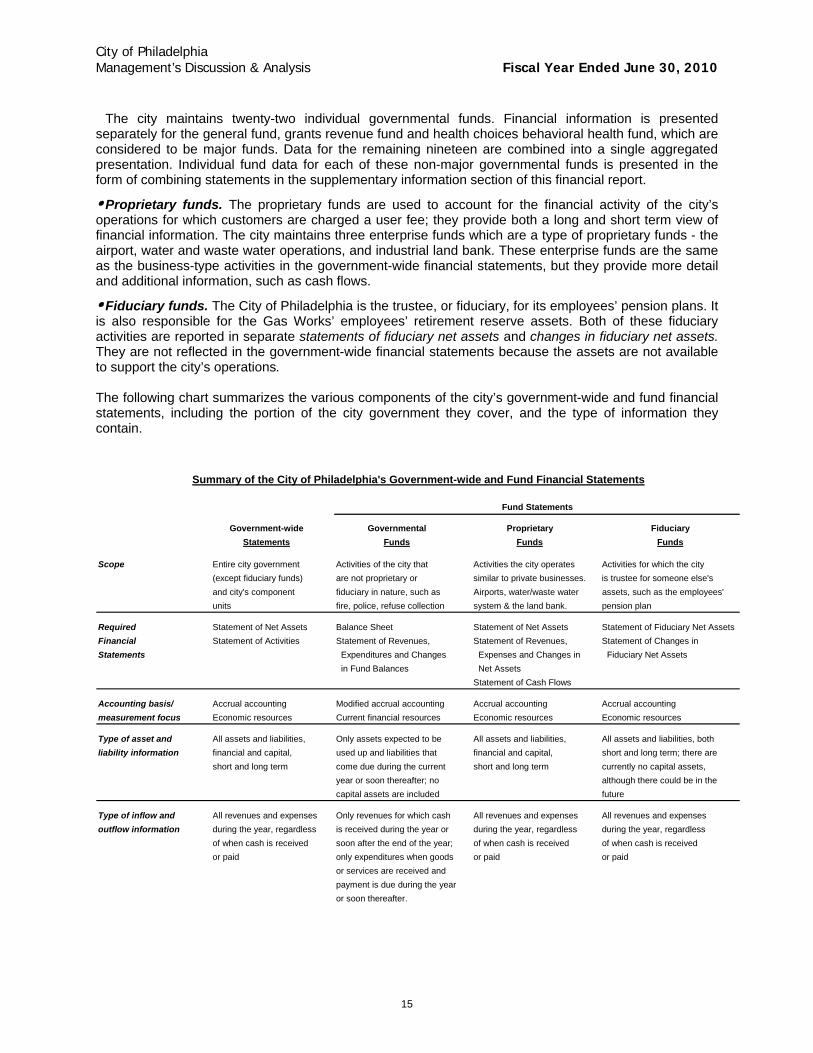
City of Philadelphia Management’s Discussion & Analysis Fiscal Year Ended June 30, 2010
15
The city maintains twenty-two individual governmental funds. Financial information is presented separately for the general fund, grants revenue fund and health choices behavioral health fund, which are considered to be major funds. Data for the remaining nineteen are combined into a single aggregated presentation. Individual fund data for each of these non-major governmental funds is presented in the form of combining statements in the supplementary information section of this financial report. Proprietary funds. The proprietary funds are used to account for the financial activity of the city’s
operations for which customers are charged a user fee; they provide both a long and short term view of financial information. The city maintains three enterprise funds which are a type of proprietary funds - the airport, water and waste water operations, and industrial land bank. These enterprise funds are the same as the business-type activities in the government-wide financial statements, but they provide more detail and additional information, such as cash flows. Fiduciary funds. The City of Philadelphia is the trustee, or fiduciary, for its employees’ pension plans. It
is also responsible for the Gas Works’ employees’ retirement reserve assets. Both of these fiduciary activities are reported in separate statements of fiduciary net assets and changes in fiduciary net assets. They are not reflected in the government-wide financial statements because the assets are not available to support the city’s operations. The following chart summarizes the various components of the city’s government-wide and fund financial statements, including the portion of the city government they cover, and the type of information they contain.
Summary of the City of Philadelphia's Government-wide and Fund Financial Statements
Fund Statements
Government-wide Governmental Proprietary FiduciaryStatements Funds Funds Funds
Scope Entire city government Activities of the city that Activities the city operates Activities for which the city
(except fiduciary funds) are not proprietary or similar to private businesses. is trustee for someone else's
and city's component fiduciary in nature, such as Airports, water/waste water assets, such as the employees'
units fire, police, refuse collection system & the land bank. pension plan
Required Statement of Net Assets Balance Sheet Statement of Net Assets Statement of Fiduciary Net Assets
Financial Statement of Activities Statement of Revenues, Statement of Revenues, Statement of Changes in
Statements Expenditures and Changes Expenses and Changes in Fiduciary Net Assets
in Fund Balances Net Assets
Statement of Cash Flows
Accounting basis/ Accrual accounting Modified accrual accounting Accrual accounting Accrual accounting
measurement focus Economic resources Current financial resources Economic resources Economic resources
Type of asset and All assets and liabilities, Only assets expected to be All assets and liabilities, All assets and liabilities, both
liability information financial and capital, used up and liabilities that financial and capital, short and long term; there are
short and long term come due during the current short and long term currently no capital assets,
year or soon thereafter; no although there could be in the
capital assets are included future
Type of inflow and All revenues and expenses Only revenues for which cash All revenues and expenses All revenues and expenses
outflow information during the year, regardless is received during the year or during the year, regardless during the year, regardless
of when cash is received soon after the end of the year; of when cash is received of when cash is received
or paid only expenditures when goods or paid or paid
or services are received and
payment is due during the year
or soon thereafter.
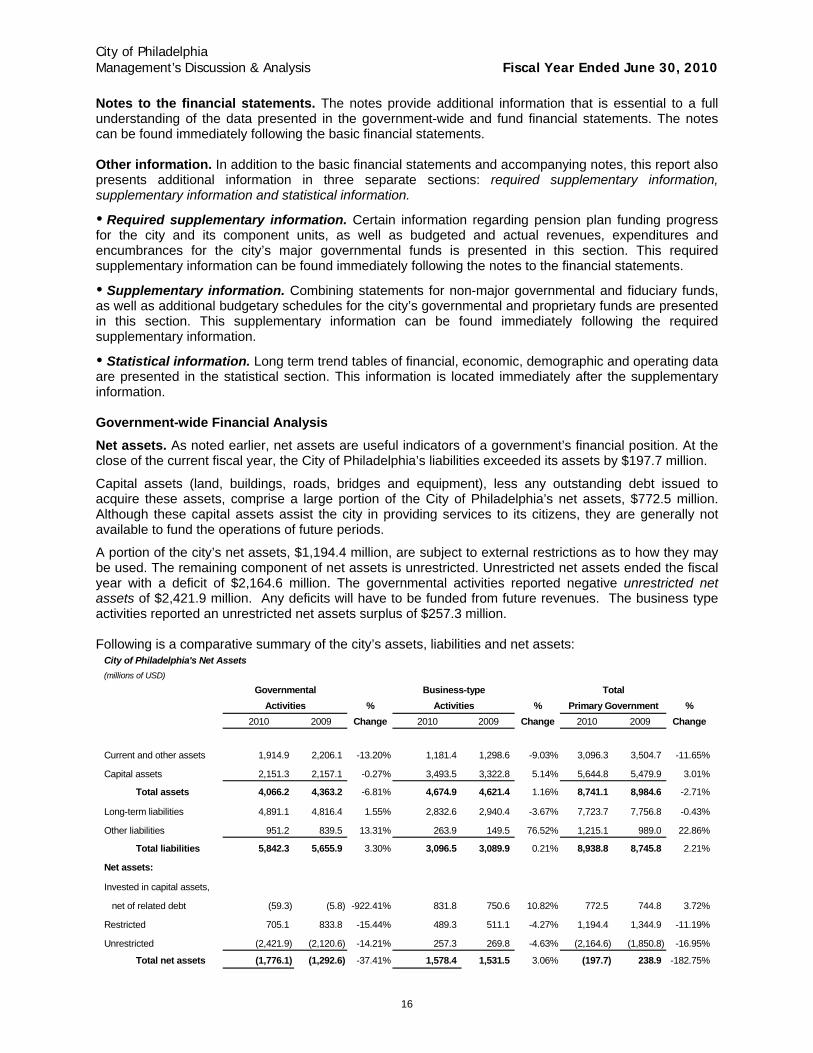
City of Philadelphia Management’s Discussion & Analysis Fiscal Year Ended June 30, 2010
16
Notes to the financial statements. The notes provide additional information that is essential to a full understanding of the data presented in the government-wide and fund financial statements. The notes can be found immediately following the basic financial statements. Other information. In addition to the basic financial statements and accompanying notes, this report also presents additional information in three separate sections: required supplementary information, supplementary information and statistical information. Required supplementary information. Certain information regarding pension plan funding progress
for the city and its component units, as well as budgeted and actual revenues, expenditures and encumbrances for the city’s major governmental funds is presented in this section. This required supplementary information can be found immediately following the notes to the financial statements. Supplementary information. Combining statements for non-major governmental and fiduciary funds,
as well as additional budgetary schedules for the city’s governmental and proprietary funds are presented in this section. This supplementary information can be found immediately following the required supplementary information. Statistical information. Long term trend tables of financial, economic, demographic and operating data
are presented in the statistical section. This information is located immediately after the supplementary information. Government-wide Financial Analysis Net assets. As noted earlier, net assets are useful indicators of a government’s financial position. At the close of the current fiscal year, the City of Philadelphia’s liabilities exceeded its assets by $197.7 million. Capital assets (land, buildings, roads, bridges and equipment), less any outstanding debt issued to acquire these assets, comprise a large portion of the City of Philadelphia’s net assets, $772.5 million. Although these capital assets assist the city in providing services to its citizens, they are generally not available to fund the operations of future periods. A portion of the city’s net assets, $1,194.4 million, are subject to external restrictions as to how they may be used. The remaining component of net assets is unrestricted. Unrestricted net assets ended the fiscal year with a deficit of $2,164.6 million. The governmental activities reported negative unrestricted net assets of $2,421.9 million. Any deficits will have to be funded from future revenues. The business type activities reported an unrestricted net assets surplus of $257.3 million. Following is a comparative summary of the city’s assets, liabilities and net assets:
City of Philadelphia's Net Assets(millions of USD)
Governmental Business-type TotalActivities % Activities % Primary Government %
2010 2009 Change 2010 2009 Change 2010 2009 Change
Current and other assets 1,914.9 2,206.1 -13.20% 1,181.4 1,298.6 -9.03% 3,096.3 3,504.7 -11.65%
Capital assets 2,151.3 2,157.1 -0.27% 3,493.5 3,322.8 5.14% 5,644.8 5,479.9 3.01%
Total assets 4,066.2 4,363.2 -6.81% 4,674.9 4,621.4 1.16% 8,741.1 8,984.6 -2.71%
Long-term liabilities 4,891.1 4,816.4 1.55% 2,832.6 2,940.4 -3.67% 7,723.7 7,756.8 -0.43%
Other liabilities 951.2 839.5 13.31% 263.9 149.5 76.52% 1,215.1 989.0 22.86%
Total liabilities 5,842.3 5,655.9 3.30% 3,096.5 3,089.9 0.21% 8,938.8 8,745.8 2.21%
Net assets:
Invested in capital assets,
net of related debt (59.3) (5.8) -922.41% 831.8 750.6 10.82% 772.5 744.8 3.72%
Restricted 705.1 833.8 -15.44% 489.3 511.1 -4.27% 1,194.4 1,344.9 -11.19%
Unrestricted (2,421.9) (2,120.6) -14.21% 257.3 269.8 -4.63% (2,164.6) (1,850.8) -16.95%
Total net assets (1,776.1) (1,292.6) -37.41% 1,578.4 1,531.5 3.06% (197.7) 238.9 -182.75%
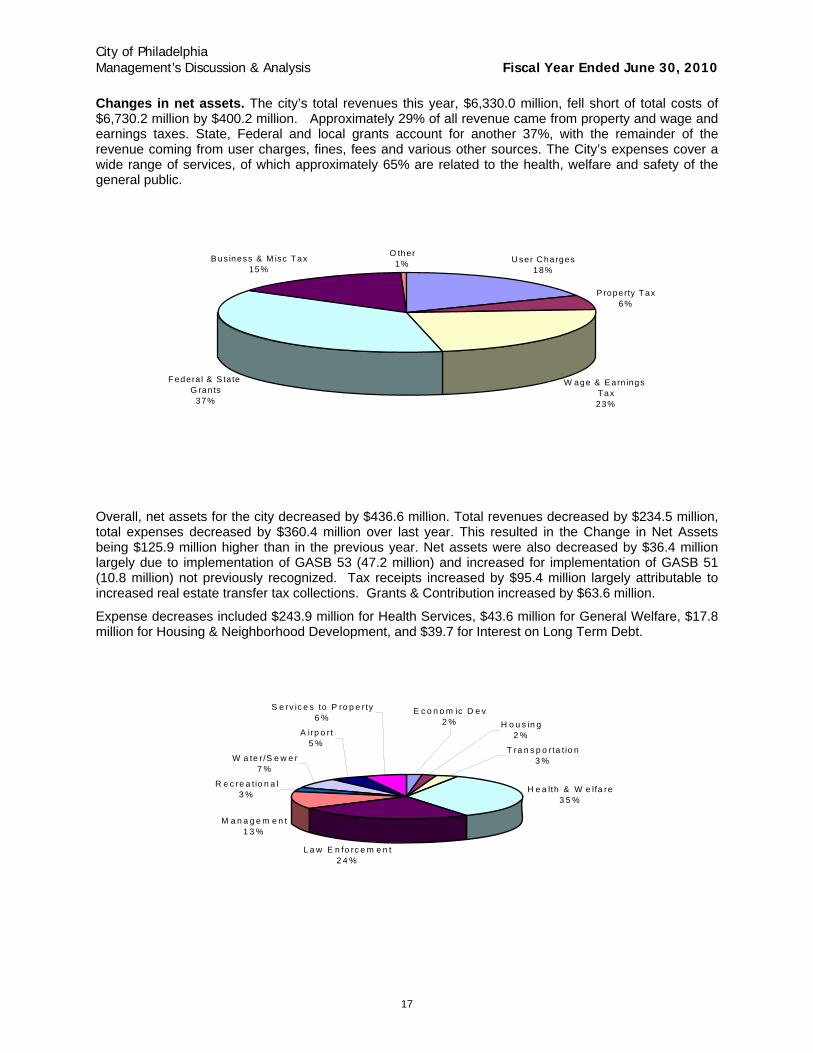
City of Philadelphia Management’s Discussion & Analysis Fiscal Year Ended June 30, 2010
17
Changes in net assets. The city’s total revenues this year, $6,330.0 million, fell short of total costs of $6,730.2 million by $400.2 million. Approximately 29% of all revenue came from property and wage and earnings taxes. State, Federal and local grants account for another 37%, with the remainder of the revenue coming from user charges, fines, fees and various other sources. The City’s expenses cover a wide range of services, of which approximately 65% are related to the health, welfare and safety of the general public.
U ser C harges18%
P roperty T ax6%
W age & E arn ings T ax23%
F edera l & S ta te G ran ts
37%
B us iness & M isc T ax15%
O ther1%
Overall, net assets for the city decreased by $436.6 million. Total revenues decreased by $234.5 million, total expenses decreased by $360.4 million over last year. This resulted in the Change in Net Assets being $125.9 million higher than in the previous year. Net assets were also decreased by $36.4 million largely due to implementation of GASB 53 (47.2 million) and increased for implementation of GASB 51 (10.8 million) not previously recognized. Tax receipts increased by $95.4 million largely attributable to increased real estate transfer tax collections. Grants & Contribution increased by $63.6 million.
Expense decreases included $243.9 million for Health Services, $43.6 million for General Welfare, $17.8 million for Housing & Neighborhood Development, and $39.7 for Interest on Long Term Debt.
H e a lth & W e lfa re3 5 %
L a w E n fo rc e m e n t2 4 %
M a n a g e m e n t1 3 %
R e c re a t io n a l3 %
W a te r /S e w e r7 %
A irp o r t5 %
S e rv ic e s to P ro p e r ty6 %
H o u s in g2 %
T ra n s p o r ta t io n3 %
E c o n o m ic D e v2 %
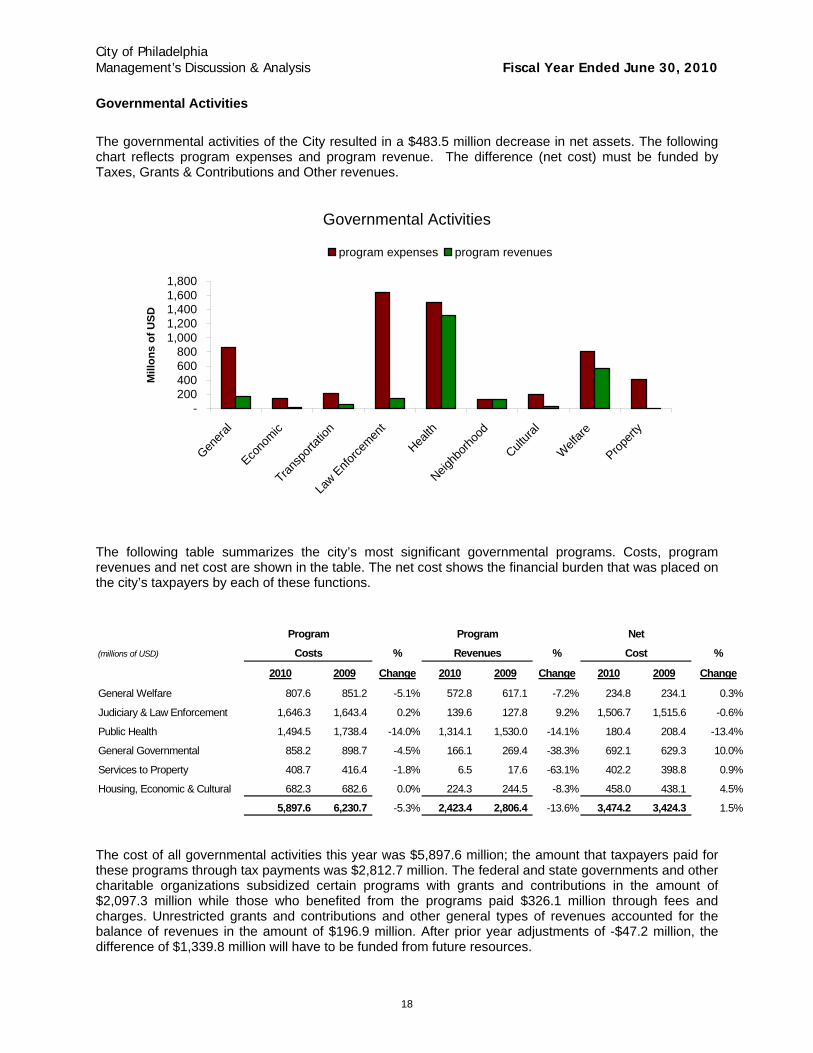
City of Philadelphia Management’s Discussion & Analysis Fiscal Year Ended June 30, 2010
18
Governmental Activities The governmental activities of the City resulted in a $483.5 million decrease in net assets. The following chart reflects program expenses and program revenue. The difference (net cost) must be funded by Taxes, Grants & Contributions and Other revenues.
Governmental Activities
-200400600800
1,0001,2001,4001,6001,800
Gener
al
Econo
mic
Trans
porta
tion
Law E
nfor
cem
ent
Health
Neigh
borh
ood
Cultur
al
Welf
are
Prope
rty
Mill
ons
of U
SD
program expenses program revenues
The following table summarizes the city’s most significant governmental programs. Costs, program revenues and net cost are shown in the table. The net cost shows the financial burden that was placed on the city’s taxpayers by each of these functions.
Program Program Net
(millions of USD) Costs % Revenues % Cost %
2010 2009 Change 2010 2009 Change 2010 2009 Change
General Welfare 807.6 851.2 -5.1% 572.8 617.1 -7.2% 234.8 234.1 0.3%
Judiciary & Law Enforcement 1,646.3 1,643.4 0.2% 139.6 127.8 9.2% 1,506.7 1,515.6 -0.6%
Public Health 1,494.5 1,738.4 -14.0% 1,314.1 1,530.0 -14.1% 180.4 208.4 -13.4%
General Governmental 858.2 898.7 -4.5% 166.1 269.4 -38.3% 692.1 629.3 10.0%
Services to Property 408.7 416.4 -1.8% 6.5 17.6 -63.1% 402.2 398.8 0.9%
Housing, Economic & Cultural 682.3 682.6 0.0% 224.3 244.5 -8.3% 458.0 438.1 4.5%
5,897.6 6,230.7 -5.3% 2,423.4 2,806.4 -13.6% 3,474.2 3,424.3 1.5%
The cost of all governmental activities this year was $5,897.6 million; the amount that taxpayers paid for these programs through tax payments was $2,812.7 million. The federal and state governments and other charitable organizations subsidized certain programs with grants and contributions in the amount of $2,097.3 million while those who benefited from the programs paid $326.1 million through fees and charges. Unrestricted grants and contributions and other general types of revenues accounted for the balance of revenues in the amount of $196.9 million. After prior year adjustments of -$47.2 million, the difference of $1,339.8 million will have to be funded from future resources.
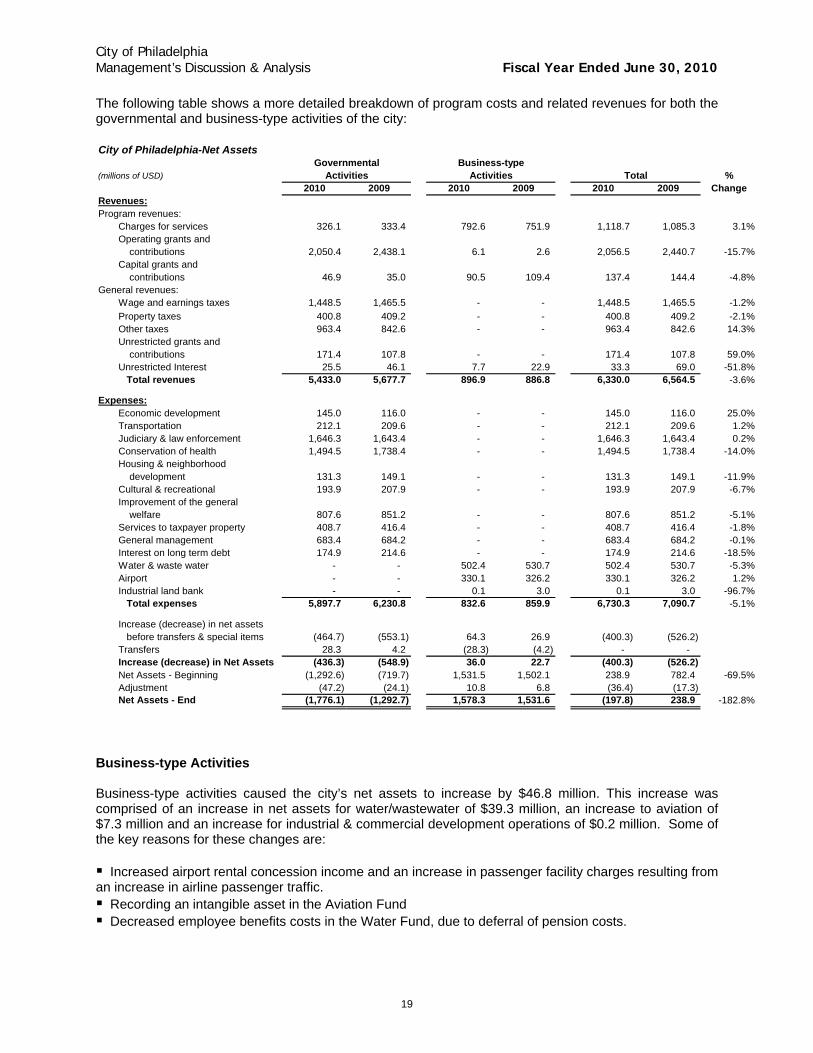
City of Philadelphia Management’s Discussion & Analysis Fiscal Year Ended June 30, 2010
19
The following table shows a more detailed breakdown of program costs and related revenues for both the governmental and business-type activities of the city: City of Philadelphia-Net Assets
Governmental Business-type(millions of USD) Activities Activities Total %
2010 2009 2010 2009 2010 2009 ChangeRevenues:Program revenues:
Charges for services 326.1 333.4 792.6 751.9 1,118.7 1,085.3 3.1%Operating grants and contributions 2,050.4 2,438.1 6.1 2.6 2,056.5 2,440.7 -15.7%Capital grants and contributions 46.9 35.0 90.5 109.4 137.4 144.4 -4.8%
General revenues:Wage and earnings taxes 1,448.5 1,465.5 - - 1,448.5 1,465.5 -1.2%
Property taxes 400.8 409.2 - - 400.8 409.2 -2.1%Other taxes 963.4 842.6 - - 963.4 842.6 14.3%Unrestricted grants and contributions 171.4 107.8 - - 171.4 107.8 59.0%Unrestricted Interest 25.5 46.1 7.7 22.9 33.3 69.0 -51.8% Total revenues 5,433.0 5,677.7 896.9 886.8 6,330.0 6,564.5 -3.6%
Expenses:Economic development 145.0 116.0 - - 145.0 116.0 25.0%Transportation 212.1 209.6 - - 212.1 209.6 1.2%Judiciary & law enforcement 1,646.3 1,643.4 - - 1,646.3 1,643.4 0.2%Conservation of health 1,494.5 1,738.4 - - 1,494.5 1,738.4 -14.0%Housing & neighborhood development 131.3 149.1 - - 131.3 149.1 -11.9%Cultural & recreational 193.9 207.9 - - 193.9 207.9 -6.7%Improvement of the general welfare 807.6 851.2 - - 807.6 851.2 -5.1%Services to taxpayer property 408.7 416.4 - - 408.7 416.4 -1.8%General management 683.4 684.2 - - 683.4 684.2 -0.1%Interest on long term debt 174.9 214.6 - - 174.9 214.6 -18.5%Water & waste water - - 502.4 530.7 502.4 530.7 -5.3%Airport - - 330.1 326.2 330.1 326.2 1.2%Industrial land bank - - 0.1 3.0 0.1 3.0 -96.7% Total expenses 5,897.7 6,230.8 832.6 859.9 6,730.3 7,090.7 -5.1%
Increase (decrease) in net assets before transfers & special items (464.7) (553.1) 64.3 26.9 (400.3) (526.2) Transfers 28.3 4.2 (28.3) (4.2) - - Increase (decrease) in Net Assets (436.3) (548.9) 36.0 22.7 (400.3) (526.2) Net Assets - Beginning (1,292.6) (719.7) 1,531.5 1,502.1 238.9 782.4 -69.5%Adjustment (47.2) (24.1) 10.8 6.8 (36.4) (17.3) Net Assets - End (1,776.1) (1,292.7) 1,578.3 1,531.6 (197.8) 238.9 -182.8%
Business-type Activities Business-type activities caused the city’s net assets to increase by $46.8 million. This increase was comprised of an increase in net assets for water/wastewater of $39.3 million, an increase to aviation of $7.3 million and an increase for industrial & commercial development operations of $0.2 million. Some of the key reasons for these changes are: Increased airport rental concession income and an increase in passenger facility charges resulting from
an increase in airline passenger traffic. Recording an intangible asset in the Aviation Fund Decreased employee benefits costs in the Water Fund, due to deferral of pension costs.
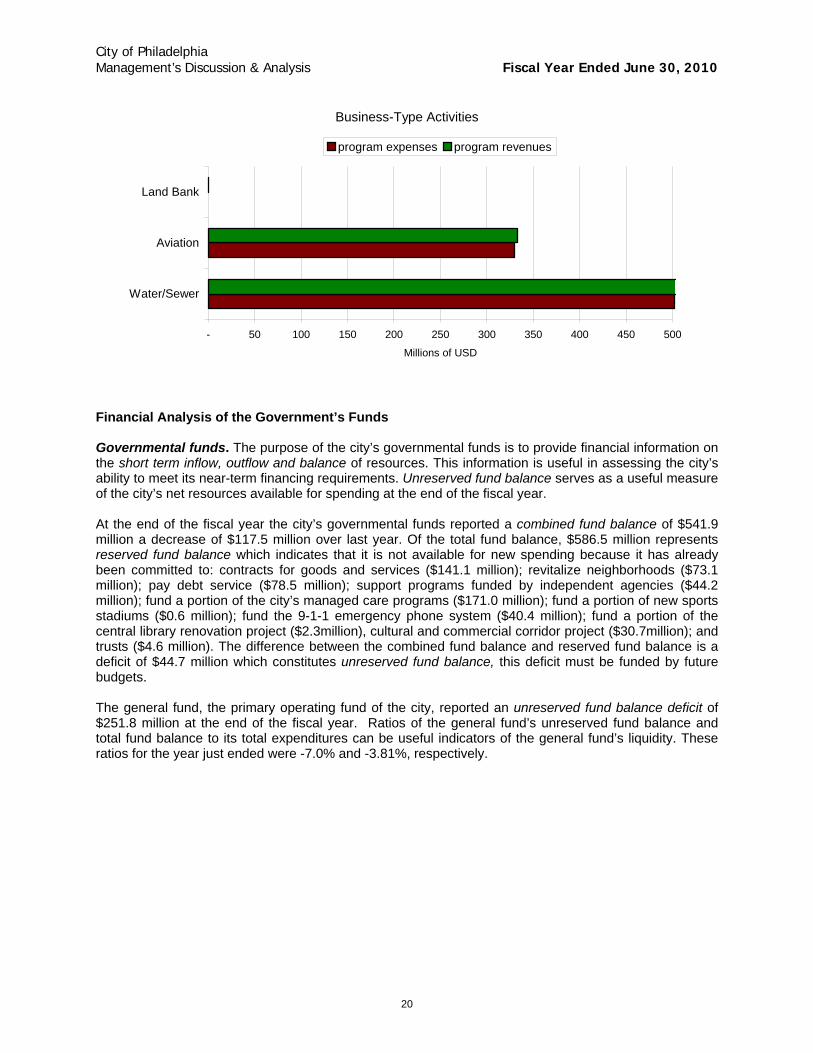
City of Philadelphia Management’s Discussion & Analysis Fiscal Year Ended June 30, 2010
20
Business-Type Activities
- 50 100 150 200 250 300 350 400 450 500
Water/Sewer
Aviation
Land Bank
Millions of USD
program expenses program revenues
Financial Analysis of the Government’s Funds Governmental funds. The purpose of the city’s governmental funds is to provide financial information on the short term inflow, outflow and balance of resources. This information is useful in assessing the city’s ability to meet its near-term financing requirements. Unreserved fund balance serves as a useful measure of the city’s net resources available for spending at the end of the fiscal year. At the end of the fiscal year the city’s governmental funds reported a combined fund balance of $541.9 million a decrease of $117.5 million over last year. Of the total fund balance, $586.5 million represents reserved fund balance which indicates that it is not available for new spending because it has already been committed to: contracts for goods and services ($141.1 million); revitalize neighborhoods ($73.1 million); pay debt service ($78.5 million); support programs funded by independent agencies ($44.2 million); fund a portion of the city’s managed care programs ($171.0 million); fund a portion of new sports stadiums ($0.6 million); fund the 9-1-1 emergency phone system ($40.4 million); fund a portion of the central library renovation project ($2.3million), cultural and commercial corridor project ($30.7million); and trusts ($4.6 million). The difference between the combined fund balance and reserved fund balance is a deficit of $44.7 million which constitutes unreserved fund balance, this deficit must be funded by future budgets. The general fund, the primary operating fund of the city, reported an unreserved fund balance deficit of $251.8 million at the end of the fiscal year. Ratios of the general fund’s unreserved fund balance and total fund balance to its total expenditures can be useful indicators of the general fund’s liquidity. These ratios for the year just ended were -7.0% and -3.81%, respectively.
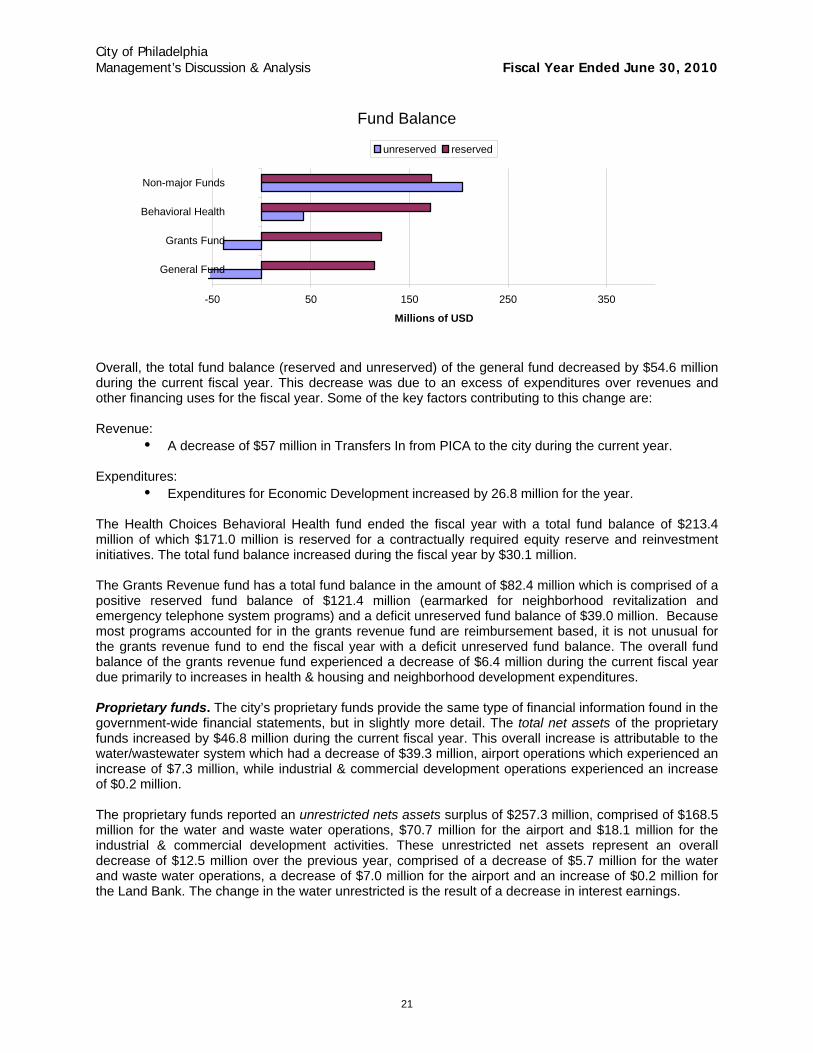
City of Philadelphia Management’s Discussion & Analysis Fiscal Year Ended June 30, 2010
21
Fund Balance
-50 50 150 250 350
General Fund
Grants Fund
Behavioral Health
Non-major Funds
Millions of USD
unreserved reserved
Overall, the total fund balance (reserved and unreserved) of the general fund decreased by $54.6 million during the current fiscal year. This decrease was due to an excess of expenditures over revenues and other financing uses for the fiscal year. Some of the key factors contributing to this change are: Revenue:
A decrease of $57 million in Transfers In from PICA to the city during the current year. Expenditures:
Expenditures for Economic Development increased by 26.8 million for the year. The Health Choices Behavioral Health fund ended the fiscal year with a total fund balance of $213.4 million of which $171.0 million is reserved for a contractually required equity reserve and reinvestment initiatives. The total fund balance increased during the fiscal year by $30.1 million. The Grants Revenue fund has a total fund balance in the amount of $82.4 million which is comprised of a positive reserved fund balance of $121.4 million (earmarked for neighborhood revitalization and emergency telephone system programs) and a deficit unreserved fund balance of $39.0 million. Because most programs accounted for in the grants revenue fund are reimbursement based, it is not unusual for the grants revenue fund to end the fiscal year with a deficit unreserved fund balance. The overall fund balance of the grants revenue fund experienced a decrease of $6.4 million during the current fiscal year due primarily to increases in health & housing and neighborhood development expenditures. Proprietary funds. The city’s proprietary funds provide the same type of financial information found in the government-wide financial statements, but in slightly more detail. The total net assets of the proprietary funds increased by $46.8 million during the current fiscal year. This overall increase is attributable to the water/wastewater system which had a decrease of $39.3 million, airport operations which experienced an increase of $7.3 million, while industrial & commercial development operations experienced an increase of $0.2 million. The proprietary funds reported an unrestricted nets assets surplus of $257.3 million, comprised of $168.5 million for the water and waste water operations, $70.7 million for the airport and $18.1 million for the industrial & commercial development activities. These unrestricted net assets represent an overall decrease of $12.5 million over the previous year, comprised of a decrease of $5.7 million for the water and waste water operations, a decrease of $7.0 million for the airport and an increase of $0.2 million for the Land Bank. The change in the water unrestricted is the result of a decrease in interest earnings.
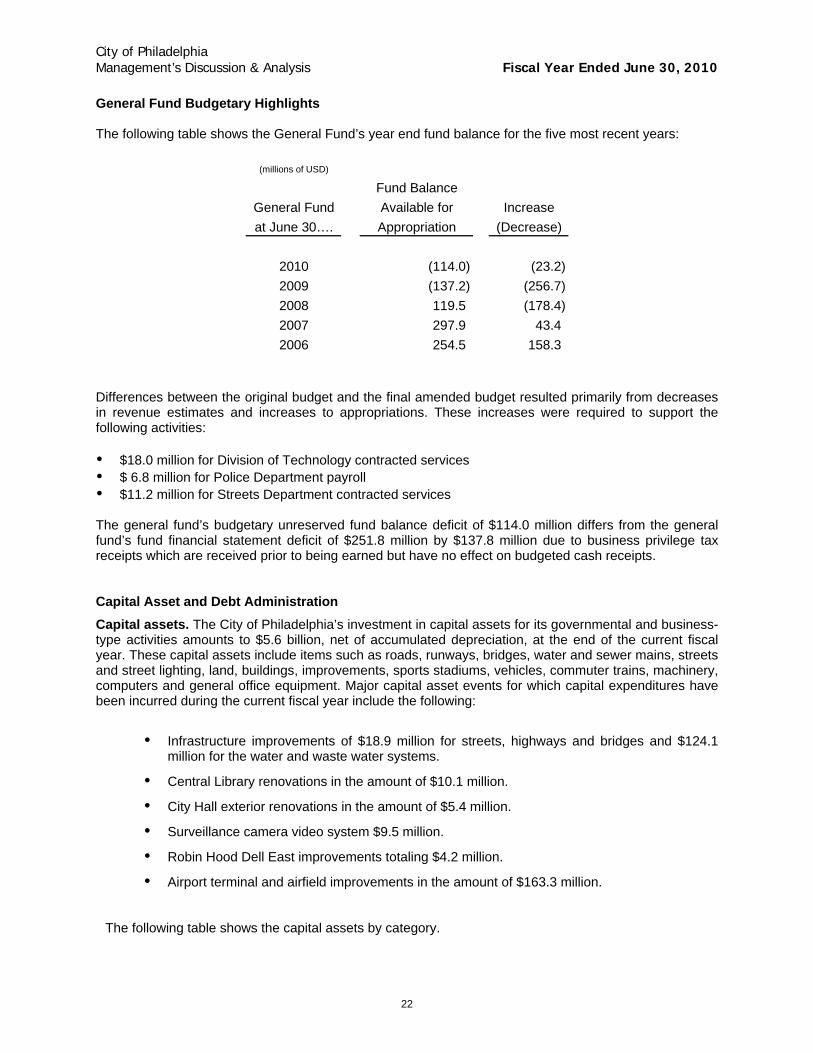
City of Philadelphia Management’s Discussion & Analysis Fiscal Year Ended June 30, 2010
22
General Fund Budgetary Highlights The following table shows the General Fund’s year end fund balance for the five most recent years:
(millions of USD)
Fund Balance
General Fund Available for Increase
at June 30…. Appropriation (Decrease)
2010 (114.0) (23.2)
2009 (137.2) (256.7)
2008 119.5 (178.4)
2007 297.9 43.4
2006 254.5 158.3
Differences between the original budget and the final amended budget resulted primarily from decreases in revenue estimates and increases to appropriations. These increases were required to support the following activities: $18.0 million for Division of Technology contracted services $ 6.8 million for Police Department payroll $11.2 million for Streets Department contracted services
The general fund’s budgetary unreserved fund balance deficit of $114.0 million differs from the general fund’s fund financial statement deficit of $251.8 million by $137.8 million due to business privilege tax receipts which are received prior to being earned but have no effect on budgeted cash receipts. Capital Asset and Debt Administration Capital assets. The City of Philadelphia’s investment in capital assets for its governmental and business-type activities amounts to $5.6 billion, net of accumulated depreciation, at the end of the current fiscal year. These capital assets include items such as roads, runways, bridges, water and sewer mains, streets and street lighting, land, buildings, improvements, sports stadiums, vehicles, commuter trains, machinery, computers and general office equipment. Major capital asset events for which capital expenditures have been incurred during the current fiscal year include the following:
Infrastructure improvements of $18.9 million for streets, highways and bridges and $124.1 million for the water and waste water systems.
Central Library renovations in the amount of $10.1 million.
City Hall exterior renovations in the amount of $5.4 million.
Surveillance camera video system $9.5 million.
Robin Hood Dell East improvements totaling $4.2 million.
Airport terminal and airfield improvements in the amount of $163.3 million.
The following table shows the capital assets by category.
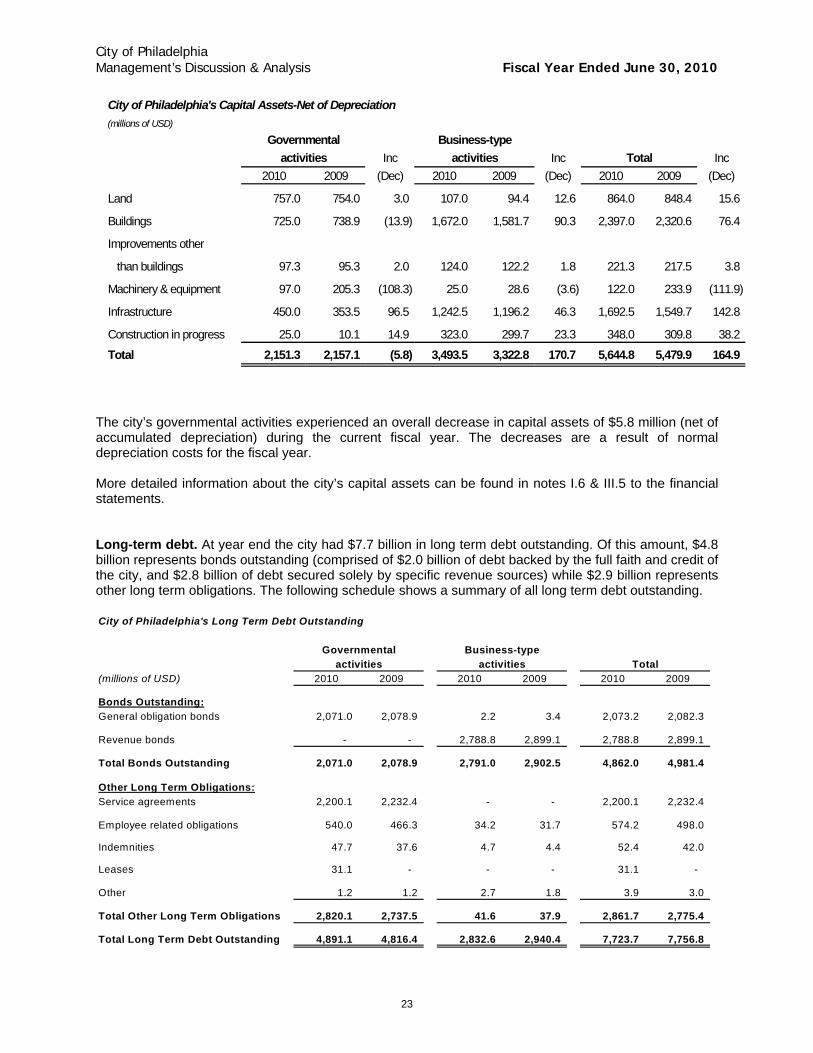
City of Philadelphia Management’s Discussion & Analysis Fiscal Year Ended June 30, 2010
23
City of Philadelphia's Capital Assets-Net of Depreciation(millions of USD)
Governmental Business-typeactivities Inc activities Inc Total Inc
2010 2009 (Dec) 2010 2009 (Dec) 2010 2009 (Dec)
Land 757.0 754.0 3.0 107.0 94.4 12.6 864.0 848.4 15.6
Buildings 725.0 738.9 (13.9) 1,672.0 1,581.7 90.3 2,397.0 2,320.6 76.4
Improvements other
than buildings 97.3 95.3 2.0 124.0 122.2 1.8 221.3 217.5 3.8
Machinery & equipment 97.0 205.3 (108.3) 25.0 28.6 (3.6) 122.0 233.9 (111.9)
Infrastructure 450.0 353.5 96.5 1,242.5 1,196.2 46.3 1,692.5 1,549.7 142.8
Construction in progress 25.0 10.1 14.9 323.0 299.7 23.3 348.0 309.8 38.2
Total 2,151.3 2,157.1 (5.8) 3,493.5 3,322.8 170.7 5,644.8 5,479.9 164.9
The city’s governmental activities experienced an overall decrease in capital assets of $5.8 million (net of accumulated depreciation) during the current fiscal year. The decreases are a result of normal depreciation costs for the fiscal year.
More detailed information about the city’s capital assets can be found in notes I.6 & III.5 to the financial statements. Long-term debt. At year end the city had $7.7 billion in long term debt outstanding. Of this amount, $4.8 billion represents bonds outstanding (comprised of $2.0 billion of debt backed by the full faith and credit of the city, and $2.8 billion of debt secured solely by specific revenue sources) while $2.9 billion represents other long term obligations. The following schedule shows a summary of all long term debt outstanding. City of Philadelphia's Long Term Debt Outstanding
Governmental Business-typeactivities activities Total
(millions of USD) 2010 2009 2010 2009 2010 2009
Bonds Outstanding:General obligation bonds 2,071.0 2,078.9 2.2 3.4 2,073.2 2,082.3
Revenue bonds - - 2,788.8 2,899.1 2,788.8 2,899.1
Total Bonds Outstanding 2,071.0 2,078.9 2,791.0 2,902.5 4,862.0 4,981.4
Other Long Term Obligations:Service agreements 2,200.1 2,232.4 - - 2,200.1 2,232.4
Employee related obligations 540.0 466.3 34.2 31.7 574.2 498.0
Indemnities 47.7 37.6 4.7 4.4 52.4 42.0
Leases 31.1 - - - 31.1 -
Other 1.2 1.2 2.7 1.8 3.9 3.0
Total Other Long Term Obligations 2,820.1 2,737.5 41.6 37.9 2,861.7 2,775.4
Total Long Term Debt Outstanding 4,891.1 4,816.4 2,832.6 2,940.4 7,723.7 7,756.8
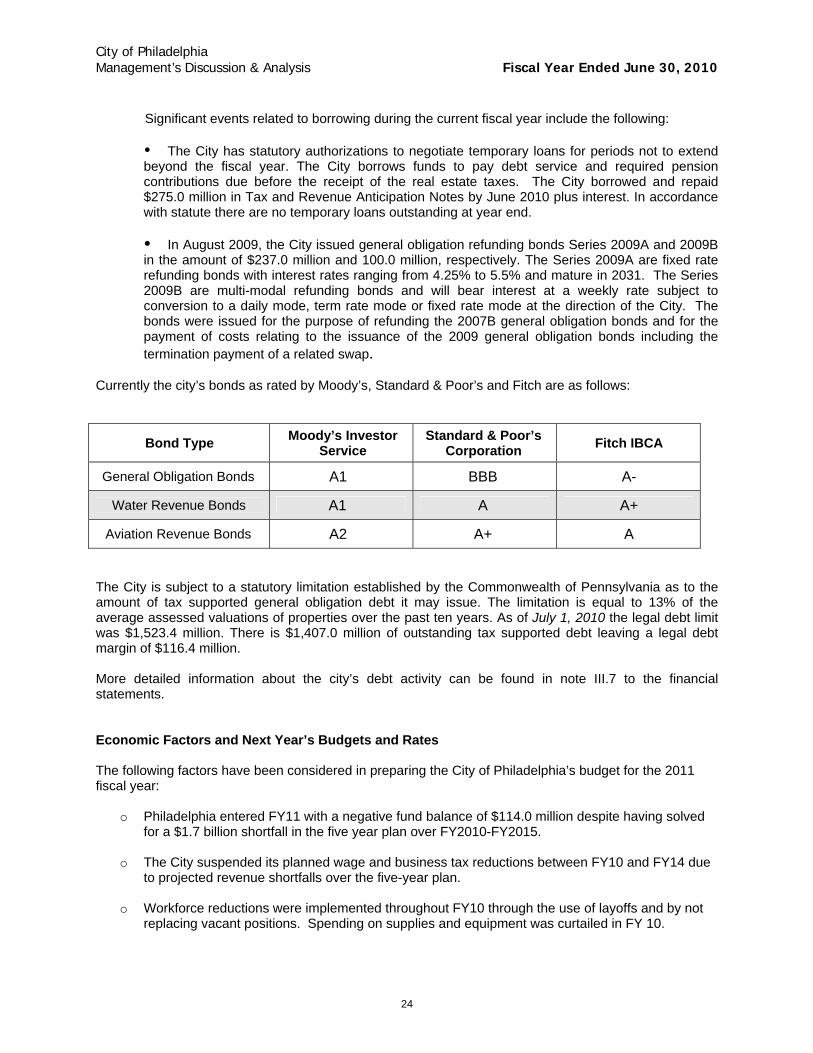
City of Philadelphia Management’s Discussion & Analysis Fiscal Year Ended June 30, 2010
24
Significant events related to borrowing during the current fiscal year include the following:
The City has statutory authorizations to negotiate temporary loans for periods not to extend
beyond the fiscal year. The City borrows funds to pay debt service and required pension contributions due before the receipt of the real estate taxes. The City borrowed and repaid $275.0 million in Tax and Revenue Anticipation Notes by June 2010 plus interest. In accordance with statute there are no temporary loans outstanding at year end. In August 2009, the City issued general obligation refunding bonds Series 2009A and 2009B
in the amount of $237.0 million and 100.0 million, respectively. The Series 2009A are fixed rate refunding bonds with interest rates ranging from 4.25% to 5.5% and mature in 2031. The Series 2009B are multi-modal refunding bonds and will bear interest at a weekly rate subject to conversion to a daily mode, term rate mode or fixed rate mode at the direction of the City. The bonds were issued for the purpose of refunding the 2007B general obligation bonds and for the payment of costs relating to the issuance of the 2009 general obligation bonds including the termination payment of a related swap.
Currently the city’s bonds as rated by Moody’s, Standard & Poor’s and Fitch are as follows:
Bond Type Moody’s Investor Service
Standard & Poor’s Corporation Fitch IBCA
General Obligation Bonds A1 BBB A-
Water Revenue Bonds A1 A A+
Aviation Revenue Bonds A2 A+ A
The City is subject to a statutory limitation established by the Commonwealth of Pennsylvania as to the amount of tax supported general obligation debt it may issue. The limitation is equal to 13% of the average assessed valuations of properties over the past ten years. As of July 1, 2010 the legal debt limit was $1,523.4 million. There is $1,407.0 million of outstanding tax supported debt leaving a legal debt margin of $116.4 million. More detailed information about the city’s debt activity can be found in note III.7 to the financial statements. Economic Factors and Next Year’s Budgets and Rates The following factors have been considered in preparing the City of Philadelphia’s budget for the 2011 fiscal year:
o Philadelphia entered FY11 with a negative fund balance of $114.0 million despite having solved for a $1.7 billion shortfall in the five year plan over FY2010-FY2015.
o The City suspended its planned wage and business tax reductions between FY10 and FY14 due
to projected revenue shortfalls over the five-year plan.
o Workforce reductions were implemented throughout FY10 through the use of layoffs and by not replacing vacant positions. Spending on supplies and equipment was curtailed in FY 10.
City of Philadelphia Management’s Discussion & Analysis Fiscal Year Ended June 30, 2010
25
o Union contracts for three of the City’s four major bargaining units are still outstanding, despite having expired in July 2009. Any awarded or negotiated wage or benefit increases will increase costs for the City.
o The country entered its most recent recession in December 2007. It is the longest recession in
the post-WWII period. o Economists expect a slow and long recovery from the current recession. Philadelphia’s recovery,
like that of other local governments, is expected to take longer than the nation due to high urban unemployment and lagging tax revenue collections.
Requests for information The Comprehensive Annual Financial Report is designed to provide a general overview of the City of Philadelphia’s finances for all interested parties. The City also publishes the Supplemental Report of Revenues & Obligations that provides a detailed look at budgetary activity at the legal level of compliance, the Annual Report of Bonded Indebtedness that details outstanding long term debt and the Schedule of Financial Assistance that reports on grant activity. All four reports are available on the City’s website, www.phila.gov/finance. Questions concerning any of the information provided in this report or requests for additional financial information should be addressed to: Office of the Director of Finance Suite 1340 MSB 1401 John F. Kennedy Boulevard
Philadelphia, PA 19102

26

City of Philadelphia P E N N S Y L V A N I A
Basic Financial
Statements
27
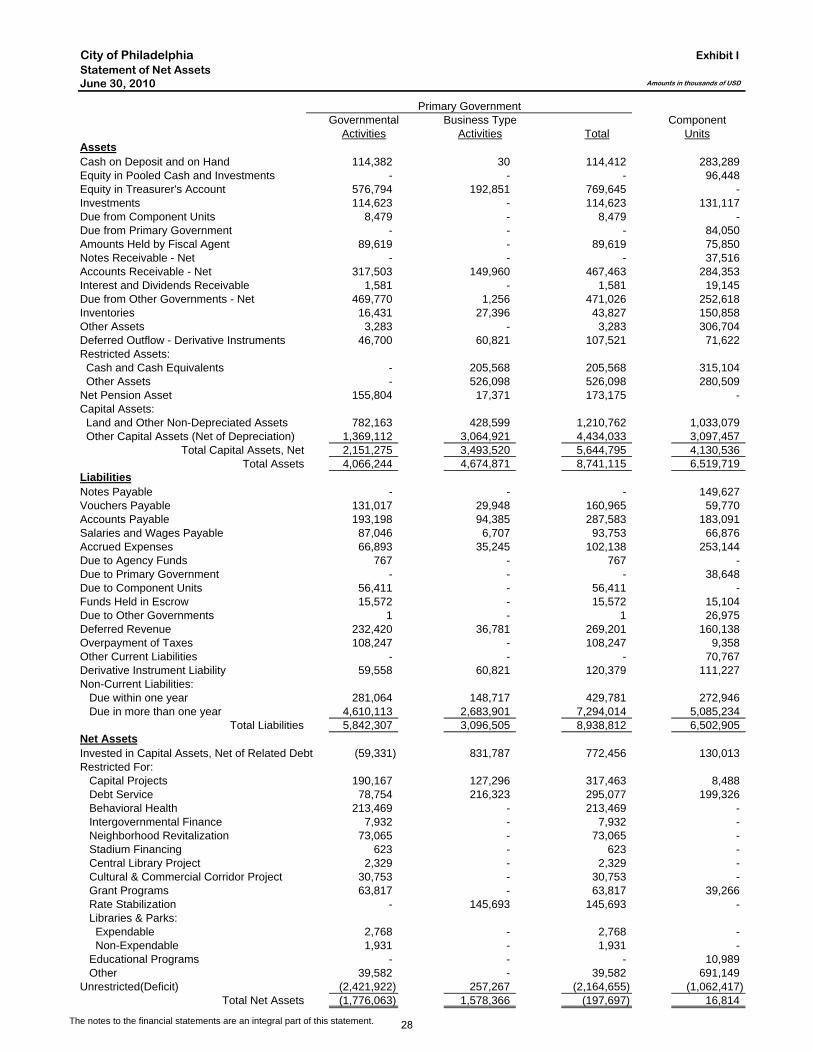
City of PhiladelphiaStatement of Net AssetsJune 30, 2010
Primary GovernmentGovernmental Business Type Component
Activities Activities Total UnitsAssetsCash on Deposit and on Hand 114,382 30 114,412 283,289 Equity in Pooled Cash and Investments - - - 96,448 Equity in Treasurer's Account 576,794 192,851 769,645 - Investments 114,623 - 114,623 131,117 Due from Component Units 8,479 - 8,479 - Due from Primary Government - - - 84,050 Amounts Held by Fiscal Agent 89,619 - 89,619 75,850 Notes Receivable - Net - - - 37,516 Accounts Receivable - Net 317,503 149,960 467,463 284,353 Interest and Dividends Receivable 1,581 - 1,581 19,145 Due from Other Governments - Net 469,770 1,256 471,026 252,618 Inventories 16,431 27,396 43,827 150,858 Other Assets 3,283 - 3,283 306,704 Deferred Outflow - Derivative Instruments 46,700 60,821 107,521 71,622 Restricted Assets: Cash and Cash Equivalents - 205,568 205,568 315,104 Other Assets - 526,098 526,098 280,509 Net Pension Asset 155,804 17,371 173,175 - Capital Assets: Land and Other Non-Depreciated Assets 782,163 428,599 1,210,762 1,033,079 Other Capital Assets (Net of Depreciation) 1,369,112 3,064,921 4,434,033 3,097,457
Total Capital Assets, Net 2,151,275 3,493,520 5,644,795 4,130,536 Total Assets 4,066,244 4,674,871 8,741,115 6,519,719
LiabilitiesNotes Payable - - - 149,627 Vouchers Payable 131,017 29,948 160,965 59,770 Accounts Payable 193,198 94,385 287,583 183,091 Salaries and Wages Payable 87,046 6,707 93,753 66,876 Accrued Expenses 66,893 35,245 102,138 253,144 Due to Agency Funds 767 - 767 - Due to Primary Government - - - 38,648 Due to Component Units 56,411 - 56,411 - Funds Held in Escrow 15,572 - 15,572 15,104 Due to Other Governments 1 - 1 26,975 Deferred Revenue 232,420 36,781 269,201 160,138 Overpayment of Taxes 108,247 - 108,247 9,358 Other Current Liabilities - - - 70,767 Derivative Instrument Liability 59,558 60,821 120,379 111,227 Non-Current Liabilities: Due within one year 281,064 148,717 429,781 272,946 Due in more than one year 4,610,113 2,683,901 7,294,014 5,085,234
Total Liabilities 5,842,307 3,096,505 8,938,812 6,502,905 Net AssetsInvested in Capital Assets, Net of Related Debt (59,331) 831,787 772,456 130,013 Restricted For: Capital Projects 190,167 127,296 317,463 8,488 Debt Service 78,754 216,323 295,077 199,326 Behavioral Health 213,469 - 213,469 - Intergovernmental Finance 7,932 - 7,932 - Neighborhood Revitalization 73,065 - 73,065 - Stadium Financing 623 - 623 - Central Library Project 2,329 - 2,329 - Cultural & Commercial Corridor Project 30,753 - 30,753 - Grant Programs 63,817 - 63,817 39,266 Rate Stabilization - 145,693 145,693 - Libraries & Parks: Expendable 2,768 - 2,768 - Non-Expendable 1,931 - 1,931 - Educational Programs - - - 10,989 Other 39,582 - 39,582 691,149 Unrestricted(Deficit) (2,421,922) 257,267 (2,164,655) (1,062,417)
Total Net Assets (1,776,063) 1,578,366 (197,697) 16,814
The notes to the financial statements are an integral part of this statement.
Exhibit I
Amounts in thousands of USD
28
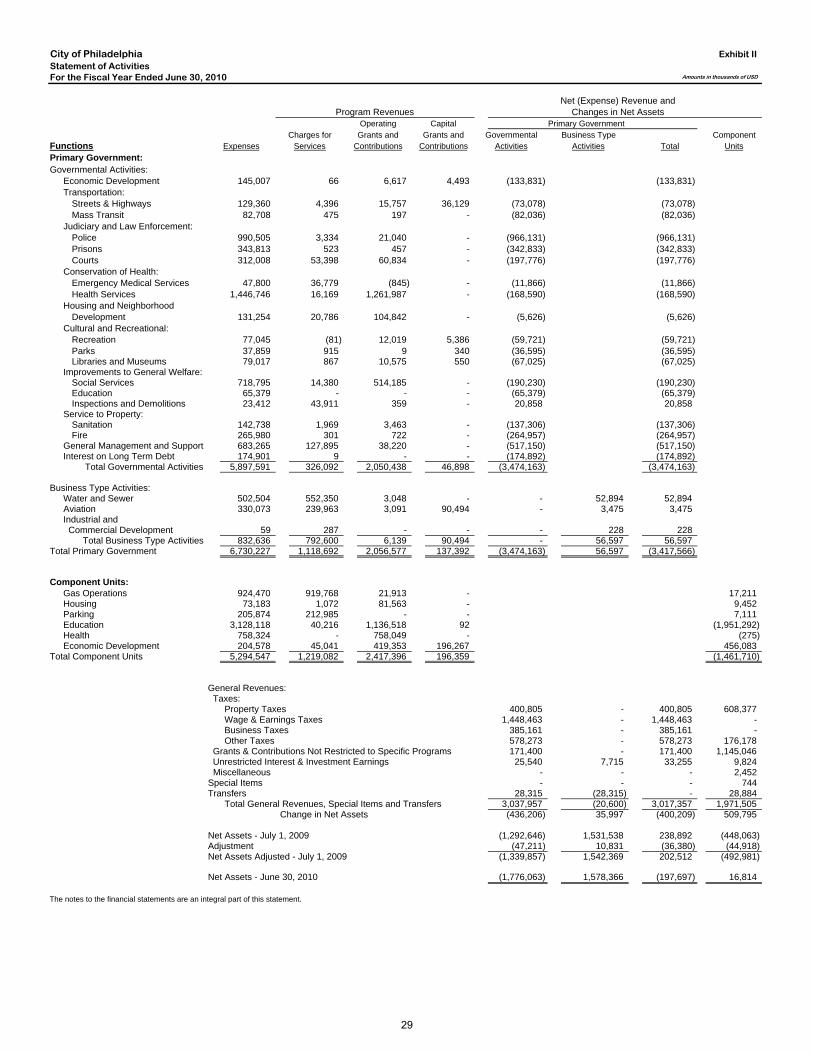
City of PhiladelphiaStatement of ActivitiesFor the Fiscal Year Ended June 30, 2010
Net (Expense) Revenue andProgram Revenues Changes in Net Assets
Operating Capital Primary GovernmentCharges for Grants and Grants and Governmental Business Type Component
Functions Expenses Services Contributions Contributions Activities Activities Total Units
Primary Government:Governmental Activities:
Economic Development 145,007 66 6,617 4,493 (133,831) (133,831) Transportation:
Streets & Highways 129,360 4,396 15,757 36,129 (73,078) (73,078) Mass Transit 82,708 475 197 - (82,036) (82,036)
Judiciary and Law Enforcement:Police 990,505 3,334 21,040 - (966,131) (966,131) Prisons 343,813 523 457 - (342,833) (342,833) Courts 312,008 53,398 60,834 - (197,776) (197,776)
Conservation of Health:Emergency Medical Services 47,800 36,779 (845) - (11,866) (11,866) Health Services 1,446,746 16,169 1,261,987 - (168,590) (168,590)
Housing and NeighborhoodDevelopment 131,254 20,786 104,842 - (5,626) (5,626)
Cultural and Recreational:Recreation 77,045 (81) 12,019 5,386 (59,721) (59,721) Parks 37,859 915 9 340 (36,595) (36,595) Libraries and Museums 79,017 867 10,575 550 (67,025) (67,025)
Improvements to General Welfare:Social Services 718,795 14,380 514,185 - (190,230) (190,230) Education 65,379 - - - (65,379) (65,379) Inspections and Demolitions 23,412 43,911 359 - 20,858 20,858
Service to Property:Sanitation 142,738 1,969 3,463 - (137,306) (137,306) Fire 265,980 301 722 - (264,957) (264,957)
General Management and Support 683,265 127,895 38,220 - (517,150) (517,150) Interest on Long Term Debt 174,901 9 - - (174,892) (174,892)
Total Governmental Activities 5,897,591 326,092 2,050,438 46,898 (3,474,163) (3,474,163)
Business Type Activities:Water and Sewer 502,504 552,350 3,048 - - 52,894 52,894 Aviation 330,073 239,963 3,091 90,494 - 3,475 3,475 Industrial and Commercial Development 59 287 - - - 228 228
Total Business Type Activities 832,636 792,600 6,139 90,494 - 56,597 56,597 Total Primary Government 6,730,227 1,118,692 2,056,577 137,392 (3,474,163) 56,597 (3,417,566)
Component Units:Gas Operations 924,470 919,768 21,913 - 17,211 Housing 73,183 1,072 81,563 - 9,452 Parking 205,874 212,985 - - 7,111 Education 3,128,118 40,216 1,136,518 92 (1,951,292)Health 758,324 - 758,049 - (275) Economic Development 204,578 45,041 419,353 196,267 456,083
Total Component Units 5,294,547 1,219,082 2,417,396 196,359 (1,461,710)
General Revenues: Taxes:
Property Taxes 400,805 - 400,805 608,377 Wage & Earnings Taxes 1,448,463 - 1,448,463 - Business Taxes 385,161 - 385,161 - Other Taxes 578,273 - 578,273 176,178
Grants & Contributions Not Restricted to Specific Programs 171,400 - 171,400 1,145,046 Unrestricted Interest & Investment Earnings 25,540 7,715 33,255 9,824 Miscellaneous - - - 2,452 Special Items - - - 744 Transfers 28,315 (28,315) - 28,884
Total General Revenues, Special Items and Transfers 3,037,957 (20,600) 3,017,357 1,971,505 Change in Net Assets (436,206) 35,997 (400,209) 509,795
Net Assets - July 1, 2009 (1,292,646) 1,531,538 238,892 (448,063) Adjustment (47,211) 10,831 (36,380) (44,918) Net Assets Adjusted - July 1, 2009 (1,339,857) 1,542,369 202,512 (492,981)
Net Assets - June 30, 2010 (1,776,063) 1,578,366 (197,697) 16,814
The notes to the financial statements are an integral part of this statement.
Exhibit II
Amounts in thousands of USD
29
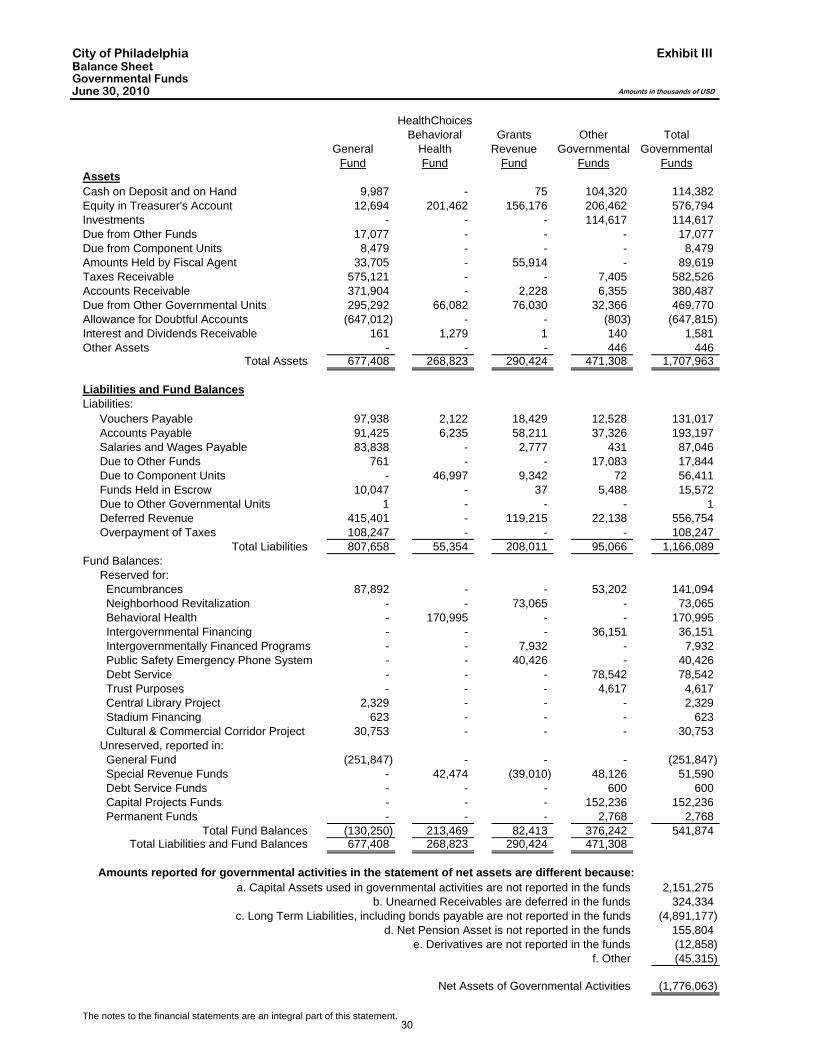
City of PhiladelphiaBalance SheetGovernmental FundsJune 30, 2010
HealthChoicesBehavioral Grants Other Total
General Health Revenue Governmental GovernmentalFund Fund Fund Funds Funds
AssetsCash on Deposit and on Hand 9,987 - 75 104,320 114,382 Equity in Treasurer's Account 12,694 201,462 156,176 206,462 576,794 Investments - - - 114,617 114,617 Due from Other Funds 17,077 - - - 17,077 Due from Component Units 8,479 - - - 8,479 Amounts Held by Fiscal Agent 33,705 - 55,914 - 89,619 Taxes Receivable 575,121 - - 7,405 582,526 Accounts Receivable 371,904 - 2,228 6,355 380,487 Due from Other Governmental Units 295,292 66,082 76,030 32,366 469,770 Allowance for Doubtful Accounts (647,012) - - (803) (647,815) Interest and Dividends Receivable 161 1,279 1 140 1,581 Other Assets - - - 446 446
Total Assets 677,408 268,823 290,424 471,308 1,707,963
Liabilities and Fund BalancesLiabilities:
Vouchers Payable 97,938 2,122 18,429 12,528 131,017 Accounts Payable 91,425 6,235 58,211 37,326 193,197 Salaries and Wages Payable 83,838 - 2,777 431 87,046 Due to Other Funds 761 - - 17,083 17,844 Due to Component Units - 46,997 9,342 72 56,411 Funds Held in Escrow 10,047 - 37 5,488 15,572 Due to Other Governmental Units 1 - - - 1 Deferred Revenue 415,401 - 119,215 22,138 556,754 Overpayment of Taxes 108,247 - - - 108,247
Total Liabilities 807,658 55,354 208,011 95,066 1,166,089 Fund Balances:
Reserved for: Encumbrances 87,892 - - 53,202 141,094 Neighborhood Revitalization - - 73,065 - 73,065 Behavioral Health - 170,995 - - 170,995 Intergovernmental Financing - - - 36,151 36,151 Intergovernmentally Financed Programs - - 7,932 - 7,932 Public Safety Emergency Phone System - - 40,426 - 40,426 Debt Service - - - 78,542 78,542 Trust Purposes - - - 4,617 4,617 Central Library Project 2,329 - - - 2,329 Stadium Financing 623 - - - 623 Cultural & Commercial Corridor Project 30,753 - - - 30,753 Unreserved, reported in: General Fund (251,847) - - - (251,847) Special Revenue Funds - 42,474 (39,010) 48,126 51,590 Debt Service Funds - - - 600 600 Capital Projects Funds - - - 152,236 152,236 Permanent Funds - - - 2,768 2,768
Total Fund Balances (130,250) 213,469 82,413 376,242 541,874 Total Liabilities and Fund Balances 677,408 268,823 290,424 471,308
Amounts reported for governmental activities in the statement of net assets are different because:2,151,275
324,334 (4,891,177)
155,804 (12,858)
f. Other (45,315)
(1,776,063)
The notes to the financial statements are an integral part of this statement.
Exhibit III
Amounts in thousands of USD
a. Capital Assets used in governmental activities are not reported in the fundsb. Unearned Receivables are deferred in the funds
Net Assets of Governmental Activities
c. Long Term Liabilities, including bonds payable are not reported in the fundsd. Net Pension Asset is not reported in the funds
e. Derivatives are not reported in the funds
30
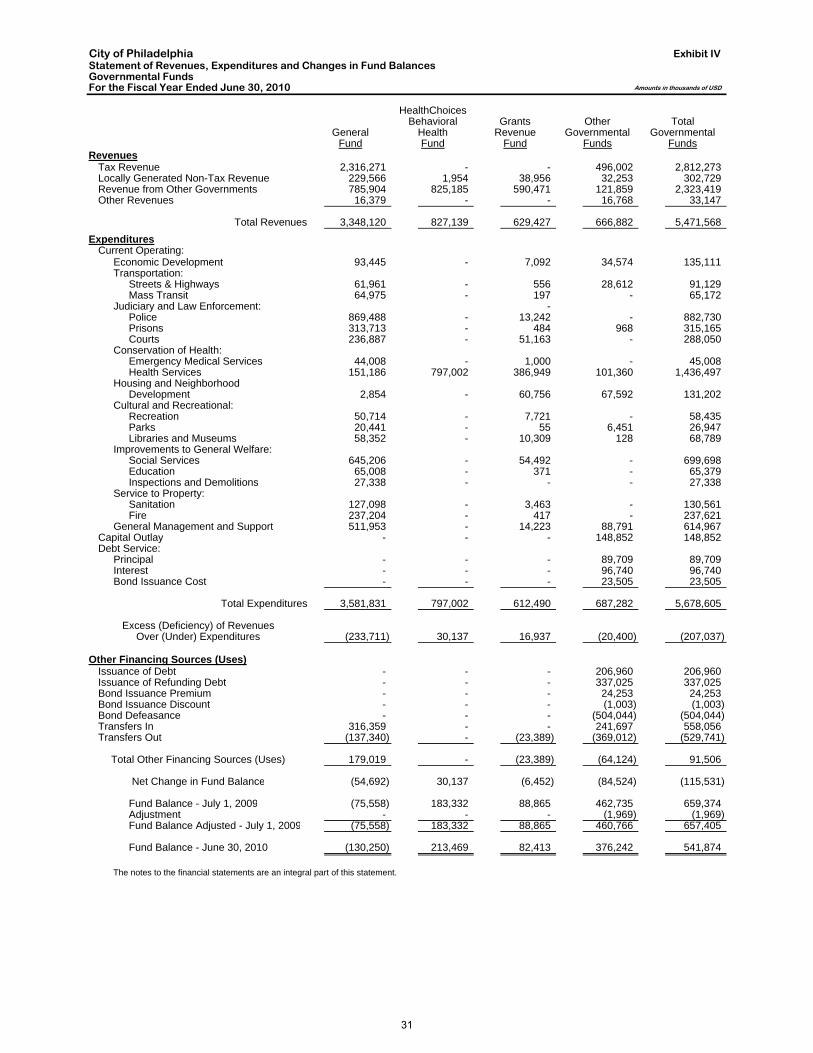
City of PhiladelphiaStatement of Revenues, Expenditures and Changes in Fund BalancesGovernmental FundsFor the Fiscal Year Ended June 30, 2010
HealthChoicesBehavioral Grants Other Total
General Health Revenue Governmental GovernmentalFund Fund Fund Funds Funds
RevenuesTax Revenue 2,316,271 - - 496,002 2,812,273Locally Generated Non-Tax Revenue 229,566 1,954 38,956 32,253 302,729 Revenue from Other Governments 785,904 825,185 590,471 121,859 2,323,419Other Revenues 16,379 - - 16,768 33,147
Total Revenues 3,348,120 827,139 629,427 666,882 5,471,568
ExpendituresCurrent Operating:
Economic Development 93,445 - 7,092 34,574 135,111 Transportation:
Streets & Highways 61,961 - 556 28,612 91,129 Mass Transit 64,975 - 197 - 65,172
Judiciary and Law Enforcement: - Police 869,488 - 13,242 - 882,730 Prisons 313,713 - 484 968 315,165 Courts 236,887 - 51,163 - 288,050
Conservation of Health:Emergency Medical Services 44,008 - 1,000 - 45,008 Health Services 151,186 797,002 386,949 101,360 1,436,497
Housing and NeighborhoodDevelopment 2,854 - 60,756 67,592 131,202
Cultural and Recreational:Recreation 50,714 - 7,721 - 58,435 Parks 20,441 - 55 6,451 26,947 Libraries and Museums 58,352 - 10,309 128 68,789
Improvements to General Welfare:Social Services 645,206 - 54,492 - 699,698 Education 65,008 - 371 - 65,379 Inspections and Demolitions 27,338 - - - 27,338
Service to Property:Sanitation 127,098 - 3,463 - 130,561 Fire 237,204 - 417 - 237,621
General Management and Support 511,953 - 14,223 88,791 614,967 Capital Outlay - - - 148,852 148,852 Debt Service:
Principal - - - 89,709 89,709 Interest - - - 96,740 96,740 Bond Issuance Cost - - - 23,505 23,505
Total Expenditures 3,581,831 797,002 612,490 687,282 5,678,605
Excess (Deficiency) of RevenuesOver (Under) Expenditures (233,711) 30,137 16,937 (20,400) (207,037)
Other Financing Sources (Uses)Issuance of Debt - - - 206,960 206,960 Issuance of Refunding Debt - - - 337,025 337,025 Bond Issuance Premium - - - 24,253 24,253 Bond Issuance Discount - - - (1,003) (1,003) Bond Defeasance - - - (504,044) (504,044) Transfers In 316,359 - - 241,697 558,056 Transfers Out (137,340) - (23,389) (369,012) (529,741)
Total Other Financing Sources (Uses) 179,019 - (23,389) (64,124) 91,506
Net Change in Fund Balance (54,692) 30,137 (6,452) (84,524) (115,531)
Fund Balance - July 1, 2009 (75,558) 183,332 88,865 462,735 659,374 Adjustment - - - (1,969) (1,969) Fund Balance Adjusted - July 1, 2009 (75,558) 183,332 88,865 460,766 657,405
Fund Balance - June 30, 2010 (130,250) 213,469 82,413 376,242 541,874
The notes to the financial statements are an integral part of this statement.
Exhibit IV
Amounts in thousands of USD
31
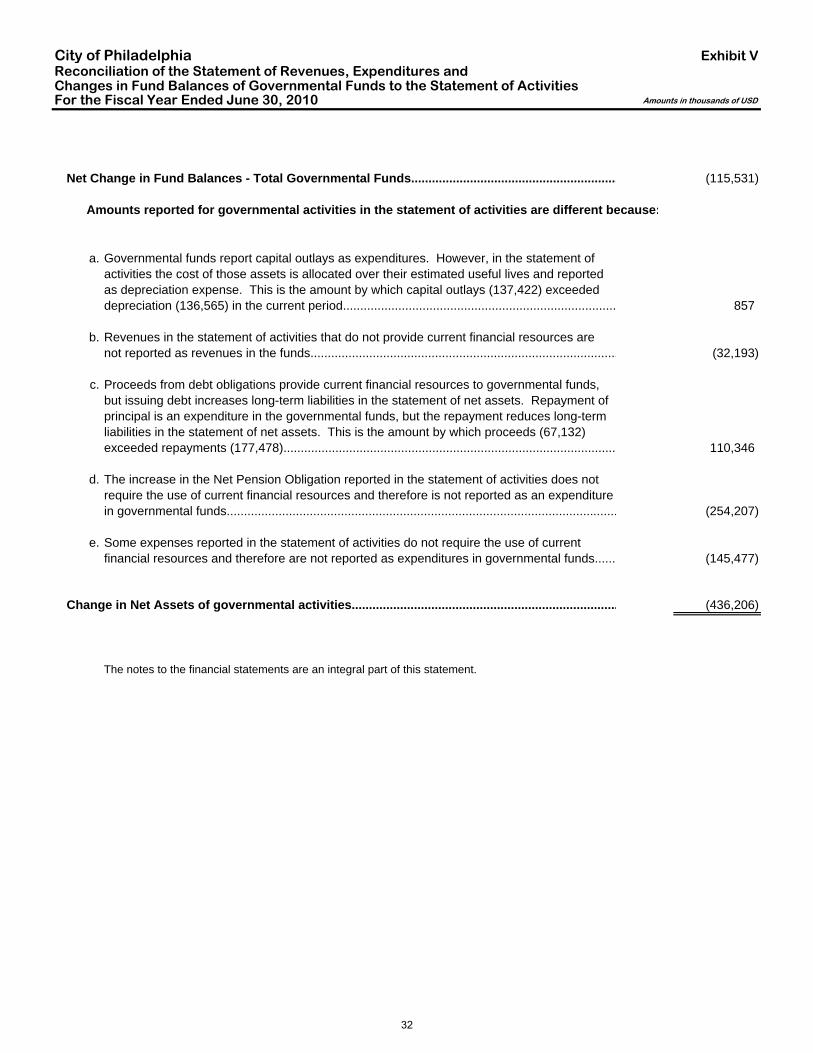
City of PhiladelphiaReconciliation of the Statement of Revenues, Expenditures andChanges in Fund Balances of Governmental Funds to the Statement of ActivitiesFor the Fiscal Year Ended June 30, 2010
Net Change in Fund Balances - Total Governmental Funds............................................................ (115,531)
Amounts reported for governmental activities in the statement of activities are different because:
a. Governmental funds report capital outlays as expenditures. However, in the statement ofactivities the cost of those assets is allocated over their estimated useful lives and reportedas depreciation expense. This is the amount by which capital outlays (137,422) exceededdepreciation (136,565) in the current period............................................................................... 857
b. Revenues in the statement of activities that do not provide current financial resources arenot reported as revenues in the funds......................................................................................... (32,193)
c. Proceeds from debt obligations provide current financial resources to governmental funds,but issuing debt increases long-term liabilities in the statement of net assets. Repayment ofprincipal is an expenditure in the governmental funds, but the repayment reduces long-termliabilities in the statement of net assets. This is the amount by which proceeds (67,132)exceeded repayments (177,478)................................................................................................ 110,346
d. The increase in the Net Pension Obligation reported in the statement of activities does notrequire the use of current financial resources and therefore is not reported as an expenditurein governmental funds................................................................................................................. (254,207)
e. Some expenses reported in the statement of activities do not require the use of currentfinancial resources and therefore are not reported as expenditures in governmental funds...... (145,477)
Change in Net Assets of governmental activities............................................................................. (436,206)
The notes to the financial statements are an integral part of this statement.
Exhibit V
Amounts in thousands of USD
32
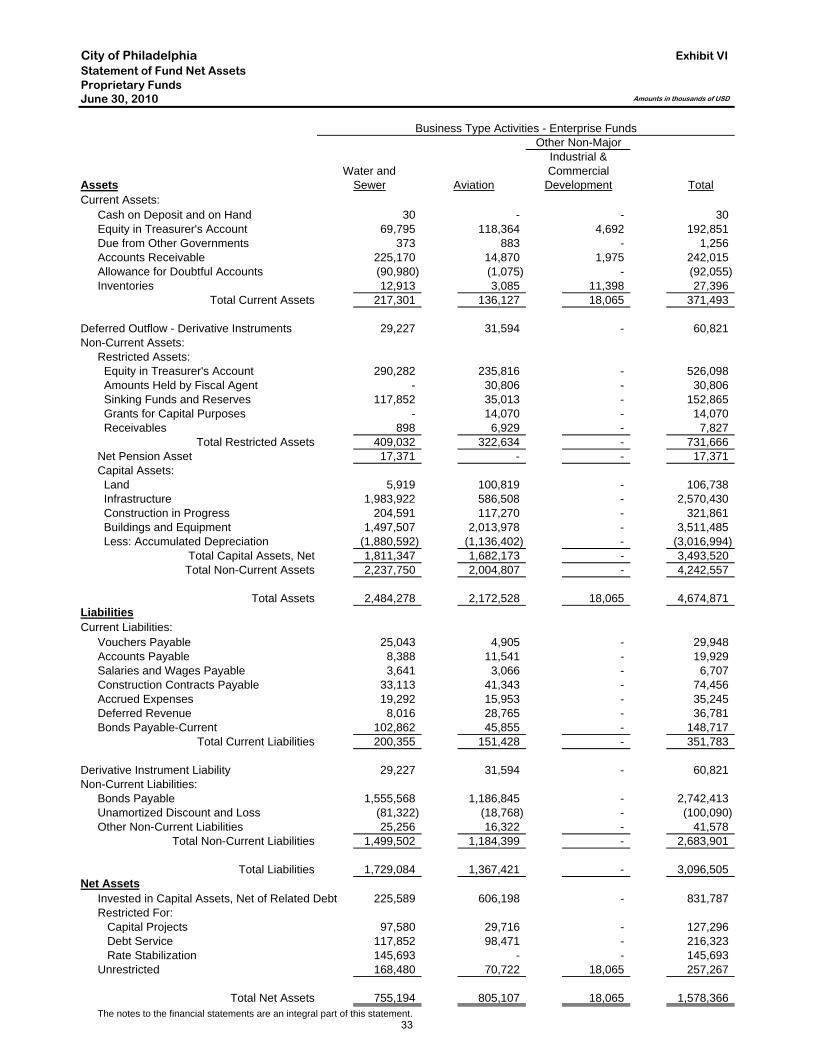
City of PhiladelphiaStatement of Fund Net AssetsProprietary FundsJune 30, 2010
Business Type Activities - Enterprise FundsOther Non-Major
Industrial &Water and Commercial
Assets Sewer Aviation Development TotalCurrent Assets:
Cash on Deposit and on Hand 30 - - 30 Equity in Treasurer's Account 69,795 118,364 4,692 192,851 Due from Other Governments 373 883 - 1,256 Accounts Receivable 225,170 14,870 1,975 242,015 Allowance for Doubtful Accounts (90,980) (1,075) - (92,055) Inventories 12,913 3,085 11,398 27,396
Total Current Assets 217,301 136,127 18,065 371,493
Deferred Outflow - Derivative Instruments 29,227 31,594 - 60,821 Non-Current Assets:
Restricted Assets: Equity in Treasurer's Account 290,282 235,816 - 526,098 Amounts Held by Fiscal Agent - 30,806 - 30,806 Sinking Funds and Reserves 117,852 35,013 - 152,865 Grants for Capital Purposes - 14,070 - 14,070 Receivables 898 6,929 - 7,827
Total Restricted Assets 409,032 322,634 - 731,666 Net Pension Asset 17,371 - - 17,371 Capital Assets: Land 5,919 100,819 - 106,738 Infrastructure 1,983,922 586,508 - 2,570,430 Construction in Progress 204,591 117,270 - 321,861 Buildings and Equipment 1,497,507 2,013,978 - 3,511,485 Less: Accumulated Depreciation (1,880,592) (1,136,402) - (3,016,994)
Total Capital Assets, Net 1,811,347 1,682,173 - 3,493,520 Total Non-Current Assets 2,237,750 2,004,807 - 4,242,557
Total Assets 2,484,278 2,172,528 18,065 4,674,871
LiabilitiesCurrent Liabilities:
Vouchers Payable 25,043 4,905 - 29,948 Accounts Payable 8,388 11,541 - 19,929 Salaries and Wages Payable 3,641 3,066 - 6,707 Construction Contracts Payable 33,113 41,343 - 74,456 Accrued Expenses 19,292 15,953 - 35,245 Deferred Revenue 8,016 28,765 - 36,781 Bonds Payable-Current 102,862 45,855 - 148,717
Total Current Liabilities 200,355 151,428 - 351,783
Derivative Instrument Liability 29,227 31,594 - 60,821 Non-Current Liabilities:
Bonds Payable 1,555,568 1,186,845 - 2,742,413 Unamortized Discount and Loss (81,322) (18,768) - (100,090) Other Non-Current Liabilities 25,256 16,322 - 41,578
Total Non-Current Liabilities 1,499,502 1,184,399 - 2,683,901
Total Liabilities 1,729,084 1,367,421 - 3,096,505 Net Assets
Invested in Capital Assets, Net of Related Debt 225,589 606,198 - 831,787 Restricted For: Capital Projects 97,580 29,716 - 127,296 Debt Service 117,852 98,471 - 216,323 Rate Stabilization 145,693 - - 145,693 Unrestricted 168,480 70,722 18,065 257,267
Total Net Assets 755,194 805,107 18,065 1,578,366 The notes to the financial statements are an integral part of this statement.
Exhibit VI
Amounts in thousands of USD
33
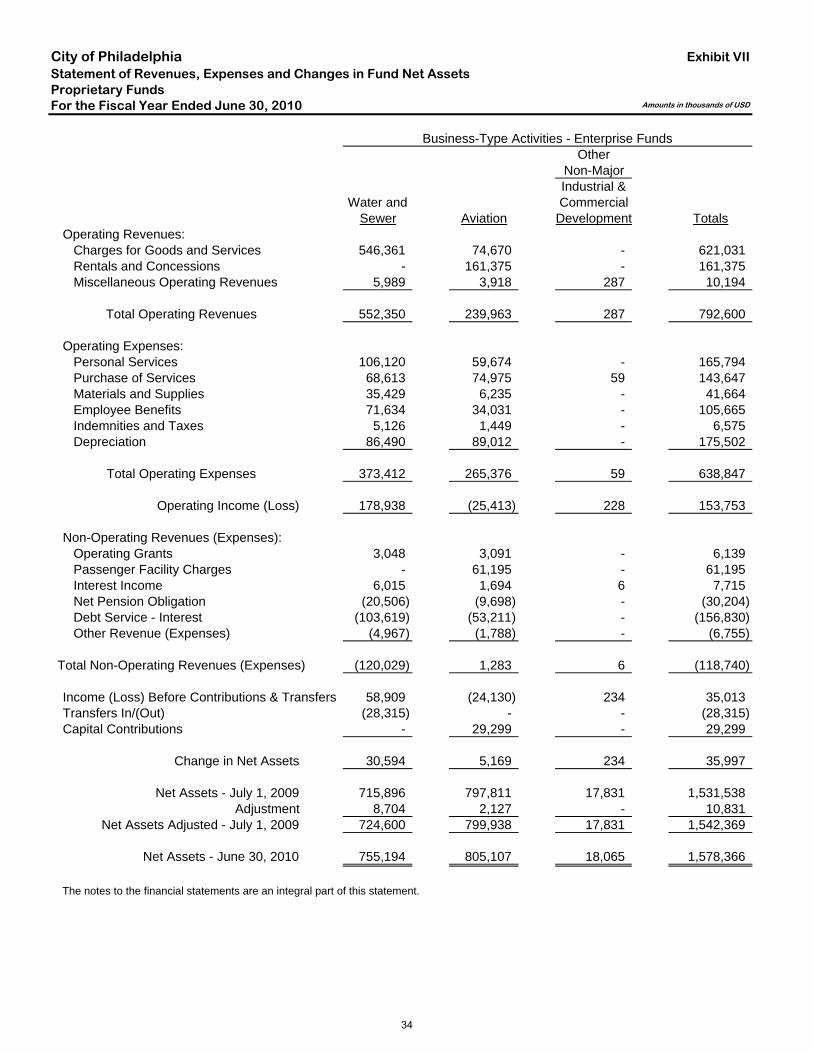
City of PhiladelphiaStatement of Revenues, Expenses and Changes in Fund Net AssetsProprietary FundsFor the Fiscal Year Ended June 30, 2010
Business-Type Activities - Enterprise FundsOther
Non-MajorIndustrial &
Water and CommercialSewer Aviation Development Totals
Operating Revenues: Charges for Goods and Services 546,361 74,670 - 621,031 Rentals and Concessions - 161,375 - 161,375 Miscellaneous Operating Revenues 5,989 3,918 287 10,194
Total Operating Revenues 552,350 239,963 287 792,600
Operating Expenses: Personal Services 106,120 59,674 - 165,794 Purchase of Services 68,613 74,975 59 143,647 Materials and Supplies 35,429 6,235 - 41,664 Employee Benefits 71,634 34,031 - 105,665 Indemnities and Taxes 5,126 1,449 - 6,575 Depreciation 86,490 89,012 - 175,502
Total Operating Expenses 373,412 265,376 59 638,847
Operating Income (Loss) 178,938 (25,413) 228 153,753
Non-Operating Revenues (Expenses): Operating Grants 3,048 3,091 - 6,139 Passenger Facility Charges - 61,195 - 61,195 Interest Income 6,015 1,694 6 7,715 Net Pension Obligation (20,506) (9,698) - (30,204) Debt Service - Interest (103,619) (53,211) - (156,830) Other Revenue (Expenses) (4,967) (1,788) - (6,755)
Total Non-Operating Revenues (Expenses) (120,029) 1,283 6 (118,740)
Income (Loss) Before Contributions & Transfers 58,909 (24,130) 234 35,013 Transfers In/(Out) (28,315) - - (28,315) Capital Contributions - 29,299 - 29,299
Change in Net Assets 30,594 5,169 234 35,997
Net Assets - July 1, 2009 715,896 797,811 17,831 1,531,538 Adjustment 8,704 2,127 - 10,831
Net Assets Adjusted - July 1, 2009 724,600 799,938 17,831 1,542,369
Net Assets - June 30, 2010 755,194 805,107 18,065 1,578,366
The notes to the financial statements are an integral part of this statement.
Exhibit VII
Amounts in thousands of USD
34
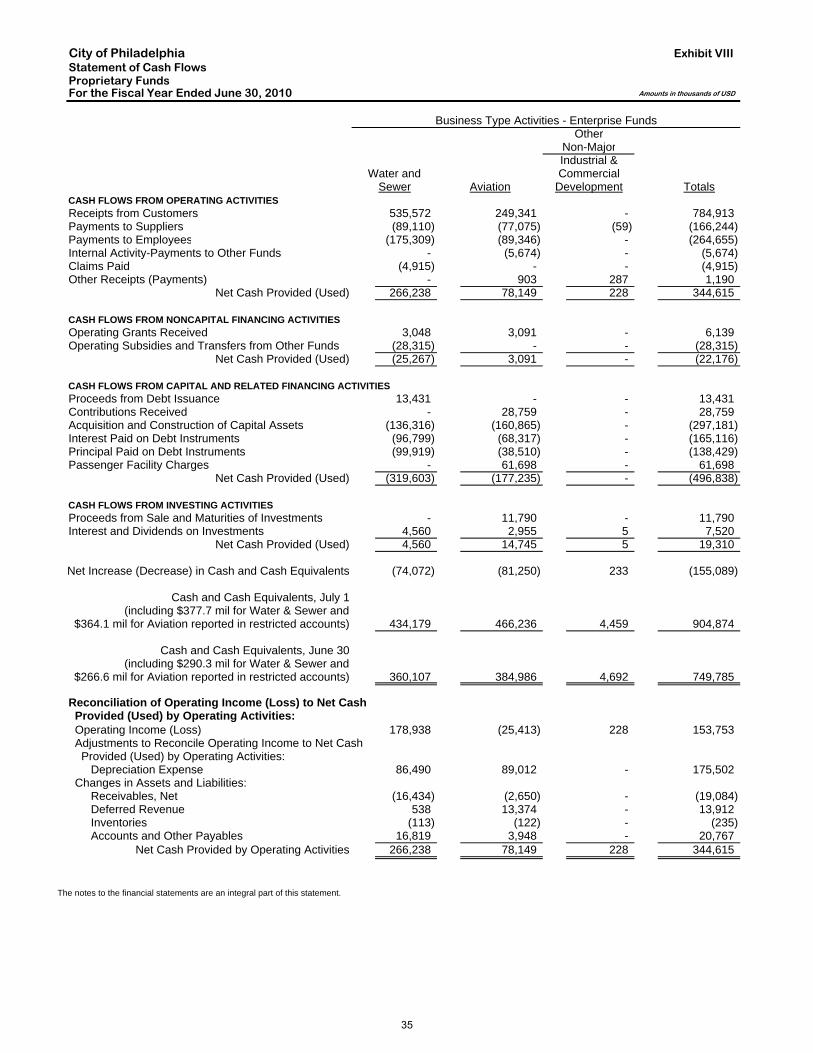
City of PhiladelphiaStatement of Cash FlowsProprietary FundsFor the Fiscal Year Ended June 30, 2010
Business Type Activities - Enterprise FundsOther
Non-MajorIndustrial &
Water and CommercialSewer Aviation Development Totals
CASH FLOWS FROM OPERATING ACTIVITIESReceipts from Customers 535,572 249,341 - 784,913 Payments to Suppliers (89,110) (77,075) (59) (166,244) Payments to Employees (175,309) (89,346) - (264,655) Internal Activity-Payments to Other Funds - (5,674) - (5,674) Claims Paid (4,915) - - (4,915) Other Receipts (Payments) - 903 287 1,190
Net Cash Provided (Used) 266,238 78,149 228 344,615
CASH FLOWS FROM NONCAPITAL FINANCING ACTIVITIESOperating Grants Received 3,048 3,091 - 6,139 Operating Subsidies and Transfers from Other Funds (28,315) - - (28,315)
Net Cash Provided (Used) (25,267) 3,091 - (22,176)
CASH FLOWS FROM CAPITAL AND RELATED FINANCING ACTIVITIESProceeds from Debt Issuance 13,431 - - 13,431 Contributions Received - 28,759 - 28,759 Acquisition and Construction of Capital Assets (136,316) (160,865) - (297,181) Interest Paid on Debt Instruments (96,799) (68,317) - (165,116) Principal Paid on Debt Instruments (99,919) (38,510) - (138,429) Passenger Facility Charges - 61,698 - 61,698
Net Cash Provided (Used) (319,603) (177,235) - (496,838)
CASH FLOWS FROM INVESTING ACTIVITIESProceeds from Sale and Maturities of Investments - 11,790 - 11,790 Interest and Dividends on Investments 4,560 2,955 5 7,520
Net Cash Provided (Used) 4,560 14,745 5 19,310
Net Increase (Decrease) in Cash and Cash Equivalents (74,072) (81,250) 233 (155,089)
Cash and Cash Equivalents, July 1(including $377.7 mil for Water & Sewer and
$364.1 mil for Aviation reported in restricted accounts) 434,179 466,236 4,459 904,874
Cash and Cash Equivalents, June 30(including $290.3 mil for Water & Sewer and
$266.6 mil for Aviation reported in restricted accounts) 360,107 384,986 4,692 749,785
Reconciliation of Operating Income (Loss) to Net Cash Provided (Used) by Operating Activities: Operating Income (Loss) 178,938 (25,413) 228 153,753 Adjustments to Reconcile Operating Income to Net Cash Provided (Used) by Operating Activities: Depreciation Expense 86,490 89,012 - 175,502 Changes in Assets and Liabilities: Receivables, Net (16,434) (2,650) - (19,084) Deferred Revenue 538 13,374 - 13,912 Inventories (113) (122) - (235) Accounts and Other Payables 16,819 3,948 - 20,767
Net Cash Provided by Operating Activities 266,238 78,149 228 344,615
The notes to the financial statements are an integral part of this statement.
Exhibit VIII
Amounts in thousands of USD
35
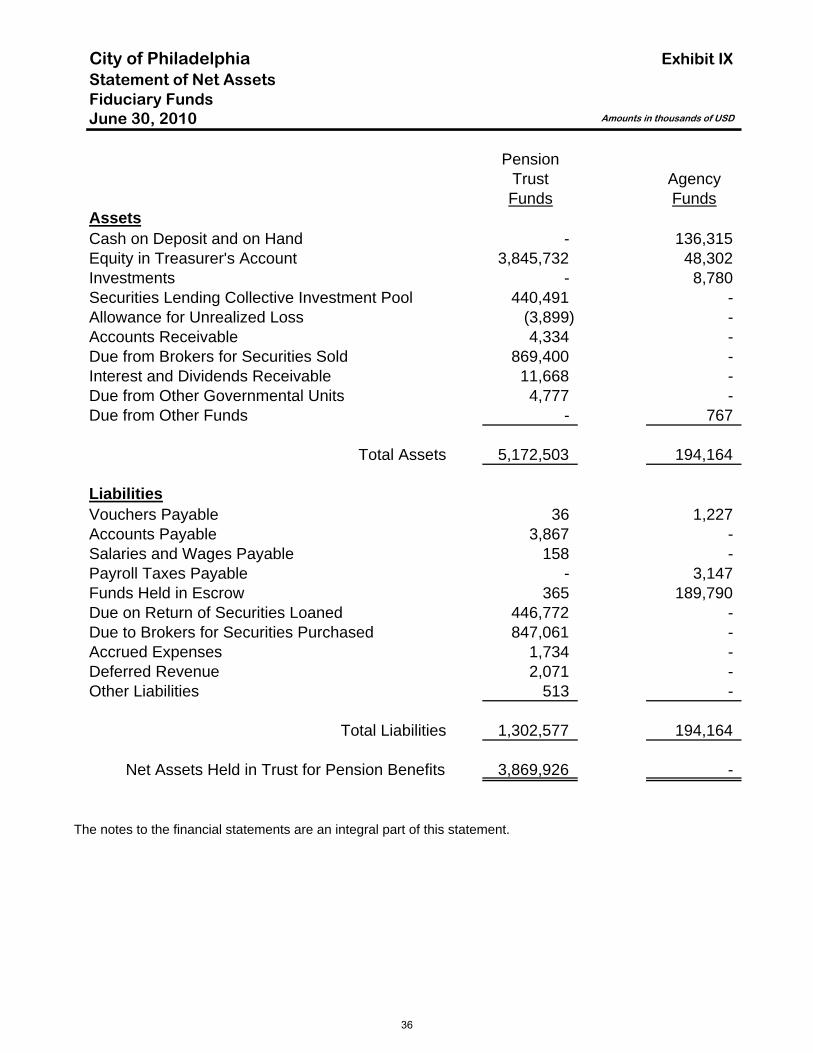
City of PhiladelphiaStatement of Net AssetsFiduciary FundsJune 30, 2010
PensionTrust AgencyFunds Funds
AssetsCash on Deposit and on Hand - 136,315 Equity in Treasurer's Account 3,845,732 48,302 Investments - 8,780 Securities Lending Collective Investment Pool 440,491 - Allowance for Unrealized Loss (3,899) - Accounts Receivable 4,334 - Due from Brokers for Securities Sold 869,400 - Interest and Dividends Receivable 11,668 - Due from Other Governmental Units 4,777 - Due from Other Funds - 767
Total Assets 5,172,503 194,164
LiabilitiesVouchers Payable 36 1,227 Accounts Payable 3,867 - Salaries and Wages Payable 158 - Payroll Taxes Payable - 3,147 Funds Held in Escrow 365 189,790 Due on Return of Securities Loaned 446,772 - Due to Brokers for Securities Purchased 847,061 - Accrued Expenses 1,734 - Deferred Revenue 2,071 - Other Liabilities 513 -
Total Liabilities 1,302,577 194,164
Net Assets Held in Trust for Pension Benefits 3,869,926 -
The notes to the financial statements are an integral part of this statement.
Exhibit IX
Amounts in thousands of USD
36
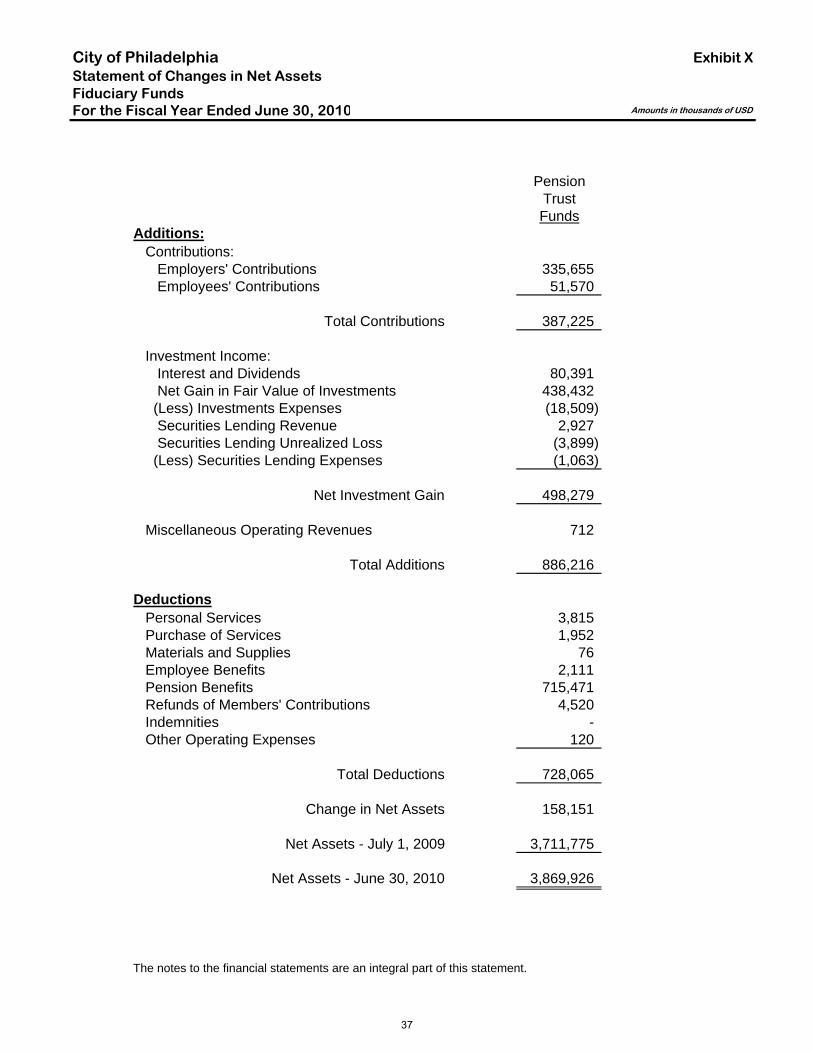
City of PhiladelphiaStatement of Changes in Net AssetsFiduciary FundsFor the Fiscal Year Ended June 30, 2010
PensionTrustFunds
Additions: Contributions: Employers' Contributions 335,655 Employees' Contributions 51,570
Total Contributions 387,225
Investment Income: Interest and Dividends 80,391 Net Gain in Fair Value of Investments 438,432 (Less) Investments Expenses (18,509) Securities Lending Revenue 2,927 Securities Lending Unrealized Loss (3,899) (Less) Securities Lending Expenses (1,063)
Net Investment Gain 498,279
Miscellaneous Operating Revenues 712
Total Additions 886,216
Deductions Personal Services 3,815 Purchase of Services 1,952 Materials and Supplies 76 Employee Benefits 2,111 Pension Benefits 715,471 Refunds of Members' Contributions 4,520 Indemnities - Other Operating Expenses 120
Total Deductions 728,065
Change in Net Assets 158,151
Net Assets - July 1, 2009 3,711,775
Net Assets - June 30, 2010 3,869,926
The notes to the financial statements are an integral part of this statement.
Exhibit X
Amounts in thousands of USD
37
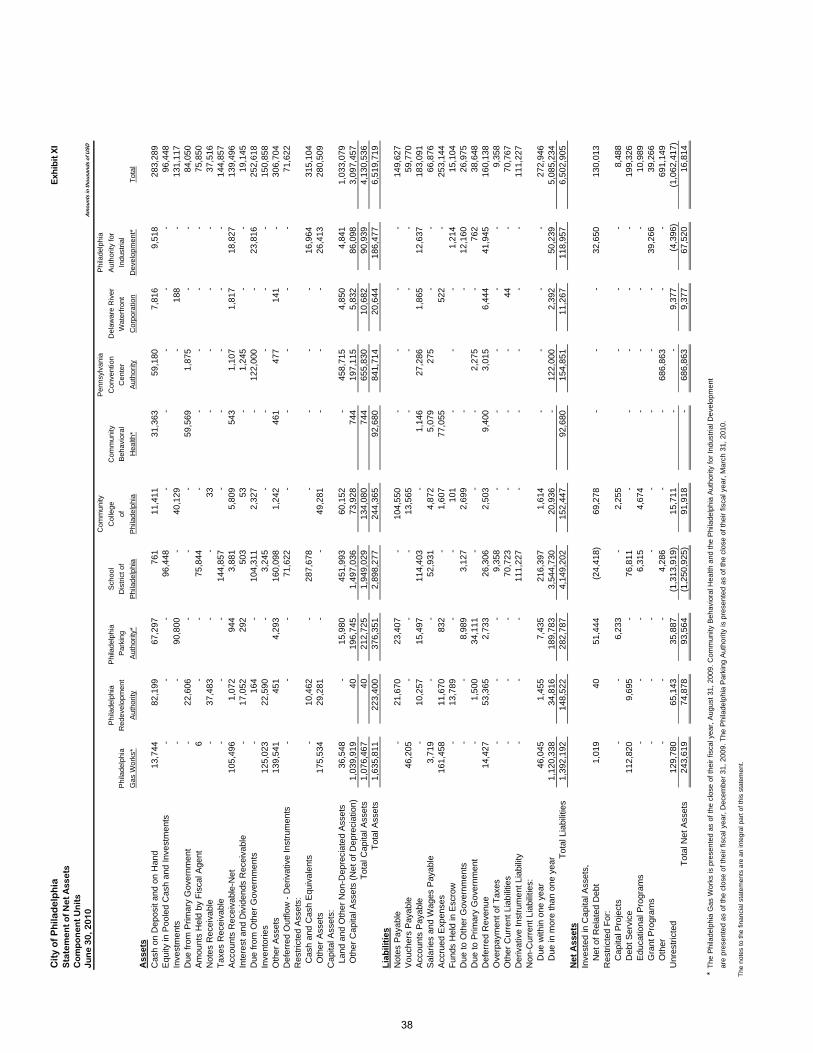
Cit
y o
f P
hila
de
lph
iaS
tate
me
nt
of
Ne
t A
sse
tsC
om
po
ne
nt
Un
its
Jun
e 3
0, 2
01
0C
omm
unity
Pen
nsyl
vani
aP
hila
delp
hia
Phi
lade
lphi
aP
hila
delp
hia
Sch
ool
Col
lege
Com
mun
ityC
onve
ntio
nD
elaw
are
Riv
erA
utho
rity
for
Phi
lade
lphi
aR
edev
elop
men
tP
arki
ngD
istr
ict o
fof
Beh
avio
ral
Cen
ter
Wat
erfr
ont
Indu
stria
l
Gas
Wor
ks*
Aut
horit
yA
utho
rity*
Phi
lade
lphi
aP
hila
delp
hia
Hea
lth*
Aut
horit
yC
orpo
ratio
nD
evel
opm
ent*
Tot
al
Ass
ets
Cas
h on
Dep
osit
and
on H
and
13,7
44
82,1
99
67
,297
761
11
,411
31,3
63
59,1
80
7,
816
9,
518
28
3,28
9
E
quity
in P
oole
d C
ash
and
Inve
stm
ents
-
-
-
96
,448
-
-
-
-
-
96,4
48
Inve
stm
ents
-
-
90,8
00
-
40
,129
-
18
8
-
131,
117
Due
from
Prim
ary
Gov
ernm
ent
-
22
,606
-
-
-
59,5
69
1,87
5
-
-
84,0
50
Am
ount
s H
eld
by F
isca
l Age
nt6
-
-
75,8
44
-
-
-
-
-
75
,850
N
otes
Rec
eiva
ble
-
37
,483
-
-
33
-
-
-
-
37
,516
T
axes
Rec
eiva
ble
-
-
-
14
4,85
7
-
-
-
-
-
144,
857
Acc
ount
s R
ecei
vabl
e-N
et10
5,49
6
1,
072
94
4
3,
881
5,80
9
543
1,10
7
1,81
7
18,8
27
13
9,49
6
In
tere
st a
nd D
ivid
ends
Rec
eiva
ble
-
17
,052
292
503
53
-
1,24
5
-
-
19,1
45
Due
from
Oth
er G
over
nmen
ts-
164
-
10
4,31
1
2,
327
-
122,
000
-
23
,816
252,
618
Inve
ntor
ies
125,
023
22,5
90
-
3,24
5
-
-
-
-
-
150,
858
Oth
er A
sset
s13
9,54
1
45
1
4,
293
16
0,09
8
1,
242
46
1
47
7
14
1
-
306,
704
Def
erre
d O
utflo
w -
Der
ivat
ive
Inst
rum
ents
-
-
-
71
,622
-
-
-
-
-
71,6
22
Res
tric
ted
Ass
ets:
Cas
h an
d C
ash
Equ
ival
ents
-
10
,462
-
28
7,67
8
-
-
-
-
16
,964
315,
104
Oth
er A
sset
s17
5,53
4
29
,281
-
-
49
,281
-
-
-
26
,413
280,
509
Cap
ital A
sset
s: L
and
and
Oth
er N
on-D
epre
ciat
ed A
sset
s36
,548
-
15,9
80
45
1,99
3
60
,152
-
45
8,71
5
4,
850
4,
841
1,
033,
079
O
ther
Cap
ital A
sset
s (N
et o
f Dep
reci
atio
n)1,
039,
919
40
19
6,74
5
1,
497,
036
73
,928
744
197,
115
5,83
2
86,0
98
3,
097,
457
T
otal
Cap
ital A
sset
s1,
076,
467
40
21
2,72
5
1,
949,
029
13
4,08
0
74
4
65
5,83
0
10
,682
90,9
39
4,
130,
536
T
otal
Ass
ets
1,63
5,81
1
223,
400
376,
351
2,89
8,27
7
244,
365
92,6
80
841,
714
20,6
44
18
6,47
7
6,
519,
719
Li
abili
ties
Not
es P
ayab
le-
21,6
70
23
,407
-
104,
550
-
-
-
-
149,
627
Vou
cher
s P
ayab
le46
,205
-
-
-
13
,565
-
-
-
-
59,7
70
Acc
ount
s P
ayab
le-
10,2
57
15
,497
114,
403
-
1,
146
27
,286
1,86
5
12,6
37
18
3,09
1
S
alar
ies
and
Wag
es P
ayab
le3,
719
-
-
52
,931
4,
872
5,
079
27
5
-
-
66
,876
A
ccru
ed E
xpen
ses
161,
458
11,6
70
83
2
-
1,
607
77
,055
52
2
-
253,
144
Fun
ds H
eld
in E
scro
w-
13,7
89
-
-
101
-
-
-
1,
214
15
,104
D
ue to
Oth
er G
over
nmen
ts-
-
8,
989
3,
127
2,69
9
-
-
12,1
60
26
,975
D
ue to
Prim
ary
Gov
ernm
ent
-
1,
500
34
,111
-
-
-
2,27
5
-
76
2
38
,648
D
efer
red
Rev
enue
14,4
27
53,3
65
2,
733
26
,306
2,
503
9,
400
3,
015
6,
444
41
,945
160,
138
Ove
rpay
men
t of T
axes
-
-
-
9,
358
-
-
-
-
-
9,
358
Oth
er C
urre
nt L
iabi
litie
s-
-
-
70,7
23
-
-
-
44
-
70,7
67
Der
ivat
ive
Inst
rum
ent L
iabi
lity
-
-
-
11
1,22
7
-
-
-
-
-
111,
227
Non
-Cur
rent
Lia
bilit
ies:
D
ue w
ithin
one
yea
r46
,045
1,
455
7,
435
21
6,39
7
1,
614
-
-
-
-
27
2,94
6
Due
in m
ore
than
one
yea
r1,
120,
338
34
,816
189,
783
3,54
4,73
0
20,9
36
-
122,
000
2,39
2
50,2
39
5,
085,
234
T
otal
Lia
bilit
ies
1,39
2,19
2
148,
522
282,
787
4,14
9,20
2
152,
447
92,6
80
154,
851
11,2
67
11
8,95
7
6,
502,
905
N
et A
sset
sIn
vest
ed in
Cap
ital A
sset
s,
Net
of R
elat
ed D
ebt
1,01
9
40
51,4
44
(2
4,41
8)
69,2
78
-
-
-
32,6
50
13
0,01
3
R
estr
icte
d F
or:
C
apita
l Pro
ject
s-
-
6,
233
-
2,
255
-
-
-
8,48
8
Deb
t Ser
vice
112,
820
9,69
5
-
76
,811
-
-
-
-
-
199,
326
E
duca
tiona
l Pro
gram
s-
-
-
6,31
5
4,
674
-
-
-
-
10
,989
Gra
nt P
rogr
ams
-
-
-
-
-
-
-
-
39
,266
39,2
66
O
ther
-
-
-
4,
286
-
-
686,
863
-
-
691,
149
Unr
estr
icte
d12
9,78
0
65
,143
35,8
87
(1
,313
,919
)
15,7
11
-
-
9,
377
(4
,396
)
(1,0
62,4
17)
T
otal
Net
Ass
ets
243,
619
74,8
78
93
,564
(1,2
50,9
25)
91
,918
-
68
6,86
3
9,
377
67
,520
16,8
14
*T
he P
hila
delp
hia
Gas
Wor
ks is
pre
sent
ed a
s of
the
clos
e of
thei
r fis
cal y
ear,
Aug
ust 3
1, 2
009.
Com
mun
ity B
ehav
iora
l Hea
lth a
nd t
he P
hila
delp
hia
Aut
horit
y fo
r In
dust
rial D
evel
opm
ent
are
pres
ente
d as
of t
he c
lose
of t
heir
fisca
l yea
r, D
ecem
ber
31, 2
009.
The
Phi
lade
lphi
a P
arki
ng A
utho
rity
is p
rese
nted
as
of th
e cl
ose
of th
eir
fisca
l yea
r, M
arch
31,
201
0.
The
not
es to
the
finan
cial
sta
tem
ents
are
an
inte
gral
par
t of t
his
stat
emen
t.
Exh
ibit
XI
Am
ount
s in
thou
sand
s of
US
D
38
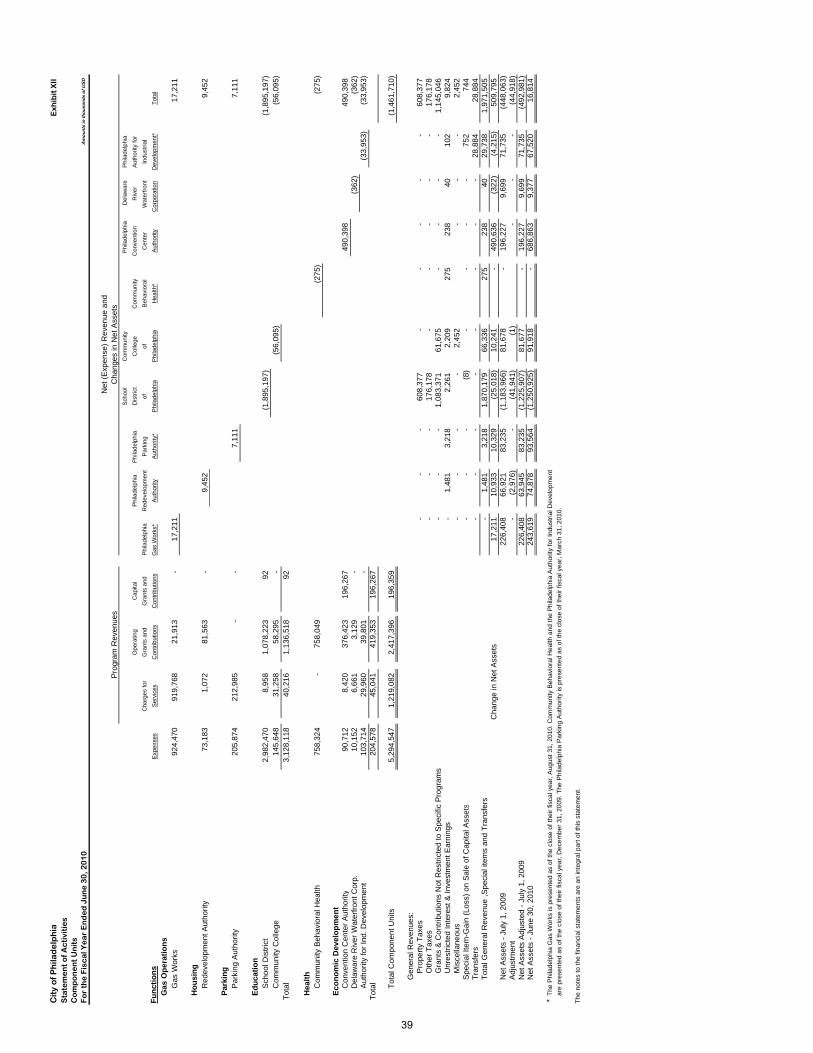
Cit
y o
f P
hila
de
lph
iaS
tate
me
nt
of
Ac
tivi
tie
sC
om
po
ne
nt
Un
its
Fo
r th
e F
isc
al Y
ea
r E
nd
ed
Ju
ne
30
, 20
10
Net
(E
xpen
se)
Rev
enue
and
Pro
gram
Rev
enue
sC
hang
es in
Net
Ass
ets
Sch
ool
Com
mun
ityP
hila
delp
hia
Del
awar
eP
hila
delp
hia
Ope
ratin
gC
apita
lP
hila
delp
hia
Phi
lade
lphi
a D
istr
ict
Col
lege
Com
mun
ityC
onve
ntio
n
Riv
erA
utho
rity
for
Cha
rges
for
Gra
nts
and
Gra
nts
and
Phi
lade
lphi
aR
edev
elop
men
tP
arki
ngof
ofB
ehav
iora
lC
ente
r
Wat
erfr
ont
Indu
stria
l
Func
tions
Exp
ense
sS
ervi
ces
Con
trib
utio
nsC
ontr
ibut
ions
Gas
Wor
ks*
Aut
horit
yA
utho
rity*
Phi
lade
lphi
aP
hila
delp
hia
Hea
lth*
Aut
horit
yC
orpo
ratio
nD
evel
opm
ent*
Tot
al
Gas
Ope
ratio
nsG
as W
orks
924,
470
919,
768
21
,913
-
17,2
11
17
,211
Hou
sing
Red
evel
opm
ent A
utho
rity
73,1
83
1,07
2
81
,563
-
9,45
2
9,
452
Park
ing
Par
king
Aut
horit
y20
5,87
4
21
2,98
5
-
-
7,11
1
7,
111
Educ
atio
nS
choo
l Dis
tric
t2,
982,
470
8,
958
1,07
8,22
3
92
(1,8
95,1
97)
(1
,895
,197
)
Com
mun
ity C
olle
ge14
5,64
8
31
,258
58
,295
-
(56,
095)
(5
6,09
5)
Tot
al3,
128,
118
40
,216
1,
136,
518
92
Hea
lthC
omm
unity
Beh
avio
ral H
ealth
758,
324
-
758,
049
(275
)
(275
)
Econ
omic
Dev
elop
men
tC
onve
ntio
n C
ente
r A
utho
rity
90,7
12
8,42
0
376,
423
19
6,26
7
490,
398
490,
398
Del
awar
e R
iver
Wat
erfr
ont C
orp.
10,1
52
6,66
1
3,12
9
-
(362
)
(3
62)
Aut
horit
y fo
r In
d. D
evel
opm
ent
103,
714
29,9
60
39
,801
-
(33,
953)
(33,
953)
Tot
al20
4,57
8
45
,041
419,
353
19
6,26
7
Tot
al C
ompo
nent
Uni
t s5,
294,
547
1,
219,
082
2,
417,
396
196,
359
(1
,461
,710
)
Gen
eral
Rev
enue
s:
Pro
pert
y T
axes
-
-
-
60
8,37
7
-
-
-
-
-
60
8,37
7
Oth
er T
axes
-
-
-
17
6,17
8
-
-
-
-
-
17
6,17
8
Gra
nts
& C
ontr
ibut
ions
Not
Res
tric
ted
to S
peci
fic P
rogr
ams
-
-
-
1,
083,
371
61,6
75
-
-
-
-
1,14
5,04
6
U
nres
tric
ted
Inte
rest
& In
vest
men
t Ear
ning
s-
1,
481
3,
218
2,
261
2,
209
27
5
238
40
102
9,82
4
M
isce
llane
ous
-
-
-
-
2,45
2
-
-
-
2,
452
S
peci
al It
em-G
ain
(Los
s) o
n S
ale
of C
apita
l Ass
ets
-
-
-
(8
)
-
-
-
-
752
744
Tra
nsfe
rs-
-
-
-
-
-
-
-
28
,884
28
,884
Tot
al G
ener
al R
even
ue ,S
peci
al it
ems
and
Tra
nsfe
rs-
1,
481
3,
218
1,
870,
179
66,3
36
275
23
8
40
29
,738
1,
971,
505
C
hang
e in
Net
Ass
ets
17,2
11
10,9
33
10,3
29
(25,
018)
10
,241
-
490,
636
(322
)
(4
,215
)
509,
795
Net
Ass
ets
- Ju
ly 1
, 200
922
6,40
8
66,9
21
83,2
35
(1,1
83,9
66)
81
,678
-
196,
227
9,69
9
71,7
35
(448
,063
)
Adj
ustm
ent
-
(2,9
76)
-
(4
1,94
1)
(1)
-
-
-
(44,
918)
Net
Ass
ets
Adj
uste
d -
July
1, 2
009
226,
408
63
,945
83
,235
(1
,225
,907
)
81,6
77
-
19
6,22
79,
699
71
,735
(4
92,9
81)
N
et A
sset
s -
June
30,
201
024
3,61
9
74,8
78
93,5
64
(1,2
50,9
25)
91
,918
-
686,
863
9,37
7
67,5
20
16,8
14
*T
he P
hila
delp
hia
Gas
Wor
ks is
pre
sent
ed a
s of
the
clos
e of
thei
r fis
cal y
ear,
Aug
ust 3
1, 2
010.
Com
mun
ity B
ehav
iora
l Hea
lth a
nd t
he P
hila
delp
hia
Aut
horit
y fo
r In
dust
rial D
evel
opm
ent
are
pres
ente
d as
of t
he c
lose
of t
heir
fisca
l yea
r, D
ecem
ber
31, 2
009.
The
Phi
lade
lphi
a P
arki
ng A
utho
rity
is p
rese
nted
as
of th
e cl
ose
of th
eir
fisca
l yea
r, M
arch
31,
201
0.
The
not
es to
the
finan
cial
sta
tem
ents
are
an
inte
gral
par
t of t
his
stat
emen
t.
Exh
ibit
XII
Am
ount
s in
thou
sand
s of
US
D
39

40
City of Philadelphia P E N N S Y L V A N I A
Notes to the Financial Statements FYE 06/30/2010
Table of Contents
I. SUMMARY OF SIGNIFICANT ACCOUNTING POLICIES........................................................ 42
1. Reporting Entity ........................................................................................................................ 42 2. Government Wide and Fund Financial Statements ................................................................. 44 3. Basis of Accounting, Measurement Focus and Financial Statements ..................................... 44 4. Deposits and Investments ........................................................................................................ 46 5. Inventories ................................................................................................................................ 46 6. Capital Assets........................................................................................................................... 46 7. Bonds and Related Premiums, Discounts and Issuance Costs ............................................... 47 8. Insurance.................................................................................................................................. 47 9. Receivables and Payables ....................................................................................................... 47 10. Deferred Revenues .................................................................................................................. 48 11. Compensated Absences .......................................................................................................... 48 12. Claims and Judgements ........................................................................................................... 48 II. LEGAL COMPLIANCE............................................................................................................... 48
1. Budgetary Information .............................................................................................................. 48 III. DETAILED NOTES ON ALL FUNDS AND ACCOUNTS........................................................... 49
1. Deposits and Investments ........................................................................................................ 49 2. Securities Lending .................................................................................................................... 54 3. Amounts Held by Fiscal Agent ................................................................................................. 55 4. Interfund Receivables and Payables........................................................................................ 55 5. Capital Asset Activity ................................................................................................................ 56 6. Notes Payable .......................................................................................................................... 59 7. Debt Payable ............................................................................................................................ 61 8. Lease Commitments and Leased Assets................................................................................. 84 9. Deferred Compensation Plans ................................................................................................. 87 10. Fund Balance Reservations ..................................................................................................... 87 11. Interfund Transactions.............................................................................................................. 88 12. Reconciliation of Government-Wide and Fund Financial Statements...................................... 88 13. Prior Period Adjustments.......................................................................................................... 89 14. Net Assets Restricted by Enabling Legislation......................................................................... 89 15. Fund Deficits............................................................................................................................. 90 16. Advance Service Charge.......................................................................................................... 90 IV. OTHER INFORMATION ............................................................................................................ 90
1. Pension Plans........................................................................................................................... 90 2. Accumulated Unpaid Sick Leave..............................................................................................103 3. Other Post Employment Benefits (OPEB)................................................................................104 4. Pennsylvania Intergovernmental Cooperation Authority ..........................................................111 5. Related Party Transactions ......................................................................................................111 6. Risk Management.....................................................................................................................112 7. Commitments ...........................................................................................................................113 8. Contingencies...........................................................................................................................113 9. Subsequent Events ..................................................................................................................119
41

City of Philadelphia Notes to the Financial Statements For the Fiscal Year Ended June 30, 2010 Exhibit XIII
42
I. SUMMARY OF SIGNIFICANT ACCOUNTING POLICIES
The financial statements of the City of Philadelphia have been prepared in conformity with generally accepted ac-counting principles (GAAP) as applied to governmental units. The Governmental Accounting Standards Board (GASB) is the accepted standard setting body for establishing governmental accounting and financial reporting prin-ciples. The more significant of the City's accounting policies are described below.
1. REPORTING ENTITY
The City of Philadelphia was founded in 1682 and was merged with the county in 1854. Since 1951 the City has been governed largely under the Philadelphia Home Rule Charter. However, in some matters, including the issu-ance of short-term and long-term debt, the City is governed by the laws of the Commonwealth of Pennsylvania. As required by GAAP, the financial statements of the City of Philadelphia include those of the primary govern-ment and its component units. The component units discussed below are included in the City's reporting entity because of the significance of their operational or financial relationships with the City. The financial statements of these component units have been included in the City's reporting entity either as blended component units or as discretely presented component units. Based on the criteria established by Governmental Accounting Standards Board Statement (GASBS) #14 as amended by GASBS #39, certain other organizations also did meet the crite-ria for inclusion, however they are not included in the City’s financial statements because they are not significant to a fair representation of the City’s reporting entity. Individual financial statements can be obtained directly from their administrative offices by writing to the addresses provided. As used both on the face of the financial statements and in the footnotes, the term “Primary Government” in-cludes both City funds and Blended Component Units while the term “Component Units” includes only Discretely Presented Component Units.
A. BLENDED COMPONENT UNITS
Pennsylvania Intergovernmental Cooperation Authority (PICA) – 1500 Walnut St., Philadelphia, PA 19102 PICA was established by act of the Commonwealth of Pennsylvania to provide financial assistance to cities of the first class and is governed by a five member board appointed by the Commonwealth. Currently, the City of Philadelphia is the only city of the first class. The activities of PICA are reflected in two of the gov-ernmental fund types (Special Revenue and Debt Service). Philadelphia Municipal Authority (PMA) – 1515 Arch St., Philadelphia, PA 19102 PMA is governed by a five member board appointed by the City and was established to issue tax exempt bonds for the acquisition and use of certain equipment and facilities for the City. The activities of PMA are reflected in three of the governmental fund types (Special Revenue, Debt Service and Capital Improvement).
B. DISCRETELY PRESENTED COMPONENT UNITS
The component unit columns in the applicable combined financial statements include the combined financial data for the organizations discussed below. They are reported in a separate column to emphasize that they are legally separate from the City. However, in order to retain their identity, applicable combining statements have been included as part of this report.
Community College of Philadelphia (CCP) – 1700 Spring Garden St., Philadelphia, PA 19130 CCP was established by the City to provide two year post-secondary education programs for its residents. It is governed by a Board appointed by the City, receives substantial subsidies from the City, and its budgets must be submitted to the City for review and approval. Delaware River Waterfront Corp. (DRWC) – 121 N. Columbus Blvd., Philadelphia, PA 19106 The 16 member board, is headed by the Mayors’ Deputy Director for Economic Development and Planning, and is comprised of appointed City officials and private sector experts in design, finance, and real estate de-velopment. The group will focus on the development of the seven-mile stretch of water front property be-tween Allegheny and Oregon Avenues.
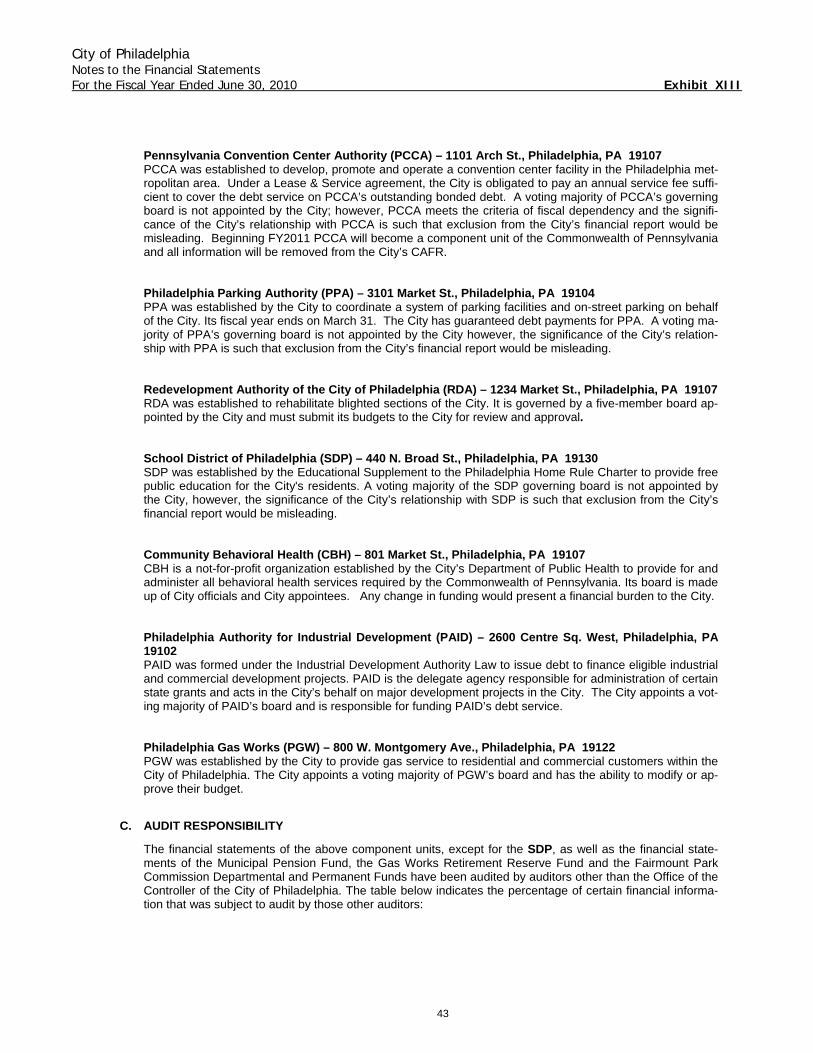
City of Philadelphia Notes to the Financial Statements For the Fiscal Year Ended June 30, 2010 Exhibit XIII
43
Pennsylvania Convention Center Authority (PCCA) – 1101 Arch St., Philadelphia, PA 19107 PCCA was established to develop, promote and operate a convention center facility in the Philadelphia met-ropolitan area. Under a Lease & Service agreement, the City is obligated to pay an annual service fee suffi-cient to cover the debt service on PCCA’s outstanding bonded debt. A voting majority of PCCA’s governing board is not appointed by the City; however, PCCA meets the criteria of fiscal dependency and the signifi-cance of the City’s relationship with PCCA is such that exclusion from the City’s financial report would be misleading. Beginning FY2011 PCCA will become a component unit of the Commonwealth of Pennsylvania and all information will be removed from the City’s CAFR. Philadelphia Parking Authority (PPA) – 3101 Market St., Philadelphia, PA 19104 PPA was established by the City to coordinate a system of parking facilities and on-street parking on behalf of the City. Its fiscal year ends on March 31. The City has guaranteed debt payments for PPA. A voting ma-jority of PPA’s governing board is not appointed by the City however, the significance of the City’s relation-ship with PPA is such that exclusion from the City’s financial report would be misleading. Redevelopment Authority of the City of Philadelphia (RDA) – 1234 Market St., Philadelphia, PA 19107 RDA was established to rehabilitate blighted sections of the City. It is governed by a five-member board ap-pointed by the City and must submit its budgets to the City for review and approval. School District of Philadelphia (SDP) – 440 N. Broad St., Philadelphia, PA 19130 SDP was established by the Educational Supplement to the Philadelphia Home Rule Charter to provide free public education for the City's residents. A voting majority of the SDP governing board is not appointed by the City, however, the significance of the City’s relationship with SDP is such that exclusion from the City’s financial report would be misleading. Community Behavioral Health (CBH) – 801 Market St., Philadelphia, PA 19107 CBH is a not-for-profit organization established by the City’s Department of Public Health to provide for and administer all behavioral health services required by the Commonwealth of Pennsylvania. Its board is made up of City officials and City appointees. Any change in funding would present a financial burden to the City. Philadelphia Authority for Industrial Development (PAID) – 2600 Centre Sq. West, Philadelphia, PA 19102 PAID was formed under the Industrial Development Authority Law to issue debt to finance eligible industrial and commercial development projects. PAID is the delegate agency responsible for administration of certain state grants and acts in the City’s behalf on major development projects in the City. The City appoints a vot-ing majority of PAID’s board and is responsible for funding PAID’s debt service. Philadelphia Gas Works (PGW) – 800 W. Montgomery Ave., Philadelphia, PA 19122 PGW was established by the City to provide gas service to residential and commercial customers within the City of Philadelphia. The City appoints a voting majority of PGW’s board and has the ability to modify or ap-prove their budget.
C. AUDIT RESPONSIBILITY
The financial statements of the above component units, except for the SDP, as well as the financial state-ments of the Municipal Pension Fund, the Gas Works Retirement Reserve Fund and the Fairmount Park Commission Departmental and Permanent Funds have been audited by auditors other than the Office of the Controller of the City of Philadelphia. The table below indicates the percentage of certain financial informa-tion that was subject to audit by those other auditors:
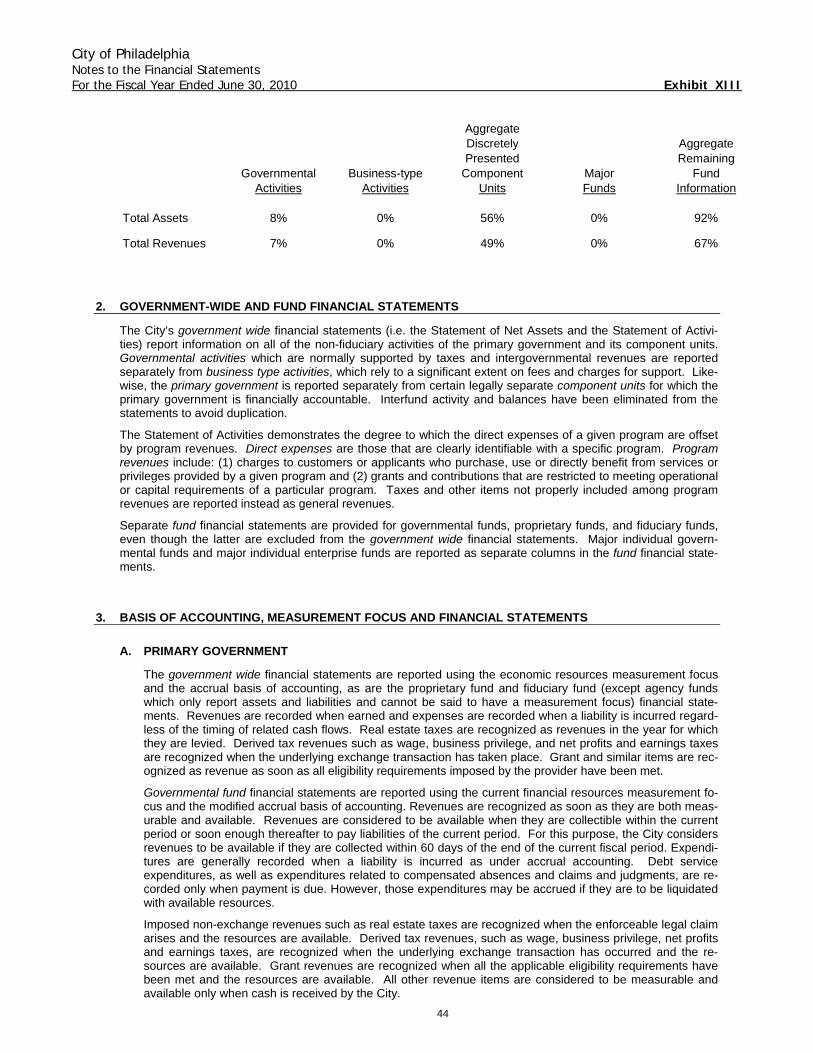
City of Philadelphia Notes to the Financial Statements For the Fiscal Year Ended June 30, 2010 Exhibit XIII
44
AggregateDiscretely AggregatePresented Remaining
Governmental Business-type Component Major FundActivities Activities Units Funds Information
Total Assets 8% 0% 56% 0% 92%
Total Revenues 7% 0% 49% 0% 67%
2. GOVERNMENT-WIDE AND FUND FINANCIAL STATEMENTS
The City’s government wide financial statements (i.e. the Statement of Net Assets and the Statement of Activi-ties) report information on all of the non-fiduciary activities of the primary government and its component units. Governmental activities which are normally supported by taxes and intergovernmental revenues are reported separately from business type activities, which rely to a significant extent on fees and charges for support. Like-wise, the primary government is reported separately from certain legally separate component units for which the primary government is financially accountable. Interfund activity and balances have been eliminated from the statements to avoid duplication.
The Statement of Activities demonstrates the degree to which the direct expenses of a given program are offset by program revenues. Direct expenses are those that are clearly identifiable with a specific program. Program revenues include: (1) charges to customers or applicants who purchase, use or directly benefit from services or privileges provided by a given program and (2) grants and contributions that are restricted to meeting operational or capital requirements of a particular program. Taxes and other items not properly included among program revenues are reported instead as general revenues.
Separate fund financial statements are provided for governmental funds, proprietary funds, and fiduciary funds, even though the latter are excluded from the government wide financial statements. Major individual govern-mental funds and major individual enterprise funds are reported as separate columns in the fund financial state-ments.
3. BASIS OF ACCOUNTING, MEASUREMENT FOCUS AND FINANCIAL STATEMENTS
A. PRIMARY GOVERNMENT
The government wide financial statements are reported using the economic resources measurement focus and the accrual basis of accounting, as are the proprietary fund and fiduciary fund (except agency funds which only report assets and liabilities and cannot be said to have a measurement focus) financial state-ments. Revenues are recorded when earned and expenses are recorded when a liability is incurred regard-less of the timing of related cash flows. Real estate taxes are recognized as revenues in the year for which they are levied. Derived tax revenues such as wage, business privilege, and net profits and earnings taxes are recognized when the underlying exchange transaction has taken place. Grant and similar items are rec-ognized as revenue as soon as all eligibility requirements imposed by the provider have been met.
Governmental fund financial statements are reported using the current financial resources measurement fo-cus and the modified accrual basis of accounting. Revenues are recognized as soon as they are both meas-urable and available. Revenues are considered to be available when they are collectible within the current period or soon enough thereafter to pay liabilities of the current period. For this purpose, the City considers revenues to be available if they are collected within 60 days of the end of the current fiscal period. Expendi-tures are generally recorded when a liability is incurred as under accrual accounting. Debt service expenditures, as well as expenditures related to compensated absences and claims and judgments, are re-corded only when payment is due. However, those expenditures may be accrued if they are to be liquidated with available resources.
Imposed non-exchange revenues such as real estate taxes are recognized when the enforceable legal claim arises and the resources are available. Derived tax revenues, such as wage, business privilege, net profits and earnings taxes, are recognized when the underlying exchange transaction has occurred and the re-sources are available. Grant revenues are recognized when all the applicable eligibility requirements have been met and the resources are available. All other revenue items are considered to be measurable and available only when cash is received by the City.
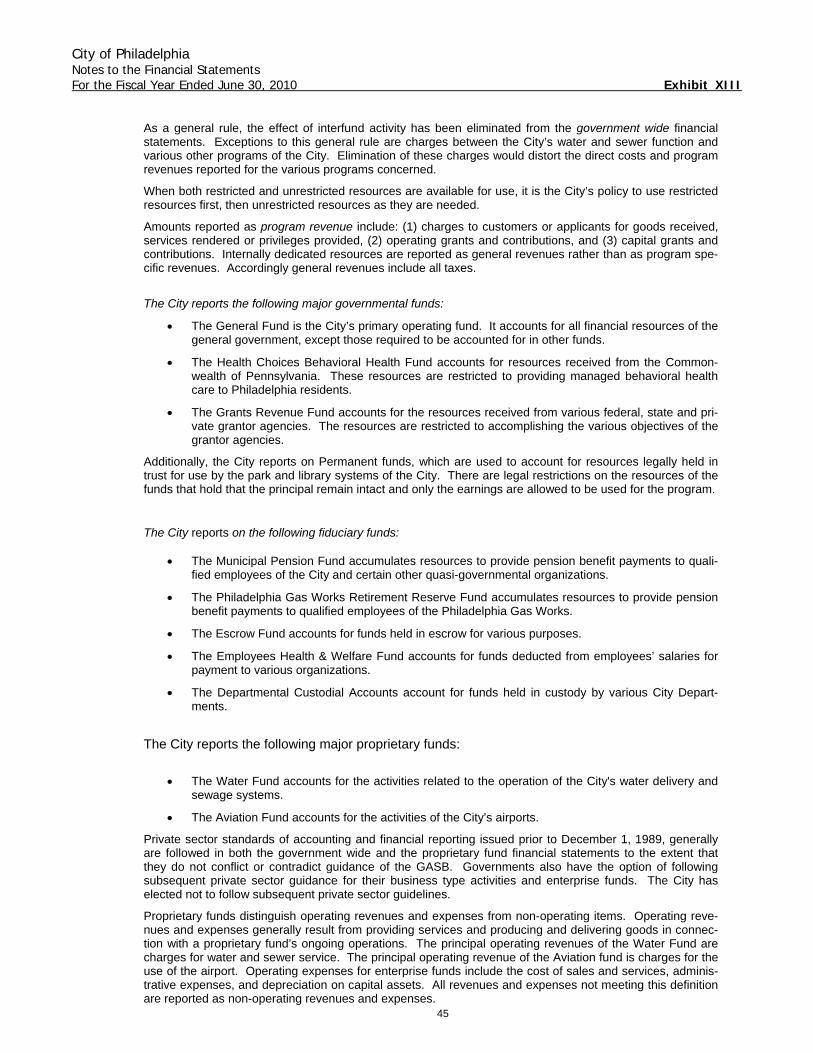
City of Philadelphia Notes to the Financial Statements For the Fiscal Year Ended June 30, 2010 Exhibit XIII
45
As a general rule, the effect of interfund activity has been eliminated from the government wide financial statements. Exceptions to this general rule are charges between the City’s water and sewer function and various other programs of the City. Elimination of these charges would distort the direct costs and program revenues reported for the various programs concerned.
When both restricted and unrestricted resources are available for use, it is the City’s policy to use restricted resources first, then unrestricted resources as they are needed.
Amounts reported as program revenue include: (1) charges to customers or applicants for goods received, services rendered or privileges provided, (2) operating grants and contributions, and (3) capital grants and contributions. Internally dedicated resources are reported as general revenues rather than as program spe-cific revenues. Accordingly general revenues include all taxes.
The City reports the following major governmental funds:
• The General Fund is the City’s primary operating fund. It accounts for all financial resources of the general government, except those required to be accounted for in other funds.
• The Health Choices Behavioral Health Fund accounts for resources received from the Common-wealth of Pennsylvania. These resources are restricted to providing managed behavioral health care to Philadelphia residents.
• The Grants Revenue Fund accounts for the resources received from various federal, state and pri-vate grantor agencies. The resources are restricted to accomplishing the various objectives of the grantor agencies.
Additionally, the City reports on Permanent funds, which are used to account for resources legally held in trust for use by the park and library systems of the City. There are legal restrictions on the resources of the funds that hold that the principal remain intact and only the earnings are allowed to be used for the program.
The City reports on the following fiduciary funds:
• The Municipal Pension Fund accumulates resources to provide pension benefit payments to quali-fied employees of the City and certain other quasi-governmental organizations.
• The Philadelphia Gas Works Retirement Reserve Fund accumulates resources to provide pension benefit payments to qualified employees of the Philadelphia Gas Works.
• The Escrow Fund accounts for funds held in escrow for various purposes.
• The Employees Health & Welfare Fund accounts for funds deducted from employees’ salaries for payment to various organizations.
• The Departmental Custodial Accounts account for funds held in custody by various City Depart-ments.
The City reports the following major proprietary funds:
• The Water Fund accounts for the activities related to the operation of the City's water delivery and
sewage systems.
• The Aviation Fund accounts for the activities of the City’s airports.
Private sector standards of accounting and financial reporting issued prior to December 1, 1989, generally are followed in both the government wide and the proprietary fund financial statements to the extent that they do not conflict or contradict guidance of the GASB. Governments also have the option of following subsequent private sector guidance for their business type activities and enterprise funds. The City has elected not to follow subsequent private sector guidelines.
Proprietary funds distinguish operating revenues and expenses from non-operating items. Operating reve-nues and expenses generally result from providing services and producing and delivering goods in connec-tion with a proprietary fund’s ongoing operations. The principal operating revenues of the Water Fund are charges for water and sewer service. The principal operating revenue of the Aviation fund is charges for the use of the airport. Operating expenses for enterprise funds include the cost of sales and services, adminis-trative expenses, and depreciation on capital assets. All revenues and expenses not meeting this definition are reported as non-operating revenues and expenses.
City of Philadelphia Notes to the Financial Statements For the Fiscal Year Ended June 30, 2010 Exhibit XIII
46
B. COMPONENT UNITS
The SDP prepares their financial statements in a manner similar to the City and utilizes the full range of governmental and proprietary fund types.
The financial statements of the Community College of Philadelphia have been prepared in accordance with GASBS #35 - Basic Financial Statements - and Management’s Discussion and Analysis - For Public Col-leges and Universities. The remaining component units prepare their financial statements in a manner simi-lar to that of proprietary funds.
4. DEPOSITS AND INVESTMENTS
The City utilizes a pooled Cash and Investments Account to provide efficient management of the cash of most City funds. In addition, separate cash accounts are maintained by various funds due to either legal requirements or operational needs. For Proprietary and Permanent Funds, all highly liquid investments (except for Repurchase Agreements) with a maturity of three months or less when purchased are considered to be cash equivalents.
The City reports investments at fair value. Short-term investments are reported at cost which approximates fair value. Securities traded on national or international exchanges are valued at the last reported sales price. The fair value of real estate investments is based on independent appraisals. Investments which do not have an es-tablished market are reported at estimated fair value.
Statutes authorize the City to invest in obligations of the Treasury, agencies, and instruments of the United States, repurchase agreements, collateralized certificates of deposit, bank acceptance or mortgage obligations, certain corporate bonds, and money market funds. The Pension Trust Fund is also authorized to invest in corpo-rate bonds rated AA or better by Moody's Bond Ratings, common stocks and real estate.
From February to early June, deposits of the City significantly exceeded the amounts reported at year end. This was due to cyclical tax collections (billings for taxes are mailed in January and payable in March).
5. INVENTORIES
A. PRIMARY GOVERNMENT
Supplies of governmental funds are recorded as expenditures when purchased rather than capitalized as in-ventory. Accordingly, inventories for governmental funds are shown on the Statement of Net Assets but not on the Governmental Funds Balance Sheet. Inventories of proprietary funds are valued at moving average cost except for the following:
Industrial and Commercial Development Fund inventory represents real estate held for resale and is valued at cost.
B. COMPONENT UNITS
All inventories are valued at moving average cost except for the following:
PGW inventory consists primarily of fuel stock and gases which are stated at average cost.
The SDP Food Services Fund inventories include food donated by the Federal Government which was valued at government cost or estimated value. All other food or supply inventories were valued at last unit cost and will be expensed when used.
RDA inventory represents real estate held for resale and is recorded based on the estimated appraisal of values and cost basis of land inventories acquired.
6. CAPITAL ASSETS
A. PRIMARY GOVERNMENT
Capital Assets, which include property, plant, equipment and infrastructure assets (e.g. bridges, curbs and gutters, streets and sidewalks and lighting systems), are reported in the applicable governmental or busi-ness-type activities columns in the government wide financial statements. Capital assets are defined by the City as assets with an initial individual cost of more than $5,000 and an estimated useful life in excess of three years. Capital assets are recorded at cost. Costs recorded do not include interest incurred as a result
City of Philadelphia Notes to the Financial Statements For the Fiscal Year Ended June 30, 2010 Exhibit XIII
47
of financing asset acquisition or construction. Assets acquired by gift or bequest are recorded at their fair market value at the date of gift. Upon sale or retirement, the cost of the assets and the related accumulated depreciation, if any, are removed from the accounts. Maintenance and repair costs are charged to opera-tions.
The City transfers Construction In Process to one or more of the major asset classes: (1) when project ex-penditures are equal to or have exceeded 90% of the estimated cost on new facilities (except for the Avia-tion Fund which uses 80% as the determining percentage), (2) when the expenditures are for existing facili-ties or (3) when they relate to specific identifiable items completed during the year which were part of a lar-ger project.
Cost of construction for proprietary fund capital assets includes all direct contract costs plus overhead costs. Overhead costs include direct and indirect engineering costs and interest incurred during the construction period for projects financed with bond proceeds. Interest is capitalized on proprietary fund assets acquired with tax-exempt debt. The amount of interest to be capitalized is calculated by offsetting interest expense in-curred from the date of the borrowing until completion of the project with interest on invested proceeds over the same period.
Depreciation on the capital assets for all City funds is provided on the straight-line method over their esti-mated useful lives: buildings - 20 to 50 years; equipment and storage facilities - 3 to 25 years; and transmis-sion and distribution lines - 50 years.
Collections of art and historical treasures meet the definition of a capital asset and normally should be re-ported in the financial statements. However, the requirement for capitalization is waived for collections that meet certain criteria. The City has collections of art, historical treasures and statuary that are not capitalized as they meet all of the waiver requirements which are: (1) the collections are held solely for public exhibition, (2) the collections are protected, preserved and cared for and (3) should any items be sold, the proceeds are used only to acquire other items for the collections. Among the City’s collections are historical artifacts at the Ryers Museum & Library, Loudoun Mansion, Fort Mifflin, Atwater Kent Museum and the Betsy Ross House. The city also has sculptures, paintings, murals and other works of art on display on public property and buildings throughout the City.
B. COMPONENT UNITS
Depreciation on the capital assets for component units is provided on the straight-line method over their es-timated useful lives: buildings - 15 to 50 years; equipment and storage facilities - 3 to 25 years; and trans-mission and distribution lines - 50 years.
7. BONDS AND RELATED PREMIUMS, DISCOUNTS & ISSUANCE COSTS
In the government-wide financial statements and in the proprietary fund statements, bond premiums and dis-counts are deferred and amortized over the life of the bonds using the effective interest method. Bonds payable are reported net of the applicable bond premium or discount. Bond issuance costs are reported as deferred charges and amortized over the life of the related debt.
In governmental fund financial statements, bond premiums, discounts and issuance costs are recognized in the current period. The face amount of the debt is reported as other financing sources. Premiums received on debt issuance are reported as other financing sources while discounts are reported as other financing uses. Issuance costs are reported as debt issuance expenditures.
8. INSURANCE
The City, except for the Airport and certain other properties, is self-insured for most fire and casualty losses to its structures and equipment and provides statutory worker's compensation, unemployment benefits, and health and welfare to its employees through a self-insured plan.
9. RECEIVABLE AND PAYABLES
Activities between funds that are representative of lending/borrowing arrangements outstanding at the end of the fiscal year are referred to as due to/from other funds. Any residual balances outstanding between the governmental activities and business-type activities are reported in the governmental-wide financial statements as “internal balances”.
City of Philadelphia Notes to the Financial Statements For the Fiscal Year Ended June 30, 2010 Exhibit XIII
48
All trade and property receivables in the governmental wide financial statements are shown net of allowance for un-collectibles. The real estate tax receivable allowance is equal to 39.7% of outstanding real estate taxes at June 30. Property taxes are levied on a calendar year basis. The City's property taxes, levied on assessed valuation as of January 1, are due and payable on or before March 31. Taxes levied are intended to finance the fiscal year in which they become due. Current real estate rates are $8.264 on each $100 assessment; $4.959 for the SDP and $3.305 for the City. Delinquent charges are assessed at 1.5% per month on all unpaid bal-ances as of April 1. Real estate tax delinquents are subject to lien as of the following January 1. The City has established real estate improvement programs that abate, for limited periods, tax increases that result from higher assessments for improved properties. Certain incremental tax assessments are earmarked to repay loans from the City to developers who improve properties under Tax Increment Financing agreements.
10. DEFERRED REVENUES
A. PRIMARY GOVERNMENT
Deferred revenues as reported in the fund financial statements represent receivables which will be collected and included in revenues of future fiscal years or funds received in advance of being earned. In the General Fund, deferred revenues relate to property tax levies and self-assessed taxes receivable which are not available to pay liabilities of the current period and grants receivable for which the eligibility criteria has been met, but the resources are not available. Also included are business-privilege taxes which were received in advance of being earned. The deferred revenue in the Special Revenue and Capital Improvement Funds is primarily related to grants receivable and funds received in advance of being earned. In the Water and Avia-tion Funds, deferred revenues relate to overpayments from water/sewer customers and airlines, respec-tively.
B. COMPONENT UNITS
Deferred revenue of the RDA generally represents cash received in advance from various sources to fund appropriate program expenditures. These advances are subject to various terms, including the obligation to return any unexpended funds upon completion or termination of the related project. Recognition of grants as revenues is deferred until funds have been expended or awarded as grants or loans.
Community College of Philadelphia student tuition and fees received prior to June 30 which are applicable to the Summer II and Fall terms have been deferred and will be included in revenue in the subsequent year.
11. COMPENSATED ABSENCES
It is the City’s policy to allow employees to accumulate earned but unused vacation benefits. Vacation pay is ac-crued when earned in the government-wide financial statements and in the proprietary and fiduciary-fund finan-cial statements. Sick leave balances are not accrued in the financial statements because sick leave rights are non-vesting.
12. CLAIMS AND JUDGMENTS
Pending claims and judgments are recorded as expenses in the government wide financial statements and in the proprietary and fiduciary fund financial statements when the City solicitor has deemed that a probable loss to the City has occurred. Claims and judgments are recorded as expenditures in the government fund financial state-ments when paid or when judgments have been rendered against the City.
II. LEGAL COMPLIANCE
1. BUDGETARY INFORMATION
The City's budgetary process accounts for certain transactions on a basis other than generally accepted account-ing principles (GAAP). In accordance with the Philadelphia Home Rule Charter, the City has formally established budgetary accounting control for its operating and capital improvement funds.
City of Philadelphia Notes to the Financial Statements For the Fiscal Year Ended June 30, 2010 Exhibit XIII
49
The operating funds of the City, consisting of the General Fund, nine Special Revenue Funds (County Liquid Fu-els Tax, Special Gasoline Tax, HealthChoices Behavioral Health, Hotel Room Rental Tax, Grants Revenue, Community Development, Car Rental Tax, Housing Trust, and Acute Care Hospital Assessment Funds) and two Enterprise Funds (Water and Aviation Funds), are subject to annual operating budgets adopted by City Council. Included with the Water Fund is the Water Residual Fund. These budgets appropriate funds for all City depart-ments, boards and commissions by major class of expenditure within each department. Major classes are de-fined as: personal services; purchase of services; materials and supplies; equipment; contributions, indemnities and taxes; debt service; payments to other funds; and advances and other miscellaneous payments. The ap-propriation amounts for each fund are supported by revenue estimates and take into account the elimination of accumulated deficits and the re-appropriation of accumulated surpluses to the extent necessary. All transfers between major classes (except for materials and supplies and equipment, which are appropriated together) must have council approval. Appropriations that are not expended or encumbered at year end are lapsed. Compari-sons of budget to actual activity at the legal level of compliance are located in the City's Supplemental Report of Revenues and Obligations, a separately published report.
The City Capital Improvement Fund budget is adopted annually by the City Council. The Capital Improvement budget is appropriated by project for each department. All transfers between projects exceeding twenty percent of each project's original appropriation must be approved by City Council. Any funds that are not committed or expended at year end are lapsed. Comparisons of departmental project actual activity to budget are located in the City's Supplemental Report of Revenues and Obligations.
The budgetary comparison schedules presented differ from the modified accrual basis of accounting. These schedules differ from the GAAP basis statements in that both expenditures and encumbrances are applied against the current budget, adjustments affecting activity budgeted in prior years are accounted for through fund balance or as reduction of expenditures and certain interfund transfers and reimbursements are budgeted as revenues and expenditures.
During the year, classification adjustments and supplementary appropriations were necessary for City funds. Therefore, budgeted appropriation amounts presented are as originally passed and as amended by the City Council. As part of the amendment process, budget estimates of City related revenues are adjusted and submit-ted to City Council for review. Changes in revenue estimates do not need City Council approval, but are submit-ted in support of testimony with regard to the appropriation adjustments. Revenue estimates are presented as originally passed and as amended.
III. DETAILED NOTES ON ALL FUNDS AND ACCOUNTS
1. DEPOSITS AND INVESTMENTS
Deposits
State statutes require banks to collateralize City deposits at amounts equal to or in excess of the City’s balance. Such collateral is to be held by the Federal Reserve Bank or the trust department of a commercial bank other than the pledging bank. At year-end, the carrying amount (book balance) of deposits for the City and the bank balances were $303.4 million and $303.4 million respectively. All of the collateralized securities were held in the City’s name except for $119.8 million which was collateralized but held in the pledging institutions name.
Investments
The City has established a comprehensive investment policy that covers all funds other than the Municipal Pen-sion Fund and the Philadelphia Gas Works Retirement Reserve. Both of those funds have separate investment policies designed to meet the long-term goals of the fund. To minimize custodial credit risk, the city’s policy is to select custodian banks that are members of the Federal Reserve System to hold its investments. Delivery of the applicable investment documents to the City’s custodian is required for all investments.
As of June 30, 2010 the City’s Investments consisted of:
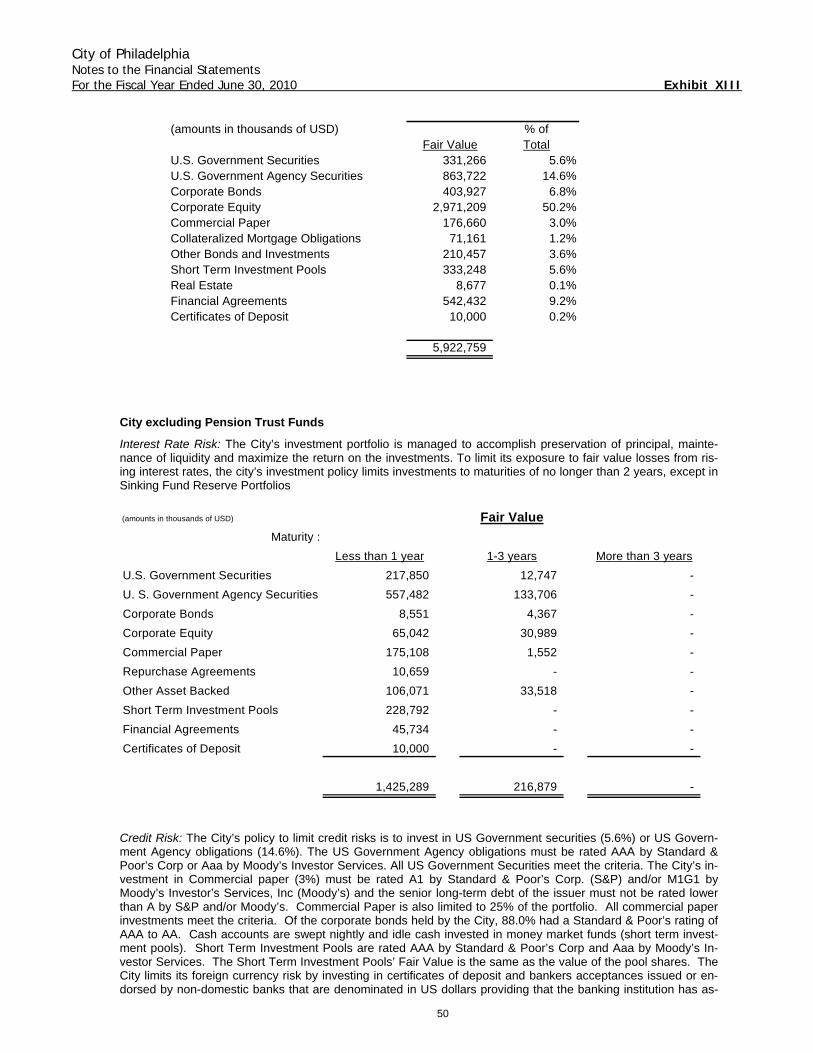
City of Philadelphia Notes to the Financial Statements For the Fiscal Year Ended June 30, 2010 Exhibit XIII
50
(amounts in thousands of USD) % ofFair Value Total
U.S. Government Securities 331,266 5.6%U.S. Government Agency Securities 863,722 14.6%Corporate Bonds 403,927 6.8%Corporate Equity 2,971,209 50.2%Commercial Paper 176,660 3.0%Collateralized Mortgage Obligations 71,161 1.2%Other Bonds and Investments 210,457 3.6%Short Term Investment Pools 333,248 5.6%Real Estate 8,677 0.1%Financial Agreements 542,432 9.2%Certificates of Deposit 10,000 0.2%
5,922,759
City excluding Pension Trust Funds
Interest Rate Risk: The City’s investment portfolio is managed to accomplish preservation of principal, mainte-nance of liquidity and maximize the return on the investments. To limit its exposure to fair value losses from ris-ing interest rates, the city’s investment policy limits investments to maturities of no longer than 2 years, except in Sinking Fund Reserve Portfolios
(amounts in thousands of USD) Fair ValueMaturity :
Less than 1 year 1-3 years More than 3 years
U.S. Government Securities 217,850 12,747 -
U. S. Government Agency Securities 557,482 133,706 -
Corporate Bonds 8,551 4,367 -
Corporate Equity 65,042 30,989 -
Commercial Paper 175,108 1,552 -
Repurchase Agreements 10,659 - -
Other Asset Backed 106,071 33,518 -
Short Term Investment Pools 228,792 - -
Financial Agreements 45,734 - -
Certificates of Deposit 10,000 - -
1,425,289 216,879 -
Credit Risk: The City’s policy to limit credit risks is to invest in US Government securities (5.6%) or US Govern-ment Agency obligations (14.6%). The US Government Agency obligations must be rated AAA by Standard & Poor’s Corp or Aaa by Moody’s Investor Services. All US Government Securities meet the criteria. The City’s in-vestment in Commercial paper (3%) must be rated A1 by Standard & Poor’s Corp. (S&P) and/or M1G1 by Moody’s Investor’s Services, Inc (Moody’s) and the senior long-term debt of the issuer must not be rated lower than A by S&P and/or Moody’s. Commercial Paper is also limited to 25% of the portfolio. All commercial paper investments meet the criteria. Of the corporate bonds held by the City, 88.0% had a Standard & Poor’s rating of AAA to AA. Cash accounts are swept nightly and idle cash invested in money market funds (short term invest-ment pools). Short Term Investment Pools are rated AAA by Standard & Poor’s Corp and Aaa by Moody’s In-vestor Services. The Short Term Investment Pools’ Fair Value is the same as the value of the pool shares. The City limits its foreign currency risk by investing in certificates of deposit and bankers acceptances issued or en-dorsed by non-domestic banks that are denominated in US dollars providing that the banking institution has as-
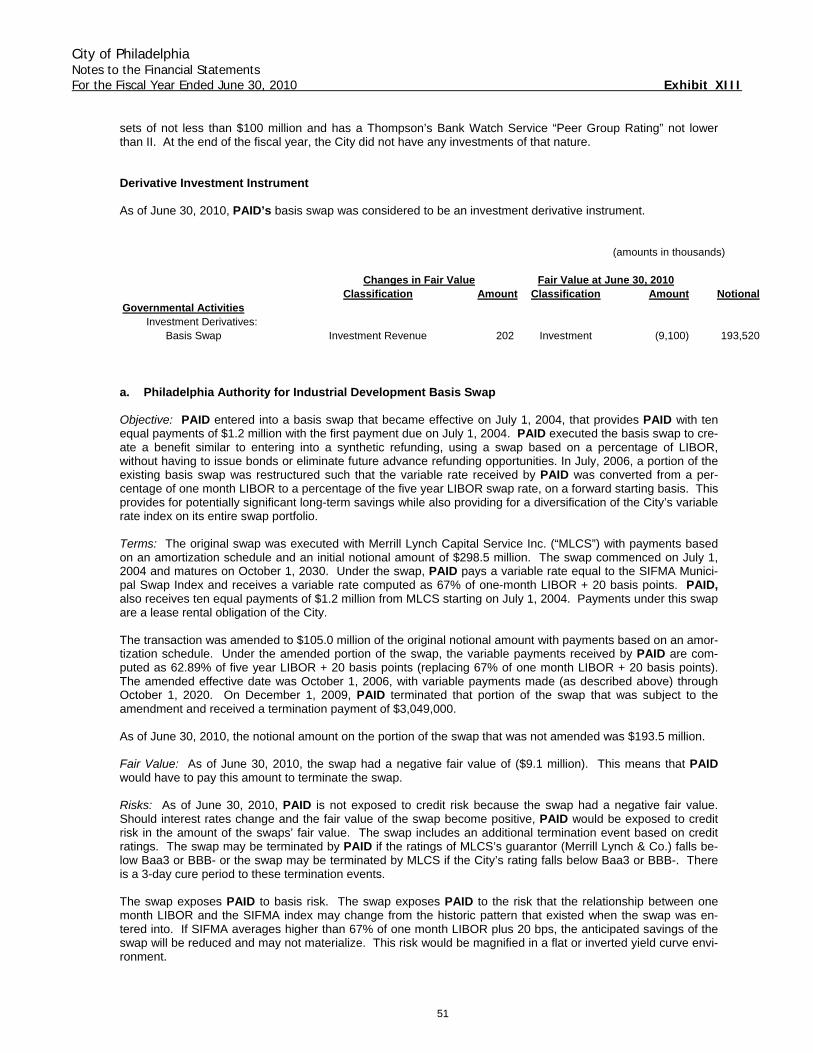
City of Philadelphia Notes to the Financial Statements For the Fiscal Year Ended June 30, 2010 Exhibit XIII
51
sets of not less than $100 million and has a Thompson’s Bank Watch Service “Peer Group Rating” not lower than II. At the end of the fiscal year, the City did not have any investments of that nature. Derivative Investment Instrument As of June 30, 2010, PAID’s basis swap was considered to be an investment derivative instrument.
(amounts in thousands)
Classification Amount Classification Amount NotionalGovernmental Activities
Investment Derivatives:Basis Swap Investment Revenue 202 Investment (9,100) 193,520
Changes in Fair Value Fair Value at June 30, 2010
a. Philadelphia Authority for Industrial Development Basis Swap Objective: PAID entered into a basis swap that became effective on July 1, 2004, that provides PAID with ten equal payments of $1.2 million with the first payment due on July 1, 2004. PAID executed the basis swap to cre-ate a benefit similar to entering into a synthetic refunding, using a swap based on a percentage of LIBOR, without having to issue bonds or eliminate future advance refunding opportunities. In July, 2006, a portion of the existing basis swap was restructured such that the variable rate received by PAID was converted from a per-centage of one month LIBOR to a percentage of the five year LIBOR swap rate, on a forward starting basis. This provides for potentially significant long-term savings while also providing for a diversification of the City’s variable rate index on its entire swap portfolio. Terms: The original swap was executed with Merrill Lynch Capital Service Inc. (“MLCS”) with payments based on an amortization schedule and an initial notional amount of $298.5 million. The swap commenced on July 1, 2004 and matures on October 1, 2030. Under the swap, PAID pays a variable rate equal to the SIFMA Munici-pal Swap Index and receives a variable rate computed as 67% of one-month LIBOR + 20 basis points. PAID, also receives ten equal payments of $1.2 million from MLCS starting on July 1, 2004. Payments under this swap are a lease rental obligation of the City. The transaction was amended to $105.0 million of the original notional amount with payments based on an amor-tization schedule. Under the amended portion of the swap, the variable payments received by PAID are com-puted as 62.89% of five year LIBOR + 20 basis points (replacing 67% of one month LIBOR + 20 basis points). The amended effective date was October 1, 2006, with variable payments made (as described above) through October 1, 2020. On December 1, 2009, PAID terminated that portion of the swap that was subject to the amendment and received a termination payment of $3,049,000. As of June 30, 2010, the notional amount on the portion of the swap that was not amended was $193.5 million. Fair Value: As of June 30, 2010, the swap had a negative fair value of ($9.1 million). This means that PAID would have to pay this amount to terminate the swap. Risks: As of June 30, 2010, PAID is not exposed to credit risk because the swap had a negative fair value. Should interest rates change and the fair value of the swap become positive, PAID would be exposed to credit risk in the amount of the swaps’ fair value. The swap includes an additional termination event based on credit ratings. The swap may be terminated by PAID if the ratings of MLCS’s guarantor (Merrill Lynch & Co.) falls be-low Baa3 or BBB- or the swap may be terminated by MLCS if the City’s rating falls below Baa3 or BBB-. There is a 3-day cure period to these termination events. The swap exposes PAID to basis risk. The swap exposes PAID to the risk that the relationship between one month LIBOR and the SIFMA index may change from the historic pattern that existed when the swap was en-tered into. If SIFMA averages higher than 67% of one month LIBOR plus 20 bps, the anticipated savings of the swap will be reduced and may not materialize. This risk would be magnified in a flat or inverted yield curve envi-ronment.
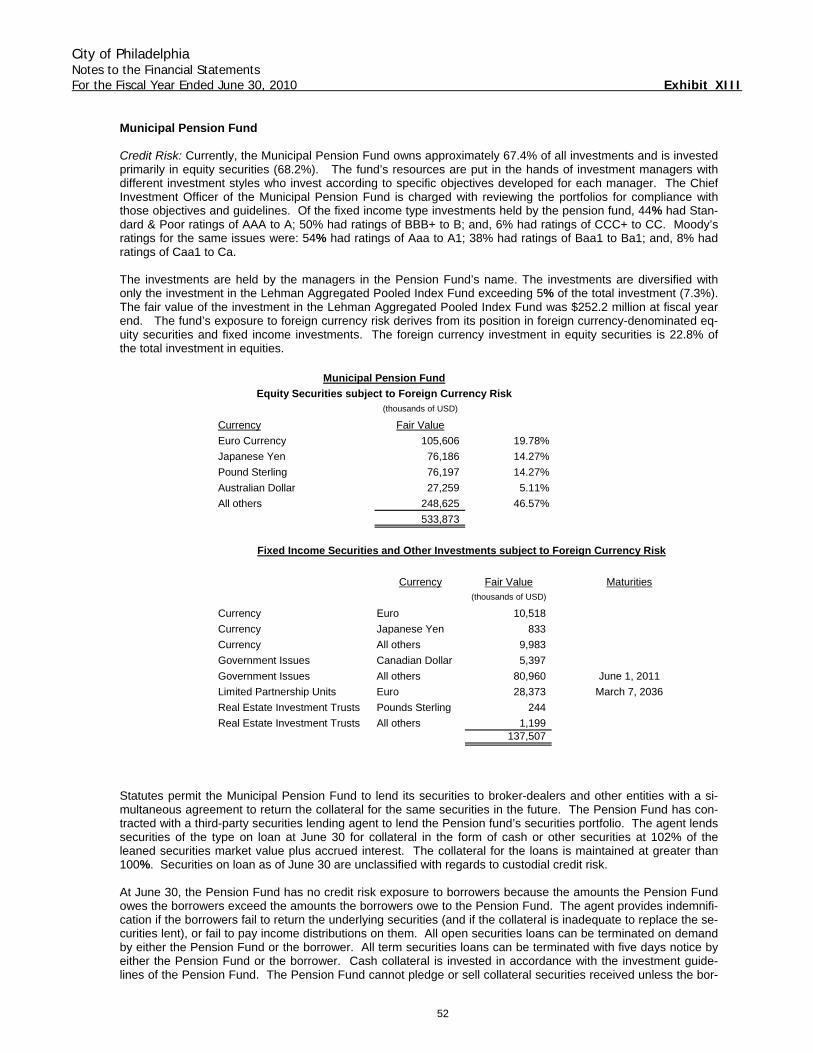
City of Philadelphia Notes to the Financial Statements For the Fiscal Year Ended June 30, 2010 Exhibit XIII
52
Municipal Pension Fund Credit Risk: Currently, the Municipal Pension Fund owns approximately 67.4% of all investments and is invested primarily in equity securities (68.2%). The fund’s resources are put in the hands of investment managers with different investment styles who invest according to specific objectives developed for each manager. The Chief Investment Officer of the Municipal Pension Fund is charged with reviewing the portfolios for compliance with those objectives and guidelines. Of the fixed income type investments held by the pension fund, 44% had Stan-dard & Poor ratings of AAA to A; 50% had ratings of BBB+ to B; and, 6% had ratings of CCC+ to CC. Moody’s ratings for the same issues were: 54% had ratings of Aaa to A1; 38% had ratings of Baa1 to Ba1; and, 8% had ratings of Caa1 to Ca. The investments are held by the managers in the Pension Fund’s name. The investments are diversified with only the investment in the Lehman Aggregated Pooled Index Fund exceeding 5% of the total investment (7.3%). The fair value of the investment in the Lehman Aggregated Pooled Index Fund was $252.2 million at fiscal year end. The fund’s exposure to foreign currency risk derives from its position in foreign currency-denominated eq-uity securities and fixed income investments. The foreign currency investment in equity securities is 22.8% of the total investment in equities.
Municipal Pension FundEquity Securities subject to Foreign Currency Risk
(thousands of USD)
Currency Fair Value
Euro Currency 105,606 19.78%
Japanese Yen 76,186 14.27%
Pound Sterling 76,197 14.27%
Australian Dollar 27,259 5.11%
All others 248,625 46.57%
533,873
Fixed Income Securities and Other Investments subject to Foreign Currency Risk
Currency Fair Value Maturities(thousands of USD)
Currency Euro 10,518
Currency Japanese Yen 833
Currency All others 9,983
Government Issues Canadian Dollar 5,397
Government Issues All others 80,960 June 1, 2011
Limited Partnership Units Euro 28,373 March 7, 2036
Real Estate Investment Trusts Pounds Sterling 244
Real Estate Investment Trusts All others 1,199 137,507
Statutes permit the Municipal Pension Fund to lend its securities to broker-dealers and other entities with a si-multaneous agreement to return the collateral for the same securities in the future. The Pension Fund has con-tracted with a third-party securities lending agent to lend the Pension fund’s securities portfolio. The agent lends securities of the type on loan at June 30 for collateral in the form of cash or other securities at 102% of the leaned securities market value plus accrued interest. The collateral for the loans is maintained at greater than 100%. Securities on loan as of June 30 are unclassified with regards to custodial credit risk. At June 30, the Pension Fund has no credit risk exposure to borrowers because the amounts the Pension Fund owes the borrowers exceed the amounts the borrowers owe to the Pension Fund. The agent provides indemnifi-cation if the borrowers fail to return the underlying securities (and if the collateral is inadequate to replace the se-curities lent), or fail to pay income distributions on them. All open securities loans can be terminated on demand by either the Pension Fund or the borrower. All term securities loans can be terminated with five days notice by either the Pension Fund or the borrower. Cash collateral is invested in accordance with the investment guide-lines of the Pension Fund. The Pension Fund cannot pledge or sell collateral securities received unless the bor-
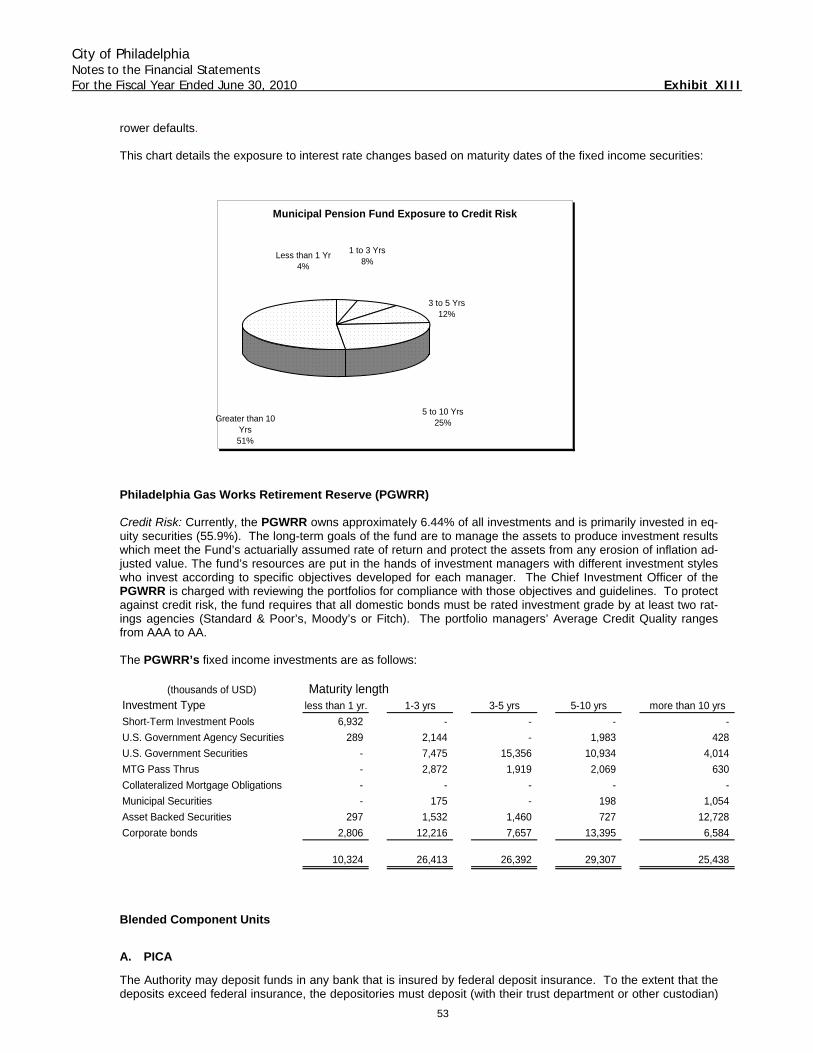
City of Philadelphia Notes to the Financial Statements For the Fiscal Year Ended June 30, 2010 Exhibit XIII
53
rower defaults. This chart details the exposure to interest rate changes based on maturity dates of the fixed income securities:
Municipal Pension Fund Exposure to Credit Risk
Less than 1 Yr4%
1 to 3 Yrs8%
3 to 5 Yrs12%
5 to 10 Yrs25%Greater than 10
Yrs51%
Philadelphia Gas Works Retirement Reserve (PGWRR) Credit Risk: Currently, the PGWRR owns approximately 6.44% of all investments and is primarily invested in eq-uity securities (55.9%). The long-term goals of the fund are to manage the assets to produce investment results which meet the Fund’s actuarially assumed rate of return and protect the assets from any erosion of inflation ad-justed value. The fund’s resources are put in the hands of investment managers with different investment styles who invest according to specific objectives developed for each manager. The Chief Investment Officer of the PGWRR is charged with reviewing the portfolios for compliance with those objectives and guidelines. To protect against credit risk, the fund requires that all domestic bonds must be rated investment grade by at least two rat-ings agencies (Standard & Poor’s, Moody’s or Fitch). The portfolio managers’ Average Credit Quality ranges from AAA to AA. The PGWRR’s fixed income investments are as follows:
(thousands of USD) Maturity lengthInvestment Type less than 1 yr. 1-3 yrs 3-5 yrs 5-10 yrs more than 10 yrs
Short-Term Investment Pools 6,932 - - - -
U.S. Government Agency Securities 289 2,144 - 1,983 428
U.S. Government Securities - 7,475 15,356 10,934 4,014
MTG Pass Thrus - 2,872 1,919 2,069 630
Collateralized Mortgage Obligations - - - - -
Municipal Securities - 175 - 198 1,054
Asset Backed Securities 297 1,532 1,460 727 12,728
Corporate bonds 2,806 12,216 7,657 13,395 6,584
10,324 26,413 26,392 29,307 25,438
Blended Component Units
A. PICA
The Authority may deposit funds in any bank that is insured by federal deposit insurance. To the extent that the deposits exceed federal insurance, the depositories must deposit (with their trust department or other custodian)
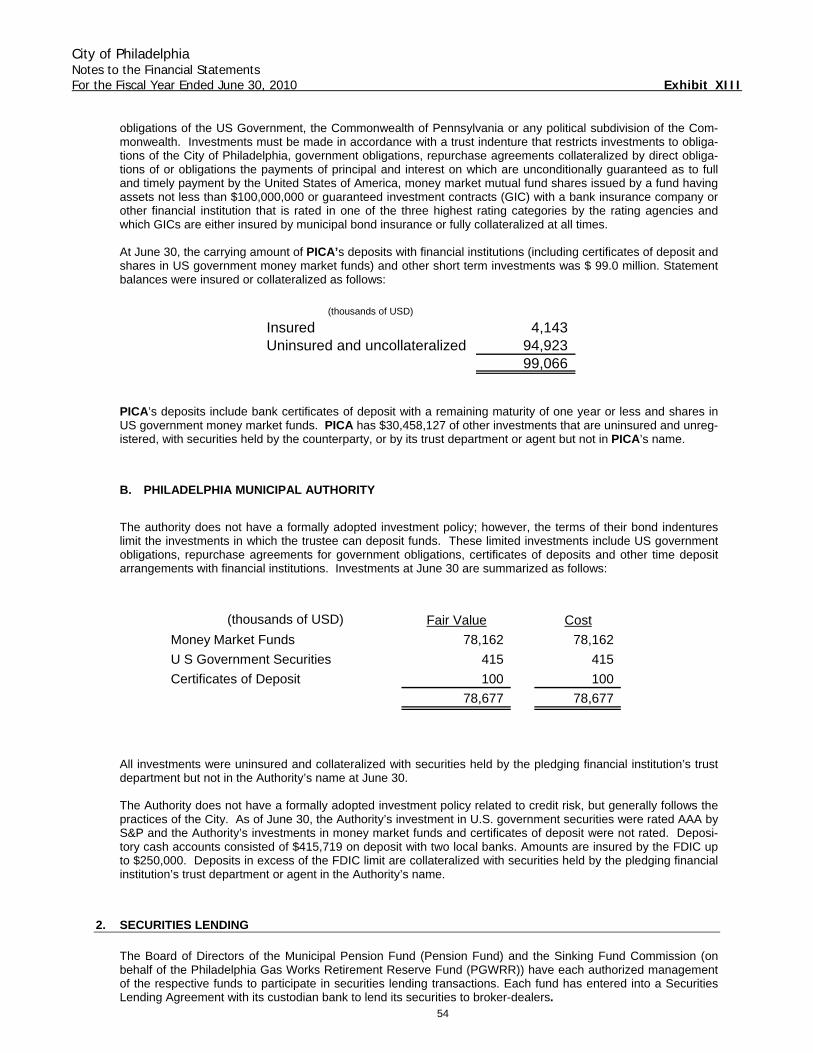
City of Philadelphia Notes to the Financial Statements For the Fiscal Year Ended June 30, 2010 Exhibit XIII
54
obligations of the US Government, the Commonwealth of Pennsylvania or any political subdivision of the Com-monwealth. Investments must be made in accordance with a trust indenture that restricts investments to obliga-tions of the City of Philadelphia, government obligations, repurchase agreements collateralized by direct obliga-tions of or obligations the payments of principal and interest on which are unconditionally guaranteed as to full and timely payment by the United States of America, money market mutual fund shares issued by a fund having assets not less than $100,000,000 or guaranteed investment contracts (GIC) with a bank insurance company or other financial institution that is rated in one of the three highest rating categories by the rating agencies and which GICs are either insured by municipal bond insurance or fully collateralized at all times. At June 30, the carrying amount of PICA’s deposits with financial institutions (including certificates of deposit and shares in US government money market funds) and other short term investments was $ 99.0 million. Statement balances were insured or collateralized as follows:
(thousands of USD)
Insured 4,143 Uninsured and uncollateralized 94,923
99,066
PICA’s deposits include bank certificates of deposit with a remaining maturity of one year or less and shares in US government money market funds. PICA has $30,458,127 of other investments that are uninsured and unreg-istered, with securities held by the counterparty, or by its trust department or agent but not in PICA’s name.
B. PHILADELPHIA MUNICIPAL AUTHORITY
The authority does not have a formally adopted investment policy; however, the terms of their bond indentures limit the investments in which the trustee can deposit funds. These limited investments include US government obligations, repurchase agreements for government obligations, certificates of deposits and other time deposit arrangements with financial institutions. Investments at June 30 are summarized as follows:
(thousands of USD) Fair Value Cost
Money Market Funds 78,162 78,162
U S Government Securities 415 415
Certificates of Deposit 100 100
78,677 78,677
All investments were uninsured and collateralized with securities held by the pledging financial institution’s trust department but not in the Authority’s name at June 30. The Authority does not have a formally adopted investment policy related to credit risk, but generally follows the practices of the City. As of June 30, the Authority’s investment in U.S. government securities were rated AAA by S&P and the Authority’s investments in money market funds and certificates of deposit were not rated. Deposi-tory cash accounts consisted of $415,719 on deposit with two local banks. Amounts are insured by the FDIC up to $250,000. Deposits in excess of the FDIC limit are collateralized with securities held by the pledging financial institution’s trust department or agent in the Authority’s name.
2. SECURITIES LENDING
The Board of Directors of the Municipal Pension Fund (Pension Fund) and the Sinking Fund Commission (on behalf of the Philadelphia Gas Works Retirement Reserve Fund (PGWRR)) have each authorized management of the respective funds to participate in securities lending transactions. Each fund has entered into a Securities Lending Agreement with its custodian bank to lend its securities to broker-dealers.
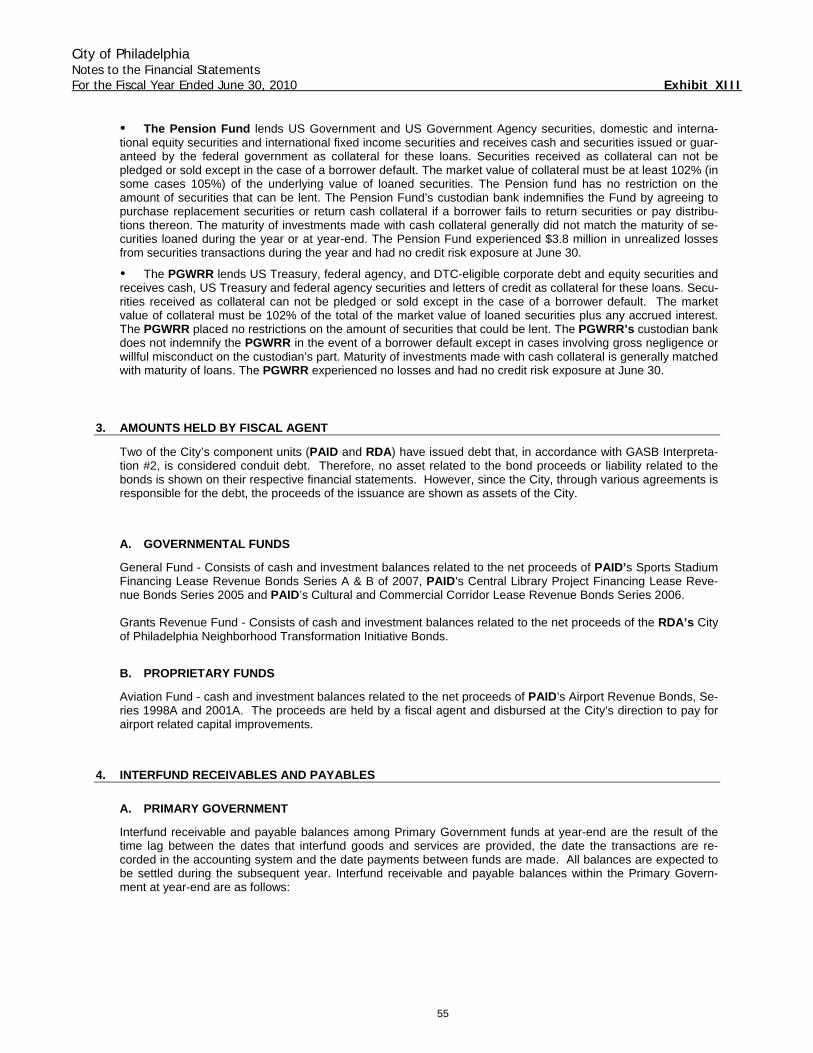
City of Philadelphia Notes to the Financial Statements For the Fiscal Year Ended June 30, 2010 Exhibit XIII
55
The Pension Fund lends US Government and US Government Agency securities, domestic and interna-tional equity securities and international fixed income securities and receives cash and securities issued or guar-anteed by the federal government as collateral for these loans. Securities received as collateral can not be pledged or sold except in the case of a borrower default. The market value of collateral must be at least 102% (in some cases 105%) of the underlying value of loaned securities. The Pension fund has no restriction on the amount of securities that can be lent. The Pension Fund’s custodian bank indemnifies the Fund by agreeing to purchase replacement securities or return cash collateral if a borrower fails to return securities or pay distribu-tions thereon. The maturity of investments made with cash collateral generally did not match the maturity of se-curities loaned during the year or at year-end. The Pension Fund experienced $3.8 million in unrealized losses from securities transactions during the year and had no credit risk exposure at June 30. The PGWRR lends US Treasury, federal agency, and DTC-eligible corporate debt and equity securities and
receives cash, US Treasury and federal agency securities and letters of credit as collateral for these loans. Secu-rities received as collateral can not be pledged or sold except in the case of a borrower default. The market value of collateral must be 102% of the total of the market value of loaned securities plus any accrued interest. The PGWRR placed no restrictions on the amount of securities that could be lent. The PGWRR’s custodian bank does not indemnify the PGWRR in the event of a borrower default except in cases involving gross negligence or willful misconduct on the custodian’s part. Maturity of investments made with cash collateral is generally matched with maturity of loans. The PGWRR experienced no losses and had no credit risk exposure at June 30.
3. AMOUNTS HELD BY FISCAL AGENT
Two of the City’s component units (PAID and RDA) have issued debt that, in accordance with GASB Interpreta-tion #2, is considered conduit debt. Therefore, no asset related to the bond proceeds or liability related to the bonds is shown on their respective financial statements. However, since the City, through various agreements is responsible for the debt, the proceeds of the issuance are shown as assets of the City.
A. GOVERNMENTAL FUNDS
General Fund - Consists of cash and investment balances related to the net proceeds of PAID’s Sports Stadium Financing Lease Revenue Bonds Series A & B of 2007, PAID’s Central Library Project Financing Lease Reve-nue Bonds Series 2005 and PAID’s Cultural and Commercial Corridor Lease Revenue Bonds Series 2006. Grants Revenue Fund - Consists of cash and investment balances related to the net proceeds of the RDA’s City of Philadelphia Neighborhood Transformation Initiative Bonds.
B. PROPRIETARY FUNDS
Aviation Fund - cash and investment balances related to the net proceeds of PAID’s Airport Revenue Bonds, Se-ries 1998A and 2001A. The proceeds are held by a fiscal agent and disbursed at the City’s direction to pay for airport related capital improvements.
4. INTERFUND RECEIVABLES AND PAYABLES
A. PRIMARY GOVERNMENT
Interfund receivable and payable balances among Primary Government funds at year-end are the result of the time lag between the dates that interfund goods and services are provided, the date the transactions are re-corded in the accounting system and the date payments between funds are made. All balances are expected to be settled during the subsequent year. Interfund receivable and payable balances within the Primary Govern-ment at year-end are as follows:
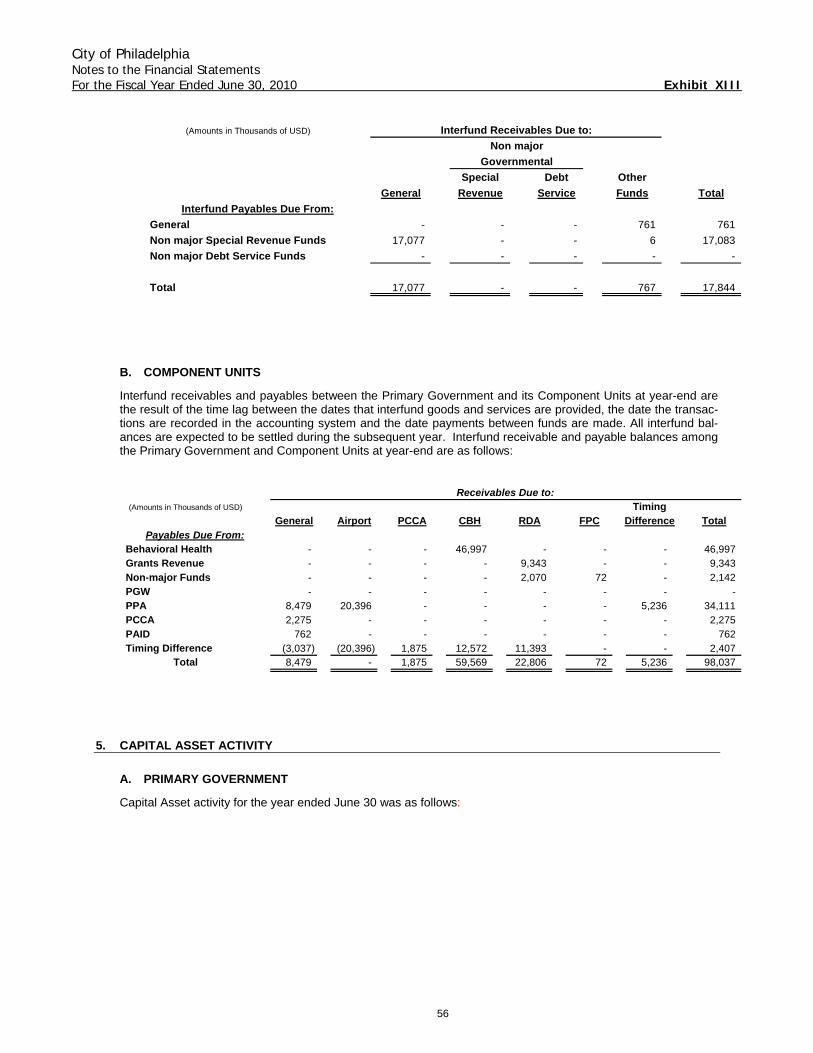
City of Philadelphia Notes to the Financial Statements For the Fiscal Year Ended June 30, 2010 Exhibit XIII
56
(Amounts in Thousands of USD) Interfund Receivables Due to:Non major
GovernmentalSpecial Debt Other
General Revenue Service Funds TotalInterfund Payables Due From:
General - - - 761 761
Non major Special Revenue Funds 17,077 - - 6 17,083
Non major Debt Service Funds - - - - -
Total 17,077 - - 767 17,844
B. COMPONENT UNITS
Interfund receivables and payables between the Primary Government and its Component Units at year-end are the result of the time lag between the dates that interfund goods and services are provided, the date the transac-tions are recorded in the accounting system and the date payments between funds are made. All interfund bal-ances are expected to be settled during the subsequent year. Interfund receivable and payable balances among the Primary Government and Component Units at year-end are as follows:
Receivables Due to:(Amounts in Thousands of USD) Timing
General Airport PCCA CBH RDA FPC Difference TotalPayables Due From:
Behavioral Health - - - 46,997 - - - 46,997 Grants Revenue - - - - 9,343 - - 9,343 Non-major Funds - - - - 2,070 72 - 2,142 PGW - - - - - - - - PPA 8,479 20,396 - - - - 5,236 34,111 PCCA 2,275 - - - - - - 2,275 PAID 762 - - - - - - 762 Timing Difference (3,037) (20,396) 1,875 12,572 11,393 - - 2,407
Total 8,479 - 1,875 59,569 22,806 72 5,236 98,037
5. CAPITAL ASSET ACTIVITY
A. PRIMARY GOVERNMENT
Capital Asset activity for the year ended June 30 was as follows:
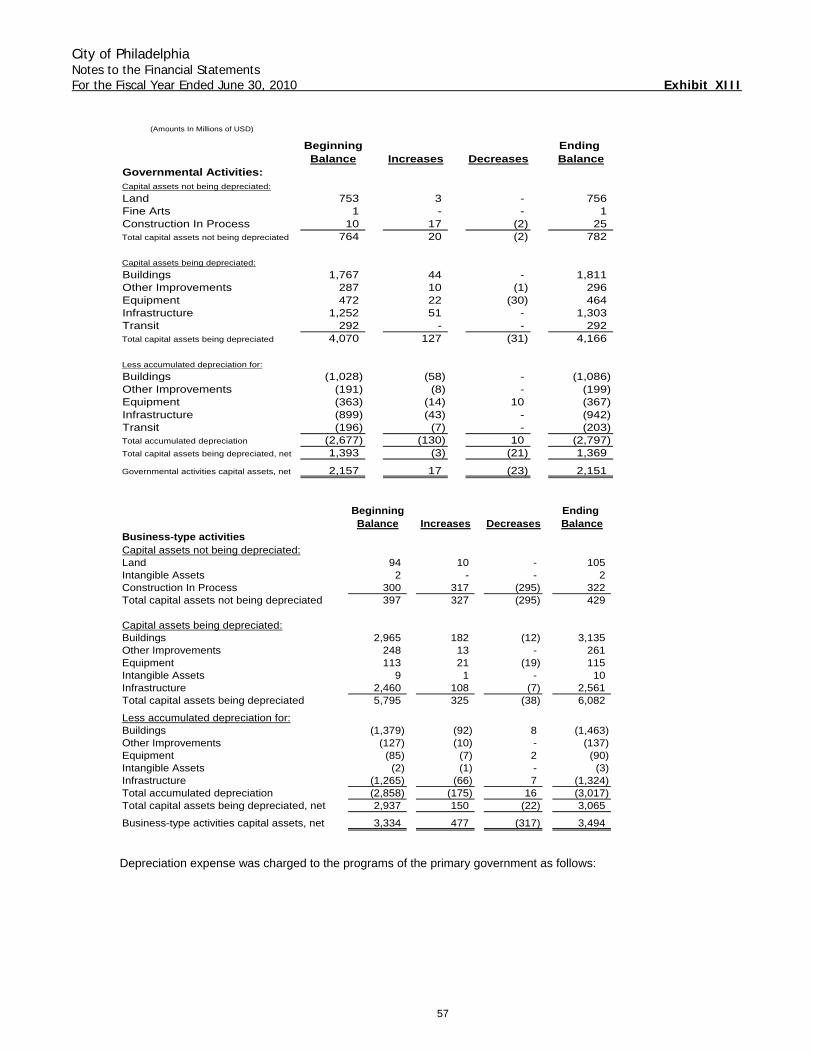
City of Philadelphia Notes to the Financial Statements For the Fiscal Year Ended June 30, 2010 Exhibit XIII
57
(Amounts In Millions of USD)
Beginning Ending Balance Increases Decreases Balance
Governmental Activities:Capital assets not being depreciated:
Land 753 3 - 756 Fine Arts 1 - - 1 Construction In Process 10 17 (2) 25 Total capital assets not being depreciated 764 20 (2) 782
Capital assets being depreciated:
Buildings 1,767 44 - 1,811 Other Improvements 287 10 (1) 296 Equipment 472 22 (30) 464 Infrastructure 1,252 51 - 1,303 Transit 292 - - 292 Total capital assets being depreciated 4,070 127 (31) 4,166
Less accumulated depreciation for:
Buildings (1,028) (58) - (1,086) Other Improvements (191) (8) - (199) Equipment (363) (14) 10 (367) Infrastructure (899) (43) - (942) Transit (196) (7) - (203) Total accumulated depreciation (2,677) (130) 10 (2,797) Total capital assets being depreciated, net 1,393 (3) (21) 1,369
Governmental activities capital assets, net 2,157 17 (23) 2,151
Beginning Ending Balance Increases Decreases Balance
Business-type activitiesCapital assets not being depreciated:Land 94 10 - 105 Intangible Assets 2 - - 2 Construction In Process 300 317 (295) 322 Total capital assets not being depreciated 397 327 (295) 429
Capital assets being depreciated:Buildings 2,965 182 (12) 3,135 Other Improvements 248 13 - 261 Equipment 113 21 (19) 115 Intangible Assets 9 1 - 10 Infrastructure 2,460 108 (7) 2,561 Total capital assets being depreciated 5,795 325 (38) 6,082
Less accumulated depreciation for:Buildings (1,379) (92) 8 (1,463) Other Improvements (127) (10) - (137) Equipment (85) (7) 2 (90) Intangible Assets (2) (1) - (3) Infrastructure (1,265) (66) 7 (1,324) Total accumulated depreciation (2,858) (175) 16 (3,017) Total capital assets being depreciated, net 2,937 150 (22) 3,065
Business-type activities capital assets, net 3,334 477 (317) 3,494
Depreciation expense was charged to the programs of the primary government as follows:
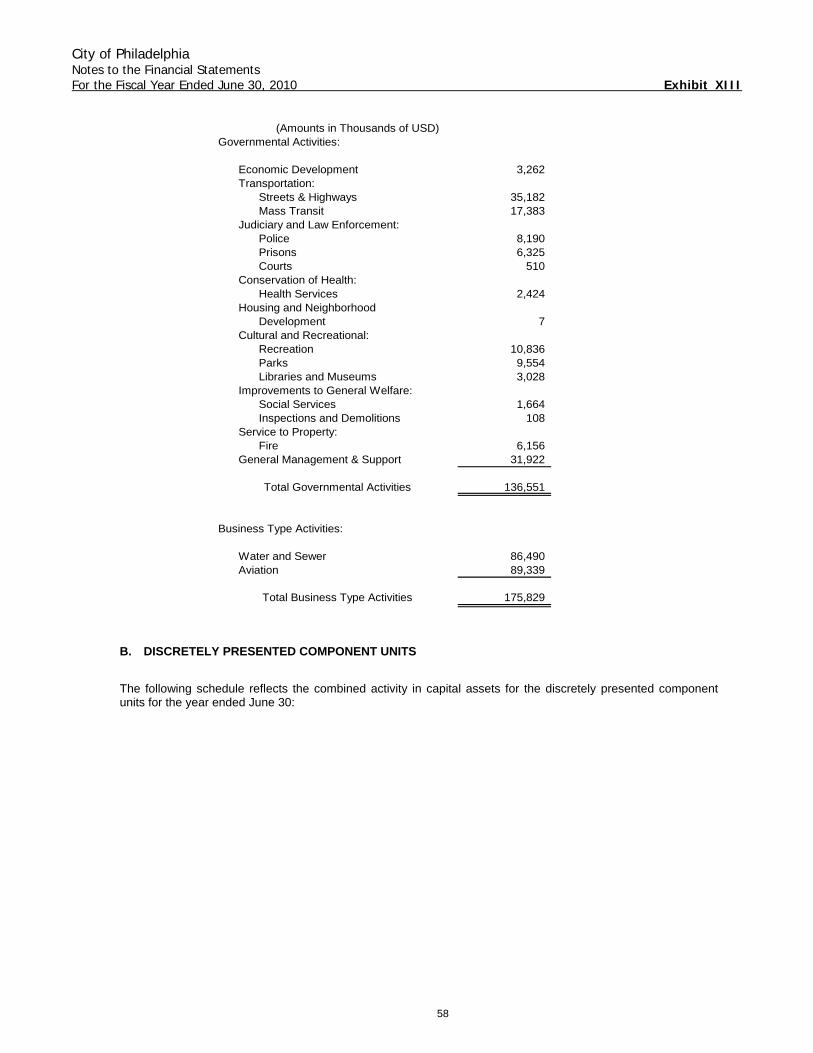
City of Philadelphia Notes to the Financial Statements For the Fiscal Year Ended June 30, 2010 Exhibit XIII
58
(Amounts in Thousands of USD)Governmental Activities:
Economic Development 3,262 Transportation:
Streets & Highways 35,182 Mass Transit 17,383
Judiciary and Law Enforcement:Police 8,190 Prisons 6,325 Courts 510
Conservation of Health:Health Services 2,424
Housing and NeighborhoodDevelopment 7
Cultural and Recreational:Recreation 10,836 Parks 9,554 Libraries and Museums 3,028
Improvements to General Welfare:Social Services 1,664 Inspections and Demolitions 108
Service to Property:Fire 6,156
General Management & Support 31,922
Total Governmental Activities 136,551
Business Type Activities:
Water and Sewer 86,490 Aviation 89,339
Total Business Type Activities 175,829
B. DISCRETELY PRESENTED COMPONENT UNITS
The following schedule reflects the combined activity in capital assets for the discretely presented component units for the year ended June 30:
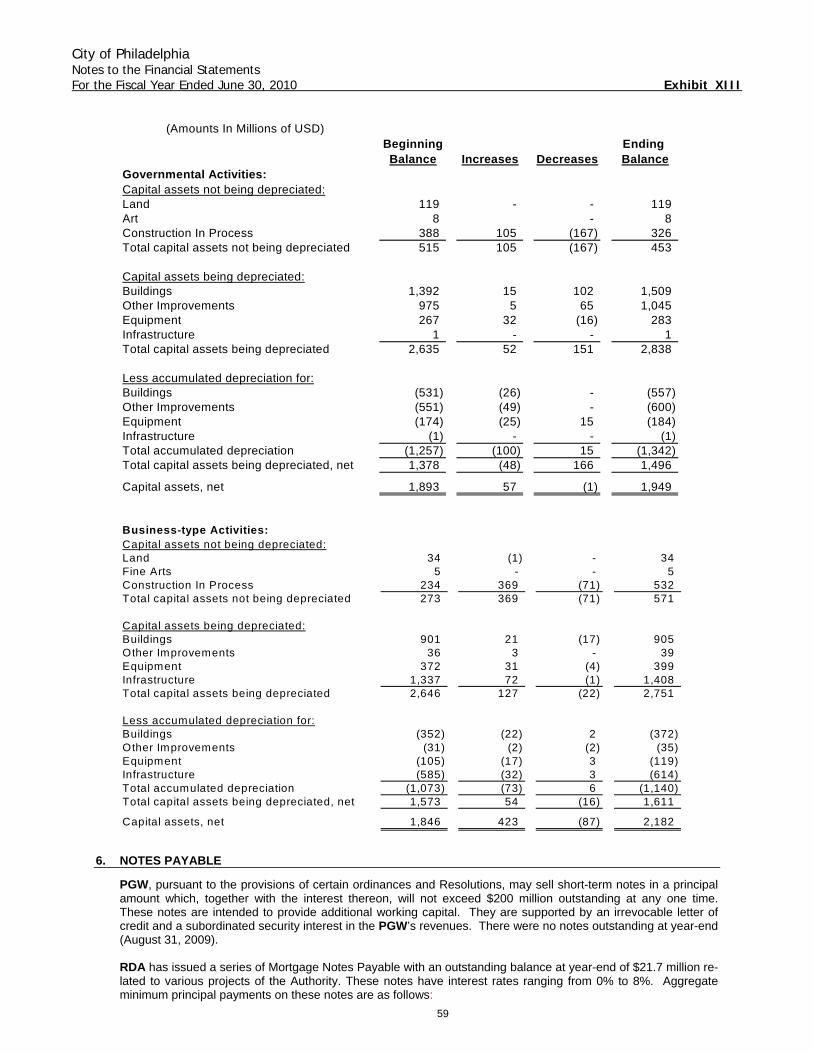
City of Philadelphia Notes to the Financial Statements For the Fiscal Year Ended June 30, 2010 Exhibit XIII
59
(Amounts In Millions of USD)Beginning Ending Balance Increases Decreases Balance
Governmental Activities:Capital assets not being depreciated:Land 119 - - 119 Art 8 - 8 Construction In Process 388 105 (167) 326 Total capital assets not being depreciated 515 105 (167) 453
Capital assets being depreciated:Buildings 1,392 15 102 1,509 Other Improvements 975 5 65 1,045 Equipment 267 32 (16) 283 Infrastructure 1 - - 1 Total capital assets being depreciated 2,635 52 151 2,838
Less accumulated depreciation for:Buildings (531) (26) - (557) Other Improvements (551) (49) - (600) Equipment (174) (25) 15 (184) Infrastructure (1) - - (1) Total accumulated depreciation (1,257) (100) 15 (1,342) Total capital assets being depreciated, net 1,378 (48) 166 1,496
Capital assets, net 1,893 57 (1) 1,949
Business-type Activities:Capital assets not being depreciated:Land 34 (1) - 34 Fine Arts 5 - - 5 Construction In Process 234 369 (71) 532 Total capital assets not being depreciated 273 369 (71) 571
Capital assets being depreciated:Buildings 901 21 (17) 905 Other Improvements 36 3 - 39 Equipment 372 31 (4) 399 Infrastructure 1,337 72 (1) 1,408 Total capital assets being depreciated 2,646 127 (22) 2,751
Less accumulated depreciation for:Buildings (352) (22) 2 (372) Other Improvements (31) (2) (2) (35) Equipment (105) (17) 3 (119) Infrastructure (585) (32) 3 (614) Total accumulated depreciation (1,073) (73) 6 (1,140) Total capital assets being depreciated, net 1,573 54 (16) 1,611
Capital assets, net 1,846 423 (87) 2,182
6. NOTES PAYABLE
PGW, pursuant to the provisions of certain ordinances and Resolutions, may sell short-term notes in a principal amount which, together with the interest thereon, will not exceed $200 million outstanding at any one time. These notes are intended to provide additional working capital. They are supported by an irrevocable letter of credit and a subordinated security interest in the PGW’s revenues. There were no notes outstanding at year-end (August 31, 2009). RDA has issued a series of Mortgage Notes Payable with an outstanding balance at year-end of $21.7 million re-lated to various projects of the Authority. These notes have interest rates ranging from 0% to 8%. Aggregate minimum principal payments on these notes are as follows:
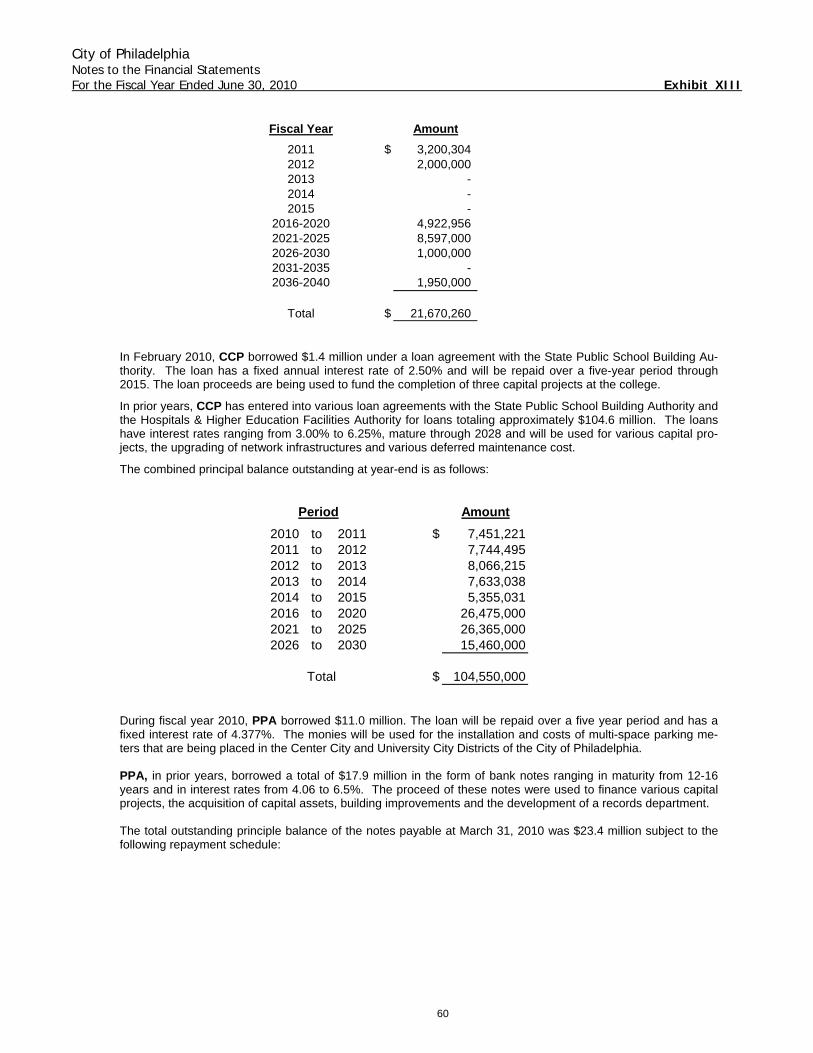
City of Philadelphia Notes to the Financial Statements For the Fiscal Year Ended June 30, 2010 Exhibit XIII
60
Fiscal Year Amount2011 $ 3,200,304 2012 2,000,000 2013 - 2014 - 2015 -
2016-2020 4,922,956 2021-2025 8,597,000 2026-2030 1,000,000 2031-2035 - 2036-2040 1,950,000
Total $ 21,670,260
In February 2010, CCP borrowed $1.4 million under a loan agreement with the State Public School Building Au-thority. The loan has a fixed annual interest rate of 2.50% and will be repaid over a five-year period through 2015. The loan proceeds are being used to fund the completion of three capital projects at the college.
In prior years, CCP has entered into various loan agreements with the State Public School Building Authority and the Hospitals & Higher Education Facilities Authority for loans totaling approximately $104.6 million. The loans have interest rates ranging from 3.00% to 6.25%, mature through 2028 and will be used for various capital pro-jects, the upgrading of network infrastructures and various deferred maintenance cost.
The combined principal balance outstanding at year-end is as follows:
Period Amount2010 to 2011 $ 7,451,2212011 to 2012 7,744,4952012 to 2013 8,066,2152013 to 2014 7,633,0382014 to 2015 5,355,0312016 to 2020 26,475,0002021 to 2025 26,365,0002026 to 2030 15,460,000
Total $ 104,550,000 During fiscal year 2010, PPA borrowed $11.0 million. The loan will be repaid over a five year period and has a fixed interest rate of 4.377%. The monies will be used for the installation and costs of multi-space parking me-ters that are being placed in the Center City and University City Districts of the City of Philadelphia. PPA, in prior years, borrowed a total of $17.9 million in the form of bank notes ranging in maturity from 12-16 years and in interest rates from 4.06 to 6.5%. The proceed of these notes were used to finance various capital projects, the acquisition of capital assets, building improvements and the development of a records department. The total outstanding principle balance of the notes payable at March 31, 2010 was $23.4 million subject to the following repayment schedule:
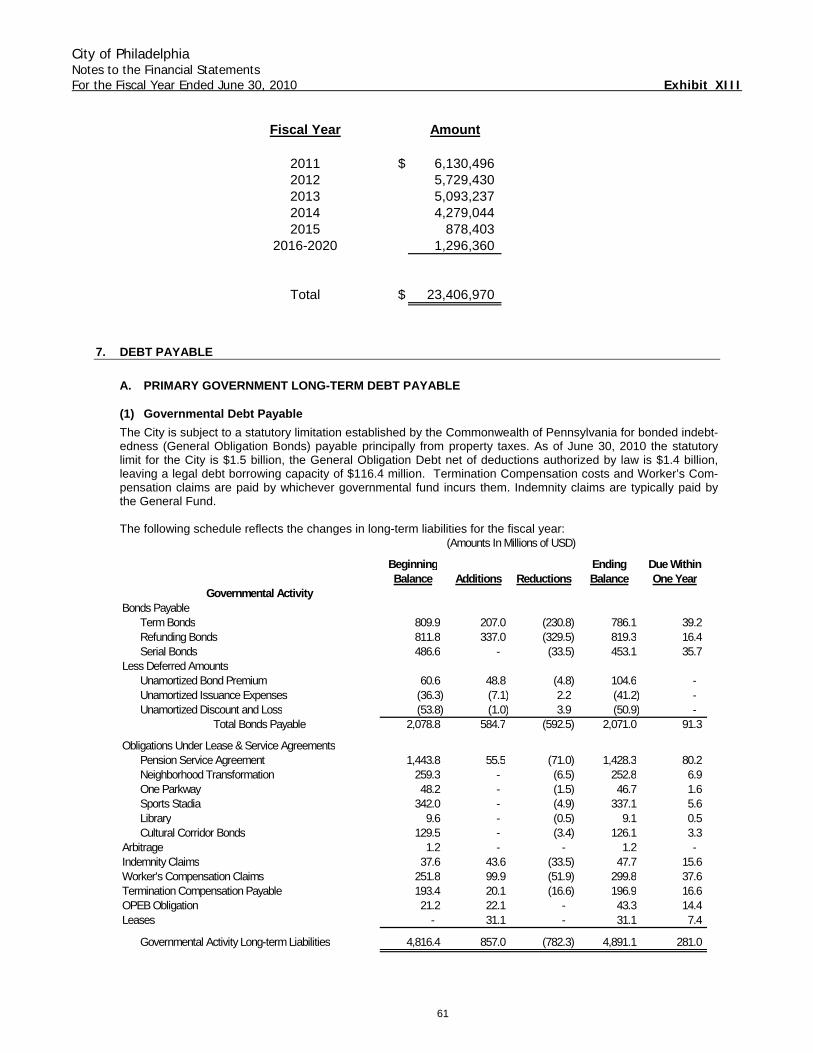
City of Philadelphia Notes to the Financial Statements For the Fiscal Year Ended June 30, 2010 Exhibit XIII
61
Fiscal Year Amount
2011 $ 6,130,496 2012 5,729,430 2013 5,093,237 2014 4,279,044 2015 878,403
2016-2020 1,296,360
Total $ 23,406,970
7. DEBT PAYABLE
A. PRIMARY GOVERNMENT LONG-TERM DEBT PAYABLE
(1) Governmental Debt Payable The City is subject to a statutory limitation established by the Commonwealth of Pennsylvania for bonded indebt-edness (General Obligation Bonds) payable principally from property taxes. As of June 30, 2010 the statutory limit for the City is $1.5 billion, the General Obligation Debt net of deductions authorized by law is $1.4 billion, leaving a legal debt borrowing capacity of $116.4 million. Termination Compensation costs and Worker’s Com-pensation claims are paid by whichever governmental fund incurs them. Indemnity claims are typically paid by the General Fund. The following schedule reflects the changes in long-term liabilities for the fiscal year:
(Amounts In Millions of USD)
Beginning Ending Due WithinBalance Additions Reductions Balance One Year
Governmental ActivityBonds Payable
Term Bonds 809.9 207.0 (230.8) 786.1 39.2 Refunding Bonds 811.8 337.0 (329.5) 819.3 16.4 Serial Bonds 486.6 - (33.5) 453.1 35.7
Less Deferred AmountsUnamortized Bond Premium 60.6 48.8 (4.8) 104.6 - Unamortized Issuance Expenses (36.3) (7.1) 2.2 (41.2) - Unamortized Discount and Loss (53.8) (1.0) 3.9 (50.9) -
Total Bonds Payable 2,078.8 584.7 (592.5) 2,071.0 91.3
Obligations Under Lease & Service AgreementsPension Service Agreement 1,443.8 55.5 (71.0) 1,428.3 80.2 Neighborhood Transformation 259.3 - (6.5) 252.8 6.9 One Parkway 48.2 - (1.5) 46.7 1.6 Sports Stadia 342.0 - (4.9) 337.1 5.6 Library 9.6 - (0.5) 9.1 0.5 Cultural Corridor Bonds 129.5 - (3.4) 126.1 3.3
Arbitrage 1.2 - - 1.2 - Indemnity Claims 37.6 43.6 (33.5) 47.7 15.6 Worker's Compensation Claims 251.8 99.9 (51.9) 299.8 37.6 Termination Compensation Payable 193.4 20.1 (16.6) 196.9 16.6 OPEB Obligation 21.2 22.1 - 43.3 14.4 Leases - 31.1 - 31.1 7.4
Governmental Activity Long-term Liabilities 4,816.4 857.0 (782.3) 4,891.1 281.0
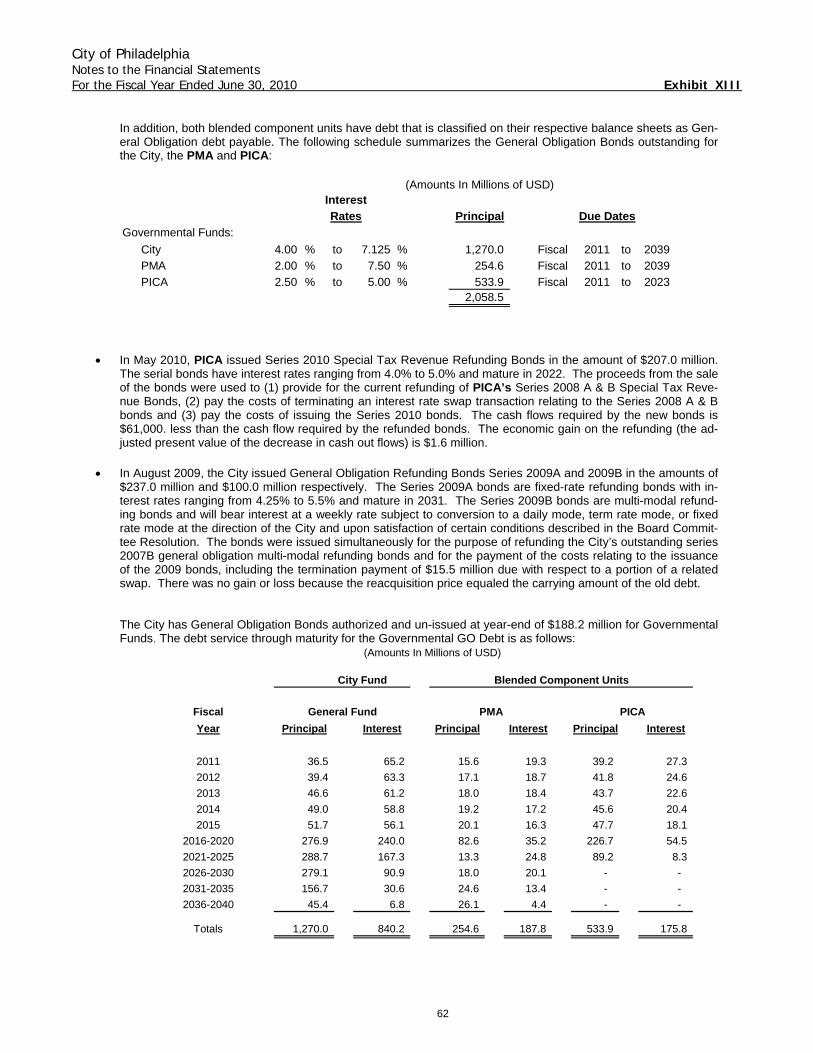
City of Philadelphia Notes to the Financial Statements For the Fiscal Year Ended June 30, 2010 Exhibit XIII
62
In addition, both blended component units have debt that is classified on their respective balance sheets as Gen-eral Obligation debt payable. The following schedule summarizes the General Obligation Bonds outstanding for the City, the PMA and PICA:
(Amounts In Millions of USD)InterestRates Principal Due Dates
Governmental Funds:
City 4.00 % to 7.125 % 1,270.0 Fiscal 2011 to 2039
PMA 2.00 % to 7.50 % 254.6 Fiscal 2011 to 2039
PICA 2.50 % to 5.00 % 533.9 Fiscal 2011 to 20232,058.5
• In May 2010, PICA issued Series 2010 Special Tax Revenue Refunding Bonds in the amount of $207.0 million. The serial bonds have interest rates ranging from 4.0% to 5.0% and mature in 2022. The proceeds from the sale of the bonds were used to (1) provide for the current refunding of PICA’s Series 2008 A & B Special Tax Reve-nue Bonds, (2) pay the costs of terminating an interest rate swap transaction relating to the Series 2008 A & B bonds and (3) pay the costs of issuing the Series 2010 bonds. The cash flows required by the new bonds is $61,000. less than the cash flow required by the refunded bonds. The economic gain on the refunding (the ad-justed present value of the decrease in cash out flows) is $1.6 million.
• In August 2009, the City issued General Obligation Refunding Bonds Series 2009A and 2009B in the amounts of $237.0 million and $100.0 million respectively. The Series 2009A bonds are fixed-rate refunding bonds with in-terest rates ranging from 4.25% to 5.5% and mature in 2031. The Series 2009B bonds are multi-modal refund-ing bonds and will bear interest at a weekly rate subject to conversion to a daily mode, term rate mode, or fixed rate mode at the direction of the City and upon satisfaction of certain conditions described in the Board Commit-tee Resolution. The bonds were issued simultaneously for the purpose of refunding the City’s outstanding series 2007B general obligation multi-modal refunding bonds and for the payment of the costs relating to the issuance of the 2009 bonds, including the termination payment of $15.5 million due with respect to a portion of a related swap. There was no gain or loss because the reacquisition price equaled the carrying amount of the old debt.
The City has General Obligation Bonds authorized and un-issued at year-end of $188.2 million for Governmental Funds. The debt service through maturity for the Governmental GO Debt is as follows:
(Amounts In Millions of USD)
City Fund Blended Component Units
Fiscal General Fund PMA PICAYear Principal Interest Principal Interest Principal Interest
2011 36.5 65.2 15.6 19.3 39.2 27.3
2012 39.4 63.3 17.1 18.7 41.8 24.6
2013 46.6 61.2 18.0 18.4 43.7 22.6
2014 49.0 58.8 19.2 17.2 45.6 20.4
2015 51.7 56.1 20.1 16.3 47.7 18.1
2016-2020 276.9 240.0 82.6 35.2 226.7 54.5
2021-2025 288.7 167.3 13.3 24.8 89.2 8.3
2026-2030 279.1 90.9 18.0 20.1 - -
2031-2035 156.7 30.6 24.6 13.4 - -
2036-2040 45.4 6.8 26.1 4.4 - -
Totals 1,270.0 840.2 254.6 187.8 533.9 175.8
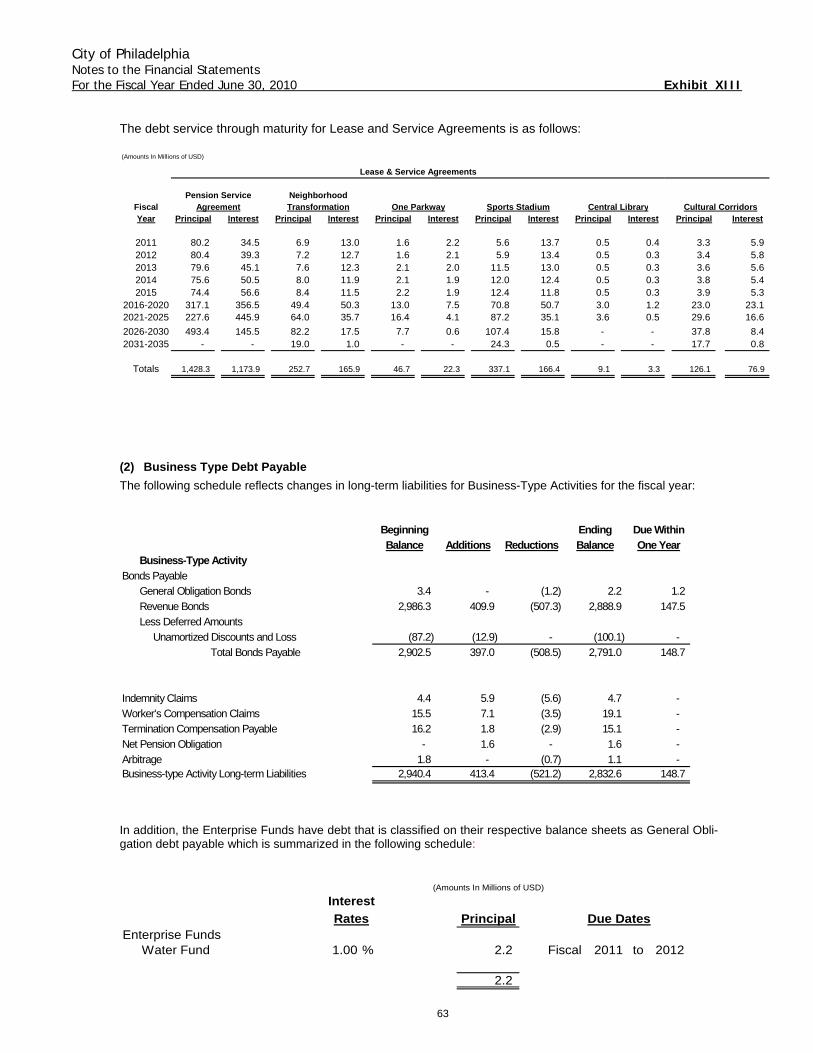
City of Philadelphia Notes to the Financial Statements For the Fiscal Year Ended June 30, 2010 Exhibit XIII
63
The debt service through maturity for Lease and Service Agreements is as follows: (Amounts In Millions of USD)
Pension Service NeighborhoodFiscal Agreement Transformation One Parkway Sports Stadium Central Library Cultural CorridorsYear Principal Interest Principal Interest Principal Interest Principal Interest Principal Interest Principal Interest
2011 80.2 34.5 6.9 13.0 1.6 2.2 5.6 13.7 0.5 0.4 3.3 5.9 2012 80.4 39.3 7.2 12.7 1.6 2.1 5.9 13.4 0.5 0.3 3.4 5.8 2013 79.6 45.1 7.6 12.3 2.1 2.0 11.5 13.0 0.5 0.3 3.6 5.6 2014 75.6 50.5 8.0 11.9 2.1 1.9 12.0 12.4 0.5 0.3 3.8 5.4 2015 74.4 56.6 8.4 11.5 2.2 1.9 12.4 11.8 0.5 0.3 3.9 5.3
2016-2020 317.1 356.5 49.4 50.3 13.0 7.5 70.8 50.7 3.0 1.2 23.0 23.1 2021-2025 227.6 445.9 64.0 35.7 16.4 4.1 87.2 35.1 3.6 0.5 29.6 16.6
2026-2030 493.4 145.5 82.2 17.5 7.7 0.6 107.4 15.8 - - 37.8 8.4 2031-2035 - - 19.0 1.0 - - 24.3 0.5 - - 17.7 0.8
Totals 1,428.3 1,173.9 252.7 165.9 46.7 22.3 337.1 166.4 9.1 3.3 126.1 76.9
Lease & Service Agreements
(2) Business Type Debt Payable The following schedule reflects changes in long-term liabilities for Business-Type Activities for the fiscal year:
Beginning Ending Due WithinBalance Additions Reductions Balance One Year
Business-Type ActivityBonds Payable
General Obligation Bonds 3.4 - (1.2) 2.2 1.2
Revenue Bonds 2,986.3 409.9 (507.3) 2,888.9 147.5
Less Deferred Amounts
Unamortized Discounts and Loss (87.2) (12.9) - (100.1) -
Total Bonds Payable 2,902.5 397.0 (508.5) 2,791.0 148.7
Indemnity Claims 4.4 5.9 (5.6) 4.7 -
Worker's Compensation Claims 15.5 7.1 (3.5) 19.1 - Termination Compensation Payable 16.2 1.8 (2.9) 15.1 -
Net Pension Obligation - 1.6 - 1.6 -
Arbitrage 1.8 - (0.7) 1.1 - Business-type Activity Long-term Liabilities 2,940.4 413.4 (521.2) 2,832.6 148.7
In addition, the Enterprise Funds have debt that is classified on their respective balance sheets as General Obli-gation debt payable which is summarized in the following schedule:
(Amounts In Millions of USD)
InterestRates Principal Due Dates
Enterprise FundsWater Fund 1.00 % 2.2 Fiscal 2011 to 2012
2.2
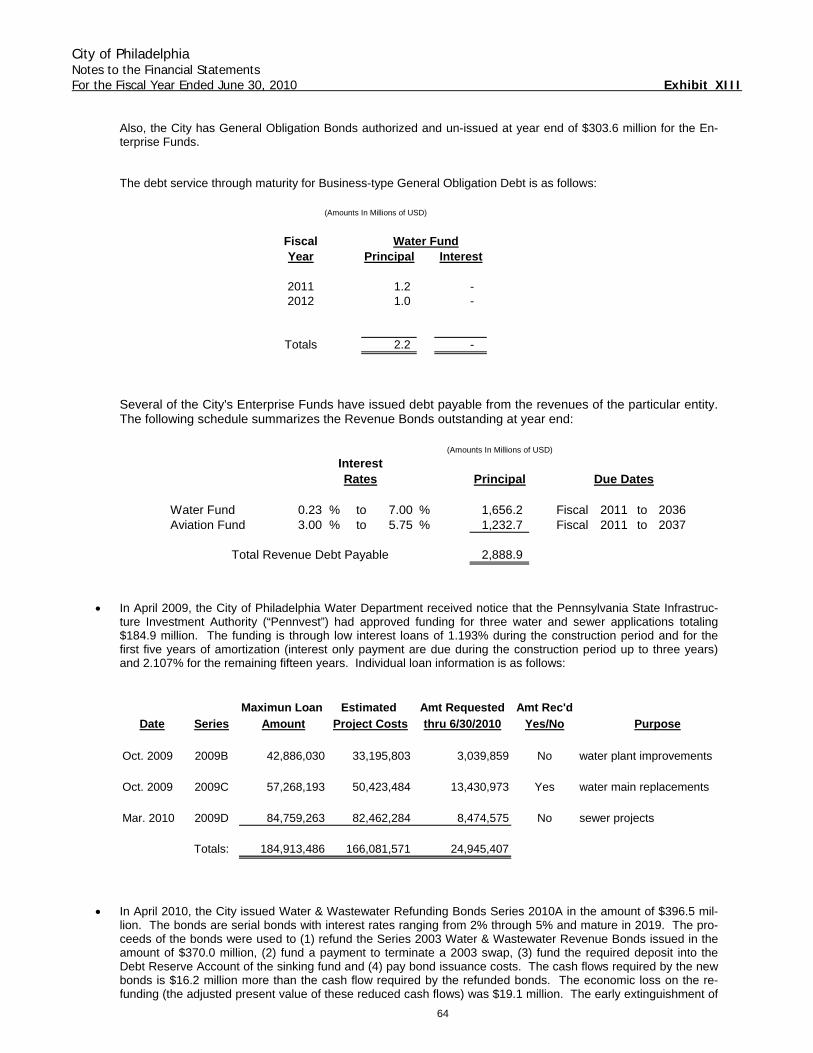
City of Philadelphia Notes to the Financial Statements For the Fiscal Year Ended June 30, 2010 Exhibit XIII
64
Also, the City has General Obligation Bonds authorized and un-issued at year end of $303.6 million for the En-terprise Funds. The debt service through maturity for Business-type General Obligation Debt is as follows:
Fiscal Water FundYear Principal Interest
2011 1.2 - 2012 1.0 -
Totals 2.2 -
(Amounts In Millions of USD)
Several of the City's Enterprise Funds have issued debt payable from the revenues of the particular entity. The following schedule summarizes the Revenue Bonds outstanding at year end:
(Amounts In Millions of USD)
InterestRates Principal Due Dates
Water Fund 0.23 % to 7.00 % 1,656.2 Fiscal 2011 to 2036Aviation Fund 3.00 % to 5.75 % 1,232.7 Fiscal 2011 to 2037
Total Revenue Debt Payable 2,888.9
• In April 2009, the City of Philadelphia Water Department received notice that the Pennsylvania State Infrastruc-ture Investment Authority (“Pennvest”) had approved funding for three water and sewer applications totaling $184.9 million. The funding is through low interest loans of 1.193% during the construction period and for the first five years of amortization (interest only payment are due during the construction period up to three years) and 2.107% for the remaining fifteen years. Individual loan information is as follows:
Maximun Loan Estimated Amt Requested Amt Rec'dDate Series Amount Project Costs thru 6/30/2010 Yes/No Purpose
Oct. 2009 2009B 42,886,030 33,195,803 3,039,859 No water plant improvements
Oct. 2009 2009C 57,268,193 50,423,484 13,430,973 Yes water main replacements
Mar. 2010 2009D 84,759,263 82,462,284 8,474,575 No sewer projects
Totals: 184,913,486 166,081,571 24,945,407
• In April 2010, the City issued Water & Wastewater Refunding Bonds Series 2010A in the amount of $396.5 mil-
lion. The bonds are serial bonds with interest rates ranging from 2% through 5% and mature in 2019. The pro-ceeds of the bonds were used to (1) refund the Series 2003 Water & Wastewater Revenue Bonds issued in the amount of $370.0 million, (2) fund a payment to terminate a 2003 swap, (3) fund the required deposit into the Debt Reserve Account of the sinking fund and (4) pay bond issuance costs. The cash flows required by the new bonds is $16.2 million more than the cash flow required by the refunded bonds. The economic loss on the re-funding (the adjusted present value of these reduced cash flows) was $19.1 million. The early extinguishment of
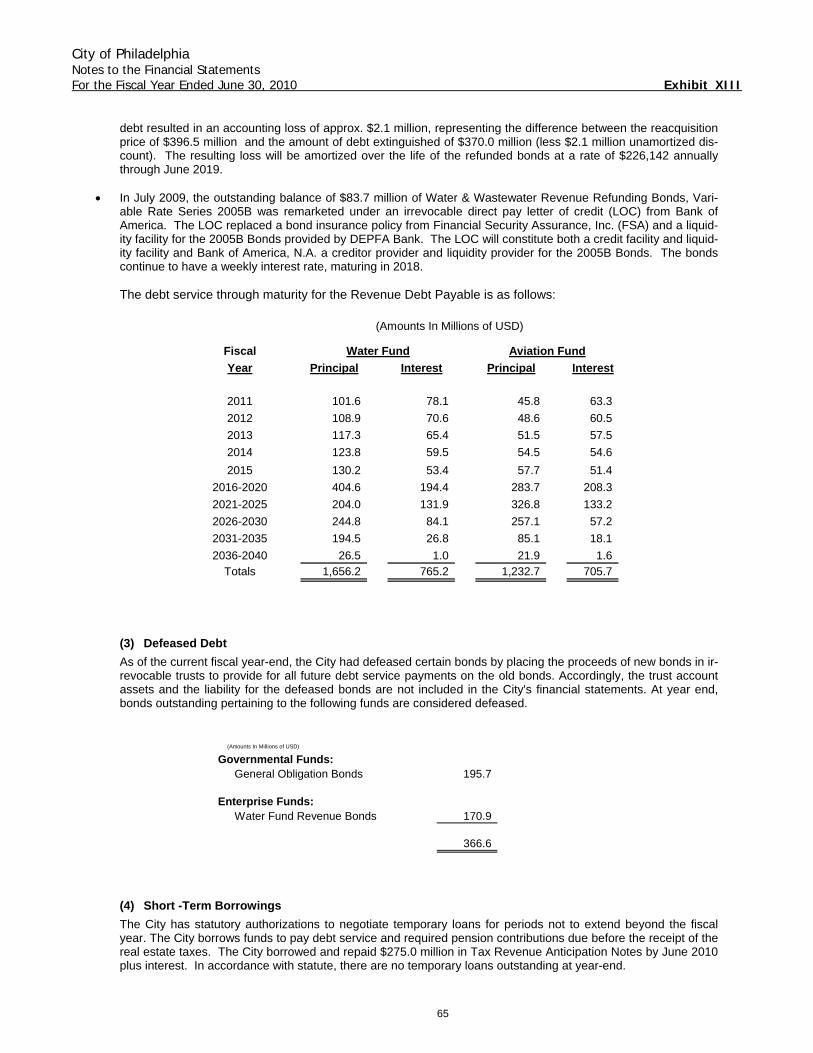
City of Philadelphia Notes to the Financial Statements For the Fiscal Year Ended June 30, 2010 Exhibit XIII
65
debt resulted in an accounting loss of approx. $2.1 million, representing the difference between the reacquisition price of $396.5 million and the amount of debt extinguished of $370.0 million (less $2.1 million unamortized dis-count). The resulting loss will be amortized over the life of the refunded bonds at a rate of $226,142 annually through June 2019.
• In July 2009, the outstanding balance of $83.7 million of Water & Wastewater Revenue Refunding Bonds, Vari-
able Rate Series 2005B was remarketed under an irrevocable direct pay letter of credit (LOC) from Bank of America. The LOC replaced a bond insurance policy from Financial Security Assurance, Inc. (FSA) and a liquid-ity facility for the 2005B Bonds provided by DEPFA Bank. The LOC will constitute both a credit facility and liquid-ity facility and Bank of America, N.A. a creditor provider and liquidity provider for the 2005B Bonds. The bonds continue to have a weekly interest rate, maturing in 2018.
The debt service through maturity for the Revenue Debt Payable is as follows:
(Amounts In Millions of USD)
Fiscal Water Fund Aviation FundYear Principal Interest Principal Interest
2011 101.6 78.1 45.8 63.3
2012 108.9 70.6 48.6 60.5
2013 117.3 65.4 51.5 57.5
2014 123.8 59.5 54.5 54.6
2015 130.2 53.4 57.7 51.4
2016-2020 404.6 194.4 283.7 208.3
2021-2025 204.0 131.9 326.8 133.2
2026-2030 244.8 84.1 257.1 57.2
2031-2035 194.5 26.8 85.1 18.1
2036-2040 26.5 1.0 21.9 1.6 Totals 1,656.2 765.2 1,232.7 705.7
(3) Defeased Debt As of the current fiscal year-end, the City had defeased certain bonds by placing the proceeds of new bonds in ir-revocable trusts to provide for all future debt service payments on the old bonds. Accordingly, the trust account assets and the liability for the defeased bonds are not included in the City's financial statements. At year end, bonds outstanding pertaining to the following funds are considered defeased.
(Amounts In Millions of USD)
Governmental Funds:General Obligation Bonds 195.7
Enterprise Funds:Water Fund Revenue Bonds 170.9
366.6
(4) Short -Term Borrowings The City has statutory authorizations to negotiate temporary loans for periods not to extend beyond the fiscal year. The City borrows funds to pay debt service and required pension contributions due before the receipt of the real estate taxes. The City borrowed and repaid $275.0 million in Tax Revenue Anticipation Notes by June 2010 plus interest. In accordance with statute, there are no temporary loans outstanding at year-end.
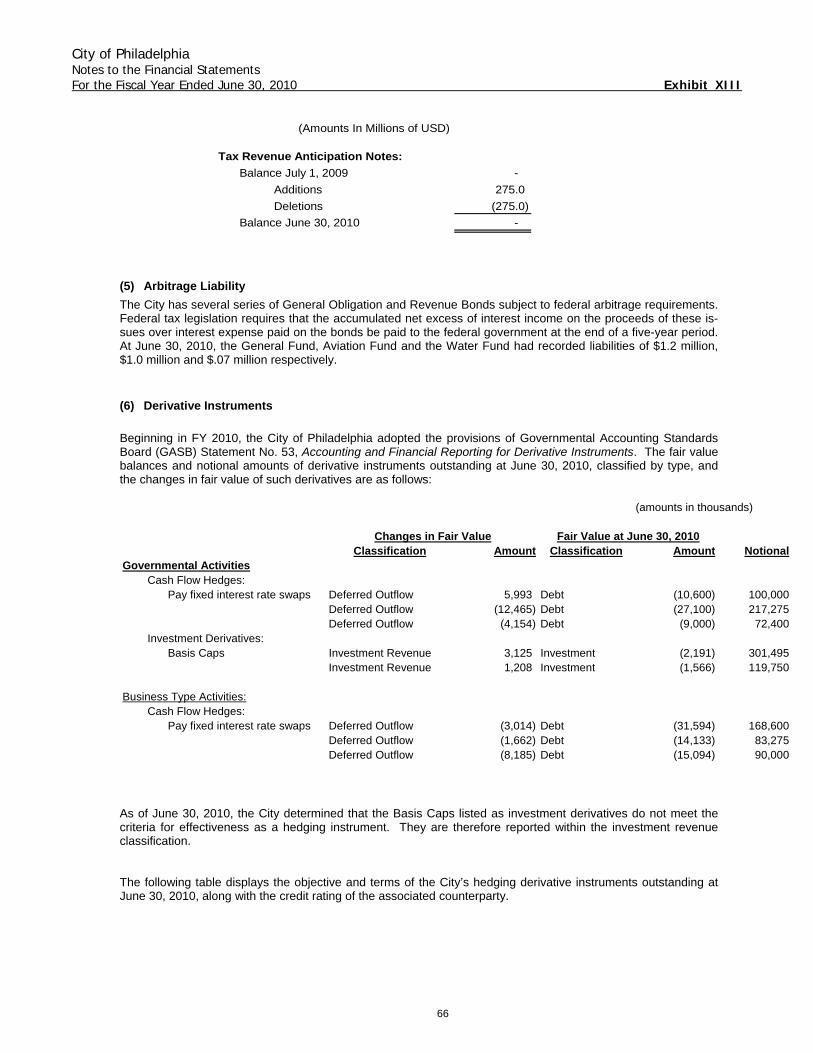
City of Philadelphia Notes to the Financial Statements For the Fiscal Year Ended June 30, 2010 Exhibit XIII
66
(Amounts In Millions of USD)
Tax Revenue Anticipation Notes:Balance July 1, 2009 -
Additions 275.0
Deletions (275.0)
Balance June 30, 2010 -
(5) Arbitrage Liability The City has several series of General Obligation and Revenue Bonds subject to federal arbitrage requirements. Federal tax legislation requires that the accumulated net excess of interest income on the proceeds of these is-sues over interest expense paid on the bonds be paid to the federal government at the end of a five-year period. At June 30, 2010, the General Fund, Aviation Fund and the Water Fund had recorded liabilities of $1.2 million, $1.0 million and $.07 million respectively.
(6) Derivative Instruments Beginning in FY 2010, the City of Philadelphia adopted the provisions of Governmental Accounting Standards Board (GASB) Statement No. 53, Accounting and Financial Reporting for Derivative Instruments. The fair value balances and notional amounts of derivative instruments outstanding at June 30, 2010, classified by type, and the changes in fair value of such derivatives are as follows:
(amounts in thousands)
Classification Amount Classification Amount NotionalGovernmental Activities
Cash Flow Hedges:Pay fixed interest rate swaps Deferred Outflow 5,993 Debt (10,600) 100,000
Deferred Outflow (12,465) Debt (27,100) 217,275Deferred Outflow (4,154) Debt (9,000) 72,400
Investment Derivatives:Basis Caps Investment Revenue 3,125 Investment (2,191) 301,495
Investment Revenue 1,208 Investment (1,566) 119,750
Business Type Activities:Cash Flow Hedges:
Pay fixed interest rate swaps Deferred Outflow (3,014) Debt (31,594) 168,600Deferred Outflow (1,662) Debt (14,133) 83,275Deferred Outflow (8,185) Debt (15,094) 90,000
Changes in Fair Value Fair Value at June 30, 2010
As of June 30, 2010, the City determined that the Basis Caps listed as investment derivatives do not meet the criteria for effectiveness as a hedging instrument. They are therefore reported within the investment revenue classification. The following table displays the objective and terms of the City’s hedging derivative instruments outstanding at June 30, 2010, along with the credit rating of the associated counterparty.
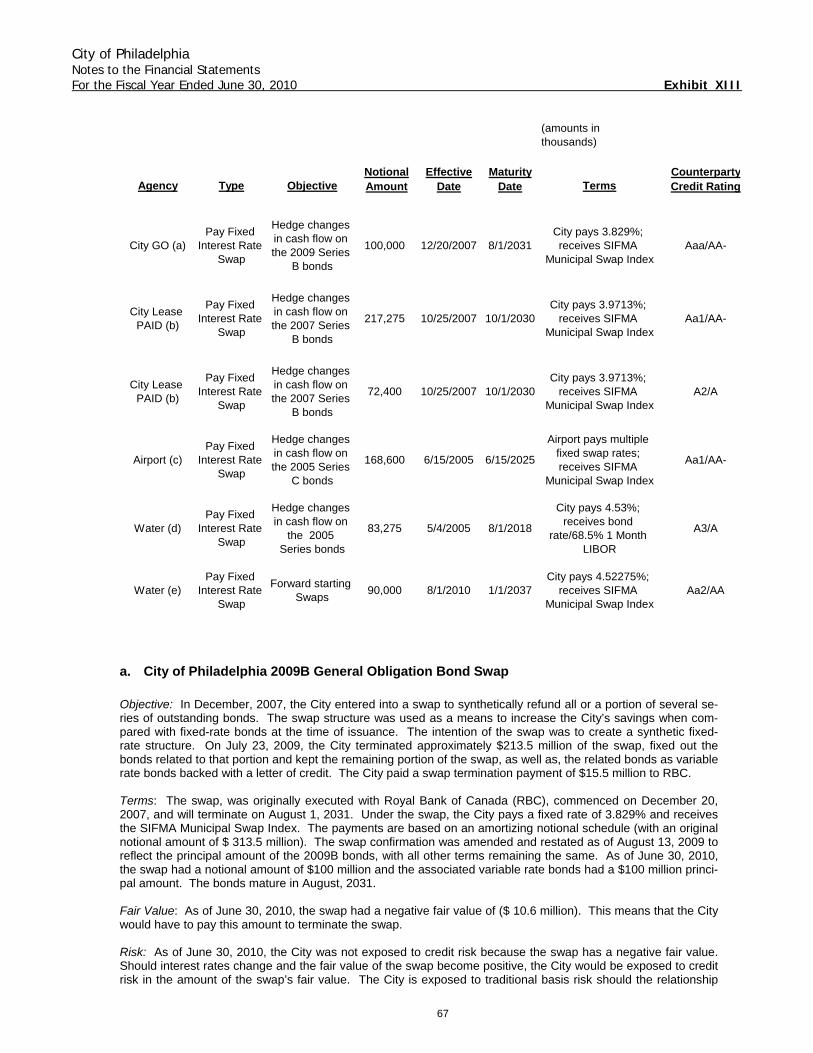
City of Philadelphia Notes to the Financial Statements For the Fiscal Year Ended June 30, 2010 Exhibit XIII
67
(amounts in thousands)
Notional Effective Maturity CounterpartyAgency Type Objective Amount Date Date Terms Credit Rating
City GO (a)Pay Fixed
Interest Rate Swap
Hedge changes in cash flow on the 2009 Series
B bonds
100,000 12/20/2007 8/1/2031City pays 3.829%; receives SIFMA
Municipal Swap IndexAaa/AA-
City Lease PAID (b)
Pay Fixed Interest Rate
Swap
Hedge changes in cash flow on the 2007 Series
B bonds
217,275 10/25/2007 10/1/2030City pays 3.9713%;
receives SIFMA Municipal Swap Index
Aa1/AA-
City Lease PAID (b)
Pay Fixed Interest Rate
Swap
Hedge changes in cash flow on the 2007 Series
B bonds
72,400 10/25/2007 10/1/2030City pays 3.9713%;
receives SIFMA Municipal Swap Index
A2/A
Airport (c)Pay Fixed
Interest Rate Swap
Hedge changes in cash flow on the 2005 Series
C bonds
168,600 6/15/2005 6/15/2025
Airport pays multiple fixed swap rates; receives SIFMA
Municipal Swap Index
Aa1/AA-
Water (d)Pay Fixed
Interest Rate Swap
Hedge changes in cash flow on
the 2005 Series bonds
83,275 5/4/2005 8/1/2018
City pays 4.53%; receives bond
rate/68.5% 1 Month LIBOR
A3/A
Water (e)Pay Fixed
Interest Rate Swap
Forward starting Swaps
90,000 8/1/2010 1/1/2037City pays 4.52275%;
receives SIFMA Municipal Swap Index
Aa2/AA
a. City of Philadelphia 2009B General Obligation Bond Swap Objective: In December, 2007, the City entered into a swap to synthetically refund all or a portion of several se-ries of outstanding bonds. The swap structure was used as a means to increase the City’s savings when com-pared with fixed-rate bonds at the time of issuance. The intention of the swap was to create a synthetic fixed-rate structure. On July 23, 2009, the City terminated approximately $213.5 million of the swap, fixed out the bonds related to that portion and kept the remaining portion of the swap, as well as, the related bonds as variable rate bonds backed with a letter of credit. The City paid a swap termination payment of $15.5 million to RBC. Terms: The swap, was originally executed with Royal Bank of Canada (RBC), commenced on December 20, 2007, and will terminate on August 1, 2031. Under the swap, the City pays a fixed rate of 3.829% and receives the SIFMA Municipal Swap Index. The payments are based on an amortizing notional schedule (with an original notional amount of $ 313.5 million). The swap confirmation was amended and restated as of August 13, 2009 to reflect the principal amount of the 2009B bonds, with all other terms remaining the same. As of June 30, 2010, the swap had a notional amount of $100 million and the associated variable rate bonds had a $100 million princi-pal amount. The bonds mature in August, 2031. Fair Value: As of June 30, 2010, the swap had a negative fair value of ($ 10.6 million). This means that the City would have to pay this amount to terminate the swap. Risk: As of June 30, 2010, the City was not exposed to credit risk because the swap has a negative fair value. Should interest rates change and the fair value of the swap become positive, the City would be exposed to credit risk in the amount of the swap’s fair value. The City is exposed to traditional basis risk should the relationship
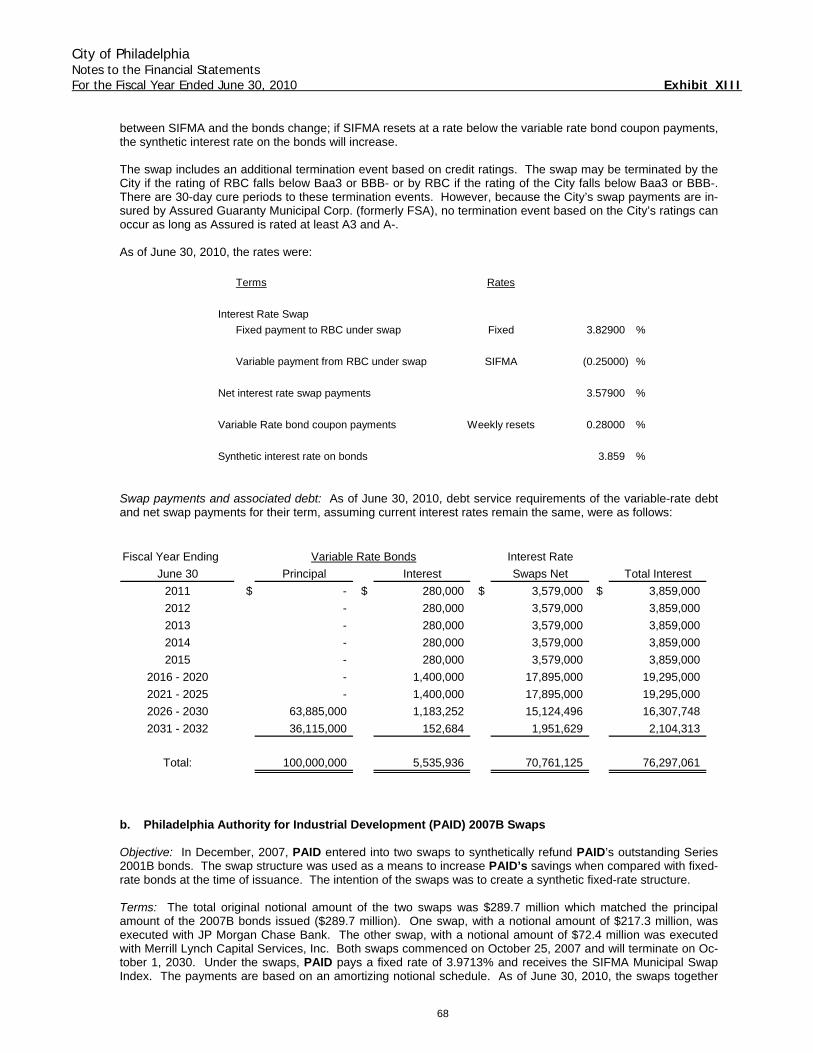
City of Philadelphia Notes to the Financial Statements For the Fiscal Year Ended June 30, 2010 Exhibit XIII
68
between SIFMA and the bonds change; if SIFMA resets at a rate below the variable rate bond coupon payments, the synthetic interest rate on the bonds will increase. The swap includes an additional termination event based on credit ratings. The swap may be terminated by the City if the rating of RBC falls below Baa3 or BBB- or by RBC if the rating of the City falls below Baa3 or BBB-. There are 30-day cure periods to these termination events. However, because the City’s swap payments are in-sured by Assured Guaranty Municipal Corp. (formerly FSA), no termination event based on the City’s ratings can occur as long as Assured is rated at least A3 and A-. As of June 30, 2010, the rates were:
Terms Rates
Interest Rate Swap
Fixed payment to RBC under swap Fixed 3.82900 %
Variable payment from RBC under swap SIFMA (0.25000) %
Net interest rate swap payments 3.57900 %
Variable Rate bond coupon payments Weekly resets 0.28000 %
Synthetic interest rate on bonds 3.859 % Swap payments and associated debt: As of June 30, 2010, debt service requirements of the variable-rate debt and net swap payments for their term, assuming current interest rates remain the same, were as follows: Fiscal Year Ending Variable Rate Bonds Interest Rate
June 30 Principal Interest Swaps Net Total Interest
2011 $ - $ 280,000 $ 3,579,000 $ 3,859,000
2012 - 280,000 3,579,000 3,859,000
2013 - 280,000 3,579,000 3,859,000
2014 - 280,000 3,579,000 3,859,000
2015 - 280,000 3,579,000 3,859,000
2016 - 2020 - 1,400,000 17,895,000 19,295,000
2021 - 2025 - 1,400,000 17,895,000 19,295,000
2026 - 2030 63,885,000 1,183,252 15,124,496 16,307,748
2031 - 2032 36,115,000 152,684 1,951,629 2,104,313
Total: 100,000,000 5,535,936 70,761,125 76,297,061
b. Philadelphia Authority for Industrial Development (PAID) 2007B Swaps Objective: In December, 2007, PAID entered into two swaps to synthetically refund PAID’s outstanding Series 2001B bonds. The swap structure was used as a means to increase PAID’s savings when compared with fixed-rate bonds at the time of issuance. The intention of the swaps was to create a synthetic fixed-rate structure. Terms: The total original notional amount of the two swaps was $289.7 million which matched the principal amount of the 2007B bonds issued ($289.7 million). One swap, with a notional amount of $217.3 million, was executed with JP Morgan Chase Bank. The other swap, with a notional amount of $72.4 million was executed with Merrill Lynch Capital Services, Inc. Both swaps commenced on October 25, 2007 and will terminate on Oc-tober 1, 2030. Under the swaps, PAID pays a fixed rate of 3.9713% and receives the SIFMA Municipal Swap Index. The payments are based on an amortizing notional schedule. As of June 30, 2010, the swaps together
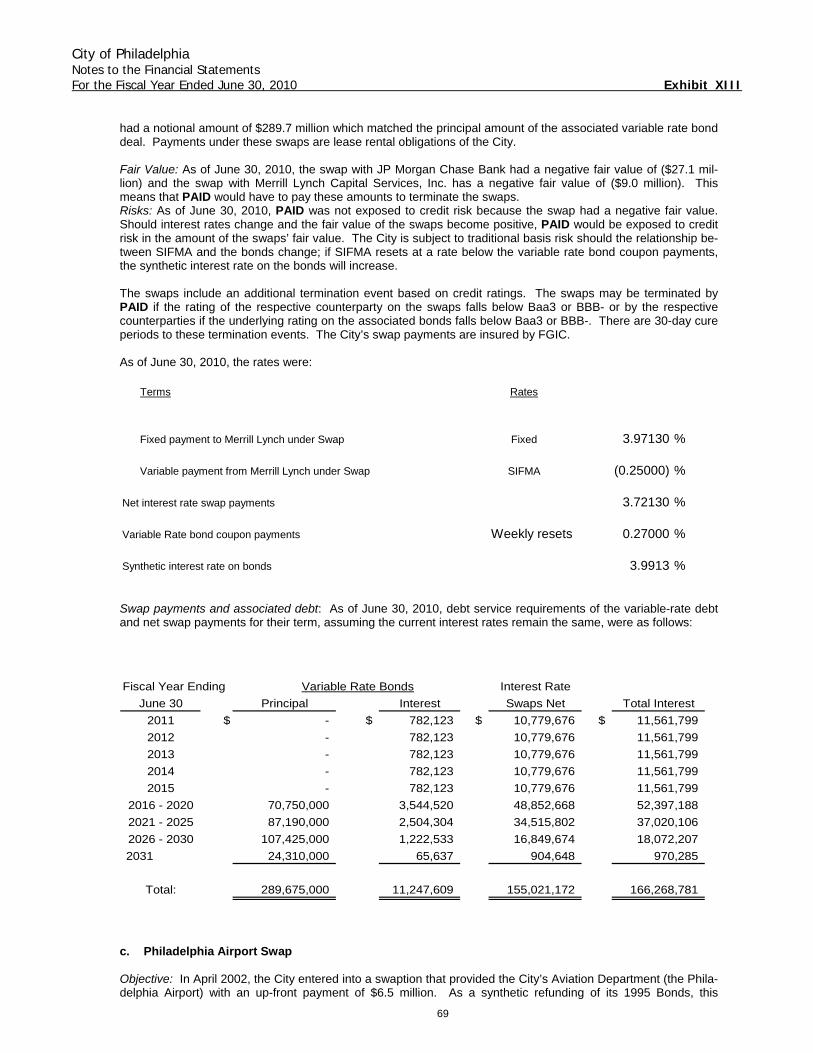
City of Philadelphia Notes to the Financial Statements For the Fiscal Year Ended June 30, 2010 Exhibit XIII
69
had a notional amount of $289.7 million which matched the principal amount of the associated variable rate bond deal. Payments under these swaps are lease rental obligations of the City. Fair Value: As of June 30, 2010, the swap with JP Morgan Chase Bank had a negative fair value of ($27.1 mil-lion) and the swap with Merrill Lynch Capital Services, Inc. has a negative fair value of ($9.0 million). This means that PAID would have to pay these amounts to terminate the swaps. Risks: As of June 30, 2010, PAID was not exposed to credit risk because the swap had a negative fair value. Should interest rates change and the fair value of the swaps become positive, PAID would be exposed to credit risk in the amount of the swaps’ fair value. The City is subject to traditional basis risk should the relationship be-tween SIFMA and the bonds change; if SIFMA resets at a rate below the variable rate bond coupon payments, the synthetic interest rate on the bonds will increase. The swaps include an additional termination event based on credit ratings. The swaps may be terminated by PAID if the rating of the respective counterparty on the swaps falls below Baa3 or BBB- or by the respective counterparties if the underlying rating on the associated bonds falls below Baa3 or BBB-. There are 30-day cure periods to these termination events. The City’s swap payments are insured by FGIC. As of June 30, 2010, the rates were:
Terms Rates
Fixed payment to Merrill Lynch under Swap Fixed 3.97130 %
Variable payment from Merrill Lynch under Swap SIFMA (0.25000) %
Net interest rate swap payments 3.72130 %
Variable Rate bond coupon payments Weekly resets 0.27000 %
Synthetic interest rate on bonds 3.9913 % Swap payments and associated debt: As of June 30, 2010, debt service requirements of the variable-rate debt and net swap payments for their term, assuming the current interest rates remain the same, were as follows: Fiscal Year Ending Variable Rate Bonds Interest Rate
June 30 Principal Interest Swaps Net Total Interest
2011 $ - $ 782,123 $ 10,779,676 $ 11,561,799
2012 - 782,123 10,779,676 11,561,799
2013 - 782,123 10,779,676 11,561,799
2014 - 782,123 10,779,676 11,561,799
2015 - 782,123 10,779,676 11,561,799
2016 - 2020 70,750,000 3,544,520 48,852,668 52,397,188
2021 - 2025 87,190,000 2,504,304 34,515,802 37,020,106
2026 - 2030 107,425,000 1,222,533 16,849,674 18,072,207
2031 24,310,000 65,637 904,648 970,285
Total: 289,675,000 11,247,609 155,021,172 166,268,781
c. Philadelphia Airport Swap
Objective: In April 2002, the City entered into a swaption that provided the City’s Aviation Department (the Phila-delphia Airport) with an up-front payment of $6.5 million. As a synthetic refunding of its 1995 Bonds, this
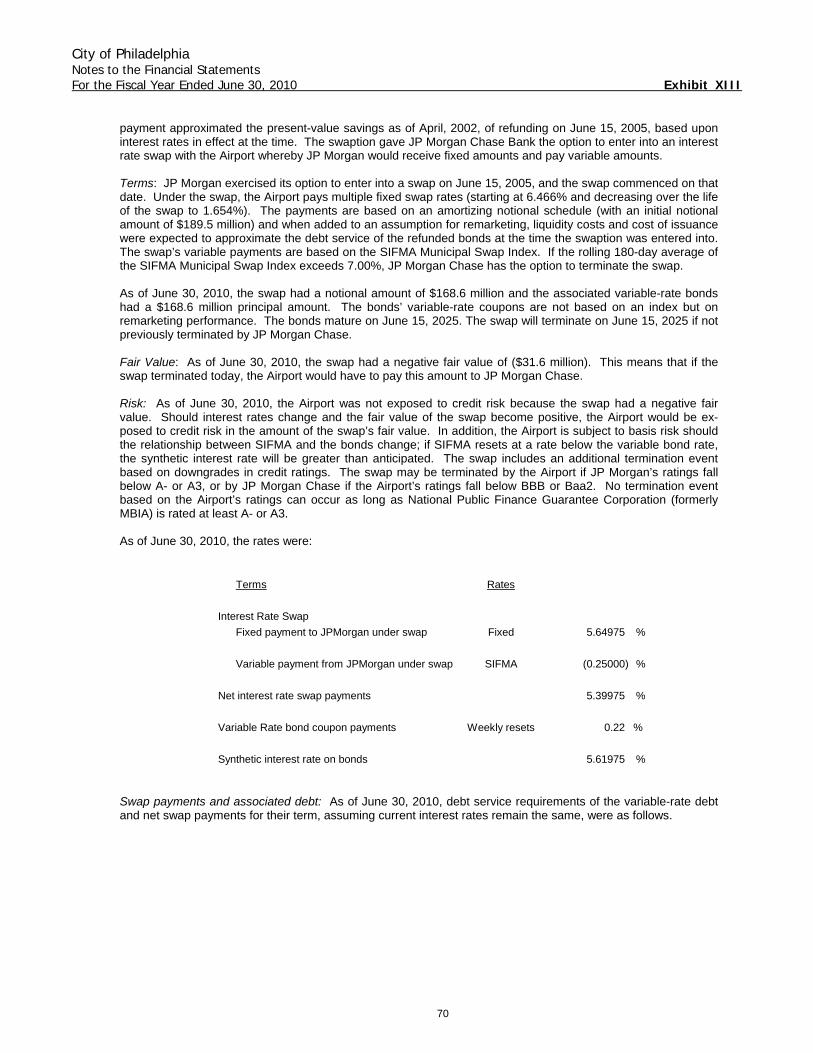
City of Philadelphia Notes to the Financial Statements For the Fiscal Year Ended June 30, 2010 Exhibit XIII
70
payment approximated the present-value savings as of April, 2002, of refunding on June 15, 2005, based upon interest rates in effect at the time. The swaption gave JP Morgan Chase Bank the option to enter into an interest rate swap with the Airport whereby JP Morgan would receive fixed amounts and pay variable amounts. Terms: JP Morgan exercised its option to enter into a swap on June 15, 2005, and the swap commenced on that date. Under the swap, the Airport pays multiple fixed swap rates (starting at 6.466% and decreasing over the life of the swap to 1.654%). The payments are based on an amortizing notional schedule (with an initial notional amount of $189.5 million) and when added to an assumption for remarketing, liquidity costs and cost of issuance were expected to approximate the debt service of the refunded bonds at the time the swaption was entered into. The swap’s variable payments are based on the SIFMA Municipal Swap Index. If the rolling 180-day average of the SIFMA Municipal Swap Index exceeds 7.00%, JP Morgan Chase has the option to terminate the swap. As of June 30, 2010, the swap had a notional amount of $168.6 million and the associated variable-rate bonds had a $168.6 million principal amount. The bonds’ variable-rate coupons are not based on an index but on remarketing performance. The bonds mature on June 15, 2025. The swap will terminate on June 15, 2025 if not previously terminated by JP Morgan Chase. Fair Value: As of June 30, 2010, the swap had a negative fair value of ($31.6 million). This means that if the swap terminated today, the Airport would have to pay this amount to JP Morgan Chase. Risk: As of June 30, 2010, the Airport was not exposed to credit risk because the swap had a negative fair value. Should interest rates change and the fair value of the swap become positive, the Airport would be ex-posed to credit risk in the amount of the swap’s fair value. In addition, the Airport is subject to basis risk should the relationship between SIFMA and the bonds change; if SIFMA resets at a rate below the variable bond rate, the synthetic interest rate will be greater than anticipated. The swap includes an additional termination event based on downgrades in credit ratings. The swap may be terminated by the Airport if JP Morgan’s ratings fall below A- or A3, or by JP Morgan Chase if the Airport’s ratings fall below BBB or Baa2. No termination event based on the Airport’s ratings can occur as long as National Public Finance Guarantee Corporation (formerly MBIA) is rated at least A- or A3. As of June 30, 2010, the rates were:
Terms Rates
Interest Rate Swap
Fixed payment to JPMorgan under swap Fixed 5.64975 %
Variable payment from JPMorgan under swap SIFMA (0.25000) %
Net interest rate swap payments 5.39975 %
Variable Rate bond coupon payments Weekly resets 0.22 %
Synthetic interest rate on bonds 5.61975 % Swap payments and associated debt: As of June 30, 2010, debt service requirements of the variable-rate debt and net swap payments for their term, assuming current interest rates remain the same, were as follows.
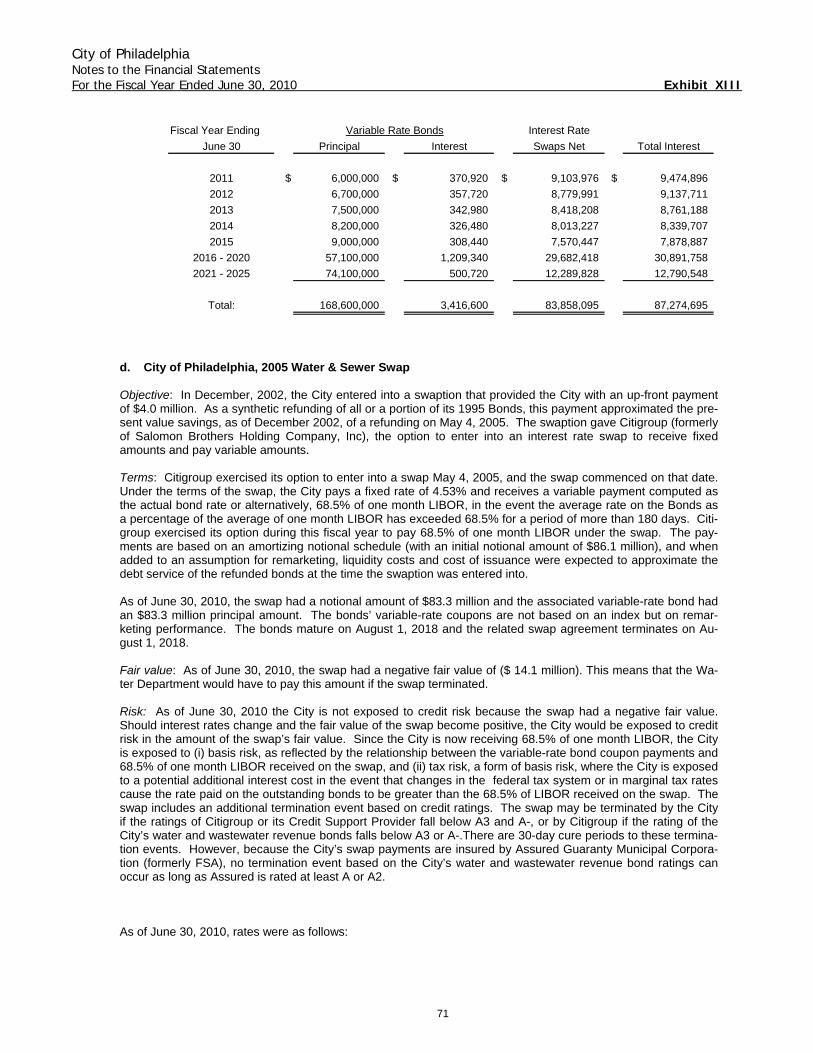
City of Philadelphia Notes to the Financial Statements For the Fiscal Year Ended June 30, 2010 Exhibit XIII
71
Fiscal Year Ending Variable Rate Bonds Interest Rate
June 30 Principal Interest Swaps Net Total Interest
2011 $ 6,000,000 $ 370,920 $ 9,103,976 $ 9,474,896
2012 6,700,000 357,720 8,779,991 9,137,711
2013 7,500,000 342,980 8,418,208 8,761,188
2014 8,200,000 326,480 8,013,227 8,339,707
2015 9,000,000 308,440 7,570,447 7,878,887
2016 - 2020 57,100,000 1,209,340 29,682,418 30,891,758
2021 - 2025 74,100,000 500,720 12,289,828 12,790,548
Total: 168,600,000 3,416,600 83,858,095 87,274,695
d. City of Philadelphia, 2005 Water & Sewer Swap
Objective: In December, 2002, the City entered into a swaption that provided the City with an up-front payment of $4.0 million. As a synthetic refunding of all or a portion of its 1995 Bonds, this payment approximated the pre-sent value savings, as of December 2002, of a refunding on May 4, 2005. The swaption gave Citigroup (formerly of Salomon Brothers Holding Company, Inc), the option to enter into an interest rate swap to receive fixed amounts and pay variable amounts. Terms: Citigroup exercised its option to enter into a swap May 4, 2005, and the swap commenced on that date. Under the terms of the swap, the City pays a fixed rate of 4.53% and receives a variable payment computed as the actual bond rate or alternatively, 68.5% of one month LIBOR, in the event the average rate on the Bonds as a percentage of the average of one month LIBOR has exceeded 68.5% for a period of more than 180 days. Citi-group exercised its option during this fiscal year to pay 68.5% of one month LIBOR under the swap. The pay-ments are based on an amortizing notional schedule (with an initial notional amount of $86.1 million), and when added to an assumption for remarketing, liquidity costs and cost of issuance were expected to approximate the debt service of the refunded bonds at the time the swaption was entered into. As of June 30, 2010, the swap had a notional amount of $83.3 million and the associated variable-rate bond had an $83.3 million principal amount. The bonds’ variable-rate coupons are not based on an index but on remar-keting performance. The bonds mature on August 1, 2018 and the related swap agreement terminates on Au-gust 1, 2018. Fair value: As of June 30, 2010, the swap had a negative fair value of ($ 14.1 million). This means that the Wa-ter Department would have to pay this amount if the swap terminated. Risk: As of June 30, 2010 the City is not exposed to credit risk because the swap had a negative fair value. Should interest rates change and the fair value of the swap become positive, the City would be exposed to credit risk in the amount of the swap’s fair value. Since the City is now receiving 68.5% of one month LIBOR, the City is exposed to (i) basis risk, as reflected by the relationship between the variable-rate bond coupon payments and 68.5% of one month LIBOR received on the swap, and (ii) tax risk, a form of basis risk, where the City is exposed to a potential additional interest cost in the event that changes in the federal tax system or in marginal tax rates cause the rate paid on the outstanding bonds to be greater than the 68.5% of LIBOR received on the swap. The swap includes an additional termination event based on credit ratings. The swap may be terminated by the City if the ratings of Citigroup or its Credit Support Provider fall below A3 and A-, or by Citigroup if the rating of the City’s water and wastewater revenue bonds falls below A3 or A-.There are 30-day cure periods to these termina-tion events. However, because the City’s swap payments are insured by Assured Guaranty Municipal Corpora-tion (formerly FSA), no termination event based on the City’s water and wastewater revenue bond ratings can occur as long as Assured is rated at least A or A2. As of June 30, 2010, rates were as follows:
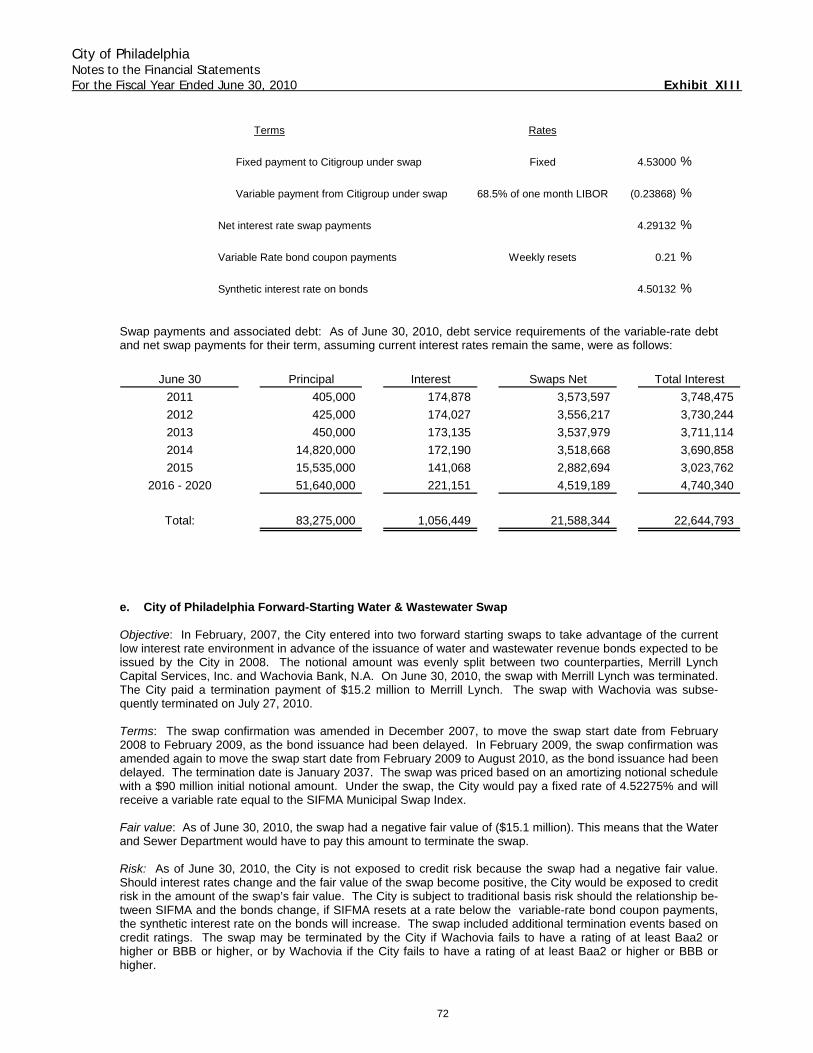
City of Philadelphia Notes to the Financial Statements For the Fiscal Year Ended June 30, 2010 Exhibit XIII
72
Terms Rates
Fixed payment to Citigroup under swap Fixed 4.53000 %
Variable payment from Citigroup under swap 68.5% of one month LIBOR (0.23868) %
Net interest rate swap payments 4.29132 %
Variable Rate bond coupon payments Weekly resets 0.21 %
Synthetic interest rate on bonds 4.50132 % Swap payments and associated debt: As of June 30, 2010, debt service requirements of the variable-rate debt and net swap payments for their term, assuming current interest rates remain the same, were as follows:
June 30 Principal Interest Swaps Net Total Interest
2011 405,000 174,878 3,573,597 3,748,475
2012 425,000 174,027 3,556,217 3,730,244
2013 450,000 173,135 3,537,979 3,711,114
2014 14,820,000 172,190 3,518,668 3,690,858
2015 15,535,000 141,068 2,882,694 3,023,762
2016 - 2020 51,640,000 221,151 4,519,189 4,740,340
Total: 83,275,000 1,056,449 21,588,344 22,644,793
e. City of Philadelphia Forward-Starting Water & Wastewater Swap Objective: In February, 2007, the City entered into two forward starting swaps to take advantage of the current low interest rate environment in advance of the issuance of water and wastewater revenue bonds expected to be issued by the City in 2008. The notional amount was evenly split between two counterparties, Merrill Lynch Capital Services, Inc. and Wachovia Bank, N.A. On June 30, 2010, the swap with Merrill Lynch was terminated. The City paid a termination payment of $15.2 million to Merrill Lynch. The swap with Wachovia was subse-quently terminated on July 27, 2010. Terms: The swap confirmation was amended in December 2007, to move the swap start date from February 2008 to February 2009, as the bond issuance had been delayed. In February 2009, the swap confirmation was amended again to move the swap start date from February 2009 to August 2010, as the bond issuance had been delayed. The termination date is January 2037. The swap was priced based on an amortizing notional schedule with a $90 million initial notional amount. Under the swap, the City would pay a fixed rate of 4.52275% and will receive a variable rate equal to the SIFMA Municipal Swap Index. Fair value: As of June 30, 2010, the swap had a negative fair value of ($15.1 million). This means that the Water and Sewer Department would have to pay this amount to terminate the swap. Risk: As of June 30, 2010, the City is not exposed to credit risk because the swap had a negative fair value. Should interest rates change and the fair value of the swap become positive, the City would be exposed to credit risk in the amount of the swap’s fair value. The City is subject to traditional basis risk should the relationship be-tween SIFMA and the bonds change, if SIFMA resets at a rate below the variable-rate bond coupon payments, the synthetic interest rate on the bonds will increase. The swap included additional termination events based on credit ratings. The swap may be terminated by the City if Wachovia fails to have a rating of at least Baa2 or higher or BBB or higher, or by Wachovia if the City fails to have a rating of at least Baa2 or higher or BBB or higher.
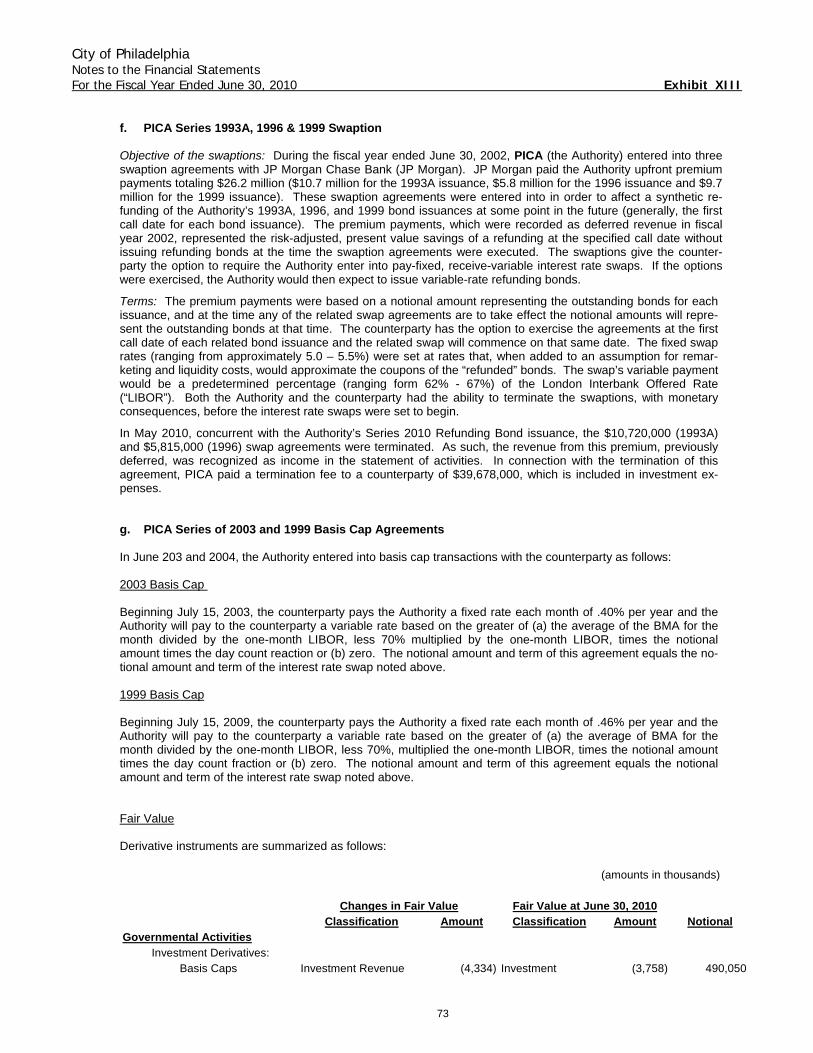
City of Philadelphia Notes to the Financial Statements For the Fiscal Year Ended June 30, 2010 Exhibit XIII
73
f. PICA Series 1993A, 1996 & 1999 Swaption
Objective of the swaptions: During the fiscal year ended June 30, 2002, PICA (the Authority) entered into three swaption agreements with JP Morgan Chase Bank (JP Morgan). JP Morgan paid the Authority upfront premium payments totaling $26.2 million ($10.7 million for the 1993A issuance, $5.8 million for the 1996 issuance and $9.7 million for the 1999 issuance). These swaption agreements were entered into in order to affect a synthetic re-funding of the Authority’s 1993A, 1996, and 1999 bond issuances at some point in the future (generally, the first call date for each bond issuance). The premium payments, which were recorded as deferred revenue in fiscal year 2002, represented the risk-adjusted, present value savings of a refunding at the specified call date without issuing refunding bonds at the time the swaption agreements were executed. The swaptions give the counter-party the option to require the Authority enter into pay-fixed, receive-variable interest rate swaps. If the options were exercised, the Authority would then expect to issue variable-rate refunding bonds.
Terms: The premium payments were based on a notional amount representing the outstanding bonds for each issuance, and at the time any of the related swap agreements are to take effect the notional amounts will repre-sent the outstanding bonds at that time. The counterparty has the option to exercise the agreements at the first call date of each related bond issuance and the related swap will commence on that same date. The fixed swap rates (ranging from approximately 5.0 – 5.5%) were set at rates that, when added to an assumption for remar-keting and liquidity costs, would approximate the coupons of the “refunded” bonds. The swap’s variable payment would be a predetermined percentage (ranging form 62% - 67%) of the London Interbank Offered Rate (“LIBOR”). Both the Authority and the counterparty had the ability to terminate the swaptions, with monetary consequences, before the interest rate swaps were set to begin.
In May 2010, concurrent with the Authority’s Series 2010 Refunding Bond issuance, the $10,720,000 (1993A) and $5,815,000 (1996) swap agreements were terminated. As such, the revenue from this premium, previously deferred, was recognized as income in the statement of activities. In connection with the termination of this agreement, PICA paid a termination fee to a counterparty of $39,678,000, which is included in investment ex-penses. g. PICA Series of 2003 and 1999 Basis Cap Agreements In June 203 and 2004, the Authority entered into basis cap transactions with the counterparty as follows: 2003 Basis Cap Beginning July 15, 2003, the counterparty pays the Authority a fixed rate each month of .40% per year and the Authority will pay to the counterparty a variable rate based on the greater of (a) the average of the BMA for the month divided by the one-month LIBOR, less 70% multiplied by the one-month LIBOR, times the notional amount times the day count reaction or (b) zero. The notional amount and term of this agreement equals the no-tional amount and term of the interest rate swap noted above. 1999 Basis Cap Beginning July 15, 2009, the counterparty pays the Authority a fixed rate each month of .46% per year and the Authority will pay to the counterparty a variable rate based on the greater of (a) the average of BMA for the month divided by the one-month LIBOR, less 70%, multiplied the one-month LIBOR, times the notional amount times the day count fraction or (b) zero. The notional amount and term of this agreement equals the notional amount and term of the interest rate swap noted above. Fair Value Derivative instruments are summarized as follows:
(amounts in thousands)
Classification Amount Classification Amount NotionalGovernmental Activities
Investment Derivatives:Basis Caps Investment Revenue (4,334) Investment (3,758) 490,050
Changes in Fair Value Fair Value at June 30, 2010
City of Philadelphia Notes to the Financial Statements For the Fiscal Year Ended June 30, 2010 Exhibit XIII
74
h. City of Philadelphia 2003 Water & Sewer Swap Objective: In December 2002, the City entered into a swaption that provided the City’s Water and Sewer De-partment with an up-front payment of $25.0 million. The original notional amount was $381.3 million. As a syn-thetic refunding of all or a portion of its 1993 Bonds, this payment approximated the present value savings, as of December 2002 of a refunding on March 18 2003, based upon interest rates in effect at the time. The swaption gave Citigroup (formerly Salomon Brothers Holding Company, Inc), the option to enter into an interest rate swap to receive fixed amounts and pay variable amounts. On April 8, 2010, the City terminated the swap and re-funded the underlying bonds to fixed rate. The City paid a swap termination payment of $48.8 million to Citi-group.
(7) Pension Service Agreement In Fiscal 1999, the Philadelphia Authority for Industrial Development issued $1.3 billion in Pension Funding Bonds. These bonds were issued pursuant to the provisions of the Pennsylvania Economic Development Financ-ing Law and the Municipal Pension Plan Funding Standard and Recovery Act (Act 205). The bonds are special and limited obligations of PAID. The City entered into a Service Agreement with PAID agreeing to make yearly payments equal to the debt service on the bonds. PAID assigned its interest in the service agreement to the par-ties providing the financing and in accordance with GASB Interpretation #2, PAID treats this as conduit debt and does not include conduit debt transactions in its financial statements. The Pension Service Agreement of $1.4 billion is reflected in the City’s financial statements in Other Long Term Obligations. The net proceeds of the bond sale of $1.3 billion were deposited with the Municipal Pension Fund. The deposit of the proceeds reduced the Unfunded Actuarial Accrued Liability by that same amount. The deposit resulted in reductions to the City’s actuarially determined pension plan payments.
(8) Neighborhood Transformation Initiative Service Agreement In Fiscal 2002, RDA issued $142.6 million in City of Philadelphia Neighborhood Transformation Initiative (NTI) Bonds. These bonds were issued to finance a portion of the initiative undertaken by the Authority and the City to revitalize, renew and redevelop blighted areas of the City. The bonds are obligations of RDA. The City entered into a service agreement with RDA, agreeing to make yearly payments equal to the debt service on the bonds. RDA assigned its interest in the service agreement to the parties providing the financing and in accordance with GASB Interpretation #2; RDA treats this as conduit debt and therefore does not include these transactions on its financial statements. In Fiscal 2004, RDA issued a $30.0 million City of Philadelphia NTI Taxable Revenue Bond. The RDA and the City plan to borrow a taxable bank line of credit (the 2003 Bond) to fund certain costs of the NTI related to the acquisition of property. The line of credit is being issued in anticipation of future long term financing. This will al-low the City and RDA to better manage the carrying costs of unspent loan proceeds and to possibly issue a por-tion of the take out financing as tax exempt bonds after obtaining certain state approvals. In March, 2005, RDA issued additional City of Philadelphia Neighborhood Transformation Initiative (NTI) bonds to finance a portion of the initiative previously undertaken by the Authority and the City. Taxable Revenue Bonds Series 2005A issued in the amount of $25.5 million are term bonds with interest rates ranging from 4.150% to 4.680% maturing through 2016. Qualified Revenue Bonds Series 2005B were issued in the amount of $ 44.0 million, with interest rates ranging from 4.75 through 5% and mature through 2027. Revenue Bonds Series 2005C with an interest rate of 5% were issued for $81.3 million and mature through 2031. The fiscal year 2010 NTI Service Agreement liability of $252.7 million is reflected in the City’s financial statements as another Long Term Obligation.
(9) Sports Stadium Financing Agreement In FY 2002, PAID issued $346.8 million in Lease Revenue Bonds Series A and B of 2001 to be used to help fi-nance the construction of two new sports stadiums. The bonds are special limited obligations of PAID. The City entered into a series of lease agreements as lessee to the Authority. The lease agreements are known as (1) the Veterans Stadium Sublease, (2) the Phillies’ Prime Lease and (3) the Eagles Prime Lease. PAID assigned its in-terest in the lease agreements to the parties providing the financing and in accordance with GASB Interpretation #2, PAID treats this as conduit debt and therefore does not include these transactions on its financial statements. In October, 2007 PAID issued Lease Revenue Refunding Bonds Series A and B of 2007. The proceeds from the bonds were used to refund the Series 2001B Stadium Bonds. PAID assigned its interest in the lease agree-ments to the parties providing the financing and in accordance with GASB Interpretation #2, PAID treats this as conduit debt and therefore does not include these transactions on its financial statements. In fiscal 2010, the
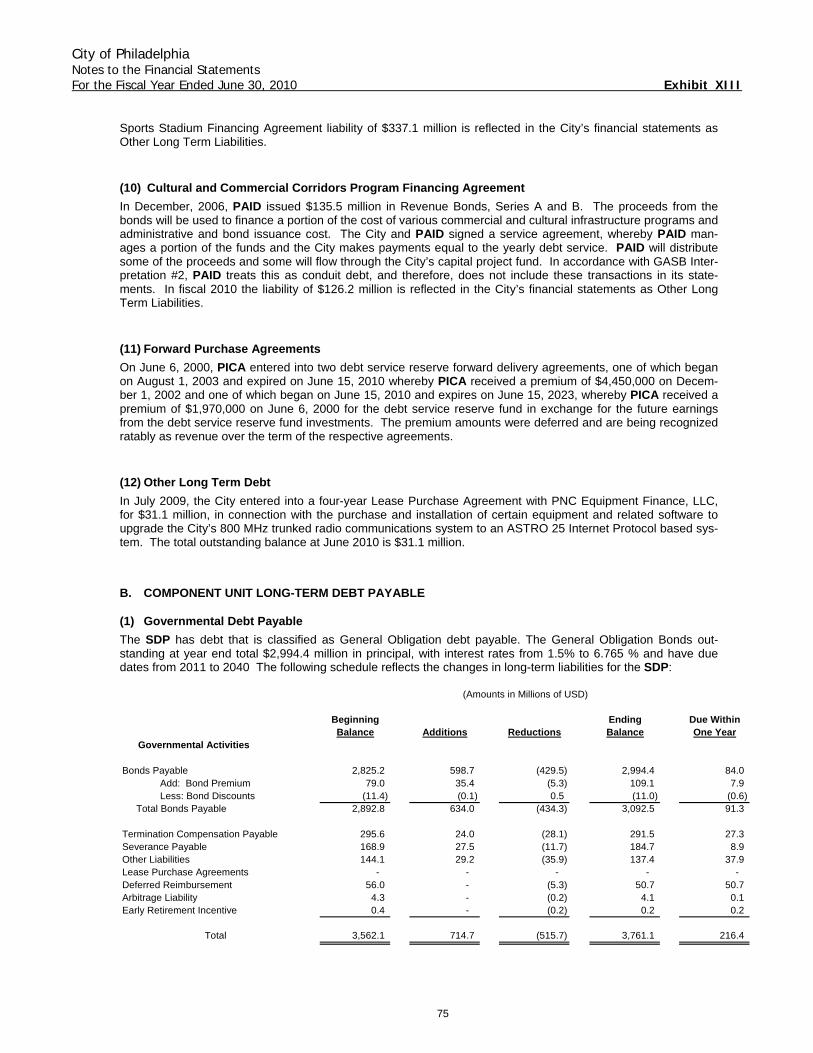
City of Philadelphia Notes to the Financial Statements For the Fiscal Year Ended June 30, 2010 Exhibit XIII
75
Sports Stadium Financing Agreement liability of $337.1 million is reflected in the City’s financial statements as Other Long Term Liabilities.
(10) Cultural and Commercial Corridors Program Financing Agreement In December, 2006, PAID issued $135.5 million in Revenue Bonds, Series A and B. The proceeds from the bonds will be used to finance a portion of the cost of various commercial and cultural infrastructure programs and administrative and bond issuance cost. The City and PAID signed a service agreement, whereby PAID man-ages a portion of the funds and the City makes payments equal to the yearly debt service. PAID will distribute some of the proceeds and some will flow through the City’s capital project fund. In accordance with GASB Inter-pretation #2, PAID treats this as conduit debt, and therefore, does not include these transactions in its state-ments. In fiscal 2010 the liability of $126.2 million is reflected in the City’s financial statements as Other Long Term Liabilities.
(11) Forward Purchase Agreements On June 6, 2000, PICA entered into two debt service reserve forward delivery agreements, one of which began on August 1, 2003 and expired on June 15, 2010 whereby PICA received a premium of $4,450,000 on Decem-ber 1, 2002 and one of which began on June 15, 2010 and expires on June 15, 2023, whereby PICA received a premium of $1,970,000 on June 6, 2000 for the debt service reserve fund in exchange for the future earnings from the debt service reserve fund investments. The premium amounts were deferred and are being recognized ratably as revenue over the term of the respective agreements.
(12) Other Long Term Debt In July 2009, the City entered into a four-year Lease Purchase Agreement with PNC Equipment Finance, LLC, for $31.1 million, in connection with the purchase and installation of certain equipment and related software to upgrade the City’s 800 MHz trunked radio communications system to an ASTRO 25 Internet Protocol based sys-tem. The total outstanding balance at June 2010 is $31.1 million.
B. COMPONENT UNIT LONG-TERM DEBT PAYABLE
(1) Governmental Debt Payable The SDP has debt that is classified as General Obligation debt payable. The General Obligation Bonds out-standing at year end total $2,994.4 million in principal, with interest rates from 1.5% to 6.765 % and have due dates from 2011 to 2040 The following schedule reflects the changes in long-term liabilities for the SDP:
(Amounts in Millions of USD)
Beginning Ending Due WithinBalance Additions Reductions Balance One Year
Governmental Activities
Bonds Payable 2,825.2 598.7 (429.5) 2,994.4 84.0 Add: Bond Premium 79.0 35.4 (5.3) 109.1 7.9 Less: Bond Discounts (11.4) (0.1) 0.5 (11.0) (0.6)
Total Bonds Payable 2,892.8 634.0 (434.3) 3,092.5 91.3
Termination Compensation Payable 295.6 24.0 (28.1) 291.5 27.3 Severance Payable 168.9 27.5 (11.7) 184.7 8.9 Other Liabilities 144.1 29.2 (35.9) 137.4 37.9 Lease Purchase Agreements - - - - - Deferred Reimbursement 56.0 - (5.3) 50.7 50.7 Arbitrage Liability 4.3 - (0.2) 4.1 0.1 Early Retirement Incentive 0.4 - (0.2) 0.2 0.2
Total 3,562.1 714.7 (515.7) 3,761.1 216.4
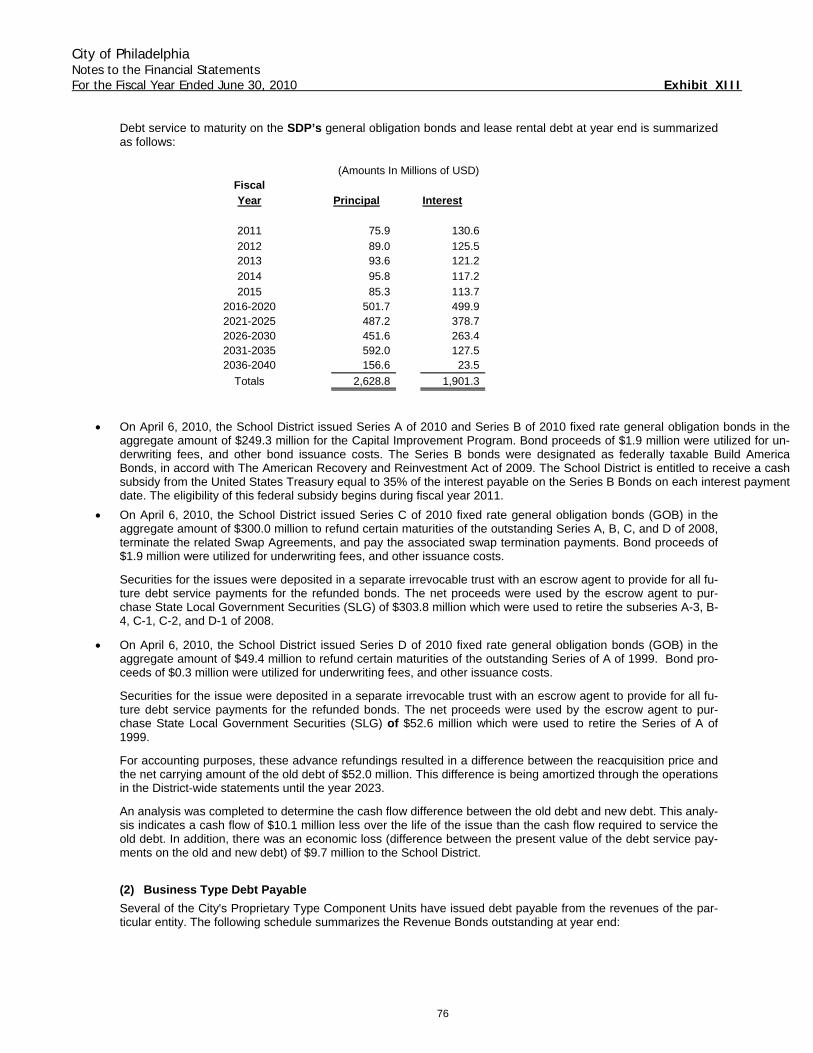
City of Philadelphia Notes to the Financial Statements For the Fiscal Year Ended June 30, 2010 Exhibit XIII
76
Debt service to maturity on the SDP’s general obligation bonds and lease rental debt at year end is summarized as follows:
(Amounts In Millions of USD)FiscalYear Principal Interest
2011 75.9 130.6
2012 89.0 125.5 2013 93.6 121.2
2014 95.8 117.2
2015 85.3 113.7 2016-2020 501.7 499.9 2021-2025 487.2 378.7 2026-2030 451.6 263.4 2031-2035 592.0 127.5 2036-2040 156.6 23.5
Totals 2,628.8 1,901.3
• On April 6, 2010, the School District issued Series A of 2010 and Series B of 2010 fixed rate general obligation bonds in the aggregate amount of $249.3 million for the Capital Improvement Program. Bond proceeds of $1.9 million were utilized for un-derwriting fees, and other bond issuance costs. The Series B bonds were designated as federally taxable Build America Bonds, in accord with The American Recovery and Reinvestment Act of 2009. The School District is entitled to receive a cash subsidy from the United States Treasury equal to 35% of the interest payable on the Series B Bonds on each interest payment date. The eligibility of this federal subsidy begins during fiscal year 2011.
• On April 6, 2010, the School District issued Series C of 2010 fixed rate general obligation bonds (GOB) in the aggregate amount of $300.0 million to refund certain maturities of the outstanding Series A, B, C, and D of 2008, terminate the related Swap Agreements, and pay the associated swap termination payments. Bond proceeds of $1.9 million were utilized for underwriting fees, and other issuance costs.
Securities for the issues were deposited in a separate irrevocable trust with an escrow agent to provide for all fu-ture debt service payments for the refunded bonds. The net proceeds were used by the escrow agent to pur-chase State Local Government Securities (SLG) of $303.8 million which were used to retire the subseries A-3, B-4, C-1, C-2, and D-1 of 2008.
• On April 6, 2010, the School District issued Series D of 2010 fixed rate general obligation bonds (GOB) in the aggregate amount of $49.4 million to refund certain maturities of the outstanding Series of A of 1999. Bond pro-ceeds of $0.3 million were utilized for underwriting fees, and other issuance costs.
Securities for the issue were deposited in a separate irrevocable trust with an escrow agent to provide for all fu-ture debt service payments for the refunded bonds. The net proceeds were used by the escrow agent to pur-chase State Local Government Securities (SLG) of $52.6 million which were used to retire the Series of A of 1999.
For accounting purposes, these advance refundings resulted in a difference between the reacquisition price and the net carrying amount of the old debt of $52.0 million. This difference is being amortized through the operations in the District-wide statements until the year 2023.
An analysis was completed to determine the cash flow difference between the old debt and new debt. This analy-sis indicates a cash flow of $10.1 million less over the life of the issue than the cash flow required to service the old debt. In addition, there was an economic loss (difference between the present value of the debt service pay-ments on the old and new debt) of $9.7 million to the School District.
(2) Business Type Debt Payable Several of the City's Proprietary Type Component Units have issued debt payable from the revenues of the par-ticular entity. The following schedule summarizes the Revenue Bonds outstanding at year end:
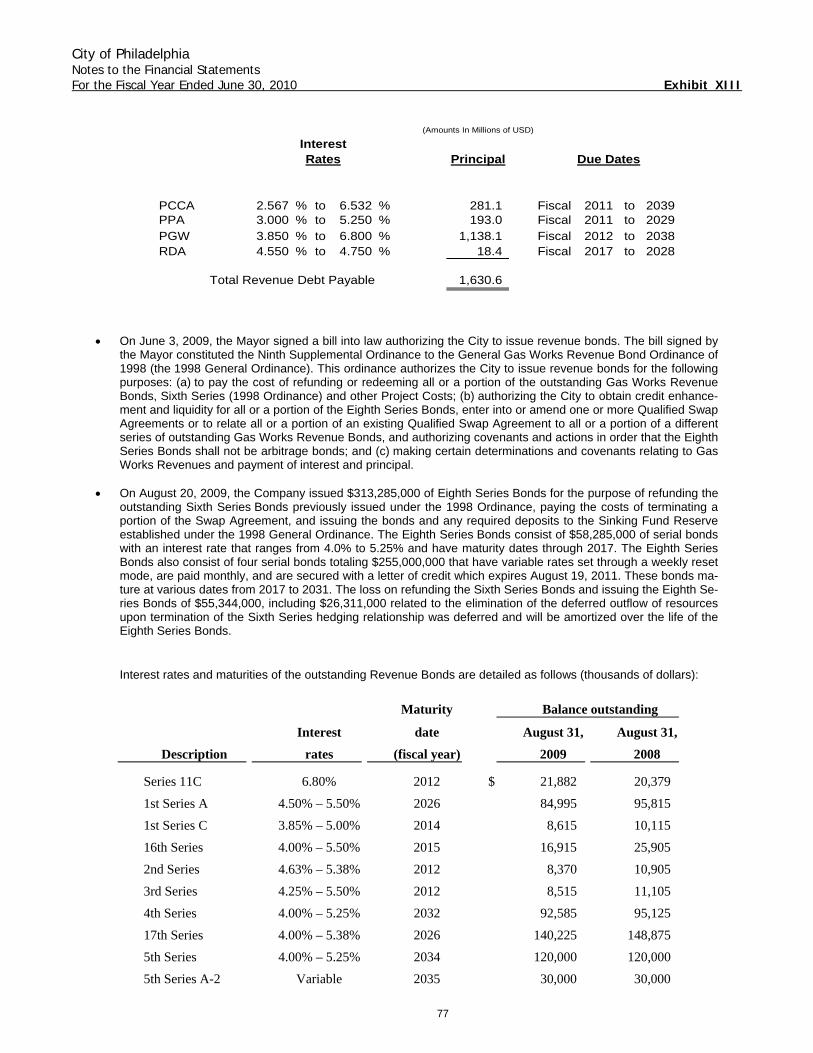
City of Philadelphia Notes to the Financial Statements For the Fiscal Year Ended June 30, 2010 Exhibit XIII
77
(Amounts In Millions of USD)
InterestRates Principal Due Dates
PCCA 2.567 % to 6.532 % 281.1 Fiscal 2011 to 2039PPA 3.000 % to 5.250 % 193.0 Fiscal 2011 to 2029PGW 3.850 % to 6.800 % 1,138.1 Fiscal 2012 to 2038RDA 4.550 % to 4.750 % 18.4 Fiscal 2017 to 2028
Total Revenue Debt Payable 1,630.6
• On June 3, 2009, the Mayor signed a bill into law authorizing the City to issue revenue bonds. The bill signed by
the Mayor constituted the Ninth Supplemental Ordinance to the General Gas Works Revenue Bond Ordinance of 1998 (the 1998 General Ordinance). This ordinance authorizes the City to issue revenue bonds for the following purposes: (a) to pay the cost of refunding or redeeming all or a portion of the outstanding Gas Works Revenue Bonds, Sixth Series (1998 Ordinance) and other Project Costs; (b) authorizing the City to obtain credit enhance-ment and liquidity for all or a portion of the Eighth Series Bonds, enter into or amend one or more Qualified Swap Agreements or to relate all or a portion of an existing Qualified Swap Agreement to all or a portion of a different series of outstanding Gas Works Revenue Bonds, and authorizing covenants and actions in order that the Eighth Series Bonds shall not be arbitrage bonds; and (c) making certain determinations and covenants relating to Gas Works Revenues and payment of interest and principal.
• On August 20, 2009, the Company issued $313,285,000 of Eighth Series Bonds for the purpose of refunding the
outstanding Sixth Series Bonds previously issued under the 1998 Ordinance, paying the costs of terminating a portion of the Swap Agreement, and issuing the bonds and any required deposits to the Sinking Fund Reserve established under the 1998 General Ordinance. The Eighth Series Bonds consist of $58,285,000 of serial bonds with an interest rate that ranges from 4.0% to 5.25% and have maturity dates through 2017. The Eighth Series Bonds also consist of four serial bonds totaling $255,000,000 that have variable rates set through a weekly reset mode, are paid monthly, and are secured with a letter of credit which expires August 19, 2011. These bonds ma-ture at various dates from 2017 to 2031. The loss on refunding the Sixth Series Bonds and issuing the Eighth Se-ries Bonds of $55,344,000, including $26,311,000 related to the elimination of the deferred outflow of resources upon termination of the Sixth Series hedging relationship was deferred and will be amortized over the life of the Eighth Series Bonds.
Interest rates and maturities of the outstanding Revenue Bonds are detailed as follows (thousands of dollars):
Maturity Balance outstanding
Interest date August 31, August 31,
Description rates (fiscal year) 2009 2008
Series 11C 6.80% 2012 $ 21,882 20,379
1st Series A 4.50% – 5.50% 2026 84,995 95,815
1st Series C 3.85% – 5.00% 2014 8,615 10,115
16th Series 4.00% – 5.50% 2015 16,915 25,905
2nd Series 4.63% – 5.38% 2012 8,370 10,905
3rd Series 4.25% – 5.50% 2012 8,515 11,105
4th Series 4.00% – 5.25% 2032 92,585 95,125
17th Series 4.00% – 5.38% 2026 140,225 148,875
5th Series 4.00% – 5.25% 2034 120,000 120,000
5th Series A-2 Variable 2035 30,000 30,000
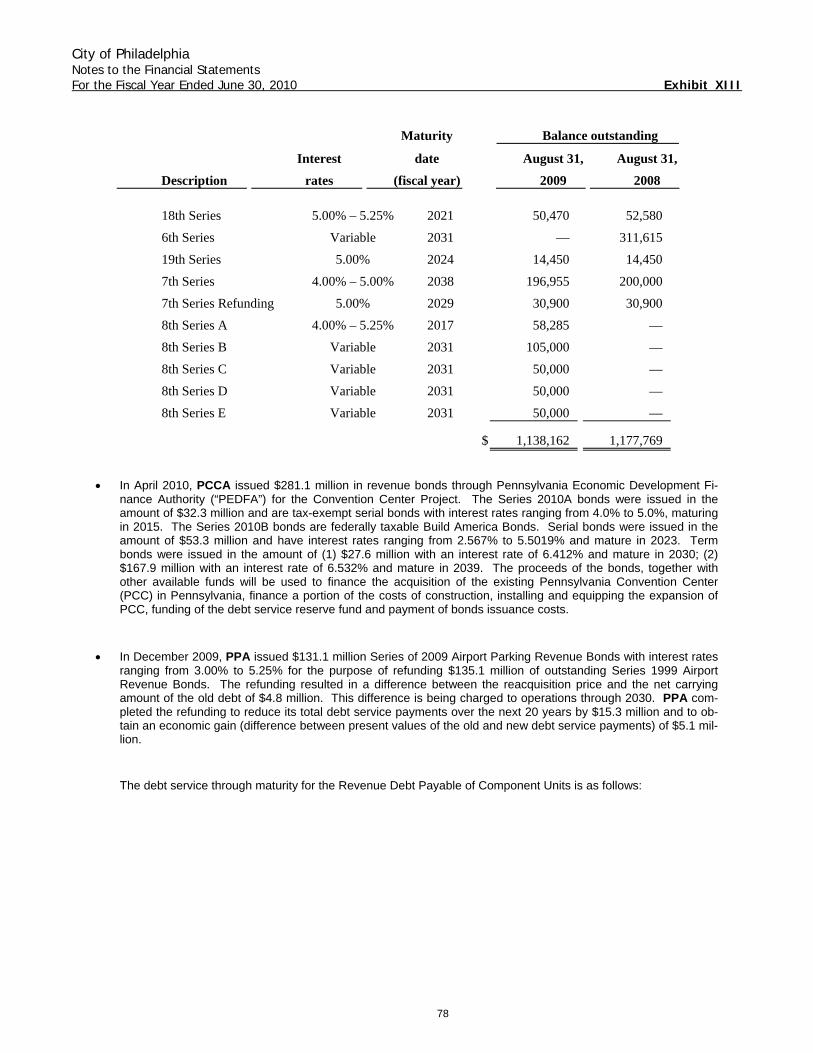
City of Philadelphia Notes to the Financial Statements For the Fiscal Year Ended June 30, 2010 Exhibit XIII
78
Maturity Balance outstanding
Interest date August 31, August 31,
Description rates (fiscal year) 2009 2008
18th Series 5.00% – 5.25% 2021 50,470 52,580
6th Series Variable 2031 — 311,615
19th Series 5.00% 2024 14,450 14,450
7th Series 4.00% – 5.00% 2038 196,955 200,000
7th Series Refunding 5.00% 2029 30,900 30,900
8th Series A 4.00% – 5.25% 2017 58,285 —
8th Series B Variable 2031 105,000 —
8th Series C Variable 2031 50,000 —
8th Series D Variable 2031 50,000 —
8th Series E Variable 2031 50,000 —
$ 1,138,162 1,177,769
• In April 2010, PCCA issued $281.1 million in revenue bonds through Pennsylvania Economic Development Fi-nance Authority (“PEDFA”) for the Convention Center Project. The Series 2010A bonds were issued in the amount of $32.3 million and are tax-exempt serial bonds with interest rates ranging from 4.0% to 5.0%, maturing in 2015. The Series 2010B bonds are federally taxable Build America Bonds. Serial bonds were issued in the amount of $53.3 million and have interest rates ranging from 2.567% to 5.5019% and mature in 2023. Term bonds were issued in the amount of (1) $27.6 million with an interest rate of 6.412% and mature in 2030; (2) $167.9 million with an interest rate of 6.532% and mature in 2039. The proceeds of the bonds, together with other available funds will be used to finance the acquisition of the existing Pennsylvania Convention Center (PCC) in Pennsylvania, finance a portion of the costs of construction, installing and equipping the expansion of PCC, funding of the debt service reserve fund and payment of bonds issuance costs.
• In December 2009, PPA issued $131.1 million Series of 2009 Airport Parking Revenue Bonds with interest rates ranging from 3.00% to 5.25% for the purpose of refunding $135.1 million of outstanding Series 1999 Airport Revenue Bonds. The refunding resulted in a difference between the reacquisition price and the net carrying amount of the old debt of $4.8 million. This difference is being charged to operations through 2030. PPA com-pleted the refunding to reduce its total debt service payments over the next 20 years by $15.3 million and to ob-tain an economic gain (difference between present values of the old and new debt service payments) of $5.1 mil-lion.
The debt service through maturity for the Revenue Debt Payable of Component Units is as follows:
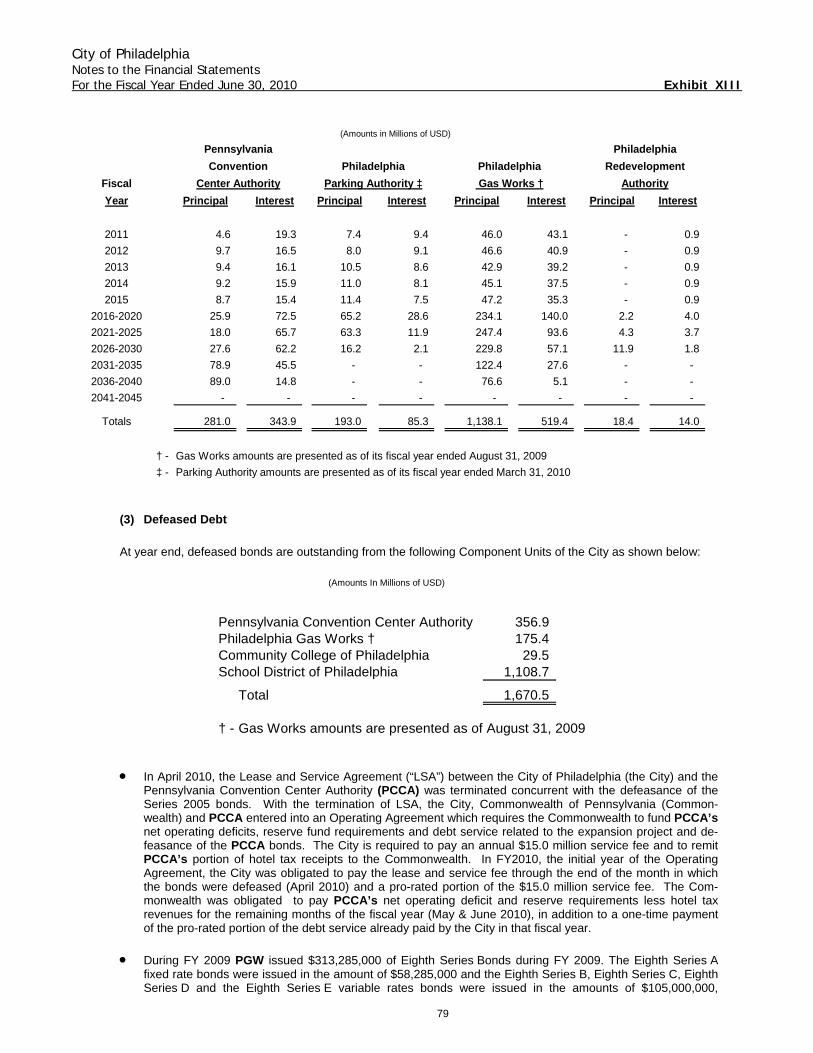
City of Philadelphia Notes to the Financial Statements For the Fiscal Year Ended June 30, 2010 Exhibit XIII
79
(Amounts in Millions of USD)
Pennsylvania PhiladelphiaConvention Philadelphia Philadelphia Redevelopment
Fiscal Center Authority Parking Authority ‡ Gas Works † AuthorityYear Principal Interest Principal Interest Principal Interest Principal Interest
2011 4.6 19.3 7.4 9.4 46.0 43.1 - 0.9
2012 9.7 16.5 8.0 9.1 46.6 40.9 - 0.9
2013 9.4 16.1 10.5 8.6 42.9 39.2 - 0.9
2014 9.2 15.9 11.0 8.1 45.1 37.5 - 0.9
2015 8.7 15.4 11.4 7.5 47.2 35.3 - 0.9
2016-2020 25.9 72.5 65.2 28.6 234.1 140.0 2.2 4.0
2021-2025 18.0 65.7 63.3 11.9 247.4 93.6 4.3 3.7
2026-2030 27.6 62.2 16.2 2.1 229.8 57.1 11.9 1.8
2031-2035 78.9 45.5 - - 122.4 27.6 - -
2036-2040 89.0 14.8 - - 76.6 5.1 - -
2041-2045 - - - - - - - -
Totals 281.0 343.9 193.0 85.3 1,138.1 519.4 18.4 14.0
† - Gas Works amounts are presented as of its fiscal year ended August 31, 2009
‡ - Parking Authority amounts are presented as of its fiscal year ended March 31, 2010
(3) Defeased Debt
At year end, defeased bonds are outstanding from the following Component Units of the City as shown below:
(Amounts In Millions of USD)
Pennsylvania Convention Center Authority 356.9 Philadelphia Gas Works † 175.4 Community College of Philadelphia 29.5 School District of Philadelphia 1,108.7
Total 1,670.5
† - Gas Works amounts are presented as of August 31, 2009
• In April 2010, the Lease and Service Agreement (“LSA”) between the City of Philadelphia (the City) and the Pennsylvania Convention Center Authority (PCCA) was terminated concurrent with the defeasance of the Series 2005 bonds. With the termination of LSA, the City, Commonwealth of Pennsylvania (Common-wealth) and PCCA entered into an Operating Agreement which requires the Commonwealth to fund PCCA’s net operating deficits, reserve fund requirements and debt service related to the expansion project and de-feasance of the PCCA bonds. The City is required to pay an annual $15.0 million service fee and to remit PCCA’s portion of hotel tax receipts to the Commonwealth. In FY2010, the initial year of the Operating Agreement, the City was obligated to pay the lease and service fee through the end of the month in which the bonds were defeased (April 2010) and a pro-rated portion of the $15.0 million service fee. The Com-monwealth was obligated to pay PCCA’s net operating deficit and reserve requirements less hotel tax revenues for the remaining months of the fiscal year (May & June 2010), in addition to a one-time payment of the pro-rated portion of the debt service already paid by the City in that fiscal year.
• During FY 2009 PGW issued $313,285,000 of Eighth Series Bonds during FY 2009. The Eighth Series A fixed rate bonds were issued in the amount of $58,285,000 and the Eighth Series B, Eighth Series C, Eighth Series D and the Eighth Series E variable rates bonds were issued in the amounts of $105,000,000,
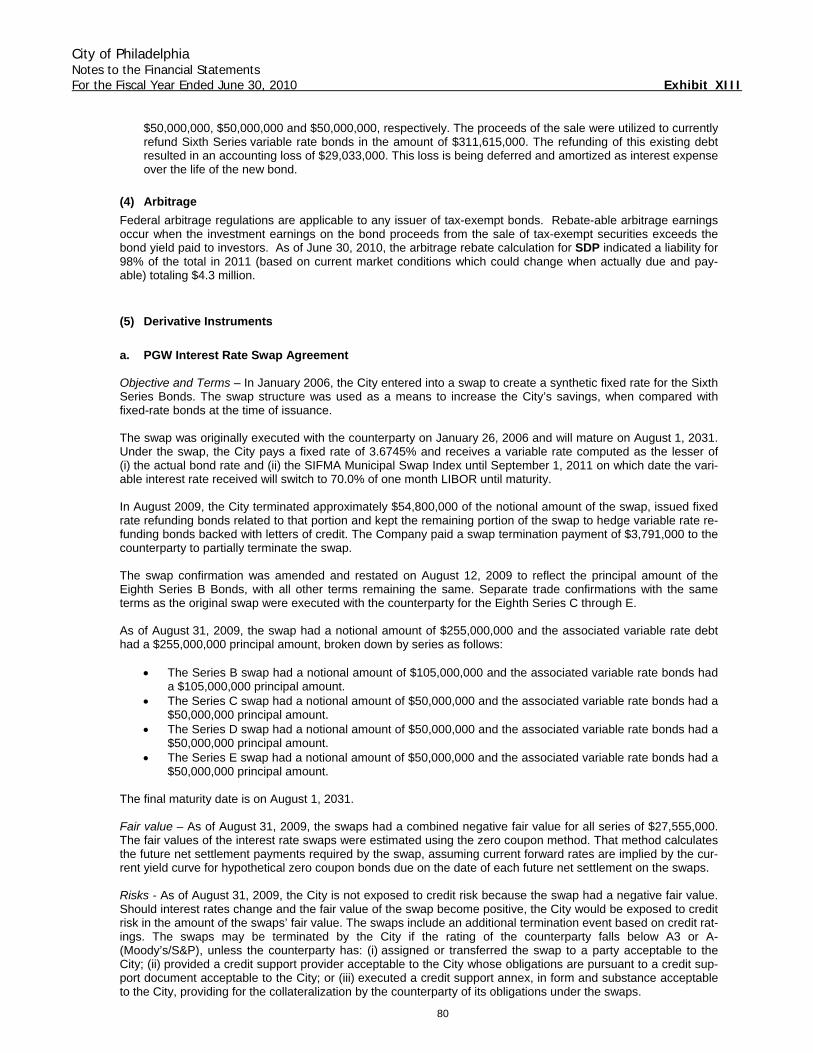
City of Philadelphia Notes to the Financial Statements For the Fiscal Year Ended June 30, 2010 Exhibit XIII
80
$50,000,000, $50,000,000 and $50,000,000, respectively. The proceeds of the sale were utilized to currently refund Sixth Series variable rate bonds in the amount of $311,615,000. The refunding of this existing debt resulted in an accounting loss of $29,033,000. This loss is being deferred and amortized as interest expense over the life of the new bond.
(4) Arbitrage Federal arbitrage regulations are applicable to any issuer of tax-exempt bonds. Rebate-able arbitrage earnings occur when the investment earnings on the bond proceeds from the sale of tax-exempt securities exceeds the bond yield paid to investors. As of June 30, 2010, the arbitrage rebate calculation for SDP indicated a liability for 98% of the total in 2011 (based on current market conditions which could change when actually due and pay-able) totaling $4.3 million. (5) Derivative Instruments a. PGW Interest Rate Swap Agreement Objective and Terms – In January 2006, the City entered into a swap to create a synthetic fixed rate for the Sixth Series Bonds. The swap structure was used as a means to increase the City’s savings, when compared with fixed-rate bonds at the time of issuance. The swap was originally executed with the counterparty on January 26, 2006 and will mature on August 1, 2031. Under the swap, the City pays a fixed rate of 3.6745% and receives a variable rate computed as the lesser of (i) the actual bond rate and (ii) the SIFMA Municipal Swap Index until September 1, 2011 on which date the vari-able interest rate received will switch to 70.0% of one month LIBOR until maturity. In August 2009, the City terminated approximately $54,800,000 of the notional amount of the swap, issued fixed rate refunding bonds related to that portion and kept the remaining portion of the swap to hedge variable rate re-funding bonds backed with letters of credit. The Company paid a swap termination payment of $3,791,000 to the counterparty to partially terminate the swap. The swap confirmation was amended and restated on August 12, 2009 to reflect the principal amount of the Eighth Series B Bonds, with all other terms remaining the same. Separate trade confirmations with the same terms as the original swap were executed with the counterparty for the Eighth Series C through E. As of August 31, 2009, the swap had a notional amount of $255,000,000 and the associated variable rate debt had a $255,000,000 principal amount, broken down by series as follows:
• The Series B swap had a notional amount of $105,000,000 and the associated variable rate bonds had a $105,000,000 principal amount.
• The Series C swap had a notional amount of $50,000,000 and the associated variable rate bonds had a $50,000,000 principal amount.
• The Series D swap had a notional amount of $50,000,000 and the associated variable rate bonds had a $50,000,000 principal amount.
• The Series E swap had a notional amount of $50,000,000 and the associated variable rate bonds had a $50,000,000 principal amount.
The final maturity date is on August 1, 2031. Fair value – As of August 31, 2009, the swaps had a combined negative fair value for all series of $27,555,000. The fair values of the interest rate swaps were estimated using the zero coupon method. That method calculates the future net settlement payments required by the swap, assuming current forward rates are implied by the cur-rent yield curve for hypothetical zero coupon bonds due on the date of each future net settlement on the swaps. Risks - As of August 31, 2009, the City is not exposed to credit risk because the swap had a negative fair value. Should interest rates change and the fair value of the swap become positive, the City would be exposed to credit risk in the amount of the swaps’ fair value. The swaps include an additional termination event based on credit rat-ings. The swaps may be terminated by the City if the rating of the counterparty falls below A3 or A- (Moody’s/S&P), unless the counterparty has: (i) assigned or transferred the swap to a party acceptable to the City; (ii) provided a credit support provider acceptable to the City whose obligations are pursuant to a credit sup-port document acceptable to the City; or (iii) executed a credit support annex, in form and substance acceptable to the City, providing for the collateralization by the counterparty of its obligations under the swaps.
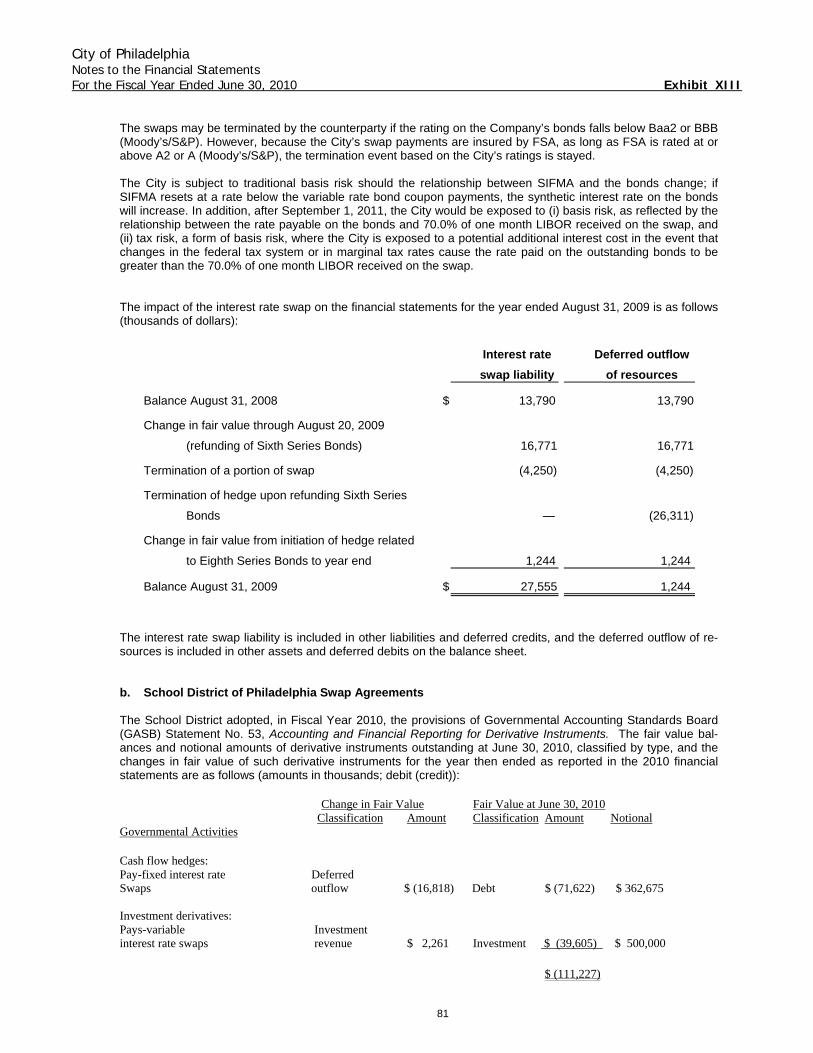
City of Philadelphia Notes to the Financial Statements For the Fiscal Year Ended June 30, 2010 Exhibit XIII
81
The swaps may be terminated by the counterparty if the rating on the Company’s bonds falls below Baa2 or BBB (Moody’s/S&P). However, because the City’s swap payments are insured by FSA, as long as FSA is rated at or above A2 or A (Moody’s/S&P), the termination event based on the City’s ratings is stayed. The City is subject to traditional basis risk should the relationship between SIFMA and the bonds change; if SIFMA resets at a rate below the variable rate bond coupon payments, the synthetic interest rate on the bonds will increase. In addition, after September 1, 2011, the City would be exposed to (i) basis risk, as reflected by the relationship between the rate payable on the bonds and 70.0% of one month LIBOR received on the swap, and (ii) tax risk, a form of basis risk, where the City is exposed to a potential additional interest cost in the event that changes in the federal tax system or in marginal tax rates cause the rate paid on the outstanding bonds to be greater than the 70.0% of one month LIBOR received on the swap. The impact of the interest rate swap on the financial statements for the year ended August 31, 2009 is as follows (thousands of dollars):
Interest rate Deferred outflow swap liability of resources
Balance August 31, 2008 $ 13,790 13,790
Change in fair value through August 20, 2009
(refunding of Sixth Series Bonds) 16,771 16,771
Termination of a portion of swap (4,250) (4,250)
Termination of hedge upon refunding Sixth Series
Bonds — (26,311)
Change in fair value from initiation of hedge related
to Eighth Series Bonds to year end 1,244 1,244
Balance August 31, 2009 $ 27,555 1,244
The interest rate swap liability is included in other liabilities and deferred credits, and the deferred outflow of re-sources is included in other assets and deferred debits on the balance sheet. b. School District of Philadelphia Swap Agreements The School District adopted, in Fiscal Year 2010, the provisions of Governmental Accounting Standards Board (GASB) Statement No. 53, Accounting and Financial Reporting for Derivative Instruments. The fair value bal-ances and notional amounts of derivative instruments outstanding at June 30, 2010, classified by type, and the changes in fair value of such derivative instruments for the year then ended as reported in the 2010 financial statements are as follows (amounts in thousands; debit (credit)): Change in Fair Value Fair Value at June 30, 2010 Classification Amount Classification Amount Notional Governmental Activities Cash flow hedges: Pay-fixed interest rate Deferred Swaps outflow $ (16,818) Debt $ (71,622) $ 362,675 Investment derivatives: Pays-variable Investment interest rate swaps revenue $ 2,261 Investment $ (39,605) $ 500,000 $ (111,227)
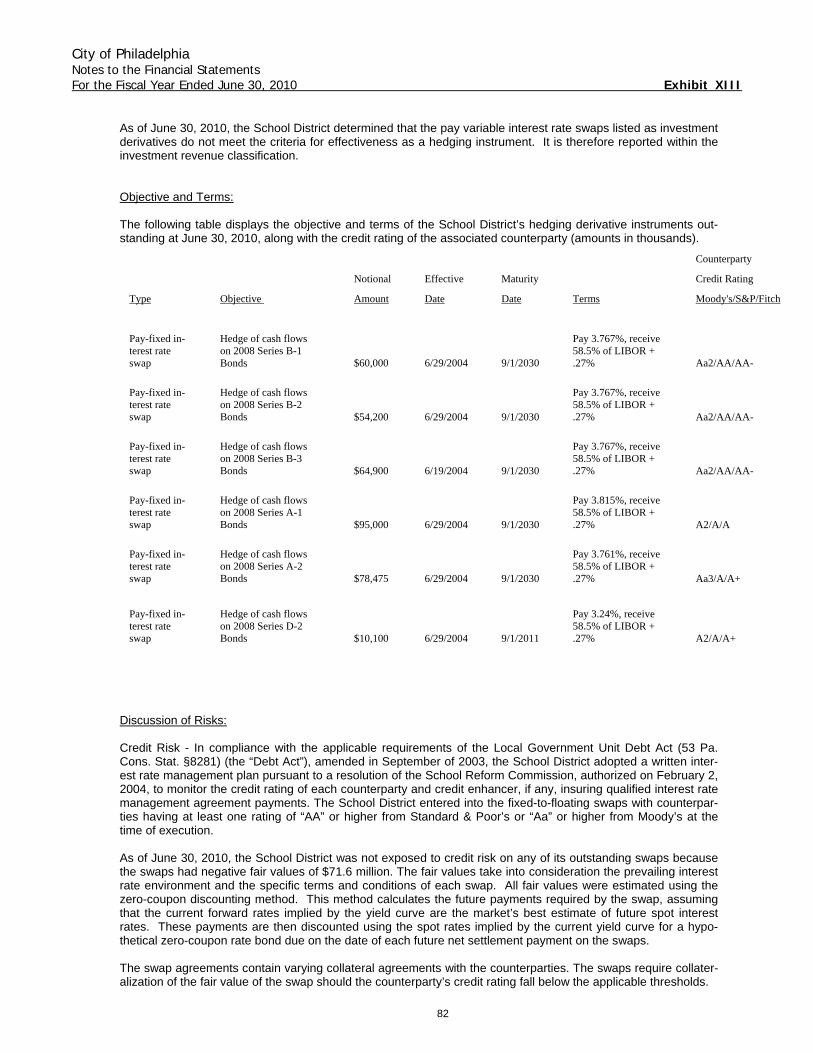
City of Philadelphia Notes to the Financial Statements For the Fiscal Year Ended June 30, 2010 Exhibit XIII
82
As of June 30, 2010, the School District determined that the pay variable interest rate swaps listed as investment derivatives do not meet the criteria for effectiveness as a hedging instrument. It is therefore reported within the investment revenue classification. Objective and Terms: The following table displays the objective and terms of the School District’s hedging derivative instruments out-standing at June 30, 2010, along with the credit rating of the associated counterparty (amounts in thousands).
Counterparty
Notional Effective Maturity Credit Rating
Type Objective Amount Date Date Terms Moody's/S&P/Fitch
Pay-fixed in-terest rate swap
Hedge of cash flows on 2008 Series B-1 Bonds $60,000 6/29/2004 9/1/2030
Pay 3.767%, receive 58.5% of LIBOR + .27% Aa2/AA/AA-
Pay-fixed in-terest rate swap
Hedge of cash flows on 2008 Series B-2 Bonds $54,200 6/29/2004 9/1/2030
Pay 3.767%, receive 58.5% of LIBOR + .27% Aa2/AA/AA-
Pay-fixed in-terest rate swap
Hedge of cash flows on 2008 Series B-3 Bonds $64,900 6/19/2004 9/1/2030
Pay 3.767%, receive 58.5% of LIBOR + .27% Aa2/AA/AA-
Pay-fixed in-terest rate swap
Hedge of cash flows on 2008 Series A-1 Bonds $95,000 6/29/2004 9/1/2030
Pay 3.815%, receive 58.5% of LIBOR + .27% A2/A/A
Pay-fixed in-terest rate swap
Hedge of cash flows on 2008 Series A-2 Bonds $78,475 6/29/2004 9/1/2030
Pay 3.761%, receive 58.5% of LIBOR + .27% Aa3/A/A+
Pay-fixed in-terest rate swap
Hedge of cash flows on 2008 Series D-2 Bonds $10,100 6/29/2004 9/1/2011
Pay 3.24%, receive 58.5% of LIBOR + .27% A2/A/A+
Discussion of Risks: Credit Risk - In compliance with the applicable requirements of the Local Government Unit Debt Act (53 Pa. Cons. Stat. §8281) (the “Debt Act”), amended in September of 2003, the School District adopted a written inter-est rate management plan pursuant to a resolution of the School Reform Commission, authorized on February 2, 2004, to monitor the credit rating of each counterparty and credit enhancer, if any, insuring qualified interest rate management agreement payments. The School District entered into the fixed-to-floating swaps with counterpar-ties having at least one rating of “AA” or higher from Standard & Poor’s or “Aa” or higher from Moody’s at the time of execution. As of June 30, 2010, the School District was not exposed to credit risk on any of its outstanding swaps because the swaps had negative fair values of $71.6 million. The fair values take into consideration the prevailing interest rate environment and the specific terms and conditions of each swap. All fair values were estimated using the zero-coupon discounting method. This method calculates the future payments required by the swap, assuming that the current forward rates implied by the yield curve are the market’s best estimate of future spot interest rates. These payments are then discounted using the spot rates implied by the current yield curve for a hypo-thetical zero-coupon rate bond due on the date of each future net settlement payment on the swaps. The swap agreements contain varying collateral agreements with the counterparties. The swaps require collater-alization of the fair value of the swap should the counterparty’s credit rating fall below the applicable thresholds.
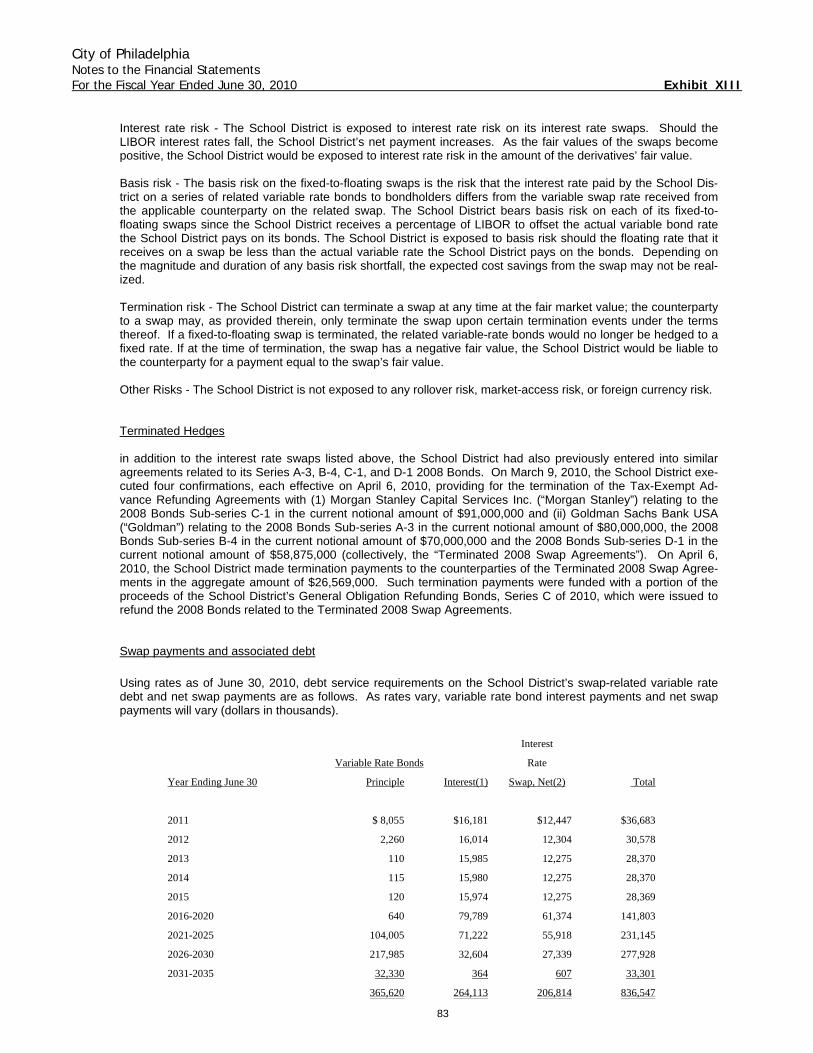
City of Philadelphia Notes to the Financial Statements For the Fiscal Year Ended June 30, 2010 Exhibit XIII
83
Interest rate risk - The School District is exposed to interest rate risk on its interest rate swaps. Should the LIBOR interest rates fall, the School District’s net payment increases. As the fair values of the swaps become positive, the School District would be exposed to interest rate risk in the amount of the derivatives’ fair value. Basis risk - The basis risk on the fixed-to-floating swaps is the risk that the interest rate paid by the School Dis-trict on a series of related variable rate bonds to bondholders differs from the variable swap rate received from the applicable counterparty on the related swap. The School District bears basis risk on each of its fixed-to-floating swaps since the School District receives a percentage of LIBOR to offset the actual variable bond rate the School District pays on its bonds. The School District is exposed to basis risk should the floating rate that it receives on a swap be less than the actual variable rate the School District pays on the bonds. Depending on the magnitude and duration of any basis risk shortfall, the expected cost savings from the swap may not be real-ized. Termination risk - The School District can terminate a swap at any time at the fair market value; the counterparty to a swap may, as provided therein, only terminate the swap upon certain termination events under the terms thereof. If a fixed-to-floating swap is terminated, the related variable-rate bonds would no longer be hedged to a fixed rate. If at the time of termination, the swap has a negative fair value, the School District would be liable to the counterparty for a payment equal to the swap’s fair value. Other Risks - The School District is not exposed to any rollover risk, market-access risk, or foreign currency risk. Terminated Hedges in addition to the interest rate swaps listed above, the School District had also previously entered into similar agreements related to its Series A-3, B-4, C-1, and D-1 2008 Bonds. On March 9, 2010, the School District exe-cuted four confirmations, each effective on April 6, 2010, providing for the termination of the Tax-Exempt Ad-vance Refunding Agreements with (1) Morgan Stanley Capital Services Inc. (“Morgan Stanley”) relating to the 2008 Bonds Sub-series C-1 in the current notional amount of $91,000,000 and (ii) Goldman Sachs Bank USA (“Goldman”) relating to the 2008 Bonds Sub-series A-3 in the current notional amount of $80,000,000, the 2008 Bonds Sub-series B-4 in the current notional amount of $70,000,000 and the 2008 Bonds Sub-series D-1 in the current notional amount of $58,875,000 (collectively, the “Terminated 2008 Swap Agreements”). On April 6, 2010, the School District made termination payments to the counterparties of the Terminated 2008 Swap Agree-ments in the aggregate amount of $26,569,000. Such termination payments were funded with a portion of the proceeds of the School District’s General Obligation Refunding Bonds, Series C of 2010, which were issued to refund the 2008 Bonds related to the Terminated 2008 Swap Agreements. Swap payments and associated debt Using rates as of June 30, 2010, debt service requirements on the School District’s swap-related variable rate debt and net swap payments are as follows. As rates vary, variable rate bond interest payments and net swap payments will vary (dollars in thousands).
Interest
Variable Rate Bonds Rate
Year Ending June 30 Principle Interest(1) Swap, Net(2) Total
2011 $ 8,055 $16,181 $12,447 $36,683
2012 2,260 16,014 12,304 30,578
2013 110 15,985 12,275 28,370
2014 115 15,980 12,275 28,370
2015 120 15,974 12,275 28,369
2016-2020 640 79,789 61,374 141,803
2021-2025 104,005 71,222 55,918 231,145
2026-2030 217,985 32,604 27,339 277,928
2031-2035 32,330 364 607 33,301
365,620 264,113 206,814 836,547
City of Philadelphia Notes to the Financial Statements For the Fiscal Year Ended June 30, 2010 Exhibit XIII
84
(1) Based on assumed interest rate of 4.5% at year end June 30th. (2) Variable rate receipts based on LIBOR rate plus basis point at year end June 30th. c. School District of Philadelphia General Obligation and Refunding Bonds General Obligation Bonds: On April 6, 2010, the School District issued Series A of 2010 and Series B of 2010 fixed rate general obligation bonds in the aggregate amount of $249.3 million for the Capital Improvement Program. Bond proceeds of $1.9 million were utilized for underwriting fees, and other bond issuance costs. The Series B bonds were designated as federally taxable Build America Bonds, in accord with The American Recovery and Reinvestment Act of 2009. The School District is entitled to receive a cash subsidy from the United States Treasury equal to 35% of the in-terest payable on the Series B Bonds on each interest payment date. The eligibility of this federal subsidy begins during fiscal year 2011. Refunding Bonds: (1) On April 6, 2010, the School District issued Series C of 2010 fixed rate general obligation bonds (GOB) in the aggregate amount of $300.0 million to refund certain maturities of the outstanding Series A, B, C, and D of 2008, terminate the related Swap Agreements, and pay the associated swap termination payments. Bond pro-ceeds of $1.9 million were utilized for underwriting fees, and other issuance costs. Securities for the issues were deposited in a separate irrevocable trust with an escrow agent to provide for all fu-ture debt service payments for the refunded bonds. The net proceeds were used by the escrow agent to pur-chase State Local Government Securities (SLG) of $303.8 million which were used to retire the subseries A-3, B-4, C-1, C-2, and D-1 of 2008. (2) On April 6, 2010, the School District issued Series D of 2010 fixed rate general obligation bonds (GOB) in the aggregate amount of $49.4 million to refund certain maturities of the outstanding Series of A of 1999. Bond proceeds of $0.3 million were utilized for underwriting fees, and other issuance costs. Securities for the issue were deposited in a separate irrevocable trust with an escrow agent to provide for all fu-ture debt service payments for the refunded bonds. The net proceeds were used by the escrow agent to pur-chase State Local Government Securities (SLG) of $52.6 million which were used to retire the Series of A of 1999. (3) For accounting purposes, these advance refundings resulted in a difference between the reacquisition price and the net carrying amount of the old debt of $52.0 million. This difference is being amortized through the operations in the District-wide statements until the year 2023. (4) An analysis was completed to determine the cash flow difference between the old debt and new debt. This analysis indicates a cash flow of $10.1 million less over the life of the issue than the cash flow required to service the old debt. In addition, there was an economic loss (difference between the present value of the debt service payments on the old and new debt) of $9.7 million to the School District.
8. LEASE COMMITMENTS AND LEASED ASSETS
A. CITY AS LESSOR
The City's operating leases consist of leases of airport facilities, recreation facilities, certain transit facilities and various other real estate and building sites. Rental income for all operating leases for the year was:
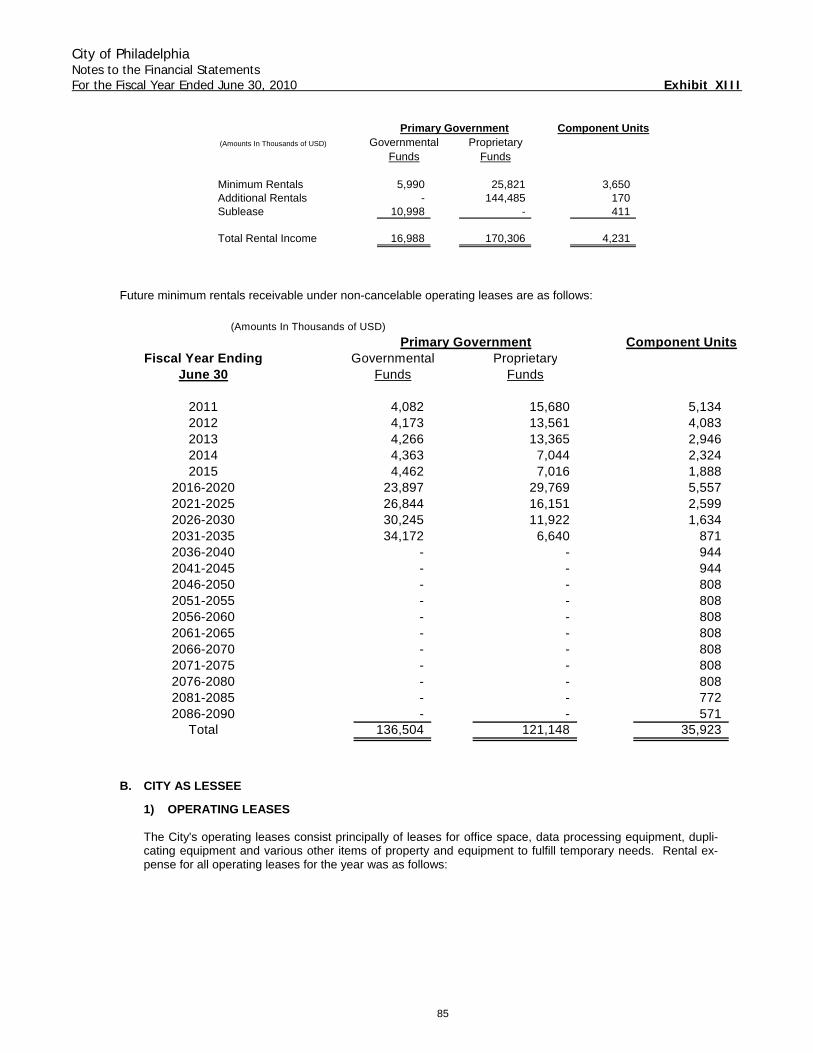
City of Philadelphia Notes to the Financial Statements For the Fiscal Year Ended June 30, 2010 Exhibit XIII
85
Primary Government Component Units(Amounts In Thousands of USD) Governmental Proprietary
Funds Funds
Minimum Rentals 5,990 25,821 3,650 Additional Rentals - 144,485 170 Sublease 10,998 - 411
Total Rental Income 16,988 170,306 4,231
Future minimum rentals receivable under non-cancelable operating leases are as follows:
(Amounts In Thousands of USD)
Primary Government Component UnitsFiscal Year Ending Governmental Proprietary
June 30 Funds Funds
2011 4,082 15,680 5,134 2012 4,173 13,561 4,083 2013 4,266 13,365 2,946 2014 4,363 7,044 2,324 2015 4,462 7,016 1,888
2016-2020 23,897 29,769 5,557 2021-2025 26,844 16,151 2,599 2026-2030 30,245 11,922 1,634 2031-2035 34,172 6,640 871 2036-2040 - - 944 2041-2045 - - 944 2046-2050 - - 808 2051-2055 - - 808 2056-2060 - - 808 2061-2065 - - 808 2066-2070 - - 808 2071-2075 - - 808 2076-2080 - - 808 2081-2085 - - 772 2086-2090 - - 571
Total 136,504 121,148 35,923
B. CITY AS LESSEE
1) OPERATING LEASES
The City's operating leases consist principally of leases for office space, data processing equipment, dupli-cating equipment and various other items of property and equipment to fulfill temporary needs. Rental ex-pense for all operating leases for the year was as follows:
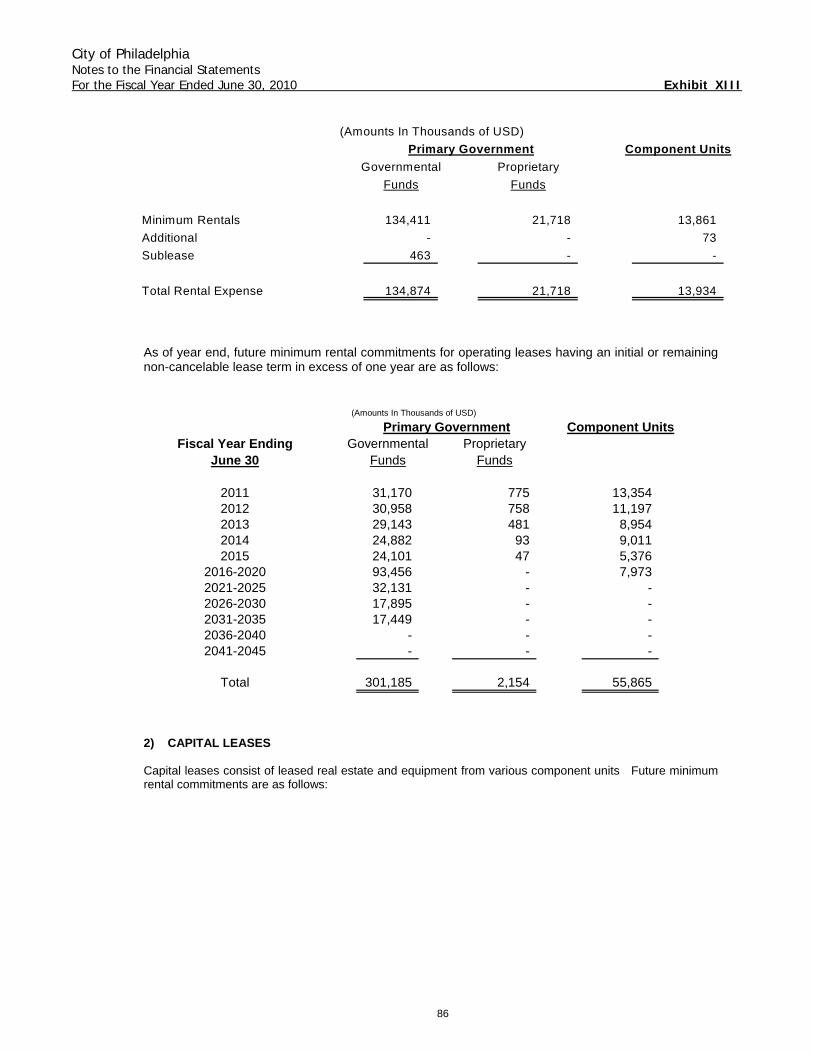
City of Philadelphia Notes to the Financial Statements For the Fiscal Year Ended June 30, 2010 Exhibit XIII
86
(Amounts In Thousands of USD)
Primary Government Component UnitsGovernmental Proprietary
Funds Funds
Minimum Rentals 134,411 21,718 13,861
Additional - - 73
Sublease 463 - -
Total Rental Expense 134,874 21,718 13,934
As of year end, future minimum rental commitments for operating leases having an initial or remaining non-cancelable lease term in excess of one year are as follows:
(Amounts In Thousands of USD)
Primary Government Component UnitsFiscal Year Ending Governmental Proprietary
June 30 Funds Funds
2011 31,170 775 13,354 2012 30,958 758 11,197 2013 29,143 481 8,954 2014 24,882 93 9,011 2015 24,101 47 5,376
2016-2020 93,456 - 7,973 2021-2025 32,131 - - 2026-2030 17,895 - - 2031-2035 17,449 - - 2036-2040 - - - 2041-2045 - - -
Total 301,185 2,154 55,865
2) CAPITAL LEASES
Capital leases consist of leased real estate and equipment from various component units Future minimum rental commitments are as follows:
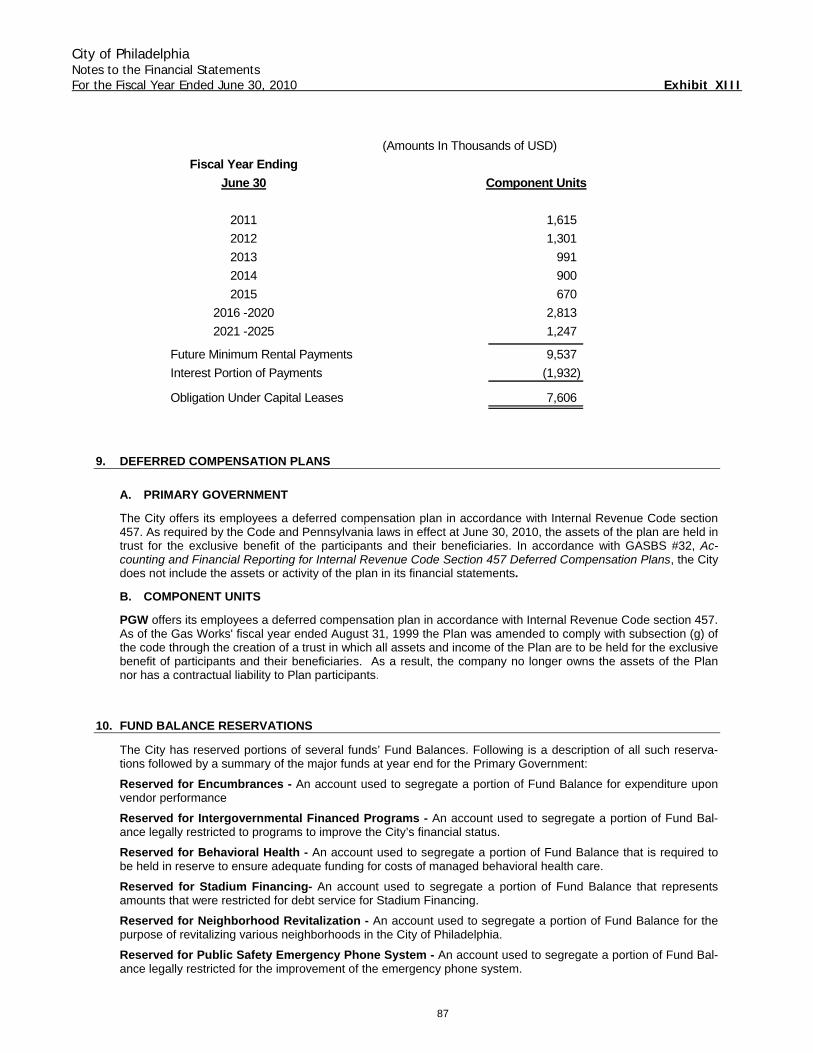
City of Philadelphia Notes to the Financial Statements For the Fiscal Year Ended June 30, 2010 Exhibit XIII
87
(Amounts In Thousands of USD)
Fiscal Year EndingJune 30 Component Units
2011 1,615
2012 1,301
2013 991
2014 900
2015 670
2016 -2020 2,813
2021 -2025 1,247
Future Minimum Rental Payments 9,537
Interest Portion of Payments (1,932)
Obligation Under Capital Leases 7,606
9. DEFERRED COMPENSATION PLANS
A. PRIMARY GOVERNMENT
The City offers its employees a deferred compensation plan in accordance with Internal Revenue Code section 457. As required by the Code and Pennsylvania laws in effect at June 30, 2010, the assets of the plan are held in trust for the exclusive benefit of the participants and their beneficiaries. In accordance with GASBS #32, Ac-counting and Financial Reporting for Internal Revenue Code Section 457 Deferred Compensation Plans, the City does not include the assets or activity of the plan in its financial statements.
B. COMPONENT UNITS
PGW offers its employees a deferred compensation plan in accordance with Internal Revenue Code section 457. As of the Gas Works' fiscal year ended August 31, 1999 the Plan was amended to comply with subsection (g) of the code through the creation of a trust in which all assets and income of the Plan are to be held for the exclusive benefit of participants and their beneficiaries. As a result, the company no longer owns the assets of the Plan nor has a contractual liability to Plan participants.
10. FUND BALANCE RESERVATIONS
The City has reserved portions of several funds’ Fund Balances. Following is a description of all such reserva-tions followed by a summary of the major funds at year end for the Primary Government:
Reserved for Encumbrances - An account used to segregate a portion of Fund Balance for expenditure upon vendor performance Reserved for Intergovernmental Financed Programs - An account used to segregate a portion of Fund Bal-ance legally restricted to programs to improve the City’s financial status. Reserved for Behavioral Health - An account used to segregate a portion of Fund Balance that is required to be held in reserve to ensure adequate funding for costs of managed behavioral health care. Reserved for Stadium Financing- An account used to segregate a portion of Fund Balance that represents amounts that were restricted for debt service for Stadium Financing. Reserved for Neighborhood Revitalization - An account used to segregate a portion of Fund Balance for the purpose of revitalizing various neighborhoods in the City of Philadelphia. Reserved for Public Safety Emergency Phone System - An account used to segregate a portion of Fund Bal-ance legally restricted for the improvement of the emergency phone system.
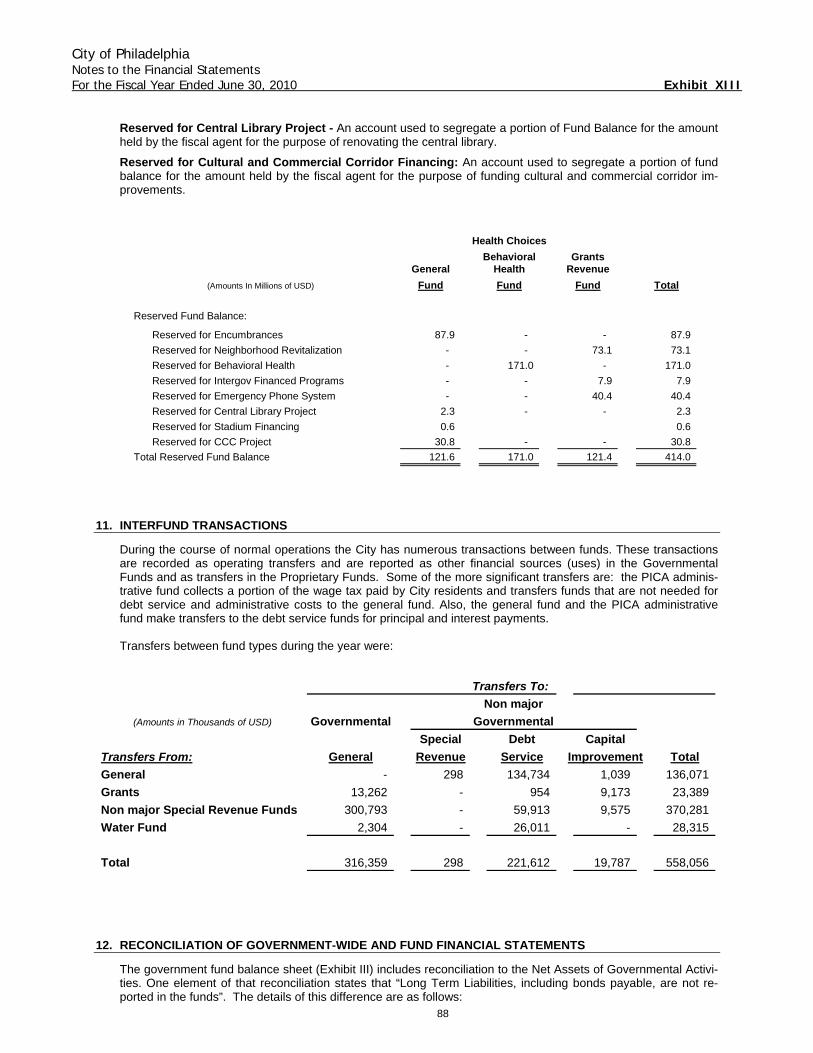
City of Philadelphia Notes to the Financial Statements For the Fiscal Year Ended June 30, 2010 Exhibit XIII
88
Reserved for Central Library Project - An account used to segregate a portion of Fund Balance for the amount held by the fiscal agent for the purpose of renovating the central library. Reserved for Cultural and Commercial Corridor Financing: An account used to segregate a portion of fund balance for the amount held by the fiscal agent for the purpose of funding cultural and commercial corridor im-provements.
Health ChoicesBehavioral Grants
General Health Revenue(Amounts In Millions of USD) Fund Fund Fund Total
Reserved Fund Balance:
Reserved for Encumbrances 87.9 - - 87.9
Reserved for Neighborhood Revitalization - - 73.1 73.1
Reserved for Behavioral Health - 171.0 - 171.0
Reserved for Intergov Financed Programs - - 7.9 7.9
Reserved for Emergency Phone System - - 40.4 40.4
Reserved for Central Library Project 2.3 - - 2.3
Reserved for Stadium Financing 0.6 0.6
Reserved for CCC Project 30.8 - - 30.8
Total Reserved Fund Balance 121.6 171.0 121.4 414.0
11. INTERFUND TRANSACTIONS
During the course of normal operations the City has numerous transactions between funds. These transactions are recorded as operating transfers and are reported as other financial sources (uses) in the Governmental Funds and as transfers in the Proprietary Funds. Some of the more significant transfers are: the PICA adminis-trative fund collects a portion of the wage tax paid by City residents and transfers funds that are not needed for debt service and administrative costs to the general fund. Also, the general fund and the PICA administrative fund make transfers to the debt service funds for principal and interest payments. Transfers between fund types during the year were:
Transfers To:Non major
(Amounts in Thousands of USD) Governmental GovernmentalSpecial Debt Capital
Transfers From: General Revenue Service Improvement TotalGeneral - 298 134,734 1,039 136,071
Grants 13,262 - 954 9,173 23,389
Non major Special Revenue Funds 300,793 - 59,913 9,575 370,281
Water Fund 2,304 - 26,011 - 28,315
Total 316,359 298 221,612 19,787 558,056
12. RECONCILIATION OF GOVERNMENT-WIDE AND FUND FINANCIAL STATEMENTS
The government fund balance sheet (Exhibit III) includes reconciliation to the Net Assets of Governmental Activi-ties. One element of that reconciliation states that “Long Term Liabilities, including bonds payable, are not re-ported in the funds”. The details of this difference are as follows:
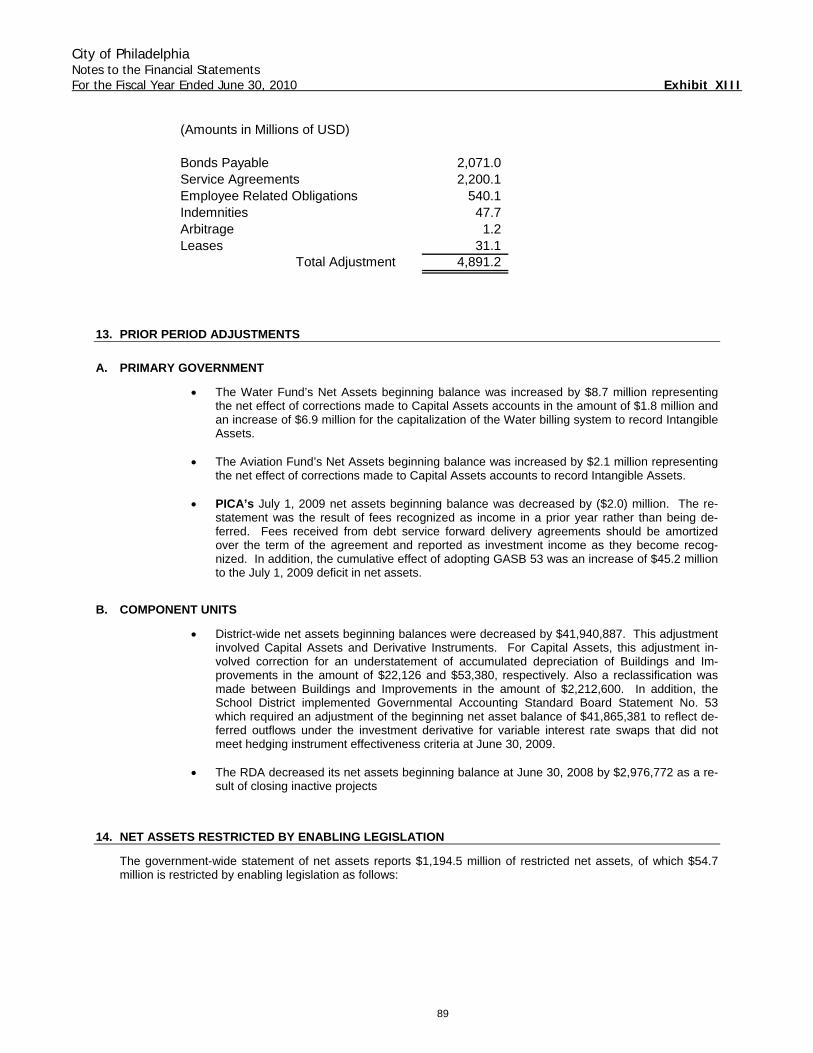
City of Philadelphia Notes to the Financial Statements For the Fiscal Year Ended June 30, 2010 Exhibit XIII
89
(Amounts in Millions of USD)
Bonds Payable 2,071.0 Service Agreements 2,200.1 Employee Related Obligations 540.1 Indemnities 47.7 Arbitrage 1.2 Leases 31.1
Total Adjustment 4,891.2
13. PRIOR PERIOD ADJUSTMENTS
A. PRIMARY GOVERNMENT
• The Water Fund’s Net Assets beginning balance was increased by $8.7 million representing the net effect of corrections made to Capital Assets accounts in the amount of $1.8 million and an increase of $6.9 million for the capitalization of the Water billing system to record Intangible Assets.
• The Aviation Fund’s Net Assets beginning balance was increased by $2.1 million representing
the net effect of corrections made to Capital Assets accounts to record Intangible Assets. • PICA’s July 1, 2009 net assets beginning balance was decreased by ($2.0) million. The re-
statement was the result of fees recognized as income in a prior year rather than being de-ferred. Fees received from debt service forward delivery agreements should be amortized over the term of the agreement and reported as investment income as they become recog-nized. In addition, the cumulative effect of adopting GASB 53 was an increase of $45.2 million to the July 1, 2009 deficit in net assets.
B. COMPONENT UNITS
• District-wide net assets beginning balances were decreased by $41,940,887. This adjustment involved Capital Assets and Derivative Instruments. For Capital Assets, this adjustment in-volved correction for an understatement of accumulated depreciation of Buildings and Im-provements in the amount of $22,126 and $53,380, respectively. Also a reclassification was made between Buildings and Improvements in the amount of $2,212,600. In addition, the School District implemented Governmental Accounting Standard Board Statement No. 53 which required an adjustment of the beginning net asset balance of $41,865,381 to reflect de-ferred outflows under the investment derivative for variable interest rate swaps that did not meet hedging instrument effectiveness criteria at June 30, 2009.
• The RDA decreased its net assets beginning balance at June 30, 2008 by $2,976,772 as a re-
sult of closing inactive projects
14. NET ASSETS RESTRICTED BY ENABLING LEGISLATION
The government-wide statement of net assets reports $1,194.5 million of restricted net assets, of which $54.7 million is restricted by enabling legislation as follows:
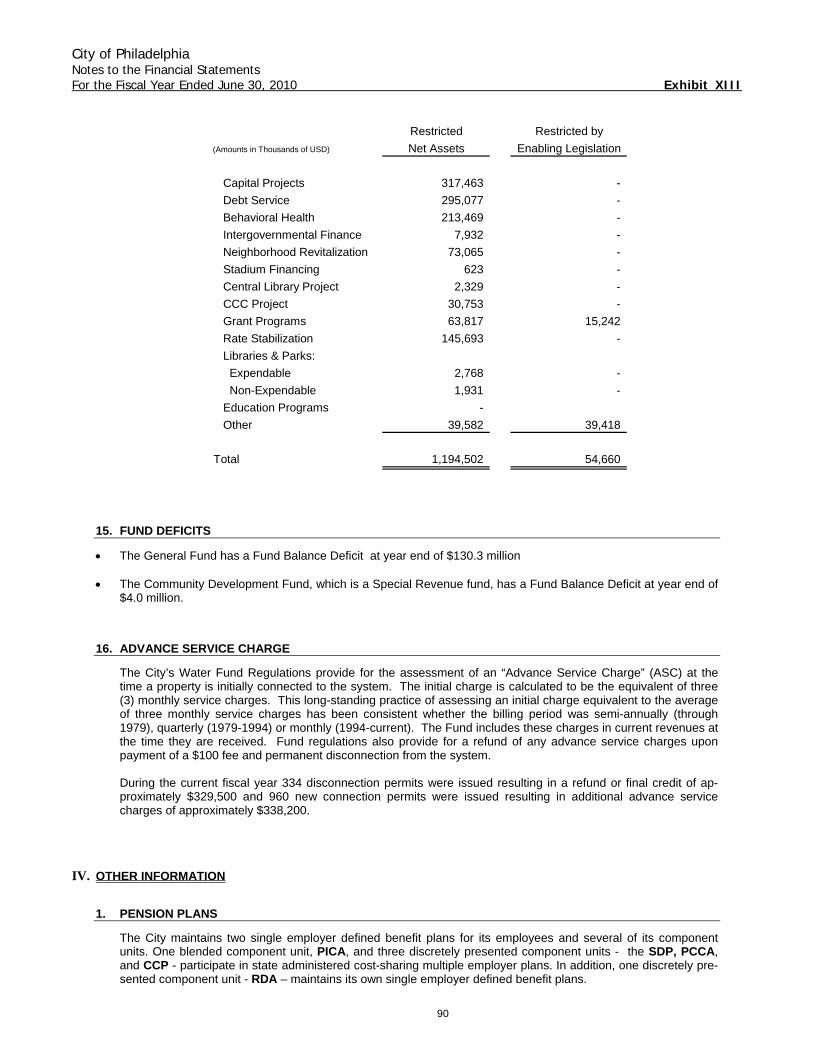
City of Philadelphia Notes to the Financial Statements For the Fiscal Year Ended June 30, 2010 Exhibit XIII
90
Restricted Restricted by
(Amounts in Thousands of USD) Net Assets Enabling Legislation
Capital Projects 317,463 -
Debt Service 295,077 -
Behavioral Health 213,469 -
Intergovernmental Finance 7,932 -
Neighborhood Revitalization 73,065 -
Stadium Financing 623 -
Central Library Project 2,329 -
CCC Project 30,753 -
Grant Programs 63,817 15,242
Rate Stabilization 145,693 -
Libraries & Parks:
Expendable 2,768 -
Non-Expendable 1,931 -
Education Programs -
Other 39,582 39,418
Total 1,194,502 54,660
15. FUND DEFICITS
• The General Fund has a Fund Balance Deficit at year end of $130.3 million • The Community Development Fund, which is a Special Revenue fund, has a Fund Balance Deficit at year end of
$4.0 million.
16. ADVANCE SERVICE CHARGE
The City’s Water Fund Regulations provide for the assessment of an “Advance Service Charge” (ASC) at the time a property is initially connected to the system. The initial charge is calculated to be the equivalent of three (3) monthly service charges. This long-standing practice of assessing an initial charge equivalent to the average of three monthly service charges has been consistent whether the billing period was semi-annually (through 1979), quarterly (1979-1994) or monthly (1994-current). The Fund includes these charges in current revenues at the time they are received. Fund regulations also provide for a refund of any advance service charges upon payment of a $100 fee and permanent disconnection from the system. During the current fiscal year 334 disconnection permits were issued resulting in a refund or final credit of ap-proximately $329,500 and 960 new connection permits were issued resulting in additional advance service charges of approximately $338,200.
IV. OTHER INFORMATION
1. PENSION PLANS
The City maintains two single employer defined benefit plans for its employees and several of its component units. One blended component unit, PICA, and three discretely presented component units - the SDP, PCCA, and CCP - participate in state administered cost-sharing multiple employer plans. In addition, one discretely pre-sented component unit - RDA – maintains its own single employer defined benefit plans.
City of Philadelphia Notes to the Financial Statements For the Fiscal Year Ended June 30, 2010 Exhibit XIII
91
A. SINGLE EMPLOYER PLANS
The two plans maintained by the City are the Municipal Pension Plan (City Plan) and the Gas Works Plan (PGW Plan). The plan maintained by the City's component unit is the Redevelopment Authority of the City of Philadel-phia Retirement Plan (RDA Plan). Financial statements for the City and PGW pension plans are prepared using the accrual basis of accounting. Employee and employer contributions are recognized as revenues when due, pursuant to formal commitments, as well as statutory or contractual requirements. Required Supplementary Information calculated in accordance with GASB Statement No. 25 is presented in au-dited financial statements of the respective pension plans. Copies of these financial statements may be obtained by contacting the Director of Finance of the City of Philadelphia.
(1) City Plan
a. Plan Description The Philadelphia Home Rule Charter (the Charter) mandates that the City maintain an actuarially sound pension and retirement system. To satisfy that mandate, the City’s Board of Pensions and Retirement maintains the single-employer Municipal Pension Plan (the Plan). The plan covers all officers and em-ployees of the City and officers and employees of five other governmental and quasi-governmental or-ganizations. By authority of two Ordinances and related amendments passed by City Council, the Plan provides retirement benefits as well as death and disability benefits. Benefits vary by the class of em-ployee. The plan has two major classes of members - those covered under the 1967 Plan and those covered under the 1987 Plan. Each of these two plans has multiple divisions. Retirement Benefits An employee who meets the age and service requirements of the particular division in which he partici-pates is entitled to an annual benefit, payable monthly for life, equal to the employee’s average final compensation multiplied by a percentage that is determined by the employee’s years of credited ser-vice. The formula for determining the percentage is different for each division. If fund earnings exceed the actuarial assumed rate by a sufficient amount, an enhanced benefit distribution to retirees, their beneficiaries, and their survivors shall be considered. A deferred vested benefit is available to an em-ployee who has 10 years of credited service, has not withdrawn contributions to the system and has at-tained the appropriate service retirement age. Members of both plans may opt for early retirement with a reduced benefit. The Deferred Retirement Option Plan (DROP) was initiated on October 1, 1999. Under this plan employees that reach retirement age may accumulate their monthly service retirement benefit in an interest bearing account at the Board of Pensions for up to four (4) years and continue to be employed by the City of Philadelphia. Death Benefits If an employee dies from the performance of duties, his/her spouse, children or dependent parents may be eligible for an annual benefit ranging from 15% to 80% of the employee’s final average compensa-tion. Depending on age and years of service, the beneficiary of an employee who dies other than from the performance of duties will be eligible for either a lump sum benefit only or a choice between a lump sum or an annual pension. Disability Benefits Employees disabled during the performance of duties are eligible for an immediate benefit equal to con-tributions plus a yearly benefit. If the employee subsequently becomes employed, the benefit is reduced by a percentage of the amount earned. Certain employees who are disabled other than during the per-formance of duties are eligible for an ordinary disability payment if they apply for the benefit within one year of termination. If the employee subsequently becomes employed, the benefit is reduced by a per-centage of the amount earned. Membership Membership in the plan as of July 1, 2009 was as follows:
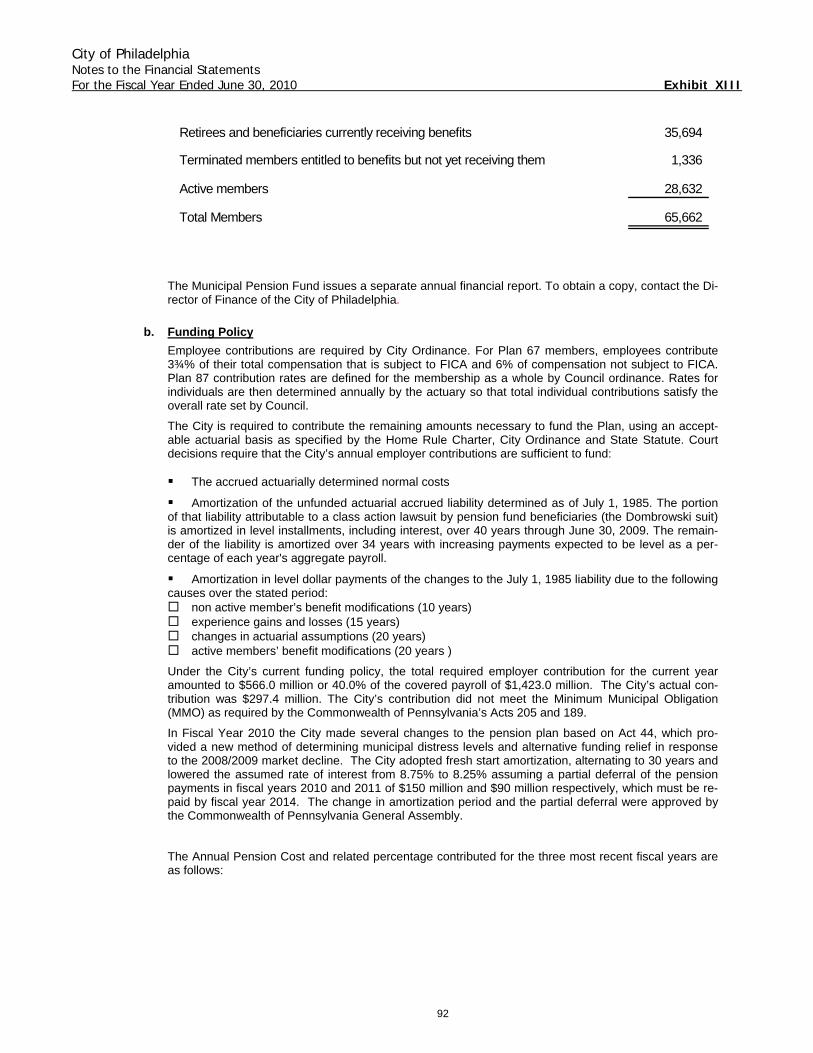
City of Philadelphia Notes to the Financial Statements For the Fiscal Year Ended June 30, 2010 Exhibit XIII
92
Retirees and beneficiaries currently receiving benefits 35,694
Terminated members entitled to benefits but not yet receiving them 1,336
Active members 28,632
Total Members 65,662
The Municipal Pension Fund issues a separate annual financial report. To obtain a copy, contact the Di-rector of Finance of the City of Philadelphia.
b. Funding Policy Employee contributions are required by City Ordinance. For Plan 67 members, employees contribute 3¾% of their total compensation that is subject to FICA and 6% of compensation not subject to FICA. Plan 87 contribution rates are defined for the membership as a whole by Council ordinance. Rates for individuals are then determined annually by the actuary so that total individual contributions satisfy the overall rate set by Council.
The City is required to contribute the remaining amounts necessary to fund the Plan, using an accept-able actuarial basis as specified by the Home Rule Charter, City Ordinance and State Statute. Court decisions require that the City’s annual employer contributions are sufficient to fund: The accrued actuarially determined normal costs
Amortization of the unfunded actuarial accrued liability determined as of July 1, 1985. The portion of that liability attributable to a class action lawsuit by pension fund beneficiaries (the Dombrowski suit) is amortized in level installments, including interest, over 40 years through June 30, 2009. The remain-der of the liability is amortized over 34 years with increasing payments expected to be level as a per-centage of each year's aggregate payroll.
Amortization in level dollar payments of the changes to the July 1, 1985 liability due to the following causes over the stated period:
non active member’s benefit modifications (10 years) experience gains and losses (15 years) changes in actuarial assumptions (20 years) active members’ benefit modifications (20 years )
Under the City’s current funding policy, the total required employer contribution for the current year amounted to $566.0 million or 40.0% of the covered payroll of $1,423.0 million. The City’s actual con-tribution was $297.4 million. The City’s contribution did not meet the Minimum Municipal Obligation (MMO) as required by the Commonwealth of Pennsylvania’s Acts 205 and 189.
In Fiscal Year 2010 the City made several changes to the pension plan based on Act 44, which pro-vided a new method of determining municipal distress levels and alternative funding relief in response to the 2008/2009 market decline. The City adopted fresh start amortization, alternating to 30 years and lowered the assumed rate of interest from 8.75% to 8.25% assuming a partial deferral of the pension payments in fiscal years 2010 and 2011 of $150 million and $90 million respectively, which must be re-paid by fiscal year 2014. The change in amortization period and the partial deferral were approved by the Commonwealth of Pennsylvania General Assembly.
The Annual Pension Cost and related percentage contributed for the three most recent fiscal years are as follows:
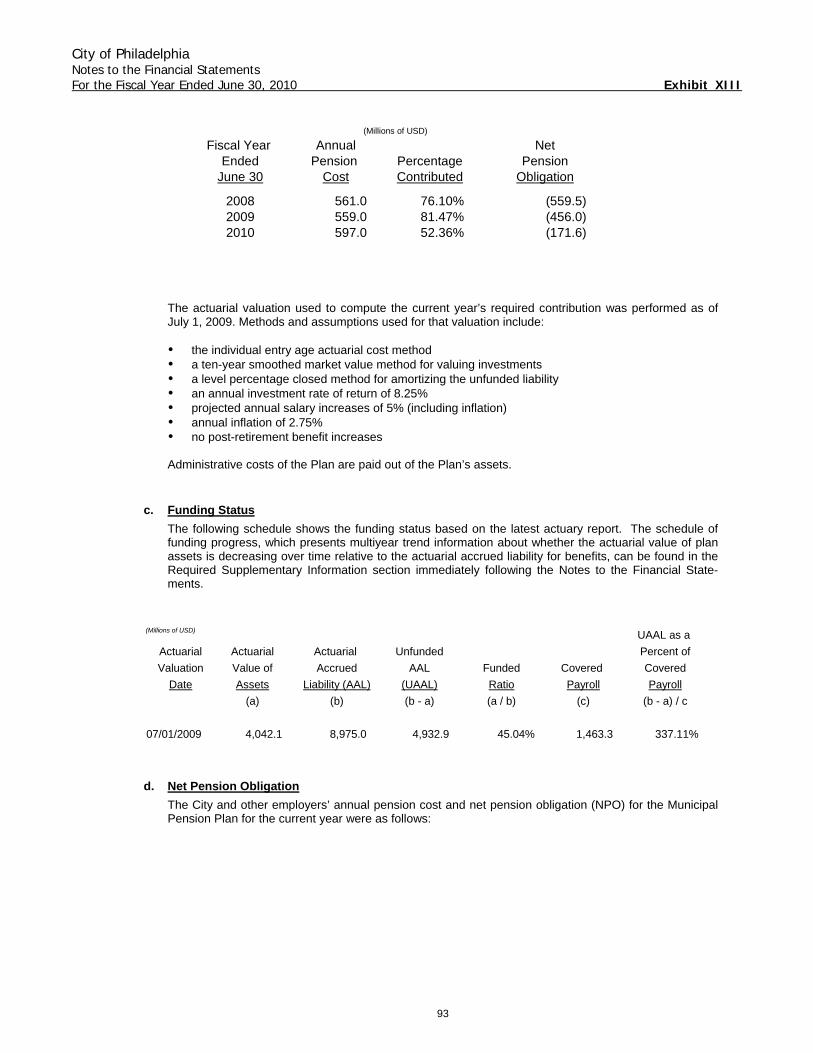
City of Philadelphia Notes to the Financial Statements For the Fiscal Year Ended June 30, 2010 Exhibit XIII
93
(Millions of USD)
Fiscal Year Annual NetEnded Pension Percentage Pension
June 30 Cost Contributed Obligation
2008 561.0 76.10% (559.5) 2009 559.0 81.47% (456.0) 2010 597.0 52.36% (171.6)
The actuarial valuation used to compute the current year’s required contribution was performed as of July 1, 2009. Methods and assumptions used for that valuation include: the individual entry age actuarial cost method a ten-year smoothed market value method for valuing investments a level percentage closed method for amortizing the unfunded liability an annual investment rate of return of 8.25% projected annual salary increases of 5% (including inflation) annual inflation of 2.75% no post-retirement benefit increases
Administrative costs of the Plan are paid out of the Plan’s assets.
c. Funding Status The following schedule shows the funding status based on the latest actuary report. The schedule of funding progress, which presents multiyear trend information about whether the actuarial value of plan assets is decreasing over time relative to the actuarial accrued liability for benefits, can be found in the Required Supplementary Information section immediately following the Notes to the Financial State-ments.
(Millions of USD) UAAL as a
Actuarial Actuarial Actuarial Unfunded Percent of
Valuation Value of Accrued AAL Funded Covered Covered
Date Assets Liability (AAL) (UAAL) Ratio Payroll Payroll
(a) (b) (b - a) (a / b) (c) (b - a) / c
07/01/2009 4,042.1 8,975.0 4,932.9 45.04% 1,463.3 337.11% d. Net Pension Obligation
The City and other employers’ annual pension cost and net pension obligation (NPO) for the Municipal Pension Plan for the current year were as follows:
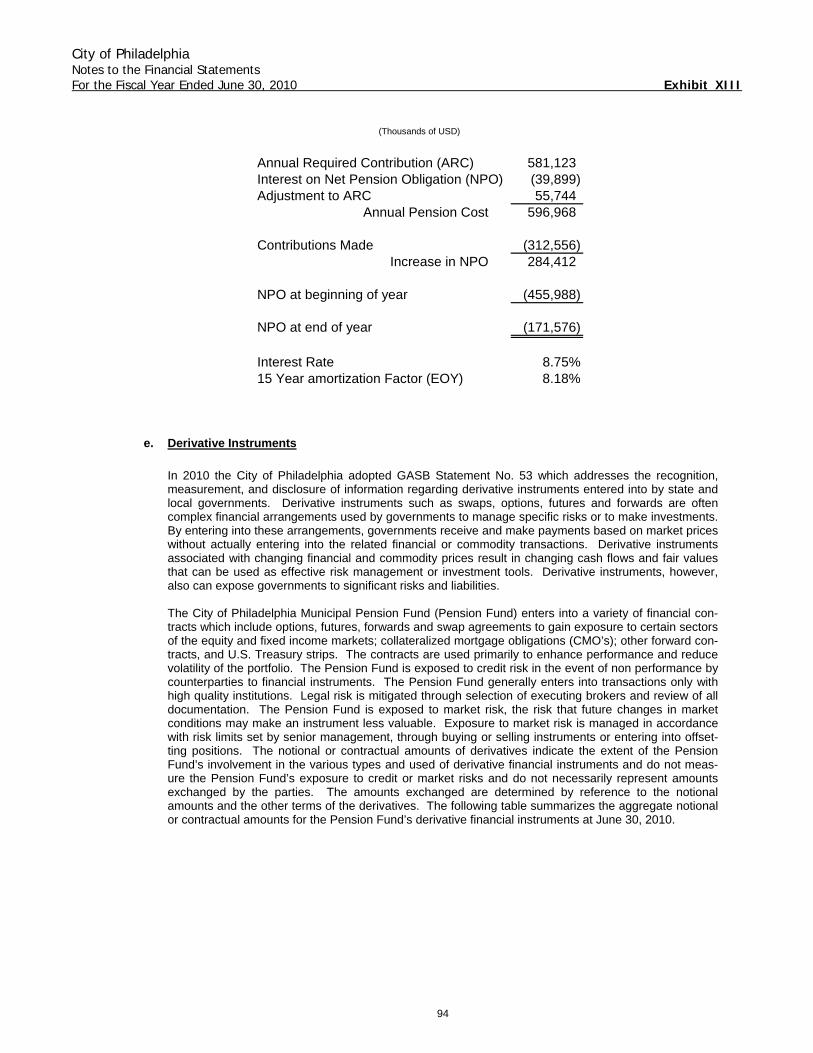
City of Philadelphia Notes to the Financial Statements For the Fiscal Year Ended June 30, 2010 Exhibit XIII
94
(Thousands of USD)
Annual Required Contribution (ARC) 581,123 Interest on Net Pension Obligation (NPO) (39,899) Adjustment to ARC 55,744
Annual Pension Cost 596,968
Contributions Made (312,556) Increase in NPO 284,412
NPO at beginning of year (455,988)
NPO at end of year (171,576)
Interest Rate 8.75%15 Year amortization Factor (EOY) 8.18%
e. Derivative Instruments In 2010 the City of Philadelphia adopted GASB Statement No. 53 which addresses the recognition, measurement, and disclosure of information regarding derivative instruments entered into by state and local governments. Derivative instruments such as swaps, options, futures and forwards are often complex financial arrangements used by governments to manage specific risks or to make investments. By entering into these arrangements, governments receive and make payments based on market prices without actually entering into the related financial or commodity transactions. Derivative instruments associated with changing financial and commodity prices result in changing cash flows and fair values that can be used as effective risk management or investment tools. Derivative instruments, however, also can expose governments to significant risks and liabilities. The City of Philadelphia Municipal Pension Fund (Pension Fund) enters into a variety of financial con-tracts which include options, futures, forwards and swap agreements to gain exposure to certain sectors of the equity and fixed income markets; collateralized mortgage obligations (CMO’s); other forward con-tracts, and U.S. Treasury strips. The contracts are used primarily to enhance performance and reduce volatility of the portfolio. The Pension Fund is exposed to credit risk in the event of non performance by counterparties to financial instruments. The Pension Fund generally enters into transactions only with high quality institutions. Legal risk is mitigated through selection of executing brokers and review of all documentation. The Pension Fund is exposed to market risk, the risk that future changes in market conditions may make an instrument less valuable. Exposure to market risk is managed in accordance with risk limits set by senior management, through buying or selling instruments or entering into offset-ting positions. The notional or contractual amounts of derivatives indicate the extent of the Pension Fund’s involvement in the various types and used of derivative financial instruments and do not meas-ure the Pension Fund’s exposure to credit or market risks and do not necessarily represent amounts exchanged by the parties. The amounts exchanged are determined by reference to the notional amounts and the other terms of the derivatives. The following table summarizes the aggregate notional or contractual amounts for the Pension Fund’s derivative financial instruments at June 30, 2010.
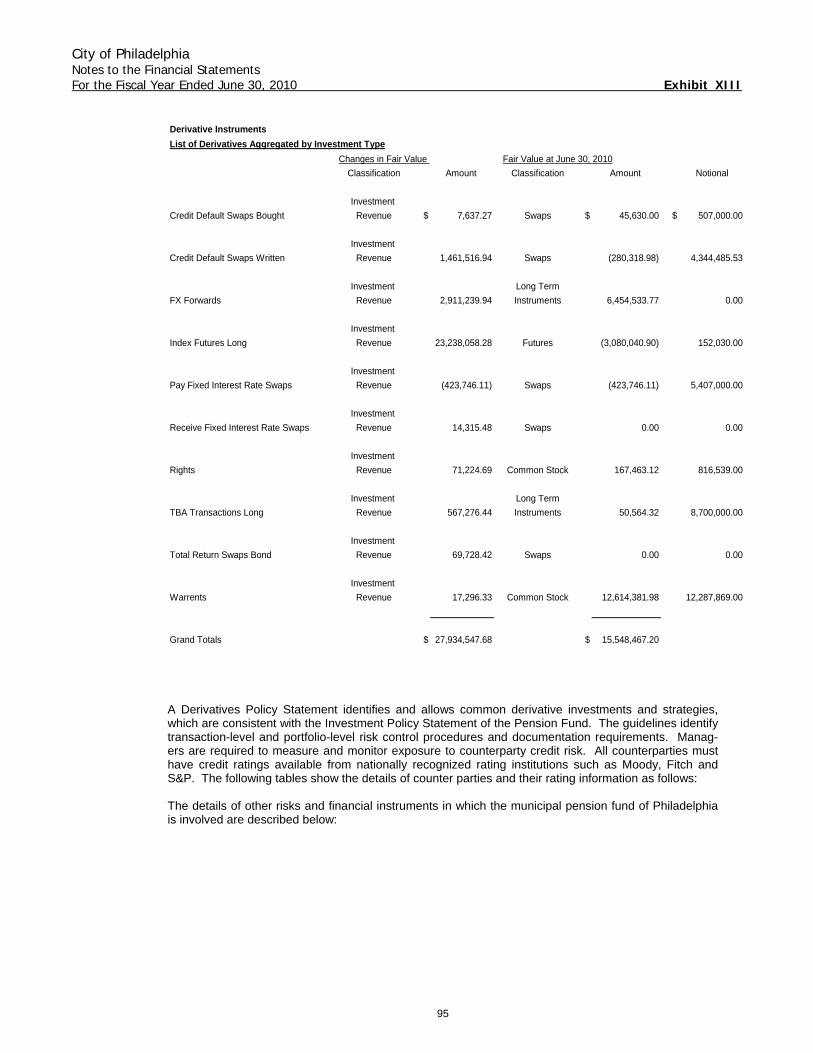
City of Philadelphia Notes to the Financial Statements For the Fiscal Year Ended June 30, 2010 Exhibit XIII
95
Derivative InstrumentsList of Derivatives Aggregated by Investment Type
Changes in Fair Value Fair Value at June 30, 2010
Classification Amount Classification Amount Notional
Investment
Credit Default Swaps Bought Revenue $ 7,637.27 Swaps $ 45,630.00 $ 507,000.00
Investment
Credit Default Swaps Written Revenue 1,461,516.94 Swaps (280,318.98) 4,344,485.53
Investment Long Term
FX Forwards Revenue 2,911,239.94 Instruments 6,454,533.77 0.00
Investment
Index Futures Long Revenue 23,238,058.28 Futures (3,080,040.90) 152,030.00
Investment
Pay Fixed Interest Rate Swaps Revenue (423,746.11) Swaps (423,746.11) 5,407,000.00
Investment
Receive Fixed Interest Rate Swaps Revenue 14,315.48 Swaps 0.00 0.00
Investment
Rights Revenue 71,224.69 Common Stock 167,463.12 816,539.00
Investment Long Term
TBA Transactions Long Revenue 567,276.44 Instruments 50,564.32 8,700,000.00
Investment
Total Return Swaps Bond Revenue 69,728.42 Swaps 0.00 0.00
Investment
Warrents Revenue 17,296.33 Common Stock 12,614,381.98 12,287,869.00
Grand Totals $ 27,934,547.68 $ 15,548,467.20
A Derivatives Policy Statement identifies and allows common derivative investments and strategies, which are consistent with the Investment Policy Statement of the Pension Fund. The guidelines identify transaction-level and portfolio-level risk control procedures and documentation requirements. Manag-ers are required to measure and monitor exposure to counterparty credit risk. All counterparties must have credit ratings available from nationally recognized rating institutions such as Moody, Fitch and S&P. The following tables show the details of counter parties and their rating information as follows: The details of other risks and financial instruments in which the municipal pension fund of Philadelphia is involved are described below:
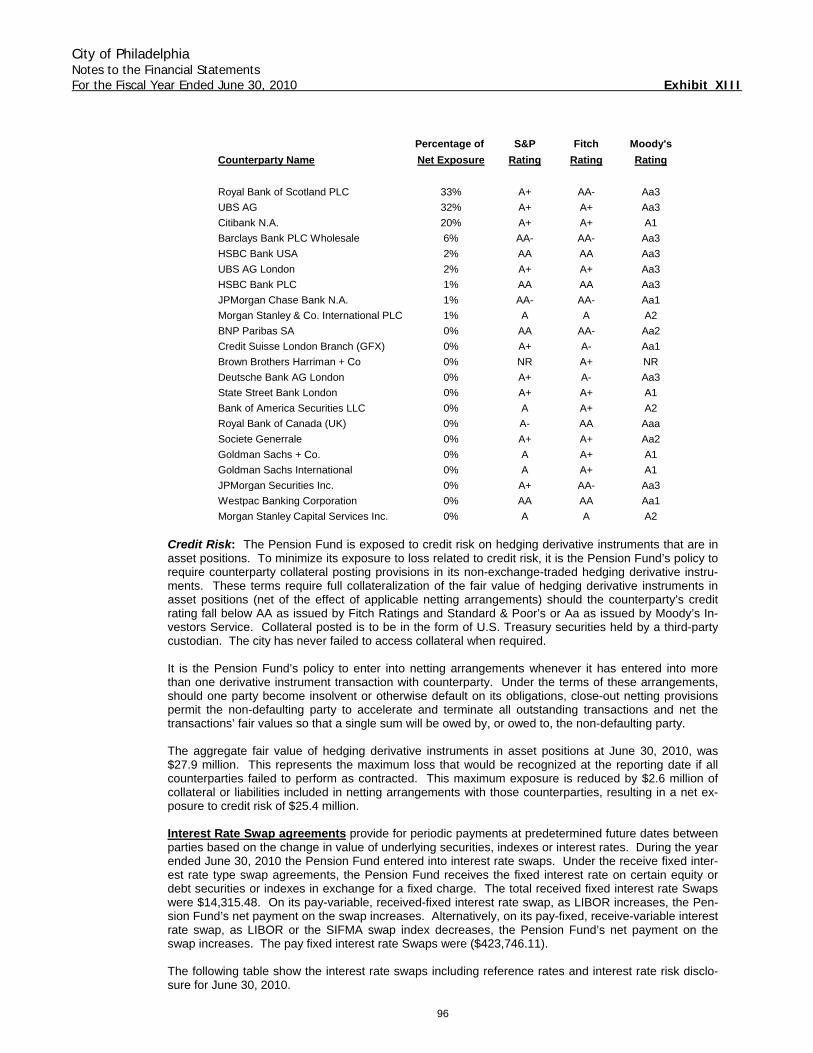
City of Philadelphia Notes to the Financial Statements For the Fiscal Year Ended June 30, 2010 Exhibit XIII
96
Percentage of S&P Fitch Moody'sCounterparty Name Net Exposure Rating Rating Rating
Royal Bank of Scotland PLC 33% A+ AA- Aa3
UBS AG 32% A+ A+ Aa3
Citibank N.A. 20% A+ A+ A1
Barclays Bank PLC Wholesale 6% AA- AA- Aa3
HSBC Bank USA 2% AA AA Aa3
UBS AG London 2% A+ A+ Aa3
HSBC Bank PLC 1% AA AA Aa3
JPMorgan Chase Bank N.A. 1% AA- AA- Aa1
Morgan Stanley & Co. International PLC 1% A A A2
BNP Paribas SA 0% AA AA- Aa2
Credit Suisse London Branch (GFX) 0% A+ A- Aa1
Brown Brothers Harriman + Co 0% NR A+ NR
Deutsche Bank AG London 0% A+ A- Aa3
State Street Bank London 0% A+ A+ A1
Bank of America Securities LLC 0% A A+ A2
Royal Bank of Canada (UK) 0% A- AA Aaa
Societe Generrale 0% A+ A+ Aa2
Goldman Sachs + Co. 0% A A+ A1
Goldman Sachs International 0% A A+ A1
JPMorgan Securities Inc. 0% A+ AA- Aa3
Westpac Banking Corporation 0% AA AA Aa1
Morgan Stanley Capital Services Inc. 0% A A A2 Credit Risk: The Pension Fund is exposed to credit risk on hedging derivative instruments that are in asset positions. To minimize its exposure to loss related to credit risk, it is the Pension Fund’s policy to require counterparty collateral posting provisions in its non-exchange-traded hedging derivative instru-ments. These terms require full collateralization of the fair value of hedging derivative instruments in asset positions (net of the effect of applicable netting arrangements) should the counterparty’s credit rating fall below AA as issued by Fitch Ratings and Standard & Poor’s or Aa as issued by Moody’s In-vestors Service. Collateral posted is to be in the form of U.S. Treasury securities held by a third-party custodian. The city has never failed to access collateral when required. It is the Pension Fund’s policy to enter into netting arrangements whenever it has entered into more than one derivative instrument transaction with counterparty. Under the terms of these arrangements, should one party become insolvent or otherwise default on its obligations, close-out netting provisions permit the non-defaulting party to accelerate and terminate all outstanding transactions and net the transactions’ fair values so that a single sum will be owed by, or owed to, the non-defaulting party. The aggregate fair value of hedging derivative instruments in asset positions at June 30, 2010, was $27.9 million. This represents the maximum loss that would be recognized at the reporting date if all counterparties failed to perform as contracted. This maximum exposure is reduced by $2.6 million of collateral or liabilities included in netting arrangements with those counterparties, resulting in a net ex-posure to credit risk of $25.4 million. Interest Rate Swap agreements provide for periodic payments at predetermined future dates between parties based on the change in value of underlying securities, indexes or interest rates. During the year ended June 30, 2010 the Pension Fund entered into interest rate swaps. Under the receive fixed inter-est rate type swap agreements, the Pension Fund receives the fixed interest rate on certain equity or debt securities or indexes in exchange for a fixed charge. The total received fixed interest rate Swaps were $14,315.48. On its pay-variable, received-fixed interest rate swap, as LIBOR increases, the Pen-sion Fund’s net payment on the swap increases. Alternatively, on its pay-fixed, receive-variable interest rate swap, as LIBOR or the SIFMA swap index decreases, the Pension Fund’s net payment on the swap increases. The pay fixed interest rate Swaps were ($423,746.11). The following table show the interest rate swaps including reference rates and interest rate risk disclo-sure for June 30, 2010.
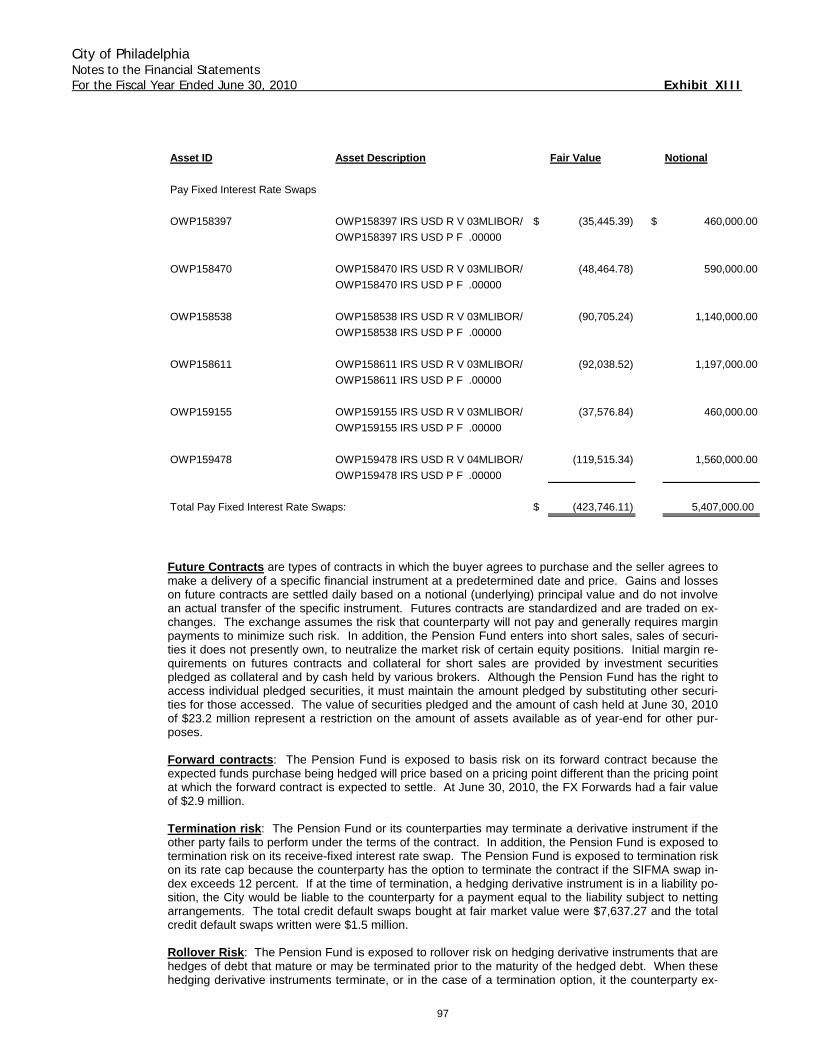
City of Philadelphia Notes to the Financial Statements For the Fiscal Year Ended June 30, 2010 Exhibit XIII
97
Asset ID Asset Description Fair Value Notional
Pay Fixed Interest Rate Swaps
OWP158397 OWP158397 IRS USD R V 03MLIBOR/ $ (35,445.39) $ 460,000.00
OWP158397 IRS USD P F .00000
OWP158470 OWP158470 IRS USD R V 03MLIBOR/ (48,464.78) 590,000.00
OWP158470 IRS USD P F .00000
OWP158538 OWP158538 IRS USD R V 03MLIBOR/ (90,705.24) 1,140,000.00
OWP158538 IRS USD P F .00000
OWP158611 OWP158611 IRS USD R V 03MLIBOR/ (92,038.52) 1,197,000.00
OWP158611 IRS USD P F .00000
OWP159155 OWP159155 IRS USD R V 03MLIBOR/ (37,576.84) 460,000.00
OWP159155 IRS USD P F .00000
OWP159478 OWP159478 IRS USD R V 04MLIBOR/ (119,515.34) 1,560,000.00
OWP159478 IRS USD P F .00000
Total Pay Fixed Interest Rate Swaps: $ (423,746.11) 5,407,000.00
Future Contracts are types of contracts in which the buyer agrees to purchase and the seller agrees to make a delivery of a specific financial instrument at a predetermined date and price. Gains and losses on future contracts are settled daily based on a notional (underlying) principal value and do not involve an actual transfer of the specific instrument. Futures contracts are standardized and are traded on ex-changes. The exchange assumes the risk that counterparty will not pay and generally requires margin payments to minimize such risk. In addition, the Pension Fund enters into short sales, sales of securi-ties it does not presently own, to neutralize the market risk of certain equity positions. Initial margin re-quirements on futures contracts and collateral for short sales are provided by investment securities pledged as collateral and by cash held by various brokers. Although the Pension Fund has the right to access individual pledged securities, it must maintain the amount pledged by substituting other securi-ties for those accessed. The value of securities pledged and the amount of cash held at June 30, 2010 of $23.2 million represent a restriction on the amount of assets available as of year-end for other pur-poses. Forward contracts: The Pension Fund is exposed to basis risk on its forward contract because the expected funds purchase being hedged will price based on a pricing point different than the pricing point at which the forward contract is expected to settle. At June 30, 2010, the FX Forwards had a fair value of $2.9 million. Termination risk: The Pension Fund or its counterparties may terminate a derivative instrument if the other party fails to perform under the terms of the contract. In addition, the Pension Fund is exposed to termination risk on its receive-fixed interest rate swap. The Pension Fund is exposed to termination risk on its rate cap because the counterparty has the option to terminate the contract if the SIFMA swap in-dex exceeds 12 percent. If at the time of termination, a hedging derivative instrument is in a liability po-sition, the City would be liable to the counterparty for a payment equal to the liability subject to netting arrangements. The total credit default swaps bought at fair market value were $7,637.27 and the total credit default swaps written were $1.5 million. Rollover Risk: The Pension Fund is exposed to rollover risk on hedging derivative instruments that are hedges of debt that mature or may be terminated prior to the maturity of the hedged debt. When these hedging derivative instruments terminate, or in the case of a termination option, it the counterparty ex-
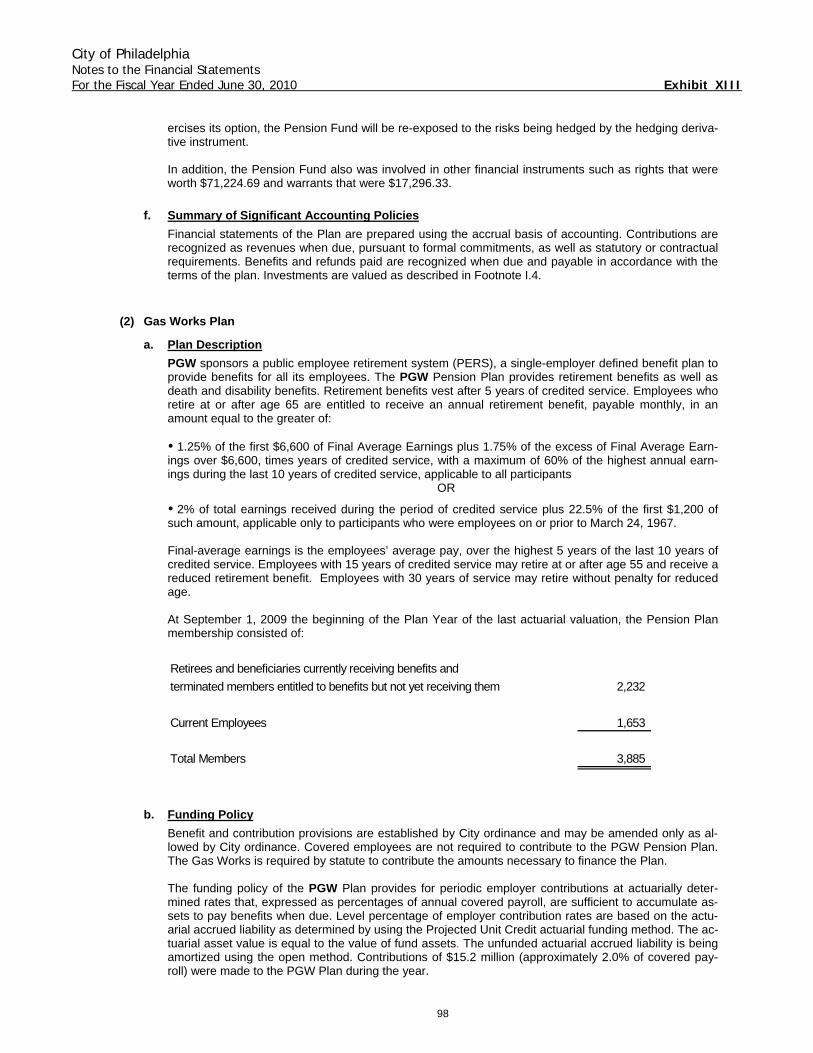
City of Philadelphia Notes to the Financial Statements For the Fiscal Year Ended June 30, 2010 Exhibit XIII
98
ercises its option, the Pension Fund will be re-exposed to the risks being hedged by the hedging deriva-tive instrument. In addition, the Pension Fund also was involved in other financial instruments such as rights that were worth $71,224.69 and warrants that were $17,296.33.
f. Summary of Significant Accounting Policies Financial statements of the Plan are prepared using the accrual basis of accounting. Contributions are recognized as revenues when due, pursuant to formal commitments, as well as statutory or contractual requirements. Benefits and refunds paid are recognized when due and payable in accordance with the terms of the plan. Investments are valued as described in Footnote I.4.
(2) Gas Works Plan
a. Plan Description PGW sponsors a public employee retirement system (PERS), a single-employer defined benefit plan to provide benefits for all its employees. The PGW Pension Plan provides retirement benefits as well as death and disability benefits. Retirement benefits vest after 5 years of credited service. Employees who retire at or after age 65 are entitled to receive an annual retirement benefit, payable monthly, in an amount equal to the greater of: 1.25% of the first $6,600 of Final Average Earnings plus 1.75% of the excess of Final Average Earn-
ings over $6,600, times years of credited service, with a maximum of 60% of the highest annual earn-ings during the last 10 years of credited service, applicable to all participants
OR 2% of total earnings received during the period of credited service plus 22.5% of the first $1,200 of
such amount, applicable only to participants who were employees on or prior to March 24, 1967. Final-average earnings is the employees’ average pay, over the highest 5 years of the last 10 years of credited service. Employees with 15 years of credited service may retire at or after age 55 and receive a reduced retirement benefit. Employees with 30 years of service may retire without penalty for reduced age. At September 1, 2009 the beginning of the Plan Year of the last actuarial valuation, the Pension Plan membership consisted of:
Retirees and beneficiaries currently receiving benefits and
terminated members entitled to benefits but not yet receiving them 2,232
Current Employees 1,653
Total Members 3,885
b. Funding Policy Benefit and contribution provisions are established by City ordinance and may be amended only as al-lowed by City ordinance. Covered employees are not required to contribute to the PGW Pension Plan. The Gas Works is required by statute to contribute the amounts necessary to finance the Plan. The funding policy of the PGW Plan provides for periodic employer contributions at actuarially deter-mined rates that, expressed as percentages of annual covered payroll, are sufficient to accumulate as-sets to pay benefits when due. Level percentage of employer contribution rates are based on the actu-arial accrued liability as determined by using the Projected Unit Credit actuarial funding method. The ac-tuarial asset value is equal to the value of fund assets. The unfunded actuarial accrued liability is being amortized using the open method. Contributions of $15.2 million (approximately 2.0% of covered pay-roll) were made to the PGW Plan during the year.
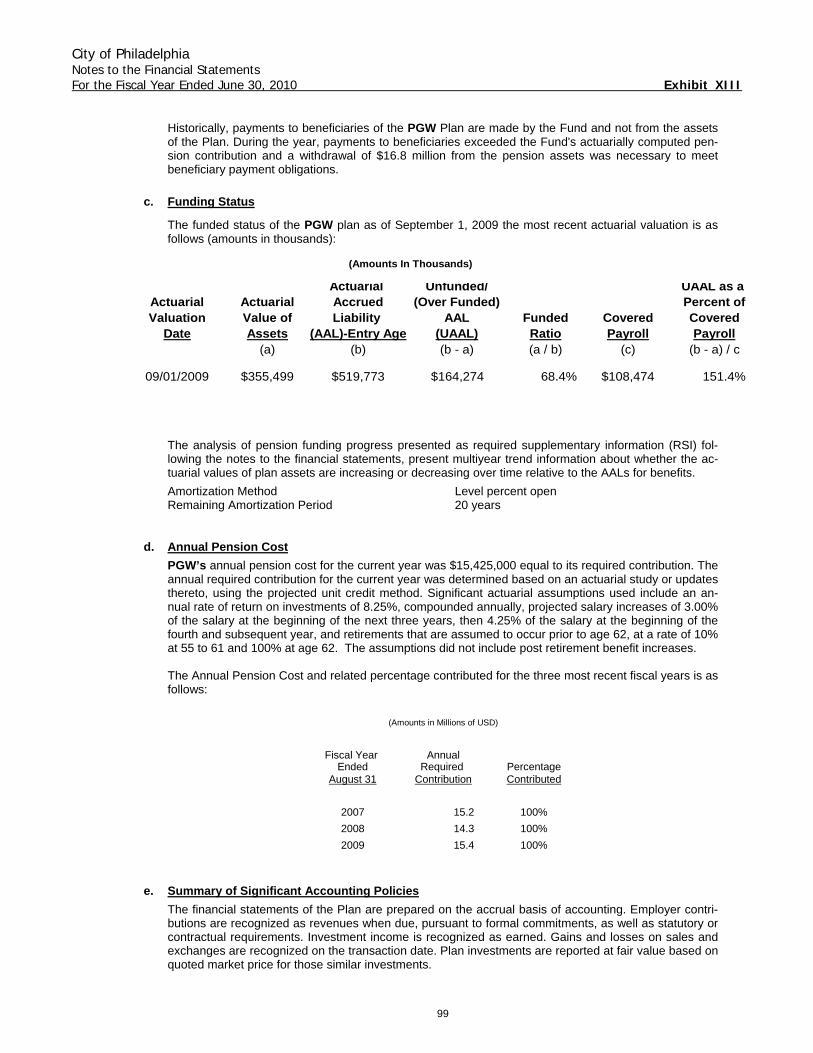
City of Philadelphia Notes to the Financial Statements For the Fiscal Year Ended June 30, 2010 Exhibit XIII
99
Historically, payments to beneficiaries of the PGW Plan are made by the Fund and not from the assets of the Plan. During the year, payments to beneficiaries exceeded the Fund's actuarially computed pen-sion contribution and a withdrawal of $16.8 million from the pension assets was necessary to meet beneficiary payment obligations.
c. Funding Status
The funded status of the PGW plan as of September 1, 2009 the most recent actuarial valuation is as follows (amounts in thousands):
(Amounts In Thousands)
Actuarial Unfunded/ UAAL as a Actuarial Actuarial Accrued (Over Funded) Percent ofValuation Value of Liability AAL Funded Covered Covered
Date Assets (AAL)-Entry Age (UAAL) Ratio Payroll Payroll(a) (b) (b - a) (a / b) (c) (b - a) / c
09/01/2009 $355,499 $519,773 $164,274 68.4% $108,474 151.4%
The analysis of pension funding progress presented as required supplementary information (RSI) fol-lowing the notes to the financial statements, present multiyear trend information about whether the ac-tuarial values of plan assets are increasing or decreasing over time relative to the AALs for benefits.
Amortization Method Level percent open Remaining Amortization Period 20 years
d. Annual Pension Cost PGW’s annual pension cost for the current year was $15,425,000 equal to its required contribution. The annual required contribution for the current year was determined based on an actuarial study or updates thereto, using the projected unit credit method. Significant actuarial assumptions used include an an-nual rate of return on investments of 8.25%, compounded annually, projected salary increases of 3.00% of the salary at the beginning of the next three years, then 4.25% of the salary at the beginning of the fourth and subsequent year, and retirements that are assumed to occur prior to age 62, at a rate of 10% at 55 to 61 and 100% at age 62. The assumptions did not include post retirement benefit increases. The Annual Pension Cost and related percentage contributed for the three most recent fiscal years is as follows:
(Amounts in Millions of USD)
Fiscal Year AnnualEnded Required Percentage
August 31 Contribution Contributed
2007 15.2 100%
2008 14.3 100%
2009 15.4 100%
e. Summary of Significant Accounting Policies The financial statements of the Plan are prepared on the accrual basis of accounting. Employer contri-butions are recognized as revenues when due, pursuant to formal commitments, as well as statutory or contractual requirements. Investment income is recognized as earned. Gains and losses on sales and exchanges are recognized on the transaction date. Plan investments are reported at fair value based on quoted market price for those similar investments.
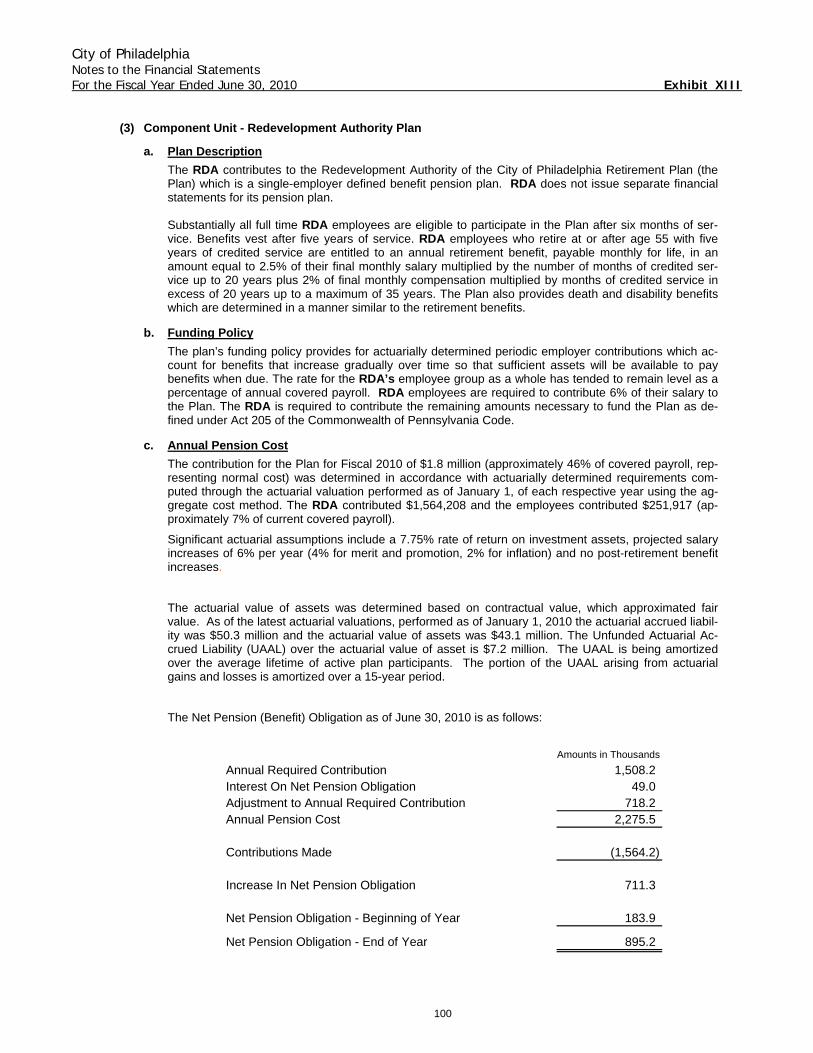
City of Philadelphia Notes to the Financial Statements For the Fiscal Year Ended June 30, 2010 Exhibit XIII
100
(3) Component Unit - Redevelopment Authority Plan
a. Plan Description The RDA contributes to the Redevelopment Authority of the City of Philadelphia Retirement Plan (the Plan) which is a single-employer defined benefit pension plan. RDA does not issue separate financial statements for its pension plan. Substantially all full time RDA employees are eligible to participate in the Plan after six months of ser-vice. Benefits vest after five years of service. RDA employees who retire at or after age 55 with five years of credited service are entitled to an annual retirement benefit, payable monthly for life, in an amount equal to 2.5% of their final monthly salary multiplied by the number of months of credited ser-vice up to 20 years plus 2% of final monthly compensation multiplied by months of credited service in excess of 20 years up to a maximum of 35 years. The Plan also provides death and disability benefits which are determined in a manner similar to the retirement benefits.
b. Funding Policy The plan’s funding policy provides for actuarially determined periodic employer contributions which ac-count for benefits that increase gradually over time so that sufficient assets will be available to pay benefits when due. The rate for the RDA’s employee group as a whole has tended to remain level as a percentage of annual covered payroll. RDA employees are required to contribute 6% of their salary to the Plan. The RDA is required to contribute the remaining amounts necessary to fund the Plan as de-fined under Act 205 of the Commonwealth of Pennsylvania Code.
c. Annual Pension Cost The contribution for the Plan for Fiscal 2010 of $1.8 million (approximately 46% of covered payroll, rep-resenting normal cost) was determined in accordance with actuarially determined requirements com-puted through the actuarial valuation performed as of January 1, of each respective year using the ag-gregate cost method. The RDA contributed $1,564,208 and the employees contributed $251,917 (ap-proximately 7% of current covered payroll).
Significant actuarial assumptions include a 7.75% rate of return on investment assets, projected salary increases of 6% per year (4% for merit and promotion, 2% for inflation) and no post-retirement benefit increases.
The actuarial value of assets was determined based on contractual value, which approximated fair value. As of the latest actuarial valuations, performed as of January 1, 2010 the actuarial accrued liabil-ity was $50.3 million and the actuarial value of assets was $43.1 million. The Unfunded Actuarial Ac-crued Liability (UAAL) over the actuarial value of asset is $7.2 million. The UAAL is being amortized over the average lifetime of active plan participants. The portion of the UAAL arising from actuarial gains and losses is amortized over a 15-year period.
The Net Pension (Benefit) Obligation as of June 30, 2010 is as follows:
Amounts in Thousands
Annual Required Contribution 1,508.2Interest On Net Pension Obligation 49.0Adjustment to Annual Required Contribution 718.2Annual Pension Cost 2,275.5
Contributions Made (1,564.2)
Increase In Net Pension Obligation 711.3
Net Pension Obligation - Beginning of Year 183.9
Net Pension Obligation - End of Year 895.2
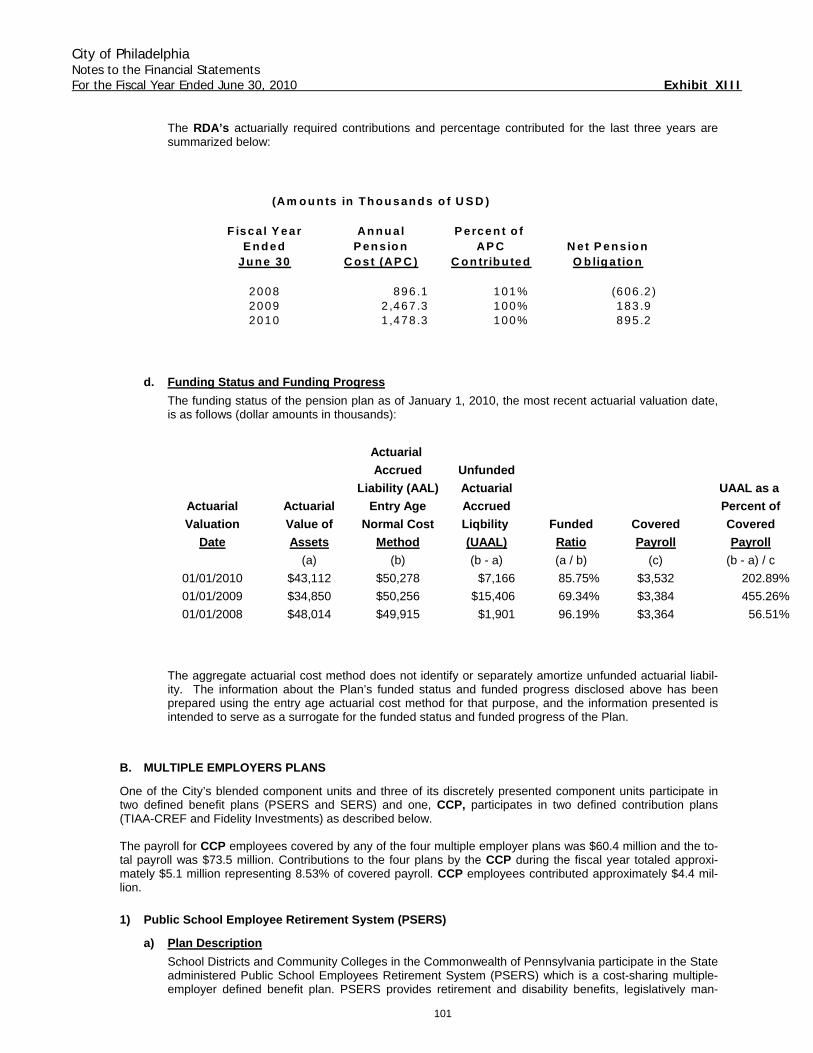
City of Philadelphia Notes to the Financial Statements For the Fiscal Year Ended June 30, 2010 Exhibit XIII
101
The RDA’s actuarially required contributions and percentage contributed for the last three years are summarized below:
(Am o u n ts in Th o u san d s o f U S D )
F isca l Y ear An n u a l P ercen t o f E n d ed P en s io n AP C N et P en s io n
Ju n e 30 C o st (AP C ) C o n trib u ted O b lig a tio n
2008 896 .1 101% (606 .2 ) 2009 2 ,467 .3 100% 183 .9 2010 1 ,478 .3 100% 895 .2
d. Funding Status and Funding Progress The funding status of the pension plan as of January 1, 2010, the most recent actuarial valuation date, is as follows (dollar amounts in thousands):
Actuarial Accrued Unfunded
Liability (AAL) Actuarial UAAL as a Actuarial Actuarial Entry Age Accrued Percent ofValuation Value of Normal Cost Liqbility Funded Covered Covered
Date Assets Method (UAAL) Ratio Payroll Payroll(a) (b) (b - a) (a / b) (c) (b - a) / c
01/01/2010 $43,112 $50,278 $7,166 85.75% $3,532 202.89%
01/01/2009 $34,850 $50,256 $15,406 69.34% $3,384 455.26%
01/01/2008 $48,014 $49,915 $1,901 96.19% $3,364 56.51%
The aggregate actuarial cost method does not identify or separately amortize unfunded actuarial liabil-ity. The information about the Plan’s funded status and funded progress disclosed above has been prepared using the entry age actuarial cost method for that purpose, and the information presented is intended to serve as a surrogate for the funded status and funded progress of the Plan.
B. MULTIPLE EMPLOYERS PLANS
One of the City’s blended component units and three of its discretely presented component units participate in two defined benefit plans (PSERS and SERS) and one, CCP, participates in two defined contribution plans (TIAA-CREF and Fidelity Investments) as described below. The payroll for CCP employees covered by any of the four multiple employer plans was $60.4 million and the to-tal payroll was $73.5 million. Contributions to the four plans by the CCP during the fiscal year totaled approxi-mately $5.1 million representing 8.53% of covered payroll. CCP employees contributed approximately $4.4 mil-lion.
1) Public School Employee Retirement System (PSERS)
a) Plan Description School Districts and Community Colleges in the Commonwealth of Pennsylvania participate in the State administered Public School Employees Retirement System (PSERS) which is a cost-sharing multiple-employer defined benefit plan. PSERS provides retirement and disability benefits, legislatively man-
City of Philadelphia Notes to the Financial Statements For the Fiscal Year Ended June 30, 2010 Exhibit XIII
102
dated ad hoc cost-of-living adjustments and health care insurance premium assistance to qualifying an-nuitants. Authority to establish and amend benefit provisions rests in the Public School Employees’ Re-tirement Code (the Code). PSERS issues a comprehensive annual financial report which includes financial statements and re-quired supplementary information for the plan. A copy of the report can be obtained by writing to: Public School Employees' Retirement System PO Box 125 Harrisburg, PA 17108-0125
b) Funding Policy Contribution policy is established by the Code and requires contributions from active members, employ-ers and the Commonwealth. Most active members contribute at 5.25% of qualifying compensation. Members joining the PSERS on or after July 22, 1983 contribute at 6.25% (class TC) or 7.50% (class TD). The employer rate is actuarially determined. The rate for fiscal year 2010 was 4.78%, and is com-posed of a pension contribution rate of 4.00% for pension benefits and .78% for health insurance pre-mium assistance. The SDP’s contributions for the last three years are as follows:
Fiscal Year AnnualEnded Required Percentage
June 30 Contribution Contributed
2008 78.2 100%
2009 58.4 100%
2010 58.4 100%
(Amounts in Millions of USD)
2) State Employees Retirement System (SERS)
a) Plan Description PICA and PCCA employees and certain CCP employees are eligible to participate in the Pennsylvania State Employees Retirement System (SERS) which is a cost sharing multiple employer plan. The SERS provides pension, death and disability benefits. Retirement benefits vest after 5 years of credited service. Employees, who retire at age 60 after 3 years of service or with 35 years of service if under age 60, are entitled to a normal annual retirement benefit. The general annual benefit is 2% to 2.5% of the member's highest three year average salary times years of service. The General Assembly has the authority to establish and amend benefits of the SERS. Ad hoc cost-of-living adjustments are provided at the discretion of the General Assembly.
b) Funding Policy The SERS funding policy is set by the SERS Board. Active members are required to contribute periodi-cally at statutory rates, generally 5 to 6.25% of gross pay. The amount is recorded in an individually identified account that accumulates interest at 4% per year as mandated by statute. Accumulated em-ployee contributions and credited interest vest immediately and are returned to the employee upon ter-mination of service if the employee is not eligible for other benefits. Employer contributions are an actuarially determined percentage of payroll such that they, along with employee contributions and an actuarially determined investment rate of return, are adequate to accu-mulate assets to pay benefits when due. In May 2001, the PCCA initiated Act 2001-9 which created a new Class AA membership, changed the vesting requirements of all members from 10 to 5 years, increased the member contribution rate from 5% to 6.25% and increased the benefit formula to 2.5% of final average salary. New members are
City of Philadelphia Notes to the Financial Statements For the Fiscal Year Ended June 30, 2010 Exhibit XIII
103
automatically enrolled as Class AA. However, election for current members at the time of enactment was voluntary. Contributions of the PCCA for the last three years were as follows:
(Amounts in Thousands of USD)
Fiscal Year AnnualEnded Required Percentage
June 30 Contribution Contributed
2008 172.7 100%2009 191.9 100%2010 163.5 100%
PICA has not been required to contribute over the past three years. According to the retirement code, all obligations of the SERS will be assumed by the Commonwealth should the SERS terminate. During the year and as of year end, the SERS did not hold securities is-sued by the City or other related parties.
The SERS issues a publicly available financial report that includes financial statements and required supplementary information which may be obtained by writing to: State Employees’ Retirement Board Commonwealth of Pennsylvania 30 North Third Street Harrisburg, PA 17108-1147
3) Teacher’s Insurance and Annuity Association-College Retirement Equities Fund (TIAA-CREF) and Fidelity Investments
a) Plan Description Community College employees are also eligible to participate in the Teacher's Insurance and Annuity Association - College Retirement Equities Fund (TIAA-CREF). TIAA-CREF is a defined contribution plan and, as such, benefits depend solely on amounts contributed to the plan plus investment earnings. Full-time faculty and administrative employees are eligible to participate from the date of employment, and clerical employees have a one year waiting period. Part-time faculty may participate after earning four (4) seniority units, as defined in the Collective Bargaining Agreement. College policy and collective bargaining agreements require that both the employee and the college contribute amounts, as set forth below, based on the employees earnings. The CCP contributions for each employee (and interest allocated to the employee's account), are fully vested. Death benefits in the amount of the full present value of accumulation are provided to the bene-ficiary of participants who die prior to retirement. There are a variety of payments available. The CCP has 1,170 employees participating in this plan.
b) Funding Policy The employer’s contribution requirement for full-time faculty and administrators and other staff is 10% of the base contract amount. For visiting lecturers, the rate is 5% of the base contract. For part-time fac-ulty, the rate is 5% of all earnings. For all employees, the employee’s contribution requirement is 5% of base salary.
2. ACCUMULATED UNPAID SICK LEAVE
City and certain component unit employees are credited with varying amounts of sick leave according to type of employee and/or length of service. City employees may accumulate unused sick leave to predetermined bal-
City of Philadelphia Notes to the Financial Statements For the Fiscal Year Ended June 30, 2010 Exhibit XIII
104
ances. SDP employees have an unlimited maximum accumulation and Gas Works' employees' sick leave is non-cumulative. Non-uniformed employees (upon retirement only) and uniformed employees (upon retirement or in case of death while on active duty) are paid varying amounts ranging from 25% to 50% of unused sick time, not to exceed predetermined amounts. Employees, who separate for any reason other than indicated above, forfeit their entire sick leave. The City budgets for and charges the cost of sick leave as it is taken.
3. OTHER POST EMPLOYMENT BENEFITS (OPEB)
A. PRIMARY GOVERNMENT
Plan description: The City of Philadelphia self-administers a single employer, defined benefit plan and provides health care for five years subsequent to separation for eligible retirees. Certain union represented employees may defer their coverage until a later date but the amount that the City pays for their health care is limited to the amount that the City would have paid at the date of their retirement. The City also provides lifetime insurance coverage for all eligible retirees. Firefighters are entitled to $7,500 coverage and all other employees receive $6,000 in coverage. The plan does not issue stand alone financial statements, and the accounting for the plan is reported within the financial statements of the City of Philadelphia. Funding Policy: The City funds its retiree benefits on a pay-as-you-go basis. To provide health care coverage, the City pays a negotiated monthly premium for retirees covered by union contracts and is self insured for non-union employees. For fiscal year 2010, the City paid $71.7 million for retiree healthcare. Annual OPEB Cost and Net OPEB Obligation: The City’s annual other post employment benefit (OPEB) ex-pense is calculated based on the annual required contribution of the employer (ARC), an amount actuarially de-termined in accordance with the parameters of GASB Statement No. 45. The ARC represents a level of funding, which if paid on an ongoing basis, is projected to cover normal cost each year and amortize any unfunded actu-arial liabilities over a period not to exceed thirty (30) years. The following table shows the components of the City’s annual OPEB cost for the year, the amount actually contributed to the plan and changes in the net OPEB obligation (dollar amount in thousands)
City of Philadelphia OPEB
(Amounts in Thousands)
Annual required contribution 93,602 Interest on net OPEB obligation 1,057 Adjustment to ARC (815) Annual OPEB cost 93,844 Payments made (71,693) Increase/(Decrease) in net OPEB Obligation 22,151
Net OPEB obligation - beginning of year 21,150
Net OPEB obligation - end of year 43,301
The City of Philadelphia’s annual OPEB cost, the percentage of annual OPEB cost contributed to the Plan, and the net OPEB obligation for the fiscal year ended June 30, 2010 was as follows:
amounts in thousands USD
Annual Percentage of
Fiscal Year OPEB Annual OPEB Net OPEB
Ended Cost Contributed Obligation
6/30/2010 $ 93,844 76% $ 43,301
6/30/2009 $ 98,733 82% $ 21,150
6/30/2008 $ 83,373 96% $ 3,668
City of Philadelphia Notes to the Financial Statements For the Fiscal Year Ended June 30, 2010 Exhibit XIII
105
Funded Status and Funding Progress: As of July 1, 2009, the most recent actuarial valuation date, the City is funding OPEB on a pay as you go basis and accordingly, the unfunded actuarial accrued liability for benefits was $1.1 billion. The covered annual payroll was $ 1.463 billion and the ratio of the UAAL to the covered payroll was 79.0 percent. The required schedule of funding progress immediately following the notes to the financial statements presents multi-year trend information about whether the actuarial value of the plan assets is increasing or decreasing over time relative to the actuarial accrued liability for benefits. The projections of future benefit payments for an ongoing plan obligation involves estimates of the value of re-ported amounts and assumptions about the probability of occurrence of events far into the future. Amounts de-termined regarding the funded status of the obligation and the contributions of the employer are subject to con-tinual revision as actual results are compared with past expectations and new estimates are made about the fu-ture. Actuarial Methods and Assumptions: Projections of costs for financial reporting purposes are based on the types of benefits provided under the terms of the substantive plan at the time of each valuation and on the pat-tern of sharing costs between the employer and plan members to that point. Costs were determined according to the individual entry age actuarial cost method with the attribution period ending at each decrement age. This is consistent with the cost method used for the City of Philadelphia Munici-pal Retirement System. The city uses a level percent open approach as its method of amortization. Unfunded liabilities are funded over a 30 year period as a level percentage of payroll, which is assumed to increase at a compound annual rate of 4% per year. The actuarial assumption included a 5.0% compound annual interest rate on the City’s general investments. The current plan incorporates the following assumptions: no post-retirement benefit increases since last year; a 5% Investment Rate of Return, a 4% Rate of Salary increases; and, a 5% Ul-timate Rate of Medical Inflation.
B. COMPONENT UNITS
School District of Philadelphia (SDP) OPEB From an accrual accounting perspective, the cost of post-employment life insurance benefits, like the cost of pension benefits, generally should be associated with the periods in which the costs occurs, rather than in the fu-ture when it will be paid. In adopting the requirements of GASB Statement No. 45, during the year ended June, 2008, SDP recognizes the costs of post-employment life insurance in the year when the employee services are received, reports the accumulated liability from prior years, and provide information useful in assessing potential demands of the SDP’s future cash flows. Recognition of the liability accumulated from prior years will be phased in over 30 years, commencing in 2008. Plan description: SDP provides up to $2,000 of life insurance coverage for retired and disabled employees. A retired employee is eligible for this benefit if covered for 10 years as an active employee and retired at age 60 with 30 years of service or age 62 with 10 years of service or 35 years of service regardless of age. Disabled employees’ eligibility is determined by the insurance company providing the coverage. An un-audited copy of the life insurance benefit plan can be obtained by writing to the School District of Philadelphia, 440 North Broad Street, Philadelphia, PA. 19130; Attention: Benefits Management. Funding Policy: SDP is not required by law or contractual agreement to provide funding for the life insurance benefits other than the pay-as-you-go amount necessary to provide current benefits to retirees and eligible dis-abled employees. The number of eligible participants enrolled to receive such benefits as of June 30, 2008, the effective date of the bi-annual OPEB valuation is below. There have been no significant changes in the number covered or the type of coverage since that date.
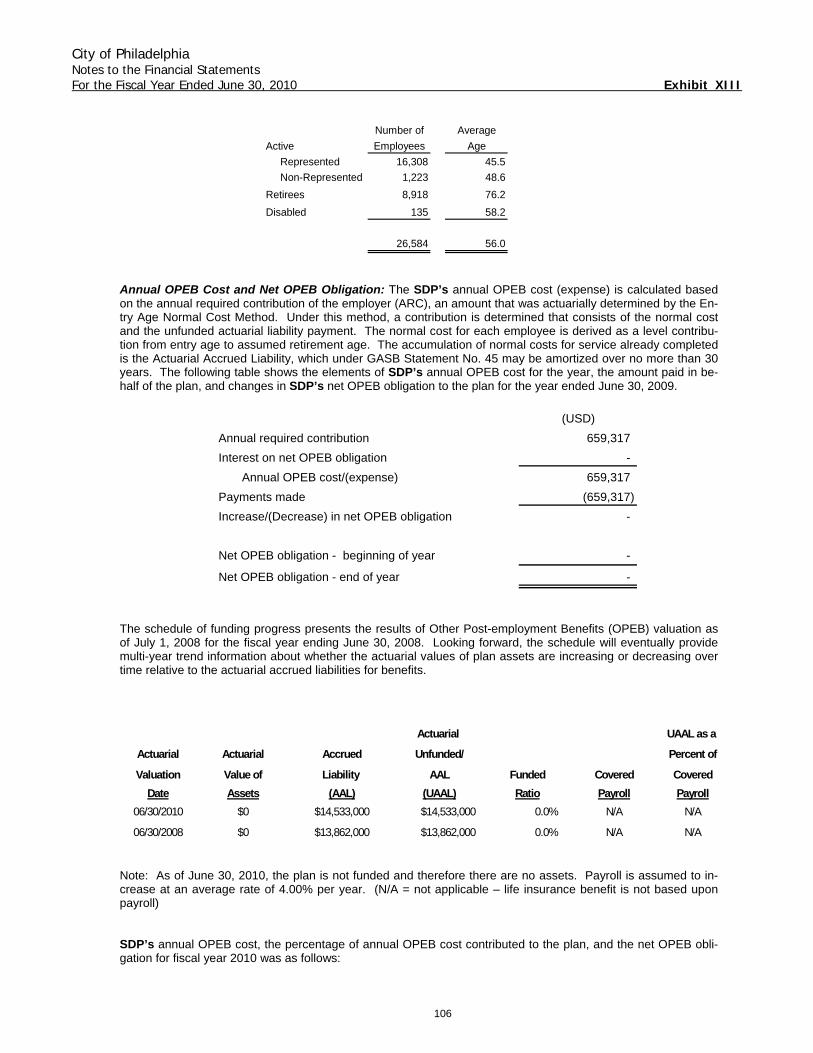
City of Philadelphia Notes to the Financial Statements For the Fiscal Year Ended June 30, 2010 Exhibit XIII
106
Number of Average
Active Employees Age
Represented 16,308 45.5
Non-Represented 1,223 48.6
Retirees 8,918 76.2
Disabled 135 58.2
26,584 56.0
Annual OPEB Cost and Net OPEB Obligation: The SDP’s annual OPEB cost (expense) is calculated based on the annual required contribution of the employer (ARC), an amount that was actuarially determined by the En-try Age Normal Cost Method. Under this method, a contribution is determined that consists of the normal cost and the unfunded actuarial liability payment. The normal cost for each employee is derived as a level contribu-tion from entry age to assumed retirement age. The accumulation of normal costs for service already completed is the Actuarial Accrued Liability, which under GASB Statement No. 45 may be amortized over no more than 30 years. The following table shows the elements of SDP’s annual OPEB cost for the year, the amount paid in be-half of the plan, and changes in SDP’s net OPEB obligation to the plan for the year ended June 30, 2009.
(USD)
Annual required contribution 659,317
Interest on net OPEB obligation -
Annual OPEB cost/(expense) 659,317
Payments made (659,317)
Increase/(Decrease) in net OPEB obligation -
Net OPEB obligation - beginning of year -
Net OPEB obligation - end of year -
The schedule of funding progress presents the results of Other Post-employment Benefits (OPEB) valuation as of July 1, 2008 for the fiscal year ending June 30, 2008. Looking forward, the schedule will eventually provide multi-year trend information about whether the actuarial values of plan assets are increasing or decreasing over time relative to the actuarial accrued liabilities for benefits.
Actuarial UAAL as a
Actuarial Actuarial Accrued Unfunded/ Percent of
Valuation Value of Liability AAL Funded Covered CoveredDate Assets (AAL) (UAAL) Ratio Payroll Payroll
06/30/2010 $0 $14,533,000 $14,533,000 0.0% N/A N/A
06/30/2008 $0 $13,862,000 $13,862,000 0.0% N/A N/A
Note: As of June 30, 2010, the plan is not funded and therefore there are no assets. Payroll is assumed to in-crease at an average rate of 4.00% per year. (N/A = not applicable – life insurance benefit is not based upon payroll) SDP’s annual OPEB cost, the percentage of annual OPEB cost contributed to the plan, and the net OPEB obli-gation for fiscal year 2010 was as follows:
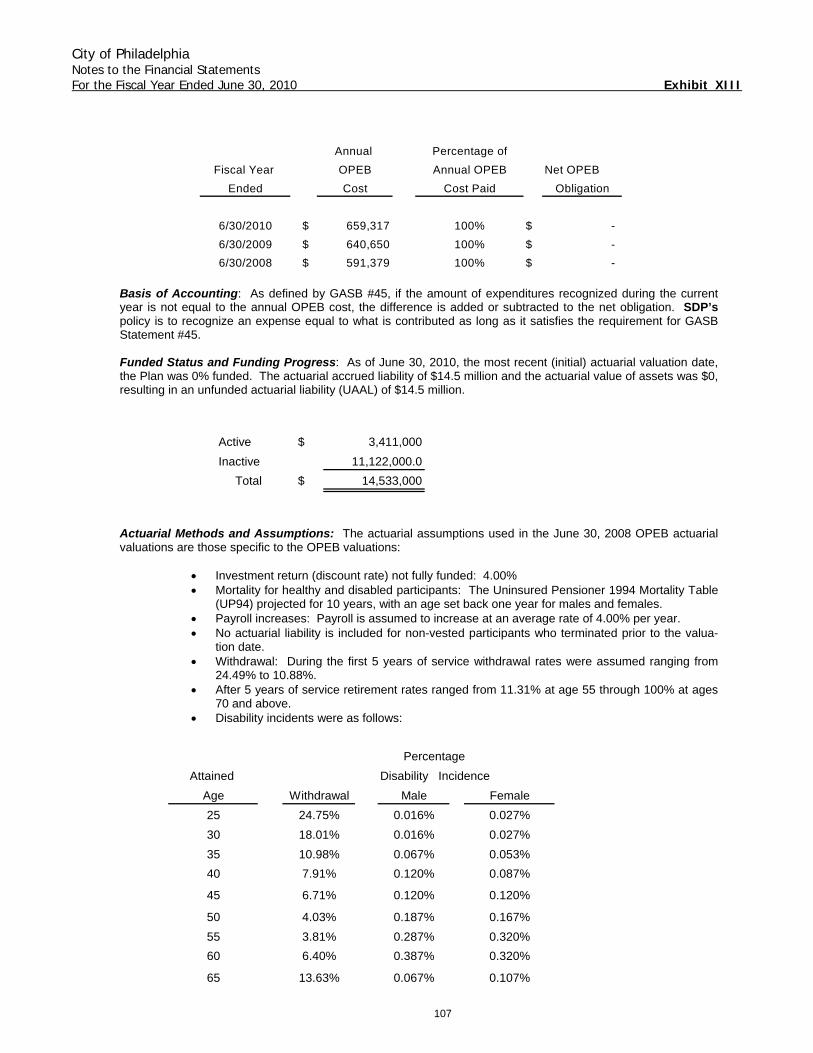
City of Philadelphia Notes to the Financial Statements For the Fiscal Year Ended June 30, 2010 Exhibit XIII
107
Annual Percentage of
Fiscal Year OPEB Annual OPEB Net OPEB
Ended Cost Cost Paid Obligation
6/30/2010 $ 659,317 100% $ -
6/30/2009 $ 640,650 100% $ -
6/30/2008 $ 591,379 100% $ - Basis of Accounting: As defined by GASB #45, if the amount of expenditures recognized during the current year is not equal to the annual OPEB cost, the difference is added or subtracted to the net obligation. SDP’s policy is to recognize an expense equal to what is contributed as long as it satisfies the requirement for GASB Statement #45. Funded Status and Funding Progress: As of June 30, 2010, the most recent (initial) actuarial valuation date, the Plan was 0% funded. The actuarial accrued liability of $14.5 million and the actuarial value of assets was $0, resulting in an unfunded actuarial liability (UAAL) of $14.5 million.
Active $ 3,411,000
Inactive 11,122,000.0
Total $ 14,533,000
Actuarial Methods and Assumptions: The actuarial assumptions used in the June 30, 2008 OPEB actuarial valuations are those specific to the OPEB valuations:
• Investment return (discount rate) not fully funded: 4.00% • Mortality for healthy and disabled participants: The Uninsured Pensioner 1994 Mortality Table
(UP94) projected for 10 years, with an age set back one year for males and females. • Payroll increases: Payroll is assumed to increase at an average rate of 4.00% per year. • No actuarial liability is included for non-vested participants who terminated prior to the valua-
tion date. • Withdrawal: During the first 5 years of service withdrawal rates were assumed ranging from
24.49% to 10.88%. • After 5 years of service retirement rates ranged from 11.31% at age 55 through 100% at ages
70 and above. • Disability incidents were as follows:
Percentage
Attained Disability Incidence
Age Withdrawal Male Female
25 24.75% 0.016% 0.027%
30 18.01% 0.016% 0.027%
35 10.98% 0.067% 0.053%
40 7.91% 0.120% 0.087%
45 6.71% 0.120% 0.120%
50 4.03% 0.187% 0.167%
55 3.81% 0.287% 0.320%
60 6.40% 0.387% 0.320%
65 13.63% 0.067% 0.107%
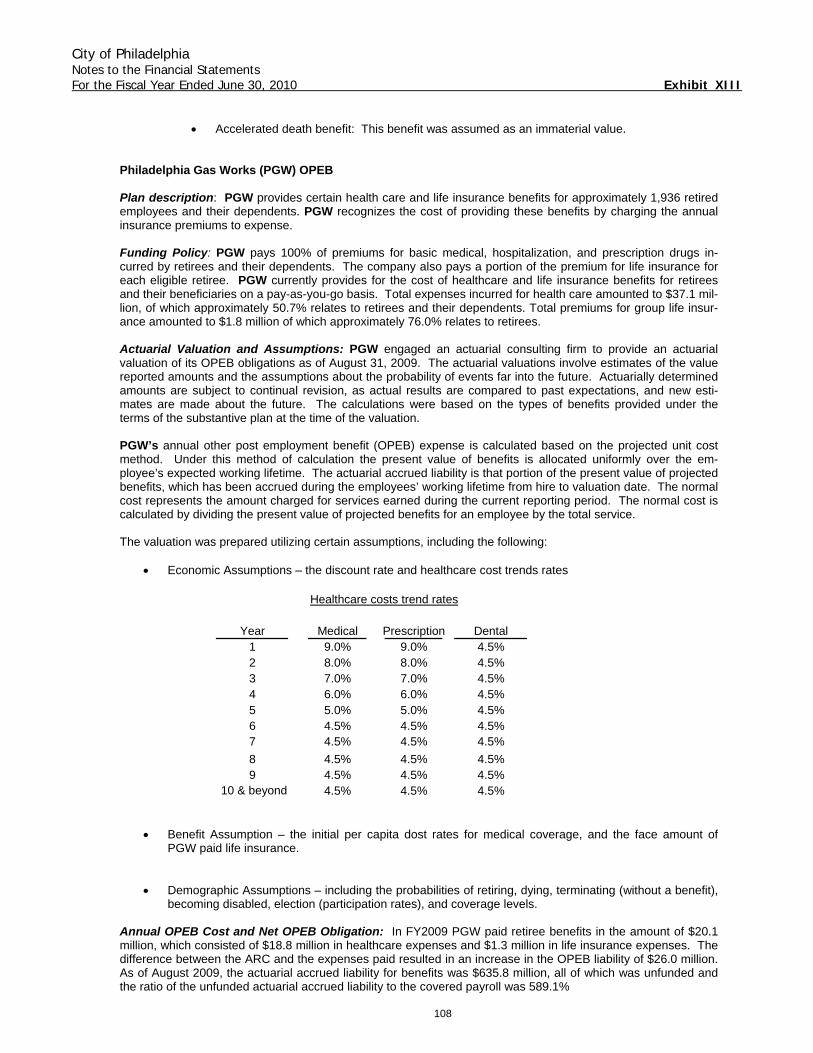
City of Philadelphia Notes to the Financial Statements For the Fiscal Year Ended June 30, 2010 Exhibit XIII
108
• Accelerated death benefit: This benefit was assumed as an immaterial value. Philadelphia Gas Works (PGW) OPEB Plan description: PGW provides certain health care and life insurance benefits for approximately 1,936 retired employees and their dependents. PGW recognizes the cost of providing these benefits by charging the annual insurance premiums to expense. Funding Policy: PGW pays 100% of premiums for basic medical, hospitalization, and prescription drugs in-curred by retirees and their dependents. The company also pays a portion of the premium for life insurance for each eligible retiree. PGW currently provides for the cost of healthcare and life insurance benefits for retirees and their beneficiaries on a pay-as-you-go basis. Total expenses incurred for health care amounted to $37.1 mil-lion, of which approximately 50.7% relates to retirees and their dependents. Total premiums for group life insur-ance amounted to $1.8 million of which approximately 76.0% relates to retirees. Actuarial Valuation and Assumptions: PGW engaged an actuarial consulting firm to provide an actuarial valuation of its OPEB obligations as of August 31, 2009. The actuarial valuations involve estimates of the value reported amounts and the assumptions about the probability of events far into the future. Actuarially determined amounts are subject to continual revision, as actual results are compared to past expectations, and new esti-mates are made about the future. The calculations were based on the types of benefits provided under the terms of the substantive plan at the time of the valuation. PGW’s annual other post employment benefit (OPEB) expense is calculated based on the projected unit cost method. Under this method of calculation the present value of benefits is allocated uniformly over the em-ployee’s expected working lifetime. The actuarial accrued liability is that portion of the present value of projected benefits, which has been accrued during the employees’ working lifetime from hire to valuation date. The normal cost represents the amount charged for services earned during the current reporting period. The normal cost is calculated by dividing the present value of projected benefits for an employee by the total service. The valuation was prepared utilizing certain assumptions, including the following:
• Economic Assumptions – the discount rate and healthcare cost trends rates
Healthcare costs trend rates
Year Medical Prescription Dental1 9.0% 9.0% 4.5%2 8.0% 8.0% 4.5%3 7.0% 7.0% 4.5%4 6.0% 6.0% 4.5%5 5.0% 5.0% 4.5%6 4.5% 4.5% 4.5%7 4.5% 4.5% 4.5%
8 4.5% 4.5% 4.5%9 4.5% 4.5% 4.5%
10 & beyond 4.5% 4.5% 4.5% • Benefit Assumption – the initial per capita dost rates for medical coverage, and the face amount of
PGW paid life insurance.
• Demographic Assumptions – including the probabilities of retiring, dying, terminating (without a benefit),
becoming disabled, election (participation rates), and coverage levels. Annual OPEB Cost and Net OPEB Obligation: In FY2009 PGW paid retiree benefits in the amount of $20.1 million, which consisted of $18.8 million in healthcare expenses and $1.3 million in life insurance expenses. The difference between the ARC and the expenses paid resulted in an increase in the OPEB liability of $26.0 million. As of August 2009, the actuarial accrued liability for benefits was $635.8 million, all of which was unfunded and the ratio of the unfunded actuarial accrued liability to the covered payroll was 589.1%
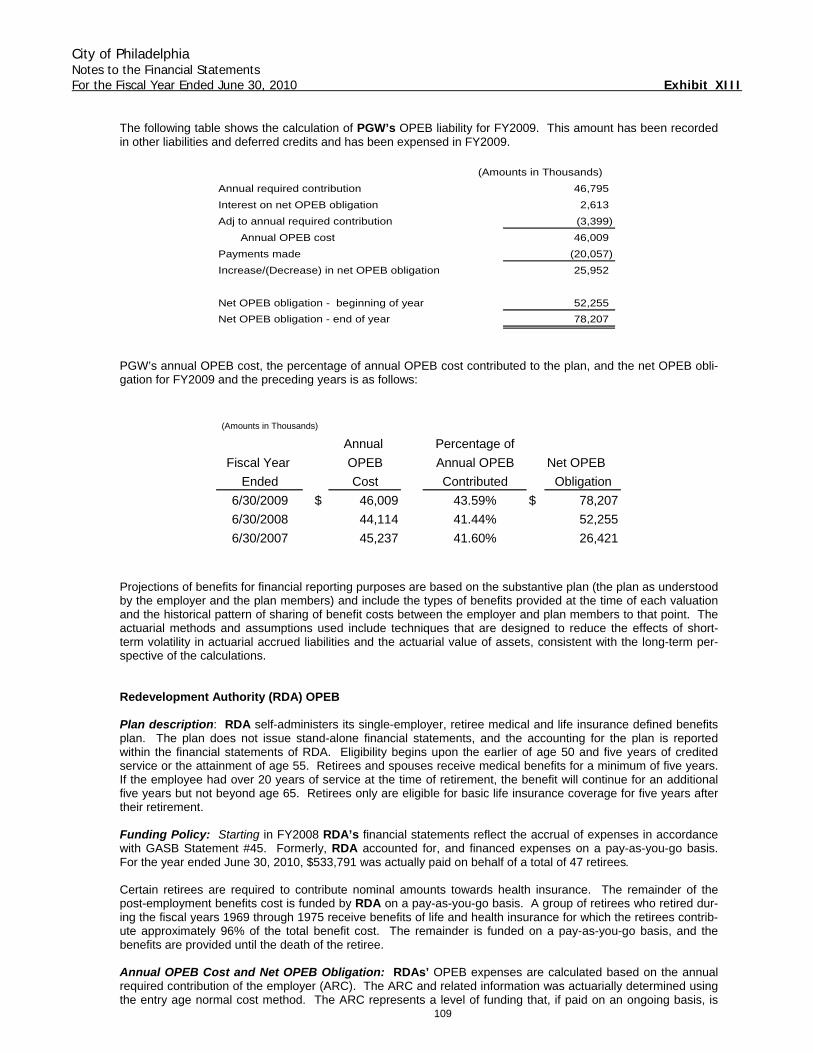
City of Philadelphia Notes to the Financial Statements For the Fiscal Year Ended June 30, 2010 Exhibit XIII
109
The following table shows the calculation of PGW’s OPEB liability for FY2009. This amount has been recorded in other liabilities and deferred credits and has been expensed in FY2009.
(Amounts in Thousands)
Annual required contribution 46,795
Interest on net OPEB obligation 2,613
Adj to annual required contribution (3,399)
Annual OPEB cost 46,009
Payments made (20,057)
Increase/(Decrease) in net OPEB obligation 25,952
Net OPEB obligation - beginning of year 52,255
Net OPEB obligation - end of year 78,207
PGW’s annual OPEB cost, the percentage of annual OPEB cost contributed to the plan, and the net OPEB obli-gation for FY2009 and the preceding years is as follows:
(Amounts in Thousands)
Annual Percentage of
Fiscal Year OPEB Annual OPEB Net OPEB
Ended Cost Contributed Obligation
6/30/2009 $ 46,009 43.59% $ 78,207
6/30/2008 44,114 41.44% 52,255
6/30/2007 45,237 41.60% 26,421
Projections of benefits for financial reporting purposes are based on the substantive plan (the plan as understood by the employer and the plan members) and include the types of benefits provided at the time of each valuation and the historical pattern of sharing of benefit costs between the employer and plan members to that point. The actuarial methods and assumptions used include techniques that are designed to reduce the effects of short-term volatility in actuarial accrued liabilities and the actuarial value of assets, consistent with the long-term per-spective of the calculations. Redevelopment Authority (RDA) OPEB Plan description: RDA self-administers its single-employer, retiree medical and life insurance defined benefits plan. The plan does not issue stand-alone financial statements, and the accounting for the plan is reported within the financial statements of RDA. Eligibility begins upon the earlier of age 50 and five years of credited service or the attainment of age 55. Retirees and spouses receive medical benefits for a minimum of five years. If the employee had over 20 years of service at the time of retirement, the benefit will continue for an additional five years but not beyond age 65. Retirees only are eligible for basic life insurance coverage for five years after their retirement. Funding Policy: Starting in FY2008 RDA’s financial statements reflect the accrual of expenses in accordance with GASB Statement #45. Formerly, RDA accounted for, and financed expenses on a pay-as-you-go basis. For the year ended June 30, 2010, $533,791 was actually paid on behalf of a total of 47 retirees. Certain retirees are required to contribute nominal amounts towards health insurance. The remainder of the post-employment benefits cost is funded by RDA on a pay-as-you-go basis. A group of retirees who retired dur-ing the fiscal years 1969 through 1975 receive benefits of life and health insurance for which the retirees contrib-ute approximately 96% of the total benefit cost. The remainder is funded on a pay-as-you-go basis, and the benefits are provided until the death of the retiree. Annual OPEB Cost and Net OPEB Obligation: RDAs’ OPEB expenses are calculated based on the annual required contribution of the employer (ARC). The ARC and related information was actuarially determined using the entry age normal cost method. The ARC represents a level of funding that, if paid on an ongoing basis, is
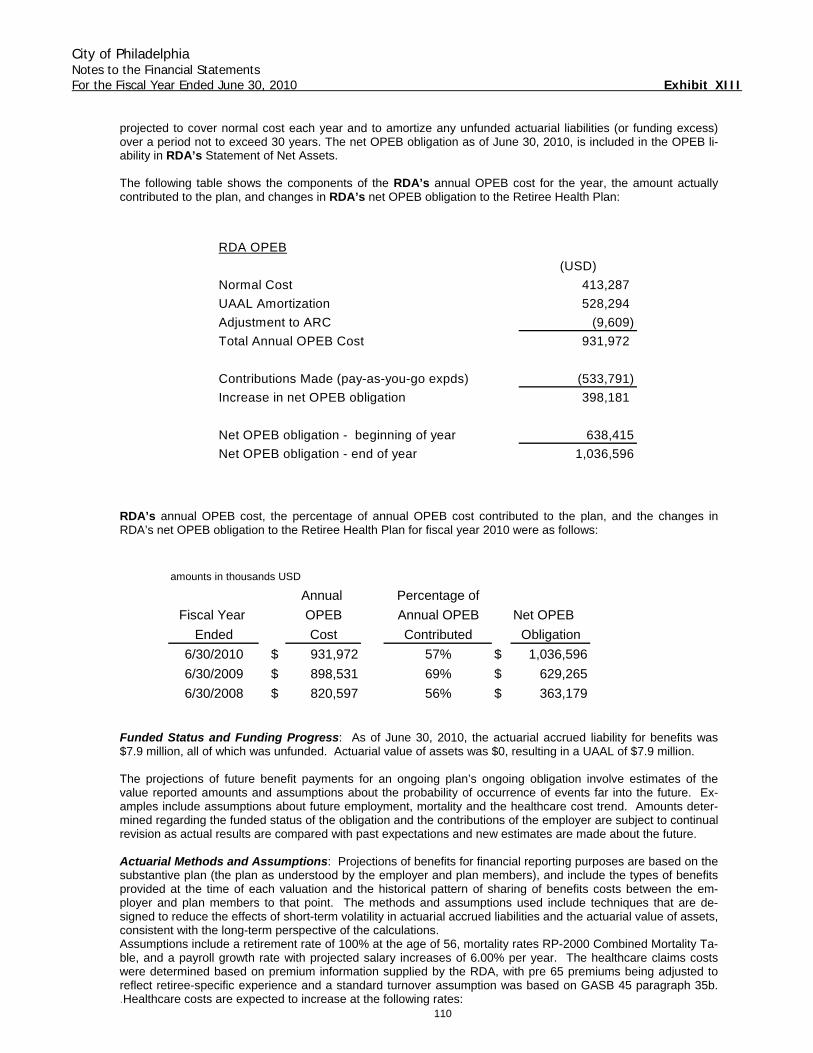
City of Philadelphia Notes to the Financial Statements For the Fiscal Year Ended June 30, 2010 Exhibit XIII
110
projected to cover normal cost each year and to amortize any unfunded actuarial liabilities (or funding excess) over a period not to exceed 30 years. The net OPEB obligation as of June 30, 2010, is included in the OPEB li-ability in RDA’s Statement of Net Assets. The following table shows the components of the RDA’s annual OPEB cost for the year, the amount actually contributed to the plan, and changes in RDA’s net OPEB obligation to the Retiree Health Plan:
RDA OPEB
(USD)
Normal Cost 413,287
UAAL Amortization 528,294
Adjustment to ARC (9,609)
Total Annual OPEB Cost 931,972
Contributions Made (pay-as-you-go expds) (533,791)
Increase in net OPEB obligation 398,181
Net OPEB obligation - beginning of year 638,415
Net OPEB obligation - end of year 1,036,596
RDA’s annual OPEB cost, the percentage of annual OPEB cost contributed to the plan, and the changes in RDA’s net OPEB obligation to the Retiree Health Plan for fiscal year 2010 were as follows:
amounts in thousands USD
Annual Percentage of
Fiscal Year OPEB Annual OPEB Net OPEB
Ended Cost Contributed Obligation
6/30/2010 $ 931,972 57% $ 1,036,596
6/30/2009 $ 898,531 69% $ 629,265
6/30/2008 $ 820,597 56% $ 363,179 Funded Status and Funding Progress: As of June 30, 2010, the actuarial accrued liability for benefits was $7.9 million, all of which was unfunded. Actuarial value of assets was $0, resulting in a UAAL of $7.9 million. The projections of future benefit payments for an ongoing plan’s ongoing obligation involve estimates of the value reported amounts and assumptions about the probability of occurrence of events far into the future. Ex-amples include assumptions about future employment, mortality and the healthcare cost trend. Amounts deter-mined regarding the funded status of the obligation and the contributions of the employer are subject to continual revision as actual results are compared with past expectations and new estimates are made about the future. Actuarial Methods and Assumptions: Projections of benefits for financial reporting purposes are based on the substantive plan (the plan as understood by the employer and plan members), and include the types of benefits provided at the time of each valuation and the historical pattern of sharing of benefits costs between the em-ployer and plan members to that point. The methods and assumptions used include techniques that are de-signed to reduce the effects of short-term volatility in actuarial accrued liabilities and the actuarial value of assets, consistent with the long-term perspective of the calculations. Assumptions include a retirement rate of 100% at the age of 56, mortality rates RP-2000 Combined Mortality Ta-ble, and a payroll growth rate with projected salary increases of 6.00% per year. The healthcare claims costs were determined based on premium information supplied by the RDA, with pre 65 premiums being adjusted to reflect retiree-specific experience and a standard turnover assumption was based on GASB 45 paragraph 35b. .Healthcare costs are expected to increase at the following rates:
City of Philadelphia Notes to the Financial Statements For the Fiscal Year Ended June 30, 2010 Exhibit XIII
111
Year Trend2010 9.0%2011 8.0%2012 7.0%2013 6.0%
2014+ 5.0%
Based on the historical and expected returns of RDA’s short-term investment portfolio, a discount rate of 5% was used. The amortization cost for the initial UAAL is a level dollar amount for a period of 30 years. The remaining amortization period at June 30, 2010, was 27 years.
4. PENNSYLVANIA INTERGOVERNMENTAL COOPERATION AUTHORITY
PICA, a body corporate and politic, was organized in June 1991 and exists under and by virtue of the Pennsyl-vania Intergovernmental Cooperation Authority Act for Cities of the First Class (the Act). Pursuant to the Act, PICA was established to provide financial assistance to cities of the first class. The City currently is the only city of the first class in the Commonwealth of Pennsylvania. Under the Act, PICA is administered by a governing Board consisting of five voting members and two ex officio non voting members. The Governor of Pennsylvania, the President Pro Tempore of the Pennsylvania Senate, the Minority Leader of the Pennsylvania Senate, the Speaker of the Pennsylvania House of Representatives and the Minority Leader of the Pennsylvania House of Representatives each appoints one voting member to the Board. The Act provides that, upon PICA's approval of a request of the City to PICA for financial assistance, PICA shall have certain financial and oversight functions. First, PICA shall have the power to issue bonds and grant or lend the proceeds thereof to the City. Second, PICA also shall have the power, in its oversight capacity, to exercise certain advisory and review powers with respect to the City's financial affairs, including the power to review and approve five-year financial plans prepared at least annually by the City and to certify noncompliance by the City with its current five-year financial plan (which certification would require the Secretary of the Budget of the Com-monwealth of Pennsylvania to cause certain Commonwealth payments due to the City to be withheld). PICA bonds are payable from the proceeds of a PICA tax on the wages and income earned by City residents. The City has reduced the amount of wage and earnings tax that it levies on City residents by an amount equal to the PICA tax so that the total tax remains the same. PICA returns to the City any portion of the tax not required to meet their debt service and operating expenses. In Fiscal 2010 this transfer amounted to $274.5 million.
5. RELATED PARTY TRANSACTIONS
The City is associated, through representation on the respective Board of Directors, with several local govern-mental organizations and certain quasi-governmental organizations created under the laws of the Common-wealth of Pennsylvania. These organizations are separate legal entities having governmental character and suf-ficient autonomy in the management of their own affairs to distinguish them as separate independent govern-mental entities. A list of such related party organizations and a description of significant transactions with the City, where applicable, is as follows:
A. SOUTHEASTERN PENNSYLVANIA TRANSPORTATION AUTHORITY (SEPTA)
During the year the City provided an operating subsidy of $64.2 million to SEPTA.
B. OTHER ORGANIZATIONS
The City provides varying levels of subsidy and other support payments (which totaled $119.6 million during the year) to the following organizations:
• Philadelphia Commercial Development Corporation
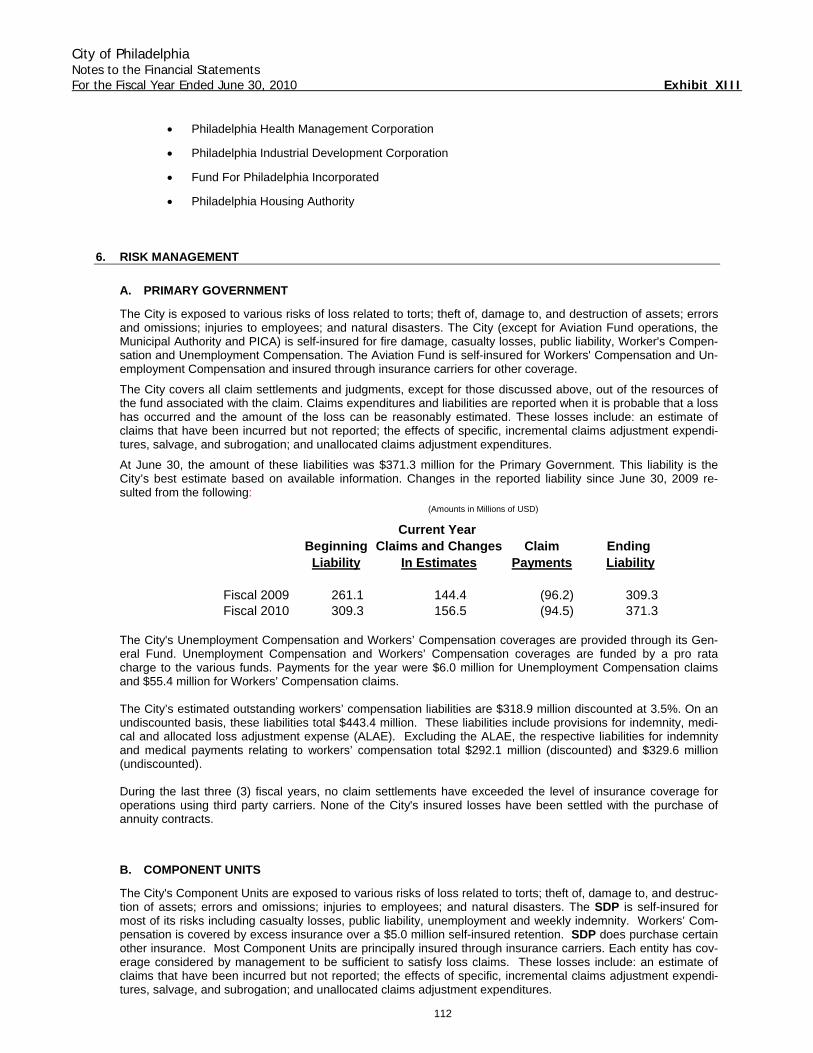
City of Philadelphia Notes to the Financial Statements For the Fiscal Year Ended June 30, 2010 Exhibit XIII
112
• Philadelphia Health Management Corporation
• Philadelphia Industrial Development Corporation
• Fund For Philadelphia Incorporated
• Philadelphia Housing Authority
6. RISK MANAGEMENT
A. PRIMARY GOVERNMENT
The City is exposed to various risks of loss related to torts; theft of, damage to, and destruction of assets; errors and omissions; injuries to employees; and natural disasters. The City (except for Aviation Fund operations, the Municipal Authority and PICA) is self-insured for fire damage, casualty losses, public liability, Worker's Compen-sation and Unemployment Compensation. The Aviation Fund is self-insured for Workers' Compensation and Un-employment Compensation and insured through insurance carriers for other coverage.
The City covers all claim settlements and judgments, except for those discussed above, out of the resources of the fund associated with the claim. Claims expenditures and liabilities are reported when it is probable that a loss has occurred and the amount of the loss can be reasonably estimated. These losses include: an estimate of claims that have been incurred but not reported; the effects of specific, incremental claims adjustment expendi-tures, salvage, and subrogation; and unallocated claims adjustment expenditures.
At June 30, the amount of these liabilities was $371.3 million for the Primary Government. This liability is the City’s best estimate based on available information. Changes in the reported liability since June 30, 2009 re-sulted from the following:
(Amounts in Millions of USD)
Current Year Beginning Claims and Changes Claim Ending
Liability In Estimates Payments Liability
Fiscal 2009 261.1 144.4 (96.2) 309.3 Fiscal 2010 309.3 156.5 (94.5) 371.3
The City's Unemployment Compensation and Workers’ Compensation coverages are provided through its Gen-eral Fund. Unemployment Compensation and Workers’ Compensation coverages are funded by a pro rata charge to the various funds. Payments for the year were $6.0 million for Unemployment Compensation claims and $55.4 million for Workers’ Compensation claims. The City’s estimated outstanding workers’ compensation liabilities are $318.9 million discounted at 3.5%. On an undiscounted basis, these liabilities total $443.4 million. These liabilities include provisions for indemnity, medi-cal and allocated loss adjustment expense (ALAE). Excluding the ALAE, the respective liabilities for indemnity and medical payments relating to workers’ compensation total $292.1 million (discounted) and $329.6 million (undiscounted). During the last three (3) fiscal years, no claim settlements have exceeded the level of insurance coverage for operations using third party carriers. None of the City's insured losses have been settled with the purchase of annuity contracts.
B. COMPONENT UNITS
The City's Component Units are exposed to various risks of loss related to torts; theft of, damage to, and destruc-tion of assets; errors and omissions; injuries to employees; and natural disasters. The SDP is self-insured for most of its risks including casualty losses, public liability, unemployment and weekly indemnity. Workers’ Com-pensation is covered by excess insurance over a $5.0 million self-insured retention. SDP does purchase certain other insurance. Most Component Units are principally insured through insurance carriers. Each entity has cov-erage considered by management to be sufficient to satisfy loss claims. These losses include: an estimate of claims that have been incurred but not reported; the effects of specific, incremental claims adjustment expendi-tures, salvage, and subrogation; and unallocated claims adjustment expenditures.
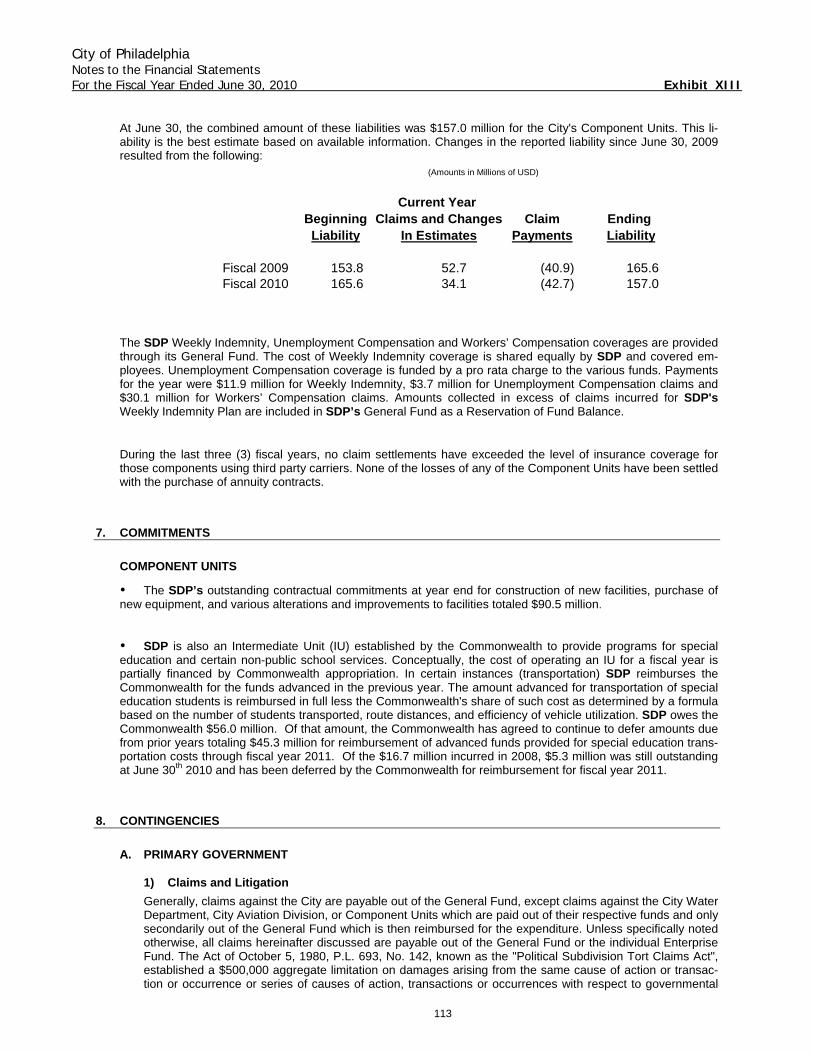
City of Philadelphia Notes to the Financial Statements For the Fiscal Year Ended June 30, 2010 Exhibit XIII
113
At June 30, the combined amount of these liabilities was $157.0 million for the City's Component Units. This li-ability is the best estimate based on available information. Changes in the reported liability since June 30, 2009 resulted from the following:
(Amounts in Millions of USD)
Current Year Beginning Claims and Changes Claim Ending
Liability In Estimates Payments Liability
Fiscal 2009 153.8 52.7 (40.9) 165.6 Fiscal 2010 165.6 34.1 (42.7) 157.0
The SDP Weekly Indemnity, Unemployment Compensation and Workers’ Compensation coverages are provided through its General Fund. The cost of Weekly Indemnity coverage is shared equally by SDP and covered em-ployees. Unemployment Compensation coverage is funded by a pro rata charge to the various funds. Payments for the year were $11.9 million for Weekly Indemnity, $3.7 million for Unemployment Compensation claims and $30.1 million for Workers’ Compensation claims. Amounts collected in excess of claims incurred for SDP's Weekly Indemnity Plan are included in SDP’s General Fund as a Reservation of Fund Balance. During the last three (3) fiscal years, no claim settlements have exceeded the level of insurance coverage for those components using third party carriers. None of the losses of any of the Component Units have been settled with the purchase of annuity contracts.
7. COMMITMENTS
COMPONENT UNITS
The SDP’s outstanding contractual commitments at year end for construction of new facilities, purchase of new equipment, and various alterations and improvements to facilities totaled $90.5 million. SDP is also an Intermediate Unit (IU) established by the Commonwealth to provide programs for special
education and certain non-public school services. Conceptually, the cost of operating an IU for a fiscal year is partially financed by Commonwealth appropriation. In certain instances (transportation) SDP reimburses the Commonwealth for the funds advanced in the previous year. The amount advanced for transportation of special education students is reimbursed in full less the Commonwealth's share of such cost as determined by a formula based on the number of students transported, route distances, and efficiency of vehicle utilization. SDP owes the Commonwealth $56.0 million. Of that amount, the Commonwealth has agreed to continue to defer amounts due from prior years totaling $45.3 million for reimbursement of advanced funds provided for special education trans-portation costs through fiscal year 2011. Of the $16.7 million incurred in 2008, $5.3 million was still outstanding at June 30th 2010 and has been deferred by the Commonwealth for reimbursement for fiscal year 2011.
8. CONTINGENCIES
A. PRIMARY GOVERNMENT
1) Claims and Litigation Generally, claims against the City are payable out of the General Fund, except claims against the City Water Department, City Aviation Division, or Component Units which are paid out of their respective funds and only secondarily out of the General Fund which is then reimbursed for the expenditure. Unless specifically noted otherwise, all claims hereinafter discussed are payable out of the General Fund or the individual Enterprise Fund. The Act of October 5, 1980, P.L. 693, No. 142, known as the "Political Subdivision Tort Claims Act", established a $500,000 aggregate limitation on damages arising from the same cause of action or transac-tion or occurrence or series of causes of action, transactions or occurrences with respect to governmental
City of Philadelphia Notes to the Financial Statements For the Fiscal Year Ended June 30, 2010 Exhibit XIII
114
units in the Commonwealth such as the City. The constitutionality of that aggregate limitation has been up-held by the United States Supreme Court. There is no such limitation under federal law. Various claims have been asserted against the City and in some cases lawsuits have been instituted. Many of these claims are reduced to judgment or otherwise settled in a manner requiring payment by the City. The aggregate estimate of loss deemed to be probable is approximately $371.3 million. Of this amount, $23.8 million is charged to current operations of the Enterprise Funds. The remaining $347.5 million pertaining to the General Fund is reflected in the Government Wide Statements. In addition to the above, there are certain lawsuits against the City for which an additional loss is reasonably possible. These lawsuits relate to General Fund and Enterprise Fund operations. The aggregate estimates of the loss which could result if unfavorable legal determinations were rendered against the City with respect to those lawsuits is approximately $91.8 million to the General Fund and $6.2 million to the Enterprise Funds. Significant cases included in the current litigation against the City are as follows:
• Lower Darby Creek Area Superfund Site - In 2001, the U. S. Environmental Protection Agency (EPA) added the Lower Darby Creek Area (Site) to the National Priority List, EPA’s list of the most serious uncontrolled or abandoned hazardous waste sites. The Site includes two former municipal landfills: the Folcroft Landfill and the Clearview Landfill. In 2002, EPA sent the City a letter alleging that the city is a Potentially Responsible Party (PRP) at the Clearview Landfill site. Designation as a PRP means the City may be jointly and sever-ally liable with other PRPs for the site’s clean-up costs. EPA has concluded that the City owns the Recrea-tion Property and streets adjacent to the Clearview Landfill and alleges that there is a reasonable basis to believe that there may be or has been a release or threat of release of hazardous substances, pollutants or contaminants at or from the City’s property. Additionally, EPA alleges that the City “arranged” for the dis-posal of hazardous substances at the Clearview Landfill. The City received and responded to two separate requests from EPA for additional information. EPA anticipates completing the Remedial Investigation for the Clearview Landfill by the end of 2010 and completing the Feasibility study in 2011. After completing the Feasibility Study, EPA will issue a Record of Decision. The city denies any liability for Clearview, Folcroft and Folcroft Annex. Insufficient information is available to the City at this time to assess whether the poten-tial loss or exposure to the City in the event of an unfavorable outcome would exceed the reporting thresh-old.
• McKenna et al v. City of Philadelphia – Plaintiffs, three former police officers alleged retaliation in violation of
Title VII of the Civil Rights Act of 1964. They secured a jury verdict in May 2008 in the aggregate amount of $10 million, which was reduced to $1.5 million by the district court, based primarily on a statutory damages cap. The district court denied both sides’ post-judgment motions, and both sides are appealing. Plaintiffs also seek substantial attorneys’ fees, as the prevailing parties.
• Waterfront Renaissance Associates (WRA) v. City, et. Al., E.D. Pa. No.07 cv 1045 - WRA, proposed devel-
oper of a “Work Trade Center” project at 400-456 Christopher Columbus Boulevard, sued the City, City Council, City Planning Commission, Brian Abernathy (then legislative aid to Councilman DiCicco), and cer-tain civic associations and their officers. In short, WRA alleged that the zoning overlay amendment to the Old City Residential Area Special District Controls, through a 65 foot maximum height restriction, effectively prevented or rendered impossible completion of its project. WRA further alleged a nearly 20 year history of support, encouragement, assistance, and other favorable representations for the project by the City, its officials and representatives, and others. WRA complained that it had spent nearly $20 million in reliance upon City’s “supportive” actions for site-acquisitions and pre-development, promotional, and other soft and hard costs. WRA sought declaratory and injunctive relief and damages in excess of $20 million. WRA claimed that the Ordinance facially violated its constitutional rights to procedural and substantive due process and equal pro-tection of laws by depriving it of property through wholly arbitrary action and/or without reasonable notice and that the Court should enjoin and declare the Ordinance as unenforceable based on promissory estop-pel, detrimental reliance, or unjust enrichment. City Defendants filed motions to dismiss. The Court dismissed all City defendants except the City. The Court also dismissed the procedural due process and as-applied substantive due process claims. The fol-lowing claims against City survived: promissory estoppel, detrimental reliance; unjust enrichment; facial vio-lation of equal protection; and facial violation of substantive due process.
City of Philadelphia Notes to the Financial Statements For the Fiscal Year Ended June 30, 2010 Exhibit XIII
115
In addition, Plaintiffs were granted leave (despite the City’s opposition) to amend the Complaint. WRA added a count for violation of substantive due process seeking injunctive relief and alleging that the Ordi-nance delegates land use and planning powers to neighborhood associations allowing for ad hoc changes and concessions regarding high-rise development through a compulsory variance process, contrary to the master planning concept of Pennsylvania zoning law the Philadelphia zoning code. The Court denied the City’s Motion to Dismiss Count XV of the Second Amended Complaint. In the wake of that ruling, Plaintiffs have asked the Court to reopen fact discovery for seventy-five days so that Plaintiffs’ can engage in further discovery related to the allegations of that claim. The City opposed that motion. The City also recently moved to dismiss WRA’s constitutional claims on mootness grounds on the basis that a recent amendment to the City’s zoning laws removed the height restriction from WRA’s prop-erty. The Court received briefing and supplemental briefing on the mootness issue and will decide that is-sue. If the Court dismisses WRA’s constitutional claims on mootness grounds, then WRA’s motion to re-open discovery will likely be moot as well, at least as it applies to those claims. WRA also has recently moved to supplement its Compliant to add new claims concerning the Central Dela-ware Riverfront Ordinance. The City opposed the motion contending the new claims are not an appropriate addition to the lawsuit. In the event the Court permits the new claims, WRA has asked for another six months of fact discovery followed by new dates for completion of expert discovery, filing of dispositive mo-tions, and ultimately scheduling of trial if necessary. The City intends to mount vigorous defenses to defeat the claims. The City’s lawyers reasonably believe that the plaintiffs are not likely to succeed on their claims or in the damage amount sought against the City and that City defenses have merit.
.
• Condemnation of Tract of Land k/a Parcel C (within Eastwick Urban Renewal Area): in November 2003, the City condemned certain property known as Parcel C within the Eastwick Urban Renewal Area Plan of 1958 for the benefit of Philadelphia International Airport. The Redevelopment Authority of the City of Philadelphia (“RDA”) was the record title holder of the property. The City deposited in court in April 2006 estimated just compensation in the amount of $7,714,000. November Term, 2003, No. 2285 (C.C.P. Phila.). In 2007, Eastwick Development Joint Venture IX, L.P. and New Eastwick Corporation, petitioned the Court for ap-pointment of a Board of Viewers and the Court appointed a Board of View to ascertain and award just com-pensation. Eastwick alleged they owned or held equitable interest in and certain development rights to the condemned property. After a view of the premises and a hearing in July 2009, the Board filed a report with the Court in October 2009. BV #3421. The Board made an award of just compensation for the property of $13,500,500 (including attorney fees), subject to credit for the $7,714,000 already paid and distributed. In addition, the Board awarded delay damages from the date of taking (11/18/03) until July 31, 2009 in the amount of $3,298,200, and accruing thereafter until payment at the rate of 4.25% per year through 2009, and at rates not yet fixed for subsequent years. BV #3421.
The City filed its appeal to the Court of Common Pleas in November 2009, requesting a jury trial de novo. The City objected, among other things, to the award of any compensation amount beyond that amount al-ready paid into court, to evidentiary, procedural and substantive errors in the Board of View proceeding and award, and to the delay damage computation and award. Eastwick Development filed a separate appeal from the Board of View Report to the Court of Common Pleas in November 2009. Eastwick Development sought a jury trial de novo and objected to the sufficiency of the amount of compensation awarded. The Court scheduled a case management conference for the cases in February 2010. The City vigorously contests the award. At this time, the City’s attorneys are unable in their professional judgment to evaluate the likelihood of unfavorable outcome in terms of probability and the range or amount of any loss assuming an unfavorable outcome. Any ultimate judgment would be paid from the City’s Avia-tion Fund.
• G&T Conveyor Co., Inc. v. Ernest Bock & Sons, Inc et al v. City et al., CCP Phila. No. 091103117: G&T has commenced and pursued a civil action for declaratory and monetary relief against Bock, and Liberty Mutual Insurance Company (“Liberty”) and Fidelity and Deposit Company of Maryland ((“Fidelity”), issuers of a pay-ment bond on behalf of Bock. G&T sued Bock for, among other things, about $1.3 million in damages for work performed but unpaid by Bock; and for nearly $7 million in additional costs incurred as a result of construction delays G&T attributed to Bock. Bock had successfully bid to perform general contractor work on the Airport Terminal D&E expansion and modernization project for baggage system (Bid #6851; Contract #084002). G&T subcontracted with Bock to
City of Philadelphia Notes to the Financial Statements For the Fiscal Year Ended June 30, 2010 Exhibit XIII
116
supply all necessary labor, supervision, material and equipment to furnish the baggage handling equipment. Bock’s Purchase Order (subcontract) with G&T required that G&T perform and complete work in strict ac-cordance with the Plans and Specifications, and eleven addenda and other terms and conditions prepared by DDI, and in Compliance with certain milestones and deadlines. G&T alleged that, by early 2010, the project was over 660 days behind schedule and its attempts to address and resolve delay and other problems with Bock had failed. Bock answered the Compliant, denying respon-sibility, asserting affirmative defenses and counterclaiming against G&T for damages caused by G&T’s al-leged breach of its contract obligations. Bock also filed a “third party” compliant against City and others, par-ticularly Chisom Electrical (reportedly a defunct entity). Bock contended City was solely liable or liable with Bock to G&T on the “delay damages” claims made by G&T, pursuant to common law theories of indemnification and contribution. Bock also claimed City was li-able to Bock for damages caused by City’s material breaches of its contract with Bock. City filed preliminary objections to the Third Party Complaint, challenging its propriety and sufficiency but the Court overruled the objections and ordered the filing of an Answer, City filed an Answer to Bock’s third party complaint, asserting its defenses, counterclaims against Bock for indemnity and breach of contract and bonding companies for indemnity. City also has filed a compliant joining the designer of the project, Daroff Design Inc. and asserting claims for contractual and common law indemnification and/or contribution. The parties have engaged in voluminous document discovery and exchanges and have commenced with depositions. Under Case Management Order, fact discovery is scheduled to close in July 2011 an trial date is set for November 2011. The City intends to mount vigorous defenses to defeat the claims. The City’s lawyers reasonably believe that the third party plaintiffs will not likely succeed on their claims or for the amount of damages sought and that the City’s defenses have merit.
• Brett Mandel et al v. The City of Phila., CCP Phila. Co., No. 1101-03848: A total of 18 taxpayers have brought suit against the City in the Court of Common Pleas for the First Judicial District, challenging the City’s system for the assessment of real estate taxes for itself and the School District of Philadelphia under the Uniformity Clause of the Pennsylvania Constitution, the First Class County Assessment Law, 72 P.S. §§ 5341.1-5341.21, and the Equal Protection Clause of the United States Constitution. Plaintiffs’ requested remedies include: (1) a declaration that the City’s tax assessment system violates these provisions, and an order requiring the City to implement new assessment policies and procedures that will ensure uniformity; (2) a declaration that the City’s 2011 and 2012 real estate tax increase is unconstitu-tional, and an order requiring the City to refund any revenues received pursuant to that increase; (3) an or-der prohibiting the City from enforcing any property tax liens and, relatedly, prohibiting the City from pro-ceeding with any Sheriff’s sales premised upon unpaid property taxes; and (4) an award of attorneys’ fees. The City has not yet responded to the complaint, but expects to contest the case vigorously. Plaintiffs' first requested form of relief -- the order requiring the implementation of new assessment policies and proce-dures -- does not appear to be substantially different from the City’s already existing plans for reforming as-sessment practices, but it is too early to tell whether a settlement will be possible. Regarding the other requested forms of relief, Plaintiffs’ claims could cost the City well over $100 million if successful, but we have strong defenses to these assertions.
2) Guaranteed Debt The City has guaranteed certain debt payments of two of its component units. As such, the City's General Fund has a potential financial obligation toward the extinguishment of this debt, either by replacing the vari-ous reserve funds, if used, or the actual payment of principal or interest. At June 30, principal balances out-standing were as follows:
(Amounts In Thousands of USD)
Philadelphia Authority for Industrial Development 3,360 Philadelphia Parking Authority 15,885
19,245
City of Philadelphia Notes to the Financial Statements For the Fiscal Year Ended June 30, 2010 Exhibit XIII
117
3) Single Audit The City receives significant financial assistance from numerous federal, state and local governmental agen-cies in the form of grants and entitlements. The disbursement of funds received under these programs generally requires compliance with terms and conditions as specified in the grant agreements, and is subject to audit. Any disallowed claims resulting from such audits and relating to the City or its component units could become a liability of the General Fund or other applicable funds. In the opinion of City officials the only significant contingent liabilities related to matters of compliance are the unresolved and questioned costs in the City's Schedule of Financial Assistance to be issued for the fiscal year ended June 30, 2010, which amounted to $523.3 million for all open program years as of December 17, 2010. Of this amount, $483.4 million represents unresolved cost due to the inability to obtain audit reports from sub-recipients for the year ended June 30, 2010 due to timing differences in audit requirements, $28.0 million represents questioned costs due to the inability to obtain sub recipient audit reports for the fiscal years June 30, 2009 and prior and $11.8 million represents questioned costs related to specific compliance requirements which have yet to be resolved.
4) HUD Section 108 Loans As of the end of the fiscal year, the Federal Department of Housing and Urban Development (HUD) had dis-bursed $199.6 million in loans to the Philadelphia Industrial Development Corporation (PIDC). The funds, which were used to establish a loan pool pursuant to a contract between the City and HUD, are being ac-counted for and administered by PIDC on behalf of the City. Pool funds are loaned to businesses for eco-nomic development purposes. Loan repayments and investment proceeds from un-loaned funds are used to repay HUD. Collateral for repayment of the funds includes future Community Development Block Grant enti-tlements due to the City from HUD. The total remaining principal to be repaid to HUD for all loans at the end of the year was $114.9 million.
B. COMPONENT UNITS
1) Claims and Litigation • Special Education and Civil Rights Claims – There are three hundred seventy-four (374) various claims
against the School District, by or on behalf of students, which aggregate to a total potential liability of $4.3 million.
Of those, three-hundred fifty-seven (357) are administrative due process hearings and appeals to the state appeals panel pending against the School District. These appeals are based on alleged violations by the School District to provide a free, appropriate public education to students under federal and state civil rights, special education or the Rehabilitation Act and anti-discrimination laws. In the opinion of the General Coun-sel of the School District, two hundred twelve (212) unfavorable outcomes are deemed probable and a hun- dred (100) are considered reasonably possible in the aggregate amounts of approximately $1.3 million and $0.4 million respectively.
There are twelve (12) lawsuits pending against the School District asserting claims in violation of §1983 of the Civil Rights Act. In the opinion of the General Counsel of the School District, unfavorable outcomes of ten (10) are deemed reasonably possible in the aggregate amounts of approximately $0.3 million.
There are three (3) suits in federal court by parents of special education students for reimbursement for at-torneys’ fees and costs in administrative proceedings and appeals to court in which the parents were prevail-ing parties. In the opinion of the General Counsel of the School District, unfavorable outcomes are deemed probable and reasonably possible in the aggregate amounts of approximately $0.12 million and $0.06 million respectively.
• Other Matters - The School District is a party to various claims, legal actions, arbitrations and complaints in the ordinary course of business, which aggregate to a total potential liability of $14.4 million. In the opinion of the General Counsel of the School District, it is unlikely that final judgments or compromised settlements will approach the total potential liability, however. Nevertheless, the School District annually budgets an amount that management believes is adequate, based on past experience, to provide for these claims when they become fixed and determinable in amount. More particularly, compromised settlements or unfavorable outcomes are deemed probable or reasonably possible in the amounts of $1.1 million and $0.2 million, re-spectively, in connection with disputed contracts and labor and employment matters. Likewise, compromised settlements or unfavorable verdicts are deemed probable or reasonably possible in the aggregate amounts
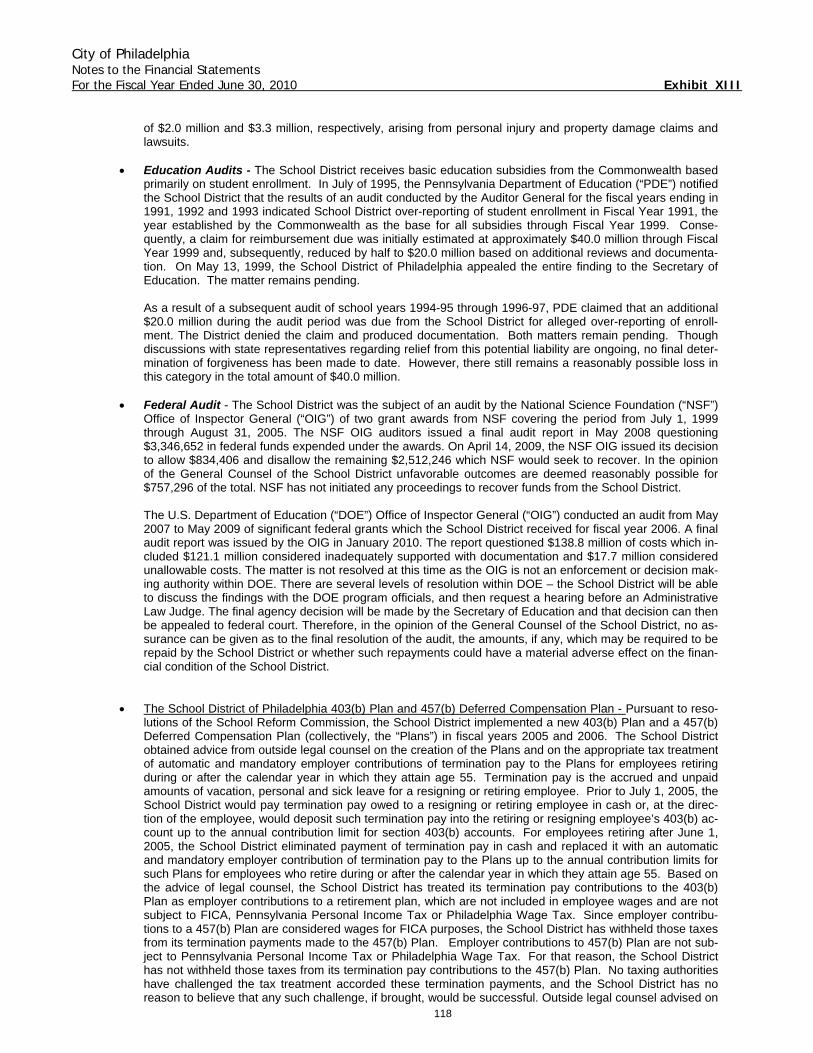
City of Philadelphia Notes to the Financial Statements For the Fiscal Year Ended June 30, 2010 Exhibit XIII
118
of $2.0 million and $3.3 million, respectively, arising from personal injury and property damage claims and lawsuits.
• Education Audits - The School District receives basic education subsidies from the Commonwealth based
primarily on student enrollment. In July of 1995, the Pennsylvania Department of Education (“PDE”) notified the School District that the results of an audit conducted by the Auditor General for the fiscal years ending in 1991, 1992 and 1993 indicated School District over-reporting of student enrollment in Fiscal Year 1991, the year established by the Commonwealth as the base for all subsidies through Fiscal Year 1999. Conse-quently, a claim for reimbursement due was initially estimated at approximately $40.0 million through Fiscal Year 1999 and, subsequently, reduced by half to $20.0 million based on additional reviews and documenta-tion. On May 13, 1999, the School District of Philadelphia appealed the entire finding to the Secretary of Education. The matter remains pending.
As a result of a subsequent audit of school years 1994-95 through 1996-97, PDE claimed that an additional $20.0 million during the audit period was due from the School District for alleged over-reporting of enroll-ment. The District denied the claim and produced documentation. Both matters remain pending. Though discussions with state representatives regarding relief from this potential liability are ongoing, no final deter-mination of forgiveness has been made to date. However, there still remains a reasonably possible loss in this category in the total amount of $40.0 million.
• Federal Audit - The School District was the subject of an audit by the National Science Foundation (“NSF”)
Office of Inspector General (“OIG”) of two grant awards from NSF covering the period from July 1, 1999 through August 31, 2005. The NSF OIG auditors issued a final audit report in May 2008 questioning $3,346,652 in federal funds expended under the awards. On April 14, 2009, the NSF OIG issued its decision to allow $834,406 and disallow the remaining $2,512,246 which NSF would seek to recover. In the opinion of the General Counsel of the School District unfavorable outcomes are deemed reasonably possible for $757,296 of the total. NSF has not initiated any proceedings to recover funds from the School District.
The U.S. Department of Education (“DOE”) Office of Inspector General (“OIG”) conducted an audit from May 2007 to May 2009 of significant federal grants which the School District received for fiscal year 2006. A final audit report was issued by the OIG in January 2010. The report questioned $138.8 million of costs which in-cluded $121.1 million considered inadequately supported with documentation and $17.7 million considered unallowable costs. The matter is not resolved at this time as the OIG is not an enforcement or decision mak-ing authority within DOE. There are several levels of resolution within DOE – the School District will be able to discuss the findings with the DOE program officials, and then request a hearing before an Administrative Law Judge. The final agency decision will be made by the Secretary of Education and that decision can then be appealed to federal court. Therefore, in the opinion of the General Counsel of the School District, no as-surance can be given as to the final resolution of the audit, the amounts, if any, which may be required to be repaid by the School District or whether such repayments could have a material adverse effect on the finan-cial condition of the School District.
• The School District of Philadelphia 403(b) Plan and 457(b) Deferred Compensation Plan - Pursuant to reso-
lutions of the School Reform Commission, the School District implemented a new 403(b) Plan and a 457(b) Deferred Compensation Plan (collectively, the “Plans”) in fiscal years 2005 and 2006. The School District obtained advice from outside legal counsel on the creation of the Plans and on the appropriate tax treatment of automatic and mandatory employer contributions of termination pay to the Plans for employees retiring during or after the calendar year in which they attain age 55. Termination pay is the accrued and unpaid amounts of vacation, personal and sick leave for a resigning or retiring employee. Prior to July 1, 2005, the School District would pay termination pay owed to a resigning or retiring employee in cash or, at the direc-tion of the employee, would deposit such termination pay into the retiring or resigning employee’s 403(b) ac-count up to the annual contribution limit for section 403(b) accounts. For employees retiring after June 1, 2005, the School District eliminated payment of termination pay in cash and replaced it with an automatic and mandatory employer contribution of termination pay to the Plans up to the annual contribution limits for such Plans for employees who retire during or after the calendar year in which they attain age 55. Based on the advice of legal counsel, the School District has treated its termination pay contributions to the 403(b) Plan as employer contributions to a retirement plan, which are not included in employee wages and are not subject to FICA, Pennsylvania Personal Income Tax or Philadelphia Wage Tax. Since employer contribu-tions to a 457(b) Plan are considered wages for FICA purposes, the School District has withheld those taxes from its termination payments made to the 457(b) Plan. Employer contributions to 457(b) Plan are not sub-ject to Pennsylvania Personal Income Tax or Philadelphia Wage Tax. For that reason, the School District has not withheld those taxes from its termination pay contributions to the 457(b) Plan. No taxing authorities have challenged the tax treatment accorded these termination payments, and the School District has no reason to believe that any such challenge, if brought, would be successful. Outside legal counsel advised on
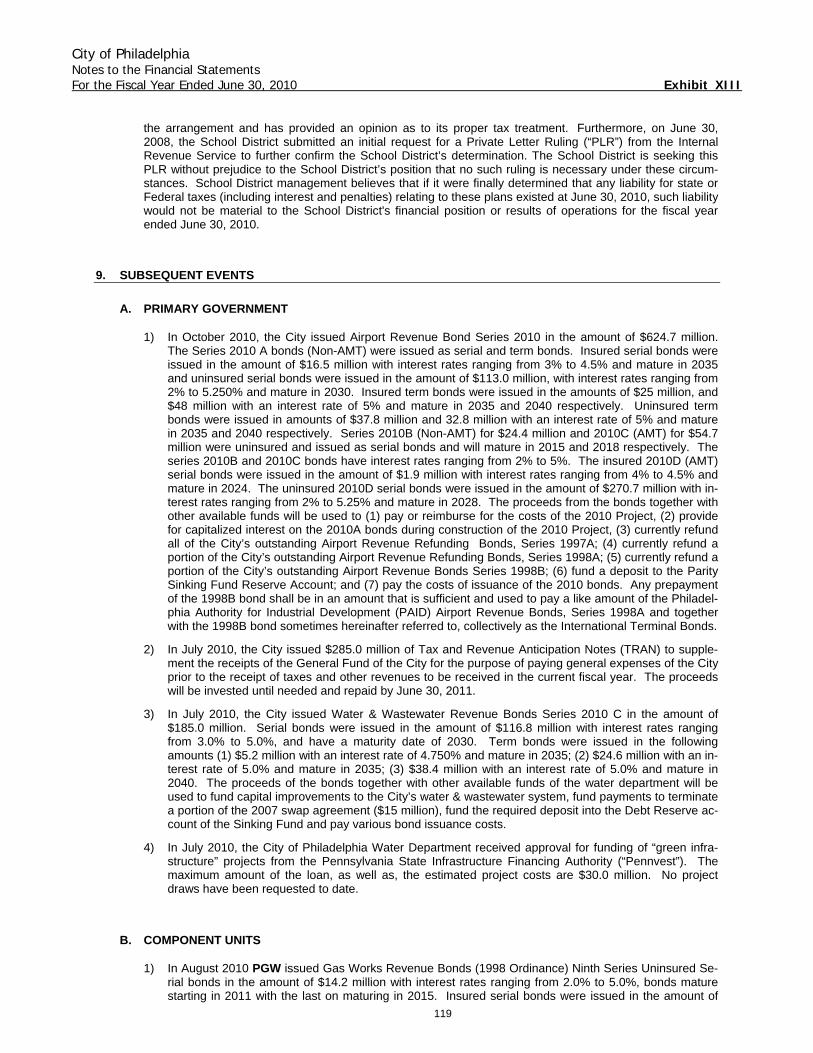
City of Philadelphia Notes to the Financial Statements For the Fiscal Year Ended June 30, 2010 Exhibit XIII
119
the arrangement and has provided an opinion as to its proper tax treatment. Furthermore, on June 30, 2008, the School District submitted an initial request for a Private Letter Ruling (“PLR”) from the Internal Revenue Service to further confirm the School District’s determination. The School District is seeking this PLR without prejudice to the School District’s position that no such ruling is necessary under these circum-stances. School District management believes that if it were finally determined that any liability for state or Federal taxes (including interest and penalties) relating to these plans existed at June 30, 2010, such liability would not be material to the School District's financial position or results of operations for the fiscal year ended June 30, 2010.
9. SUBSEQUENT EVENTS
A. PRIMARY GOVERNMENT
1) In October 2010, the City issued Airport Revenue Bond Series 2010 in the amount of $624.7 million. The Series 2010 A bonds (Non-AMT) were issued as serial and term bonds. Insured serial bonds were issued in the amount of $16.5 million with interest rates ranging from 3% to 4.5% and mature in 2035 and uninsured serial bonds were issued in the amount of $113.0 million, with interest rates ranging from 2% to 5.250% and mature in 2030. Insured term bonds were issued in the amounts of $25 million, and $48 million with an interest rate of 5% and mature in 2035 and 2040 respectively. Uninsured term bonds were issued in amounts of $37.8 million and 32.8 million with an interest rate of 5% and mature in 2035 and 2040 respectively. Series 2010B (Non-AMT) for $24.4 million and 2010C (AMT) for $54.7 million were uninsured and issued as serial bonds and will mature in 2015 and 2018 respectively. The series 2010B and 2010C bonds have interest rates ranging from 2% to 5%. The insured 2010D (AMT) serial bonds were issued in the amount of $1.9 million with interest rates ranging from 4% to 4.5% and mature in 2024. The uninsured 2010D serial bonds were issued in the amount of $270.7 million with in-terest rates ranging from 2% to 5.25% and mature in 2028. The proceeds from the bonds together with other available funds will be used to (1) pay or reimburse for the costs of the 2010 Project, (2) provide for capitalized interest on the 2010A bonds during construction of the 2010 Project, (3) currently refund all of the City’s outstanding Airport Revenue Refunding Bonds, Series 1997A; (4) currently refund a portion of the City’s outstanding Airport Revenue Refunding Bonds, Series 1998A; (5) currently refund a portion of the City’s outstanding Airport Revenue Bonds Series 1998B; (6) fund a deposit to the Parity Sinking Fund Reserve Account; and (7) pay the costs of issuance of the 2010 bonds. Any prepayment of the 1998B bond shall be in an amount that is sufficient and used to pay a like amount of the Philadel-phia Authority for Industrial Development (PAID) Airport Revenue Bonds, Series 1998A and together with the 1998B bond sometimes hereinafter referred to, collectively as the International Terminal Bonds.
2) In July 2010, the City issued $285.0 million of Tax and Revenue Anticipation Notes (TRAN) to supple-ment the receipts of the General Fund of the City for the purpose of paying general expenses of the City prior to the receipt of taxes and other revenues to be received in the current fiscal year. The proceeds will be invested until needed and repaid by June 30, 2011.
3) In July 2010, the City issued Water & Wastewater Revenue Bonds Series 2010 C in the amount of $185.0 million. Serial bonds were issued in the amount of $116.8 million with interest rates ranging from 3.0% to 5.0%, and have a maturity date of 2030. Term bonds were issued in the following amounts (1) $5.2 million with an interest rate of 4.750% and mature in 2035; (2) $24.6 million with an in-terest rate of 5.0% and mature in 2035; (3) $38.4 million with an interest rate of 5.0% and mature in 2040. The proceeds of the bonds together with other available funds of the water department will be used to fund capital improvements to the City’s water & wastewater system, fund payments to terminate a portion of the 2007 swap agreement ($15 million), fund the required deposit into the Debt Reserve ac-count of the Sinking Fund and pay various bond issuance costs.
4) In July 2010, the City of Philadelphia Water Department received approval for funding of “green infra-structure” projects from the Pennsylvania State Infrastructure Financing Authority (“Pennvest”). The maximum amount of the loan, as well as, the estimated project costs are $30.0 million. No project draws have been requested to date.
B. COMPONENT UNITS
1) In August 2010 PGW issued Gas Works Revenue Bonds (1998 Ordinance) Ninth Series Uninsured Se-rial bonds in the amount of $14.2 million with interest rates ranging from 2.0% to 5.0%, bonds mature starting in 2011 with the last on maturing in 2015. Insured serial bonds were issued in the amount of
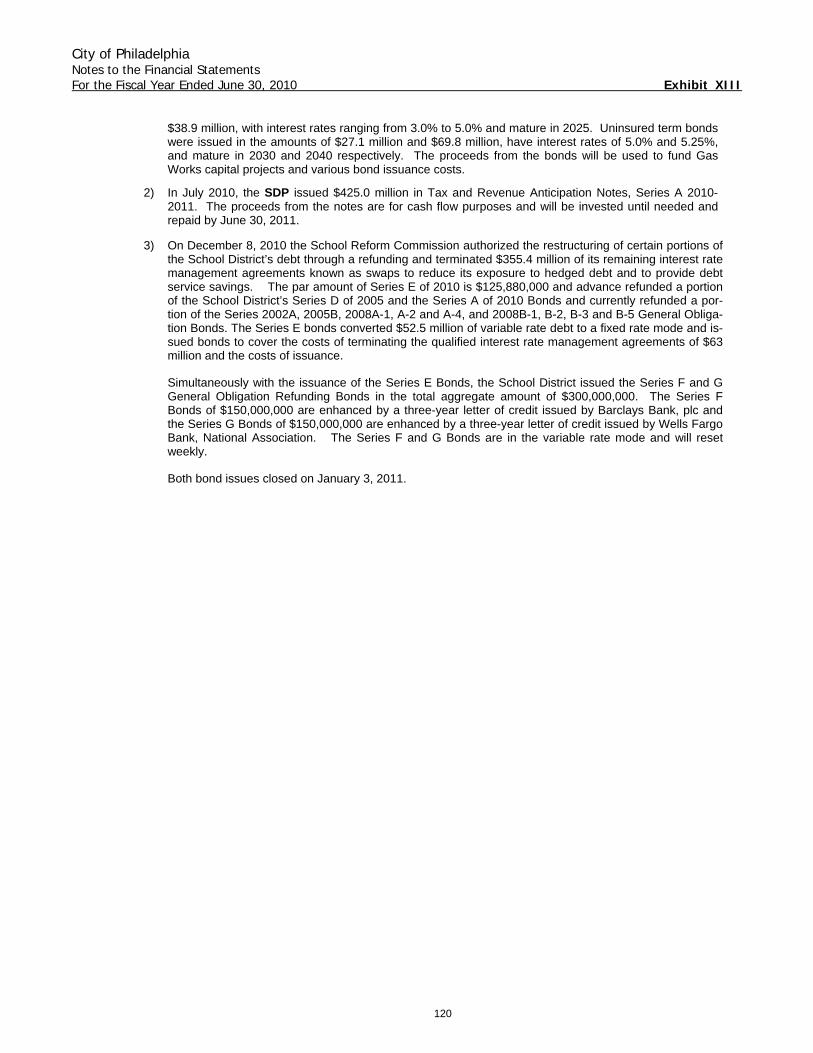
City of Philadelphia Notes to the Financial Statements For the Fiscal Year Ended June 30, 2010 Exhibit XIII
120
$38.9 million, with interest rates ranging from 3.0% to 5.0% and mature in 2025. Uninsured term bonds were issued in the amounts of $27.1 million and $69.8 million, have interest rates of 5.0% and 5.25%, and mature in 2030 and 2040 respectively. The proceeds from the bonds will be used to fund Gas Works capital projects and various bond issuance costs.
2) In July 2010, the SDP issued $425.0 million in Tax and Revenue Anticipation Notes, Series A 2010-2011. The proceeds from the notes are for cash flow purposes and will be invested until needed and repaid by June 30, 2011.
3) On December 8, 2010 the School Reform Commission authorized the restructuring of certain portions of the School District’s debt through a refunding and terminated $355.4 million of its remaining interest rate management agreements known as swaps to reduce its exposure to hedged debt and to provide debt service savings. The par amount of Series E of 2010 is $125,880,000 and advance refunded a portion of the School District’s Series D of 2005 and the Series A of 2010 Bonds and currently refunded a por-tion of the Series 2002A, 2005B, 2008A-1, A-2 and A-4, and 2008B-1, B-2, B-3 and B-5 General Obliga-tion Bonds. The Series E bonds converted $52.5 million of variable rate debt to a fixed rate mode and is-sued bonds to cover the costs of terminating the qualified interest rate management agreements of $63 million and the costs of issuance.
Simultaneously with the issuance of the Series E Bonds, the School District issued the Series F and G General Obligation Refunding Bonds in the total aggregate amount of $300,000,000. The Series F Bonds of $150,000,000 are enhanced by a three-year letter of credit issued by Barclays Bank, plc and the Series G Bonds of $150,000,000 are enhanced by a three-year letter of credit issued by Wells Fargo Bank, National Association. The Series F and G Bonds are in the variable rate mode and will reset weekly.
Both bond issues closed on January 3, 2011.

City of Philadelphia P E N N S Y L V A N I A
Required Supplementary
Information
(Other than Management’s Discussion and Analysis)
121
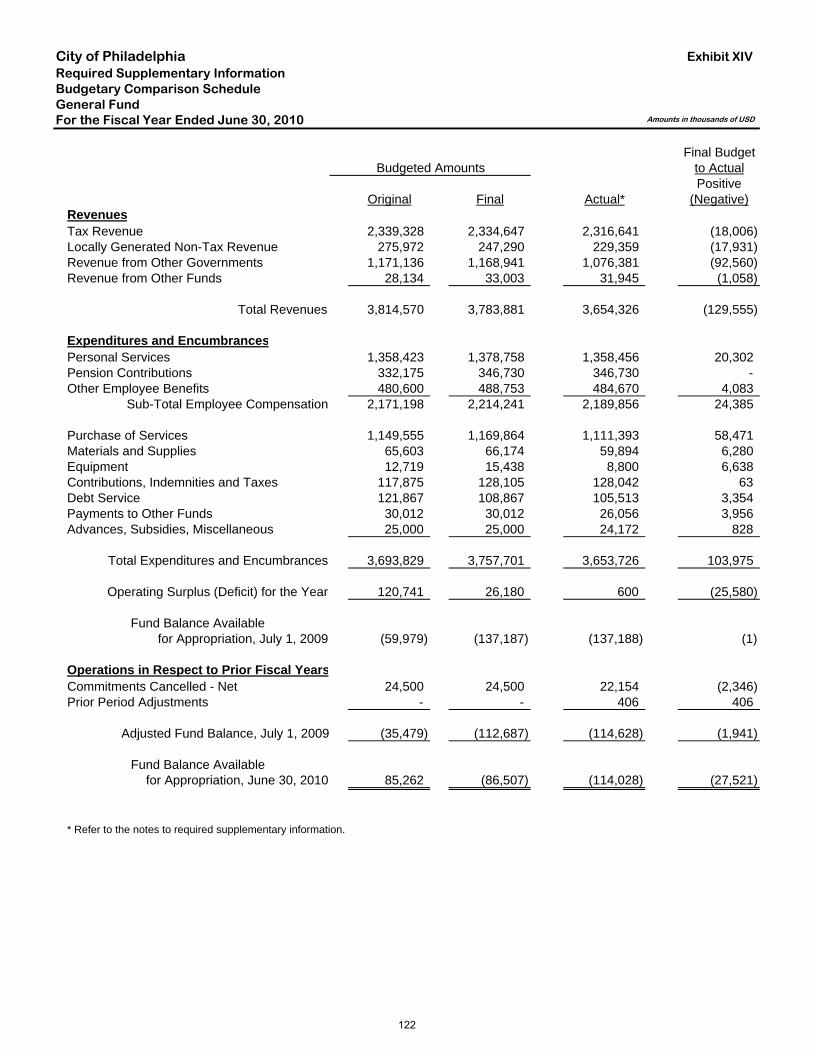
City of Philadelphia Exhibit XIVRequired Supplementary InformationBudgetary Comparison ScheduleGeneral FundFor the Fiscal Year Ended June 30, 2010
Final BudgetBudgeted Amounts to Actual
PositiveOriginal Final Actual* (Negative)
RevenuesTax Revenue 2,339,328 2,334,647 2,316,641 (18,006) Locally Generated Non-Tax Revenue 275,972 247,290 229,359 (17,931) Revenue from Other Governments 1,171,136 1,168,941 1,076,381 (92,560) Revenue from Other Funds 28,134 33,003 31,945 (1,058)
Total Revenues 3,814,570 3,783,881 3,654,326 (129,555)
Expenditures and EncumbrancesPersonal Services 1,358,423 1,378,758 1,358,456 20,302 Pension Contributions 332,175 346,730 346,730 - Other Employee Benefits 480,600 488,753 484,670 4,083
Sub-Total Employee Compensation 2,171,198 2,214,241 2,189,856 24,385
Purchase of Services 1,149,555 1,169,864 1,111,393 58,471 Materials and Supplies 65,603 66,174 59,894 6,280 Equipment 12,719 15,438 8,800 6,638 Contributions, Indemnities and Taxes 117,875 128,105 128,042 63 Debt Service 121,867 108,867 105,513 3,354 Payments to Other Funds 30,012 30,012 26,056 3,956 Advances, Subsidies, Miscellaneous 25,000 25,000 24,172 828
Total Expenditures and Encumbrances 3,693,829 3,757,701 3,653,726 103,975
Operating Surplus (Deficit) for the Year 120,741 26,180 600 (25,580)
Fund Balance Availablefor Appropriation, July 1, 2009 (59,979) (137,187) (137,188) (1)
Operations in Respect to Prior Fiscal YearsCommitments Cancelled - Net 24,500 24,500 22,154 (2,346) Prior Period Adjustments - - 406 406
Adjusted Fund Balance, July 1, 2009 (35,479) (112,687) (114,628) (1,941)
Fund Balance Availablefor Appropriation, June 30, 2010 85,262 (86,507) (114,028) (27,521)
* Refer to the notes to required supplementary information.
Amounts in thousands of USD
122
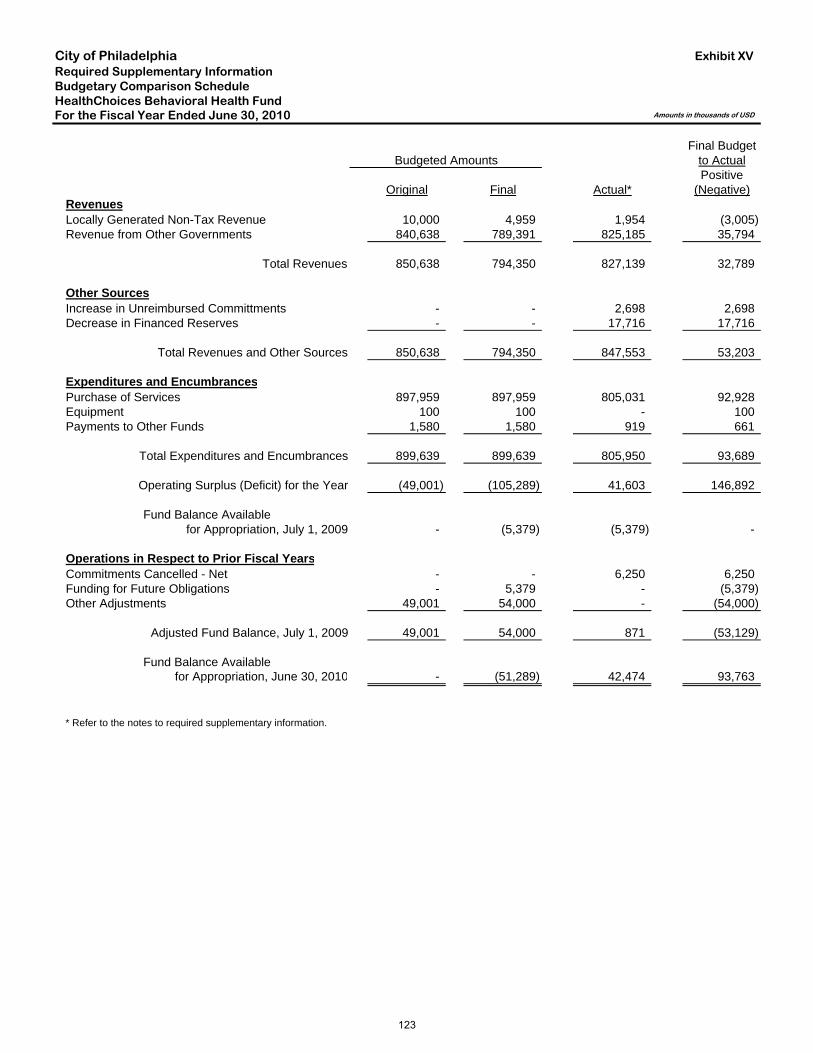
City of PhiladelphiaRequired Supplementary InformationBudgetary Comparison ScheduleHealthChoices Behavioral Health FundFor the Fiscal Year Ended June 30, 2010
Final BudgetBudgeted Amounts to Actual
PositiveOriginal Final Actual* (Negative)
RevenuesLocally Generated Non-Tax Revenue 10,000 4,959 1,954 (3,005) Revenue from Other Governments 840,638 789,391 825,185 35,794
Total Revenues 850,638 794,350 827,139 32,789
Other SourcesIncrease in Unreimbursed Committments - - 2,698 2,698 Decrease in Financed Reserves - - 17,716 17,716
Total Revenues and Other Sources 850,638 794,350 847,553 53,203
Expenditures and EncumbrancesPurchase of Services 897,959 897,959 805,031 92,928 Equipment 100 100 - 100 Payments to Other Funds 1,580 1,580 919 661
Total Expenditures and Encumbrances 899,639 899,639 805,950 93,689
Operating Surplus (Deficit) for the Year (49,001) (105,289) 41,603 146,892
Fund Balance Availablefor Appropriation, July 1, 2009 - (5,379) (5,379) -
Operations in Respect to Prior Fiscal YearsCommitments Cancelled - Net - - 6,250 6,250 Funding for Future Obligations - 5,379 - (5,379) Other Adjustments 49,001 54,000 - (54,000)
Adjusted Fund Balance, July 1, 2009 49,001 54,000 871 (53,129)
Fund Balance Available for Appropriation, June 30, 2010 - (51,289) 42,474 93,763
* Refer to the notes to required supplementary information.
Exhibit XV
Amounts in thousands of USD
123
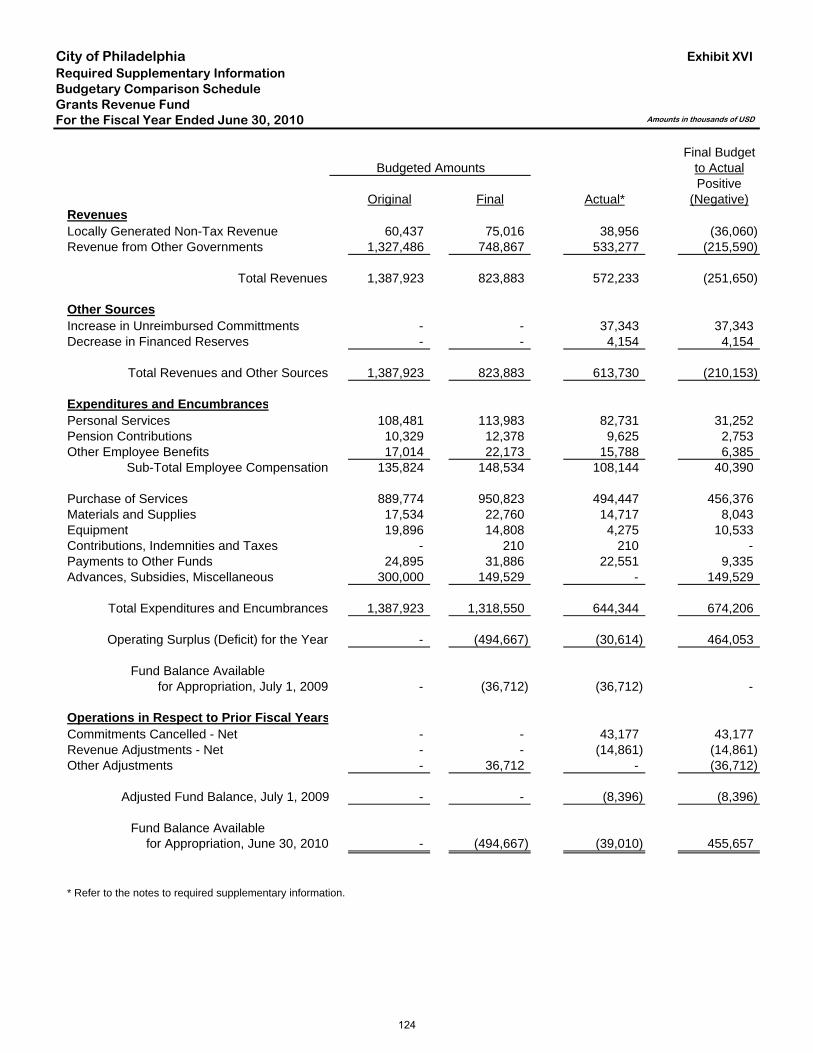
City of PhiladelphiaRequired Supplementary InformationBudgetary Comparison ScheduleGrants Revenue FundFor the Fiscal Year Ended June 30, 2010
Final BudgetBudgeted Amounts to Actual
PositiveOriginal Final Actual* (Negative)
RevenuesLocally Generated Non-Tax Revenue 60,437 75,016 38,956 (36,060) Revenue from Other Governments 1,327,486 748,867 533,277 (215,590)
Total Revenues 1,387,923 823,883 572,233 (251,650)
Other SourcesIncrease in Unreimbursed Committments - - 37,343 37,343 Decrease in Financed Reserves - - 4,154 4,154
Total Revenues and Other Sources 1,387,923 823,883 613,730 (210,153)
Expenditures and EncumbrancesPersonal Services 108,481 113,983 82,731 31,252 Pension Contributions 10,329 12,378 9,625 2,753 Other Employee Benefits 17,014 22,173 15,788 6,385
Sub-Total Employee Compensation 135,824 148,534 108,144 40,390
Purchase of Services 889,774 950,823 494,447 456,376 Materials and Supplies 17,534 22,760 14,717 8,043 Equipment 19,896 14,808 4,275 10,533 Contributions, Indemnities and Taxes - 210 210 - Payments to Other Funds 24,895 31,886 22,551 9,335 Advances, Subsidies, Miscellaneous 300,000 149,529 - 149,529
Total Expenditures and Encumbrances 1,387,923 1,318,550 644,344 674,206
Operating Surplus (Deficit) for the Year - (494,667) (30,614) 464,053
Fund Balance Availablefor Appropriation, July 1, 2009 - (36,712) (36,712) -
Operations in Respect to Prior Fiscal YearsCommitments Cancelled - Net - - 43,177 43,177 Revenue Adjustments - Net - - (14,861) (14,861) Other Adjustments - 36,712 - (36,712)
Adjusted Fund Balance, July 1, 2009 - - (8,396) (8,396)
Fund Balance Available for Appropriation, June 30, 2010 - (494,667) (39,010) 455,657
* Refer to the notes to required supplementary information.
Exhibit XVI
Amounts in thousands of USD
124
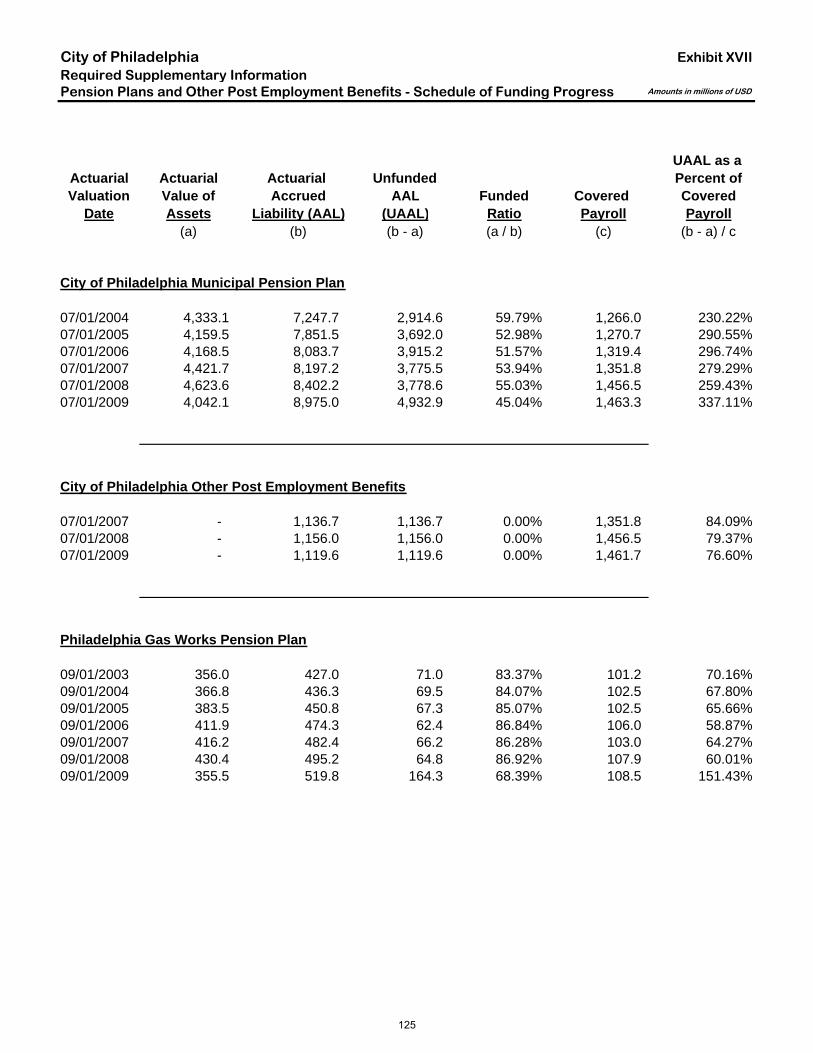
City of PhiladelphiaRequired Supplementary InformationPension Plans and Other Post Employment Benefits - Schedule of Funding Progress
UAAL as a Actuarial Actuarial Actuarial Unfunded Percent ofValuation Value of Accrued AAL Funded Covered Covered
Date Assets Liability (AAL) (UAAL) Ratio Payroll Payroll(a) (b) (b - a) (a / b) (c) (b - a) / c
City of Philadelphia Municipal Pension Plan
07/01/2004 4,333.1 7,247.7 2,914.6 59.79% 1,266.0 230.22%07/01/2005 4,159.5 7,851.5 3,692.0 52.98% 1,270.7 290.55%07/01/2006 4,168.5 8,083.7 3,915.2 51.57% 1,319.4 296.74%07/01/2007 4,421.7 8,197.2 3,775.5 53.94% 1,351.8 279.29%07/01/2008 4,623.6 8,402.2 3,778.6 55.03% 1,456.5 259.43%07/01/2009 4,042.1 8,975.0 4,932.9 45.04% 1,463.3 337.11%
City of Philadelphia Other Post Employment Benefits
07/01/2007 - 1,136.7 1,136.7 0.00% 1,351.8 84.09%07/01/2008 - 1,156.0 1,156.0 0.00% 1,456.5 79.37%07/01/2009 - 1,119.6 1,119.6 0.00% 1,461.7 76.60%
Philadelphia Gas Works Pension Plan
09/01/2003 356.0 427.0 71.0 83.37% 101.2 70.16%09/01/2004 366.8 436.3 69.5 84.07% 102.5 67.80%09/01/2005 383.5 450.8 67.3 85.07% 102.5 65.66%09/01/2006 411.9 474.3 62.4 86.84% 106.0 58.87%09/01/2007 416.2 482.4 66.2 86.28% 103.0 64.27%09/01/2008 430.4 495.2 64.8 86.92% 107.9 60.01%09/01/2009 355.5 519.8 164.3 68.39% 108.5 151.43%
Exhibit XVII
Amounts in millions of USD
125
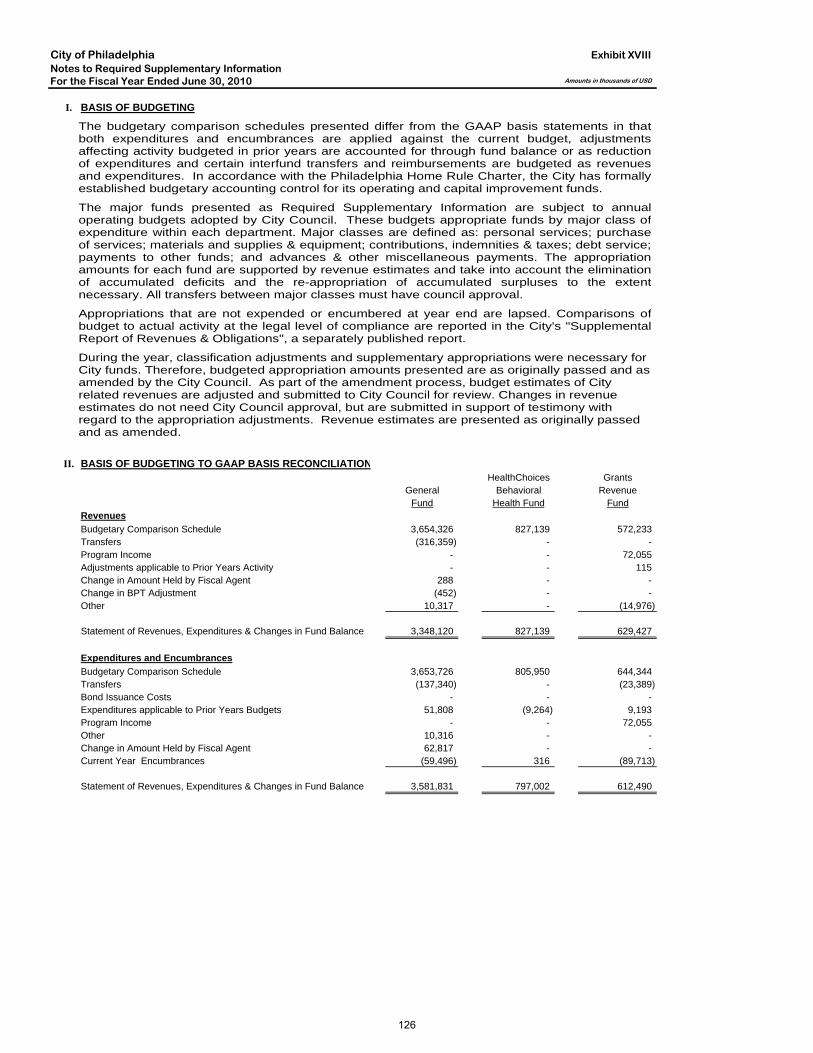
City of PhiladelphiaNotes to Required Supplementary InformationFor the Fiscal Year Ended June 30, 2010
I. BASIS OF BUDGETING
II. BASIS OF BUDGETING TO GAAP BASIS RECONCILIATIONHealthChoices Grants
General Behavioral RevenueFund Health Fund Fund
RevenuesBudgetary Comparison Schedule 3,654,326 827,139 572,233 Transfers (316,359) - - Program Income - - 72,055 Adjustments applicable to Prior Years Activity - - 115 Change in Amount Held by Fiscal Agent 288 - - Change in BPT Adjustment (452) - - Other 10,317 - (14,976)
Statement of Revenues, Expenditures & Changes in Fund Balance 3,348,120 827,139 629,427
Expenditures and EncumbrancesBudgetary Comparison Schedule 3,653,726 805,950 644,344 Transfers (137,340) - (23,389) Bond Issuance Costs - - - Expenditures applicable to Prior Years Budgets 51,808 (9,264) 9,193 Program Income - - 72,055 Other 10,316 - - Change in Amount Held by Fiscal Agent 62,817 - - Current Year Encumbrances (59,496) 316 (89,713)
Statement of Revenues, Expenditures & Changes in Fund Balance 3,581,831 797,002 612,490
Exhibit XVIII
Amounts in thousands of USD
The budgetary comparison schedules presented differ from the GAAP basis statements in thatboth expenditures and encumbrances are applied against the current budget, adjustmentsaffecting activity budgeted in prior years are accounted for through fund balance or as reductionof expenditures and certain interfund transfers and reimbursements are budgeted as revenuesand expenditures. In accordance with the Philadelphia Home Rule Charter, the City has formallyestablished budgetary accounting control for its operating and capital improvement funds.
The major funds presented as Required Supplementary Information are subject to annualoperating budgets adopted by City Council. These budgets appropriate funds by major class ofexpenditure within each department. Major classes are defined as: personal services; purchaseof services; materials and supplies & equipment; contributions, indemnities & taxes; debt service;payments to other funds; and advances & other miscellaneous payments. The appropriationamounts for each fund are supported by revenue estimates and take into account the eliminationof accumulated deficits and the re-appropriation of accumulated surpluses to the extentnecessary. All transfers between major classes must have council approval.
Appropriations that are not expended or encumbered at year end are lapsed. Comparisons ofbudget to actual activity at the legal level of compliance are reported in the City's "SupplementalReport of Revenues & Obligations", a separately published report.
During the year, classification adjustments and supplementary appropriations were necessary for City funds. Therefore, budgeted appropriation amounts presented are as originally passed and as amended by the City Council. As part of the amendment process, budget estimates of City related revenues are adjusted and submitted to City Council for review. Changes in revenue estimates do not need City Council approval, but are submitted in support of testimony with regard to the appropriation adjustments. Revenue estimates are presented as originally passed and as amended.
126

City of Philadelphia P E N N S Y L V A N I A
Other Supplementary
Information
127
NON-MAJOR GOVERNMENTAL FUNDS
SPECIAL REVENUE FUNDS Special Revenue Funds are used to account for the proceeds of specific revenue sources that are restricted by law or administrative action to specific purposes. COUNTY LIQUID FUELS TAX - Established to account for funds made available by Public Law No. 149. SPECIAL GASOLINE TAX - Established to account for funds made available by Public Law No. 588. HOTEL ROOM RENTAL TAX - Established to account for the tax levied to promote tourism. COMMUNITY DEVELOPMENT - Established to account for revenues received from the Department of Housing and Urban Development, restricted to accomplishing the objectives of the CDBG Program, within specific target areas. CAR RENTAL TAX - Established to account for the tax levied to retire new municipal stadium debt. HOUSING TRUST - Established to account for the funds to be used under Chapter 1600 of Title 21 of the Philadelphia Code to assist low income homeowners. ACUTE CARE HOSPITAL ASSESSMENT - Established in FY 2009 to account for the assessment of certain net operating revenues of certain acute care hospitals. RIVERVIEW RESIDENTS - Established to maintain a commissary and provide other benefits for the residents. PHILADELPHIA PRISONS - Established to operate a workshop and to provide benefits for the prison inmates. ARBITRATION APPEALS - Established to account for certain court fees and provide funds for the arbitration board. DEPARTMENTAL - Established to account for various activities of the Free Library and Fairmount Park. MUNICIPAL AUTHORITY ADMINISTRATIVE - Established to account for all financial transactions of the Municipal Authority not accounted for in other funds. PENNSYLVANIA INTERGOVERNMENTAL COOPERATION AUTHORITY ADMINISTRATIVE - Established to account for PICA revenues from taxes and deficit financing transactions.
128
NON-MAJOR GOVERNMENTAL FUNDS (Cont’d)
DEBT SERVICE FUNDS Debt Service Funds are used for the purpose of accumulating resources for the payment of principal on general obligation term bonds and to function as a conduit for the debt service payments to fiscal agents. CITY - Established to account for the debt service activities of the City not reflected in proprietary funds operations. MUNICIPAL AUTHORITY - Established to account for the debt service activities related to the equipment and facilities financed through the Philadelphia Municipal Authority. PENNSYLVANIA INTERGOVERNMENTAL COOPERATION AUTHORITY DEBT SERVICE - Established to account for the debt service activities related to the deficit financing provided by PICA.
CAPITAL IMPROVEMENT FUNDS
Capital Improvement Funds are used to account for financial resources to be used for the acquisition or construction of the major capital facilities other than those financed by proprietary fund operations. CITY - Established to account for capital additions and improvements to the City's facilities and infrastructure and financed through general obligation bond issues and grants from federal, state and local agencies.
MUNICIPAL AUTHORITY - Established to account for the acquisition of vehicles and the construction of major facilities for the city.
PERMANENT FUNDS
Permanent Funds are used to account for financial resources that are legally restricted to the extent that only earnings, not principal, may be used for purposes that support the government’s programs. LIBRARIES & PARKS - Established to account for trust of the Free Library and Fairmount Park.
129
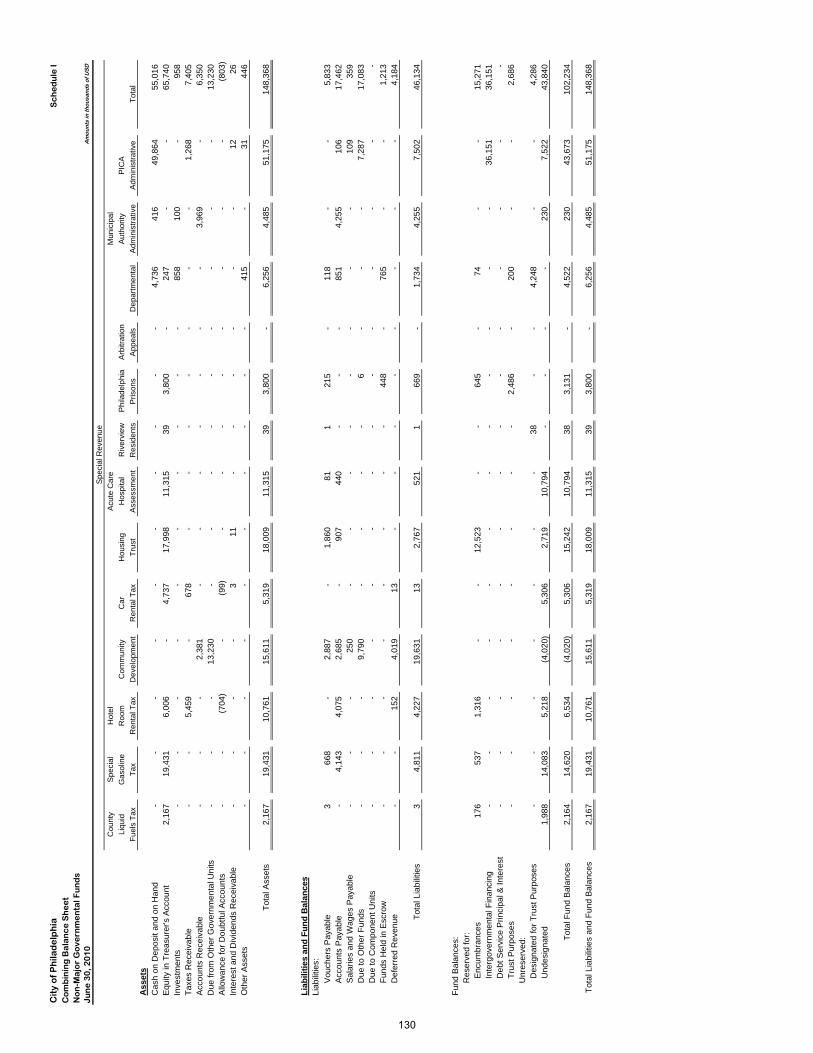
Cit
y o
f P
hila
de
lph
iaC
om
bin
ing
Ba
lan
ce
Sh
ee
tN
on
-Ma
jor
Go
vern
me
nta
l Fu
nd
sJu
ne
30
, 20
10
Spe
cial
Rev
enue
Cou
nty
Spe
cial
Hot
elA
cute
Car
eM
unic
ipal
Liqu
idG
asol
ine
Roo
mC
omm
unity
Car
Hou
sing
Hos
pita
lR
iver
view
Phi
lade
lphi
aA
rbitr
atio
nA
utho
rity
PIC
A
Fue
ls T
axT
axR
enta
l Tax
Dev
elop
men
tR
enta
l Tax
Tru
stA
sses
smen
tR
esid
ents
Pris
ons
App
eals
Dep
artm
enta
lA
dmin
istr
ativ
eA
dmin
istr
ativ
eT
otal
Ass
ets
Cas
h on
Dep
osit
and
on H
and
-
-
-
-
-
-
-
-
-
-
4,
736
416
49
,864
55
,016
Equ
ity in
Tre
asur
er's
Acc
ount
2,16
7
19
,431
6,
006
-
4,73
7
17
,998
11
,315
39
3,80
0
-
247
-
-
65,7
40
In
vest
men
ts-
-
-
-
-
-
-
-
-
-
858
10
0
-
95
8
Tax
es R
ecei
vabl
e-
-
5,
459
-
678
-
-
-
-
-
-
-
1,
268
7,
405
Acc
ount
s R
ecei
vabl
e-
-
-
2,38
1
-
-
-
-
-
-
-
3,96
9
-
6,35
0
D
ue fr
om O
ther
Gov
ernm
enta
l Uni
ts-
-
-
13,2
30
-
-
-
-
-
-
-
-
-
13,2
30
A
llow
ance
for
Dou
btfu
l Acc
ount
s-
-
(7
04)
-
(9
9)
-
-
-
-
-
-
-
-
(8
03)
In
tere
st a
nd D
ivid
ends
Rec
eiva
ble
-
-
-
-
3
11
-
-
-
-
-
-
12
26
O
ther
Ass
ets
-
-
-
-
-
-
-
-
-
-
41
5
-
31
446
Tot
al A
sset
s2,
167
19,4
31
10,7
61
15,6
11
5,31
9
18
,009
11
,315
39
3,80
0
-
6,25
6
4,
485
51,1
75
148,
368
Liab
ilitie
s an
d Fu
nd B
alan
ces
Liab
ilitie
s:
Vou
cher
s P
ayab
le3
668
-
2,
887
-
1,
860
81
1
215
-
118
-
-
5,83
3
A
ccou
nts
Pay
able
-
4,
143
4,
075
2,
685
-
90
7
440
-
-
-
85
1
4,25
5
10
6
17
,462
Sal
arie
s an
d W
ages
Pay
able
-
-
-
25
0
-
-
-
-
-
-
-
-
10
9
35
9
Due
to O
ther
Fun
ds-
-
-
9,79
0
-
-
-
-
6
-
-
-
7,28
7
17,0
83
D
ue to
Com
pone
nt U
nits
-
-
-
-
-
-
-
-
-
-
-
-
-
-
Fun
ds H
eld
in E
scro
w-
-
-
-
-
-
-
-
448
-
765
-
-
1,21
3
D
efer
red
Rev
enue
-
-
152
4,01
9
13
-
-
-
-
-
-
-
-
4,18
4
T
otal
Lia
bilit
ies
3
4,
811
4,
227
19
,631
13
2,
767
521
1
66
9
-
1,
734
4,25
5
7,
502
46
,134
Fun
d B
alan
ces:
Res
erve
d fo
r: E
ncum
bran
ces
176
53
7
1,
316
-
-
12
,523
-
-
645
-
74
-
-
15,2
71
I
nter
gove
rnm
enta
l Fin
anci
ng-
-
-
-
-
-
-
-
-
-
-
-
36,1
51
36,1
51
D
ebt S
ervi
ce P
rinci
pal &
Inte
rest
-
-
-
-
-
-
-
-
-
-
-
-
-
-
Tru
st P
urpo
ses
-
-
-
-
-
-
-
-
2,
486
-
20
0
-
-
2,
686
Unr
eser
ved:
Des
igna
ted
for
Tru
st P
urpo
ses
-
-
-
-
-
-
-
38
-
-
4,24
8
-
-
4,28
6
U
ndes
igna
ted
1,98
8
14
,083
5,
218
(4
,020
)
5,30
6
2,
719
10,7
94
-
-
-
-
230
7,
522
43
,840
Tot
al F
und
Bal
ance
s2,
164
14,6
20
6,53
4
(4,0
20)
5,
306
15,2
42
10,7
94
38
3,
131
-
4,
522
230
43
,673
10
2,23
4
Tot
al L
iabi
litie
s an
d F
und
Bal
ance
s2,
167
19,4
31
10,7
61
15,6
11
5,31
9
18
,009
11
,315
39
3,80
0
-
6,25
6
4,
485
51,1
75
148,
368
Sc
he
du
le I
Am
ount
s in
thou
sand
s of
US
D
130
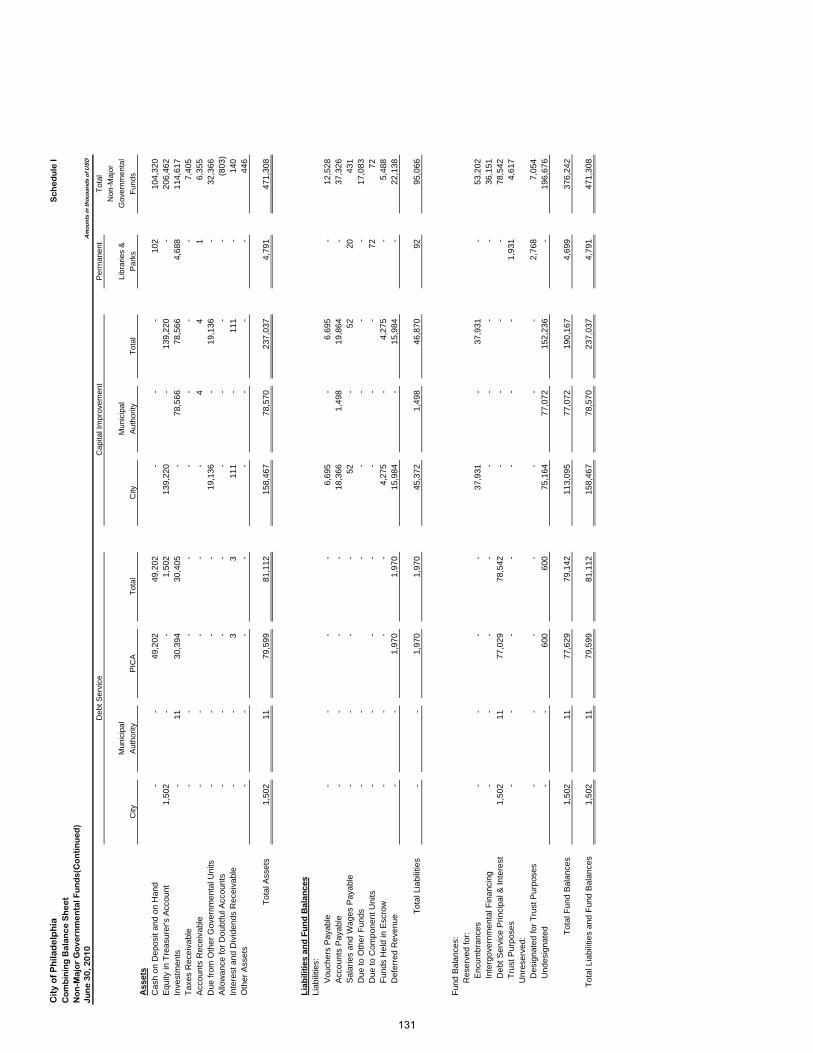
Cit
y o
f P
hila
de
lph
iaC
om
bin
ing
Ba
lan
ce
Sh
ee
tN
on
-Ma
jor
Go
vern
me
nta
l Fu
nd
s(C
on
tin
ue
d)
Jun
e 3
0, 2
01
0D
ebt S
ervi
ceC
apita
l Im
prov
emen
tP
erm
anen
tT
otal
Non
-Maj
or
Mun
icip
alM
unic
ipal
Libr
arie
s &
Gov
ernm
enta
l
City
Aut
horit
yP
ICA
Tot
alC
ityA
utho
rity
Tot
alP
arks
Fun
dsA
sset
sC
ash
on D
epos
it an
d on
Han
d-
-
49,2
02
49
,202
-
-
-
102
10
4,32
0
E
quity
in T
reas
urer
's A
ccou
nt1,
502
-
-
1,50
2
13
9,22
0
-
139,
220
-
206,
462
Inve
stm
ents
-
11
30,3
94
30
,405
-
78
,566
78
,566
4,
688
114,
617
Tax
es R
ecei
vabl
e-
-
-
-
-
-
-
-
7,40
5
Acc
ount
s R
ecei
vabl
e-
-
-
-
-
4
4
1
6,35
5
Due
from
Oth
er G
over
nmen
tal U
nits
-
-
-
-
19
,136
-
19
,136
-
32
,366
Allo
wan
ce fo
r D
oubt
ful A
ccou
nts
-
-
-
-
-
-
-
-
(8
03)
In
tere
st a
nd D
ivid
ends
Rec
eiva
ble
-
-
3
3
11
1
-
111
-
14
0
O
ther
Ass
ets
-
-
-
-
-
-
-
-
44
6
Tot
al A
sset
s1,
502
11
79
,599
81,1
12
15
8,46
7
78,5
70
237,
037
4,79
1
47
1,30
8
Liab
ilitie
s an
d Fu
nd B
alan
ces
Liab
ilitie
s:
Vou
cher
s P
ayab
le-
-
-
-
6,69
5
-
6,
695
-
12,5
28
A
ccou
nts
Pay
able
-
-
-
-
18
,366
1,
498
19,8
64
-
37,3
26
S
alar
ies
and
Wag
es P
ayab
le-
-
-
-
52
-
52
20
431
Due
to O
ther
Fun
ds-
-
-
-
-
-
-
17,0
83
D
ue to
Com
pone
nt U
nits
-
-
-
-
-
-
-
72
72
Fun
ds H
eld
in E
scro
w-
-
-
-
4,27
5
-
4,
275
-
5,48
8
Def
erre
d R
even
ue-
-
1,97
0
1,
970
15,9
84
-
15,9
84
-
22,1
38
T
otal
Lia
bilit
ies
-
-
1,
970
1,97
0
45
,372
1,
498
46,8
70
92
95
,066
Fun
d B
alan
ces:
Res
erve
d fo
r: E
ncum
bran
ces
-
-
-
-
37
,931
-
37
,931
-
53
,202
Int
ergo
vern
men
tal F
inan
cing
-
-
-
-
-
-
-
-
36
,151
Deb
t Ser
vice
Prin
cipa
l & In
tere
st1,
502
11
77
,029
78,5
42
-
-
-
-
78
,542
Tru
st P
urpo
ses
-
-
-
-
-
-
-
1,
931
4,61
7
Unr
eser
ved:
Des
igna
ted
for
Tru
st P
urpo
ses
-
-
-
-
-
-
-
2,
768
7,05
4
Und
esig
nate
d-
-
600
60
0
75,1
64
77,0
72
152,
236
-
196,
676
Tot
al F
und
Bal
ance
s1,
502
11
77
,629
79,1
42
11
3,09
5
77,0
72
190,
167
4,69
9
37
6,24
2
Tot
al L
iabi
litie
s an
d F
und
Bal
ance
s1,
502
11
79
,599
81,1
12
15
8,46
7
78,5
70
237,
037
4,79
1
47
1,30
8
Sc
he
du
le I
Am
ount
s in
thou
sand
s of
US
D
131
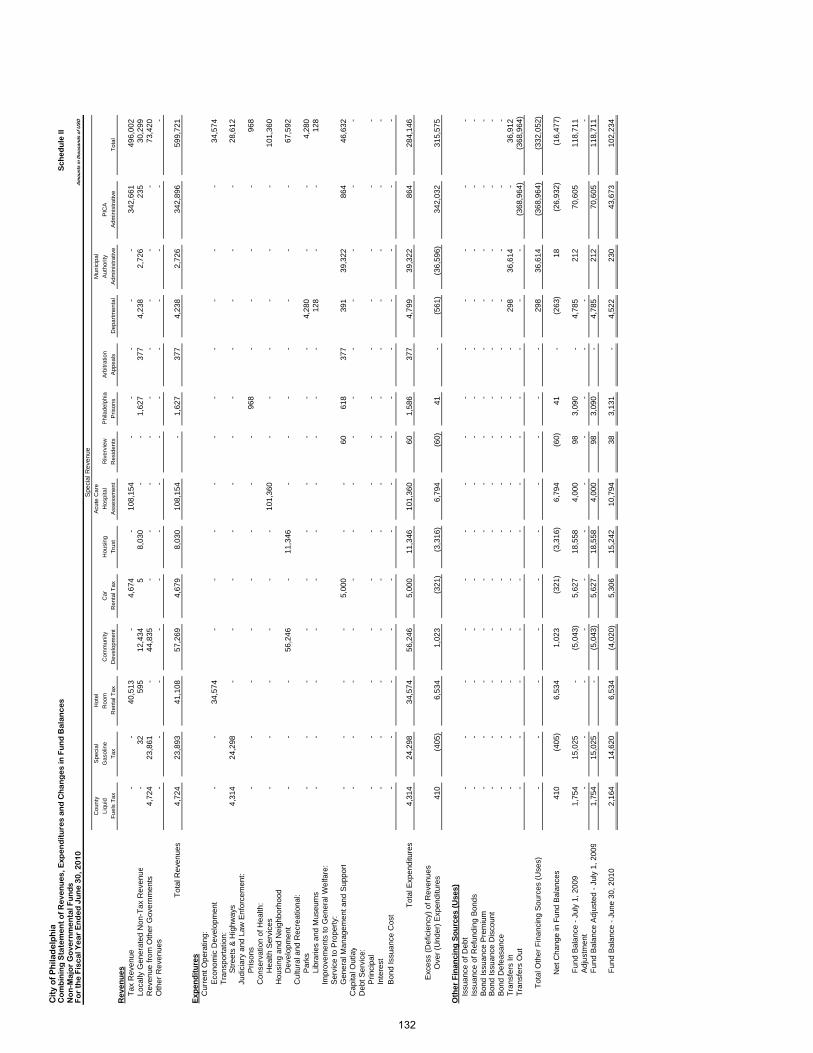
Cit
y o
f P
hila
de
lph
iaC
om
bin
ing
Sta
tem
en
t o
f R
eve
nu
es,
Exp
en
dit
ure
s a
nd
Ch
an
ge
s in
Fu
nd
Ba
lan
ce
sSc
hedu
le II
No
n-M
ajo
r G
ove
rnm
en
tal F
un
ds
Fo
r th
e F
isc
al Y
ea
r E
nd
ed
Ju
ne
30
, 20
10
Spe
cial
Rev
enue
Cou
nty
Spe
cial
Hot
elA
cute
Car
eM
unic
ipal
Liqu
idG
asol
ine
Roo
mC
omm
unity
Car
Hou
sing
Hos
pita
lR
iver
view
Phi
lade
lphi
aA
rbitr
atio
nA
utho
rity
PIC
A
Fue
ls T
axT
axR
enta
l Tax
Dev
elop
men
tR
enta
l Tax
Tru
stA
sses
smen
tR
esid
ents
Pris
ons
App
eals
Dep
artm
enta
lA
dmin
istr
ativ
eA
dmin
istr
ativ
eT
otal
Rev
enue
sT
ax R
even
ue-
-
40
,513
-
4,
674
-
108,
154
-
-
-
-
-
342,
661
49
6,00
2
Loca
lly G
ener
ated
Non
-Tax
Rev
enu
e-
32
595
12,4
34
5
8,
030
-
-
1,
627
377
4,
238
2,72
6
23
5
30,2
99
R
even
ue fr
om O
ther
Gov
ernm
ents
4,72
4
23
,861
-
44,8
35
-
-
-
-
-
-
-
-
-
73
,420
Oth
er R
even
ues
-
-
-
-
-
-
-
-
-
-
-
-
-
-
T
otal
Rev
enue
s4,
724
23,8
93
41,1
08
57,2
69
4,
679
8,03
0
10
8,15
4
-
1,62
7
37
7
4,23
8
2,
726
342,
896
59
9,72
1
Expe
nditu
res
Cur
rent
Ope
ratin
g:E
cono
mic
Dev
elop
men
t-
-
34
,574
-
-
-
-
-
-
-
-
-
-
34
,574
Tra
nspo
rtat
ion:
Str
eets
& H
ighw
ays
4,31
4
24
,298
-
-
-
-
-
-
-
-
-
-
-
28,6
12
Ju
dici
ary
and
Law
Enf
orce
men
t:P
rison
s-
-
-
-
-
-
-
-
96
8
-
-
-
-
968
Con
serv
atio
n of
Hea
lth:
Hea
lth S
ervi
ces
-
-
-
-
-
-
10
1,36
0
-
-
-
-
-
-
10
1,36
0
Hou
sing
and
Nei
ghbo
rhoo
dD
evel
opm
ent
-
-
-
56
,246
-
11,3
46
-
-
-
-
-
-
-
67,5
92
C
ultu
ral a
nd R
ecre
atio
nal:
Par
ks-
-
-
-
-
-
-
-
-
-
4,28
0
-
-
4,
280
Li
brar
ies
and
Mus
eum
s-
-
-
-
-
-
-
-
-
-
128
-
-
12
8
Im
prov
emen
ts to
Gen
eral
Wel
fare
:S
ervi
ce to
Pro
pert
y:G
ener
al M
anag
emen
t and
Sup
port
-
-
-
-
5,
000
-
-
60
618
37
7
391
39
,322
864
46
,632
Cap
ital O
utla
y-
-
-
-
-
-
-
-
-
-
-
-
-
-
Deb
t Ser
vice
:P
rinci
pal
-
-
-
-
-
-
-
-
-
-
-
-
-
-
In
tere
st-
-
-
-
-
-
-
-
-
-
-
-
-
-
Bon
d Is
suan
ce C
ost
-
-
-
-
-
-
-
-
-
-
-
-
-
-
Tot
al E
xpen
ditu
res
4,31
4
24
,298
34
,574
56
,246
5,00
0
11
,346
10
1,36
0
60
1,
586
377
4,
799
39,3
22
86
4
284,
146
Exc
ess
(Def
icie
ncy)
of R
even
ues
Ove
r (U
nder
) E
xpen
ditu
res
410
(4
05)
6,53
4
1,02
3
(321
)
(3,3
16)
6,79
4
(6
0)
41
-
(561
)
(36,
596)
34
2,03
2
315,
575
Oth
er F
inan
cing
Sou
rces
(Use
s)Is
suan
ce o
f Deb
t-
-
-
-
-
-
-
-
-
-
-
-
-
-
Issu
ance
of R
efun
ding
Bon
ds-
-
-
-
-
-
-
-
-
-
-
-
-
-
Bon
d Is
suan
ce P
rem
ium
-
-
-
-
-
-
-
-
-
-
-
-
-
-
B
ond
Issu
ance
Dis
coun
t-
-
-
-
-
-
-
-
-
-
-
-
-
-
Bon
d D
efea
sanc
e-
-
-
-
-
-
-
-
-
-
-
-
-
-
Tra
nsfe
rs In
-
-
-
-
-
-
-
-
-
-
29
8
36,6
14
-
36
,912
Tra
nsfe
rs O
ut-
-
-
-
-
-
-
-
-
-
-
-
(368
,964
)
(368
,964
)
Tot
al O
ther
Fin
anci
ng S
ourc
es (
Use
s )-
-
-
-
-
-
-
-
-
-
298
36
,614
(368
,964
)
(332
,052
)
Net
Cha
nge
in F
und
Bal
ance
s41
0
(405
)
6,
534
1,
023
(3
21)
(3
,316
)
6,
794
(60)
41
-
(2
63)
18
(26,
932)
(1
6,47
7)
Fun
d B
alan
ce -
Jul
y 1,
200
91,
754
15,0
25
-
(5
,043
)
5,
627
18,5
58
4,00
0
98
3,09
0
-
4,
785
212
70
,605
118,
711
A
djus
tmen
t-
-
-
-
-
-
-
-
-
-
-
-
Fun
d B
alan
ce A
djus
ted
- Ju
ly 1
, 200
91,
754
15,0
25
-
(5
,043
)
5,
627
18,5
58
4,00
0
98
3,09
0
-
4,
785
212
70
,605
118,
711
Fun
d B
alan
ce -
Jun
e 30
, 201
02,
164
14,6
20
6,53
4
(4,0
20)
5,30
6
15
,242
10
,794
38
3,13
1
-
4,
522
230
43
,673
102,
234
Am
ount
s in
thou
sand
s of
US
D
132
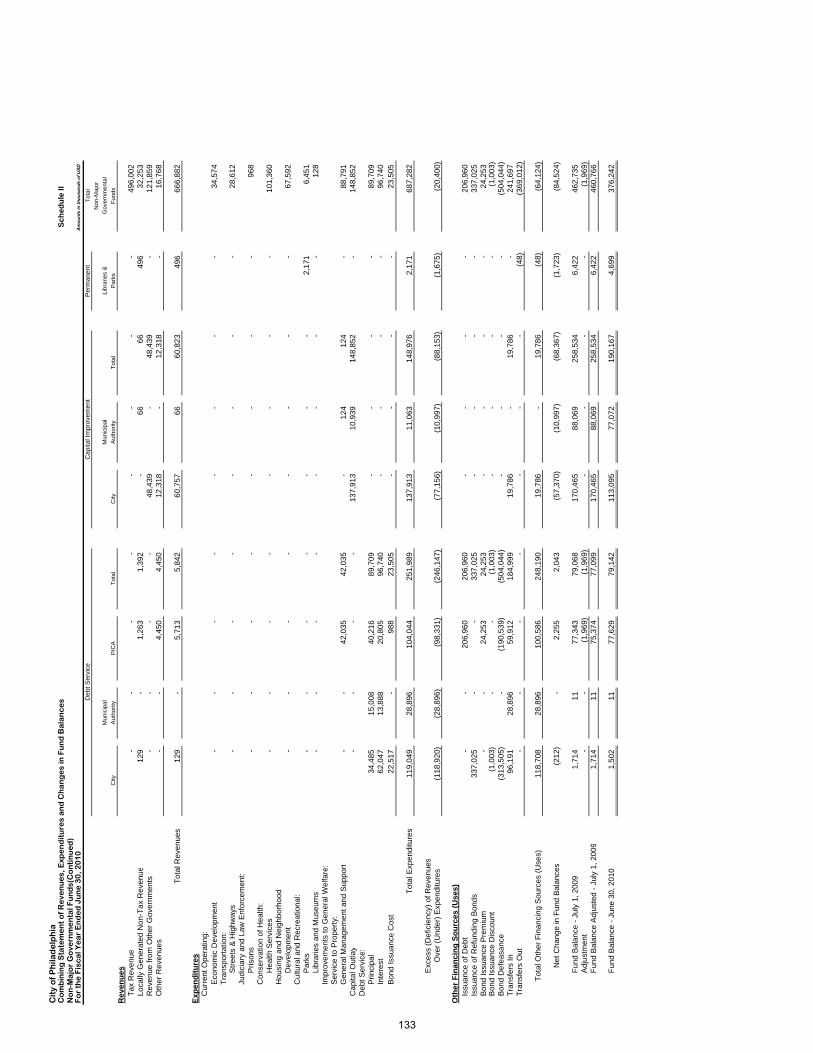
Cit
y o
f P
hila
de
lph
iaC
om
bin
ing
Sta
tem
en
t o
f R
eve
nu
es,
Exp
en
dit
ure
s a
nd
Ch
an
ge
s in
Fu
nd
Ba
lan
ce
sSc
hedu
le II
No
n-M
ajo
r G
ove
rnm
en
tal F
un
ds(
Co
nti
nu
ed
)F
or
the
Fis
ca
l Ye
ar
En
de
d J
un
e 3
0, 2
01
0D
ebt S
ervi
ceC
apita
l Im
prov
emen
tP
erm
anen
tT
otal
Non
-Maj
or
Mun
icip
alM
unic
ipal
Libr
arie
s &
Gov
ernm
enta
l
City
Aut
horit
yP
ICA
Tot
alC
ityA
utho
rity
Tot
alP
arks
Fun
ds
Rev
enue
sT
ax R
even
ue-
-
-
-
-
-
-
-
496,
002
Lo
cally
Gen
erat
ed N
on-T
ax R
even
ue12
9
-
1,26
3
1,39
2
-
66
66
496
32,2
53
R
even
ue fr
om O
ther
Gov
ernm
ents
-
-
-
-
48
,439
-
48
,439
-
12
1,85
9
Oth
er R
even
ues
-
-
4,45
0
4,45
0
12,3
18
-
12,3
18
-
16,7
68
T
otal
Rev
enue
s12
9
-
5,71
3
5,84
2
60,7
57
66
60
,823
49
6
66
6,88
2
Expe
nditu
res
Cur
rent
Ope
ratin
g:E
cono
mic
Dev
elop
men
t-
-
-
-
-
-
-
-
34,5
74
T
rans
port
atio
n:S
tree
ts &
Hig
hway
s-
-
-
-
-
-
-
-
28,6
12
Ju
dici
ary
and
Law
Enf
orce
men
t:P
rison
s-
-
-
-
-
-
-
-
968
C
onse
rvat
ion
of H
ealth
:H
ealth
Ser
vice
s-
-
-
-
-
-
-
-
101,
360
H
ousi
ng a
nd N
eigh
borh
ood
Dev
elop
men
t-
-
-
-
-
-
-
-
67,5
92
C
ultu
ral a
nd R
ecre
atio
nal:
Par
ks-
-
-
-
-
-
-
2,17
1
6,45
1
Li
brar
ies
and
Mus
eum
s-
-
-
-
-
-
-
-
128
Im
prov
emen
ts to
Gen
eral
Wel
fare
:S
ervi
ce to
Pro
pert
y:G
ener
al M
anag
emen
t and
Sup
port
-
-
42,0
35
42,0
35
-
12
4
12
4
-
88
,791
Cap
ital O
utla
y-
-
-
-
137,
913
10
,939
14
8,85
2
-
14
8,85
2
Deb
t Ser
vice
:P
rinci
pal
34,4
85
15,0
08
40,2
16
89,7
09
-
-
-
-
89
,709
Inte
rest
62,0
47
13,8
88
20,8
05
96,7
40
-
-
-
-
96
,740
Bon
d Is
suan
ce C
ost
22,5
17
-
988
23
,505
-
-
-
-
23,5
05
Tot
al E
xpen
ditu
res
119,
049
28,8
96
104,
044
251,
989
137,
913
11
,063
14
8,97
6
2,
171
68
7,28
2
Exc
ess
(Def
icie
ncy)
of R
even
ues
Ove
r (U
nder
) E
xpen
ditu
res
(118
,920
)
(2
8,89
6)
(98,
331)
(246
,147
)
(77,
156)
(10,
997)
(88,
153)
(1,6
75)
(20,
400)
Oth
er F
inan
cing
Sou
rces
(Use
s)Is
suan
ce o
f Deb
t-
-
20
6,96
0
20
6,96
0
-
-
-
-
20
6,96
0
Issu
ance
of R
efun
ding
Bon
ds33
7,02
5
-
-
33
7,02
5
-
-
-
-
33
7,02
5
Bon
d Is
suan
ce P
rem
ium
-
-
24,2
53
24,2
53
-
-
-
-
24
,253
Bon
d Is
suan
ce D
isco
unt
(1,0
03)
-
-
(1
,003
)
-
-
-
-
(1,0
03)
Bon
d D
efea
sanc
e(3
13,5
05)
-
(1
90,5
39)
(504
,044
)
-
-
-
-
(504
,044
)
Tra
nsfe
rs In
96,1
91
28,8
96
59,9
12
184,
999
19,7
86
-
19,7
86
-
241,
697
T
rans
fers
Out
-
-
-
-
-
-
-
(4
8)
(3
69,0
12)
Tot
al O
ther
Fin
anci
ng S
ourc
es (
Use
s)11
8,70
8
28
,896
10
0,58
6
24
8,19
0
19
,786
-
19
,786
(4
8)
(6
4,12
4)
Net
Cha
nge
in F
und
Bal
ance
s(2
12)
-
2,
255
2,
043
(5
7,37
0)
(1
0,99
7)
(6
8,36
7)
(1
,723
)
(8
4,52
4)
Fun
d B
alan
ce -
Jul
y 1,
200
91,
714
11
77
,343
79
,068
170,
465
88
,069
25
8,53
4
6,
422
46
2,73
5
Adj
ustm
ent
-
-
(1,9
69)
(1
,969
)
-
-
-
-
(1,9
69)
Fun
d B
alan
ce A
djus
ted
- Ju
ly 1
, 200
91,
714
11
75
,374
77
,099
170,
465
88
,069
25
8,53
4
6,
422
46
0,76
6
Fun
d B
alan
ce -
Jun
e 30
, 201
01,
502
11
77
,629
79
,142
113,
095
77
,072
19
0,16
7
4,
699
37
6,24
2
Am
ount
s in
thou
sand
s of
US
D
133
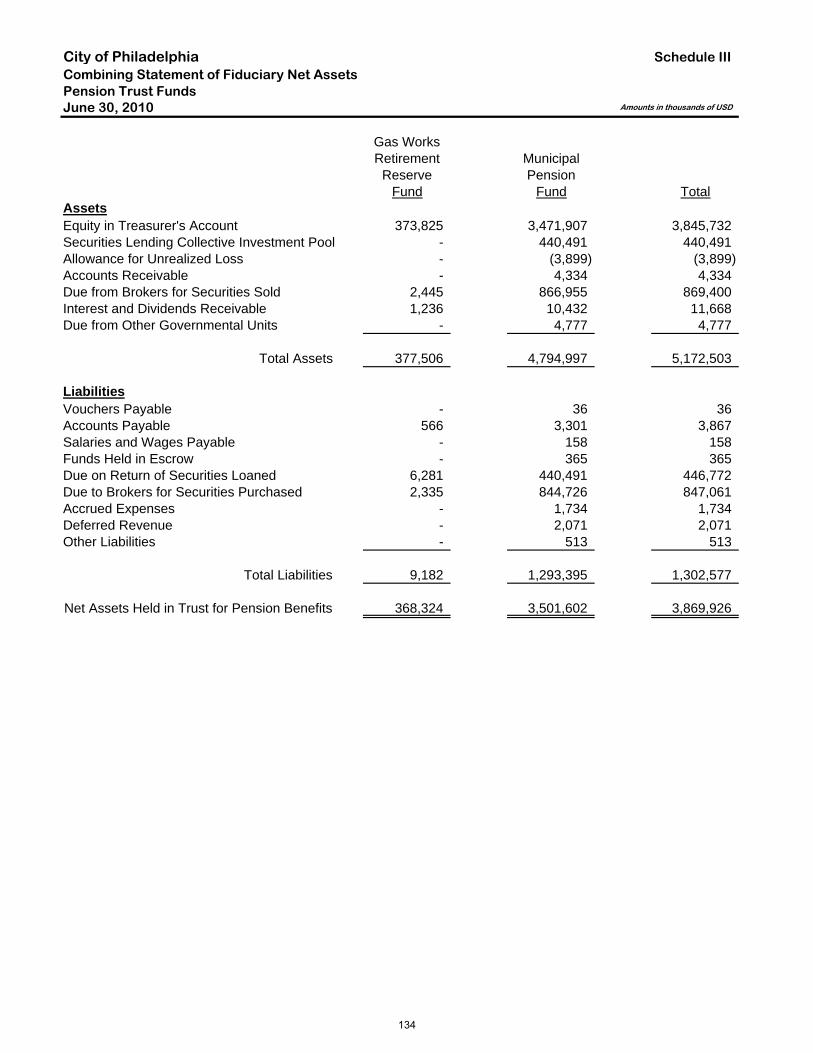
City of PhiladelphiaCombining Statement of Fiduciary Net AssetsPension Trust FundsJune 30, 2010
Gas WorksRetirement Municipal
Reserve PensionFund Fund Total
AssetsEquity in Treasurer's Account 373,825 3,471,907 3,845,732 Securities Lending Collective Investment Pool - 440,491 440,491 Allowance for Unrealized Loss - (3,899) (3,899) Accounts Receivable - 4,334 4,334 Due from Brokers for Securities Sold 2,445 866,955 869,400 Interest and Dividends Receivable 1,236 10,432 11,668 Due from Other Governmental Units - 4,777 4,777
Total Assets 377,506 4,794,997 5,172,503
LiabilitiesVouchers Payable - 36 36 Accounts Payable 566 3,301 3,867 Salaries and Wages Payable - 158 158 Funds Held in Escrow - 365 365 Due on Return of Securities Loaned 6,281 440,491 446,772 Due to Brokers for Securities Purchased 2,335 844,726 847,061 Accrued Expenses - 1,734 1,734 Deferred Revenue - 2,071 2,071 Other Liabilities - 513 513
Total Liabilities 9,182 1,293,395 1,302,577
Net Assets Held in Trust for Pension Benefits 368,324 3,501,602 3,869,926
Schedule III
Amounts in thousands of USD
134
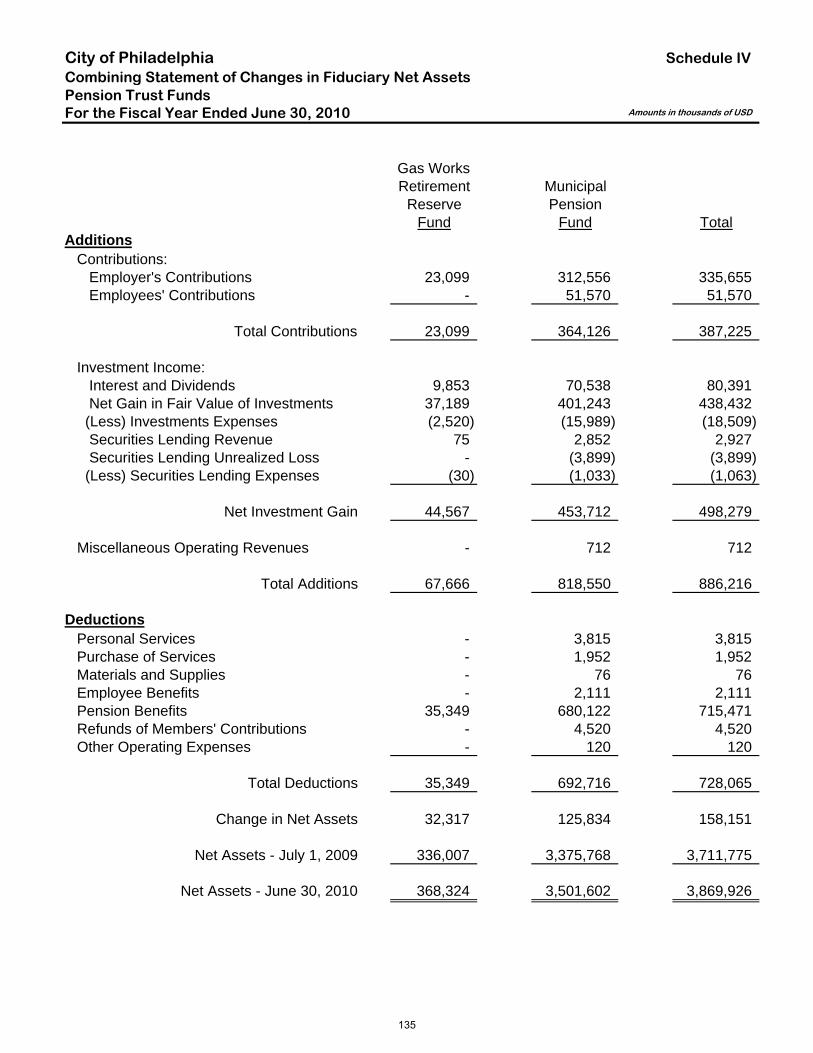
City of PhiladelphiaCombining Statement of Changes in Fiduciary Net AssetsPension Trust FundsFor the Fiscal Year Ended June 30, 2010
Gas WorksRetirement Municipal
Reserve PensionFund Fund Total
Additions Contributions: Employer's Contributions 23,099 312,556 335,655 Employees' Contributions - 51,570 51,570
Total Contributions 23,099 364,126 387,225
Investment Income: Interest and Dividends 9,853 70,538 80,391 Net Gain in Fair Value of Investments 37,189 401,243 438,432 (Less) Investments Expenses (2,520) (15,989) (18,509) Securities Lending Revenue 75 2,852 2,927 Securities Lending Unrealized Loss - (3,899) (3,899) (Less) Securities Lending Expenses (30) (1,033) (1,063)
Net Investment Gain 44,567 453,712 498,279
Miscellaneous Operating Revenues - 712 712
Total Additions 67,666 818,550 886,216
Deductions Personal Services - 3,815 3,815 Purchase of Services - 1,952 1,952 Materials and Supplies - 76 76 Employee Benefits - 2,111 2,111 Pension Benefits 35,349 680,122 715,471 Refunds of Members' Contributions - 4,520 4,520 Other Operating Expenses - 120 120
Total Deductions 35,349 692,716 728,065
Change in Net Assets 32,317 125,834 158,151
Net Assets - July 1, 2009 336,007 3,375,768 3,711,775
Net Assets - June 30, 2010 368,324 3,501,602 3,869,926
Schedule IV
Amounts in thousands of USD
135
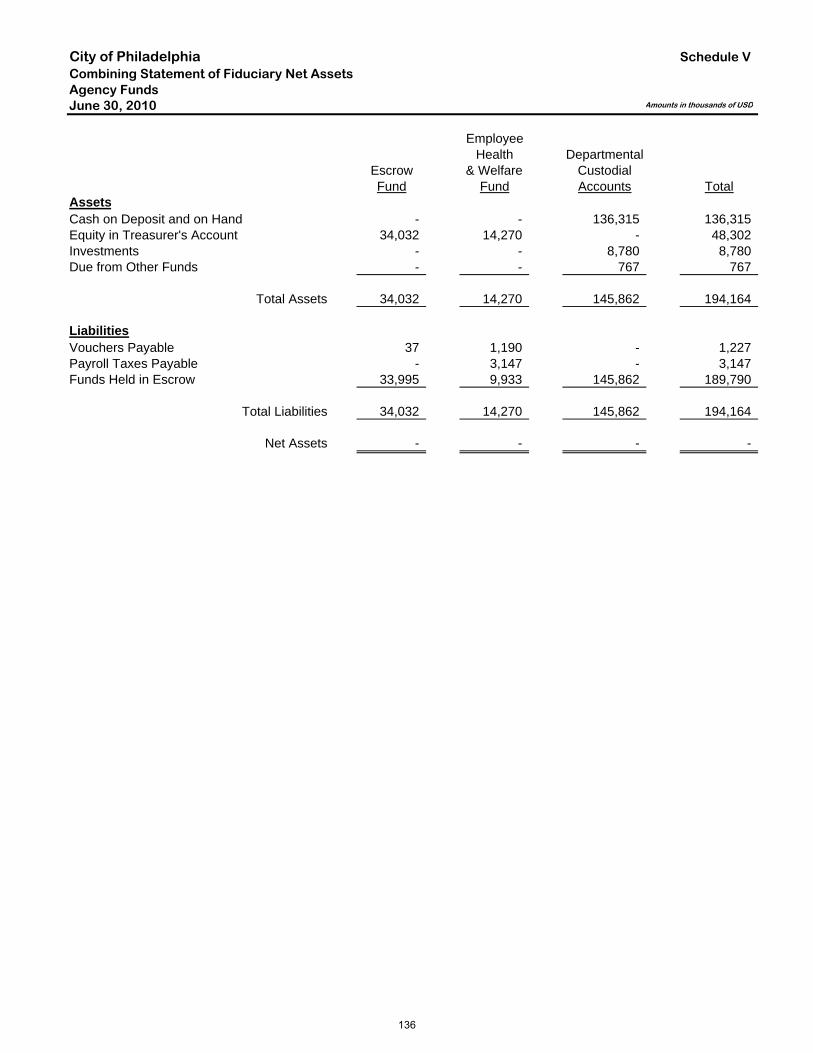
City of PhiladelphiaCombining Statement of Fiduciary Net AssetsAgency FundsJune 30, 2010
EmployeeHealth Departmental
Escrow & Welfare CustodialFund Fund Accounts Total
AssetsCash on Deposit and on Hand - - 136,315 136,315 Equity in Treasurer's Account 34,032 14,270 - 48,302 Investments - - 8,780 8,780 Due from Other Funds - - 767 767
Total Assets 34,032 14,270 145,862 194,164
LiabilitiesVouchers Payable 37 1,190 - 1,227 Payroll Taxes Payable - 3,147 - 3,147 Funds Held in Escrow 33,995 9,933 145,862 189,790
Total Liabilities 34,032 14,270 145,862 194,164
Net Assets - - - -
Schedule V
Amounts in thousands of USD
136
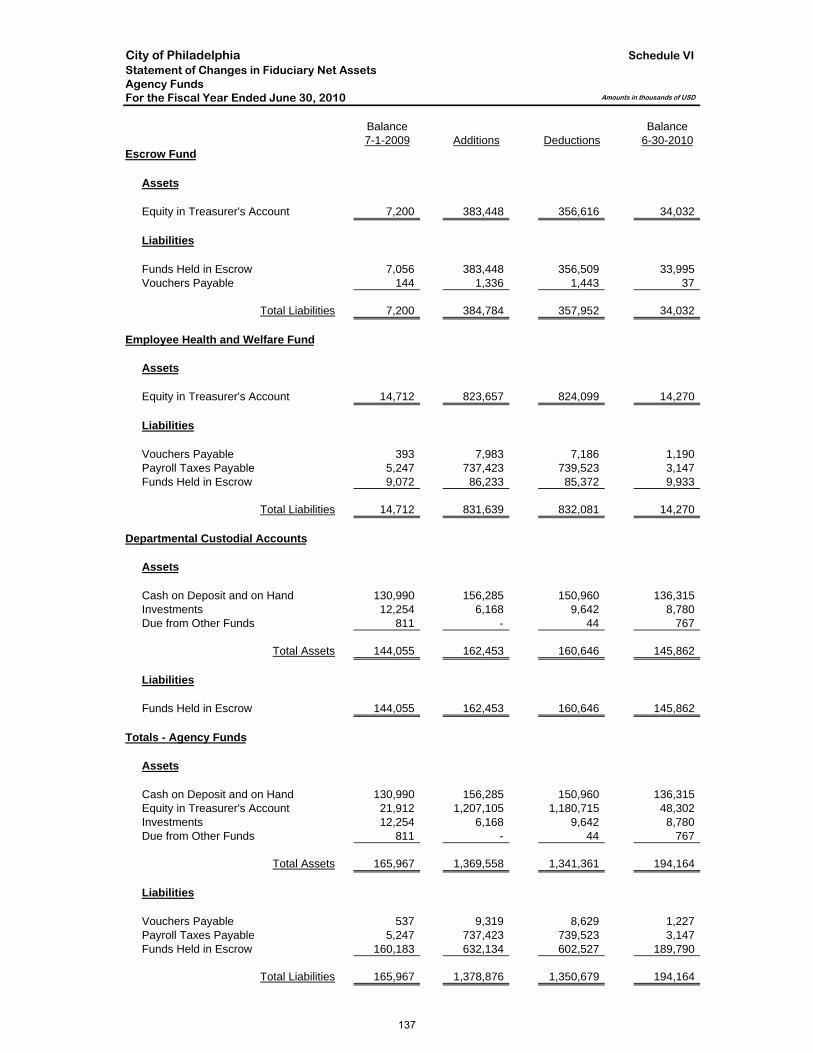
City of PhiladelphiaStatement of Changes in Fiduciary Net AssetsAgency FundsFor the Fiscal Year Ended June 30, 2010
Balance Balance7-1-2009 Additions Deductions 6-30-2010
Escrow Fund
Assets
Equity in Treasurer's Account 7,200 383,448 356,616 34,032
Liabilities
Funds Held in Escrow 7,056 383,448 356,509 33,995 Vouchers Payable 144 1,336 1,443 37
Total Liabilities 7,200 384,784 357,952 34,032
Employee Health and Welfare Fund
Assets
Equity in Treasurer's Account 14,712 823,657 824,099 14,270
Liabilities
Vouchers Payable 393 7,983 7,186 1,190 Payroll Taxes Payable 5,247 737,423 739,523 3,147 Funds Held in Escrow 9,072 86,233 85,372 9,933
Total Liabilities 14,712 831,639 832,081 14,270
Departmental Custodial Accounts
Assets
Cash on Deposit and on Hand 130,990 156,285 150,960 136,315 Investments 12,254 6,168 9,642 8,780 Due from Other Funds 811 - 44 767
Total Assets 144,055 162,453 160,646 145,862
Liabilities
Funds Held in Escrow 144,055 162,453 160,646 145,862
Totals - Agency Funds
Assets
Cash on Deposit and on Hand 130,990 156,285 150,960 136,315 Equity in Treasurer's Account 21,912 1,207,105 1,180,715 48,302 Investments 12,254 6,168 9,642 8,780 Due from Other Funds 811 - 44 767
Total Assets 165,967 1,369,558 1,341,361 194,164
Liabilities
Vouchers Payable 537 9,319 8,629 1,227 Payroll Taxes Payable 5,247 737,423 739,523 3,147 Funds Held in Escrow 160,183 632,134 602,527 189,790
Total Liabilities 165,967 1,378,876 1,350,679 194,164
Schedule VI
Amounts in thousands of USD
137
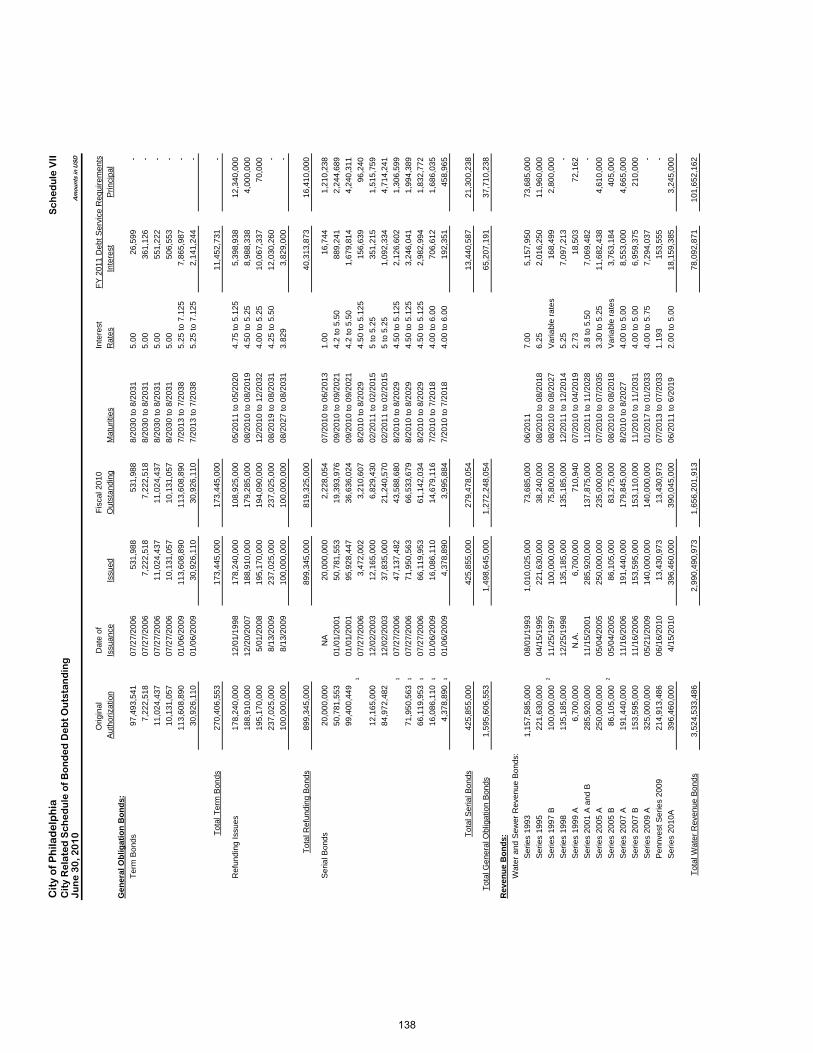
Cit
y o
f P
hila
de
lph
iaC
ity
Re
late
d S
ch
ed
ule
of
Bo
nd
ed
De
bt
Ou
tsta
nd
ing
Jun
e 3
0, 2
01
0
Orig
inal
D
ate
ofF
isca
l 201
0In
tere
st
FY
201
1 D
ebt S
ervi
ce R
equi
rem
ents
Aut
horiz
atio
nIs
suan
ceIs
sued
Out
stan
ding
Mat
uriti
esR
ates
Inte
rest
Prin
cipa
lG
ener
al O
blig
atio
n B
onds
:T
erm
Bon
ds97
,493
,541
07/2
7/20
0653
1,98
8
531,
988
8/
2030
to 8
/203
15.
0026
,599
-
7,22
2,51
8
07
/27/
2006
7,22
2,51
8
7,
222,
518
8/20
30 to
8/2
031
5.00
361,
126
-
11,0
24,4
37
07
/27/
2006
11,0
24,4
37
11
,024
,437
8/20
30 to
8/2
031
5.00
551,
222
-
10,1
31,0
57
07
/27/
2006
10,1
31,0
57
10
,131
,057
8/20
30 to
8/2
031
5.00
506,
553
-
113,
608,
890
01
/06/
2009
113,
608,
890
11
3,60
8,89
0
7/20
13 to
7/2
038
5.25
to 7
.125
7,86
5,98
7
-
30,9
26,1
10
01
/06/
2009
30,9
26,1
10
30
,926
,110
7/20
13 to
7/2
038
5.25
to 7
.125
2,14
1,24
4
-
Tot
al T
erm
Bon
ds27
0,40
6,55
3
173,
445,
000
17
3,44
5,00
0
11,4
52,7
31
-
Ref
undi
ng Is
sues
178,
240,
000
12
/01/
1998
178,
240,
000
10
8,92
5,00
0
05/2
011
to 0
5/20
204.
75 to
5.1
255,
398,
938
12,3
40,0
00
188,
910,
000
12
/20/
2007
188,
910,
000
17
9,28
5,00
0
08/2
010
to 0
8/20
194.
50 to
5.2
58,
988,
338
4,00
0,00
0
195,
170,
000
5/
01/2
008
195,
170,
000
19
4,09
0,00
0
12/2
010
to 1
2/20
324.
00 to
5.2
510
,067
,337
70
,000
237,
025,
000
8/
13/2
009
237,
025,
000
23
7,02
5,00
0
08/2
019
to 0
8/20
314.
25 to
5.5
012
,030
,260
-
100,
000,
000
8/
13/2
009
100,
000,
000
10
0,00
0,00
0
08/2
027
to 0
8/20
313.
829
3,82
9,00
0
-
Tot
al R
efun
ding
Bon
ds89
9,34
5,00
0
899,
345,
000
81
9,32
5,00
0
40,3
13,8
73
16,4
10,0
00
Ser
ial B
onds
20,0
00,0
00
N
A20
,000
,000
2,22
8,05
4
07
/201
0 to
06/
2013
1.00
16,7
44
1,
210,
238
50,7
81,5
53
01
/01/
2001
50,7
81,5
53
19
,393
,976
09/2
010
to 0
9/20
214.
2 to
5.5
088
9,24
1
2,24
4,68
9
99,4
00,4
49
01
/01/
2001
95,9
28,4
47
36
,636
,024
09/2
010
to 0
9/20
214.
2 to
5.5
01,
679,
814
4,24
0,31
1
107
/27/
2006
3,47
2,00
2
3,
210,
607
8/20
10 to
8/2
029
4.50
to 5
.125
156,
639
96
,240
12,1
65,0
00
12
/02/
2003
12,1
65,0
00
6,
829,
430
02/2
011
to 0
2/20
155
to 5
.25
351,
215
1,
515,
759
84,9
72,4
82
12
/02/
2003
37,8
35,0
00
21
,240
,570
02/2
011
to 0
2/20
155
to 5
.25
1,09
2,33
4
4,
714,
241
107
/27/
2006
47,1
37,4
82
43
,588
,680
8/20
10 to
8/2
029
4.50
to 5
.125
2,12
6,60
2
1,
306,
599
71,9
50,5
63
1
07/2
7/20
0671
,950
,563
66,5
33,6
79
8/
2010
to 8
/202
94.
50 to
5.1
253,
246,
041
1,99
4,38
9
66,1
19,9
53
1
07/2
7/20
0666
,119
,953
61,1
42,0
34
8/
2010
to 8
/202
94.
50 to
5.1
252,
982,
994
1,83
2,77
2
16,0
86,1
10
1
01/0
6/20
0916
,086
,110
14,6
79,1
16
7/
2010
to 7
/201
84.
00 to
6.0
070
6,61
2
1,68
6,03
5
4,37
8,89
0
1
01/0
6/20
094,
378,
890
3,99
5,88
4
7/
2010
to 7
/201
84.
00 to
6.0
019
2,35
1
458,
965
Tot
al S
eria
l Bon
ds42
5,85
5,00
0
425,
855,
000
27
9,47
8,05
4
13,4
40,5
87
21,3
00,2
38
Tot
al G
ener
al O
blig
atio
n B
onds
1,59
5,60
6,55
3
1,
498,
645,
000
1,27
2,24
8,05
4
65
,207
,191
37
,710
,238
Rev
enue
Bon
ds:
Wat
er a
nd S
ewer
Rev
enue
Bon
ds:
Ser
ies
1993
1,15
7,58
5,00
0
08
/01/
1993
1,01
0,02
5,00
0
73
,685
,000
06/2
011
7.00
5,15
7,95
0
73
,685
,000
Ser
ies
1995
221,
630,
000
04
/15/
1995
221,
630,
000
38
,240
,000
08/2
010
to 0
8/20
186.
252,
016,
250
11,9
60,0
00
Ser
ies
1997
B10
0,00
0,00
0
211
/25/
1997
100,
000,
000
75
,800
,000
08/2
010
to 0
8/20
27V
aria
ble
rate
s16
8,49
9
2,80
0,00
0
Ser
ies
1998
135,
185,
000
12
/25/
1998
135,
185,
000
13
5,18
5,00
0
12/2
011
to 1
2/20
145.
257,
097,
213
-
Ser
ies
1999
A6,
700,
000
N.A
.6,
700,
000
710,
940
07
/201
0 to
04/
2019
2.73
18,5
03
72
,162
Ser
ies
2001
A a
nd B
285,
920,
000
11
/15/
2001
285,
920,
000
13
7,87
5,00
0
11/2
011
to 1
1/20
283.
8 to
5.5
07,
069,
482
-
Ser
ies
2005
A25
0,00
0,00
0
05/0
4/20
0525
0,00
0,00
0
235,
000,
000
07
/201
0 to
07/
2035
3.30
to 5
.25
11,6
82,4
38
4,61
0,00
0
Ser
ies
2005
B86
,105
,000
205
/04/
2005
86,1
05,0
00
83
,275
,000
08/2
010
to 0
8/20
18V
aria
ble
rate
s3,
763,
184
405,
000
Ser
ies
2007
A19
1,44
0,00
0
11/1
6/20
0619
1,44
0,00
0
179,
845,
000
8/
2010
to 8
/202
74.
00 to
5.0
08,
553,
000
4,66
5,00
0
Ser
ies
2007
B15
3,59
5,00
0
11/1
6/20
0615
3,59
5,00
0
153,
110,
000
11
/201
0 to
11/
2031
4.00
to 5
.00
6,95
9,37
5
21
0,00
0
Ser
ies
2009
A32
5,00
0,00
0
05/2
1/20
0914
0,00
0,00
0
140,
000,
000
01
/201
7 to
01/
2033
4.00
to 5
.75
7,29
4,03
7
-
Pen
nves
t Ser
ies
2009
214,
913,
486
06
/16/
2010
13,4
30,9
73
13
,430
,973
07/2
013
to 0
7/20
331.
193
153,
555
-
Ser
ies
2010
A39
6,46
0,00
0
4/15
/201
039
6,46
0,00
0
390,
045,
000
06
/201
1 to
6/2
019
2.00
to 5
.00
18,1
59,3
85
3,24
5,00
0
Tot
al W
ater
Rev
enue
Bon
ds3,
524,
533,
486
2,99
0,49
0,97
3
1,
656,
201,
913
78,0
92,8
71
101,
652,
162
Sc
he
du
le V
II
Am
ount
s in
US
D
138
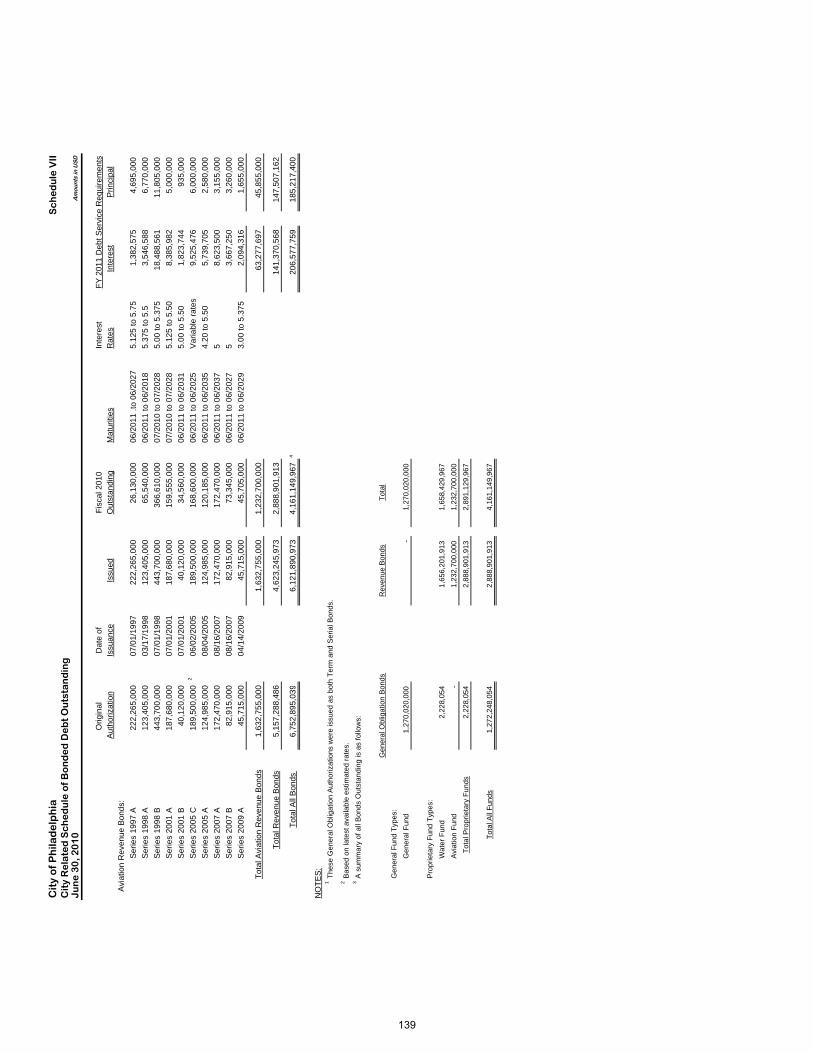
Cit
y o
f P
hila
de
lph
iaC
ity
Re
late
d S
ch
ed
ule
of
Bo
nd
ed
De
bt
Ou
tsta
nd
ing
Jun
e 3
0, 2
01
0
Orig
inal
D
ate
ofF
isca
l 201
0In
tere
st
FY
201
1 D
ebt S
ervi
ce R
equi
rem
ents
Aut
horiz
atio
nIs
suan
ceIs
sued
Out
stan
ding
Mat
uriti
esR
ates
Inte
rest
Prin
cipa
l
Sc
he
du
le V
II
Am
ount
s in
US
D
A
viat
ion
Rev
enue
Bon
ds:
Ser
ies
1997
A22
2,26
5,00
0
07/0
1/19
9722
2,26
5,00
0
26,1
30,0
00
06
/201
1 .to
06/
2027
5.12
5 to
5.7
51,
382,
575
4,69
5,00
0
Ser
ies
1998
A12
3,40
5,00
0
03/1
7/19
9812
3,40
5,00
0
65,5
40,0
00
06
/201
1 to
06/
2018
5.37
5 to
5.5
3,54
6,58
8
6,
770,
000
Ser
ies
1998
B44
3,70
0,00
0
07/0
1/19
9844
3,70
0,00
0
366,
610,
000
07
/201
0 to
07/
2028
5.00
to 5
.375
18,4
88,5
61
11,8
05,0
00
Ser
ies
2001
A18
7,68
0,00
0
07/0
1/20
0118
7,68
0,00
0
159,
555,
000
07
/201
0 to
07/
2028
5.12
5 to
5.5
08,
385,
982
5,00
0,00
0
Ser
ies
2001
B40
,120
,000
07/0
1/20
0140
,120
,000
34,5
60,0
00
06
/201
1 to
06/
2031
5.00
to 5
.50
1,82
3,74
4
93
5,00
0
Ser
ies
2005
C18
9,50
0,00
0
206
/02/
2005
189,
500,
000
16
8,60
0,00
0
06/2
011
to 0
6/20
25V
aria
ble
rate
s9,
525,
476
6,00
0,00
0
Ser
ies
2005
A12
4,98
5,00
0
08/0
4/20
0512
4,98
5,00
0
120,
185,
000
06
/201
1 to
06/
2035
4.20
to 5
.50
5,73
9,70
5
2,
580,
000
Ser
ies
2007
A17
2,47
0,00
0
08/1
6/20
0717
2,47
0,00
0
172,
470,
000
06
/201
1 to
06/
2037
58,
623,
500
3,15
5,00
0
Ser
ies
2007
B82
,915
,000
08/1
6/20
0782
,915
,000
73,3
45,0
00
06
/201
1 to
06/
2027
53,
667,
250
3,26
0,00
0
Ser
ies
2009
A45
,715
,000
04/1
4/20
0945
,715
,000
45,7
05,0
00
06
/201
1 to
06/
2029
3.00
to 5
.375
2,09
4,31
6
1,
655,
000
Tot
al A
viat
ion
Rev
enue
Bon
ds1,
632,
755,
000
1,63
2,75
5,00
0
1,
232,
700,
000
63,2
77,6
97
45,8
55,0
00
Tot
al R
even
ue B
onds
5,15
7,28
8,48
6
4,
623,
245,
973
2,88
8,90
1,91
3
14
1,37
0,56
8
147,
507,
162
Tot
al A
ll B
onds
6,
752,
895,
039
6,12
1,89
0,97
3
4,16
1,14
9,96
7
420
6,57
7,75
9
18
5,21
7,40
0
NO
TE
S:
1T
hese
Gen
eral
Obl
igat
ion
Aut
horiz
atio
ns w
ere
issu
ed a
s bo
th T
erm
and
Ser
ial B
onds
.
2B
ased
on
late
st a
vaila
ble
estim
ated
rat
es.
3A
sum
mar
y of
all
Bon
ds O
utst
andi
ng is
as
follo
ws:
Gen
eral
Obl
igat
ion
Bon
dsR
even
ue B
onds
Tot
al
Gen
eral
Fun
d T
ypes
:
Gen
eral
Fun
d1,
270,
020,
000
-
1,27
0,02
0,00
0
Pro
prie
tary
Fun
d T
ypes
:
Wat
er F
und
2,22
8,05
4
1,65
6,20
1,91
3
1,65
8,42
9,96
7
Avi
atio
n F
und
-
1,
232,
700,
000
1,
232,
700,
000
Tot
al P
ropr
ieta
ry F
unds
2,22
8,05
4
2,88
8,90
1,91
3
2,89
1,12
9,96
7
Tot
al A
ll F
unds
1,27
2,24
8,05
4
2,88
8,90
1,91
3
4,16
1,14
9,96
7
139
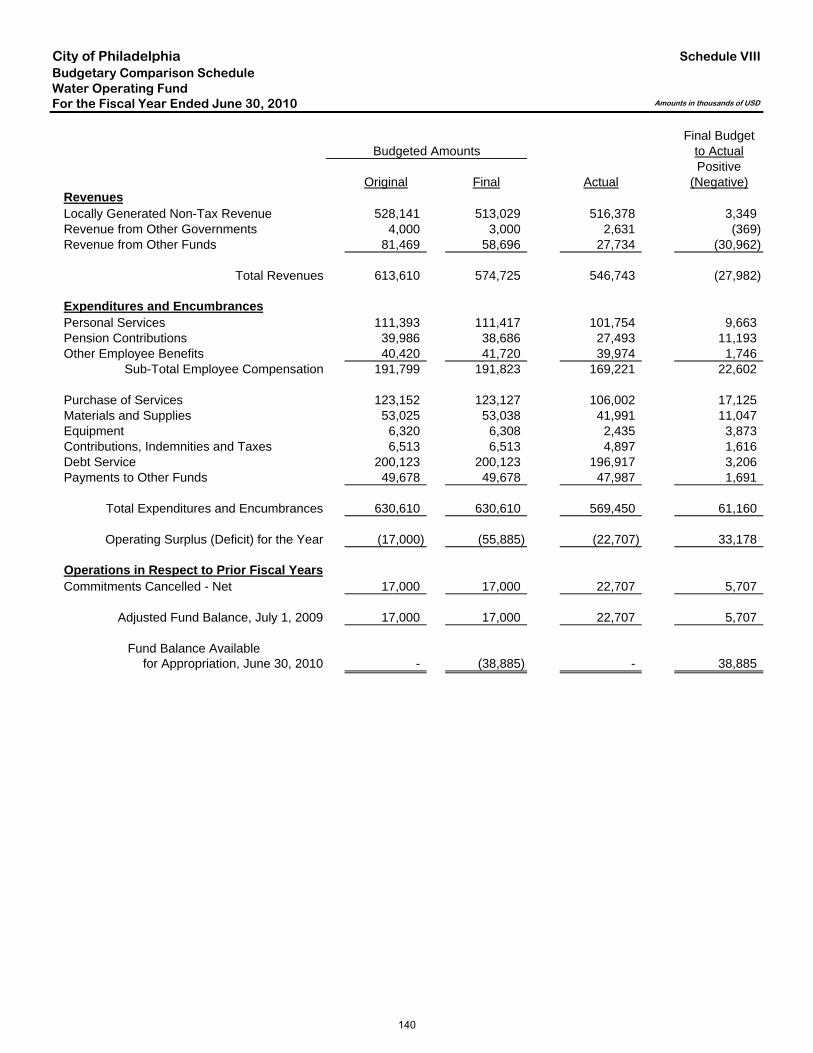
City of PhiladelphiaBudgetary Comparison ScheduleWater Operating FundFor the Fiscal Year Ended June 30, 2010
Final BudgetBudgeted Amounts to Actual
PositiveOriginal Final Actual (Negative)
RevenuesLocally Generated Non-Tax Revenue 528,141 513,029 516,378 3,349 Revenue from Other Governments 4,000 3,000 2,631 (369) Revenue from Other Funds 81,469 58,696 27,734 (30,962)
Total Revenues 613,610 574,725 546,743 (27,982)
Expenditures and EncumbrancesPersonal Services 111,393 111,417 101,754 9,663 Pension Contributions 39,986 38,686 27,493 11,193 Other Employee Benefits 40,420 41,720 39,974 1,746
Sub-Total Employee Compensation 191,799 191,823 169,221 22,602
Purchase of Services 123,152 123,127 106,002 17,125 Materials and Supplies 53,025 53,038 41,991 11,047 Equipment 6,320 6,308 2,435 3,873 Contributions, Indemnities and Taxes 6,513 6,513 4,897 1,616 Debt Service 200,123 200,123 196,917 3,206 Payments to Other Funds 49,678 49,678 47,987 1,691
Total Expenditures and Encumbrances 630,610 630,610 569,450 61,160
Operating Surplus (Deficit) for the Year (17,000) (55,885) (22,707) 33,178
Operations in Respect to Prior Fiscal YearsCommitments Cancelled - Net 17,000 17,000 22,707 5,707
Adjusted Fund Balance, July 1, 2009 17,000 17,000 22,707 5,707
Fund Balance Available for Appropriation, June 30, 2010 - (38,885) - 38,885
Amounts in thousands of USD
Schedule VIII
140
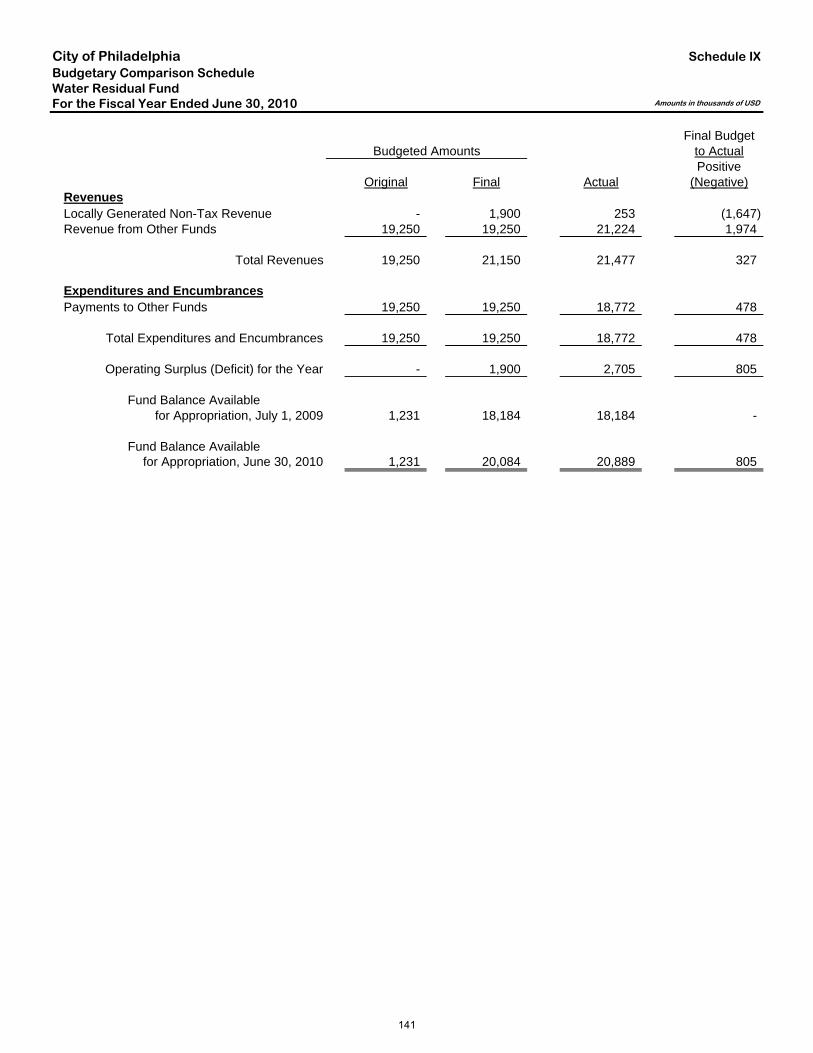
City of PhiladelphiaBudgetary Comparison ScheduleWater Residual FundFor the Fiscal Year Ended June 30, 2010
Final BudgetBudgeted Amounts to Actual
PositiveOriginal Final Actual (Negative)
RevenuesLocally Generated Non-Tax Revenue - 1,900 253 (1,647) Revenue from Other Funds 19,250 19,250 21,224 1,974
Total Revenues 19,250 21,150 21,477 327
Expenditures and EncumbrancesPayments to Other Funds 19,250 19,250 18,772 478
Total Expenditures and Encumbrances 19,250 19,250 18,772 478
Operating Surplus (Deficit) for the Year - 1,900 2,705 805
Fund Balance Availablefor Appropriation, July 1, 2009 1,231 18,184 18,184 -
Fund Balance Available for Appropriation, June 30, 2010 1,231 20,084 20,889 805
Schedule IX
Amounts in thousands of USD
141
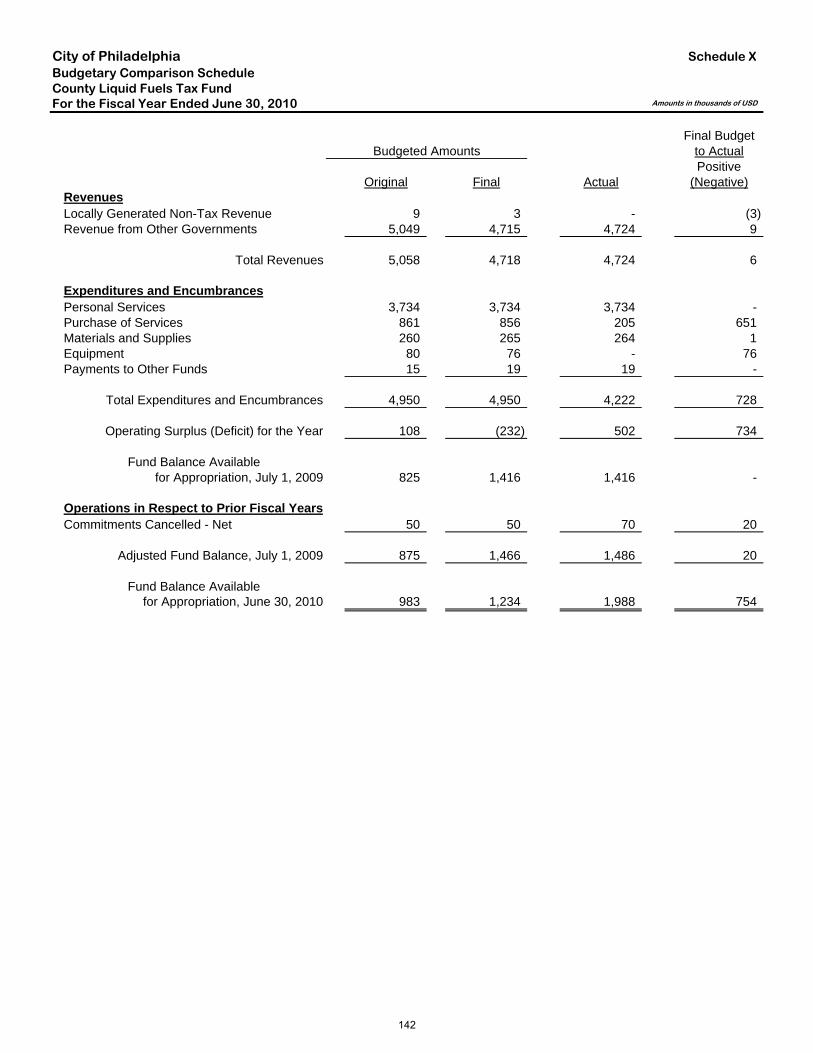
City of PhiladelphiaBudgetary Comparison ScheduleCounty Liquid Fuels Tax FundFor the Fiscal Year Ended June 30, 2010
Final BudgetBudgeted Amounts to Actual
PositiveOriginal Final Actual (Negative)
RevenuesLocally Generated Non-Tax Revenue 9 3 - (3) Revenue from Other Governments 5,049 4,715 4,724 9
Total Revenues 5,058 4,718 4,724 6
Expenditures and EncumbrancesPersonal Services 3,734 3,734 3,734 - Purchase of Services 861 856 205 651 Materials and Supplies 260 265 264 1 Equipment 80 76 - 76 Payments to Other Funds 15 19 19 -
Total Expenditures and Encumbrances 4,950 4,950 4,222 728
Operating Surplus (Deficit) for the Year 108 (232) 502 734
Fund Balance Availablefor Appropriation, July 1, 2009 825 1,416 1,416 -
Operations in Respect to Prior Fiscal YearsCommitments Cancelled - Net 50 50 70 20
Adjusted Fund Balance, July 1, 2009 875 1,466 1,486 20
Fund Balance Available for Appropriation, June 30, 2010 983 1,234 1,988 754
Schedule X
Amounts in thousands of USD
142
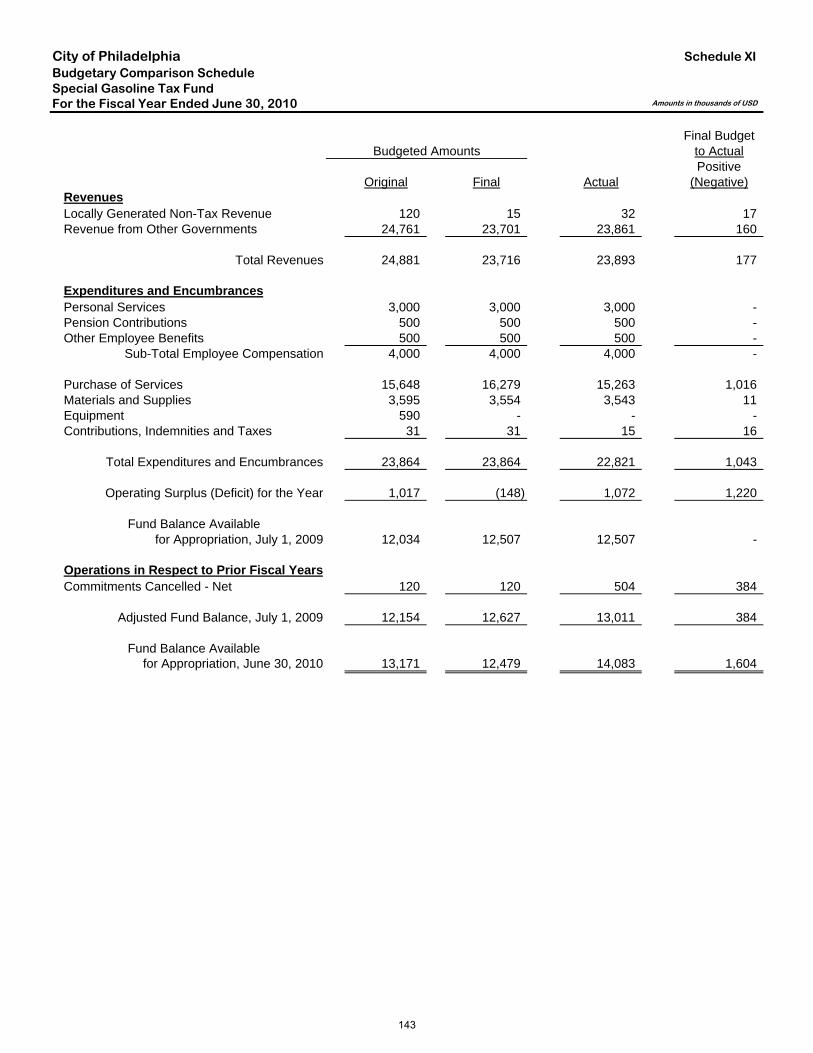
City of PhiladelphiaBudgetary Comparison ScheduleSpecial Gasoline Tax FundFor the Fiscal Year Ended June 30, 2010
Final BudgetBudgeted Amounts to Actual
PositiveOriginal Final Actual (Negative)
RevenuesLocally Generated Non-Tax Revenue 120 15 32 17 Revenue from Other Governments 24,761 23,701 23,861 160
Total Revenues 24,881 23,716 23,893 177
Expenditures and EncumbrancesPersonal Services 3,000 3,000 3,000 - Pension Contributions 500 500 500 - Other Employee Benefits 500 500 500 -
Sub-Total Employee Compensation 4,000 4,000 4,000 -
Purchase of Services 15,648 16,279 15,263 1,016 Materials and Supplies 3,595 3,554 3,543 11 Equipment 590 - - - Contributions, Indemnities and Taxes 31 31 15 16
Total Expenditures and Encumbrances 23,864 23,864 22,821 1,043
Operating Surplus (Deficit) for the Year 1,017 (148) 1,072 1,220
Fund Balance Availablefor Appropriation, July 1, 2009 12,034 12,507 12,507 -
Operations in Respect to Prior Fiscal YearsCommitments Cancelled - Net 120 120 504 384
Adjusted Fund Balance, July 1, 2009 12,154 12,627 13,011 384
Fund Balance Available for Appropriation, June 30, 2010 13,171 12,479 14,083 1,604
Schedule XI
Amounts in thousands of USD
143
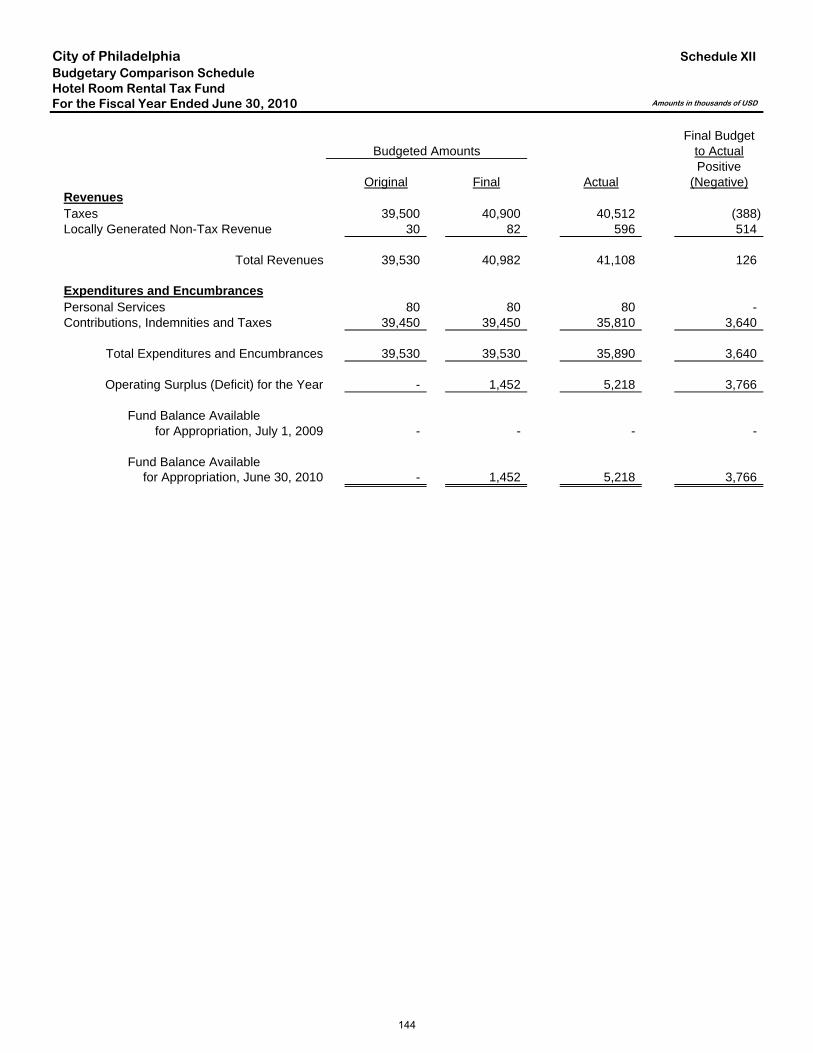
City of PhiladelphiaBudgetary Comparison ScheduleHotel Room Rental Tax FundFor the Fiscal Year Ended June 30, 2010
Final BudgetBudgeted Amounts to Actual
PositiveOriginal Final Actual (Negative)
RevenuesTaxes 39,500 40,900 40,512 (388) Locally Generated Non-Tax Revenue 30 82 596 514
Total Revenues 39,530 40,982 41,108 126
Expenditures and EncumbrancesPersonal Services 80 80 80 - Contributions, Indemnities and Taxes 39,450 39,450 35,810 3,640
Total Expenditures and Encumbrances 39,530 39,530 35,890 3,640
Operating Surplus (Deficit) for the Year - 1,452 5,218 3,766
Fund Balance Availablefor Appropriation, July 1, 2009 - - - -
Fund Balance Available for Appropriation, June 30, 2010 - 1,452 5,218 3,766
Schedule XII
Amounts in thousands of USD
144
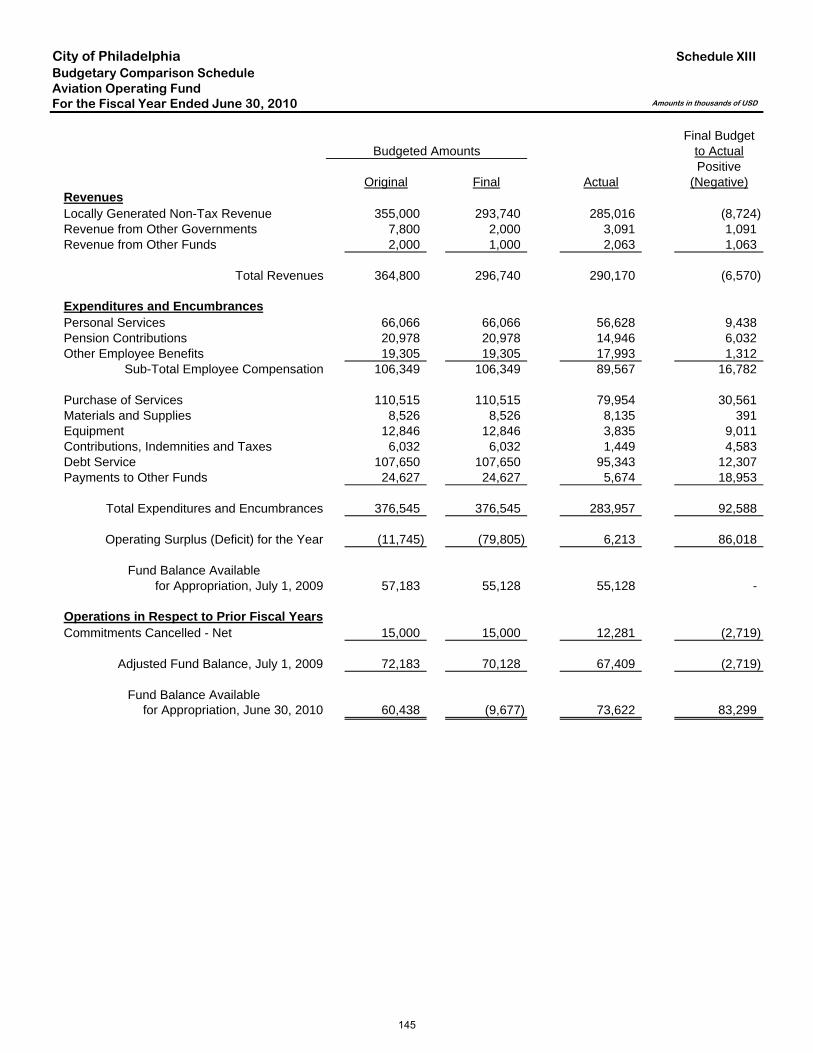
City of PhiladelphiaBudgetary Comparison ScheduleAviation Operating FundFor the Fiscal Year Ended June 30, 2010
Final BudgetBudgeted Amounts to Actual
PositiveOriginal Final Actual (Negative)
RevenuesLocally Generated Non-Tax Revenue 355,000 293,740 285,016 (8,724) Revenue from Other Governments 7,800 2,000 3,091 1,091 Revenue from Other Funds 2,000 1,000 2,063 1,063
Total Revenues 364,800 296,740 290,170 (6,570)
Expenditures and EncumbrancesPersonal Services 66,066 66,066 56,628 9,438 Pension Contributions 20,978 20,978 14,946 6,032 Other Employee Benefits 19,305 19,305 17,993 1,312
Sub-Total Employee Compensation 106,349 106,349 89,567 16,782
Purchase of Services 110,515 110,515 79,954 30,561 Materials and Supplies 8,526 8,526 8,135 391 Equipment 12,846 12,846 3,835 9,011 Contributions, Indemnities and Taxes 6,032 6,032 1,449 4,583 Debt Service 107,650 107,650 95,343 12,307 Payments to Other Funds 24,627 24,627 5,674 18,953
Total Expenditures and Encumbrances 376,545 376,545 283,957 92,588
Operating Surplus (Deficit) for the Year (11,745) (79,805) 6,213 86,018
Fund Balance Availablefor Appropriation, July 1, 2009 57,183 55,128 55,128 -
Operations in Respect to Prior Fiscal YearsCommitments Cancelled - Net 15,000 15,000 12,281 (2,719)
Adjusted Fund Balance, July 1, 2009 72,183 70,128 67,409 (2,719)
Fund Balance Available for Appropriation, June 30, 2010 60,438 (9,677) 73,622 83,299
Schedule XIII
Amounts in thousands of USD
145
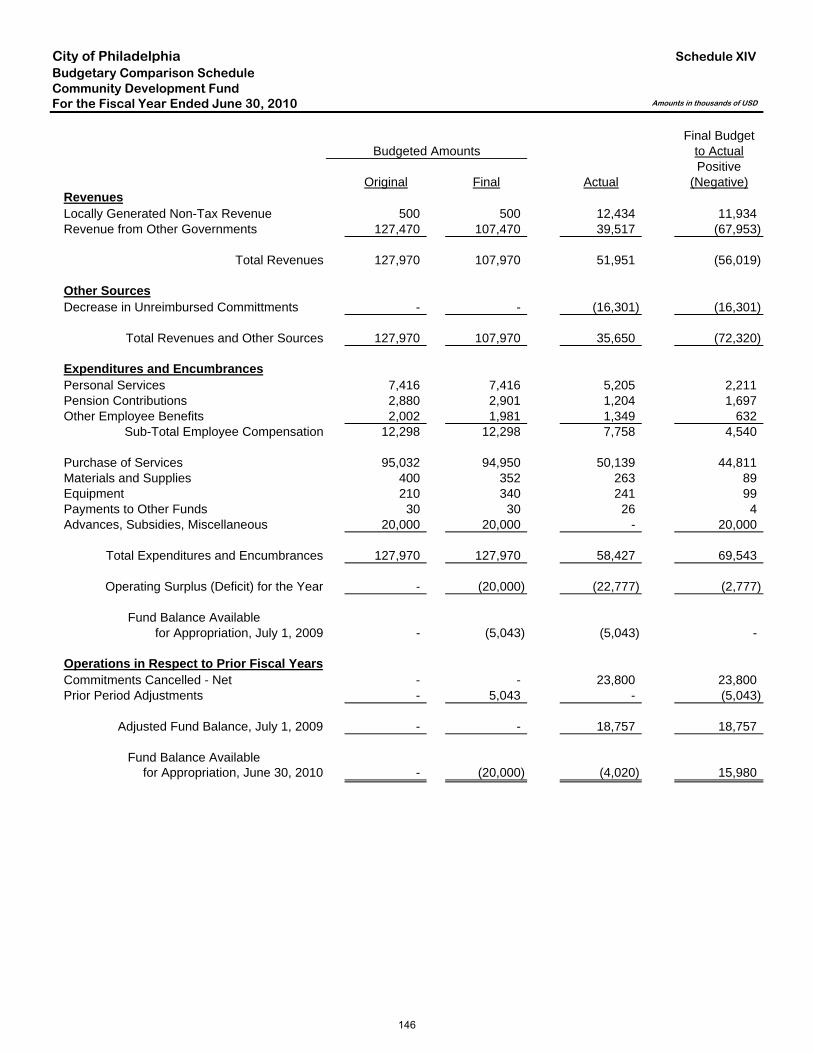
City of PhiladelphiaBudgetary Comparison ScheduleCommunity Development FundFor the Fiscal Year Ended June 30, 2010
Final BudgetBudgeted Amounts to Actual
PositiveOriginal Final Actual (Negative)
RevenuesLocally Generated Non-Tax Revenue 500 500 12,434 11,934 Revenue from Other Governments 127,470 107,470 39,517 (67,953)
Total Revenues 127,970 107,970 51,951 (56,019)
Other SourcesDecrease in Unreimbursed Committments - - (16,301) (16,301)
Total Revenues and Other Sources 127,970 107,970 35,650 (72,320)
Expenditures and EncumbrancesPersonal Services 7,416 7,416 5,205 2,211 Pension Contributions 2,880 2,901 1,204 1,697 Other Employee Benefits 2,002 1,981 1,349 632
Sub-Total Employee Compensation 12,298 12,298 7,758 4,540
Purchase of Services 95,032 94,950 50,139 44,811 Materials and Supplies 400 352 263 89 Equipment 210 340 241 99 Payments to Other Funds 30 30 26 4 Advances, Subsidies, Miscellaneous 20,000 20,000 - 20,000
Total Expenditures and Encumbrances 127,970 127,970 58,427 69,543
Operating Surplus (Deficit) for the Year - (20,000) (22,777) (2,777)
Fund Balance Availablefor Appropriation, July 1, 2009 - (5,043) (5,043) -
Operations in Respect to Prior Fiscal YearsCommitments Cancelled - Net - - 23,800 23,800 Prior Period Adjustments - 5,043 - (5,043)
Adjusted Fund Balance, July 1, 2009 - - 18,757 18,757
Fund Balance Available for Appropriation, June 30, 2010 - (20,000) (4,020) 15,980
Schedule XIV
Amounts in thousands of USD
146
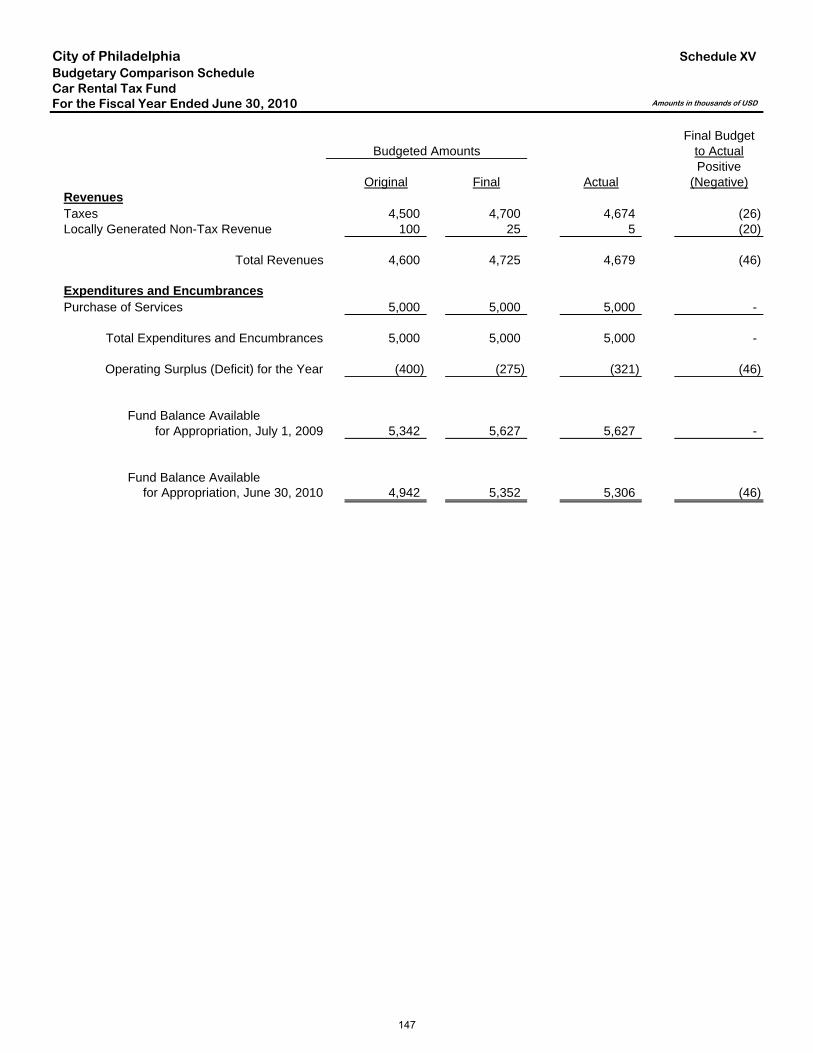
City of PhiladelphiaBudgetary Comparison ScheduleCar Rental Tax FundFor the Fiscal Year Ended June 30, 2010
Final BudgetBudgeted Amounts to Actual
PositiveOriginal Final Actual (Negative)
RevenuesTaxes 4,500 4,700 4,674 (26) Locally Generated Non-Tax Revenue 100 25 5 (20)
Total Revenues 4,600 4,725 4,679 (46)
Expenditures and EncumbrancesPurchase of Services 5,000 5,000 5,000 -
Total Expenditures and Encumbrances 5,000 5,000 5,000 -
Operating Surplus (Deficit) for the Year (400) (275) (321) (46)
Fund Balance Availablefor Appropriation, July 1, 2009 5,342 5,627 5,627 -
Fund Balance Available for Appropriation, June 30, 2010 4,942 5,352 5,306 (46)
Schedule XV
Amounts in thousands of USD
147
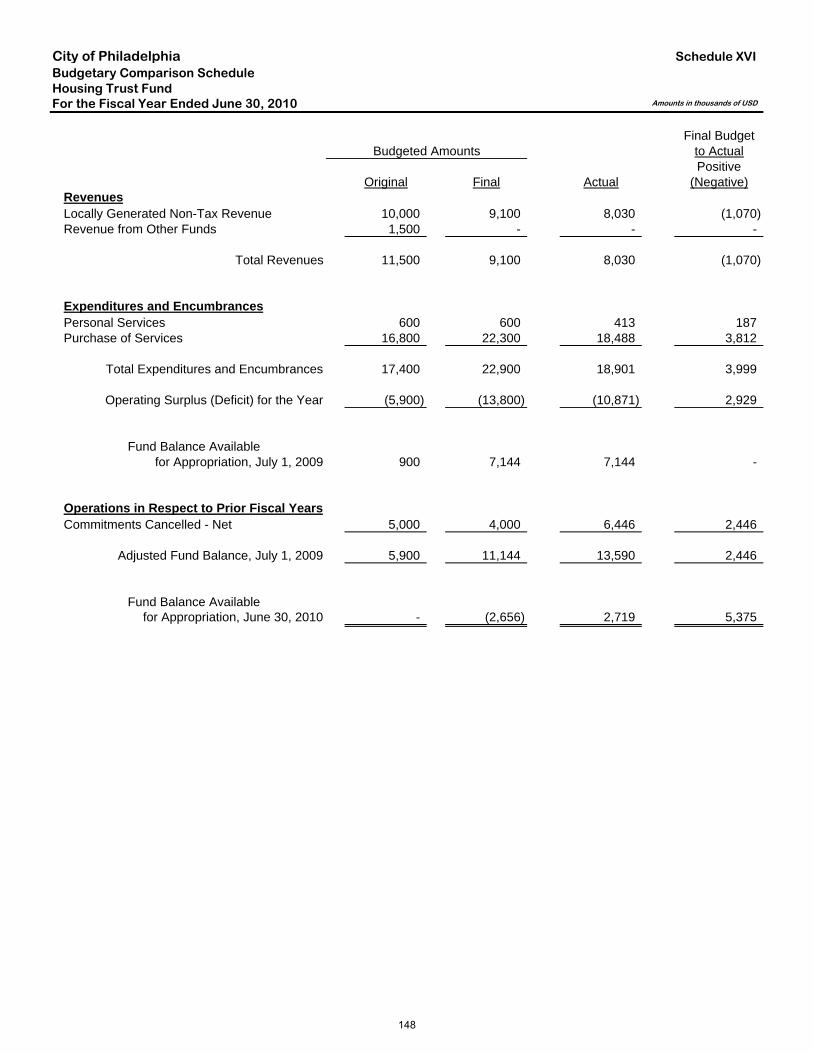
City of PhiladelphiaBudgetary Comparison ScheduleHousing Trust FundFor the Fiscal Year Ended June 30, 2010
Final BudgetBudgeted Amounts to Actual
PositiveOriginal Final Actual (Negative)
RevenuesLocally Generated Non-Tax Revenue 10,000 9,100 8,030 (1,070) Revenue from Other Funds 1,500 - - -
Total Revenues 11,500 9,100 8,030 (1,070)
Expenditures and EncumbrancesPersonal Services 600 600 413 187 Purchase of Services 16,800 22,300 18,488 3,812
Total Expenditures and Encumbrances 17,400 22,900 18,901 3,999
Operating Surplus (Deficit) for the Year (5,900) (13,800) (10,871) 2,929
Fund Balance Availablefor Appropriation, July 1, 2009 900 7,144 7,144 -
Operations in Respect to Prior Fiscal YearsCommitments Cancelled - Net 5,000 4,000 6,446 2,446
Adjusted Fund Balance, July 1, 2009 5,900 11,144 13,590 2,446
Fund Balance Available for Appropriation, June 30, 2010 - (2,656) 2,719 5,375
Schedule XVI
Amounts in thousands of USD
148
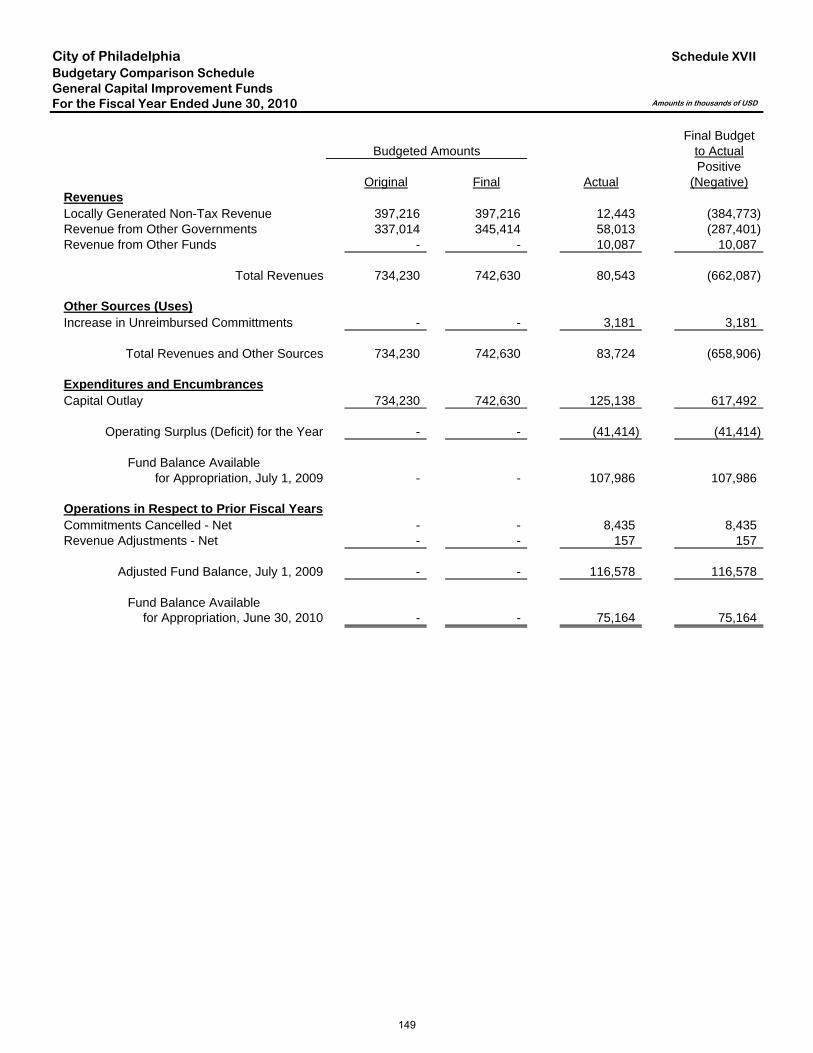
City of PhiladelphiaBudgetary Comparison ScheduleGeneral Capital Improvement FundsFor the Fiscal Year Ended June 30, 2010
Final BudgetBudgeted Amounts to Actual
PositiveOriginal Final Actual (Negative)
RevenuesLocally Generated Non-Tax Revenue 397,216 397,216 12,443 (384,773) Revenue from Other Governments 337,014 345,414 58,013 (287,401) Revenue from Other Funds - - 10,087 10,087
Total Revenues 734,230 742,630 80,543 (662,087)
Other Sources (Uses)Increase in Unreimbursed Committments - - 3,181 3,181
Total Revenues and Other Sources 734,230 742,630 83,724 (658,906)
Expenditures and EncumbrancesCapital Outlay 734,230 742,630 125,138 617,492
Operating Surplus (Deficit) for the Year - - (41,414) (41,414)
Fund Balance Availablefor Appropriation, July 1, 2009 - - 107,986 107,986
Operations in Respect to Prior Fiscal YearsCommitments Cancelled - Net - - 8,435 8,435 Revenue Adjustments - Net - - 157 157
Adjusted Fund Balance, July 1, 2009 - - 116,578 116,578
Fund Balance Available for Appropriation, June 30, 2010 - - 75,164 75,164
Schedule XVII
Amounts in thousands of USD
149
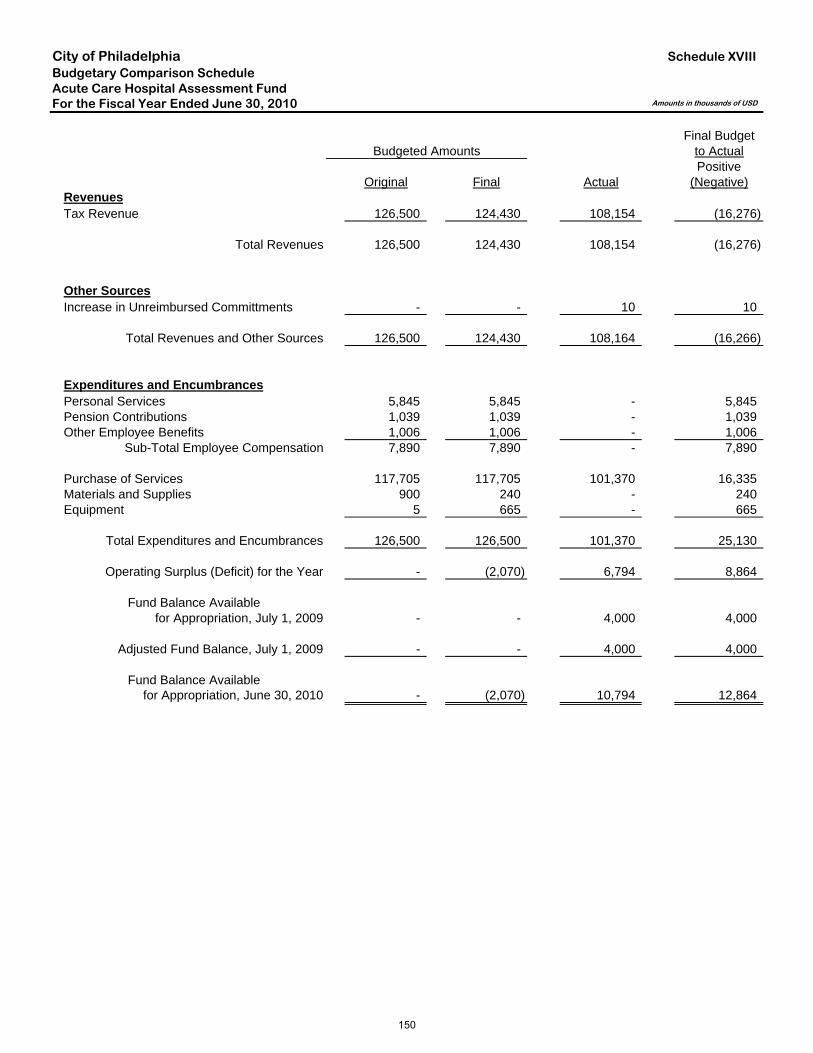
City of PhiladelphiaBudgetary Comparison ScheduleAcute Care Hospital Assessment FundFor the Fiscal Year Ended June 30, 2010
Final BudgetBudgeted Amounts to Actual
PositiveOriginal Final Actual (Negative)
RevenuesTax Revenue 126,500 124,430 108,154 (16,276)
Total Revenues 126,500 124,430 108,154 (16,276)
Other SourcesIncrease in Unreimbursed Committments - - 10 10
Total Revenues and Other Sources 126,500 124,430 108,164 (16,266)
Expenditures and EncumbrancesPersonal Services 5,845 5,845 - 5,845 Pension Contributions 1,039 1,039 - 1,039 Other Employee Benefits 1,006 1,006 - 1,006
Sub-Total Employee Compensation 7,890 7,890 - 7,890
Purchase of Services 117,705 117,705 101,370 16,335 Materials and Supplies 900 240 - 240 Equipment 5 665 - 665
Total Expenditures and Encumbrances 126,500 126,500 101,370 25,130
Operating Surplus (Deficit) for the Year - (2,070) 6,794 8,864
Fund Balance Availablefor Appropriation, July 1, 2009 - - 4,000 4,000
Adjusted Fund Balance, July 1, 2009 - - 4,000 4,000
Fund Balance Available for Appropriation, June 30, 2010 - (2,070) 10,794 12,864
Schedule XVIII
Amounts in thousands of USD
150
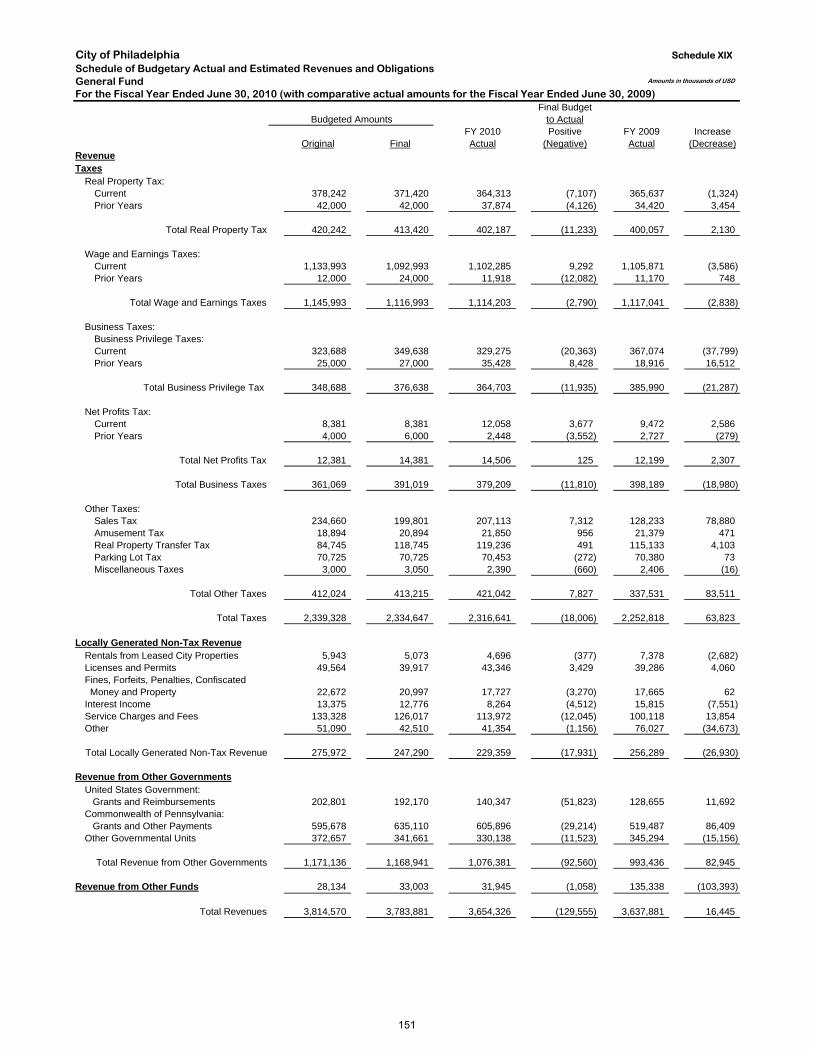
City of PhiladelphiaSchedule of Budgetary Actual and Estimated Revenues and ObligationsGeneral FundFor the Fiscal Year Ended June 30, 2010 (with comparative actual amounts for the Fiscal Year Ended June 30, 2009)
Final BudgetBudgeted Amounts to Actual
FY 2010 Positive FY 2009 IncreaseOriginal Final Actual (Negative) Actual (Decrease)
RevenueTaxes
Real Property Tax:Current 378,242 371,420 364,313 (7,107) 365,637 (1,324) Prior Years 42,000 42,000 37,874 (4,126) 34,420 3,454
Total Real Property Tax 420,242 413,420 402,187 (11,233) 400,057 2,130
Wage and Earnings Taxes:Current 1,133,993 1,092,993 1,102,285 9,292 1,105,871 (3,586) Prior Years 12,000 24,000 11,918 (12,082) 11,170 748
Total Wage and Earnings Taxes 1,145,993 1,116,993 1,114,203 (2,790) 1,117,041 (2,838)
Business Taxes:Business Privilege Taxes:Current 323,688 349,638 329,275 (20,363) 367,074 (37,799) Prior Years 25,000 27,000 35,428 8,428 18,916 16,512
Total Business Privilege Tax 348,688 376,638 364,703 (11,935) 385,990 (21,287)
Net Profits Tax:Current 8,381 8,381 12,058 3,677 9,472 2,586 Prior Years 4,000 6,000 2,448 (3,552) 2,727 (279)
Total Net Profits Tax 12,381 14,381 14,506 125 12,199 2,307
Total Business Taxes 361,069 391,019 379,209 (11,810) 398,189 (18,980)
Other Taxes:Sales Tax 234,660 199,801 207,113 7,312 128,233 78,880 Amusement Tax 18,894 20,894 21,850 956 21,379 471 Real Property Transfer Tax 84,745 118,745 119,236 491 115,133 4,103 Parking Lot Tax 70,725 70,725 70,453 (272) 70,380 73 Miscellaneous Taxes 3,000 3,050 2,390 (660) 2,406 (16)
Total Other Taxes 412,024 413,215 421,042 7,827 337,531 83,511
Total Taxes 2,339,328 2,334,647 2,316,641 (18,006) 2,252,818 63,823
Locally Generated Non-Tax RevenueRentals from Leased City Properties 5,943 5,073 4,696 (377) 7,378 (2,682) Licenses and Permits 49,564 39,917 43,346 3,429 39,286 4,060 Fines, Forfeits, Penalties, Confiscated Money and Property 22,672 20,997 17,727 (3,270) 17,665 62 Interest Income 13,375 12,776 8,264 (4,512) 15,815 (7,551) Service Charges and Fees 133,328 126,017 113,972 (12,045) 100,118 13,854 Other 51,090 42,510 41,354 (1,156) 76,027 (34,673)
Total Locally Generated Non-Tax Revenue 275,972 247,290 229,359 (17,931) 256,289 (26,930)
Revenue from Other GovernmentsUnited States Government: Grants and Reimbursements 202,801 192,170 140,347 (51,823) 128,655 11,692 Commonwealth of Pennsylvania: Grants and Other Payments 595,678 635,110 605,896 (29,214) 519,487 86,409 Other Governmental Units 372,657 341,661 330,138 (11,523) 345,294 (15,156)
Total Revenue from Other Governments 1,171,136 1,168,941 1,076,381 (92,560) 993,436 82,945
Revenue from Other Funds 28,134 33,003 31,945 (1,058) 135,338 (103,393)
Total Revenues 3,814,570 3,783,881 3,654,326 (129,555) 3,637,881 16,445
Schedule XIX
Amounts in thousands of USD
151
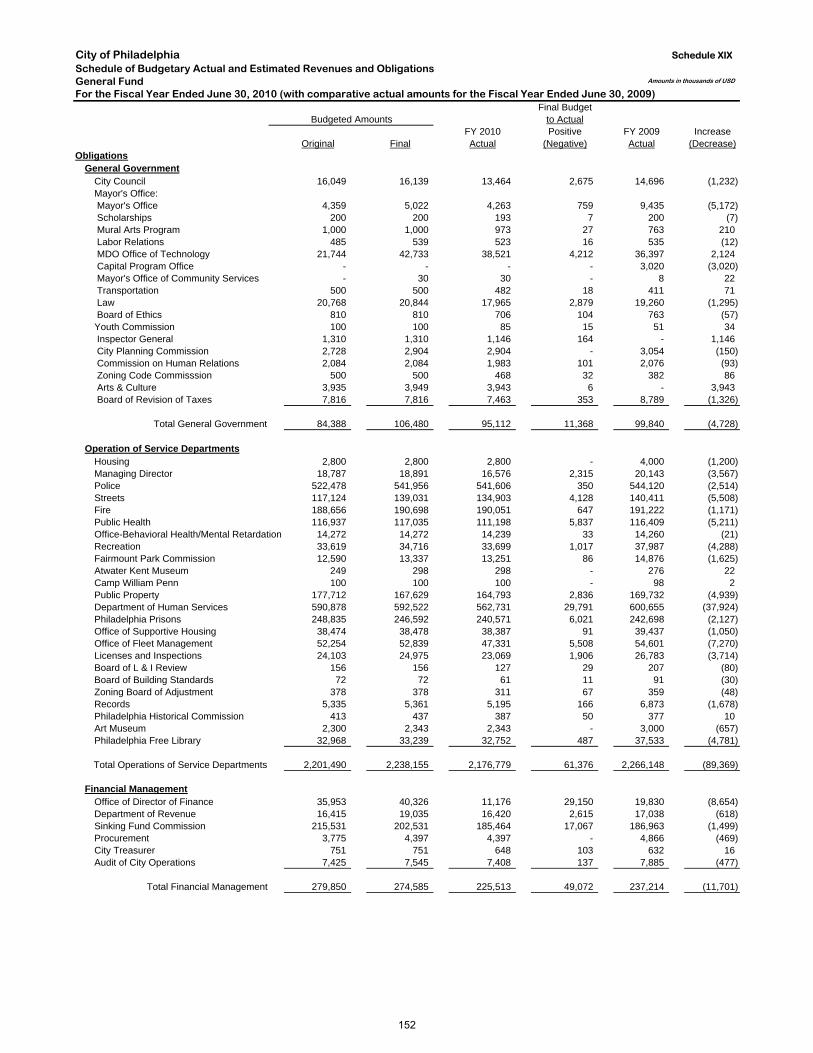
City of PhiladelphiaSchedule of Budgetary Actual and Estimated Revenues and ObligationsGeneral FundFor the Fiscal Year Ended June 30, 2010 (with comparative actual amounts for the Fiscal Year Ended June 30, 2009)
Final BudgetBudgeted Amounts to Actual
FY 2010 Positive FY 2009 IncreaseOriginal Final Actual (Negative) Actual (Decrease)
Schedule XIX
Amounts in thousands of USD
ObligationsGeneral Government
City Council 16,049 16,139 13,464 2,675 14,696 (1,232) Mayor's Office: Mayor's Office 4,359 5,022 4,263 759 9,435 (5,172) Scholarships 200 200 193 7 200 (7) Mural Arts Program 1,000 1,000 973 27 763 210 Labor Relations 485 539 523 16 535 (12) MDO Office of Technology 21,744 42,733 38,521 4,212 36,397 2,124 Capital Program Office - - - - 3,020 (3,020) Mayor's Office of Community Services - 30 30 - 8 22 Transportation 500 500 482 18 411 71 Law 20,768 20,844 17,965 2,879 19,260 (1,295) Board of Ethics 810 810 706 104 763 (57) Youth Commission 100 100 85 15 51 34 Inspector General 1,310 1,310 1,146 164 - 1,146 City Planning Commission 2,728 2,904 2,904 - 3,054 (150) Commission on Human Relations 2,084 2,084 1,983 101 2,076 (93) Zoning Code Commisssion 500 500 468 32 382 86 Arts & Culture 3,935 3,949 3,943 6 - 3,943 Board of Revision of Taxes 7,816 7,816 7,463 353 8,789 (1,326)
Total General Government 84,388 106,480 95,112 11,368 99,840 (4,728)
Operation of Service DepartmentsHousing 2,800 2,800 2,800 - 4,000 (1,200) Managing Director 18,787 18,891 16,576 2,315 20,143 (3,567) Police 522,478 541,956 541,606 350 544,120 (2,514) Streets 117,124 139,031 134,903 4,128 140,411 (5,508) Fire 188,656 190,698 190,051 647 191,222 (1,171) Public Health 116,937 117,035 111,198 5,837 116,409 (5,211) Office-Behavioral Health/Mental Retardation 14,272 14,272 14,239 33 14,260 (21) Recreation 33,619 34,716 33,699 1,017 37,987 (4,288) Fairmount Park Commission 12,590 13,337 13,251 86 14,876 (1,625) Atwater Kent Museum 249 298 298 - 276 22 Camp William Penn 100 100 100 - 98 2 Public Property 177,712 167,629 164,793 2,836 169,732 (4,939) Department of Human Services 590,878 592,522 562,731 29,791 600,655 (37,924) Philadelphia Prisons 248,835 246,592 240,571 6,021 242,698 (2,127) Office of Supportive Housing 38,474 38,478 38,387 91 39,437 (1,050) Office of Fleet Management 52,254 52,839 47,331 5,508 54,601 (7,270) Licenses and Inspections 24,103 24,975 23,069 1,906 26,783 (3,714) Board of L & I Review 156 156 127 29 207 (80) Board of Building Standards 72 72 61 11 91 (30) Zoning Board of Adjustment 378 378 311 67 359 (48) Records 5,335 5,361 5,195 166 6,873 (1,678) Philadelphia Historical Commission 413 437 387 50 377 10 Art Museum 2,300 2,343 2,343 - 3,000 (657) Philadelphia Free Library 32,968 33,239 32,752 487 37,533 (4,781)
Total Operations of Service Departments 2,201,490 2,238,155 2,176,779 61,376 2,266,148 (89,369)
Financial ManagementOffice of Director of Finance 35,953 40,326 11,176 29,150 19,830 (8,654) Department of Revenue 16,415 19,035 16,420 2,615 17,038 (618) Sinking Fund Commission 215,531 202,531 185,464 17,067 186,963 (1,499) Procurement 3,775 4,397 4,397 - 4,866 (469) City Treasurer 751 751 648 103 632 16 Audit of City Operations 7,425 7,545 7,408 137 7,885 (477)
Total Financial Management 279,850 274,585 225,513 49,072 237,214 (11,701)
152
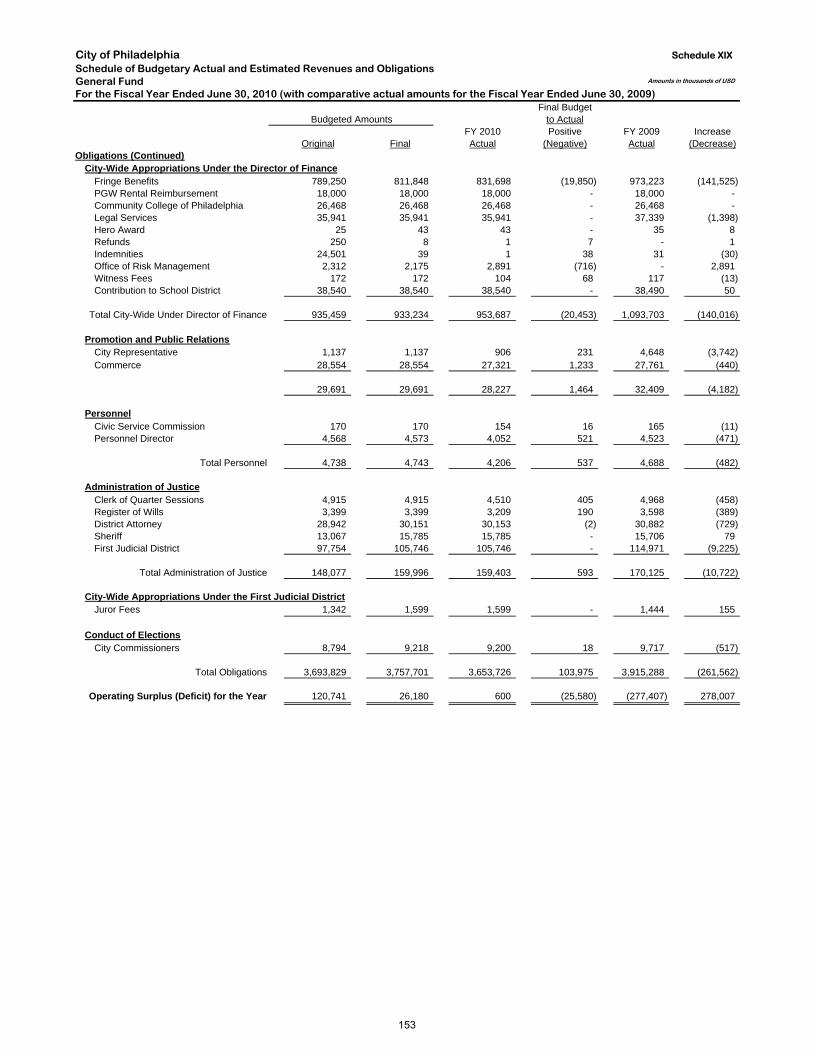
City of PhiladelphiaSchedule of Budgetary Actual and Estimated Revenues and ObligationsGeneral FundFor the Fiscal Year Ended June 30, 2010 (with comparative actual amounts for the Fiscal Year Ended June 30, 2009)
Final BudgetBudgeted Amounts to Actual
FY 2010 Positive FY 2009 IncreaseOriginal Final Actual (Negative) Actual (Decrease)
Schedule XIX
Amounts in thousands of USD
Obligations (Continued)City-Wide Appropriations Under the Director of Finance
Fringe Benefits 789,250 811,848 831,698 (19,850) 973,223 (141,525) PGW Rental Reimbursement 18,000 18,000 18,000 - 18,000 - Community College of Philadelphia 26,468 26,468 26,468 - 26,468 - Legal Services 35,941 35,941 35,941 - 37,339 (1,398) Hero Award 25 43 43 - 35 8 Refunds 250 8 1 7 - 1 Indemnities 24,501 39 1 38 31 (30) Office of Risk Management 2,312 2,175 2,891 (716) - 2,891 Witness Fees 172 172 104 68 117 (13) Contribution to School District 38,540 38,540 38,540 - 38,490 50
Total City-Wide Under Director of Finance 935,459 933,234 953,687 (20,453) 1,093,703 (140,016)
Promotion and Public RelationsCity Representative 1,137 1,137 906 231 4,648 (3,742) Commerce 28,554 28,554 27,321 1,233 27,761 (440)
29,691 29,691 28,227 1,464 32,409 (4,182)
PersonnelCivic Service Commission 170 170 154 16 165 (11) Personnel Director 4,568 4,573 4,052 521 4,523 (471)
Total Personnel 4,738 4,743 4,206 537 4,688 (482)
Administration of JusticeClerk of Quarter Sessions 4,915 4,915 4,510 405 4,968 (458) Register of Wills 3,399 3,399 3,209 190 3,598 (389) District Attorney 28,942 30,151 30,153 (2) 30,882 (729) Sheriff 13,067 15,785 15,785 - 15,706 79 First Judicial District 97,754 105,746 105,746 - 114,971 (9,225)
Total Administration of Justice 148,077 159,996 159,403 593 170,125 (10,722)
City-Wide Appropriations Under the First Judicial DistrictJuror Fees 1,342 1,599 1,599 - 1,444 155
Conduct of ElectionsCity Commissioners 8,794 9,218 9,200 18 9,717 (517)
Total Obligations 3,693,829 3,757,701 3,653,726 103,975 3,915,288 (261,562)
Operating Surplus (Deficit) for the Year 120,741 26,180 600 (25,580) (277,407) 278,007
153
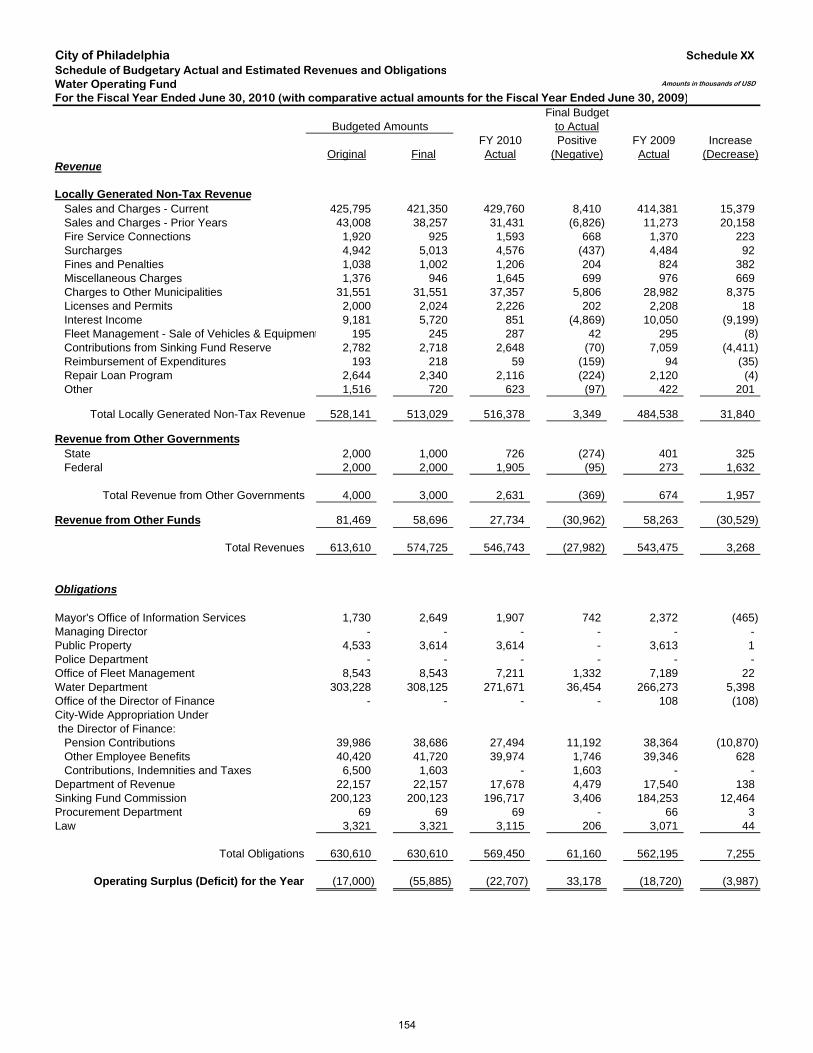
City of PhiladelphiaSchedule of Budgetary Actual and Estimated Revenues and ObligationsWater Operating FundFor the Fiscal Year Ended June 30, 2010 (with comparative actual amounts for the Fiscal Year Ended June 30, 2009)
Final BudgetBudgeted Amounts to Actual
FY 2010 Positive FY 2009 IncreaseOriginal Final Actual (Negative) Actual (Decrease)
Revenue
Locally Generated Non-Tax Revenue Sales and Charges - Current 425,795 421,350 429,760 8,410 414,381 15,379 Sales and Charges - Prior Years 43,008 38,257 31,431 (6,826) 11,273 20,158 Fire Service Connections 1,920 925 1,593 668 1,370 223 Surcharges 4,942 5,013 4,576 (437) 4,484 92 Fines and Penalties 1,038 1,002 1,206 204 824 382 Miscellaneous Charges 1,376 946 1,645 699 976 669 Charges to Other Municipalities 31,551 31,551 37,357 5,806 28,982 8,375 Licenses and Permits 2,000 2,024 2,226 202 2,208 18 Interest Income 9,181 5,720 851 (4,869) 10,050 (9,199) Fleet Management - Sale of Vehicles & Equipment 195 245 287 42 295 (8) Contributions from Sinking Fund Reserve 2,782 2,718 2,648 (70) 7,059 (4,411) Reimbursement of Expenditures 193 218 59 (159) 94 (35) Repair Loan Program 2,644 2,340 2,116 (224) 2,120 (4) Other 1,516 720 623 (97) 422 201
Total Locally Generated Non-Tax Revenue 528,141 513,029 516,378 3,349 484,538 31,840
Revenue from Other Governments State 2,000 1,000 726 (274) 401 325 Federal 2,000 2,000 1,905 (95) 273 1,632
Total Revenue from Other Governments 4,000 3,000 2,631 (369) 674 1,957
Revenue from Other Funds 81,469 58,696 27,734 (30,962) 58,263 (30,529)
Total Revenues 613,610 574,725 546,743 (27,982) 543,475 3,268
Obligations
Mayor's Office of Information Services 1,730 2,649 1,907 742 2,372 (465) Managing Director - - - - - - Public Property 4,533 3,614 3,614 - 3,613 1 Police Department - - - - - - Office of Fleet Management 8,543 8,543 7,211 1,332 7,189 22 Water Department 303,228 308,125 271,671 36,454 266,273 5,398 Office of the Director of Finance - - - - 108 (108) City-Wide Appropriation Under the Director of Finance: Pension Contributions 39,986 38,686 27,494 11,192 38,364 (10,870) Other Employee Benefits 40,420 41,720 39,974 1,746 39,346 628 Contributions, Indemnities and Taxes 6,500 1,603 - 1,603 - - Department of Revenue 22,157 22,157 17,678 4,479 17,540 138 Sinking Fund Commission 200,123 200,123 196,717 3,406 184,253 12,464 Procurement Department 69 69 69 - 66 3 Law 3,321 3,321 3,115 206 3,071 44
Total Obligations 630,610 630,610 569,450 61,160 562,195 7,255
Operating Surplus (Deficit) for the Year (17,000) (55,885) (22,707) 33,178 (18,720) (3,987)
Schedule XX
Amounts in thousands of USD
154
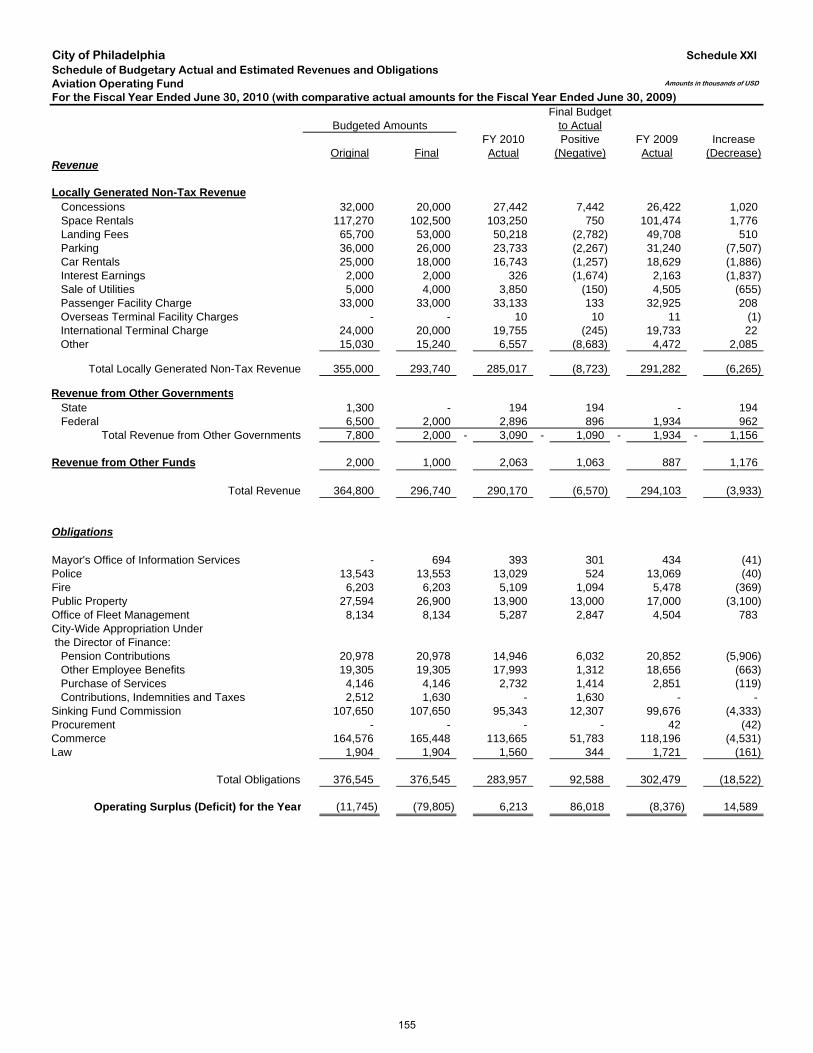
City of PhiladelphiaSchedule of Budgetary Actual and Estimated Revenues and ObligationsAviation Operating FundFor the Fiscal Year Ended June 30, 2010 (with comparative actual amounts for the Fiscal Year Ended June 30, 2009)
Final BudgetBudgeted Amounts to Actual
FY 2010 Positive FY 2009 IncreaseOriginal Final Actual (Negative) Actual (Decrease)
Revenue
Locally Generated Non-Tax Revenue Concessions 32,000 20,000 27,442 7,442 26,422 1,020 Space Rentals 117,270 102,500 103,250 750 101,474 1,776 Landing Fees 65,700 53,000 50,218 (2,782) 49,708 510 Parking 36,000 26,000 23,733 (2,267) 31,240 (7,507) Car Rentals 25,000 18,000 16,743 (1,257) 18,629 (1,886) Interest Earnings 2,000 2,000 326 (1,674) 2,163 (1,837) Sale of Utilities 5,000 4,000 3,850 (150) 4,505 (655) Passenger Facility Charge 33,000 33,000 33,133 133 32,925 208 Overseas Terminal Facility Charges - - 10 10 11 (1) International Terminal Charge 24,000 20,000 19,755 (245) 19,733 22 Other 15,030 15,240 6,557 (8,683) 4,472 2,085
Total Locally Generated Non-Tax Revenue 355,000 293,740 285,017 (8,723) 291,282 (6,265)
Revenue from Other Governments State 1,300 - 194 194 - 194 Federal 6,500 2,000 2,896 896 1,934 962
Total Revenue from Other Governments 7,800 2,000 - 3,090 - 1,090 - 1,934 - 1,156
Revenue from Other Funds 2,000 1,000 2,063 1,063 887 1,176
Total Revenue 364,800 296,740 290,170 (6,570) 294,103 (3,933)
Obligations
Mayor's Office of Information Services - 694 393 301 434 (41) Police 13,543 13,553 13,029 524 13,069 (40) Fire 6,203 6,203 5,109 1,094 5,478 (369) Public Property 27,594 26,900 13,900 13,000 17,000 (3,100) Office of Fleet Management 8,134 8,134 5,287 2,847 4,504 783 City-Wide Appropriation Under the Director of Finance: Pension Contributions 20,978 20,978 14,946 6,032 20,852 (5,906) Other Employee Benefits 19,305 19,305 17,993 1,312 18,656 (663) Purchase of Services 4,146 4,146 2,732 1,414 2,851 (119) Contributions, Indemnities and Taxes 2,512 1,630 - 1,630 - - Sinking Fund Commission 107,650 107,650 95,343 12,307 99,676 (4,333) Procurement - - - - 42 (42) Commerce 164,576 165,448 113,665 51,783 118,196 (4,531) Law 1,904 1,904 1,560 344 1,721 (161)
Total Obligations 376,545 376,545 283,957 92,588 302,479 (18,522)
Operating Surplus (Deficit) for the Year (11,745) (79,805) 6,213 86,018 (8,376) 14,589
Schedule XXI
Amounts in thousands of USD
155

156
City of Philadelphia P E N N S Y L V A N I A
Statistical Section
Financial Trends
These tables contain trend information to help the reader understand how the City’s financial performance and well-being have changed over time.
Table 1 Net Assets by Component ....................................................................... 159 Table 2 Changes in Net Assets ............................................................................ 160 Table 3 Fund Balances-Governmental Funds...................................................... 162 Table 4 Changes in Fund Balances-Governmental Funds................................... 163 Table 5 Comparative Schedule of Operations-Municipal Pension Fund.............. 164
Revenue Capacity These tables contain information to help the reader assess the City’s most significant local revenue source, the wage and earnings tax. Property tax information is also presented.
Table 6 Wage and Earnings Tax Taxable Income ............................................... 165 Table 7 Direct and Overlapping Tax Rates .......................................................... 166 Table 8 Principal Wage and Earnings Tax Remitters........................................... 168 Table 9 Assessed Value and Estimated Value of Taxable Property .................... 169 Table 10 Principal Property Tax Payers ................................................................. 170 Table 11 Real Property Taxes Levied and Collected ............................................. 171
Debt Capacity These tables present information to help the reader assess the affordability of the City’s current levels of outstanding debt and the City’s ability to issue additional debt.
Table 12 Ratios of Outstanding Debt by Type........................................................ 172 Table 13 Ratios of General Bonded Debt Outstanding .......................................... 173 Table 14 Direct and Overlapping Governmental Activities Debt ............................ 174 Table 15 Legal Debt Margin Information ................................................................ 175 Table 16 Pledged Revenue Coverage.................................................................... 176
Demographic & Economic Information These tables offer demographic and economic indicators to help the reader understand the environment within which the City’s financial activities take place.
Table 17 Demographic and Economic Statistics .................................................... 177 Table 18 Principal Employers ................................................................................. 178
Operating Information These tables contain service and infrastructure information data to help the reader understand how the information in the City’s financial report relates to the services the city provides and the activities it performs.
Table 19 Full Time Employees by Function............................................................ 179 Table 20 Operating Indicators by Function............................................................. 180 Table 21 Capital Assets Statistics by Function....................................................... 181
The City of Philadelphia implemented GASB Statement #34 in FY2002. Tables presenting government-wide information include information beginning in that year.
157

158
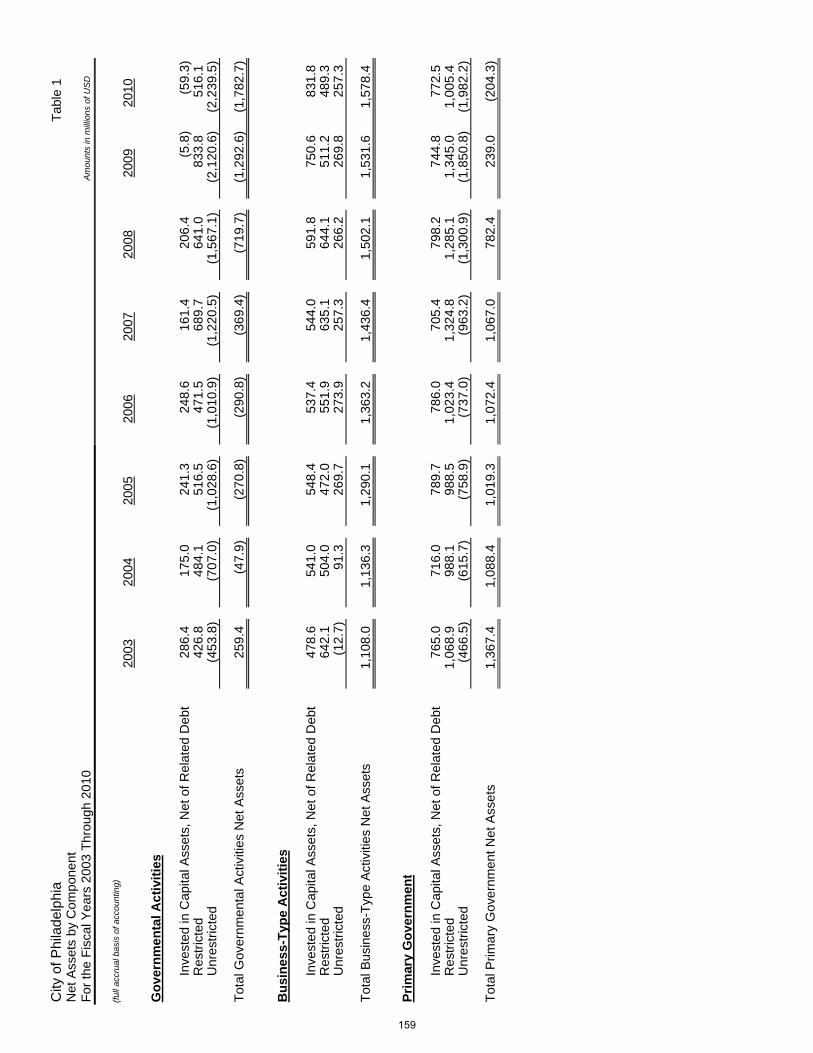
City
of P
hila
delp
hia
Tab
le 1
Net
Ass
ets
by C
ompo
nent
For
the
Fis
cal Y
ears
200
3 T
hrou
gh 2
010
Am
ount
s in
mill
ions
of U
SD
(full
accr
ual b
asis
of a
ccou
ntin
g)20
0320
0420
0520
0620
0720
0820
0920
10
Gov
ernm
enta
l Act
iviti
es
Inve
sted
in C
apita
l Ass
ets,
Net
of R
elat
ed D
ebt
286.
4
17
5.0
241.
3
24
8.6
16
1.4
206.
4
(5
.8)
(5
9.3)
Res
tric
ted
426.
8
48
4.1
516.
5
47
1.5
68
9.7
641.
0
83
3.8
516.
1
U
nres
tric
ted
(453
.8)
(707
.0)
(1,0
28.6
)
(1,0
10.9
)
(1
,220
.5)
(1
,567
.1)
(2
,120
.6)
(2
,239
.5)
Tot
al G
over
nmen
tal A
ctiv
ities
Net
Ass
ets
259.
4
(4
7.9)
(270
.8)
(290
.8)
(3
69.4
)
(7
19.7
)
(1
,292
.6)
(1
,782
.7)
Bus
ines
s-Ty
pe A
ctiv
ities
Inve
sted
in C
apita
l Ass
ets,
Net
of R
elat
ed D
ebt
478.
6
54
1.0
548.
4
53
7.4
54
4.0
591.
8
75
0.6
831.
8
R
estr
icte
d64
2.1
504.
0
47
2.0
551.
9
635.
1
64
4.1
511.
2
48
9.3
Unr
estr
icte
d(1
2.7)
91.3
26
9.7
273.
9
257.
3
26
6.2
269.
8
25
7.3
Tot
al B
usin
ess-
Typ
e A
ctiv
ities
Net
Ass
ets
1,10
8.0
1,
136.
3
1,29
0.1
1,
363.
2
1,
436.
4
1,50
2.1
1,
531.
6
1,57
8.4
Prim
ary
Gov
ernm
ent
Inve
sted
in C
apita
l Ass
ets,
Net
of R
elat
ed D
ebt
765.
0
71
6.0
789.
7
78
6.0
70
5.4
798.
2
74
4.8
772.
5
R
estr
icte
d1,
068.
9
988.
1
98
8.5
1,02
3.4
1,32
4.8
1,
285.
1
1,34
5.0
1,
005.
4
Unr
estr
icte
d(4
66.5
)
(6
15.7
)
(7
58.9
)
(7
37.0
)
(963
.2)
(1,3
00.9
)
(1,8
50.8
)
(1,9
82.2
)
Tot
al P
rimar
y G
over
nmen
t Net
Ass
ets
1,36
7.4
1,
088.
4
1,01
9.3
1,
072.
4
1,
067.
0
782.
4
23
9.0
(204
.3)
159
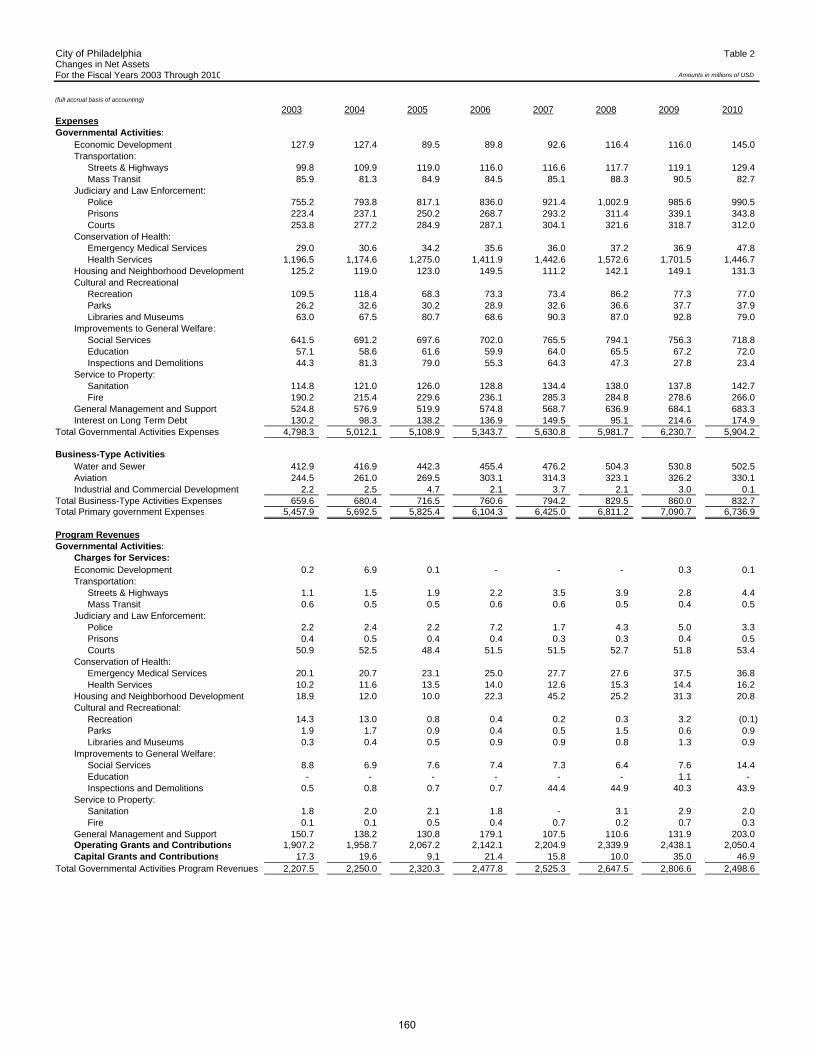
City of Philadelphia Table 2Changes in Net AssetsFor the Fiscal Years 2003 Through 2010
(full accrual basis of accounting)
2003 2004 2005 2006 2007 2008 2009 2010ExpensesGovernmental Activities:
Economic Development 127.9 127.4 89.5 89.8 92.6 116.4 116.0 145.0 Transportation:
Streets & Highways 99.8 109.9 119.0 116.0 116.6 117.7 119.1 129.4 Mass Transit 85.9 81.3 84.9 84.5 85.1 88.3 90.5 82.7
Judiciary and Law Enforcement:Police 755.2 793.8 817.1 836.0 921.4 1,002.9 985.6 990.5 Prisons 223.4 237.1 250.2 268.7 293.2 311.4 339.1 343.8 Courts 253.8 277.2 284.9 287.1 304.1 321.6 318.7 312.0
Conservation of Health:Emergency Medical Services 29.0 30.6 34.2 35.6 36.0 37.2 36.9 47.8 Health Services 1,196.5 1,174.6 1,275.0 1,411.9 1,442.6 1,572.6 1,701.5 1,446.7
Housing and Neighborhood Development 125.2 119.0 123.0 149.5 111.2 142.1 149.1 131.3 Cultural and Recreational
Recreation 109.5 118.4 68.3 73.3 73.4 86.2 77.3 77.0 Parks 26.2 32.6 30.2 28.9 32.6 36.6 37.7 37.9 Libraries and Museums 63.0 67.5 80.7 68.6 90.3 87.0 92.8 79.0
Improvements to General Welfare:Social Services 641.5 691.2 697.6 702.0 765.5 794.1 756.3 718.8 Education 57.1 58.6 61.6 59.9 64.0 65.5 67.2 72.0 Inspections and Demolitions 44.3 81.3 79.0 55.3 64.3 47.3 27.8 23.4
Service to Property:Sanitation 114.8 121.0 126.0 128.8 134.4 138.0 137.8 142.7 Fire 190.2 215.4 229.6 236.1 285.3 284.8 278.6 266.0
General Management and Support 524.8 576.9 519.9 574.8 568.7 636.9 684.1 683.3 Interest on Long Term Debt 130.2 98.3 138.2 136.9 149.5 95.1 214.6 174.9
Total Governmental Activities Expenses 4,798.3 5,012.1 5,108.9 5,343.7 5,630.8 5,981.7 6,230.7 5,904.2
Business-Type Activities:Water and Sewer 412.9 416.9 442.3 455.4 476.2 504.3 530.8 502.5 Aviation 244.5 261.0 269.5 303.1 314.3 323.1 326.2 330.1 Industrial and Commercial Development 2.2 2.5 4.7 2.1 3.7 2.1 3.0 0.1
Total Business-Type Activities Expenses 659.6 680.4 716.5 760.6 794.2 829.5 860.0 832.7 Total Primary government Expenses 5,457.9 5,692.5 5,825.4 6,104.3 6,425.0 6,811.2 7,090.7 6,736.9
Program RevenuesGovernmental Activities:
Charges for Services:Economic Development 0.2 6.9 0.1 - - - 0.3 0.1 Transportation:
Streets & Highways 1.1 1.5 1.9 2.2 3.5 3.9 2.8 4.4 Mass Transit 0.6 0.5 0.5 0.6 0.6 0.5 0.4 0.5
Judiciary and Law Enforcement:Police 2.2 2.4 2.2 7.2 1.7 4.3 5.0 3.3 Prisons 0.4 0.5 0.4 0.4 0.3 0.3 0.4 0.5 Courts 50.9 52.5 48.4 51.5 51.5 52.7 51.8 53.4
Conservation of Health:Emergency Medical Services 20.1 20.7 23.1 25.0 27.7 27.6 37.5 36.8 Health Services 10.2 11.6 13.5 14.0 12.6 15.3 14.4 16.2
Housing and Neighborhood Development 18.9 12.0 10.0 22.3 45.2 25.2 31.3 20.8 Cultural and Recreational:
Recreation 14.3 13.0 0.8 0.4 0.2 0.3 3.2 (0.1) Parks 1.9 1.7 0.9 0.4 0.5 1.5 0.6 0.9 Libraries and Museums 0.3 0.4 0.5 0.9 0.9 0.8 1.3 0.9
Improvements to General Welfare:Social Services 8.8 6.9 7.6 7.4 7.3 6.4 7.6 14.4 Education - - - - - - 1.1 - Inspections and Demolitions 0.5 0.8 0.7 0.7 44.4 44.9 40.3 43.9
Service to Property:Sanitation 1.8 2.0 2.1 1.8 - 3.1 2.9 2.0 Fire 0.1 0.1 0.5 0.4 0.7 0.2 0.7 0.3
General Management and Support 150.7 138.2 130.8 179.1 107.5 110.6 131.9 203.0 Operating Grants and Contributions 1,907.2 1,958.7 2,067.2 2,142.1 2,204.9 2,339.9 2,438.1 2,050.4 Capital Grants and Contributions 17.3 19.6 9.1 21.4 15.8 10.0 35.0 46.9
Total Governmental Activities Program Revenues 2,207.5 2,250.0 2,320.3 2,477.8 2,525.3 2,647.5 2,806.6 2,498.6
Amounts in millions of USD
160
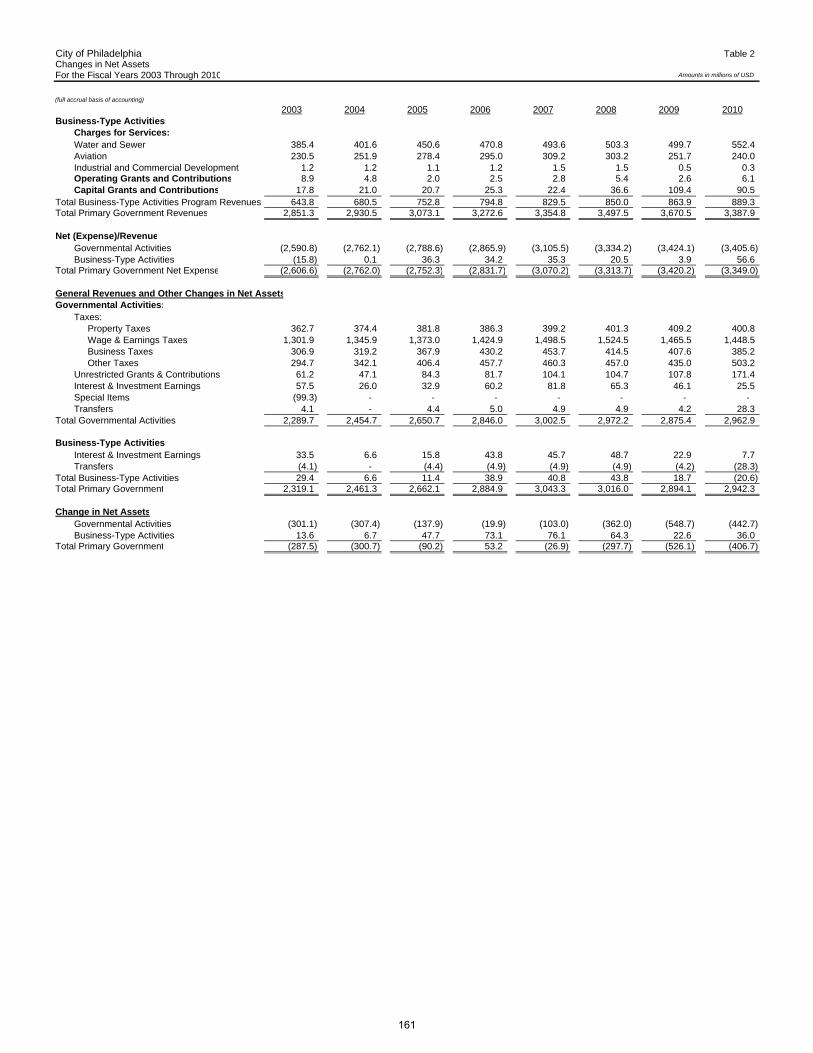
City of Philadelphia Table 2Changes in Net AssetsFor the Fiscal Years 2003 Through 2010
(full accrual basis of accounting)
2003 2004 2005 2006 2007 2008 2009 2010
Amounts in millions of USD
Business-Type Activities:Charges for Services:Water and Sewer 385.4 401.6 450.6 470.8 493.6 503.3 499.7 552.4 Aviation 230.5 251.9 278.4 295.0 309.2 303.2 251.7 240.0 Industrial and Commercial Development 1.2 1.2 1.1 1.2 1.5 1.5 0.5 0.3 Operating Grants and Contributions 8.9 4.8 2.0 2.5 2.8 5.4 2.6 6.1 Capital Grants and Contributions 17.8 21.0 20.7 25.3 22.4 36.6 109.4 90.5
Total Business-Type Activities Program Revenues 643.8 680.5 752.8 794.8 829.5 850.0 863.9 889.3 Total Primary Government Revenues 2,851.3 2,930.5 3,073.1 3,272.6 3,354.8 3,497.5 3,670.5 3,387.9
Net (Expense)/RevenueGovernmental Activities (2,590.8) (2,762.1) (2,788.6) (2,865.9) (3,105.5) (3,334.2) (3,424.1) (3,405.6) Business-Type Activities (15.8) 0.1 36.3 34.2 35.3 20.5 3.9 56.6
Total Primary Government Net Expense (2,606.6) (2,762.0) (2,752.3) (2,831.7) (3,070.2) (3,313.7) (3,420.2) (3,349.0)
General Revenues and Other Changes in Net AssetsGovernmental Activities:
Taxes:Property Taxes 362.7 374.4 381.8 386.3 399.2 401.3 409.2 400.8 Wage & Earnings Taxes 1,301.9 1,345.9 1,373.0 1,424.9 1,498.5 1,524.5 1,465.5 1,448.5 Business Taxes 306.9 319.2 367.9 430.2 453.7 414.5 407.6 385.2 Other Taxes 294.7 342.1 406.4 457.7 460.3 457.0 435.0 503.2
Unrestricted Grants & Contributions 61.2 47.1 84.3 81.7 104.1 104.7 107.8 171.4 Interest & Investment Earnings 57.5 26.0 32.9 60.2 81.8 65.3 46.1 25.5 Special Items (99.3) - - - - - - - Transfers 4.1 - 4.4 5.0 4.9 4.9 4.2 28.3
Total Governmental Activities 2,289.7 2,454.7 2,650.7 2,846.0 3,002.5 2,972.2 2,875.4 2,962.9
Business-Type Activities:Interest & Investment Earnings 33.5 6.6 15.8 43.8 45.7 48.7 22.9 7.7 Transfers (4.1) - (4.4) (4.9) (4.9) (4.9) (4.2) (28.3)
Total Business-Type Activities 29.4 6.6 11.4 38.9 40.8 43.8 18.7 (20.6) Total Primary Government 2,319.1 2,461.3 2,662.1 2,884.9 3,043.3 3,016.0 2,894.1 2,942.3
Change in Net AssetsGovernmental Activities (301.1) (307.4) (137.9) (19.9) (103.0) (362.0) (548.7) (442.7) Business-Type Activities 13.6 6.7 47.7 73.1 76.1 64.3 22.6 36.0
Total Primary Government (287.5) (300.7) (90.2) 53.2 (26.9) (297.7) (526.1) (406.7)
161
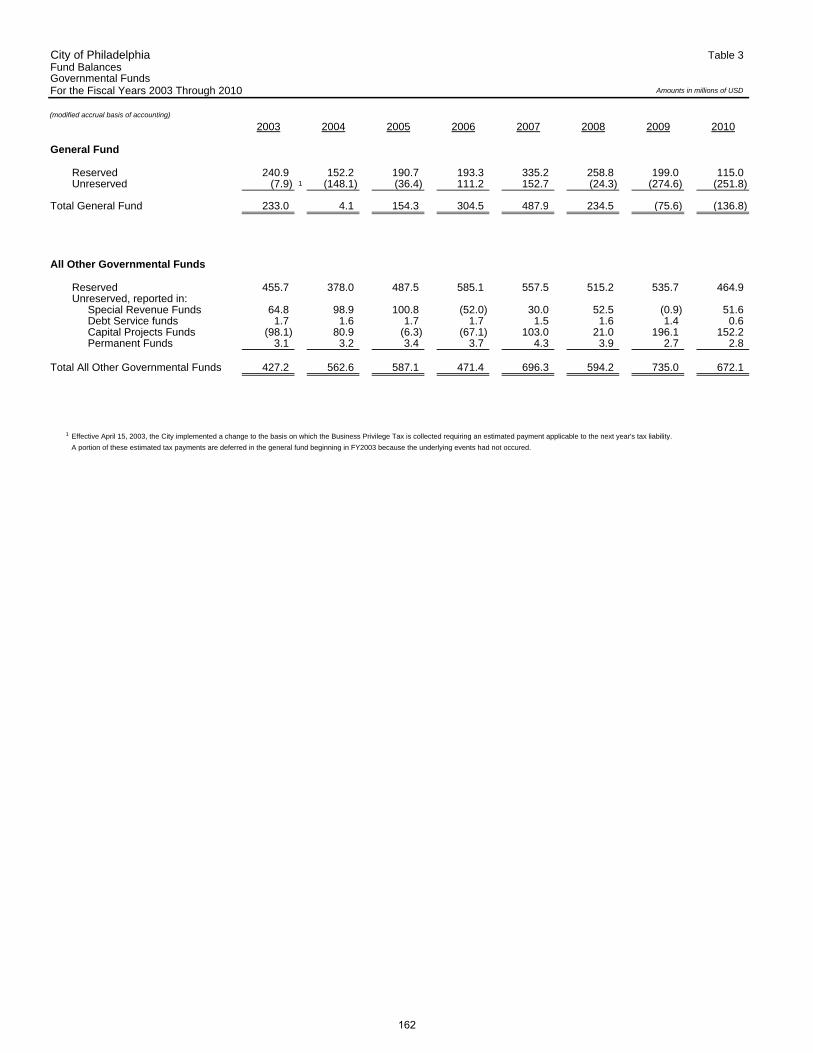
City of Philadelphia Table 3Fund BalancesGovernmental FundsFor the Fiscal Years 2003 Through 2010
(modified accrual basis of accounting)
2003 2004 2005 2006 2007 2008 2009 2010
General Fund
Reserved 240.9 152.2 190.7 193.3 335.2 258.8 199.0 115.0 Unreserved (7.9) 1 (148.1) (36.4) 111.2 152.7 (24.3) (274.6) (251.8)
Total General Fund 233.0 4.1 154.3 304.5 487.9 234.5 (75.6) (136.8)
All Other Governmental Funds
Reserved 455.7 378.0 487.5 585.1 557.5 515.2 535.7 464.9 Unreserved, reported in:
Special Revenue Funds 64.8 98.9 100.8 (52.0) 30.0 52.5 (0.9) 51.6 Debt Service funds 1.7 1.6 1.7 1.7 1.5 1.6 1.4 0.6 Capital Projects Funds (98.1) 80.9 (6.3) (67.1) 103.0 21.0 196.1 152.2 Permanent Funds 3.1 3.2 3.4 3.7 4.3 3.9 2.7 2.8
Total All Other Governmental Funds 427.2 562.6 587.1 471.4 696.3 594.2 735.0 672.1
1 Effective April 15, 2003, the City implemented a change to the basis on which the Business Privilege Tax is collected requiring an estimated payment applicable to the next year's tax liability.
A portion of these estimated tax payments are deferred in the general fund beginning in FY2003 because the underlying events had not occured.
Amounts in millions of USD
162
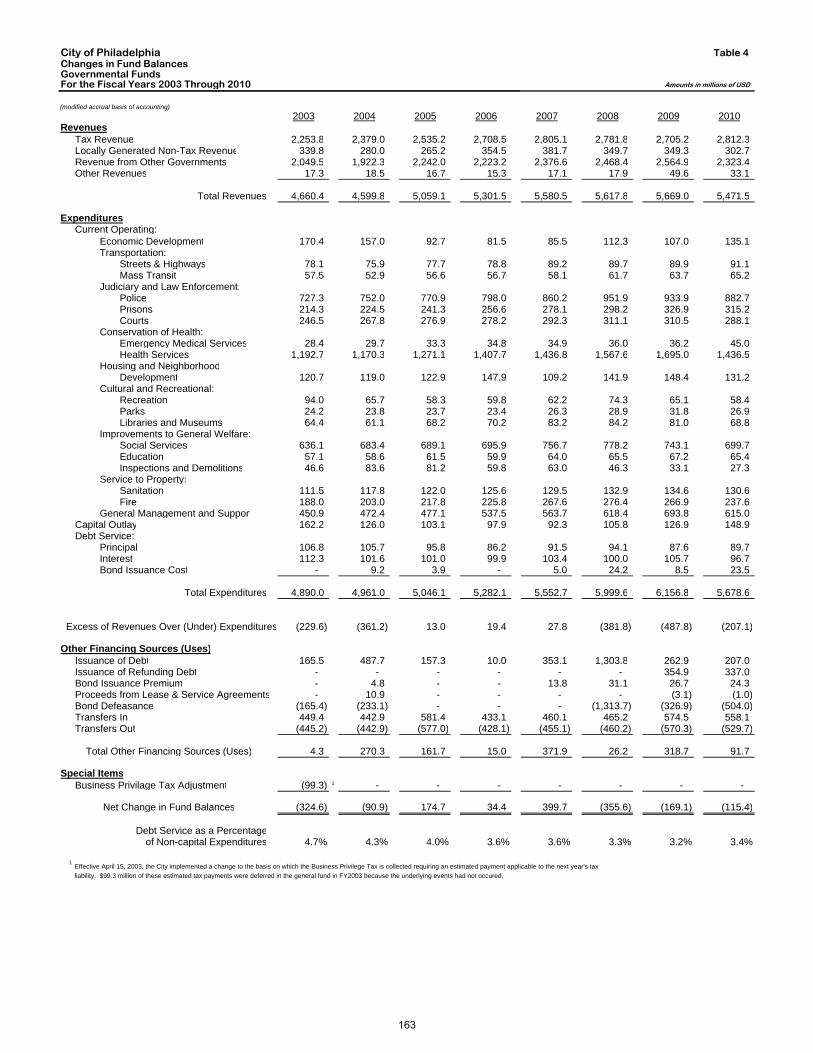
City of Philadelphia Table 4Changes in Fund BalancesGovernmental FundsFor the Fiscal Years 2003 Through 2010
(modified accrual basis of accounting)2003 2004 2005 2006 2007 2008 2009 2010
RevenuesTax Revenue 2,253.8 2,379.0 2,535.2 2,708.5 2,805.1 2,781.8 2,705.2 2,812.3 Locally Generated Non-Tax Revenue 339.8 280.0 265.2 354.5 381.7 349.7 349.3 302.7 Revenue from Other Governments 2,049.5 1,922.3 2,242.0 2,223.2 2,376.6 2,468.4 2,564.9 2,323.4 Other Revenues 17.3 18.5 16.7 15.3 17.1 17.9 49.6 33.1
Total Revenues 4,660.4 4,599.8 5,059.1 5,301.5 5,580.5 5,617.8 5,669.0 5,471.5
ExpendituresCurrent Operating:
Economic Development 170.4 157.0 92.7 81.5 85.5 112.3 107.0 135.1 Transportation:
Streets & Highways 78.1 75.9 77.7 78.8 89.2 89.7 89.9 91.1 Mass Transit 57.5 52.9 56.6 56.7 58.1 61.7 63.7 65.2
Judiciary and Law Enforcement:Police 727.3 752.0 770.9 798.0 860.2 951.9 933.9 882.7 Prisons 214.3 224.5 241.3 256.6 278.1 298.2 326.9 315.2 Courts 246.5 267.8 276.9 278.2 292.3 311.1 310.5 288.1
Conservation of Health:Emergency Medical Services 28.4 29.7 33.3 34.8 34.9 36.0 36.2 45.0 Health Services 1,192.7 1,170.3 1,271.1 1,407.7 1,436.8 1,567.6 1,695.0 1,436.5
Housing and NeighborhoodDevelopment 120.7 119.0 122.9 147.9 109.2 141.9 148.4 131.2
Cultural and Recreational:Recreation 94.0 65.7 58.3 59.8 62.2 74.3 65.1 58.4 Parks 24.2 23.8 23.7 23.4 26.3 28.9 31.8 26.9 Libraries and Museums 64.4 61.1 68.2 70.2 83.2 84.2 81.0 68.8
Improvements to General Welfare:Social Services 636.1 683.4 689.1 695.9 756.7 778.2 743.1 699.7 Education 57.1 58.6 61.5 59.9 64.0 65.5 67.2 65.4 Inspections and Demolitions 46.6 83.6 81.2 59.8 63.0 46.3 33.1 27.3
Service to Property:Sanitation 111.5 117.8 122.0 125.6 129.5 132.9 134.6 130.6 Fire 188.0 203.0 217.8 225.8 267.6 276.4 266.9 237.6
General Management and Support 450.9 472.4 477.1 537.5 563.7 618.4 693.8 615.0 Capital Outlay 162.2 126.0 103.1 97.9 92.3 105.8 126.9 148.9 Debt Service:
Principal 106.8 105.7 95.8 86.2 91.5 94.1 87.6 89.7 Interest 112.3 101.6 101.0 99.9 103.4 100.0 105.7 96.7 Bond Issuance Cost - 9.2 3.9 - 5.0 24.2 8.5 23.5
Total Expenditures 4,890.0 4,961.0 5,046.1 5,282.1 5,552.7 5,999.6 6,156.8 5,678.6
(229.6) (361.2) 13.0 19.4 27.8 (381.8) (487.8) (207.1)
Other Financing Sources (Uses)Issuance of Debt 165.5 487.7 157.3 10.0 353.1 1,303.8 262.9 207.0 Issuance of Refunding Debt - - - - - - 354.9 337.0 Bond Issuance Premium - 4.8 - - 13.8 31.1 26.7 24.3 Proceeds from Lease & Service Agreements - 10.9 - - - - (3.1) (1.0) Bond Defeasance (165.4) (233.1) - - - (1,313.7) (326.9) (504.0) Transfers In 449.4 442.9 581.4 433.1 460.1 465.2 574.5 558.1 Transfers Out (445.2) (442.9) (577.0) (428.1) (455.1) (460.2) (570.3) (529.7)
Total Other Financing Sources (Uses) 4.3 270.3 161.7 15.0 371.9 26.2 318.7 91.7
Special ItemsBusiness Privilage Tax Adjustment (99.3) 1 - - - - - - -
Net Change in Fund Balances (324.6) (90.9) 174.7 34.4 399.7 (355.6) (169.1) (115.4)
Debt Service as a Percentageof Non-capital Expenditures 4.7% 4.3% 4.0% 3.6% 3.6% 3.3% 3.2% 3.4%
1Effective April 15, 2003, the City implemented a change to the basis on which the Business Privilege Tax is collected requiring an estimated payment applicable to the next year's tax
liability. $99.3 million of these estimated tax payments were deferred in the general fund in FY2003 because the underlying events had not occured.
Amounts in millions of USD
Excess of Revenues Over (Under) Expenditures
163
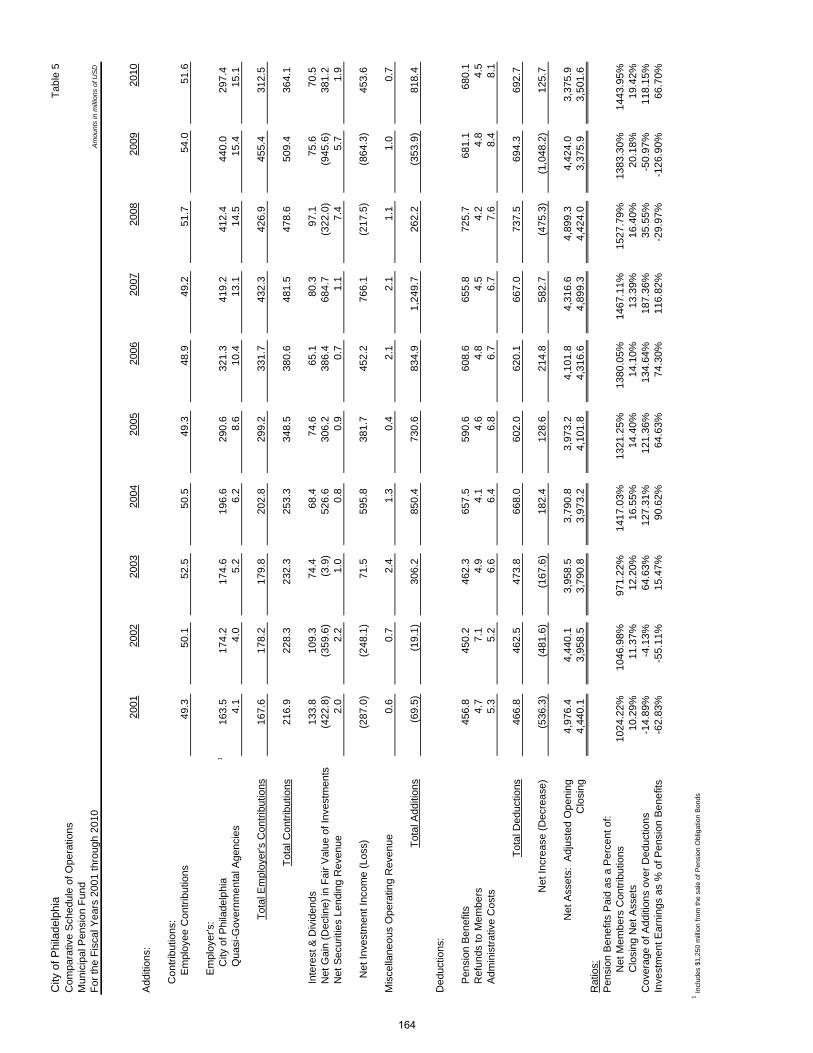
City
of P
hila
delp
hia
Tab
le 5
Com
para
tive
Sch
edul
e of
Ope
ratio
nsM
unic
ipal
Pen
sion
Fun
dF
or th
e F
isca
l Yea
rs 2
001
thro
ugh
2010
Am
ount
s in
mill
ions
of U
SD
2001
2002
2003
2004
2005
2006
2007
2008
2009
2010
Add
ition
s:
C
ontr
ibut
ions
:
E
mpl
oyee
Con
trib
utio
ns49
.350
.152
.550
.549
.348
.949
.251
.754
.051
.6
Em
ploy
er's
:
City
of P
hila
delp
hia
116
3.5
174.
217
4.6
196.
629
0.6
321.
341
9.2
412.
444
0.0
297.
4
Qua
si-G
over
nmen
tal A
genc
ies
4.1
4.0
5.2
6.2
8.6
10.4
13.1
14.5
15.4
15.1
Tot
al E
mpl
oyer
's C
ontr
ibut
ions
167.
617
8.2
179.
820
2.8
299.
233
1.7
432.
342
6.9
455.
431
2.5
Tot
al C
ontr
ibut
ions
216.
922
8.3
232.
325
3.3
348.
538
0.6
481.
547
8.6
509.
436
4.1
In
tere
st &
Div
iden
ds13
3.8
109.
374
.468
.474
.665
.180
.397
.175
.670
.5
Net
Gai
n (D
eclin
e) in
Fai
r V
alue
of I
nves
tmen
ts(4
22.8
)(3
59.6
)(3
.9)
526.
630
6.2
386.
468
4.7
(322
.0)
(945
.6)
381.
2
Net
Sec
uriti
es L
endi
ng R
even
ue2.
02.
21.
00.
80.
90.
71.
17.
45.
71.
9
N
et In
vest
men
t Inc
ome
(Los
s)(2
87.0
)(2
48.1
)71
.559
5.8
381.
745
2.2
766.
1(2
17.5
)(8
64.3
)45
3.6
Mis
cella
neou
s O
pera
ting
Rev
enue
0.6
0.7
2.4
1.3
0.4
2.1
2.1
1.1
1.0
0.7
Tot
al A
dditi
ons
(69.
5)(1
9.1)
306.
285
0.4
730.
683
4.9
1,24
9.7
262.
2(3
53.9
)81
8.4
Ded
uctio
ns:
P
ensi
on B
enef
its45
6.8
450.
246
2.3
657.
559
0.6
608.
665
5.8
725.
768
1.1
680.
1
Ref
unds
to M
embe
rs4.
77.
14.
94.
14.
64.
84.
54.
24.
84.
5
Adm
inis
trat
ive
Cos
ts5.
35.
26.
66.
46.
86.
76.
77.
68.
48.
1
Tot
al D
educ
tions
466.
846
2.5
473.
866
8.0
602.
062
0.1
667.
073
7.5
694.
369
2.7
Net
Incr
ease
(D
ecre
ase)
(536
.3)
(481
.6)
(167
.6)
182.
412
8.6
214.
858
2.7
(475
.3)
(1,0
48.2
)12
5.7
Net
Ass
ets:
Adj
uste
d O
peni
ng4,
976.
44,
440.
13,
958.
53,
790.
83,
973.
24,
101.
84,
316.
64,
899.
34,
424.
03,
375.
9C
losi
ng4,
440.
13,
958.
53,
790.
83,
973.
24,
101.
84,
316.
64,
899.
34,
424.
03,
375.
93,
501.
6R
atio
s:P
ensi
on B
enef
its P
aid
as a
Per
cent
of:
Net
Mem
bers
Con
trib
utio
ns10
24.2
2%10
46.9
8%97
1.22
%14
17.0
3%13
21.2
5%13
80.0
5%14
67.1
1%15
27.7
9%13
83.3
0%14
43.9
5%
C
losi
ng N
et A
sset
s10
.29%
11.3
7%12
.20%
16.5
5%14
.40%
14.1
0%13
.39%
16.4
0%20
.18%
19.4
2%C
over
age
of A
dditi
ons
over
Ded
uctio
ns-1
4.89
%-4
.13%
64.6
3%12
7.31
%12
1.36
%13
4.64
%18
7.36
%35
.55%
-50.
97%
118.
15%
Inve
stm
ent E
arni
ngs
as %
of P
ensi
on B
enef
its-6
2.83
%-5
5.11
%15
.47%
90.6
2%64
.63%
74.3
0%11
6.82
%-2
9.97
%-1
26.9
0%66
.70%
1In
clud
es $
1,25
0 m
illio
n fr
om th
e sa
le o
f Pen
sion
Obl
igat
ion
Bon
ds
164
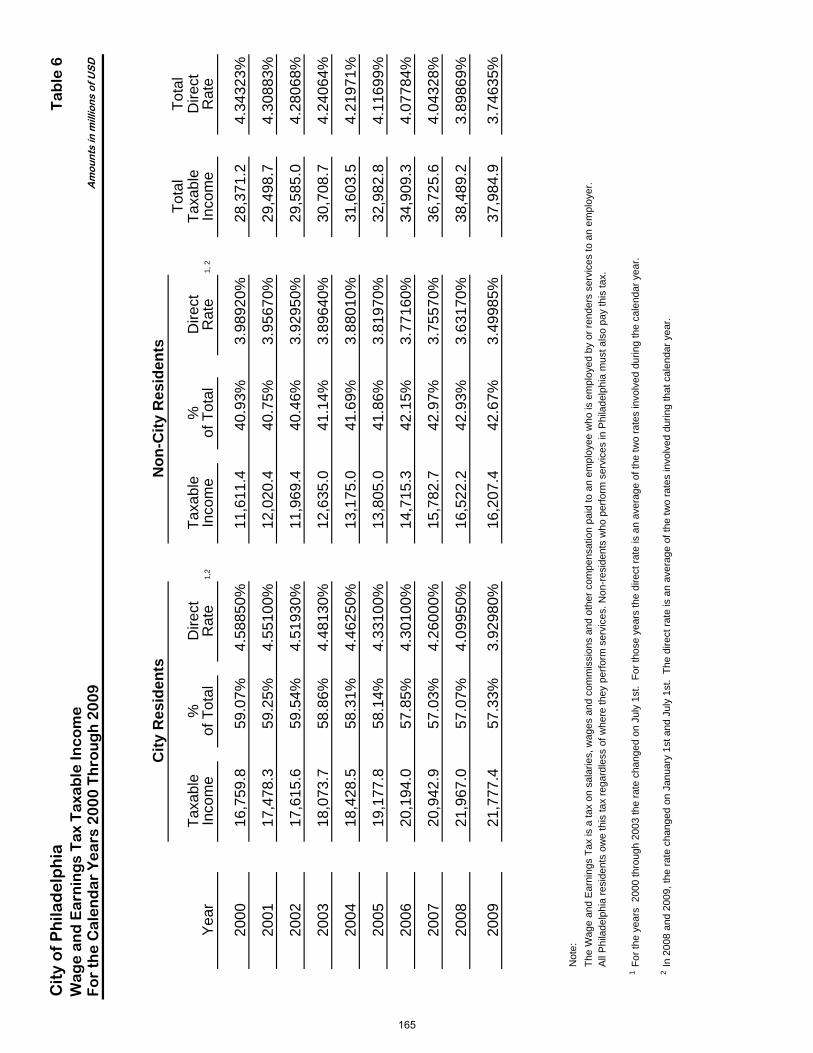
Cit
y o
f P
hila
de
lph
iaT
ab
le 6
Wa
ge
an
d E
arn
ing
s T
ax
Ta
xab
le In
co
me
Fo
r th
e C
ale
nd
ar
Ye
ars
20
00
Th
rou
gh
20
09
City
Res
iden
tsN
on-C
ity R
esid
ent s
Tot
alT
otal
Tax
able
%D
irect
Tax
able
%D
irect
Tax
able
Dire
ctY
ear
Inco
me
of T
otal
Rat
e1,
2In
com
eof
Tot
alR
ate
1, 2
Inco
me
Rat
e
2000
16,7
59.8
59
.07%
4.58
850%
11,6
11.4
40.9
3%3.
9892
0%28
,371
.24.
3432
3%
2001
17,4
78.3
59
.25%
4.55
100%
12,0
20.4
40.7
5%3.
9567
0%29
,498
.74.
3088
3%
2002
17,6
15.6
59
.54%
4.51
930%
11,9
69.4
40.4
6%3.
9295
0%29
,585
.04.
2806
8%
2003
18,0
73.7
58
.86%
4.48
130%
12,6
35.0
41.1
4%3.
8964
0%30
,708
.74.
2406
4%
2004
18,4
28.5
58
.31%
4.46
250%
13,1
75.0
41.6
9%3.
8801
0%31
,603
.54.
2197
1%
2005
19,1
77.8
58
.14%
4.33
100%
13,8
05.0
41.8
6%3.
8197
0%32
,982
.84.
1169
9%
2006
20,1
94.0
57
.85%
4.30
100%
14,7
15.3
42.1
5%3.
7716
0%34
,909
.34.
0778
4%
2007
20,9
42.9
57
.03%
4.26
000%
15,7
82.7
42.9
7%3.
7557
0%36
,725
.64.
0432
8%
2008
21,9
67.0
57
.07%
4.09
950%
16,5
22.2
42.9
3%3.
6317
0%38
,489
.23.
8986
9%
2009
21,7
77.4
57
.33%
3.92
980%
16,2
07.4
42.6
7%3.
4998
5%37
,984
.93.
7463
5%
Not
e:
The
Wag
e an
d E
arni
ngs
Tax
is a
tax
on s
alar
ies,
wag
es a
nd c
omm
issi
ons
and
othe
r co
mpe
nsat
ion
paid
to a
n em
ploy
ee w
ho is
em
ploy
ed
by o
r re
nder
s se
rvic
es to
an
empl
oyer
.A
ll P
hila
delp
hia
resi
dent
s ow
e th
is ta
x re
gard
less
of w
here
they
per
form
ser
vice
s. N
on-r
esid
ents
who
per
form
ser
vice
s in
Phi
lad
elph
ia m
ust a
lso
pay
this
tax.
1F
or th
e ye
ars
200
0 th
roug
h 20
03 th
e ra
te c
hang
ed o
n Ju
ly 1
st.
For
thos
e ye
ars
the
dire
ct r
ate
is a
n av
erag
e of
the
two
rate
s in
volv
ed d
urin
g th
e ca
lend
ar y
ear.
2In
200
8 an
d 20
09, t
he r
ate
chan
ged
on J
anua
ry 1
st a
nd J
uly
1st.
The
dire
ct r
ate
is a
n av
erag
e of
the
two
rate
s in
volv
ed d
urin
g th
at c
alen
dar
year
.
Am
ount
s in
mill
ions
of U
SD
165
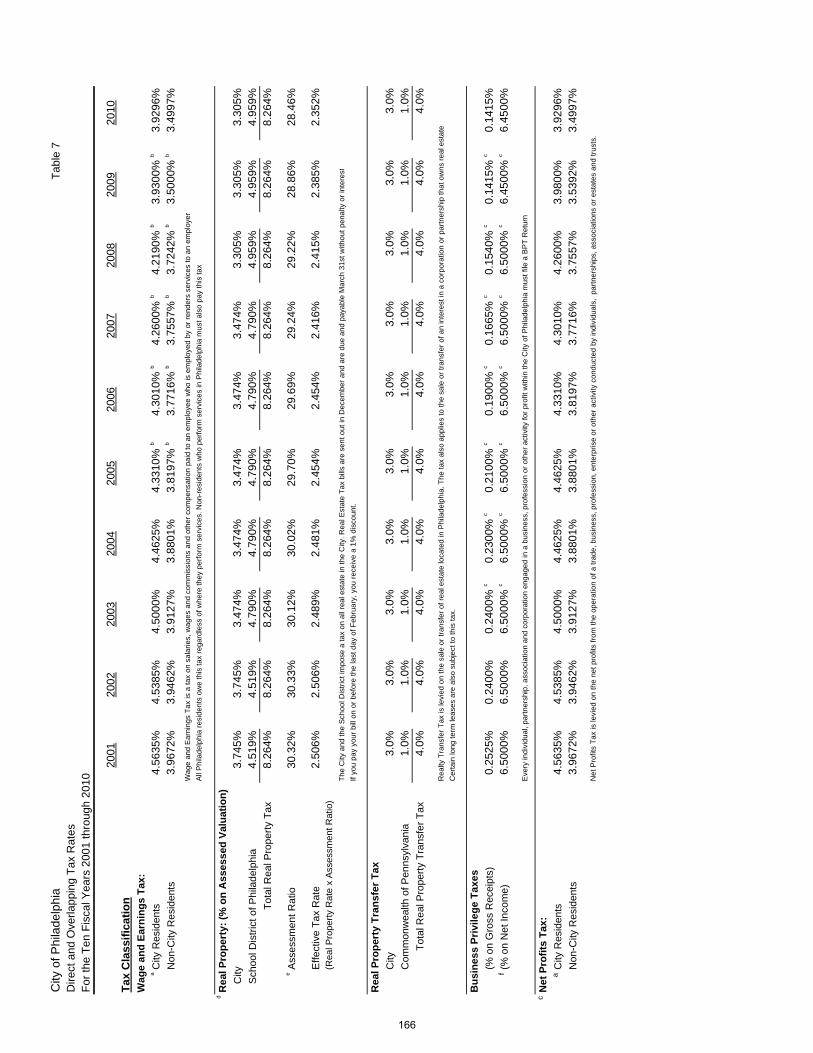
City
of P
hila
delp
hia
Dire
ct a
nd O
verla
ppin
g T
ax R
ates
For
the
Ten
Fis
cal Y
ears
200
1 th
roug
h 20
10
2001
2002
2003
2004
2005
2006
2007
2008
2009
2010
Tax
Cla
ssifi
catio
nW
age
and
Earn
ings
Tax
:a
City
Res
iden
ts4.
5635
%4.
5385
%4.
5000
%4.
4625
%4.
3310
%b
4.30
10%
b4.
2600
%b
4.21
90%
b3.
9300
%b
3.92
96%
Non
-City
Res
iden
ts3.
9672
%3.
9462
%3.
9127
%3.
8801
%3.
8197
%b
3.77
16%
b3.
7557
%b
3.72
42%
b3.
5000
%b
3.49
97%
Wag
e an
d E
arni
ngs
Tax
is a
tax
on s
alar
ies,
wag
es a
nd c
omm
issi
ons
and
othe
r co
mpe
nsat
ion
paid
to a
n em
ploy
ee w
ho is
em
ploy
ed b
y or
ren
ders
ser
vice
s to
an
empl
oyer
All
Phi
lade
lphi
a re
side
nts
owe
this
tax
rega
rdle
ss o
f whe
re th
ey p
erfo
rm s
ervi
ces.
Non
-res
iden
ts w
ho p
erfo
rm s
ervi
ces
in P
hila
del
phia
mus
t als
o pa
y th
is ta
x
dR
eal P
rope
rty:
(% o
n A
sses
sed
Valu
atio
n)
City
3.
745%
3.74
5%3.
474%
3.47
4%3.
474%
3.47
4%3.
474%
3.30
5%3.
305%
3.30
5%
Sch
ool D
istr
ict o
f Phi
lade
lphi
a4.
519%
4.51
9%4.
790%
4.79
0%4.
790%
4.79
0%4.
790%
4.95
9%4.
959%
4.95
9%
T
otal
Rea
l Pro
pert
y T
ax8.
264%
8.26
4%8.
264%
8.26
4%8.
264%
8.26
4%8.
264%
8.26
4%8.
264%
8.26
4%
eA
sses
smen
t Rat
io30
.32%
30.3
3%30
.12%
30.0
2%29
.70%
29.6
9%29
.24%
29.2
2%28
.86%
28.4
6%
Effe
ctiv
e T
ax R
ate
2.50
6%2.
506%
2.48
9%2.
481%
2.45
4%2.
454%
2.41
6%2.
415%
2.38
5%2.
352%
(Rea
l Pro
pert
y R
ate
x A
sses
smen
t Rat
io)
The
City
and
the
Sch
ool D
istr
ict i
mpo
se a
tax
on a
ll re
al e
stat
e in
the
City
. Rea
l Est
ate
Tax
bill
s ar
e se
nt o
ut in
Dec
embe
r an
d ar
e du
e an
d pa
yabl
e M
arch
31s
t with
out p
enal
ty o
r in
tere
st
If yo
u pa
y yo
ur b
ill o
n or
bef
ore
the
last
day
of F
ebru
ary,
you
rec
eive
a 1
% d
isco
unt.
Rea
l Pro
pert
y Tr
ansf
er T
ax
City
3.0%
3.0%
3.0%
3.0%
3.0%
3.0%
3.0%
3.0%
3.0%
3.0%
Com
mon
wea
lth o
f Pen
nsyl
vani
a1.
0%1.
0%1.
0%1.
0%1.
0%1.
0%1.
0%1.
0%1.
0%1.
0%T
otal
Rea
l Pro
pert
y T
rans
fer
Tax
4.0%
4.0%
4.0%
4.0%
4.0%
4.0%
4.0%
4.0%
4.0%
4.0%
Rea
lty T
rans
fer
Tax
is le
vied
on
the
sale
or
tran
sfer
of r
eal e
stat
e lo
cate
d in
Phi
lade
lphi
a. T
he ta
x al
so a
pplie
s to
the
sale
or
tran
sfer
of a
n in
tere
st in
a c
orpo
ratio
n or
par
tner
ship
that
ow
ns r
eal e
stat
e
Cer
tain
long
term
leas
es a
re a
lso
subj
ect t
o th
is ta
x.
Bus
ines
s Pr
ivile
ge T
axes
(% o
n G
ross
Rec
eipt
s)0.
2525
%0.
2400
%0.
2400
%c
0.23
00%
c0.
2100
%c
0.19
00%
c0.
1665
%c
0.15
40%
c0.
1415
%c
0.14
15%
f(%
on
Net
Inco
me)
6.50
00%
6.50
00%
6.50
00%
c6.
5000
%c
6.50
00%
c6.
5000
%c
6.50
00%
c6.
5000
%c
6.45
00%
c6.
4500
%
Eve
ry in
divi
dual
, par
tner
ship
, ass
ocia
tion
and
corp
orat
ion
enga
ged
in a
bus
ines
s, p
rofe
ssio
n or
oth
er a
ctiv
ity fo
r pr
ofit
with
in th
e C
ity o
f Phi
lade
lphi
a m
ust f
ile a
BP
T R
etur
n
cN
et P
rofit
s Ta
x:a
City
Res
iden
ts4.
5635
%4.
5385
%4.
5000
%4.
4625
%4.
4625
%4.
3310
%4.
3010
%4.
2600
%3.
9800
%3.
9296
%N
on-C
ity R
esid
ents
3.96
72%
3.94
62%
3.91
27%
3.88
01%
3.88
01%
3.81
97%
3.77
16%
3.75
57%
3.53
92%
3.49
97%
Net
Pro
fits
Tax
is le
vied
on
the
net p
rofit
s fr
om th
e op
erat
ion
of a
trad
e, b
usin
ess,
pro
fess
ion,
ent
erpr
ise
or o
ther
act
ivity
con
duct
ed b
y in
divi
dual
s, p
artn
ersh
ips,
ass
ocia
tions
or
esta
tes
and
trus
ts.
Tab
le 7
166
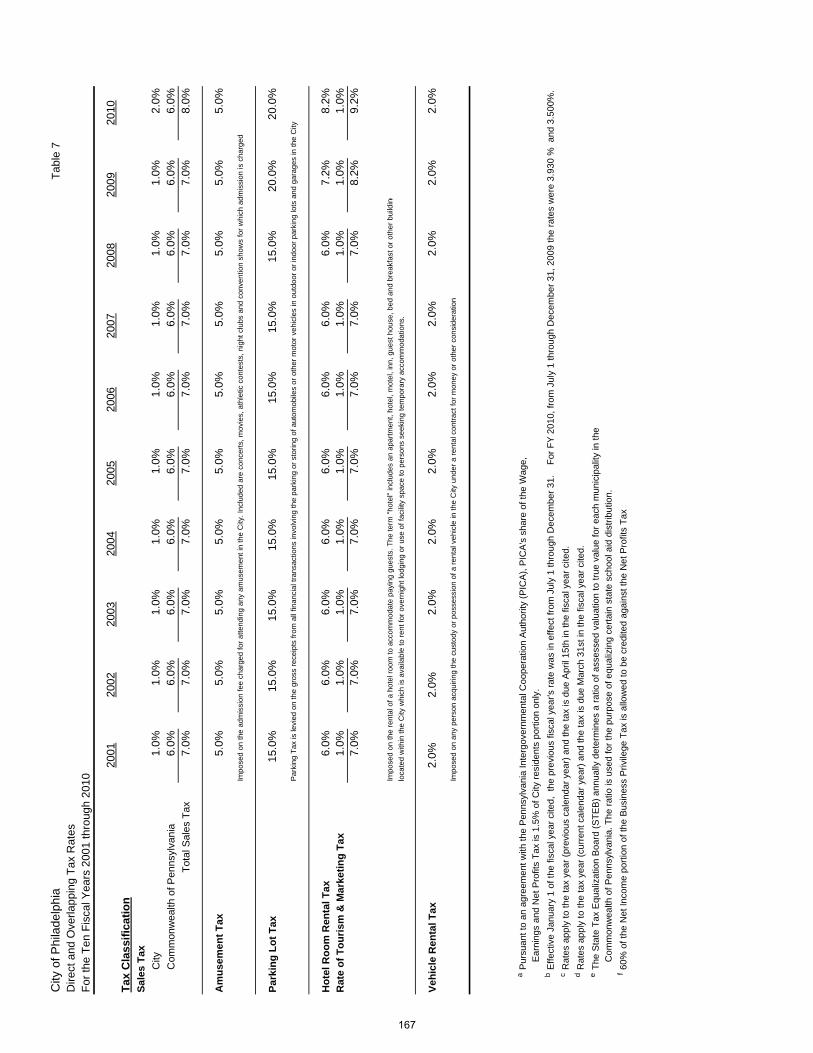
City
of P
hila
delp
hia
Dire
ct a
nd O
verla
ppin
g T
ax R
ates
For
the
Ten
Fis
cal Y
ears
200
1 th
roug
h 20
10
2001
2002
2003
2004
2005
2006
2007
2008
2009
2010
Tax
Cla
ssifi
catio
n
Tab
le 7
Sale
s Ta
xC
ity1.
0%1.
0%1.
0%1.
0%1.
0%1.
0%1.
0%1.
0%1.
0%2.
0%C
omm
onw
ealth
of P
enns
ylva
nia
6.0%
6.0%
6.0%
6.0%
6.0%
6.0%
6.0%
6.0%
6.0%
6.0%
Tot
al S
ales
Tax
7.0%
7.0%
7.0%
7.0%
7.0%
7.0%
7.0%
7.0%
7.0%
8.0%
Am
usem
ent T
ax5.
0%5.
0%5.
0%5.
0%5.
0%5.
0%5.
0%5.
0%5.
0%5.
0%
Impo
sed
on th
e ad
mis
sion
fee
char
ged
for
atte
ndin
g an
y am
usem
ent i
n th
e C
ity. I
nclu
ded
are
conc
erts
, mov
ies,
ath
letic
con
test
s, n
ight
clu
bs a
nd c
onve
ntio
n sh
ows
for
whi
ch a
dmis
sion
is c
harg
ed
Park
ing
Lot T
ax15
.0%
15.0
%15
.0%
15.0
%15
.0%
15.0
%15
.0%
15.0
%20
.0%
20.0
%
Par
king
Tax
is le
vied
on
the
gros
s re
ceip
ts fr
om a
ll fin
anci
al tr
ansa
ctio
ns in
volv
ing
the
park
ing
or s
torin
g of
aut
omob
iles
or o
ther
mot
or v
ehic
les
in o
utdo
or o
r in
door
par
king
lots
and
gar
ages
in th
e C
ity
Hot
el R
oom
Ren
tal T
ax6.
0%6.
0%6.
0%6.
0%6.
0%6.
0%6.
0%6.
0%7.
2%8.
2%R
ate
of T
ouris
m &
Mar
ketin
g Ta
x1.
0%1.
0%1.
0%1.
0%1.
0%1.
0%1.
0%1.
0%1.
0%1.
0%7.
0%7.
0%7.
0%7.
0%7.
0%7.
0%7.
0%7.
0%8.
2%9.
2%
Impo
sed
on th
e re
ntal
of a
hot
el r
oom
to a
ccom
mod
ate
payi
ng g
uest
s. T
he te
rm "
hote
l" in
clud
es a
n ap
artm
ent,
hote
l, m
otel
, inn
, gu
est h
ouse
, bed
and
bre
akfa
st o
r ot
her
build
ing
loca
ted
with
in th
e C
ity w
hich
is a
vaila
ble
to r
ent f
or o
vern
ight
lodg
ing
or u
se o
f fac
ility
spa
ce to
per
sons
see
king
tem
pora
ry a
ccom
mod
atio
ns.
Vehi
cle
Ren
tal T
ax2.
0%2.
0%2.
0%2.
0%2.
0%2.
0%2.
0%2.
0%2.
0%2.
0%
Impo
sed
on a
ny p
erso
n ac
quiri
ng th
e cu
stod
y or
pos
sess
ion
of a
ren
tal v
ehic
le in
the
City
und
er a
ren
tal c
ontr
act f
or m
oney
or
othe
r co
nsid
erat
ion
aP
ursu
ant t
o an
agr
eem
ent w
ith th
e P
enns
ylva
nia
Inte
rgov
ernm
enta
l Coo
pera
tion
Aut
horit
y (P
ICA
), P
ICA
's s
hare
of t
he W
age,
E
arni
ngs
and
Net
Pro
fits
Tax
is 1
.5%
of C
ity r
esid
ents
por
tion
only
.b
Effe
ctiv
e Ja
nuar
y 1
of th
e fis
cal y
ear
cite
d, t
he p
revi
ous
fisca
l yea
r's r
ate
was
in e
ffect
from
Jul
y 1
thro
ugh
Dec
embe
r 31
. F
or F
Y 2
010,
from
Jul
y 1
thro
ugh
Dec
embe
r 31
, 200
9 th
e ra
tes
wer
e 3.
930
% a
nd 3
.500
%.
cR
ates
app
ly to
the
tax
year
(pr
evio
us c
alen
dar
year
) an
d th
e ta
x is
due
Apr
il 15
th in
the
fisca
l yea
r ci
ted.
dR
ates
app
ly to
the
tax
year
(cu
rren
t cal
enda
r ye
ar)
and
the
tax
is d
ue M
arch
31s
t in
the
fisca
l yea
r ci
ted.
eT
he S
tate
Tax
Equ
aliz
atio
n B
oard
(S
TE
B)
annu
ally
det
erm
ines
a r
atio
of a
sses
sed
valu
atio
n to
true
val
ue fo
r ea
ch m
unic
ipal
ity in
the
C
omm
onw
ealth
of P
enns
ylva
nia.
The
rat
io is
use
d fo
r th
e pu
rpos
e of
equ
aliz
ing
cert
ain
stat
e sc
hool
aid
dis
trib
utio
n.f
60%
of t
he N
et In
com
e po
rtio
n of
the
Bus
ines
s P
rivile
ge T
ax is
allo
wed
to b
e cr
edite
d ag
ains
t the
Net
Pro
fits
Tax
167
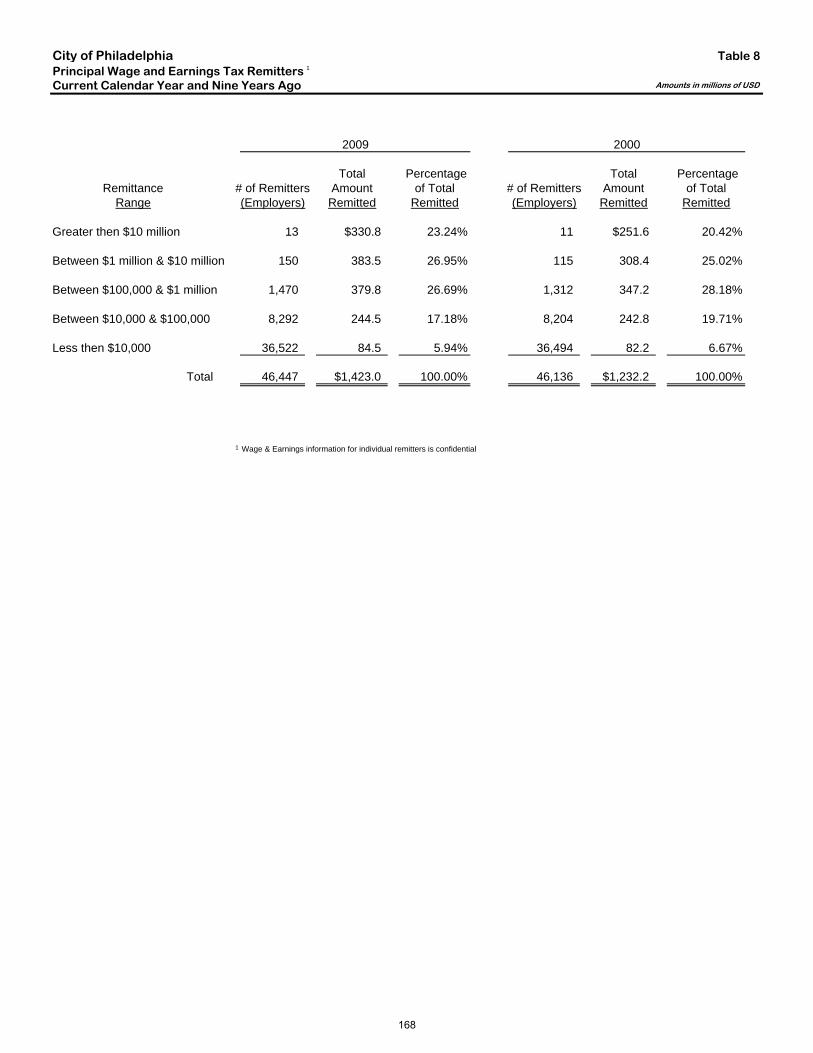
City of PhiladelphiaPrincipal Wage and Earnings Tax Remitters 1
Current Calendar Year and Nine Years Ago
2009 2000
Total Percentage Total PercentageRemittance # of Remitters Amount of Total # of Remitters Amount of Total
Range (Employers) Remitted Remitted (Employers) Remitted Remitted
Greater then $10 million 13 $330.8 23.24% 11 $251.6 20.42%
Between $1 million & $10 million 150 383.5 26.95% 115 308.4 25.02%
Between $100,000 & $1 million 1,470 379.8 26.69% 1,312 347.2 28.18%
Between $10,000 & $100,000 8,292 244.5 17.18% 8,204 242.8 19.71%
Less then $10,000 36,522 84.5 5.94% 36,494 82.2 6.67%
Total 46,447 $1,423.0 100.00% 46,136 $1,232.2 100.00%
1 Wage & Earnings information for individual remitters is confidential
Table 8
Amounts in millions of USD
168
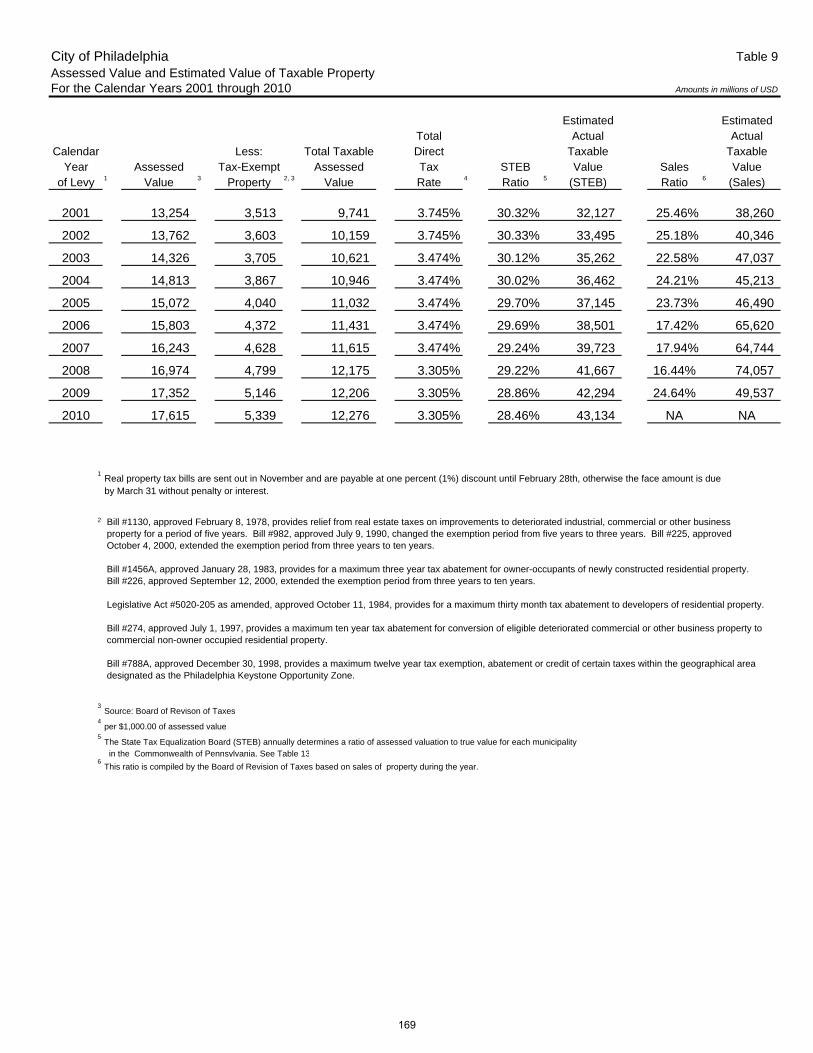
City of Philadelphia Table 9Assessed Value and Estimated Value of Taxable PropertyFor the Calendar Years 2001 through 2010
Estimated EstimatedTotal Actual Actual
Calendar Less: Total Taxable Direct Taxable TaxableYear Assessed Tax-Exempt Assessed Tax STEB Value Sales Value
of Levy 1 Value 3 Property 2, 3 Value Rate 4 Ratio 5 (STEB) Ratio 6 (Sales)
2001 13,254 3,513 9,741 3.745% 30.32% 32,127 25.46% 38,260
2002 13,762 3,603 10,159 3.745% 30.33% 33,495 25.18% 40,346
2003 14,326 3,705 10,621 3.474% 30.12% 35,262 22.58% 47,037
2004 14,813 3,867 10,946 3.474% 30.02% 36,462 24.21% 45,213
2005 15,072 4,040 11,032 3.474% 29.70% 37,145 23.73% 46,490
2006 15,803 4,372 11,431 3.474% 29.69% 38,501 17.42% 65,620
2007 16,243 4,628 11,615 3.474% 29.24% 39,723 17.94% 64,744
2008 16,974 4,799 12,175 3.305% 29.22% 41,667 16.44% 74,057
2009 17,352 5,146 12,206 3.305% 28.86% 42,294 24.64% 49,537
2010 17,615 5,339 12,276 3.305% 28.46% 43,134 NA NA
1Real property tax bills are sent out in November and are payable at one percent (1%) discount until February 28th, otherwise the face amount is dueby March 31 without penalty or interest.
2
3Source: Board of Revison of Taxes
4per $1,000.00 of assessed value
5The State Tax Equalization Board (STEB) annually determines a ratio of assessed valuation to true value for each municipality in the Commonwealth of Pennsylvania. See Table 13
6This ratio is compiled by the Board of Revision of Taxes based on sales of property during the year.
Amounts in millions of USD
Bill #1130, approved February 8, 1978, provides relief from real estate taxes on improvements to deteriorated industrial, commercial or other business property for a period of five years. Bill #982, approved July 9, 1990, changed the exemption period from five years to three years. Bill #225, approved October 4, 2000, extended the exemption period from three years to ten years.
Bill #1456A, approved January 28, 1983, provides for a maximum three year tax abatement for owner-occupants of newly constructed residential property. Bill #226, approved September 12, 2000, extended the exemption period from three years to ten years.
Legislative Act #5020-205 as amended, approved October 11, 1984, provides for a maximum thirty month tax abatement to developers of residential property.
Bill #274, approved July 1, 1997, provides a maximum ten year tax abatement for conversion of eligible deteriorated commercial or other business property to commercial non-owner occupied residential property.
Bill #788A, approved December 30, 1998, provides a maximum twelve year tax exemption, abatement or credit of certain taxes within the geographical area designated as the Philadelphia Keystone Opportunity Zone.
169
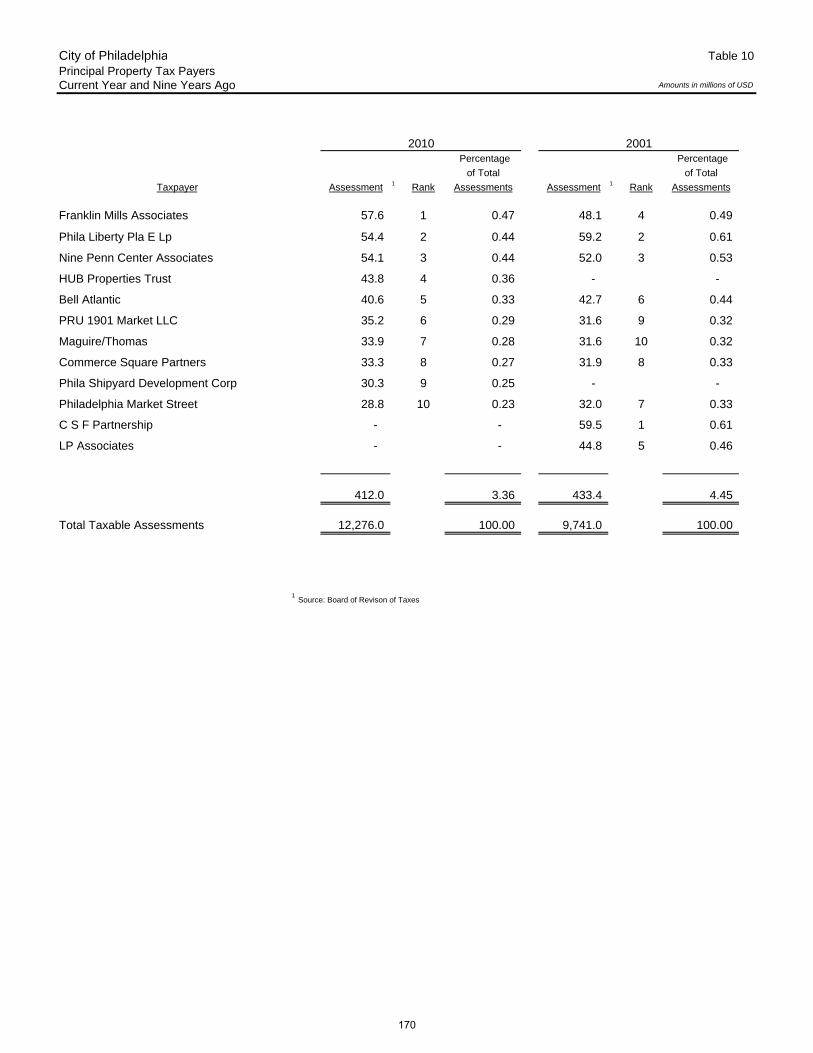
City of Philadelphia Table 10Principal Property Tax PayersCurrent Year and Nine Years Ago
2010 2001 Percentage Percentage
of Total of Total
Taxpayer Assessment 1 Rank Assessments Assessment 1 Rank Assessments
Franklin Mills Associates 57.6 1 0.47 48.1 4 0.49
Phila Liberty Pla E Lp 54.4 2 0.44 59.2 2 0.61
Nine Penn Center Associates 54.1 3 0.44 52.0 3 0.53
HUB Properties Trust 43.8 4 0.36 - -
Bell Atlantic 40.6 5 0.33 42.7 6 0.44
PRU 1901 Market LLC 35.2 6 0.29 31.6 9 0.32
Maguire/Thomas 33.9 7 0.28 31.6 10 0.32
Commerce Square Partners 33.3 8 0.27 31.9 8 0.33
Phila Shipyard Development Corp 30.3 9 0.25 - -
Philadelphia Market Street 28.8 10 0.23 32.0 7 0.33
C S F Partnership - - 59.5 1 0.61
LP Associates - - 44.8 5 0.46
412.0 3.36 433.4 4.45
Total Taxable Assessments 12,276.0 100.00 9,741.0 100.00
1Source: Board of Revison of Taxes
Amounts in millions of USD
170
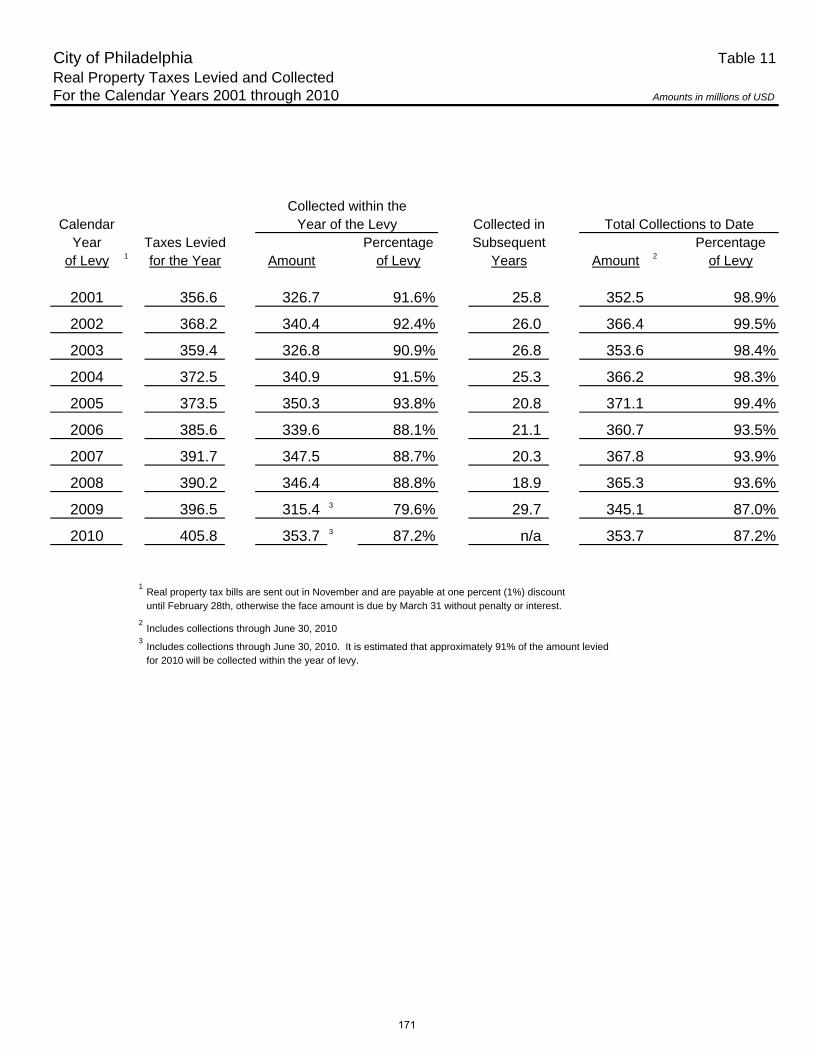
City of Philadelphia Table 11Real Property Taxes Levied and CollectedFor the Calendar Years 2001 through 2010
Collected within theCalendar Year of the Levy Collected in Total Collections to Date
Year Taxes Levied Percentage Subsequent Percentageof Levy 1 for the Year Amount of Levy Years Amount 2 of Levy
2001 356.6 326.7 91.6% 25.8 352.5 98.9%
2002 368.2 340.4 92.4% 26.0 366.4 99.5%
2003 359.4 326.8 90.9% 26.8 353.6 98.4%
2004 372.5 340.9 91.5% 25.3 366.2 98.3%
2005 373.5 350.3 93.8% 20.8 371.1 99.4%
2006 385.6 339.6 88.1% 21.1 360.7 93.5%
2007 391.7 347.5 88.7% 20.3 367.8 93.9%
2008 390.2 346.4 88.8% 18.9 365.3 93.6%
2009 396.5 315.4 3 79.6% 29.7 345.1 87.0%
2010 405.8 353.7 3 87.2% n/a 353.7 87.2%
1Real property tax bills are sent out in November and are payable at one percent (1%) discountuntil February 28th, otherwise the face amount is due by March 31 without penalty or interest.
2Includes collections through June 30, 2010
3Includes collections through June 30, 2010. It is estimated that approximately 91% of the amount leviedfor 2010 will be collected within the year of levy.
Amounts in millions of USD
171
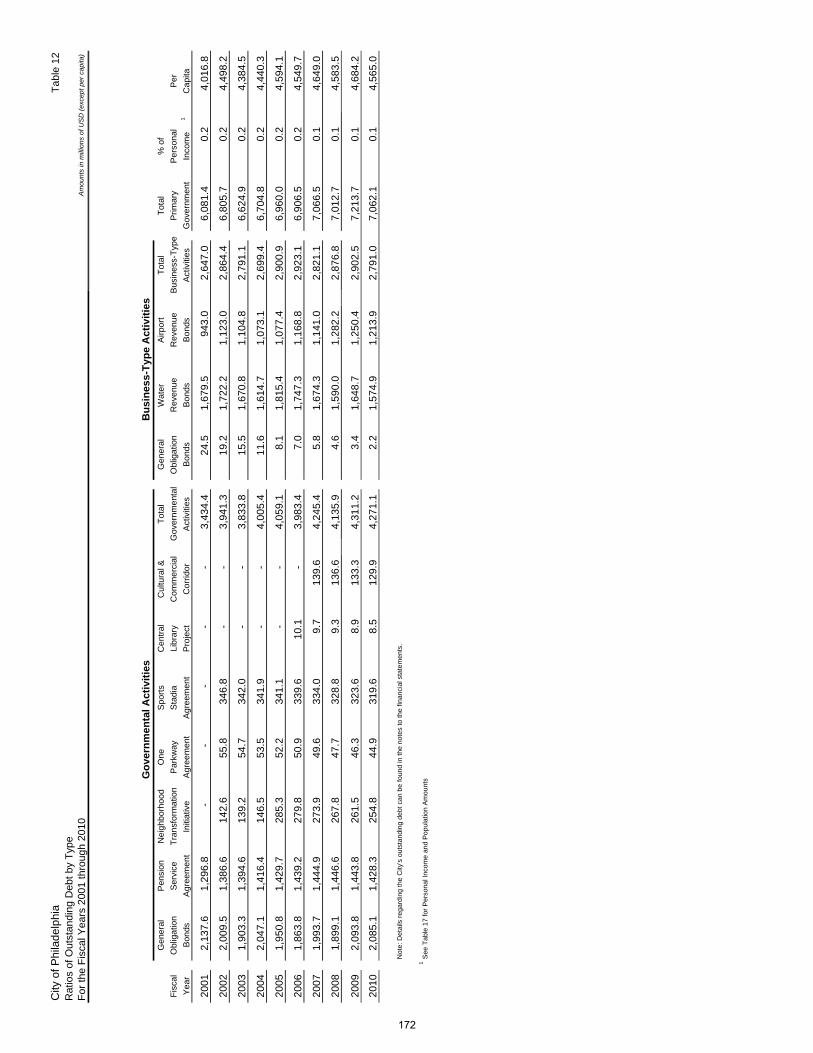
City
of P
hila
delp
hia
Rat
ios
of O
utst
andi
ng D
ebt b
y T
ype
For
the
Fis
cal Y
ears
200
1 th
roug
h 20
10
Gov
ernm
enta
l Act
iviti
esG
ener
alP
ensi
onN
eigh
borh
ood
One
Spo
rts
Cen
tral
Cul
tura
l &T
otal
Gen
eral
Wat
erA
irpor
tT
otal
Tot
al%
of
Fis
cal
Obl
igat
ion
Ser
vice
Tra
nsfo
rmat
ion
Par
kway
Sta
dia
Libr
ary
Com
mer
cial
Gov
ernm
enta
lO
blig
atio
nR
even
ueR
even
ueB
usin
ess-
Typ
eP
rimar
yP
erso
nal
Per
Yea
rB
onds
Agr
eem
ent
Initi
ativ
eA
gree
men
tA
gree
men
tP
roje
ctC
orrid
orA
ctiv
ities
Bon
dsB
onds
Bon
dsA
ctiv
ities
Gov
ernm
ent
Inco
me
1C
apita
2001
2,13
7.6
1,
296.
8
-
-
-
-
-
3,
434.
4
24.5
1,
679.
5
943.
0
2,
647.
0
6,08
1.4
0.
2
4,01
6.8
2002
2,00
9.5
1,
386.
6
142.
6
55
.8
346.
8
-
-
3,
941.
3
19.2
1,
722.
2
1,12
3.0
2,
864.
4
6,80
5.7
0.
2
4,49
8.2
2003
1,90
3.3
1,
394.
6
139.
2
54
.7
342.
0
-
-
3,
833.
8
15.5
1,
670.
8
1,10
4.8
2,
791.
1
6,62
4.9
0.
2
4,38
4.5
2004
2,04
7.1
1,
416.
4
146.
5
53
.5
341.
9
-
-
4,
005.
4
11.6
1,
614.
7
1,07
3.1
2,
699.
4
6,70
4.8
0.
2
4,44
0.3
2005
1,95
0.8
1,
429.
7
285.
3
52
.2
341.
1
-
-
4,
059.
1
8.1
1,
815.
4
1,07
7.4
2,
900.
9
6,96
0.0
0.
2
4,59
4.1
2006
1,86
3.8
1,
439.
2
279.
8
50
.9
339.
6
10
.1
-
3,
983.
4
7.0
1,
747.
3
1,16
8.8
2,
923.
1
6,90
6.5
0.
2
4,54
9.7
2007
1,99
3.7
1,
444.
9
273.
9
49
.6
334.
0
9.
7
139.
6
4,
245.
4
5.8
1,
674.
3
1,14
1.0
2,
821.
1
7,06
6.5
0.
1
4,64
9.0
2008
1,89
9.1
1,
446.
6
267.
8
47
.7
328.
8
9.
3
136.
6
4,
135.
9
4.6
1,
590.
0
1,28
2.2
2,
876.
8
7,01
2.7
0.
1
4,58
3.5
2009
2,09
3.8
1,
443.
8
261.
5
46
.3
323.
6
8.
9
133.
3
4,
311.
2
3.4
1,
648.
7
1,25
0.4
2,
902.
5
7,21
3.7
0.
1
4,68
4.2
2010
2,08
5.1
1,
428.
3
254.
8
44
.9
319.
6
8.
5
129.
9
4,
271.
1
2.2
1,
574.
9
1,21
3.9
2,
791.
0
7,06
2.1
0.
1
4,56
5.0
Not
e: D
etai
ls r
egar
ding
the
City
's o
utst
andi
ng d
ebt c
an b
e fo
und
in th
e no
tes
to th
e fin
anci
al s
tate
men
ts.
1S
ee T
able
17
for
Per
sona
l Inc
ome
and
Pop
ulat
ion
Am
ount
s
Bus
ines
s-Ty
pe A
ctiv
ities
Am
ount
s in
mill
ions
of U
SD
(exc
ept p
er c
apita
)
Tab
le 1
2
172
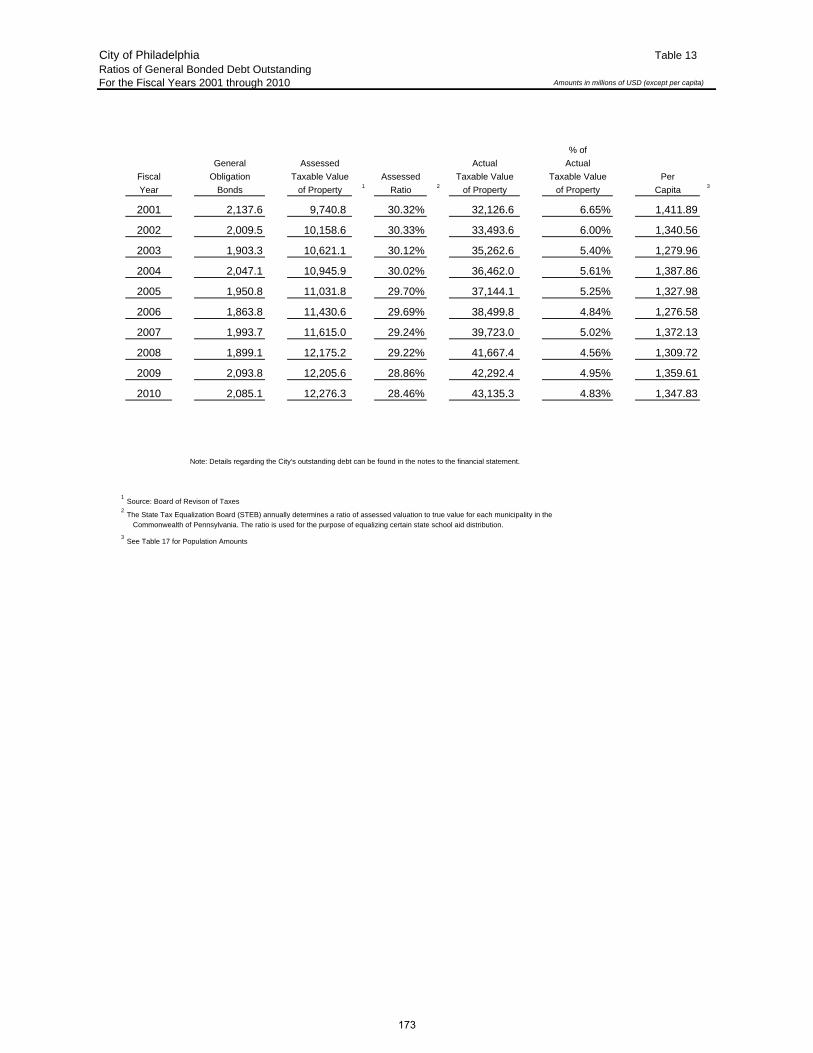
City of Philadelphia Table 13Ratios of General Bonded Debt OutstandingFor the Fiscal Years 2001 through 2010 Amounts in millions of USD (except per capita)
% of
General Assessed Actual Actual
Fiscal Obligation Taxable Value Assessed Taxable Value Taxable Value Per
Year Bonds of Property 1 Ratio 2 of Property of Property Capita 3
2001 2,137.6 9,740.8 30.32% 32,126.6 6.65% 1,411.89
2002 2,009.5 10,158.6 30.33% 33,493.6 6.00% 1,340.56
2003 1,903.3 10,621.1 30.12% 35,262.6 5.40% 1,279.96
2004 2,047.1 10,945.9 30.02% 36,462.0 5.61% 1,387.86
2005 1,950.8 11,031.8 29.70% 37,144.1 5.25% 1,327.98
2006 1,863.8 11,430.6 29.69% 38,499.8 4.84% 1,276.58
2007 1,993.7 11,615.0 29.24% 39,723.0 5.02% 1,372.13
2008 1,899.1 12,175.2 29.22% 41,667.4 4.56% 1,309.72
2009 2,093.8 12,205.6 28.86% 42,292.4 4.95% 1,359.61
2010 2,085.1 12,276.3 28.46% 43,135.3 4.83% 1,347.83
Note: Details regarding the City's outstanding debt can be found in the notes to the financial statement.
1Source: Board of Revison of Taxes
2The State Tax Equalization Board (STEB) annually determines a ratio of assessed valuation to true value for each municipality in the Commonwealth of Pennsylvania. The ratio is used for the purpose of equalizing certain state school aid distribution.
3See Table 17 for Population Amounts
173
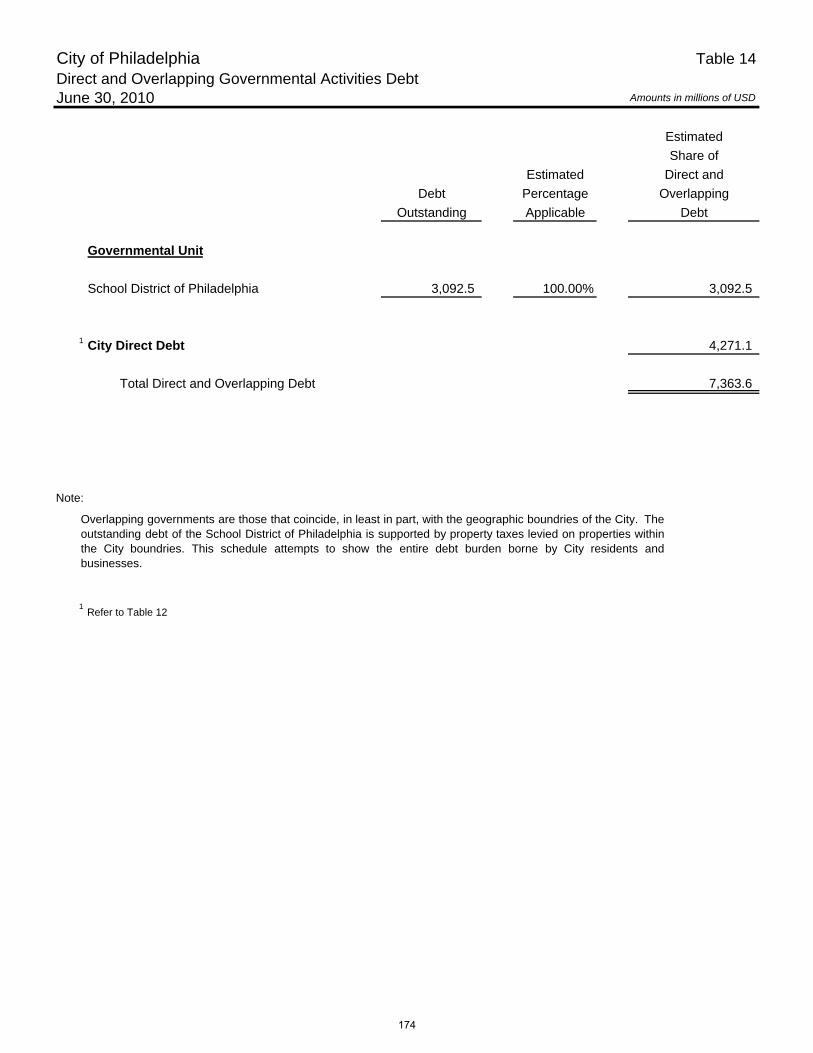
City of Philadelphia Table 14Direct and Overlapping Governmental Activities DebtJune 30, 2010 Amounts in millions of USD
Estimated
Share of
Estimated Direct and
Debt Percentage Overlapping
Outstanding Applicable Debt
Governmental Unit
School District of Philadelphia 3,092.5 100.00% 3,092.5
1 City Direct Debt 4,271.1
Total Direct and Overlapping Debt 7,363.6
Note:
1Refer to Table 12
Overlapping governments are those that coincide, in least in part, with the geographic boundries of the City. Theoutstanding debt of the School District of Philadelphia is supported by property taxes levied on properties withinthe City boundries. This schedule attempts to show the entire debt burden borne by City residents andbusinesses.
174
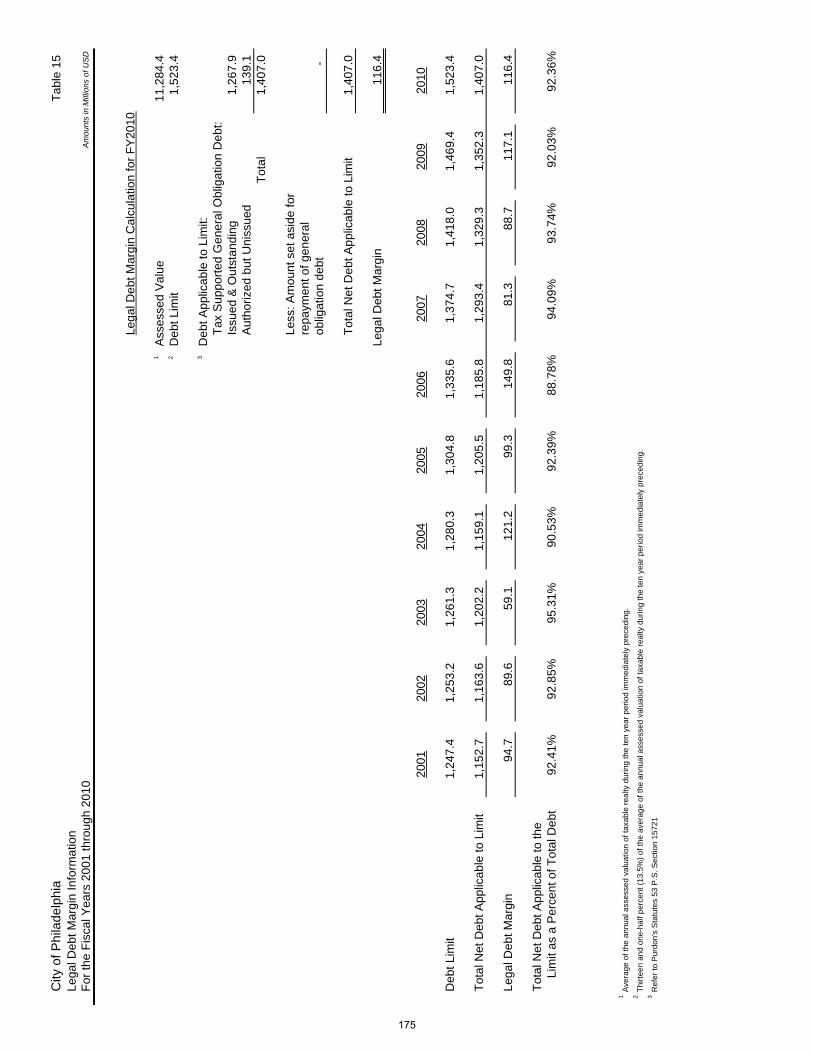
City
of P
hila
delp
hia
Lega
l Deb
t Mar
gin
Info
rmat
ion
For
the
Fis
cal Y
ears
200
1 th
roug
h 20
10
Lega
l Deb
t Mar
gin
Cal
cula
tion
for
FY
2010
1A
sses
sed
Val
ue11
,284
.4
2D
ebt L
imit
1,52
3.4
3D
ebt A
pplic
able
to L
imit:
Tax
Sup
port
ed G
ener
al O
blig
atio
n D
ebt:
Issu
ed &
Out
stan
ding
1,26
7.9
Aut
horiz
ed b
ut U
niss
ued
139.
1
Tot
al1,
407.
0
Less
: Am
ount
set
asi
de fo
rre
paym
ent o
f gen
eral
oblig
atio
n de
bt-
Tot
al N
et D
ebt A
pplic
able
to L
imit
1,40
7.0
Lega
l Deb
t Mar
gin
116.
4
2001
2002
2003
2004
2005
2006
2007
2008
2009
2010
Deb
t Lim
it1,
247.
4
1,
253.
2
1,
261.
3
1,
280.
3
1,
304.
8
1,
335.
6
1,
374.
7
1,
418.
0
1,
469.
4
1,
523.
4
Tot
al N
et D
ebt A
pplic
able
to L
imit
1,15
2.7
1,16
3.6
1,20
2.2
1,15
9.1
1,20
5.5
1,18
5.8
1,29
3.4
1,32
9.3
1,35
2.3
1,40
7.0
Lega
l Deb
t Mar
gin
94.7
89.6
59.1
121.
2
99.3
149.
8
81.3
88.7
117.
1
116.
4
Tot
al N
et D
ebt A
pplic
able
to th
e
Lim
it as
a P
erce
nt o
f Tot
al D
ebt
92.4
1%92
.85%
95.3
1%90
.53%
92.3
9%88
.78%
94.0
9%93
.74%
92.0
3%92
.36%
1A
vera
ge o
f the
ann
ual a
sses
sed
valu
atio
n of
taxa
ble
real
ty d
urin
g th
e te
n ye
ar p
erio
d im
med
iate
ly p
rece
ding
.2
Thi
rtee
n an
d on
e-ha
lf pe
rcen
t (13
.5%
) of
the
aver
age
of th
e an
nual
ass
esse
d va
luat
ion
of ta
xabl
e re
alty
dur
ing
the
ten
year
per
iod
imm
edia
tely
pre
cedi
ng.
3R
efer
to P
urdo
n's
Sta
tute
s 53
P.S
. Sec
tion
1572
1
Tab
le 1
5
Am
ount
s in
Mill
ions
of U
SD
175
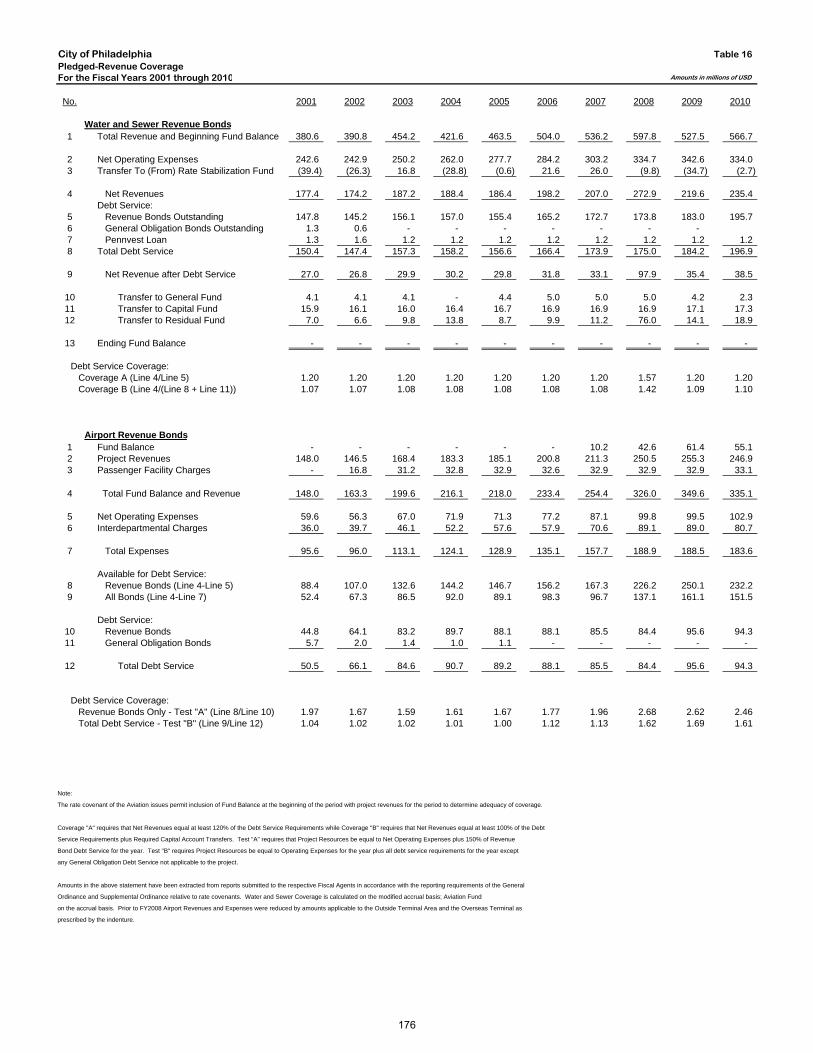
City of PhiladelphiaPledged-Revenue CoverageFor the Fiscal Years 2001 through 2010
No. 2001 2002 2003 2004 2005 2006 2007 2008 2009 2010
Water and Sewer Revenue Bonds1 Total Revenue and Beginning Fund Balance 380.6 390.8 454.2 421.6 463.5 504.0 536.2 597.8 527.5 566.7
2 Net Operating Expenses 242.6 242.9 250.2 262.0 277.7 284.2 303.2 334.7 342.6 334.0 3 Transfer To (From) Rate Stabilization Fund (39.4) (26.3) 16.8 (28.8) (0.6) 21.6 26.0 (9.8) (34.7) (2.7)
4 Net Revenues 177.4 174.2 187.2 188.4 186.4 198.2 207.0 272.9 219.6 235.4 Debt Service:
5 Revenue Bonds Outstanding 147.8 145.2 156.1 157.0 155.4 165.2 172.7 173.8 183.0 195.7 6 General Obligation Bonds Outstanding 1.3 0.6 - - - - - - - 7 Pennvest Loan 1.3 1.6 1.2 1.2 1.2 1.2 1.2 1.2 1.2 1.2 8 Total Debt Service 150.4 147.4 157.3 158.2 156.6 166.4 173.9 175.0 184.2 196.9
9 Net Revenue after Debt Service 27.0 26.8 29.9 30.2 29.8 31.8 33.1 97.9 35.4 38.5
10 Transfer to General Fund 4.1 4.1 4.1 - 4.4 5.0 5.0 5.0 4.2 2.3 11 Transfer to Capital Fund 15.9 16.1 16.0 16.4 16.7 16.9 16.9 16.9 17.1 17.3 12 Transfer to Residual Fund 7.0 6.6 9.8 13.8 8.7 9.9 11.2 76.0 14.1 18.9
13 Ending Fund Balance - - - - - - - - - -
Debt Service Coverage: Coverage A (Line 4/Line 5) 1.20 1.20 1.20 1.20 1.20 1.20 1.20 1.57 1.20 1.20 Coverage B (Line 4/(Line 8 + Line 11)) 1.07 1.07 1.08 1.08 1.08 1.08 1.08 1.42 1.09 1.10
Airport Revenue Bonds1 Fund Balance - - - - - - 10.2 42.6 61.4 55.1 2 Project Revenues 148.0 146.5 168.4 183.3 185.1 200.8 211.3 250.5 255.3 246.9 3 Passenger Facility Charges - 16.8 31.2 32.8 32.9 32.6 32.9 32.9 32.9 33.1
4 Total Fund Balance and Revenue 148.0 163.3 199.6 216.1 218.0 233.4 254.4 326.0 349.6 335.1
5 Net Operating Expenses 59.6 56.3 67.0 71.9 71.3 77.2 87.1 99.8 99.5 102.9 6 Interdepartmental Charges 36.0 39.7 46.1 52.2 57.6 57.9 70.6 89.1 89.0 80.7
7 Total Expenses 95.6 96.0 113.1 124.1 128.9 135.1 157.7 188.9 188.5 183.6
Available for Debt Service:8 Revenue Bonds (Line 4-Line 5) 88.4 107.0 132.6 144.2 146.7 156.2 167.3 226.2 250.1 232.2 9 All Bonds (Line 4-Line 7) 52.4 67.3 86.5 92.0 89.1 98.3 96.7 137.1 161.1 151.5
Debt Service:10 Revenue Bonds 44.8 64.1 83.2 89.7 88.1 88.1 85.5 84.4 95.6 94.3 11 General Obligation Bonds 5.7 2.0 1.4 1.0 1.1 - - - - -
12 Total Debt Service 50.5 66.1 84.6 90.7 89.2 88.1 85.5 84.4 95.6 94.3
Debt Service Coverage: Revenue Bonds Only - Test "A" (Line 8/Line 10) 1.97 1.67 1.59 1.61 1.67 1.77 1.96 2.68 2.62 2.46 Total Debt Service - Test "B" (Line 9/Line 12) 1.04 1.02 1.02 1.01 1.00 1.12 1.13 1.62 1.69 1.61
Note:
The rate covenant of the Aviation issues permit inclusion of Fund Balance at the beginning of the period with project revenues for the period to determine adequacy of coverage.
Coverage "A" requires that Net Revenues equal at least 120% of the Debt Service Requirements while Coverage "B" requires that Net Revenues equal at least 100% of the Debt
Service Requirements plus Required Capital Account Transfers. Test "A" requires that Project Resources be equal to Net Operating Expenses plus 150% of Revenue
Bond Debt Service for the year. Test "B" requires Project Resources be equal to Operating Expenses for the year plus all debt service requirements for the year except
any General Obligation Debt Service not applicable to the project.
Amounts in the above statement have been extracted from reports submitted to the respective Fiscal Agents in accordance with the reporting requirements of the General
Ordinance and Supplemental Ordinance relative to rate covenants. Water and Sewer Coverage is calculated on the modified accrual basis; Aviation Fund
on the accrual basis. Prior to FY2008 Airport Revenues and Expenses were reduced by amounts applicable to the Outside Terminal Area and the Overseas Terminal as
prescribed by the indenture.
Amounts in millions of USD
Table 16
176
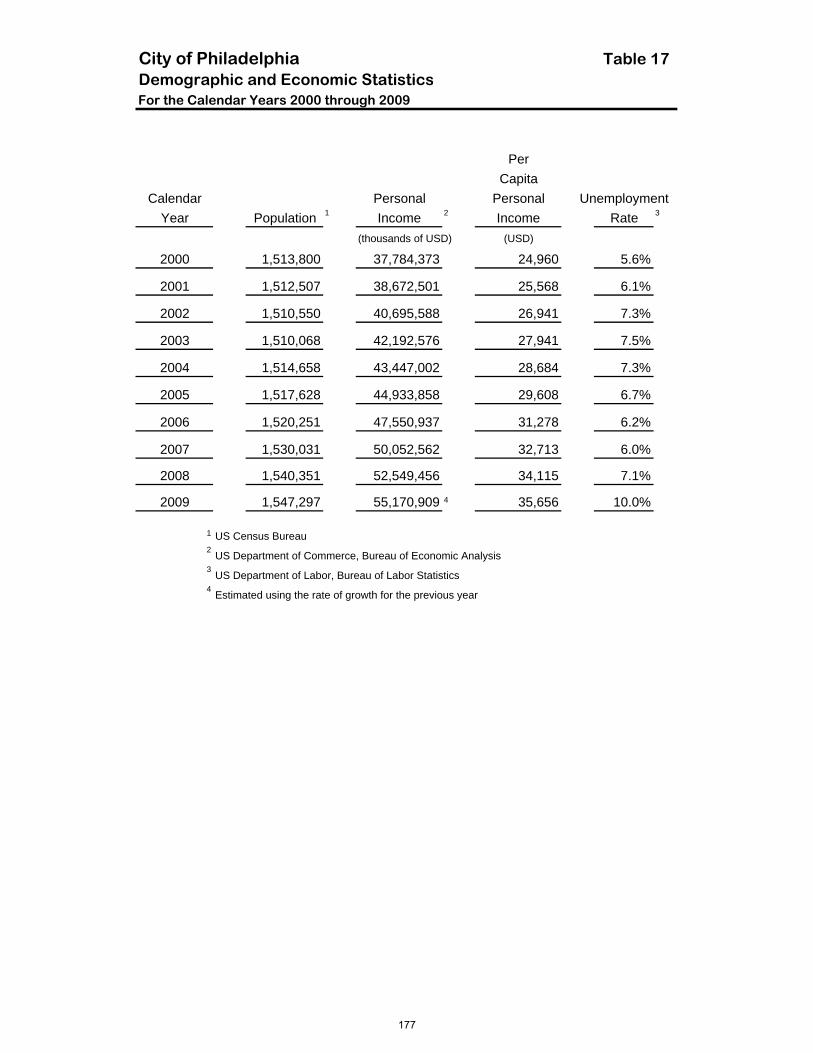
City of Philadelphia Table 17Demographic and Economic StatisticsFor the Calendar Years 2000 through 2009
Per
Capita
Calendar Personal Personal Unemployment
Year Population 1 Income 2 Income Rate 3
(thousands of USD) (USD)
2000 1,513,800 37,784,373 24,960 5.6%
2001 1,512,507 38,672,501 25,568 6.1%
2002 1,510,550 40,695,588 26,941 7.3%
2003 1,510,068 42,192,576 27,941 7.5%
2004 1,514,658 43,447,002 28,684 7.3%
2005 1,517,628 44,933,858 29,608 6.7%
2006 1,520,251 47,550,937 31,278 6.2%
2007 1,530,031 50,052,562 32,713 6.0%
2008 1,540,351 52,549,456 34,115 7.1%
2009 1,547,297 55,170,909 4 35,656 10.0%
1 US Census Bureau2
US Department of Commerce, Bureau of Economic Analysis3
US Department of Labor, Bureau of Labor Statistics4
Estimated using the rate of growth for the previous year
177
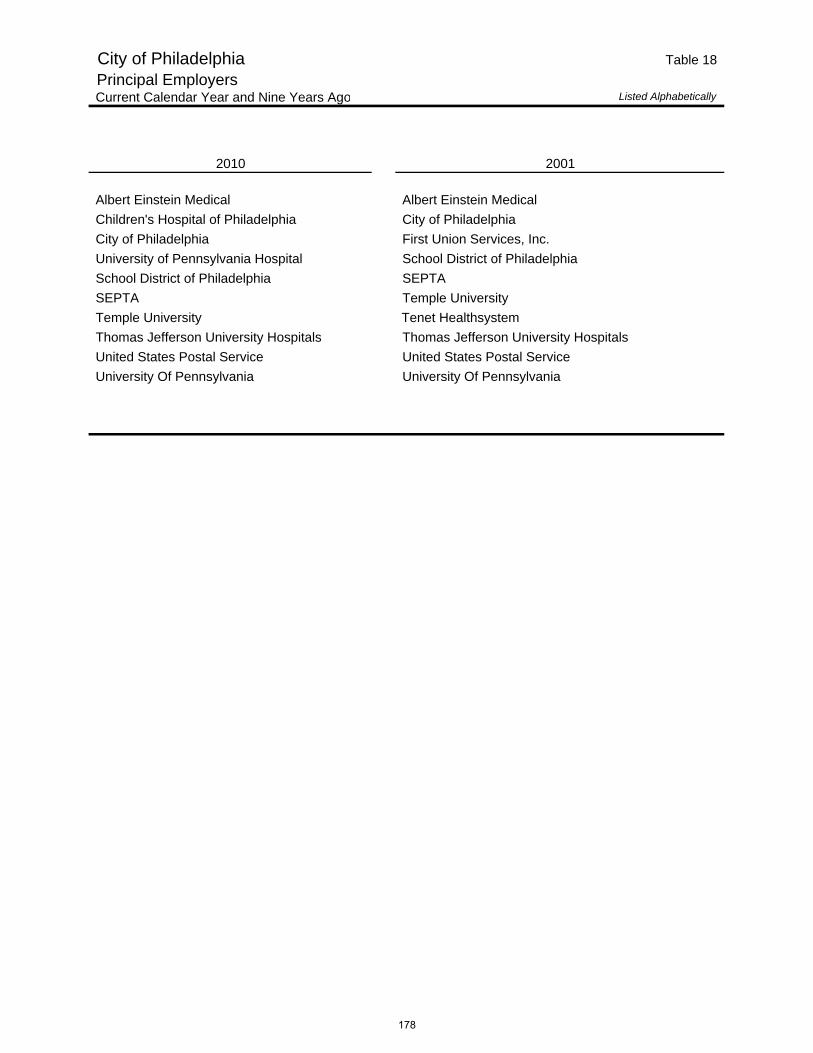
City of Philadelphia Table 18
Principal EmployersCurrent Calendar Year and Nine Years Ago Listed Alphabetically
2010 2001
Albert Einstein Medical Albert Einstein Medical
Children's Hospital of Philadelphia City of Philadelphia
City of Philadelphia First Union Services, Inc.
University of Pennsylvania Hospital School District of Philadelphia
School District of Philadelphia SEPTA
SEPTA Temple University
Temple University Tenet Healthsystem
Thomas Jefferson University Hospitals Thomas Jefferson University Hospitals
United States Postal Service United States Postal Service
University Of Pennsylvania University Of Pennsylvania
178
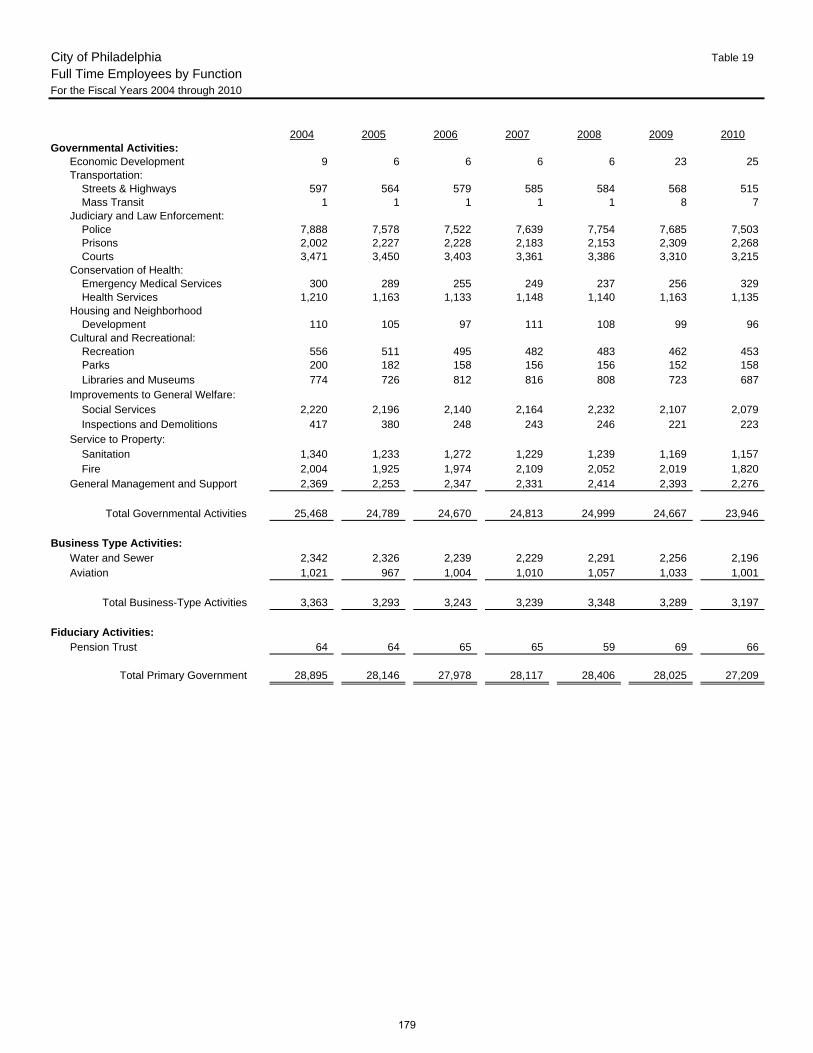
City of Philadelphia Table 19
Full Time Employees by FunctionFor the Fiscal Years 2004 through 2010
2004 2005 2006 2007 2008 2009 2010Governmental Activities:
Economic Development 9 6 6 6 6 23 25 Transportation:
Streets & Highways 597 564 579 585 584 568 515 Mass Transit 1 1 1 1 1 8 7
Judiciary and Law Enforcement:Police 7,888 7,578 7,522 7,639 7,754 7,685 7,503 Prisons 2,002 2,227 2,228 2,183 2,153 2,309 2,268 Courts 3,471 3,450 3,403 3,361 3,386 3,310 3,215
Conservation of Health:Emergency Medical Services 300 289 255 249 237 256 329 Health Services 1,210 1,163 1,133 1,148 1,140 1,163 1,135
Housing and NeighborhoodDevelopment 110 105 97 111 108 99 96
Cultural and Recreational:Recreation 556 511 495 482 483 462 453 Parks 200 182 158 156 156 152 158 Libraries and Museums 774 726 812 816 808 723 687
Improvements to General Welfare:Social Services 2,220 2,196 2,140 2,164 2,232 2,107 2,079 Inspections and Demolitions 417 380 248 243 246 221 223
Service to Property:Sanitation 1,340 1,233 1,272 1,229 1,239 1,169 1,157 Fire 2,004 1,925 1,974 2,109 2,052 2,019 1,820
General Management and Support 2,369 2,253 2,347 2,331 2,414 2,393 2,276
Total Governmental Activities 25,468 24,789 24,670 24,813 24,999 24,667 23,946
Business Type Activities:Water and Sewer 2,342 2,326 2,239 2,229 2,291 2,256 2,196 Aviation 1,021 967 1,004 1,010 1,057 1,033 1,001
Total Business-Type Activities 3,363 3,293 3,243 3,239 3,348 3,289 3,197
Fiduciary Activities:Pension Trust 64 64 65 65 59 69 66
Total Primary Government 28,895 28,146 27,978 28,117 28,406 28,025 27,209
179
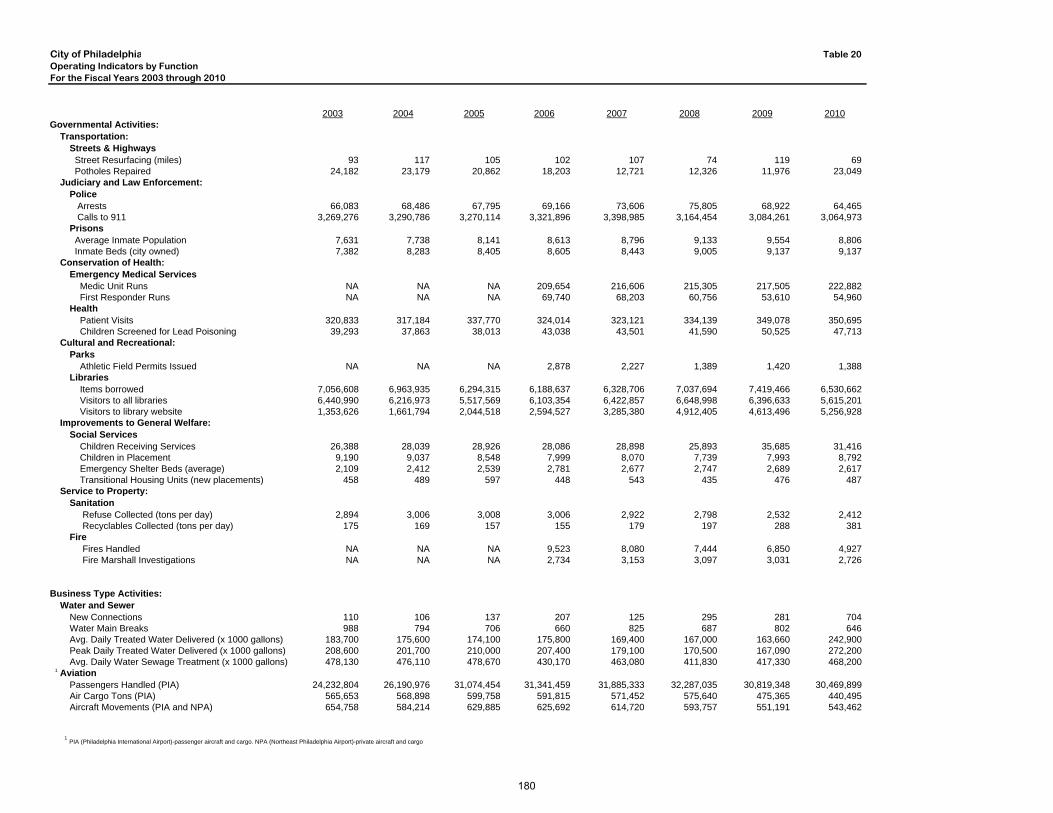
City of Philadelphia Table 20Operating Indicators by FunctionFor the Fiscal Years 2003 through 2010
2003 2004 2005 2006 2007 2008 2009 2010Governmental Activities:
Transportation:Streets & Highways Street Resurfacing (miles) 93 117 105 102 107 74 119 69 Potholes Repaired 24,182 23,179 20,862 18,203 12,721 12,326 11,976 23,049
Judiciary and Law Enforcement:Police Arrests 66,083 68,486 67,795 69,166 73,606 75,805 68,922 64,465 Calls to 911 3,269,276 3,290,786 3,270,114 3,321,896 3,398,985 3,164,454 3,084,261 3,064,973 Prisons Average Inmate Population 7,631 7,738 8,141 8,613 8,796 9,133 9,554 8,806 Inmate Beds (city owned) 7,382 8,283 8,405 8,605 8,443 9,005 9,137 9,137
Conservation of Health:Emergency Medical Services Medic Unit Runs NA NA NA 209,654 216,606 215,305 217,505 222,882 First Responder Runs NA NA NA 69,740 68,203 60,756 53,610 54,960 Health Patient Visits 320,833 317,184 337,770 324,014 323,121 334,139 349,078 350,695 Children Screened for Lead Poisoning 39,293 37,863 38,013 43,038 43,501 41,590 50,525 47,713
Cultural and Recreational:Parks Athletic Field Permits Issued NA NA NA 2,878 2,227 1,389 1,420 1,388 Libraries Items borrowed 7,056,608 6,963,935 6,294,315 6,188,637 6,328,706 7,037,694 7,419,466 6,530,662 Visitors to all libraries 6,440,990 6,216,973 5,517,569 6,103,354 6,422,857 6,648,998 6,396,633 5,615,201 Visitors to library website 1,353,626 1,661,794 2,044,518 2,594,527 3,285,380 4,912,405 4,613,496 5,256,928
Improvements to General Welfare:Social Services Children Receiving Services 26,388 28,039 28,926 28,086 28,898 25,893 35,685 31,416 Children in Placement 9,190 9,037 8,548 7,999 8,070 7,739 7,993 8,792 Emergency Shelter Beds (average) 2,109 2,412 2,539 2,781 2,677 2,747 2,689 2,617 Transitional Housing Units (new placements) 458 489 597 448 543 435 476 487
Service to Property:Sanitation Refuse Collected (tons per day) 2,894 3,006 3,008 3,006 2,922 2,798 2,532 2,412 Recyclables Collected (tons per day) 175 169 157 155 179 197 288 381 Fire Fires Handled NA NA NA 9,523 8,080 7,444 6,850 4,927 Fire Marshall Investigations NA NA NA 2,734 3,153 3,097 3,031 2,726
Business Type Activities:Water and Sewer
New Connections 110 106 137 207 125 295 281 704 Water Main Breaks 988 794 706 660 825 687 802 646 Avg. Daily Treated Water Delivered (x 1000 gallons) 183,700 175,600 174,100 175,800 169,400 167,000 163,660 242,900 Peak Daily Treated Water Delivered (x 1000 gallons) 208,600 201,700 210,000 207,400 179,100 170,500 167,090 272,200 Avg. Daily Water Sewage Treatment (x 1000 gallons) 478,130 476,110 478,670 430,170 463,080 411,830 417,330 468,200
1 AviationPassengers Handled (PIA) 24,232,804 26,190,976 31,074,454 31,341,459 31,885,333 32,287,035 30,819,348 30,469,899 Air Cargo Tons (PIA) 565,653 568,898 599,758 591,815 571,452 575,640 475,365 440,495 Aircraft Movements (PIA and NPA) 654,758 584,214 629,885 625,692 614,720 593,757 551,191 543,462
1PIA (Philadelphia International Airport)-passenger aircraft and cargo. NPA (Northeast Philadelphia Airport)-private aircraft and cargo
180
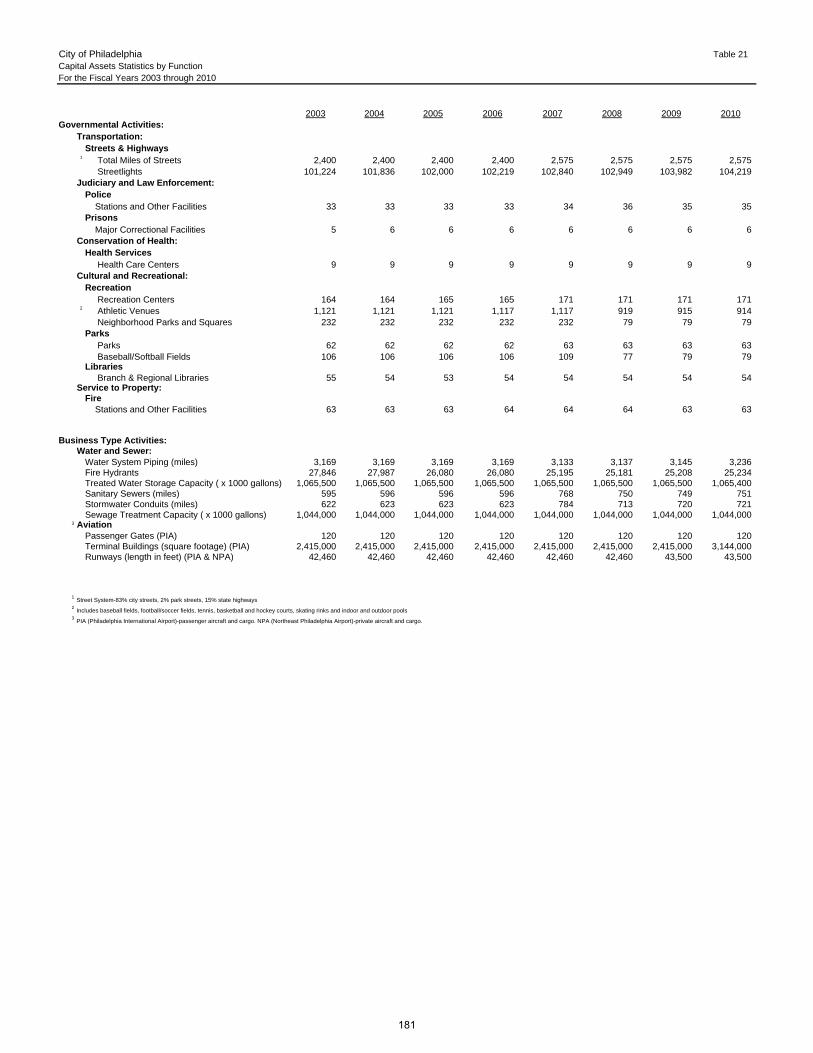
City of Philadelphia Table 21Capital Assets Statistics by FunctionFor the Fiscal Years 2003 through 2010
2003 2004 2005 2006 2007 2008 2009 2010Governmental Activities:
Transportation:Streets & Highways
1 Total Miles of Streets 2,400 2,400 2,400 2,400 2,575 2,575 2,575 2,575 Streetlights 101,224 101,836 102,000 102,219 102,840 102,949 103,982 104,219
Judiciary and Law Enforcement:Police Stations and Other Facilities 33 33 33 33 34 36 35 35 Prisons Major Correctional Facilities 5 6 6 6 6 6 6 6
Conservation of Health:Health Services Health Care Centers 9 9 9 9 9 9 9 9
Cultural and Recreational:Recreation Recreation Centers 164 164 165 165 171 171 171 171
2 Athletic Venues 1,121 1,121 1,121 1,117 1,117 919 915 914 Neighborhood Parks and Squares 232 232 232 232 232 79 79 79 Parks Parks 62 62 62 62 63 63 63 63 Baseball/Softball Fields 106 106 106 106 109 77 79 79 Libraries Branch & Regional Libraries 55 54 53 54 54 54 54 54
Service to Property:Fire Stations and Other Facilities 63 63 63 64 64 64 63 63
Business Type Activities:Water and Sewer:
Water System Piping (miles) 3,169 3,169 3,169 3,169 3,133 3,137 3,145 3,236 Fire Hydrants 27,846 27,987 26,080 26,080 25,195 25,181 25,208 25,234 Treated Water Storage Capacity ( x 1000 gallons) 1,065,500 1,065,500 1,065,500 1,065,500 1,065,500 1,065,500 1,065,500 1,065,400Sanitary Sewers (miles) 595 596 596 596 768 750 749 751 Stormwater Conduits (miles) 622 623 623 623 784 713 720 721 Sewage Treatment Capacity ( x 1000 gallons) 1,044,000 1,044,000 1,044,000 1,044,000 1,044,000 1,044,000 1,044,000 1,044,000
3 AviationPassenger Gates (PIA) 120 120 120 120 120 120 120 120 Terminal Buildings (square footage) (PIA) 2,415,000 2,415,000 2,415,000 2,415,000 2,415,000 2,415,000 2,415,000 3,144,000Runways (length in feet) (PIA & NPA) 42,460 42,460 42,460 42,460 42,460 42,460 43,500 43,500
1Street System-83% city streets, 2% park streets, 15% state highways
2Includes baseball fields, football/soccer fields, tennis, basketball and hockey courts, skating rinks and indoor and outdoor pools
3PIA (Philadelphia International Airport)-passenger aircraft and cargo. NPA (Northeast Philadelphia Airport)-private aircraft and cargo.
181

Office of the Director of Finance • 1330 MSB • Philadelphia, PA 19102
182

APPENDIX C-1
Form of 2009 Co-Bond Counsel Opinion

[ THIS PAGE INTENTIONALLY LEFT BLANK ]
APPENDIX C-1
BELOW IS THE FORM OF OPINION OF CO-BOND COUNSEL DELIVERED IN CONNECTION WITH THE ISSUANCE OF
THE 2009B BONDS
August 13, 2009
RE: $100,000,000 The City of Philadelphia, Pennsylvania General Obligation Multi-Modal Refunding Bonds, Series 2009B
TO THE PURCHASERS OF THE SERIES 2009B BONDS:
We have served as Co-Bond Counsel to The City of Philadelphia, Pennsylvania (the “City”) in connection with the issuance of its $100,000,000 General Obligation Multi-Modal Refunding Bonds, Series 2009B (the “Series 2009B Bonds”). The Series 2009B Bonds are issued under and pursuant to (i) the Constitution of the Commonwealth of Pennsylvania (the “Commonwealth”), (ii) the Act of the General Assembly of the Commonwealth, approved June 25, 1919, P.L. 581, as amended, and the Act of the General Assembly of the Commonwealth of Pennsylvania of June 11, 1941, P.L. 113, as amended by the Act of the General Assembly of the Commonwealth of Pennsylvania of December 8, 1985, P.L. 324 (together, the “Act”), (iii) an Ordinance (Bill No. 090324) of the Council of the City, approved by the Mayor on June 15, 2009 (the “Ordinance”); and (iv) a Resolution of the Bond Committee established by the Ordinance adopted July 28, 2009, with respect to the Series 2009B Bonds (the “Bond Committee Resolution”). Capitalized terms used herein but not defined shall have the meanings set forth in the Bond Committee Resolution.
The Series 2009B Bonds will bear interest initially in the Weekly Mode as shown in the official statement (the “Official Statement”) prepared for the Series 2009B Bonds, subject to conversion to other Modes. The Series 2009B Bonds will be issued only as fully registered bonds, initially in denominations of $100,000 and any integral multiples of $5,000 in excess thereof. The Series 2009B Bonds are subject to optional and mandatory redemption prior to maturity and to optional and mandatory tender as more fully described in the Official Statement.
The Series 2009B Bonds are being issued by the City to finance a portion of the current refunding of its General Obligation Multi-Modal Refunding Bonds, Series 2007B (the “Series 2007B Bonds”) and to pay costs of issuance of the Series 2009 Bonds.
We have examined the proceedings relating to the authorization and issuance of the Series 2009B Bonds, including, among other things: (a) the Constitution of the Commonwealth and the Act; (b) certified copies of the Ordinance and the Bond Committee Resolution; (c) executed copies of the Initial Reimbursement Agreement and the Letter of Credit; (d) certificates executed by the City and its Fiscal Agent for the Series 2009B Bonds as to the execution and authentication of the Series 2009B Bonds; (e) various other certificates executed by the City, including a certificate with regard to Sections 103 and 141 through 150 of the Internal Revenue Code of 1986, as amended (the “Code”); and (f) the Form 8038-G of the City with respect to the Series 2009B Bonds. We have also examined a fully executed and authenticated Series 2009B Bond and we assume all other Series 2009B Bonds are in such form and are similarly executed and authenticated. In rendering our opinion, we have not undertaken to verify the factual matters set forth in such certificates by independent investigation and have relied on the covenants, warranties and representations made by the City in such certificates and in the Ordinance and other financing documents.
We have also relied, in the opinions set forth below, upon the opinion of the City Solicitor with respect to the absence of any challenge to the corporate existence of the City, the incumbency of officers
C-2
of the City and their entitlement to their offices, and other matters incident to, inter alia, the execution and delivery by the City of the Series 2009B Bonds and such other documentation as the City, and its officials were required to execute and deliver in connection with the issuance of the Series 2009B Bonds.
From our examination of the foregoing and such other items as we deem relevant, we are of the opinion that:
1. The City is authorized under the provisions of the Constitution and laws of the Commonwealth to issue the Series 2009B Bonds for the purposes therein set forth.
2. The Series 2009B Bonds have been duly authorized, executed and delivered by the City and constitute valid and binding general obligations of the City, enforceable against the City in accordance with the terms thereof, except as enforcement may be limited by bankruptcy, insolvency, moratorium and other similar laws and equitable principles affecting creditors' rights and remedies generally, and by the exercise of judicial discretion in accordance with general principles of equity.
3. The full faith, credit and taxing power of the City are pledged for the payment of the principal of and interest due on the Series 2009B Bonds, and the City has effectively covenanted in the Ordinance that it will make payments from the City’s sinking fund established for the Series 2009 Bonds or any of the City’s general revenues or funds at such times and in such annual amounts as shall be sufficient for the payment of all principal of and interest on the Series 2009B Bonds when due.
4. Under existing laws of the Commonwealth, the interest on the Series 2009B Bonds is free from Pennsylvania personal income taxation and Pennsylvania corporate net income taxation, but such exemption does not extend to gift, estate, succession or inheritance taxes or any other taxes not levied or assessed directly on the Series 2009B Bonds or the interest thereon.
5. Interest on the Series 2009B Bonds is excluded from gross income for purposes of federal income taxation under existing statutes, regulations, rulings and court decisions. The opinion set forth in the preceding sentence is subject to the condition that the City comply with all applicable federal income tax law requirements that must be satisfied subsequent to the issuance of the Series 2009B Bonds in order that interest thereon continues to be excluded from gross income for purposes of federal income taxation. Failure to comply with all of such requirements could cause the interest on the Series 2009B Bonds to be includable in gross income retroactive to the date of issuance of the Series 2009B Bonds. The City has covenanted to comply with all such requirements. Interest on the Series 2009B Bonds is not treated as an item of tax preference under Section 57 of the Code for purposes of the individual and corporate alternative minimum taxes and is not included in adjusted current earnings under Section 56(g) of the Code when calculating corporate alternative minimum taxable income. We express no opinion regarding other federal tax consequences relating to the Series 2009B Bonds or the receipt of interest thereon.
We express no opinion herein on the adequacy, completeness or accuracy of any official statement, placement memorandum or other disclosure document pertaining to the offering of the Series 2009B Bonds.
This opinion is given as of the date hereof and we express no opinion as to any matter not set forth in the numbered paragraphs herein. We assume no obligation to update or supplement this opinion to reflect any facts or circumstances which may hereafter come to our attention or any changes in law which may hereafter occur.
Very truly yours,

APPENDIX C-2
Proposed Form of 2011 Co-Bond Counsel Opinion

[ THIS PAGE INTENTIONALLY LEFT BLANK ]
APPENDIX C-2
BELOW IS THE PROPOSED FORM OF OPINION OF 2011 CO-BOND COUNSEL EXPECTED TO BE DELIVERED IN CONNECTION WITH THE SUBSTITUTION OF
THE LETTER OF CREDIT
August 4, 2011
City of Philadelphia City Treasurer’s Office 1401 John F. Kennedy Blvd., Suite 640 Philadelphia, PA 19102
U.S. Bank National Association, as Fiscal Agent 123 S. Broad Street Philadelphia, PA 19109
Royal Bank of Canada Three World Financial Center, 200 Vesey Street New York, NY 10281-8098
RBC Capital Markets, LLC One Logan Square, 17th Floor Philadelphia, PA 19103
RE: $100,000,000 The City of Philadelphia, Pennsylvania
General Obligation Multi-Modal Refunding Bonds, Series 2009B
Ladies and Gentlemen:
We have served as Co-Bond Counsel to The City of Philadelphia, Pennsylvania (the “City”) in connection with the letter of credit substitution on the date hereof relating to its $100,000,000 General Obligation Multi-Modal Refunding Bonds, Series 2009B (the “Series 2009B Bonds”). The Series 2009B Bonds were issued under and pursuant to (i) the Constitution of the Commonwealth of Pennsylvania (the “Commonwealth”), (ii) the Act of the General Assembly of the Commonwealth, approved June 25, 1919, P.L. 581, as amended, and the Act of the General Assembly of the Commonwealth of June 11, 1941, P.L. 113, as amended by the Act of the General Assembly of the Commonwealth of December 8, 1985, P.L. 324 (together, the “Act”), (iii) an Ordinance (Bill No. 090324) of the Council of the City, approved by the Mayor on June 15, 2009 (the “Ordinance”); and (iv) a Resolution of the Bond Committee established by the Ordinance adopted July 28, 2009, with respect to the Series 2009B Bonds (the “2009 Bond Committee Resolution”). The letter of credit substitution and related matters were approved by a Resolution of the Bond Committee established by the Ordinance on July 27, 2011 (the “2011 Bond Committee Resolution“). Capitalized terms used herein but not defined shall have the meanings set forth in the 2009 Bond Committee Resolution.
The existing Letter of Credit securing the Series 2009B Bonds will be replaced on the date hereof with an Alternate Credit Facility and an Alternate Liquidity Facility in the form of a letter of credit (the “Substitute Letter of Credit”) issued by Royal Bank of Canada (the “Bank”). Section 2.08(d) of Exhibit C to the 2009 Bond Committee Resolution requires that the City deliver a Favorable Opinion of Bond Counsel with respect to the delivery of the Substitute Letter of Credit.
We have examined certain of the proceedings relating to the authorization and issuance of the Series 2009B Bonds, including, among other things: (a) the Constitution of the Commonwealth and the Act; (b) certified copies of the Ordinance, the 2009 Bond Committee Resolution and the 2011 Bond Committee Resolution; (c) the Substitute Letter of Credit; (d) the Tax Certificate executed by the City in connection with the issuance of the Series 2009B Bonds; (e) rating letters from each of Standard & Poor’s Rating Group and Moody’s Investors Service as to the ratings on the Series 2009B Bonds following the issuance of the Substitute Letter of Credit and its substitution for the existing Letter of Credit; and (f) the remainder of the proceedings related to the issuance of the Substitute Letter of Credit and its substitution
C-2-2
for the existing Letter of Credit. We also have examined such other documents as we have deemed necessary or appropriate as a basis for the opinions set forth herein.
In rendering our opinion, we have not undertaken to verify the factual matters set forth in such proceedings by independent investigation and have relied on the covenants, warranties and representations made by the City and the Bank in such proceedings. We have assumed the genuineness of all signatures, the competency of all individuals, the authenticity of all documents submitted to us as originals and the conformity with originals of all documents submitted to us as copies or telecopies.
From our examination of the foregoing and such other items as we deem relevant, we are of the opinion that:
1. The replacement of the existing Letter of Credit with the Substitute Letter of Credit is authorized or permitted by the Ordinance and the 2009 Bond Committee Resolution.
2. While we express no opinion herein on whether interest on the Series 2009B Bonds is excludable from gross income for federal income tax purposes under Section 103 of the Internal Revenue Code of 1986, as amended (the “Code”), but assuming that it is so excludable, the replacement of the existing Letter of Credit with the Substitute Letter of Credit, in and of itself, will not adversely affect the exclusion from gross income for federal income tax purposes of interest on any Series 2009B Bonds under Section 103 of the Code.
We express no opinion herein on the adequacy, completeness or accuracy of any remarketing memorandum or other disclosure document pertaining to any remarketing of the Series 2009B Bonds.
We have made no inquiry as to whether any events have occurred or circumstances have arisen (other than replacement of the existing Letter of Credit with the Substitute Letter of Credit) since issuance of the Series 2009B Bonds which could adversely affect the excludability from gross income for federal income tax purposes of interest on the Series 2009B Bonds under Section 103 of the Code.
This opinion is given as of the date hereof and we express no opinion as to any matter not set forth in the numbered paragraphs herein. We assume no obligation to update or supplement this opinion to reflect any facts or circumstances which may hereafter come to our attention or any changes in law which may hereafter occur. We express no opinion as to the law of any jurisdiction other than the Commonwealth of Pennsylvania and the federal tax law of the United States.
Very truly yours,

APPENDIX D
Form of Continuing Disclosure Agreement

[ THIS PAGE INTENTIONALLY LEFT BLANK ]
CONTINUING DISCLOSURE AGREEMENT
CITY OF PHILADELPHIA, PENNSYLVANIA GENERAL OBLIGATION MULTI-MODAL REFUNDING BONDS,
SERIES 2009B
This Continuing Disclosure Agreement (“Disclosure Agreement”) dated as of August 4, 2011, is executed and delivered by and between The City of Philadelphia, Pennsylvania (“City’’) and Digital Assurance Certification, L.L.C., as dissemination agent (“Dissemination Agent”), in connection with the City’s $100,000,000 aggregate principal amount of General Obligation Multi-Modal Refunding Bonds, Series 2009B (the “2009B Bonds”), which are being tendered and remarketed in connection with the substitution of the letter of credit originally securing the 2009B Bonds.
In consideration of the mutual covenants, promises and agreements contained herein and intending to be legally bound hereby, the parties hereto agree as follows:
Section 1: Definitions
In this Disclosure Agreement and any agreement supplemental hereto (except as otherwise expressly provided for unless the context clearly otherwise requires) terms defined in the recitals hereto shall have such meanings throughout this Disclosure Agreement, and, in addition, the following terms shall have the meanings specified below:
“Annual Financial Information” shall mean the financial information or operating data with respect to the City, delivered at least annually pursuant to Section 3 hereof, substantially similar to the type set forth in Appendix A attached hereto and made a part hereof, and in accordance with the Rule (as hereafter defined). The financial statements comprising the Annual Financial Information are prepared according to accounting methods and procedures which conform to generally accepted accounting principles for governmental units as prescribed by the Government Accounting Standards Board.
“Business Day” or “Business Days” shall mean any day other than a Saturday or Sunday or, in the City, a legal holiday or a day on which banking institutions are authorized by law to close or a day on which the Dissemination Agent is closed.
“Disclosure Representative” shall mean the Director of Finance of the City, the City Treasurer or such other official or employee of the City as the Director of Finance or the City Treasurer shall designate in writing to the Dissemination Agent.
“EMMA” means the Electronic Municipal Market Access System operated by the MSRB.
“Fiscal Agent” shall mean U.S. Bank National Association.
“Material Event” shall mean any of the events listed in Section 4(a) of this Disclosure Agreement.
“MSRB” means the Municipal Securities Rulemaking Board.
“Participating Underwriters” shall mean any of the original underwriters of the 2009B Bonds required to comply with the Rule in connection with their purchase and reoffering of the 2009B Bonds, and, to the extent required to comply with the Rule in connection with the remarketing of the 2009B Bonds, the Remarketing Agent.
2
“Registered Owner” or “Registered Owners” shall mean the person or persons in whose name a 2009B Bond is registered on the books of the City maintained by the Fiscal Agent in accordance with the Bond Committee Resolution. For so long as the 2009B Bonds shall be registered in the name of the Securities Depository or its nominee, the term “Registered Owner” or “Registered Owners” shall also mean and include, for the purposes of this Disclosure Agreement, the owners of book-entry credits in the 2009B Bonds evidencing an interest in the 2009B Bonds; provided, however, that the Dissemination Agent shall have no obligation to provide notice hereunder to owners of book-entry credits in the 2009B Bonds except those who have filed their names and addresses with the Dissemination Agent for the purposes of receiving notices or giving direction under this Disclosure Agreement.
“Remarketing Agent” shall mean RBC Capital Markets, LLC or any other successor entity acting as remarketing agent for the 2009B Bonds.
“Remarketing Memorandum” shall mean the Remarketing Memorandum dated July 27, 2011, relating to the 2009B Bonds.
“Rule” shall mean Rule 15c2-12(b)(5) promulgated by the Securities and Exchange Commission under the Securities Exchange Act of 1934, as amended, as such Rule may be amended from time to time.
“Securities Depository” shall mean The Depository Trust Company, New York, New York, or its nominee, Cede & Co., or successor thereto appointed pursuant to the Bond Committee Resolution.
All words and terms used in this Disclosure Agreement and not defined above or elsewhere herein shall have the same meanings as set forth in the Bond Committee Resolution.
Section 2: Authorization and Purpose of Disclosure Agreement
This Disclosure Agreement is authorized to be executed and delivered by the City in order to assist the Remarketing Agent in complying with the requirements of the Rule.
Section 3: Annual Financial Information
a) Within 240 days of the close of each fiscal year of the City, commencing with the fiscal year ending June 30, 2011, the Disclosure Representative shall file with the Dissemination Agent, Annual Financial Information for such fiscal year. The Dissemination Agent shall promptly upon receipt thereof file the Annual Financial Information with the MSRB. The Annual Financial Information will be in the form of the City’s Comprehensive Annual Financial Report and will contain unaudited financial statements if audited financial statements are not available.
b) As soon as audited financial statements for the City are available, commencing with the audited financial statements for the fiscal year ending June 30, 2011, the Disclosure Representative shall file the audited financial statements with the Dissemination Agent. The Dissemination Agent shall promptly upon receipt thereof file the audited financial statements with the MSRB.
Section 4: Material Events
a) The City agrees that it shall provide through the Dissemination Agent, in a timely manner not in excess of ten business days after the occurrence of the event, to the MSRB, notice of any of the following events with respect to the 2009B Bonds (each a “Material Event”):
3
(i) Principal and interest payment delinquencies;
(ii) Non-payment related defaults, if material;
(iii) Unscheduled draws on debt service reserves reflecting financial difficulties;
(iv) Unscheduled draws on credit enhancements reflecting financial difficulties;
(v) Substitution of credit or liquidity providers or their failure to perform;
(vi) Adverse tax opinions, the issuance by the Internal Revenue Service of proposed or final determinations of taxability, Notices of Proposed Issue (IRS Form 5701–TEB) or other material notices or determinations with respect to the tax status of the 2009B Bonds, or other material events affecting the tax status of the 2009B Bonds;
(vii) Modifications to the rights of holders of the 2009B Bonds, if material;
(viii) Calls of the 2009B Bonds, if material, and tender offers;
(ix) Defeasances;
(x) Release, substitution or sale of property securing repayment of the 2009B Bonds, if material;
(xi) Rating changes;
(xii) Bankruptcy, insolvency, receivership or similar event of the City;
(xiii) The consummation of a merger, consolidation, or acquisition involving the City or the sale of all or substantially all of the assets of the City, other than in the ordinary course of business, the entry into a definitive agreement to undertake such an action or the termination of a definitive agreement relating to any such actions, other than pursuant to its terms, if material; and
(xiv) Appointment of a successor or additional trustee or the change of name of a trustee, if material.
The foregoing fourteen (14) events are quoted from the Rule. No mandatory redemption shall be deemed a Material Event.
b) Whenever the City concludes that a Material Event has occurred, the Disclosure Representative shall promptly notify the Dissemination Agent in writing of such occurrence, specifying the Material Event. Such notice shall instruct the Dissemination Agent to file a notice of such occurrence with the MSRB. Upon receipt, the Dissemination Agent shall promptly file such notice with the MSRB. In addition, the Dissemination Agent shall promptly file with the MSRB, notice of any failure by the City or the Dissemination Agent to timely file the Annual Financial Information as provided in Section 3 hereof, including any failure by the City or the Dissemination Agent to provide the Annual Financial Information on or before the date specified in Section 3(a) hereof.
c) Notwithstanding the foregoing, the Dissemination Agent shall, promptly after obtaining actual knowledge of an event listed in clauses (a)(i), (iv), (viii), (ix) notify the Disclosure Representative of the occurrence of such event and shall, within five (5) Business Days of giving notice to the Disclosure Representative, file notice of such occurrence with the MSRB, unless the Disclosure Representative gives the Dissemination Agent written instructions not to file such notice because the event has not occurred or the event is not a Material Event within the meaning of the Rule.
4
d) The Dissemination Agent shall prepare an affidavit of filing for each notice delivered pursuant to clauses (b) and (c) of this Section 4 and shall deliver such affidavit to the City no later than three (3) Business Days following the date of delivery of such notice.
e) Upon the return of any completed acknowledgment of a filing, the Dissemination Agent shall prepare an affidavit of receipt specifying the date and hour of receipt of such notice by each recipient to the extent such information has been provided to the Dissemination Agent. Such affidavit of receipt shall be delivered to the City no later than three (3) Business Days following the date of receipt by the Dissemination Agent of the last completed acknowledgment.
f) For the purposes of the event identified in clause (a)(xii) of this section, the event is considered to occur when any of the following occur: The appointment of a receiver, fiscal agent or similar officer for the City in a proceeding under the U.S. Bankruptcy Code or in any other proceeding under state or federal law in which a court or governmental authority has assumed jurisdiction over substantially all of the assets or business of the City, or if such jurisdiction has been assumed by leaving the existing governing body and officials or officers in possession but subject to the supervision and orders of a court or governmental authority, or the entry of an order confirming a plan of reorganization, arrangement or liquidation by a court or governmental authority having supervision or jurisdiction over substantially all of the assets or business of the City.
Section 5: Amendment; Waiver
a) Notwithstanding any other provision of this Disclosure Agreement, the City and the Dissemination Agent may amend the Disclosure Agreement or waive any of the provisions hereof, provided that no such amendment or waiver shall be executed by the parties hereto or effective unless:
(i) the amendment or waiver is made in writing and in connection with a change in circumstances that arises from a change in legal requirements, change in law or change in identity, nature or status of the City or the governmental operations conducted by the City;
(ii) the Disclosure Agreement, as amended by the amendment or waiver, would have been the written undertaking contemplated by the Rule at the time of original issuance of the 2009B Bonds after taking into account any amendments or interpretations of the Rule, as well as any change in circumstances; and
(iii) the amendment or waiver does not materially impair the interests of the Registered Owner of the 2009B Bonds.
b) Evidence of compliance with the conditions set forth in clause (a) of this Section 5 shall be satisfied by the delivery to the Dissemination Agent of an opinion of counsel having recognized experience and skill in the issuance of municipal securities and federal securities law, acceptable to both the City and the Dissemination Agent, to the effect that the amendment or waiver satisfies the conditions set forth in clauses (a)(i), (ii), and (iii) of this Section 5.
c) Notice of any amendment or waiver containing an explanation of the reasons therefor shall be given by the Disclosure Representative to the Dissemination Agent upon execution of the amendment or waiver and the Dissemination Agent shall promptly file such notice with the MSRB. The Dissemination Agent shall also send notice of the amendment or waiver to each Registered Owner including owners of book-entry credits in the 2009B Bonds who have filed their names and addresses with the Dissemination Agent.
5
Section 6: Other Information; Duties of Dissemination Agent
a) Nothing in this Disclosure Agreement shall preclude the City from disseminating any other information with respect to the City or the 2009B Bonds, using the means of communication provided in this Disclosure Agreement or otherwise, in addition to the Annual Financial Information and the notices of Material Events specifically provided for herein, nor shall the City be relieved of complying with any applicable law relating to the availability and inspection of public records. Any election by the City to furnish any information not specifically provided for herein in any notice given pursuant to this Disclosure Agreement or by the means of communication provided for herein shall not be deemed to be an additional contractual undertaking and the City shall have no obligation to furnish such information in any subsequent notice or by the same means of communication.
b) Nothing in this Disclosure Agreement shall relieve the Dissemination Agent of any of its duties and obligations under any other agreement or in any other capacity.
c) Except as expressly set forth in this Disclosure Agreement, the Dissemination Agent shall have no responsibility for any continuing disclosure to the Registered Owners or the MSRB.
Section 7: Default
a) In the event that the City or the Dissemination Agent fails to comply with any provision of this Disclosure Agreement, the Dissemination Agent or any Registered Owner of the 2009B Bonds shall have the right, by mandamus, suit, action or proceeding at law or in equity, to compel the City or the Dissemination Agent to perform each and every term, provision and covenant contained in this Disclosure Agreement. The Dissemination Agent shall be under no obligation to take any action in respect of any default hereunder unless it has received the direction in writing to do so by the Registered Owners of at least 25% of the outstanding principal amount of the 2009B Bonds and if, in the Dissemination Agent’s opinion, such action may tend to involve expense or liability, unless it is also furnished with indemnity and security for expenses satisfactory to it.
b) A default under the Disclosure Agreement shall not be or be deemed to be a default under the 2009B Bonds or any other agreement related thereto and the sole remedy in the event of a failure of the City or the Dissemination Agent to comply with the provisions hereof shall be the action to compel performance described in Section 7(a) above.
Section 8: Concerning the Dissemination Agent
a) The Dissemination Agent accepts and agrees to perform the duties imposed on it by this Disclosure Agreement, but only upon the terms and conditions set forth herein. The Dissemination Agent shall have only such duties in its capacity as are specifically set forth in this Disclosure Agreement. The Dissemination Agent may execute any powers hereunder and perform any duties required of it through attorneys, agents, and other experts, officers, or employees, selected by it and the written advice of such counsel or other experts shall be full and complete authorization and protection in respect of any action taken, suffered or omitted by it hereunder in good faith and in reliance thereon. The Dissemination Agent shall not be answerable for the default or misconduct of any attorney, agent, expert or employee selected by it with reasonable care. The Dissemination Agent shall not be answerable for the exercise of any discretion or power under this Disclosure Agreement or liable to the City or any other person for actions taken hereunder, except for its own willful misconduct or negligence.
b) The City shall pay the Dissemination Agent reasonable compensation for its services hereunder, and also all of its reasonable expenses and disbursements, including reasonable fees and
6
expenses of its counsel or other experts, as shall be agreed upon by the Dissemination Agent and the City. Nothing in this Section 8(b) shall be deemed to constitute a waiver of governmental immunity by the City. The provisions of this paragraph shall survive termination of this Disclosure Agreement
c) The Dissemination Agent may act on any resolution, notice, telegram, request, consent, waiver, certificate, statement, affidavit, or other paper or document which it in good faith believes to be genuine and to have been passed or signed by the proper persons or to have been prepared and furnished pursuant to any of the provisions of this Disclosure Agreement; and the Dissemination Agent shall be under no duty to make any investigation as to any statement contained in any such instrument, but may accept the same as conclusive evidence of the accuracy of such statement in the absence of actual notice to the contrary. The Dissemination Agent shall be under no obligation to institute any suit, or to take any action under this Disclosure Agreement, or to enter any appearance or in any way defend in any suit in which it may be made a defendant, or to take any steps in the execution of the duties hereby created or in the enforcement of any rights and powers hereunder, until it shall be indemnified by the Registered Owners to its satisfaction against any and all costs and expenses, outlays and counsel fees and expenses and other reasonable disbursements, and against all liability; the Dissemination Agent may, nevertheless, begin suit or appear in and defend suit, or do anything else in its judgment proper to be done by it as Dissemination Agent, without indemnity.
Section 9: Term of Disclosure Agreement
This Disclosure Agreement shall terminate (1) upon payment or provision for payment in full of the 2009B Bonds, or (2) upon repeal or rescission of Section (b)(5) of the Rule, or (3) upon a final determination that Section (b)(5) of the Rule is invalid or unenforceable.
Section 10: Beneficiaries
This Disclosure Agreement shall inure solely to the benefit of the City, the Dissemination Agent and the Registered Owners from time to time of the 2009B Bonds and nothing herein contained shall confer any right upon any other person.
Section 11: Notices
Any written notice to or demand may be served, presented or made to the persons named below and shall be sufficiently given or filed for all purposes of this Disclosure Agreement if deposited in the United States mail, first class postage prepaid, or in a recognized form of overnight mail, or by telecopy with confirmation of receipt, addressed:
(a) to the Dissemination Agent at:
Digital Assurance Certification LLC 390 North Orange Avenue, Suite 1750 Orlando, FL 32801 Attention: Jenny Emami Fax: (407) 515-6513
7
(b) to the City or the Disclosure Representative at:
City of Philadelphia Office of the Director of Finance 1330 Municipal Services Building 1401 John F. Kennedy Boulevard Philadelphia, PA 19102 Attention: Director of Finance Fax: (215) 568-1947; or
Office of the City Treasurer 640 Municipal Services Building 1401 John F. Kennedy Boulevard Philadelphia, PA 19102 Attention: City Treasurer Fax: (215) 686-3815
or such other addresses as may be designated in writing to all parties hereto.
Section 12: No Personal Recourse
No personal recourse shall be had for any claim based on this Disclosure Agreement against any member, officer, or employee, past, present or future, of the City (including without limitation the Disclosure Representative), or of any successor body as such, either directly or through the City or any such successor body, under any constitutional provision, statute or rule of law or by the enforcement of any assessment or penalty otherwise.
Section 13: Controlling Law
This Disclosure Agreement and all matters arising out of or related to this Disclosure Agreement shall be governed by and construed in accordance with the laws of the Commonwealth of Pennsylvania.
Section 14: Removal and Resignation of Dissemination Agent
a) The City may discharge the Dissemination Agent by notice in writing mailed postage prepaid to the Dissemination Agent; provided, however, that the City shall provide written notice to the Fiscal Agent upon the engagement or discharge of any Dissemination Agent, and shall provide the name, address and telephone number of any successor Dissemination Agent. The City shall cause any successor Dissemination Agent appointed hereunder and any further successors to execute and deliver an acknowledgement of acceptance of the designation and duties of Dissemination Agent. If at any time there is not any other designated Dissemination Agent, the City shall be the Dissemination Agent.
b) The Dissemination Agent may resign and thereby become discharged from its duties as such under this Disclosure Agreement by notice in writing mailed postage prepaid to the City, such resignation to become effective on the later of (i) the tenth (l0th) business day following the City’s receipt or notice thereof (or at such different date and time as stated in such notice) and (ii) the City’s appointment of a new Dissemination Agent hereunder or the City’s notice to the Dissemination Agent and the Fiscal Agent that the City has determined to act itself in such capacity.

8
Section 15: Filing with EMMA; Other Filings.
All filings with the MSRB shall be done through EMMA in an electronic format prescribed by the MSRB and accompanied by identifying data prescribed by the MSRB, or as otherwise specified by the MSRB.
In addition to filings through EMMA, the Dissemination Agent may file any of the information necessary to be filed hereunder with such other electronic filing systems and entities as are approved by the Securities and Exchange Commission (the “SEC”) by interpretative letter or “no action” letter for receipt of such information in compliance with the requirements of paragraph (b)(5) of the Rule.
Section 16: Successors and Assigns..
All of the covenants, promises and agreements contained in this Disclosure Agreement by or on behalf of the City or by or on behalf of the Dissemination Agent shall bind and inure to the benefit of their respective successors and assigns, whether so expressed or not.
Section 17: Headings for Convenience Only.
The descriptive headings in this Disclosure Agreement are inserted for convenience of reference only and shall not control or affect the meaning or construction of any of the provisions hereof.
Section 18: Counterparts
This Disclosure Agreement may be executed in any number of counterparts, each of which when so executed and delivered shall be an original, but such counterparts shall together constitute but one and the same instrument.
Section 19: Entire Agreement
This Disclosure Agreement sets forth the entire understanding and agreement of the City and the Dissemination Agent with respect to the matters herein contemplated and no modification or amendment of or supplement to this Disclosure Agreement shall be valid or effective unless the same is in writing and signed by the parties hereto.
[The remainder of this page is left blank intentionally.]
IN WITNESS WHEREOF, THE CITY OF PHILADELPHIA, PENNSYLVANIA, has caused this Disclosure Agreement to be executed by the Director of Finance and DIGITAL ASSURANCE CERTIFICATION, L.L.C., as Dissemination Agent, has caused this Disclosure Agreement to be executed by one of its authorized officers, all as of the day and year first above written.
CITY OF PHILADELPHIA, PENNSYLVANIA
By:__________________________ Name: Rob Dubow Title: Director of Finance
DIGITAL ASSURANCE CERTIFICATION, L.L.C., as Dissemination Agent
By:__________________________ Name: Title:
APPENDIX A
1. Commencing with the fiscal year ending June 30, 2011, a copy of the Comprehensive Annual Financial Report (“CAFR”), which contains the audited combined financial statements of the City, prepared by the office of the Director of Finance of the City in conformance with guidelines adopted by the Governmental Accounting Standards Board and the American Institute of Certified Public Accountants’ audit guide, Audits of State and Local Government Units; and
2. Commencing with the fiscal year ending June 30, 2011, to the extent such information is not contained in the CAFR, an update of the information in Appendix A of the Remarketing Memorandum under the captions “SUMMARY FINANCIAL INFORMATION,” “DISCUSSION OF FINANCIAL OPERATIONS,” “REVENUES OF THE CITY,” “EXPENDITURES OF THE CITY,” and “DEBT OF THE CITY.”

APPENDIX E
Certain Information Concerning the Bank

[ THIS PAGE INTENTIONALLY LEFT BLANK ]
CERTAIN INFORMATION CONCERNING THE BANK Royal Bank of Canada (the “Bank”) is a Schedule I bank under the Bank Act (Canada), which
constitutes its charter and governs its operations. The Bank’s corporate headquarters are located at Royal Bank Plaza, 200 Bay Street, Toronto, Ontario M5J 2J5, Canada, and its head office is located at 1 Place Ville Marie, Montreal, Quebec H3C 3A9, Canada. The Bank is the parent company of RBC Capital Markets, LLC, the Remarketing Agent for the 2009B Bonds.
The Bank and its subsidiaries operate under the master brand name RBC. The Bank is Canada’s
largest bank as measured by assets and market capitalization and among the largest banks in the world based on market capitalization. The Bank is one of North America’s leading diversified financial services companies and provides personal and commercial banking, wealth management services, insurance, corporate and investment banking and transaction processing services on a global basis. The Bank and its subsidiaries employ approximately 79,000 full- and part-time employees who serve close to 16 million personal, business, public sector and institutional clients through offices in Canada, the U.S. and 56 other countries.
The Bank had, on a consolidated basis, as at April 30, 2011, total assets of C$729 billion (approximately US$770 billion*), shareholders’ equity of C$40 billion (approximately US$43 billion*), and total deposits of C$441 billion (approximately US$466 billion*). The foregoing figures were prepared in accordance with Canadian generally accepted accounting principles and have been extracted and derived from, and are qualified by reference to, the Bank’s unaudited Interim Consolidated Financial Statements included in the Bank’s Report to Shareholders for the fiscal period ended April 30, 2011.
The senior long-term unsecured debt of the Bank has been assigned ratings of AA- (positive outlook) by Standard & Poor’s Ratings Services, Aa1 (stable outlook) by Moody’s Investors Service and AA (stable outlook) by Fitch Ratings. The Bank’s common shares are listed on the Toronto Stock Exchange, the New York Stock Exchange and the Swiss Exchange under the trading symbol “RY.” Its preferred shares are listed on the Toronto Stock Exchange.
Upon written request, and without charge, the Bank will provide a copy of its most recent publicly filed Annual Report on Form 40-F, which includes audited Consolidated Financial Statements, to any person to whom this Remarketing Memorandum is delivered. Requests for such copies should be directed to Investor Relations, Royal Bank of Canada, by writing to 200 Bay Street, 4th Floor, North Tower, Toronto, Ontario M5J 2W7, Canada, or by calling (416) 955-7802, or by visiting rbc.com/investorrelations/.
The delivery of this Remarketing Memorandum shall not create any implication that there has been no change in the affairs of the Bank since the date hereof or that the information contained or referred to herein is correct as at any time subsequent to its date.
__________________ *As at April 30, 2011: C$1.00 = US$1.057

[ THIS PAGE INTENTIONALLY LEFT BLANK ]