Embed Size (px)
Citation preview
Supplement to March, 1952 Issue
CONTENTS FOR SUPPLEMENT
Youngstown A r e a ...................................10Ashlabula-to-East Liverpool Area . . 11
Canton A r e a ......................................... 13Akron A re a ................................................ 14
Sandusky-Mansfield Area . . . . 15Lorain-Elyria A r e a .................................. 19Cleveland A rea......................................... 20
FINANCE • INDUSTRY • AGRICULTURE • TRADEFOURTH FEDERAL RESERVE DISTRICT
Vol. 34— No. 3 Supplement Federal Reserve Bank of Cleveland Cleveland 1, Ohio
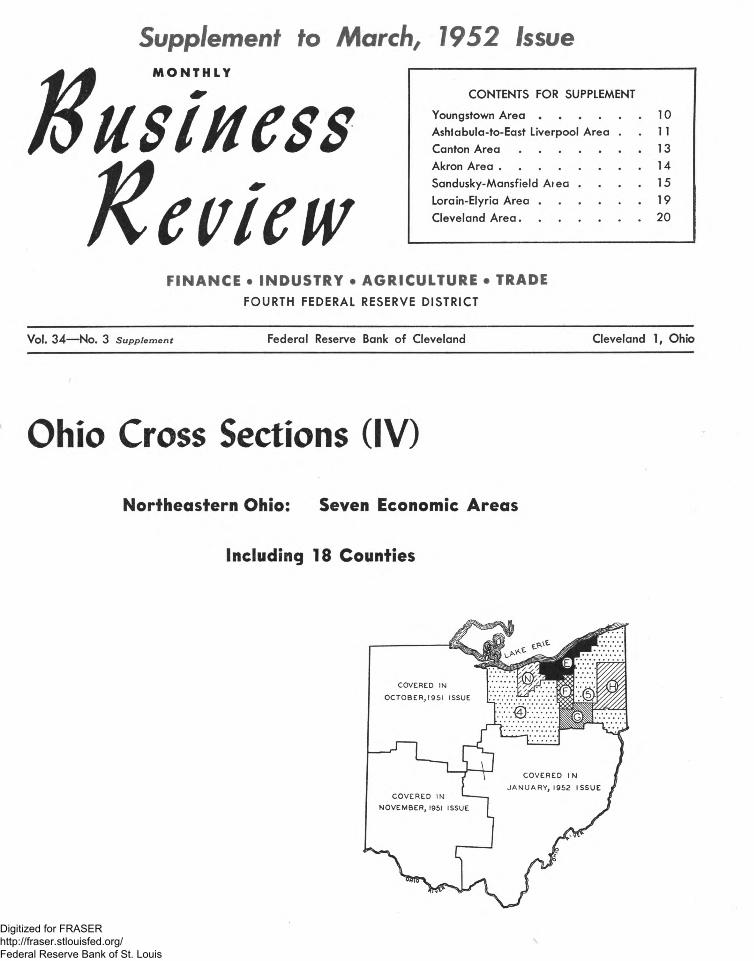
Ohio Cross Sections (IV)
Northeastern Ohio: Seven Economic Areas
Including 18 Counties
Digitized for FRASER http://fraser.stlouisfed.org/ Federal Reserve Bank of St. Louis
Page 10 Monthly Business Review March 1, 1952
Area H YOUNGSTOWN
(Mahoning and Trumbull Counties)
N. Bloomfield 1KUMBULLGustavus
Mesopotamia
WestFarmington
° Bristol ville
O Mecca
Kinsman
Burghil! O CortlandtO Orangeville©
oHartford
WarrenO 0 O Vienna
Leavittsburg Masury o° Newton Niles
Falls Mineral • Girard Hubbard______ Mc oaold______ °_
YOUNGSTOWN®Campbell0
MAHONING Struthers o Ellsworth O Canfield p0|Qn<J O Lowe£
° Craig Beach o Lake Milton
New Middletown
Sebring°°B e lo it J ~ L
North i Li mo
Petersburg
Hagrstrom Co.
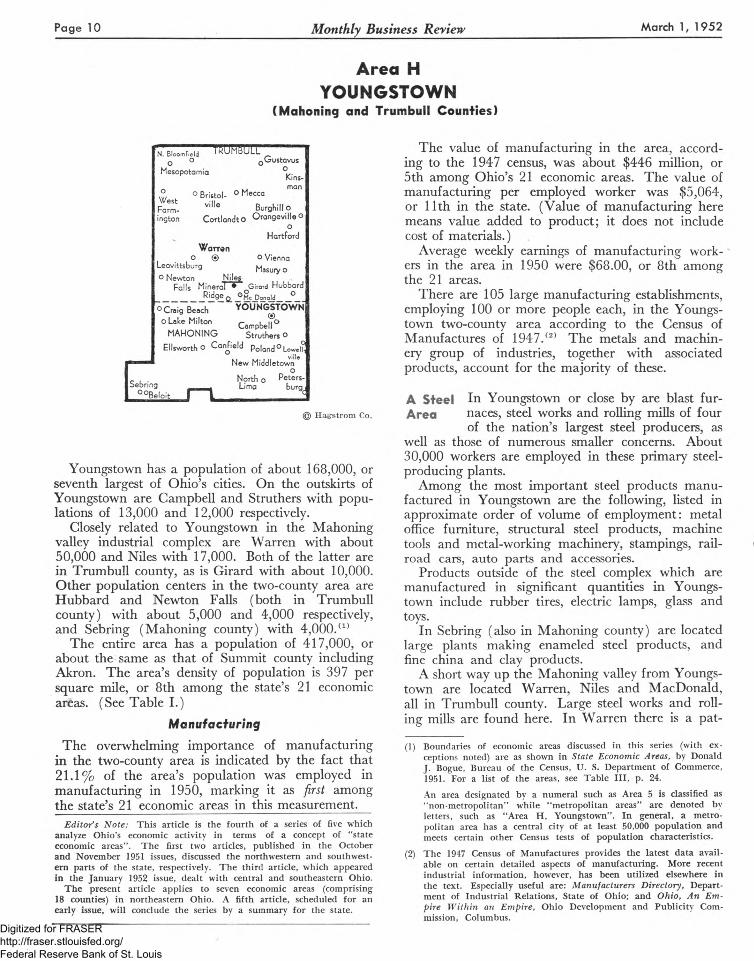
Youngstown has a population of about 168,000, or seventh largest of Ohio’s cities. On the outskirts of Youngstown are Campbell and Struthers with populations of 13,000 and 12,000 respectively.
Closely related to Youngstown in the Mahoning valley industrial complex are Warren with about 50,000 and Niles with 17,000. Both of the latter are in Trumbull county, as is Girard with about 10,000. Other population centers in the two-county area are Hubbard and Newton Falls (both in Trumbull county) with about 5,000 and 4,000 respectively, and Sebring (Mahoning county) with 4,000.(1)
The entire area has a population of 417,000, or about the same as that of Summit county including Akron. The area’s density of population is 397 per square mile, or 8th among the state’s 21 economic areas. (See Table I.)
Manufacturing
The overwhelming importance of manufacturing in the two-county area is indicated by the fact that 21.1% of the area’s population was employed in manufacturing in 1950, marking it as first among the state’s 21 economic areas in this measurement.
Editor’s N ote : This article is the fourth of a series of five which analyze Ohio’s economic activity in terms of a concept of “state economic areas”. The first two articles, published in the October and November 1951 issues, discussed the northwestern and southwestern parts of the state, respectively. The third article, which appeared in the January 1952 issue, dealt with central and southeastern Ohio.
The present article applies to seven economic areas (comprising 18 counties) in northeastern Ohio. A fifth article, scheduled for an early issue, will conclude the series by a summary for the state.
The value of manufacturing in the area, according to the 1947 census, was about $446 million, or 5th among Ohio’s 21 economic areas. The value of manufacturing per employed worker was $5,064, or 11th in the state. (Value of manufacturing here means value added to product; it does not include cost of materials.)
Average weekly earnings of manufacturing workers in the area in 1950 were $68.00, or 8th among the 21 areas.
There are 105 large manufacturing establishments, employing 100 or more people each, in the Youngstown two-county area according to the Census of Manufactures of 1947.(2) The metals and machinery group of industries, together with associated products, account for the majority of these.
A Steel In Youngstown or close by are blast fur- Area naces, steel works and rolling mills of four
of the nation’s largest steel producers, as well as those of numerous smaller concerns. About 30,000 workers are employed in these primary steel- producing plants.
Among the most important steel products manufactured in Youngstown are the following, listed in approximate order of volume of employment: metal office furniture, structural steel products, machine tools and metal-working machinery, stampings, railroad cars, auto parts and accessories.
Products outside of the steel complex which are manufactured in significant quantities in Youngstown include rubber tires, electric lamps, glass and toys.
In Sebring (also in Mahoning county) are located large plants making enameled steel products, and fine china and clay products.
A short way up the Mahoning valley from Youngstown are located Warren, Niles and MacDonald, all in Trumbull county. Large steel works and rolling mills are found here. In Warren there is a pat-
(1) Boundaries of economic areas discussed in this series (with exceptions noted) are as shown in State Econom ic Areas, by Donald J. Bogue, Bureau of the Census, U. S. Department of Commerce, 1951. For a list of the areas, see Table III, p. 24.An area designated by a numeral such as Area 5 is classified as “non-metropolitan” while “metropolitan areas” are denoted bv letters, such as “Area H, Youngstown”. In general, a metropolitan area has a central city of at least 50,000 population and meets certain other Census tests of population characteristics.
(2) The 1947 Census of Manufactures provides the latest data available on certain detailed aspects of manufacturing. More recent industrial information, however, has been utilized elsewhere in the text. Especially useful are: M anufacturers D irectory, Department of Industrial Relations, State of Ohio; and Ohio, An Em pire W ithin an Empire, Ohio Development and Publicity Commission, Columbus.
Digitized for FRASER http://fraser.stlouisfed.org/ Federal Reserve Bank of St. Louis
March 1, 1952 Monthly Business Review Page 1 1
tern of steel-products manufacturing somewhat similar to that of Youngstown. Warren is distinguished, however, by large plants manufacturing electric motors, enameled-steel kitchen ware, and electric lamps.
Manufactured elsewhere in Trumbull county are railroad cars (M asury), leather products (G irard), and auto parts (Newton Falls).
Trade and FinanceSales by retail stores in the two-county Youngs
town area totaled $368 million in 1948, according to the latest Census of Business. This amounted to
$884 per capita or 12th among the state’s 21 economic areas. (See Table I.)
Area H ranks 8th in the state in respect to demand deposits of commercial banks, as reported at the end of 1950; the total amounted to $155 million.
Savings accounts (in the form of time deposits at banks and withdrawable shares of savings and loan associations) were $207 million at the end of 1950. This amounted to $496 per capita, for a rank of 12th among Ohio’s 21 economic areas. As will be seen by Table I, such a per-capita savings figure is somewhat below the Ohio average but substantially above the United States average.
Area 5 ASHTABULA-to-EAST LIVERPOOL AREA
(Four Counties)
N. Kingsville^ OAmboy ° KingsvilleGeneva-on-
the-Lake _f * s lJ S . f f A B U L A
BULA O Saybrook * Geneva
° Austinburg Jefferson ® Pierpont O
GEAUGA
®
0 iHartsgrove Montville! °
O Dorsetj RockCreek Cherry
Valley Andover
ChardonClaridon
I Orwell I O O Huntsburgl J indsorBurton O o
Middlefield
Colebrook
PORTAGEoMantua o
Parkman O
o HiramO
Garrettsville
Windham 0BradyLake Ravenna
® oCharlestown
Palmyra o
• Kent
o Brimfield
i MogadoreAtwater °
Deerfield
mCOLUM- Salem Wash- O O Columbiana BIANA ington- Leetonia ” nity °
O Winona ville N«w Waterford •Homeworth
c o k _ Lisbon®E. Rochester . .O O Hanoverton^ ^ s i n g t o a
E. Palestine
C op yrigh t 1951, Hagrstrom Co., N .Y .C .
Negleyo
E.Salineville LIVERPOOL
Wellsville.
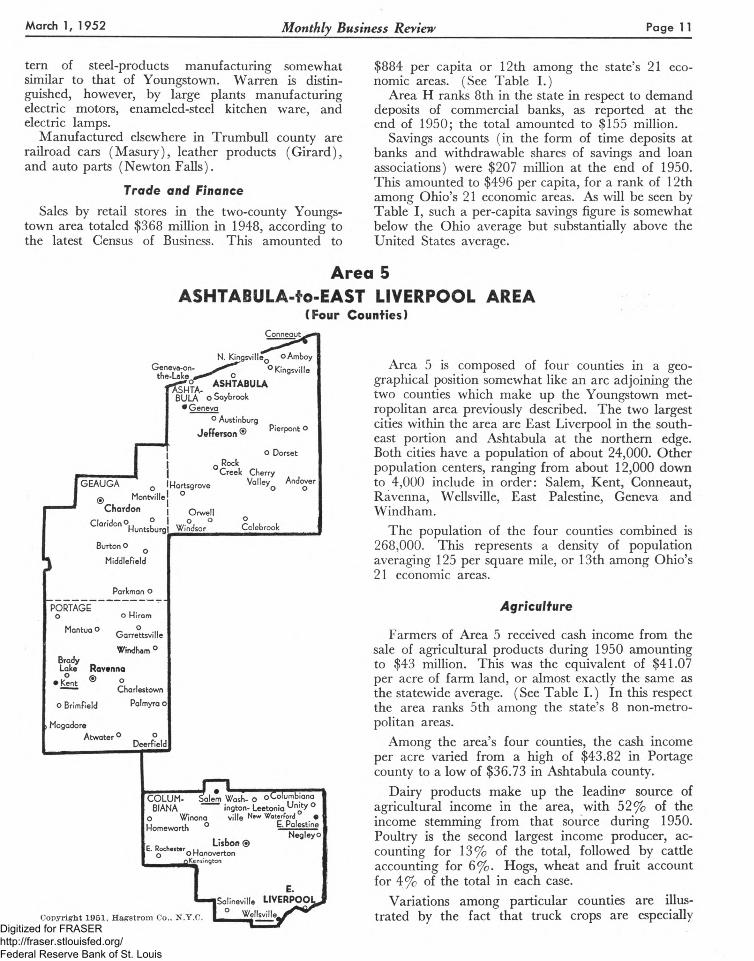
Area 5 is composed of four counties in a geographical position somewhat like an arc adjoining the two counties which make up the Youngstown metropolitan area previously described. The two largest cities within the area are East Liverpool in the southeast portion and Ashtabula at the northern edge. Both cities have a population of about 24,000. Other population centers, ranging from about 12,000 down to 4,000 include in order: Salem, Kent, Conneaut, Ravenna, Wells ville, East Palestine, Geneva and Windham.
The population of the four counties combined is268,000. This represents a density of population averaging 125 per square mile, or 13th among Ohio’s 21 economic areas.
Agriculture
Farmers of Area 5 received cash income from the sale of agricultural products during 1950 amounting to $43 million. This was the equivalent of $41.07 per acre of farm land, or almost exactly the same as the statewide average. (See Table I.) In this respect the area ranks 5th among the state’s 8 non-metropolitan areas.
Among the area’s four counties, the cash income per acre varied from a high of $43.82 in Portage county to a low of $36.73 in Ashtabula county.
Dairy products make up the leading source of agricultural income in the area, with 52% of the income stemming from that source during 1950. Poultry is the second largest income producer, accounting for 13% of the total, followed by cattle accounting for 6% . Hogs, wheat and fruit account for 4% of the total in each case.
Variations among particular counties are illustrated by the fact that truck crops are especially
Digitized for FRASER http://fraser.stlouisfed.org/ Federal Reserve Bank of St. Louis
Page 1 2 Monthly Business Review March 1, 1952
significant in Portage, and fruit and greenhouse products in Ashtabula county.
Industry
About 11 % of the area’s population was employed in manufacturing during 1950, marking the area in this respect as 15th among the state’s 21 areas.
Area 5 has 63 large establishments, employing 100 or more each, according to the Census of Manufactures of 1947. Leading industrial classifications are machinery, stone-clay-glass industries, fabricated metal products, furniture, rubber products, and primary metal manufacturing in the order named.
East Liverpool The largest concentration of manu- ond Ashtabula facturing within the area is in Co
lumbiana county. East Liverpool, Wellsville and East Palestine constitute a strategic center of the pottery and clay industries, along with numerous similar establishments on the West V irginia side of the Ohio River. The machinery industry is also important in East Liverpool, Salem and several smaller towns. (Special-industry machinery such as foundry machinery, woodworking machinery, rubber-industry machinery, etc., is prominent.) Metal stampings and plumbers’ supplies are produced in quantity in Salem; moderate-sized steel works are also found in Salem and East Liverpool.
Products manufactured in Ashtabula (located at the other extreme of Area 5) include the following: chemicals and ferro-alloys, forgings and foundry products, electric motors, radios and television, tools, and auto parts, as well as leather, paper and rubber products. Other manufactures in the county include tools (Geneva and Conneaut), radios and television ( Conneaut), and metal wheels and foundry products (Geneva). Parts for the electric lamp industry are made in Conneaut, Andover and Jefferson.
Conneaut and Ashtabula are important Lake ports, especially in respect to shipments of iron ore.
Ravenna, Manufacturing in Portage county is fair- Kent, etc. ty evenly divided between Ravenna and
Kent. In Ravenna there are important worsted mills, a half dozen plants producing small rubber items, a large establishment for the manufacture of power cranes and shovels, as well as several foundries; a substantial number of workers are employed by the federal government at the Ravenna Arsenal. Leading products manufactured at Kent include: electric motors, motor coaches, machine shop products, and steel bolts and nuts. A rubber tire plant is located at Garrettsville, also in Portage county.
Rubber products are the principal manufactures in Geauga county, with two plants located in Mid- dlefield and one in Chardon.
The total value of manufacturing (value added to product) in Area 5, according to the 1947 Census of Manufactures, was $137 million. This was the equivalent of $4,869 per worker employed in manufacturing, or 17th out of the state’s 21 economic areas.
Average weekly earnings of the area’s manufacturing workers were $63.48 during 1950, or 15th among the 21 areas. Such weekly earnings are approximately the same as the United States average, but somewhat below the state average. (See Table I.)
Trade and Finance
Retail sales in the area amounted to $217 million during 1948, according to the Census of that year. This is equal to $807 per capita, or 16th among Ohio’s 21 areas.
The Ashtabula-to-East Liverpool area ranks 14th among the state’s 21 areas as to demand deposits in commercial banks at the end of 1950, with a total of $81 million.
The same rank holds in respect to important forms of savings accounts. Thus, the sum of time deposits and savings-and-loan shares amounted to $129 million at the end of 1950, or an average of $482 per capita, ranking 14th among the 21 areas.
Digitized for FRASER http://fraser.stlouisfed.org/ Federal Reserve Bank of St. Louis
March 1, 1952 Monthly Business Review Page 13
Area G CANTON
(Stark County)
mavi 11 eUniontow nC OHartfivill*Q f^Q flbo fO
I oGreentown Alliance • °Middl«br«ncti
O Canal FultonCrystal SpringO
N. Lawrence o N. CantonLouisville
M=ssilton, , 6v»°® CANTON .V ' - • n o £. Canton P a r isl" Waco°
Robertsville O O N. Indust"' —
Brewster 0 NQVQrre® Justus Waynesburg
Beach City^f^^gort^^lag^liaO
Hag-strom Co.
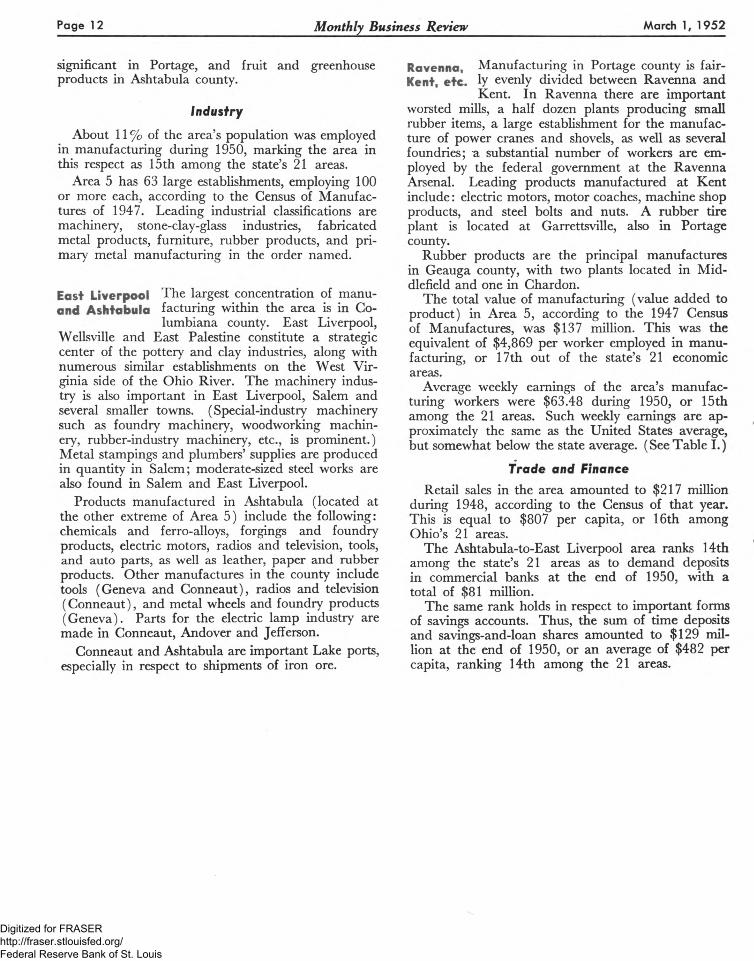
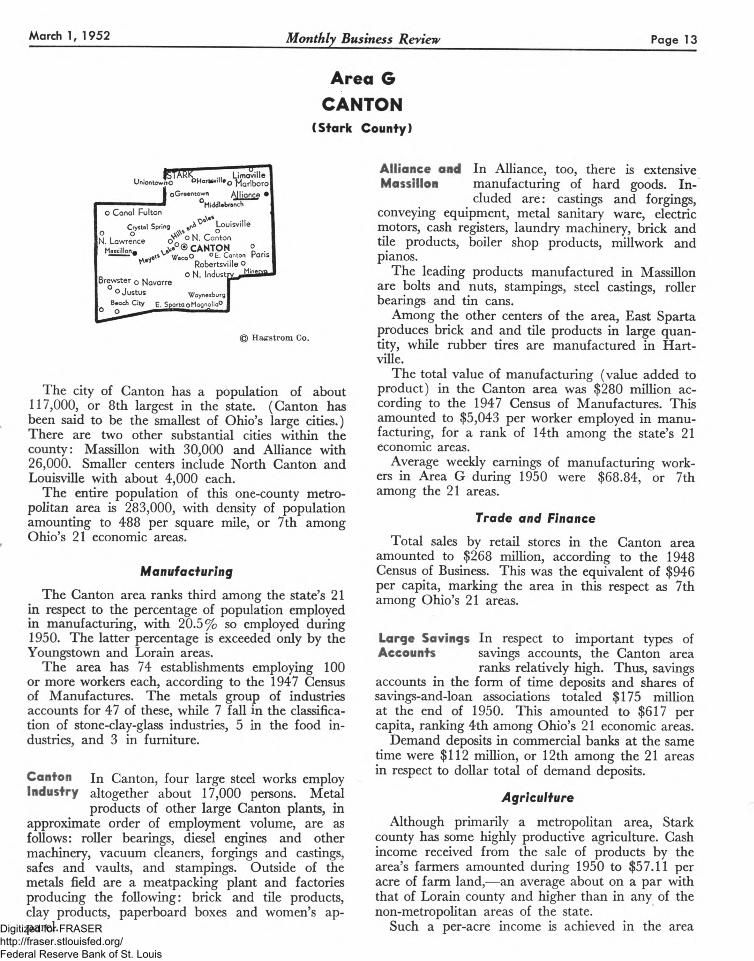
The city of Canton has a population of about117.000, or 8th largest in the state. (Canton has been said to be the smallest of Ohio’s large cities.) There are two other substantial cities within the county: Massillon with 30,000 and Alliance with26.000. Smaller centers include North Canton and Louisville with about 4,000 each.
The entire population of this one-county metropolitan area is 283,000, with density of population amounting to 488 per square mile, or 7th among Ohio’s 21 economic areas.
Manufacturing
The Canton area ranks third among the state’s 21 in respect to the percentage of population employed in manufacturing, with 20.5% so employed during 1950. The latter percentage is exceeded only by the Youngstown and Lorain areas.
The area has 74 establishments employing 100 or more workers each, according to the 1947 Census of Manufactures. The metals group of industries accounts for 47 of these, while 7 fall in the classification of stone-clay-glass industries, 5 in the food industries, and 3 in furniture.
Canton In Canton, four large steel works employ Industry altogether about 17,000 persons. Metal
products of other large Canton plants, in approximate order of employment volume, are as follows: roller bearings, diesel engines and other machinery, vacuum cleaners, forgings and castings, safes and vaults, and stampings. Outside of the metals field are a meatpacking plant and factories producing the following: brick and tile products, clay products, paperboard boxes and women’s apparel.
Alliance and In Alliance, too, there is extensive Massillon manufacturing of hard goods. In
cluded are: castings and forgings, conveying equipment, metal sanitary ware, electric motors, cash registers, laundry machinery, brick and tile products, boiler shop products, millwork and pianos.
The leading products manufactured in Massillon are bolts and nuts, stampings, steel castings, roller bearings and tin cans.
Among the other centers of the area, East Sparta produces brick and and tile products in large quantity, while rubber tires are manufactured in Hart- ville.
The total value of manufacturing (value added to product) in the Canton area was $280 million according to the 1947 Census of Manufactures. This amounted to $5,043 per worker employed in manufacturing, for a rank of 14th among the state’s 21 economic areas.
Average weekly earnings of manufacturing workers in Area G during 1950 were $68.84, or 7th among the 21 areas.
Trade and Finance
Total sales by retail stores in the Canton area amounted to $268 million, according to the 1948 Census of Business. This was the equivalent of $946 per capita, marking the area in this respect as 7th among Ohio’s 21 areas.
Large Savings In respect to important types of Accounts savings accounts, the Canton area
ranks relatively high. Thus, savings accounts in the form of time deposits and shares of savings-and-loan associations totaled $175 million at the end of 1950. This amounted to $617 per capita, ranking 4th among Ohio’s 21 economic areas.
Demand deposits in commercial banks at the same time were $112 million, or 12th among the 21 areas in respect to dollar total of demand deposits.
Agriculture
Although primarily a metropolitan area, Stark county has some highly productive agriculture. Cash income received from the sale of products by the area’s farmers amounted during 1950 to $57.11 per acre of farm land,—an average about on a par with that of Lorain county and higher than in any of the non-metropolitan areas of the state.
Such a per-acre income is achieved in the areaDigitized for FRASER http://fraser.stlouisfed.org/ Federal Reserve Bank of St. Louis
Page 14 Monthly Business Review March 1, 1952
without substantial influence from the sale of greenhouse products, which frequently boosts the per-acre income figure of metropolitan counties as, for instance, in Cuyahoga, Lucas and Lorain. In Stark
county, income from truck crops plays a large role (12% of the total), although dairy and poultry remain the leading sources of income as in neighboring counties.
Area F AKRON
(Summit County)
• ? Macedonia ° °- IkHela Twins*
burg° BostonO o
W. Peninsula Hudsoi Rich- Stowofield Silver Lekeo
CuyoHo^o^J^alko O Munroe FallsTallmadgeO
SUMMIT ® AKRONKenmorer
BorberLafl. Lgl-emore Johnson
■Clinton
O Sawyer-r© H a&strom Co.
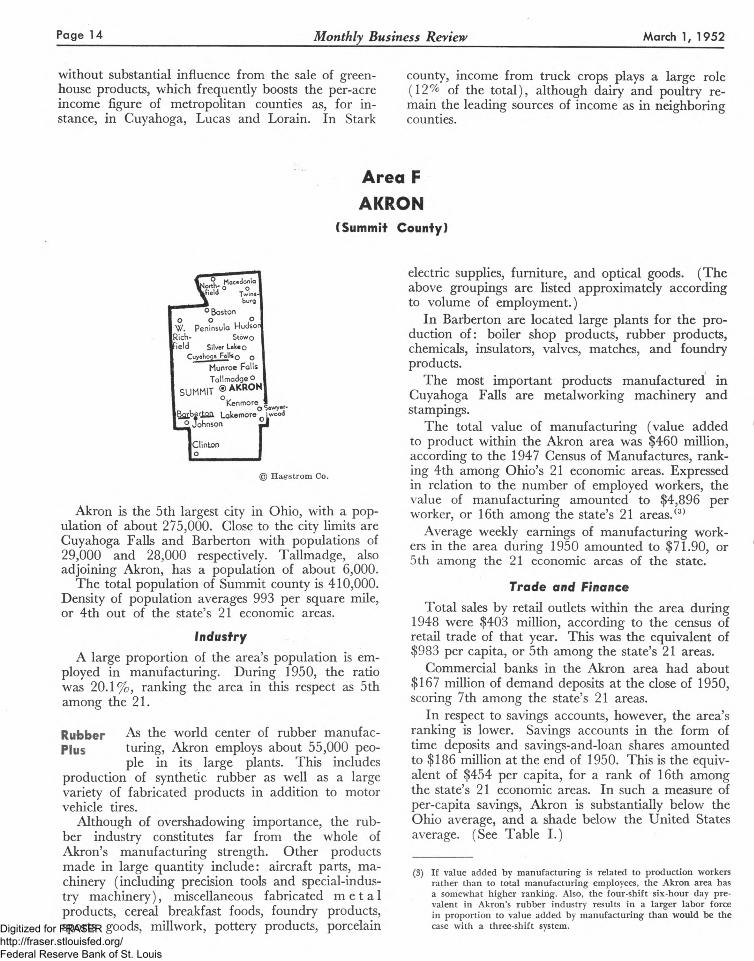
Akron is the 5th largest city in Ohio, with a population of about 275,000. Close to the city limits are Cuyahoga Falls and Barberton with populations of29,000 and 28,000 respectively. Tallmadge, also adjoining Akron, has a population of about 6,000.
The total population of Summit county is 410,000. Density of population averages 993 per square mile, or 4th out of the state’s 21 economic areas.
IndustryA large proportion of the area’s population is em
ployed in manufacturing. During 1950, the ratio was 20.1%, ranking the area in this respect as 5th among the 21.
Rubber As the world center of rubber manufac- Plus turing, Akron employs about 55,000 peo
ple in its large plants. This includes production of synthetic rubber as well as a large variety of fabricated products in addition to motor vehicle tires.
Although of overshadowing importance, the rubber industry constitutes far from the whole of Akron’s manufacturing strength. Other products made in large quantity include: aircraft parts, machinery (including precision tools and special-indus- try machinery), miscellaneous fabricated m e t a l products, cereal breakfast foods, foundry products, sports goods, millwork, pottery products, porcelain
electric supplies, furniture, and optical goods. (The above groupings are listed approximately according to volume of employment.)
In Barberton are located large plants for the production of: boiler shop products, rubber products, chemicals, insulators, valves, matches, and foundry products.
The most important products manufactured in Cuyahoga Falls are metalworking machinery and stampings.
The total value of manufacturing (value added to product within the Akron area was $460 million, according to the 1947 Census of Manufactures, ranking 4th among Ohio’s 21 economic areas. Expressed in relation to the number of employed workers, the value of manufacturing amounted to $4,896 per worker, or 16th among the state’s 21 areas.(3)
Average weekly earnings of manufacturing workers in the area during 1950 amounted to $71.90, or 5 th among the 21 economic areas of the state.
Trade and FinanceTotal sales by retail outlets within the area during
1948 were $403 million, according to the census of retail trade of that year. This was the equivalent of $983 per capita, or 5th among the state’s 21 areas.
Commercial banks in the Akron area had about $167 million of demand deposits at the close of 1950, scoring 7th among the state’s 21 areas.
In respect to savings accounts, however, the area’s ranking is lower. Savings accounts in the form of time deposits and savings-and-loan shares amounted to $186 million at the end of 1950. This is the equivalent of $454 per capita, for a rank of 16th among the state’s 21 economic areas. In such a measure of per-capita savings, Akron is substantially below the Ohio average, and a shade below the United States average. (See Table I.)
(S) If value added by manufacturing is related to production workers rather than to total manufacturing employees, the Akron area has a somewhat higher ranking. Also, the four-shift six-hour day prevalent in Akron’s rubber industry results in a larger labor force in proportion to value added by manufacturing than would be the case with a three-shift system.Digitized for FRASER
http://fraser.stlouisfed.org/ Federal Reserve Bank of St. Louis
March 1, 1952 Monthly Business Review Page 15
Area 4 SANDUSKY -MANSFIELD AREA
(Seven Counties)
ERIE SANDUSKY, o Casta! ia
Huron
Milan ©HURON
BellevueMonroeville
®Norwalk
Birmingham 0 Berlin
_____Htsu _Collins0 0
Wa Iceman
N.Fairfield °
Clarksfield
New c London
MEDINA
Mallet o Creek
Weymoutho® Medina
Willard OGreenwich ° | o Nova
PlymouthShiloh
• Shelby
O Polk
MANSFIELD®S. Boulevards0
--- "1 L'I °i ■J Lexington
| BellvilleO
ButlerC
> JeromevilleO M i fFI in o
1Lucas "*
Hayesville
Sharon O •Cen.
W estern S tar
_____ LPerrys- O ville FhOLMES
O)Loudon- |
ville |
Spencer© Chatham
Chippewa-orvthe-LokeQ Gloria Glen PLq
LeroyLod: O o 9
Seville O WadsworthO West B u rb a n k C re s to n ^ R ittm an
Salem S te r lin g D o y lesto w n
° Confess Marshallville oWAYNE
O SmithvilleO Orrville
® Wooster 0Dalton
O Apple Creek
Mt. Eaton o O Shreve o Fredericksburg
Wilfr.ot
Holmesville O Winesburg O * O Nashville Benton O
H agstrom Co.
Glenmont® Millersburg
o Killbuck
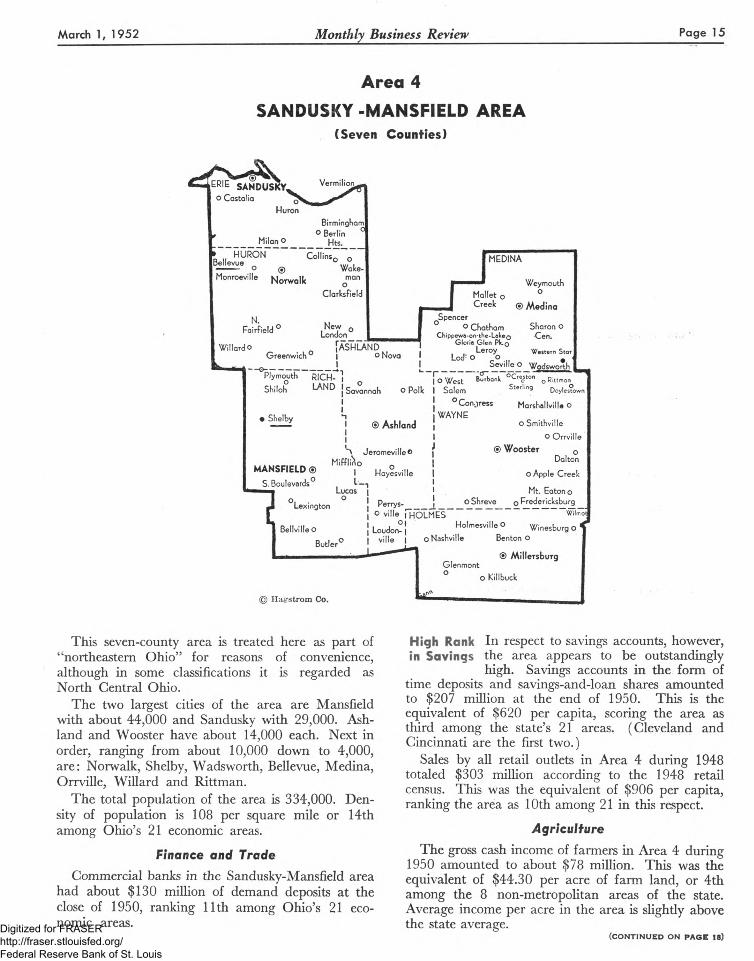
This seven-county area is treated here as part of “northeastern Ohio” for reasons of convenience, although in some classifications it is regarded as North Central Ohio.
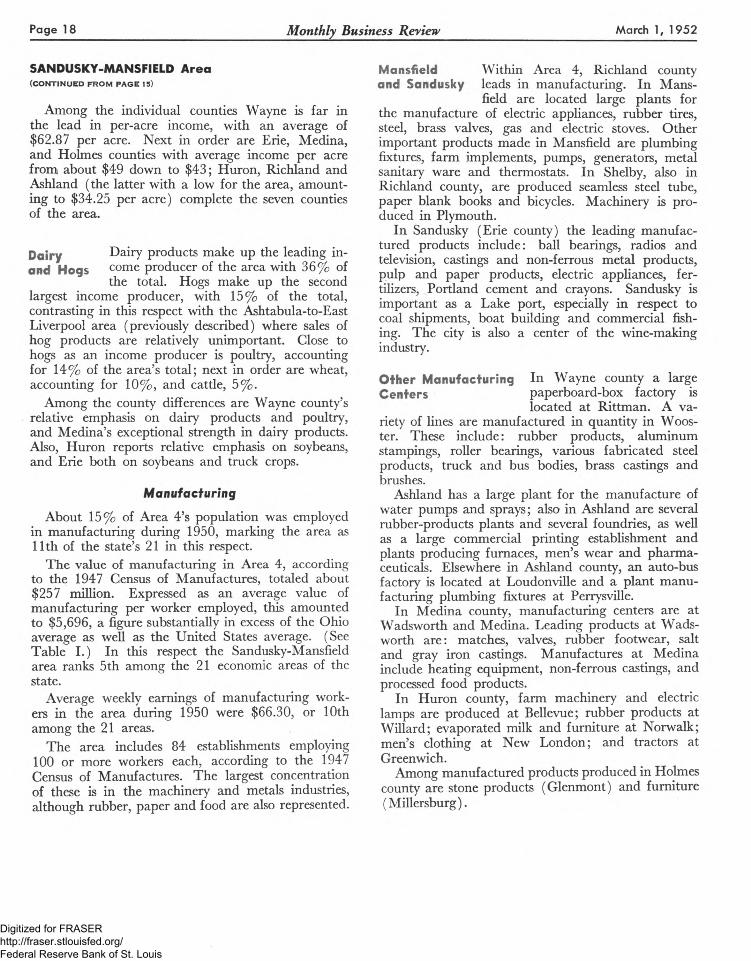
The two largest cities of the area are Mansfield with about 44,000 and Sandusky with 29,000. Ashland and Wooster have about 14,000 each. Next in order, ranging from about 10,000 down to 4,000, are: Norwalk, Shelby, Wadsworth, Bellevue, Medina, Orrville, Willard and Rittman.
The total population of the area is 334,000. Density of population is 108 per square mile or 14th among Ohio’s 21 economic areas.
Finance and Trade
Commercial banks in the Sandusky-Mansfield area had about $130 million of demand deposits at the close of 1950, ranking 11th among Ohio’s 21 economic areas.
High Rank In respect to savings accounts, however, in Savings the area appears to be outstandingly
high. Savings accounts in the form of time deposits and savings-and-loan shares amounted to $207 million at the end of 1950. This is the equivalent of $620 per capita, scoring the area as third among the state’s 21 areas. (Cleveland and Cincinnati are the first two.)
Sales by all retail outlets in Area 4 during 1948 totaled $303 million according to the 1948 retail census. This was the equivalent of $906 per capita, ranking the area as 10th among 21 in this respect.
Agriculture
The gross cash income of farmers in Area 4 during 1950 amounted to about $78 million. This was the equivalent of $44.30 per acre of farm land, or 4th among the 8 non-metropolitan areas of the state. Average income per acre in the area is slightly above the state average.
(CONTINUED ON PAGE 18)Digitized for FRASER http://fraser.stlouisfed.org/ Federal Reserve Bank of St. Louis
P age 16 Monthly Business Review March 1, 1952
TABI
BASIC ECONOMIC FACTS FOR SEVEN ECOI
METROPOLITAN
Area E CLEVELAND (2 counties)
Area F AKRON
(1 county)
Area G CANTON (1 county)
POPULATION
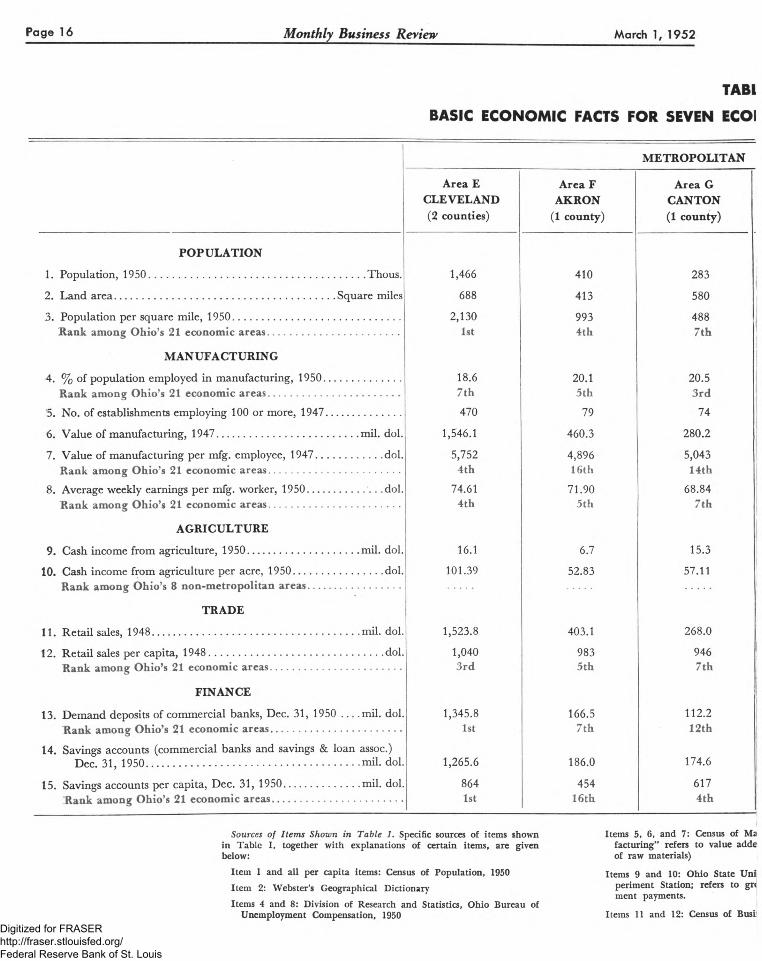
1. Population, 1950 ............................................................. .......... Thous. 1,466 410 283
2. Land area......................................................................... .Square miles 688 413 580
3. Population per square mile, 1950................................ 2,130 993 488Rank among Ohio’s 21 economic areas.................... 1st 4th 7th
MANUFACTURING
4. % of population employed in manufacturing, 1950. 18.6 20.1 20.5Rank among Ohio’s 21 economic areas.................... 7th 5th 3rd
5. No. of establishments employing 100 or more, 1947. 470 79 74
6. Value of manufacturing, 1947 ...................................... 1,546.1 460.3 280.2
7. Value of manufacturing per mfg. employee, 1947.. . ................ dol. 5,752 4,896 5,043Rank among Ohio’s 21 economic areas.................... 4th 16th 14th
8. Average weekly earnings per mfg. worker, 1950....... ................ dol. 74.61 71.90 68.84Rank among Ohio’s 21 economic areas.................... 4th 5th 7th
AGRICULTURE
9. Cash income from agriculture, 1950 ........................... 16.1 6.7 15.3
10. Cash income from agriculture per acre, 1950............ ................ dol. 101.39 52.83 57.11Rank among Ohio’s 8 non-metropolitan areas.. .. ........
TRADE
11. Retail sales, 1948............................................................ 1,523.8 403.1 268.0
12. Retail sales per capita, 1948 ......................................... 1,040 983 946Rank among Ohio’s 21 economic areas.................... 3rd 5th 7th
FINANCE
13. Demand deposits of commercial banks, Dec. 31, 1950 . . . .mil. dol. 1,345.8 166.5 112.21st 7th 12th
14. Savings accounts (commercial banks and savings & Dec. 31, 1950..............................................................
loan assoc.)1,265.6 186.0 174.6
15. Savings accounts per capita, Dec. 31, 1950............... 864 454 617Rank among Ohio’s 21 economic areas.................. 1st 16 th 4th
Sources o f Item s Shown in Table 1. Specific sources of items shown in Tabic I, together with explanations of certain items, are given below:
Item 1 and all per capita items: Census of Population, 1950
Item 2: Webster’s Geographical Dictionary
Items 4 and 8: Division of Research and Statistics, Ohio Bureau of Unemployment Compensation, 1950
Items 5, 6, and 7: Census of Ma facturing” refers to value adde of raw materials)
Items 9 and 10: Ohio State Uni periment Station; refers to gr< ment payments.
Items 11 and 12: Census of Busi,Digitized for FRASER http://fraser.stlouisfed.org/ Federal Reserve Bank of St. Louis
March 1, 1952 Monthly Business Review Page 17
.E I
MOMIC AREAS OF NORTHEASTERN OHIO
INON-METROPOLITAN
Area H YOUNGSTOWN
(2 counties)
Area N LORAIN-ELYRIA
(1 county)
Area 4 SANDUSKY, etc.
(7 counties)
Area 5 ASHTABULA, etc.
(4 counties)
OHIO U.S.
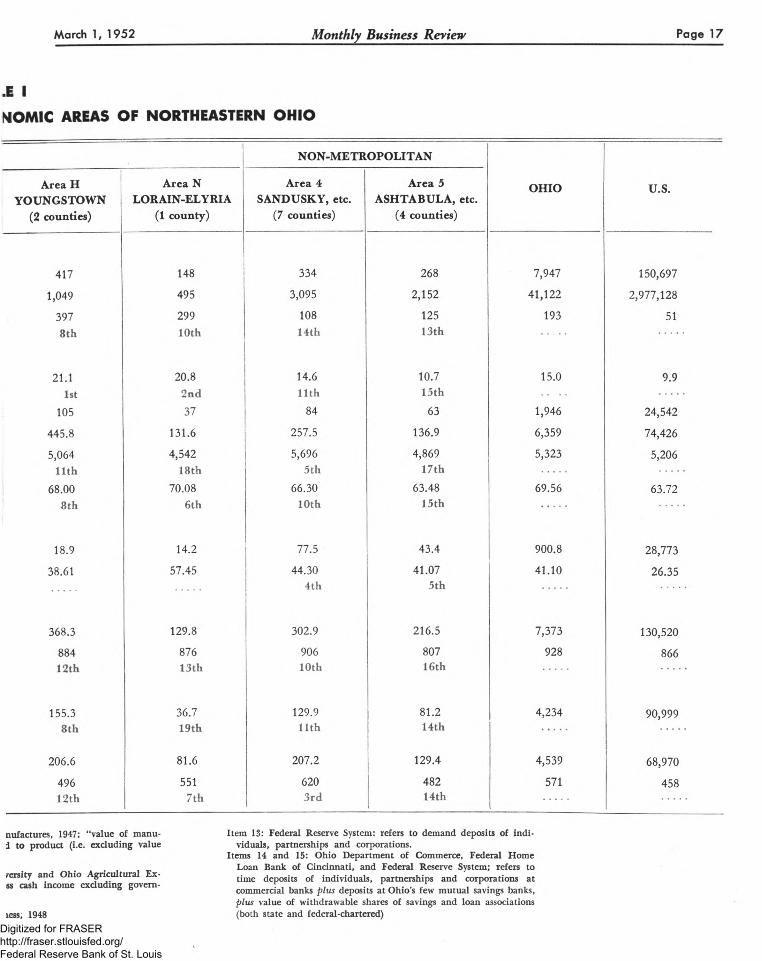
417 148 334 268 7,947 150,697
1,049 495 3,095 2,152 41,122 2,977,128
397 299 108 125 193 518th 10th 14th 13th
21.1 20.8 14.6 10.7 15.0 9.91st 2nd 11th 15th
105 37 84 63 1,946 24,542
445.8 131.6 257.5 136.9 6,359 74,426
5,064 4,542 5,696 4,869 5,323 5,20611th 18th 5th 17th
68.00 70.08 66.30 63.48 69.56 63.728th 6th 10th 15th
18.9 14.2 77.5 43.4 900.8 28,773
38.61 57.45 44.304th
41.075th
41.10 26.35
368.3 129.8 302.9 216.5 7,373 130,520
884 876 906 807 928 86612 th 13th 10th 16 th
155.3 36.7 129.9 81.2 4,234 90,9998th 19th 11th 14 th
206.6 81.6 207.2 129.4 4,539 68,970
496 551 620 482 571 45812th 7th 3rd 14th
nufactures, 1947; “value of manu- i to product (i.e. excluding value
/ersity and Ohio Agricultural Ex- ss cash income excluding govem-
less, 1948
Item 13: Federal Reserve System: refers to demand deposits of individuals, partnerships and corporations.
Items 14 and 15: Ohio Department of Commerce, Federal Home Loan Bank of Cincinnati, and Federal Reserve System; refers to time deposits of individuals, partnerships and corporations at commercial banks plus deposits at Ohio’s few mutual savings banks, plus value of withdrawable shares of savings and loan associations (both state and federal-chartered)
Digitized for FRASER http://fraser.stlouisfed.org/ Federal Reserve Bank of St. Louis
Page 18 Monthly Business Review March 1, 1952
SANDUSKY-MANSFIELD Area(CONTINUED FROM PAGE 15)
Among the individual counties Wayne is far in the lead in per-acre income, with an average of $62.87 per acre. Next in order are Erie, Medina, and Holmes counties with average income per acre from about $49 down to $43; Huron, Richland and Ashland (the latter with a low for the area, amounting to $34.25 per acre) complete the seven counties of the area.
Dairy Dairy products make up the leading in-and Hogs come producer of the area with 36% of
the total. Hogs make up the second largest income producer, with 15% of the total, contrasting in this respect with the Ashtabula-to-East Liverpool area (previously described) where sales of hog products are relatively unimportant. Close to hogs as an income producer is poultry, accounting for 14% of the area’s total; next in order are wheat, accounting for 10%, and cattle, 5%.
Among the county differences are Wayne county’s relative emphasis on dairy products and poultry, and Medina’s exceptional strength in dairy products. Also, Huron reports relative emphasis on soybeans, and Erie both on soybeans and truck crops.
Manufacturing
About 15% of Area 4’s population was employed in manufacturing during 1950, marking the area as 11th of the state’s 21 in this respect.
The value of manufacturing in Area 4, according to the 1947 Census of Manufactures, totaled about $257 million. Expressed as an average value of manufacturing per worker employed, this amounted to $5,696, a figure substantially in excess of the Ohio average as well as the United States average. (See Table I.) In this respect the Sandusky-Mansfield area ranks 5 th among the 21 economic areas of the state.
Average weekly earnings of manufacturing workers in the area during 1950 were $66.30, or 10th among the 21 areas.
The area includes 84 establishments employing 100 or more workers each, according to the 1947 Census of Manufactures. The largest concentration of these is in the machinery and metals industries, although rubber, paper and food are also represented.
Mansfield Within Area 4, Richland countyand Sandusky leads in manufacturing. In Mans
field are located large plants for the manufacture of electric appliances, rubber tires, steel, brass valves, gas and electric stoves. Other important products made in Mansfield are plumbing fixtures, farm implements, pumps, generators, metal sanitary ware and thermostats. In Shelby, also in Richland county, are produced seamless steel tube, paper blank books and bicycles. Machinery is produced in Plymouth.
In Sandusky (Erie county) the leading manufactured products include: ball bearings, radios and television, castings and non-ferrous metal products, pulp and paper products, electric appliances, fertilizers, Portland cement and crayons. Sandusky is important as a Lake port, especially in respect to coal shipments, boat building and commercial fishing. The city is also a center of the wine-making industry.
Other Manufacturing In Wayne county a large Centers paperboard-box factory is
located at Rittman. A variety of lines are manufactured in quantity in Wooster. These include: rubber products, aluminum stampings, roller bearings, various fabricated steel products, truck and bus bodies, brass castings and brushes.
Ashland has a large plant for the manufacture of water pumps and sprays; also in Ashland are several rubber-products plants and several foundries, as well as a large commercial printing establishment and plants producing furnaces, men’s wear and pharmaceuticals. Elsewhere in Ashland county, an auto-bus factory is located at Loudonville and a plant manufacturing plumbing fixtures at Perrysville.
In Medina county, manufacturing centers are at Wadsworth and Medina. Leading products at Wadsworth are : matches, valves, rubber footwear, salt and gray iron castings. Manufactures at Medina include heating equipment, non-ferrous castings, and processed food products.
In Huron county, farm machinery and electric lamps are produced at Bellevue; rubber products at W illard; evaporated milk and furniture at Norwalk; men’s clothing at New London; and tractors at Greenwich.
Among manufactured products produced in Holmes county are stone products (Glenmont) and furniture (M illersburg).
Digitized for FRASER http://fraser.stlouisfed.org/ Federal Reserve Bank of St. Louis
March 1, 1952 Monthly Business Review Page 19
Area N LORAIN - ELYRIA Area
(Lorain County)
Avon LakeSheffield U k e ^ sh eff ie|d
W R AIN Avon North Ridgeville
® °
LORAINAmherst 0
Asl£ e 'v -
O Oberlin Kipton Grafto
Lagrange
H agstrom Co.
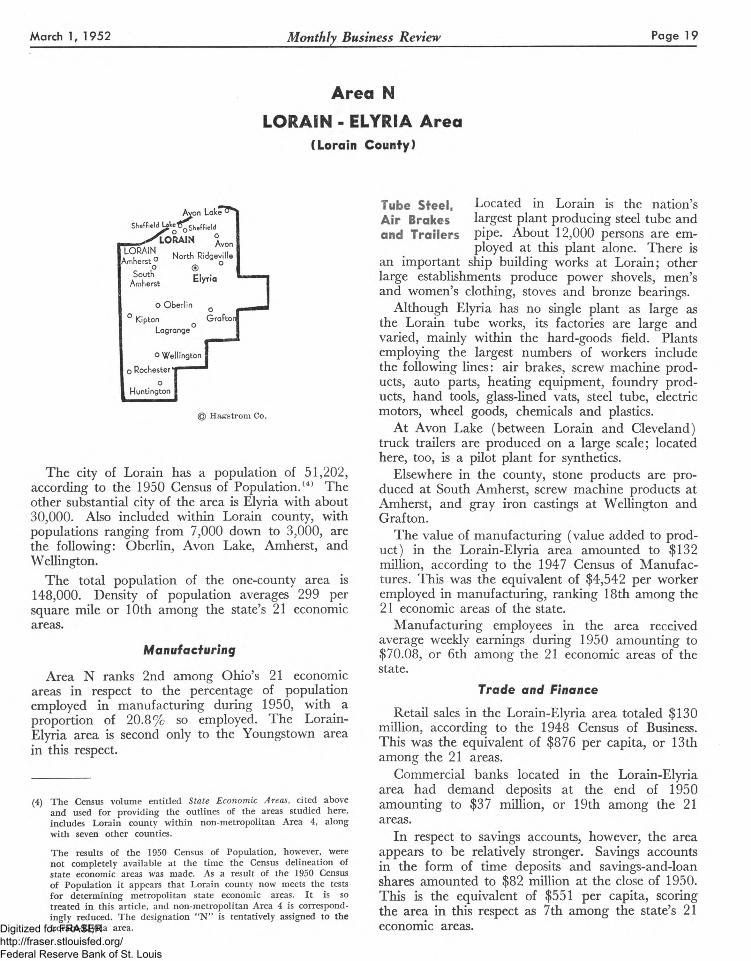
The city of Lorain has a population of 51,202, according to the 1950 Census of Population.(4) The other substantial city of the area is Elyria with about30.000. Also included within Lorain county, with populations ranging from 7,000 down to 3,000, are the following: Oberlin, Avon Lake, Amherst, and Wellington.
The total population of the one-county area is148.000. Density of population averages 299 per square mile or 10th among the state’s 21 economic areas.
Manufacturing
Area N ranks 2nd among Ohio’s 21 economic areas in respect to the percentage of population employed in manufacturing during 1950, with a proportion of 20.8% so employed. The Lorain- Elyria area is second only to the Youngstown area in this respect.
(4) The Census volume entitled State Econom ic Areas, cited above and used for providing the outlines of the areas studied here, includes Lorain county within non-metropolitan Area 4, along with seven other counties.
The results of the 1950 Census of Population, however, were not completely available at the time the Census delineation of state economic areas was made. As a result of the 1950 Census of Population it appears that Lorain county now meets the tests for determining metropolitan state economic areas. It is so treated in this article, and non-metropolitan Area 4 is correspondingly reduced. The designation “N” is tentatively assigned to the Lorain-Elyria area.
Tube Steel, Located in Lorain is the nation’s Air Brakes largest plant producing steel tube and and Trailers pipe. About 12,000 persons are em
ployed at this plant alone. There is an important ship building works at Lorain; other large establishments produce power shovels, men’s and women’s clothing, stoves and bronze bearings.
Although Elyria has no single plant as large as the Lorain tube works, its factories are large and varied, mainly within the hard-goods field. Plants employing the largest numbers of workers include the following lines: air brakes, screw machine products, auto parts, heating equipment, foundry products, hand tools, glass-lined vats, steel tube, electric motors, wheel goods, chemicals and plastics.
At Avon Lake (between Lorain and Cleveland) truck trailers are produced on a large scale; located here, too, is a pilot plant for synthetics.
Elsewhere in the county, stone products are produced at South Amherst, screw machine products at Amherst, and gray iron castings at Wellington and Grafton.
The value of manufacturing (value added to product) in the Lorain-Elyria area amounted to $132 million, according to the 1947 Census of Manufactures. This was the equivalent of $4,542 per worker employed in manufacturing, ranking 18th among the 21 economic areas of the state.
Manufacturing employees in the area received average weekly earnings during 1950 amounting to $70.08, or 6th among the 21 economic areas of the state.
Trade and Finance
Retail sales in the Lorain-Elyria area totaled $130 million, according to the 1948 Census of Business. This was the equivalent of $876 per capita, or 13th among the 21 areas.
Commercial banks located in the Lorain-Elyria area had demand deposits at the end of 1950 amounting to $37 million, or 19th among the 21 areas.
In respect to savings accounts, however, the area appears to be relatively stronger. Savings accounts in the form of time deposits and savings-and-loan shares amounted to $82 million at the close of 1950. This is the equivalent of $551 per capita, scoring the area in this respect as 7th among the state’s 21 economic areas.Digitized for FRASER
http://fraser.stlouisfed.org/ Federal Reserve Bank of St. Louis
Page 20 Monthly Business Review March 1, 1952
Area E CLEVELAND
(Cuyahoga and Lake Counties)
the Lake Lakelm , _
Willowick^ Willoughby o ,
j Kirtlandj PWickliffe Hi
:lid ^
. C leveland M ayfieldS. Euclid O o
LyndhurstM»y£i«ld G «t«
C leve land0 Mi"‘Hts. Worrensville °N ew borg°
o oN . Randall ___ G arfield Hts. ©Maple Hts. ^H agrmI - ! Polls
Bedford
>N. Perry
c • Take oF o irp o r tj^ Q Madison Richmond o Perry
Mentor on$ ® pQ;nesvl||eO Mentor
___^Lakewood° Rocky® °o Rivor Dover Brooklyn °
N,0 0Olmstead pOTma o Q
O lmstead ° Berea Independence _ Bedford S o lo ^ ijso W estv iew ^ g g j jn l lg ja
1 C U YA H O G AStrongsville o 0
4 N. Royalton* x
Brecksville A
\
i H ag'strom Co.
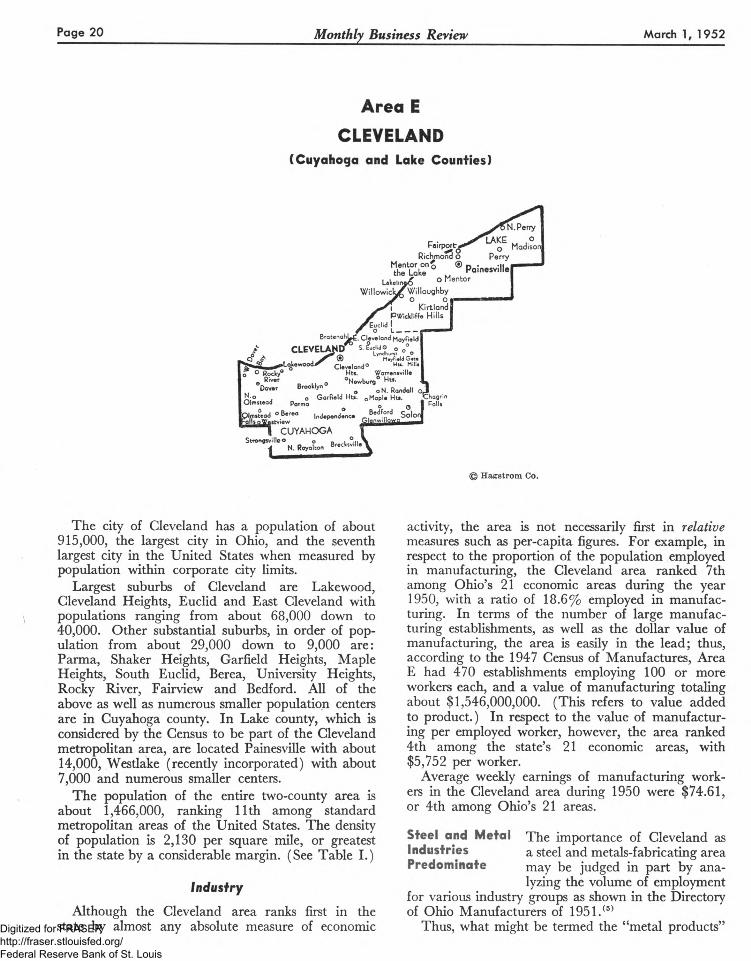
The city of Cleveland has a population of about915.000, the largest city in Ohio, and the seventh largest city in the United States when measured by population within corporate city limits.
Largest suburbs of Cleveland are Lakewood, Cleveland Heights, Euclid and East Cleveland with populations ranging from about 68,000 down to40.000, Other substantial suburbs, in order of population from about 29,000 down to 9,000 are: Parma, Shaker Heights, Garfield Heights, Maple Heights, South Euclid, Berea, University Heights, Rocky River, Fairview and Bedford. All of the above as well as numerous smaller population centers are in Cuyahoga county. In Lake county, which is considered by the Census to be part of the Cleveland metropolitan area, are located Painesville with about14.000, Westlake (recently incorporated) with about7,000 and numerous smaller centers.
The population of the entire two-county area is about 1,466,000, ranking 11th among standard metropolitan areas of the United States. The density of population is 2,130 per square mile, or greatest in the state by a considerable margin. (See Table I.)
Industry
Although the Cleveland area ranks first in the state by almost any absolute measure of economic
activity, the area is not necessarily first in re la t iv e measures such as per-capita figures. For example, in respect to the proportion of the population employed in manufacturing, the Cleveland area ranked 7th among Ohio’s 21 economic areas during the year 1950, with a ratio of 18.6% employed in manufacturing. In terms of the number of large manufacturing establishments, as well as the dollar value of manufacturing, the area is easily in the lead; thus, according to the 1947 Census of Manufactures, Area E had 470 establishments employing 100 or more workers each, and a value of manufacturing totaling about $1,546,000,000. (This refers to value added to product.) In respect to the value of manufacturing per employed worker, however, the area ranked 4th among the state’s 21 economic areas, with $5,752 per worker.
Average weekly earnings of manufacturing workers in the Cleveland area during 1950 were $74.61, or 4th among Ohio’s 21 areas.
Steel and Metal The importance of Cleveland as Industries a steel and metals-fabricating areaPredominate m a y be judged in part by ana
lyzing the volume of employment for various industry groups as shown in the Directory of Ohio Manufacturers of 1951.(5)
Thus, what might be termed the “metal products”Digitized for FRASER http://fraser.stlouisfed.org/ Federal Reserve Bank of St. Louis
March 1,^1952 Monthly Business Review Page 21
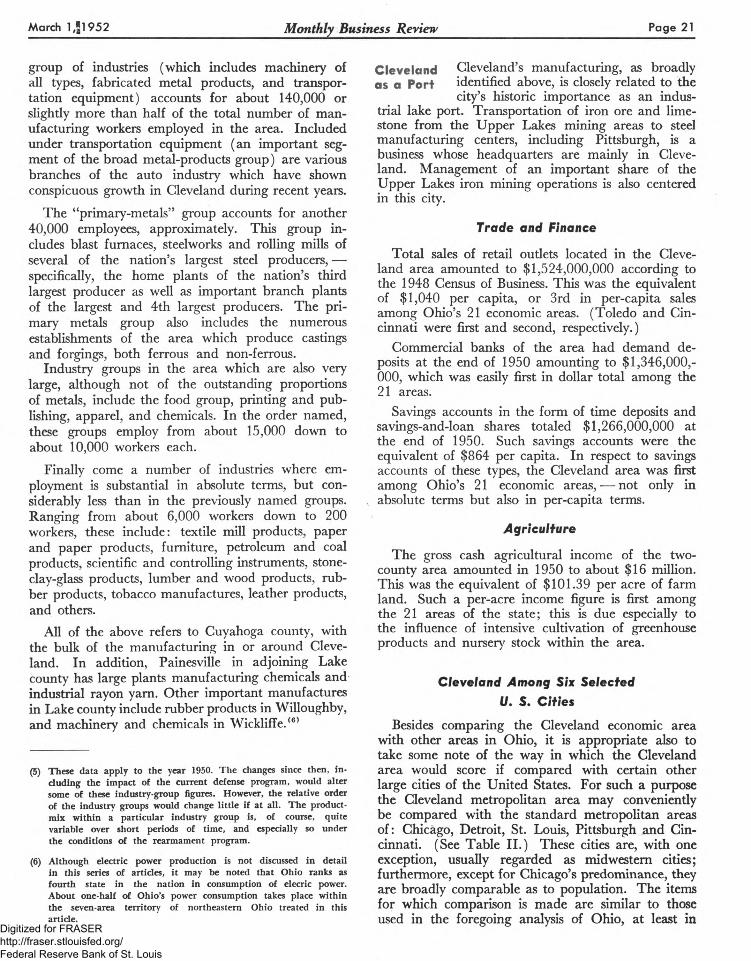
group of industries (which includes machinery of all types, fabricated metal products, and transportation equipment) accounts for about 140,000 or slightly more than half of the total number of manufacturing workers employed in the area. Included under transportation equipment (an important segment of the broad metal-products group) are various branches of the auto industry which have shown conspicuous growth in Cleveland during recent years.
The “primary-metals” group accounts for another40,000 employees, approximately. This group includes blast furnaces, steelworks and rolling mills of several of the nation’s largest steel producers, — specifically, the home plants of the nation’s third largest producer as well as important branch plants of the largest and 4th largest producers. The primary metals group also includes the numerous establishments of the area which produce castings and forgings, both ferrous and non-ferrous.
Industry groups in the area which are also very large, although not of the outstanding proportions of metals, include the food group, printing and publishing, apparel, and chemicals. In the order named, these groups employ from about 15,000 down to about 10,000 workers each.
Finally come a number of industries where employment is substantial in absolute terms, but considerably less than in the previously named groups. Ranging from about 6,000 workers down to 200 workers, these include: textile mill products, paper and paper products, furniture, petroleum and coal products, scientific and controlling instruments, stone- clay-glass products, lumber and wood products, rubber products, tobacco manufactures, leather products, and others.
All of the above refers to Cuyahoga county, with the bulk of the manufacturing in or around Cleveland. In addition, Painesville in adjoining Lake county has large plants manufacturing chemicals and industrial rayon yam. Other important manufactures in Lake county include rubber products in Willoughby, and machinery and chemicals in Wickliffe.(6)
(5) These data apply to the year 1950. The changes since then, including the impact of the current defense program, would alter some of these industry-group figures. However, the relative order of the industry groups would change little if at all. The product- mix within a particular industry group is, of course, quite variable over short periods of time, and especially so under the conditions of the rearmament program.
(6) Although electric power production is not discussed in detail in this series of articles, it may be noted that Ohio ranks asfourth state in the nation in consumption of elecric power. About one-half of Ohio’s power consumption takes place within the seven-area territory of northeastern Ohio treated in this article.
Cleveland Cleveland’s manufacturing, as broadly as a Port identified above, is closely related to the
city’s historic importance as an industrial lake port. Transportation of iron ore and limestone from the Upper Lakes mining areas to steel manufacturing centers, including Pittsburgh, is a business whose headquarters are mainly in Cleveland. Management of an important share of the Upper Lakes iron mining operations is also centered in this city.
Trade and Finance
Total sales of retail outlets located in the Cleveland area amounted to $1,524,000,000 according to the 1948 Census of Business. This was the equivalent of $1,040 per capita, or 3rd in per-capita sales among Ohio’s 21 economic areas. (Toledo and Cincinnati were first and second, respectively.)
Commercial banks of the area had demand deposits at the end of 1950 amounting to $1,346,000,-000, which was easily first in dollar total among the 21 areas.
Savings accounts in the form of time deposits and savings-and-loan shares totaled $1,266,000,000 at the end of 1950. Such savings accounts were the equivalent of $864 per capita. In respect to savings accounts of these types, the Cleveland area was first among Ohio’s 21 economic areas, — not only in absolute terms but also in per-capita terms.
Agriculture
The gross cash agricultural income of the two- county area amounted in 1950 to about $16 million. This was the equivalent of $101.39 per acre of farm land. Such a per-acre income figure is first among the 21 areas of the state; this is due especially to the influence of intensive cultivation of greenhouse products and nursery stock within the area.
Cleveland Among Six Selected U. S. Cities
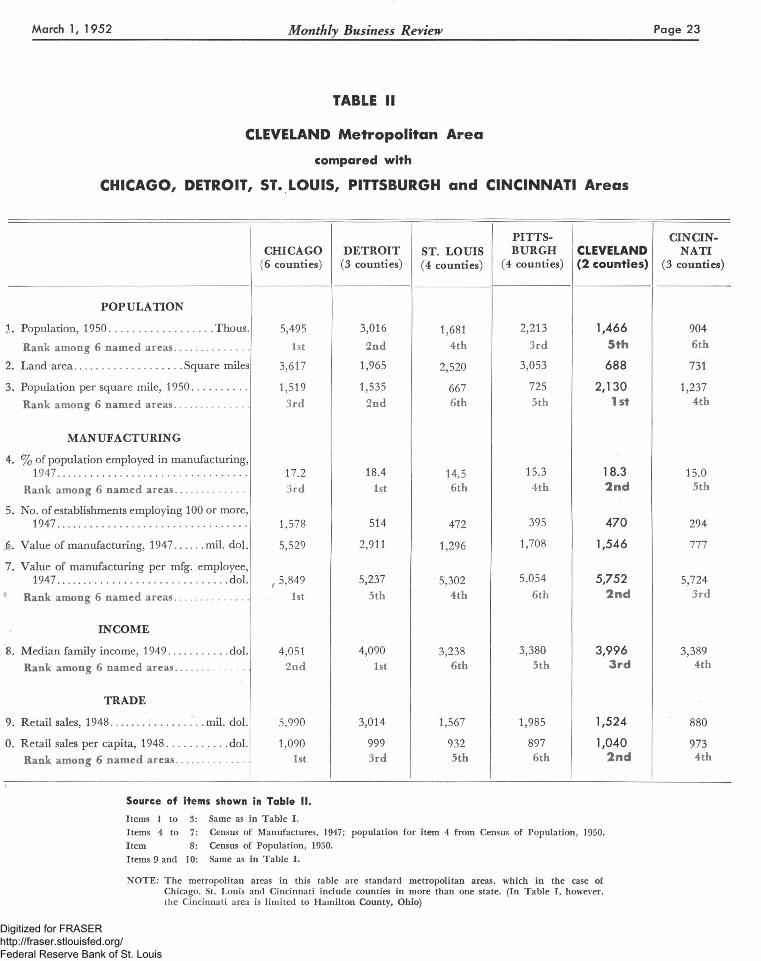
Besides comparing the Cleveland economic area with other areas in Ohio, it is appropriate also to take some note of the way in which the Cleveland area would score if compared with certain other large cities of the United States. For such a purpose the Cleveland metropolitan area may conveniently be compared with the standard metropolitan areas of: Chicago, Detroit, St. Louis, Pittsburgh and Cincinnati. (See Table II.) These cities are, with one exception, usually regarded as midwestem cities; furthermore, except for Chicago’s predominance, they are broadly comparable as to population. The items for which comparison is made are similar to those used in the foregoing analysis of Ohio, at least in
Digitized for FRASER http://fraser.stlouisfed.org/ Federal Reserve Bank of St. Louis
Page 22 Monthly Business Review March 1, 1952
respect to certain items of population, manufacturing, and trade.(7)
Population When Cleveland’s population is meas- Rank ured in terms of its two-county metro
politan area, rather than by corporate city coverage, it is apparent that it ranks below the metropolitan areas of Chicago, Detroit, St. Louis and Pittsburgh, — although above Cincinnati. (See first item of Table II.) Such a result, of course, is partly due to the way in which the metropolitan area boundaries have been fixed. Thus, the population of two counties for the Cleveland area is set alongside that of six counties for the Chicago area, four counties for St. Louis, four for Pittsburgh, etc.
When population is related to geographical area, the resulting density of population is revealed as very heavy for the Cleveland area. Thus, with a density of 2,130 per square mile the two-county Cleveland area ranks first among the six named metropolitan areas, i.e. exceeding Detroit, Chicago, Cincinnati, Pittsburgh and St. Louis. (It is obvious that the same boundary considerations which tend toward conservatism in the Cleveland area’s rank in absolute population also result in high rank for the area in respect to population per square mile.)
In respect to the percentage of population employed in manufacturing during 1947, the Cleveland
(7) The items shown in Table II for the six United States cities have been selected so as to be as close as possible in concept and coverage to the items shown in Table I for the areas within Ohio. For differences between the two sets of items, see note following Table II.
area ranks second among the named six cities of the United States, with 18.3% so employed, — only a shade below the 18.4% applicable to Detroit.(8)
Industry and The Cleveland area had 470 manu- Trade Rank facturing establishments employing
100 or more workers each according to the 1947 Census of Manufactures, ranking in this respect 4th among the named six U. S. cities. (Chicago, Detroit and St. Louis lead in the order named.) The Cleveland area ranks 4th also in value of manufacturing according to the same census. However, Cleveland ranks 2nd among the six cities in respect to value of manufacturing per employed worker for 1947; the Cleveland area figure was $5,752 per employed worker, close behind Chicago’s $5,849 per worker.
The Cleveland area was third among the six named metropolitan areas in respect to average family income during 1949, the latest year for which such information is available. The median family income in the Cleveland area was $3,996, or slightly below the Detroit and Chicago figures, and substantially above the medians for the other three areas.
In retail sales per capita, the Cleveland area exceeded the score of Detroit, St. Louis, Pittsburgh and Cincinnati with a 1948 figure of $1,040, or close behind the Chicago area’s figure of $1,090.
(8) There is evidence that the same ranking of the six cities held true for the year 1950. The data supporting this conclusion howewver, are on a somewhat different basis of coverage than that used throughout these articles, and consequently are not included in the table.
Digitized for FRASER http://fraser.stlouisfed.org/ Federal Reserve Bank of St. Louis
March 1, 1952 Monthly Business Review Page 23
TABLE II
CLEVELAND Metropolitan Area
compared with
CHICAGO, DETROIT, ST. LOUIS, PITTSBURGH and CINCINNATI Areas
CHICAGO (6 counties)
DETROIT(3 counties)
ST. LOUIS(4 counties)
PITTSBURGH
(4 counties)CLEVELAND(2 counties)
CINCINNATI
(3 counties)
POPULATION
Population, 1950 ...................................Thous. 5,495 3,016 1.681 2,213 1,466 904Rank among 6 named areas......................... 1st 2nd 4th 3rd 5th 6th
2. Land area....................................Square miles 3,617 1,965 2,520 3,053 688 731
3. Population per square mile, 1950.................. 1,519 1,535 667 725 2,130 1,237Rank among 6 named areas................. 3rd 2nd 6th 5th 1st 4 th
MANUFACTURING
4. % of population employed in manufacturing,1947................................................................ 17.2 18.4 14.5 15.3 18.3 15.0
Rank among 6 named areas....................... 3rd 1st 6th 4 th 2nd 5th
5. No. of establishments employing 100 or more,1947................................................................ 1,578 514 472 395 470 294
f . Value of manufacturing, 1947......... mil. dol. 5,529 2,911 1,296 1,708 1,546 777
7. Value of manufacturing per mfg. employee,1947......................................................... dol. , 5,849 5,237 5,302 5,054 5,752 5,724
Rank among 6 named areas......................... 1st 5 th 4th 6th 2nd 3rd
INCOME
8. Median family income, 1949....................dol. 4.051 4,090 3,238 3,380 3,996 3,389Rank among 6 named areas......................... 2nd 1st 6th 5th 3rd 4th
TRADE
9. Retail sales, 1948............................... mil. dol. 5,990 3,014 1,567 1,985 1,524 880
0. Retail sales per capita, 1948.................... dol. 1,090 999 932 897 1,040 973Rank among 6 named areas....................... 1st 3rd 5th 6th 2nd 4th
Source of items shown in Table II.
Items 1 to Items 4 to 7Item 8Items 9 and 10
Same as in Table I.Census of Manufactures, 1947; population for item 4 from Census of Population, 1950. Census of Population, 1950.Same as in Table I.
NOTE: The metropolitan areas in this table are standard metropolitan areas, which in the case of Chicago, St. Louis and Cincinnati include counties in more than one state. (In Table I, however, the Cincinnati area is limited to Hamilton County, Ohio)
Digitized for FRASER http://fraser.stlouisfed.org/ Federal Reserve Bank of St. Louis
Page 24 Monthly Business Review March 1, 1952
Table III
LIST OF OHIO'S 21 ECONOMIC AREAS
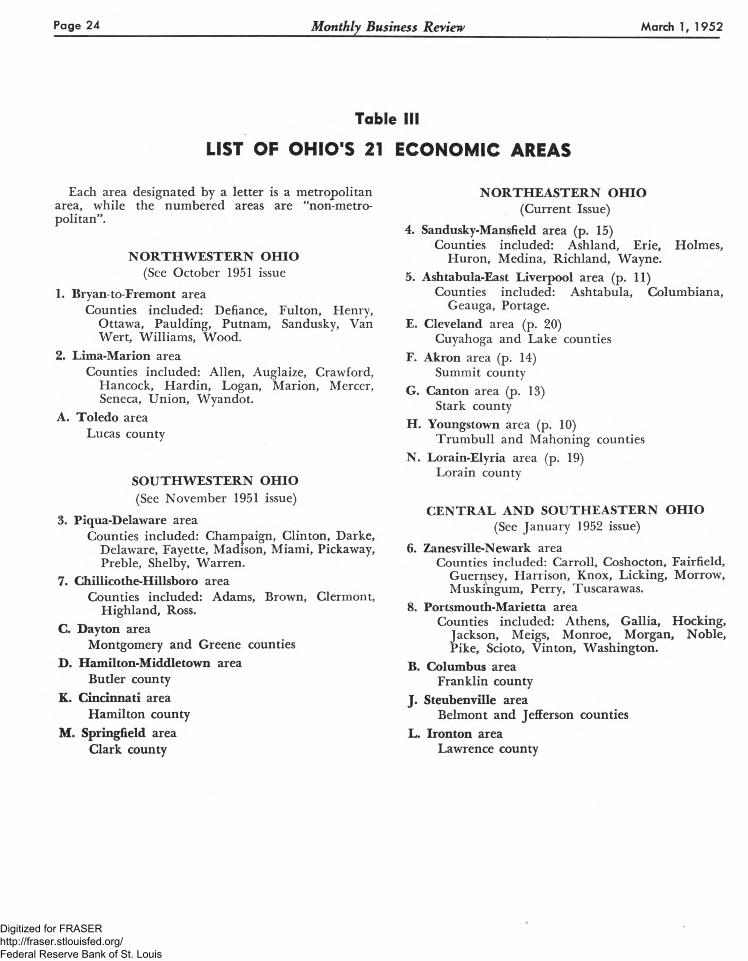
Each area designated by a letter is a metropolitan area, while the numbered areas are “non-metropolitan”.
NORTHWESTERN OHIO(See October 1951 issue
1. Bryan-to-Fremont areaCounties included: Defiance, Fulton, Henry,
Ottawa, Paulding, Putnam, Sandusky, Van Wert, Williams, Wood.
2. Lima-Marion areaCounties included: Allen, Auglaize, Crawford,
Hancock, Hardin, Logan, Marion, Mercer, Seneca, Union, Wyandot.
A. Toledo area Lucas county
SOUTHWESTERN OHIO(See November 1951 issue)
3. Piqua-Delaware areaCounties included: Champaign, Clinton, Darke,
Delaware, Fayette, Madison, Miami, Pickaway, Preble, Shelby, Warren.
7. Chillicothe-Hillsboro areaCounties included: Adams, Brown, Clermont,
Highland, Ross.C. Dayton area
Montgomery and Greene countiesD. Hamilton-Middletown area
Butler county K. Cincinnati area
Hamilton county M. Springfield area
Clark county
NORTHEASTERN OHIO(Current Issue)
4. Sandusky-Mansfield area (p. 15)Counties included: Ashland, Erie, Holmes,
Huron, Medina, Richland, Wayne.5. Ashtabula-East Liverpool area (p. 11)
Counties included: Ashtabula, Columbiana, Geauga, Portage.
E. Cleveland area (p. 20)Cuyahoga and Lake counties
F. Akron area (p. 14)Summit county
G. Canton area (p. 13)Stark county
H. Youngstown area (p. 10)Trumbull and Mahoning counties
N. Lorain-Elyria area (p. 19)Lorain county
CENTRAL AND SOUTHEASTERN OHIO(See January 1952 issue)
6. Zanesville-Newark areaCounties included: Carroll, Coshocton, Fairfield,
Guernsey, Harrison, Knox, Licking, Morrow, Muskingum, Perry, Tuscarawas.
8. Portsmouth-Marietta areaCounties included: Athens, Gallia, Hocking,
Jackson, Meigs, Monroe, Morgan, Noble, Pike, Scioto, Vinton, Washington.
B. Columbus area Franklin county
J. Steubenville areaBelmont and Jefferson counties
L. Ironton areaLawrence county
Digitized for FRASER http://fraser.stlouisfed.org/ Federal Reserve Bank of St. Louis