Embed Size (px)
Citation preview
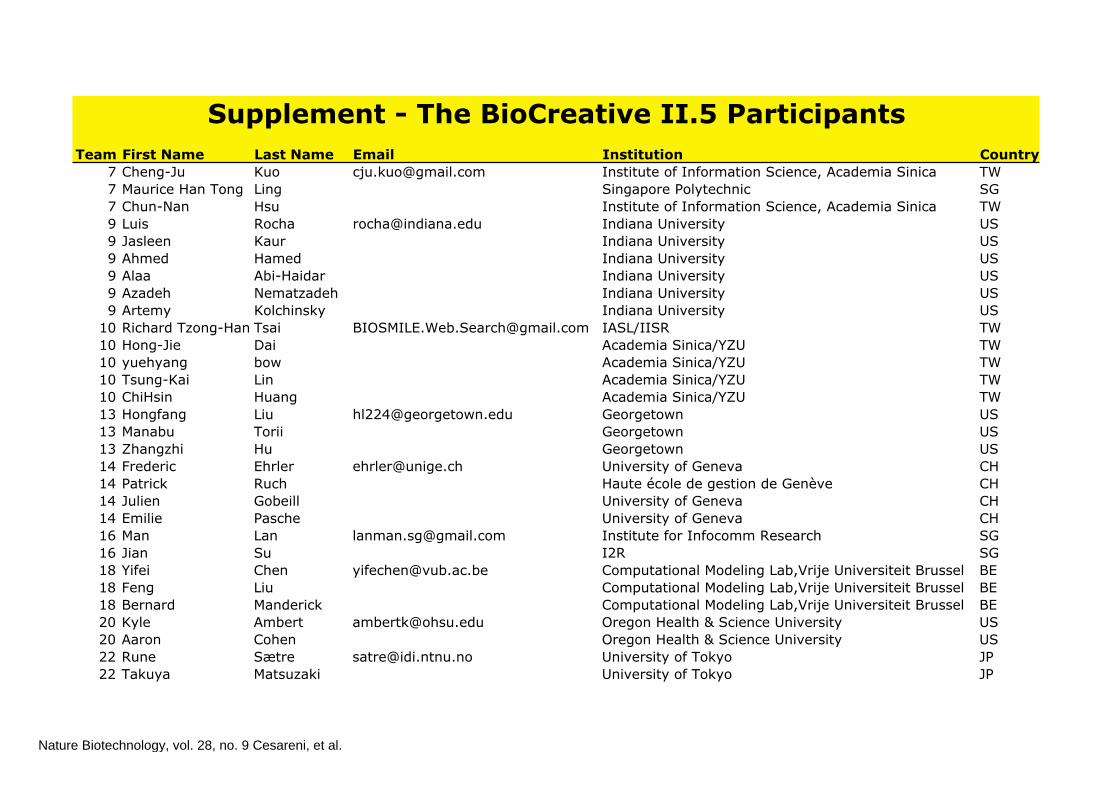
Team IDFirst Name Last Name Email Institution Country7 Cheng-Ju Kuo [email protected] Institute of Information Science, Academia Sinica TW7 Maurice Han Tong Ling Singapore Polytechnic SG7 Chun-Nan Hsu Institute of Information Science, Academia Sinica TW9 Luis Rocha [email protected] Indiana University US9 Jasleen Kaur Indiana University US9 Ahmed Hamed Indiana University US9 Alaa Abi-Haidar Indiana University US9 Azadeh Nematzadeh Indiana University US9 Artemy Kolchinsky Indiana University US
10 Richard Tzong-Han Tsai [email protected] IASL/IISR TW10 Hong-Jie Dai Academia Sinica/YZU TW10 yuehyang bow Academia Sinica/YZU TW10 Tsung-Kai Lin Academia Sinica/YZU TW10 ChiHsin Huang Academia Sinica/YZU TW13 Hongfang Liu [email protected] Georgetown US13 Manabu Torii Georgetown US13 Zhangzhi Hu Georgetown US14 Frederic Ehrler [email protected] University of Geneva CH14 Patrick Ruch Haute école de gestion de Genève CH14 Julien Gobeill University of Geneva CH14 Emilie Pasche University of Geneva CH16 Man Lan [email protected] Institute for Infocomm Research SG16 Jian Su I2R SG18 Yifei Chen [email protected] Computational Modeling Lab,Vrije Universiteit Brussel BE18 Feng Liu Computational Modeling Lab,Vrije Universiteit Brussel BE18 Bernard Manderick Computational Modeling Lab,Vrije Universiteit Brussel BE20 Kyle Ambert [email protected] Oregon Health & Science University US20 Aaron Cohen Oregon Health & Science University US22 Rune Sætre [email protected] University of Tokyo JP22 Takuya Matsuzaki University of Tokyo JP
Supplement - The BioCreative II.5 Participants
Nature Biotechnology, vol. 28, no. 9 Cesareni, et al.

22 Kazuhiro Yoshida University of Tokyo JP22 Makoto Miwa University of Tokyo JP22 Yoshinobu Kano University of Tokyo JP26 Wei Chih-Hsuan [email protected] NCKU KMlab TW26 Yi-Tsung Tang NCKU-csie TW31 Yong-gang Cao [email protected] University of Wisconsin-Milwaukee NLP group US31 Qing Zhang University of Wisconsin-Milwaukee NLP group US31 Shashank Agarwal University of Wisconsin-Milwaukee NLP group US31 Balaji Polepalli Ramesh University of Wisconsin-Milwaukee NLP group US31 Zuofeng Li University of Wisconsin-Milwaukee NLP group US32 Karin Verspoor [email protected] UC Denver US32 Kevin Cohen UC Denver US32 Helen Johnson UC Denver US32 Chris Roeder UC Denver US32 William Baumgartner UC Denver US37 Fabio Rinaldi [email protected] University of Zurich CH37 Kaarel Kaljurand University of Zurich CH37 Gerold Schneider University of Zurich CH37 Martin Romacker Novartis, NITAS CH37 Simon Clematide University of Zurich CH42 Jörg Hakenberg [email protected] Arizona State University US42 Nguyen Ha Vo Arizona State University US42 Luis Tari Arizona State University US42 Chitta Baral Arizona State University US42 Robert J. Leaman Dept Biomedical Informatics, Arizona State University US42 Siddhartha Jonnalagadda Dept Biomedical Informatics, Arizona State University US42 Ryan Sullivan Dept Biomedical Informatics, Arizona State University US42 Christopher Miller Dept Biomedical Informatics, Arizona State University US42 Graciela Gonzalez Dept Biomedical Informatics, Arizona State University US51 Jay Urbain [email protected] Milwaukee School of Engineering US
Nature Biotechnology, vol. 28, no. 9 Cesareni, et al.

Supplementary Methods for “The FEBS Letters/BioCreative II.5 experiment: making biological information accessible”
Florian Leitnera, Andrew Chatr-aryamontrib, Scott A. Mardisc, Arnaud Ceolb, Martin Krallingera, Luana Licatab, Lynette Hirschmanc, Gianni Cesarenib,d and Alfonso Valenciaa
a) Structural and Computational Biology Group, Spanish National Cancer Research Centre (CNIO), Madrid, Spain.b) Department of Biology, University of Rome Tor Vergata, Rome, Italy.c) The MITRE Corporation, Bedford, MA, USA.d) Research Institute “Fondazione Santa Lucia”, Rome, Italy, and IRCSS Santa Lucia, Rome, Italy.
This supplement describes the corpora (“document collections”) used for the various methods presented, data preparation strategies, our approach to estimate annotation time requirements, the setup for the ensemble system (systems + authors) and the combined system, as well as mathematical definitions of the evaluation functions.
Estimating the number of PPI articles p.a.The combined number of articles indexed in Google Scholar (advanced search) for the year 2009 in the subject areas "Biology, Life Sciences, and Environmental Science" (Bio) and "Medicine, Pharmacology, and Veterinary Science" (Med) is currently 209,500: 122,000 in Bio + 145,000 in Med - 57,500 articles in Bio AND Med. This is a number similar to Highwire's 220,000 articles available for the same year. On the other hand, 20 to 30 % of the articles of FEBS Letters, Journal EMBO J, or EMBO reports contain protein interaction information according to our curators. Using some query logic, it is possible to estimate the number of articles reporting PPI informations per year (p.a.). Terms describing methods to detect PPIs that are highly specific to this topic can be used to create the estimate. All queries are done for all articles in these two subject areas but excluding patents, and only for the year 2009. Results are required to have "at least summaries". To enhance the specificity of the results, the most distinct noun in the BC II.5 corpus (see below) of PPI articles, namely "interaction", as established during the challenge, is combined with a method term using ANDing. The five most important PPI experimental method description terms (defined by the PSI:MI ontology) using this logic were determined to be: "coimmunoprecipitation", "two hybrid", "pull down", "tandem affinity purification", and "complementation assay". The final query is then constructed by requiring the noun "interaction" and any of these five terms (Google Scholar query link) and is run against all articles in the two subject areas Bio and Med. This produces a result set of approximately 11,400 articles. Note that a similar query on PubMed would produce significantly less results, as NLM does not index the full text, only abstracts. As Google Scholar has full text access to most of the
relevant journals, it is safe to assume that a conservative low estimate of PPI articles p.a. is about 10,000.
Corpora usageAll articles in the corpora are from the FEBS Letters journal. Due to the fact that authors had made annotations that were public during the time of the challenge, we could not responsibly use these articles (from 2008) in the test set. Instead, author-annotated articles were used in the training set and a set of articles from the year before (2007) without public SDAs was used as test set. This forced us to apply the official training set results from the systems for the following two methods: building an ensemble system (systems + authors), and overlap evaluation (see Supplementary Results).
Authors corpus: The author corpus consisted of the 52 articles from 2008 for which participating authors (57 in total) returned evaluation-relevant PPI data (i.e., 56/57 authors returned annotations, while one author did not, and 4 of the 56 authors did not return annotations for protein identifiers or pairs). 33 of these articles form the “overlap corpus” mentioned below and 38 are part of the curator corpus. 51 of these articles are part of the author + curator corpus (i.e., the 55 “authors + curators” articles miss one article from this set, as we only have author annotations for it).
Curator corpus: The curator corpus consisted of 42 articles for which the curators generated annotations not basing their work on the author data, 38 of which overlap with the author corpus, and 33 of which in turn form the “overlap corpus”.
Authors + curator corpus: For the authors + curator evaluation we had 55 articles, covering 51 of the above author articles plus the four “missing articles” in the author corpus for which authors had submitted annotations without pair/identifier information. These four articles none the less were used by the curator for generating author-based annotations (while one of the 52 author submissions is not part of this corpus).
1Nature Biotechnology, vol. 28, no. 9 Cesareni, et al.

Training set: For the BioCreative challenge, the training set consisted of 61 articles from 2008, mostly containing the publicly available SDAs created by authors and/or curators (45 of these articles overlap with the author corpus and were used in the ensemble system described later, 39 overlap with the curator corpus, and 48 with the author + curator corpus). For the overlap calculations presented in the Supplementary Results, we used a set of 33 articles from the original 61 training set articles for which we had annotations from all three sources (i.e., this training set, and the authors and curator corpora).
Test set: The test set consisted of 61 articles, mostly from 2007, but also included nine articles from 2002-2006 that had no annotations in any PPI repository at the time of the challenge. These nine articles were added to ensure the challenge participants (15 research groups in total) were not mining for evidence in the PPI databases. This corpus has no overlaps with any other corpus, as the SDA annotations were publicly available at the time of the BioCreative challenge, so the automated systems could not be tested on the articles annotated by authors and instead had to be evaluated on an independent test set
Overlap corpus: For the overlap study presented in the Supplementary Results we used the 33 articles that overlap between the training set, the author corpus, and the curator corpus.
Homonym ortholg matching and organism filtering (data preparation)Species identification is a hard task for automatic annotation because authors often do not mention the species and because experiments carried out with proteins from different species are common in the PPI literature. As a practical solution, in addition to the “raw” system results, we applied two filters to estimate how well the automated systems could perform if augmented by information readily provided by an author or curator.
In a two-step process, we map homonymous orthologs to their correct gold standard entries and then filter out irrelevant species (organism filtering, see Figure 1), since in a real life application, it will be relatively easy for authors and curators to disambiguate the species and select correct orthologs if necessary. See the Supplementary Results for an investigation on the impact of these two post-processing steps.
The map of homonymous orthologs is created by extracting (i) all UniRef50 (release 15.0) sequence sets and (ii) grouping all homonymous UniProt records (r 15.0) by their gene and protein names (case-insensitive matching, filtering single character or pure numerals). Each set in one list is then intersected with all sets in the other to generate a list of homonymous homolog sets. Finally, for each result in the gold standard, we extract all identifiers in these homonymous homolog sets that contain a gold standard identifier,
2
Figure 1. Combined homonym ortholog matching and organism filtering. After curating the gold standard (gold, center) from the paper (gray, left), that in this diagram contains proteins for the hypothetical organisms A and B, a system produces automated results for that paper (blue ovals) that contains proteins for organisms A, B and C. In principal, these annotations either count as true positives, or false positives, while missed results are false negatives (annotated with green ovals). Proteins in the systemʼs result for organism C that have homonymous orthologs in the gold standard for organisms A or B are mapped and count as true positives (yellow circles). Results for organism C that have no mapping are filtered and do not count as false positives, while wrong (false positive) results for organisms A or B still are counted. Duplicates produced by the homonym ortholog mapping step are counted once only (white box at bottom).
Goldstandard(organismsA+B)
Homonym orthologs organism
C
System resultsfor organism B
System resultsfor organism A
Systemresults for
organism C
Homonym orthologs organisms
A+B
Scientific report (paper)
false negatives true positives
false positives organism-filtered
inter-curator annotation
homonym ortholog matching
duplicate homonym orthologs in organism C already reported by the system for organisms A or B are discarded
Nature Biotechnology, vol. 28, no. 9 Cesareni, et al.

but remove any protein identifiers for the same organism as the gold standard identifier from each extracted set to produce sets of homonymous orthologs (meaning, to avoid creating mappings to the same organism (homologs) as the gold standard identifier, we only extracted mappings to other organisms (potential orthologs)).
Organism filtering is based on looking up the TaxIDs of the gold standard proteins in their UniProt records and then removing any protein identifiers the systems reported that do not belong to one of those TaxIDs.
Metrics for system-aided author curationWe also made estimates of whether it would be possible to use the automated system results to facilitate the authorʼs work in generating a structured digital abstract. The authors reported that they needed, on average, an hour to annotate their articles and that the most time consuming task was find ing the p ro te in iden t i fiers (see Supplementary Results). Given that an average article had about 4 proteins and 3 interacting protein pairs, we made a conservative estimate that it would take the author, on average, 5 minutes to find a UniProt ID for an interacting protein. We further estimated that when presented with a proper list of possible interacting proteins and their identifiers, it would take an author 10 sec. to make a yes/no decision about a candidate protein (This estimate, of course, depends on the quality of the user interface and will be investigated in BioCreative III.) Using these estimates, we can compare expected time and quality of author curation with and without aid from an automated system.
• With no system, we would expect the author to find 2-3 of the 4 interacting proteins in an article (recall 66% from
Figure 1 in the main article), and it would take approximately 10-15 minutes of time.
• Using an automated system, we estimate that the author would spend 1 minute inspecting the 6 top ranked results of the best or a combined/ensemble system, which would yield a comparable recall (2-3 interacting proteins) – but in far less time (1 minute vs. 10-15 minutes).
Note that at a depth of the 6 top-ranked results, more than half of the automated systems (27/52) achieve a recall above 50% (the highest being 68%). This means that those systems would report in their top 6 candidates at least two of the four identifiers found in an average article. In the future, if automated systems can improve their ranking of answers or by using an ensemble system, this should bring most of the correct answers into the top 30, allowing an author to quickly annotate 80-90% of the correct interacting proteins in 5 minutes (30*10 seconds).
Creating an ensemble system and combining system resultsFor the ensemble system (systems + authors) we used the number of answers provided by the author as a cut-off that varied by document. The ensemble runs were produced using a trained classifier that combines the output of multiple raw system results (i.e., before the homonym ortholog mapping and organisms filtering described above) into a single ranked list. Using a set of documents for training, we created a maximum entropy classifier that we used to predict whether a particular protein is properly in the gold standard based on 5-fold cross-validation.
We also created a combined system (independent of the ensemble system mentioned above) joining the top 30 answers per document from each groupʼs best run.
3Nature Biotechnology, vol. 28, no. 9 Cesareni, et al.

Formulas and calculation
NOMENCLATURE
p – precisionr – recallTP – true positive [count]FP – false positive [count]FN – false negative [count]TN – true negative [count]
AVERAGING
Note that IAA, F-measure, Recall, and Precision can be calculated over the complete results set (called “micro-averaging”), or for each article separately and then averaging over the number of articles (called “macro-averaging”). This second approach is more independent of the underlying set and therefore the approach used for all numbers in this publication.
IAA - INTER-ANNOTATOR AGREEMENT
The IAA is defined as the percentage of common annotations from two annotation sets A and B over the number of total annotations contained in those sets:
This measure has the advantage over JPA (see below) of being directly comparable to the F1-measure (see below), as it can be shown that the above formula is the same as an F1-score that can be calculated between two annotation sets if one is used as reference for the other:
JPA - JOINT PROBABILITY OF AGREEMENT
The JPA is defined as the percentage of annotations the annotators have in common over the total number of annotations they made:
Where Ai are the annotation sets generated by n annotators. This measure is more strict than IAA, and we use micro-averaging for the numbers shown in this publication; however, its results are not comparable to the F-measure.
AUC IP/R - AREA UNDER THE INTERPOLATED PRECISION/RECALL CURVE
This is the official evaluation function of the challenge results (AUC iP/R is part of the online results available from the www.biocreative.org site). The AUC A of the interpolated P/R function fpr is defined as follows:
Where n is the total number of correct hits and pi is the highest interpolated precision for the correct hit j at rj, the recall for that hit. Interpolated precision pi is calculated for each recall r by taking the highest precision at r or any rʼ ≥ r.
F-MEASURE
Where β is a measure of the relative importance of recall as compared to precision. The balanced F-measure (F1) weighs precision and recall equally:
F1 = 2 (p ! r) / (p + r)
PRECISION
TP / (TP + FP)
RECALL
TP / (TP + FN)
4Nature Biotechnology, vol. 28, no. 9 Cesareni, et al.

Supplementary Results for “The FEBS Letters/BioCreative II.5 experiment: making biological information accessible”
Florian Leitnera, Andrew Chatr-aryamontrib, Scott A. Mardisc, Arnaud Ceolb, Martin Krallingera, Luana Licatab, Lynette Hirschmanc, Gianni Cesarenib,d and Alfonso Valenciaa
a) Structural and Computational Biology Group, Spanish National Cancer Research Centre (CNIO), Madrid, Spain.b) Department of Biology, University of Rome Tor Vergata, Rome, Italy.c) The MITRE Corporation, Bedford, MA, USA.d) Research Institute “Fondazione Santa Lucia”, Rome, Italy, and IRCSS Santa Lucia, Rome, Italy.
This supplement describes in greater detail the results of the FEBS Letters SDA experiment and the inter-annotator agreement, explains the challenges for automated systems, illustrates a detailed, comparative analysis of results from all three main sources, and reports on the ensemble and combined system results.
FEBS Letters SDA experiment - detailed author results and responses76 authors were asked to participate in the FEBS Letters SDA experiment, and 57 of them accepted the invitation. Of these 57, 52 returned PPI curation-relevant annotations. Of the 19 authors who did not join the FEBS experiment, the main reasons were concerns about possible delays in the publication of their articles. 22 of the participating authors also responded to an accompanying questionnaire, and 17 demonstrated interest in the experiment. Seven authors complained about insufficient guidelines for creating the annotations (authors received an Excel form containing the explanations for creating the annotations.) However, two authors explicitly said that they would be discouraged from publishing in FEBS Letters if the SDA procedure were made compulsory. The 22 authors that returned the questionnaire declared that generating the SDAs took them, on average, 68 minutes (i.e., about one hour) of their time (with a Standard Deviation of 72 min.) and that the most demanding task was the identification of the protein database identifiers.
Inter-annotator agreement (IAA) studiesTwo curators from the MINT database and one from another PPI database, adopting the same curation procedures, independently annotated sample sets of PPI manuscripts. These annotations were used to estimate an inter-annotator agreement based on sets of 21 common documents between each curator pairing.
When comparing protein identifiers annotated from curators of the same database, we calculated an (macro-averaged) inter-annotator agreement (IAA) of 95% (with a [micro-averaged] joint probability of agreement, JPA, of 87%), while comparison between curators of two different databases had an
agreement of 86% (JPA: 70%). When comparing interaction pairs, curators of the same database had an agreement of 87% (JPA: 69%), while curators from different databases only had an agreement of 76% (JPA: 60%).
The intra-database IAA scores reflect the approximately expected values for curator performance and indeed match well with the F1 scores of the curator evaluation (Figure 1, curator results, main article). The formulas for calculating IAA and JPA are shown in the Supplementary Material.
The challenge of identifying interacting proteinsThere are two problems that make it difficult for automated systems to identify interacting proteins: species identification and distinguishing interacting proteins from other proteins mentioned in an article. See the Supplementary Methods for details on how homonym ortholog maps and organism filtering were implemented.
Homonym ortholog mapping had the effect of raising the scores on the protein pair task considerably (3pp/14% for the highest-scoring system, T42 S1), and to a lesser extent on the protein identification task (3pp/8%, for T42 S1). Organism filtering, because of the removal of large quantities of false positives from the result set, has a much larger impact on the results than homonym ortholog mapping. Systems mainly report these large numbers of false positives due to the mentioned difficulty of disambiguating the articleʼs species origins (e.g., authors might not even mention the source species of the reported proteins) and due to the protein name ambiguity (proteins from different organisms with the same names). Organism filtering increases the protein identification score of T42 S1 by 13pp/30% and the pairs result by 13pp/58%. Combining the mapping and filtering steps produces an optimized, highest achievable result from the automatically generated data after human processing (i.e., the result set now only contains correct orthologs and correct species results). For system T42 S1 the overall increase resulting from mapping and filtering is
1Nature Biotechnology, vol. 28, no. 9 Cesareni, et al.

16pp/37% for identifiers and 15pp/69% for pairs, or 2-3pp better than organism filtering only.
It is also difficult for automated systems to distinguish interacting proteins from other proteins mentioned in an article. This is another source of the large numbers of false positives - even after homonym ortholog filtering - resulting in low precision. Low precision, in turn, drives down the balanced F-measure when looking at the entire ranked result sets (Note that F-measure does not take into account ranking in any way.) However, if we apply a cut-off (e.g., 6 top-ranked results per document), or if we use an F-measure weighted to emphasize recall (see definition of Fβ in the Supplementary Methods), then the results suggest that the systems could be used even in their present state to provide useful information to authors or curators. In summary, the identification task is not comparable, and much harder, than “regular” protein identification tasks where all
proteins mentioned in an article are to be identified, given that the actual number of proteins with experimental interaction evidence is only a small fraction of the proteins mentioned in an article and their identification requires additional analysis steps.
The BioCreative system results as quoted in this publication are the results after application of the homonym ortholog filtering process. The individual system results before and after each post-processing step can be downloaded here as an Excel file: BC II.5 results, on www.biocreative.org.
Comparing system, authors and curator result setsDue to the es t imates p resented in the Supplementary Methods (Metrics for system-aided author curation), we used the best systemʼs top 6 results for each article when calculating the annotation overlaps (Figure 1). In total, there are 33
2
Figure 1. Overlap of annotations by authors, curators and automatic systems, shown as Venn diagrams. The number of annotations are for the protein identification task and refer to 33 (training set) articles that all three sources had in common. The automatic systems, for each article, produce a relatively long list of proteins ranked according to relevance. For a fair comparison with the other annotation methods we have only considered the systemʼs top six proteins for each article. The system data in this figure are from Team 10, training set run 5 (also see Supplementary Methods). For an interpretation, see text. (Clockwise)Top left, a: Comparison of the result sets from all three sources of annotations. All others show the overlaps relative to the gold standard: Top right, b: Authors and text-mining systems. Bottom right, c: Curators and text-mining systems. Bottom left, d: Curators and authors.
Nature Biotechnology, vol. 28, no. 9 Cesareni, et al.

articles the three sources have in common; the performance of the system that was used in this analysis - T10 R5, the highest scoring AUC iP/R system on the test set - is about 10% better on the training than on the test set; As the SDA annotations were publicly available at the time of the BioCreative challenge, the automated systems could not be tested on the articles annotated by the authors and were evaluated on an independent test set (see Supplementary Material). To calculate the overlaps between the three sources the training set result used was 18%/10pp higher performing than its test set result (AUC iP/R of 0.575 in the test set vs. 0.679 in the training set).
The Venn diagrams in Figure 1 show that the results from systems, authors, and curators are disjoint over large parts of their annotations, making it likely that each source might be able to assist the others (Fig. 1a). Authors and automated systems have just 1/4 of their annotations in common, and joining the results of the best-scoring system with authorsʼ annotations would increase the gold standard coverage of author annotations by 28%/18pp (see Fig. 1b). When joining system and curator annotations (Fig. 1c), the increase in coverage is not as large (5%), but the system reproduces nearly 2/3 of the annotations the curators made. Thus, it can be argued that text mining could assist both authors and curators and help speed up the process of retrieving correct protein identifiers. In comparison, using authorsʼ annotations, curators obtain a similar benefit in coverage with the authorsʼ results and the added advantage of a much smaller number of false positives (15 vs. 101, Fig. 1d vs. 1c). Comparing this last Venn Diagram (1d) to the gain curators had in coverage when integrating author data (Figure 1,
curators vs. authors + curators, main article) shows that the author data helped them to remove FP annotations shown in the diagram above, and to integrate the false negatives the authors did find. It is also worth noting that the automated systems produced more annotations than the other sources; some of these additional annotations will refer to proteins mentioned in the article that are not relevant to the task. However, these extra results negatively affect calculations of precision and balanced F-measure.
Ensemble and combined system resultsThe overlap comparisons showed that the three approaches could assist each other: systems could help the authors, who in turn could aid curators, improving the overall performance. For example, authors working alone found about 2/3 of the relevant identifiers, while 84% of their annotations were correct (Figure 1, main article, authors). Curators alone achieved a recall of 89%. Comparing the top-scoring systemʼs identifier results to the performance of authors indicates that the (post-processed) results of the automated systems lag behind in balanced F-measure; however, we also ran an experiment to combine author input with inputs from multiple automated systems using the raw (unprocessed) results (an “ensemble system”); This ensemble system achieved a precision of 83%, a recall of 73%, and a balanced f-measure of 0.75 - better than the authors alone (see Figure 1, systems + authors, main article). Furthermore, the “combined system” (using the top 30 answers per document from each groupʼs best run) achieved a macro-averaged recall of 84% - higher than the (macro-averaged) author recall (55%) and not far below the curator recall (89%).
3Nature Biotechnology, vol. 28, no. 9 Cesareni, et al.

A service model for integrating Structured Digital Abstracts in the publishing process.
Supplementary Discussion for “The FEBS Letters/BioCreative II.5 experiment: making biological information accessible”
Florian Leitnera, Andrew Chatr-aryamontrib, Scott A. Mardisc, Arnaud Ceolb, Martin Krallingera, Luana Licatab, Lynette Hirschmanc, Gianni Cesarenib,d and Alfonso Valenciaa
a) Structural and Computational Biology Group, Spanish National Cancer Research Centre (CNIO), Madrid, Spain.b) Department of Biology, University of Rome Tor Vergata, Rome, Italy.c) The MITRE Corporation, Bedford, MA, USA.
d) Research Institute “Fondazione Santa Lucia”, Rome, Italy, and IRCSS Santa Lucia, Rome, Italy.
We present a possible model to programmatically integrate SDAs into the publishing process and for enriching existing biological repositories. Our intent is to spark a discussion about ways to include author-provided data for public manuscripts.
Most of the workflow required to integrate structured information in scientific publications and databases is already in place (Figure, 1-3): (1) Publishers provide interfaces for authors connecting them with the review process, leading to new publications that are stored in web-accessible repositories of papers. (2) Databases have professional bio-curators filling biological repositories with structured records that can be accessed by web services. (3) Text miners (BioNLP, Natural Language Processing in Biology) have joined forces to provide the BioCreative Meta-Server (BCMS)1, a platform connected to a growing number of Annotation Servers with a unified web-protocol with the ability to extract biologically
relevant information from text. Concerning the text-mining service (3), there are other alternatives available, such as the web-services offered by Reflect4 or Whatizit5, or, for example the paper annotation service offered by PaperMaker6. However, the BCMS is quite different from those approaches, as it does not provide its “own” annotation service, but rather integrates many different providers under one point-of-access (and, indeed, Reflect and WhatIzIt are planned to be part of text-mining services offered by the BCMS platform in the future, just as iHOP1,2 already is). All the services registered on the BCMS platform get queried in parallel for any incoming request and the results are pooled. Therefore, the BCMS acts as a “meta-service” to access multiple providers under one URI (unique resource identifier) with a unified data format and constitutes a federated repository of text-mining-based annotations.
Web-UI
Web-services
Text-miningplatform
Curation pipeline
Authors Curators
Paperrepository
BioNLPResearchers
Biologicalrepository
Publishers Databases
BCMS
Annotation Servers
Web-services
Web-services
SDAs part ofsubmission andreview process
peer-reviewedSDAs
interactiveannotationassistance
annotationassistance during
curation
12
13
A
B
C
D
Review process 11
Web-UI
Nature Biotechnology, vol. 28, no. 9 Cesareni, et al.

By setting up the necessary connections, SDAs can become an integral part of the publication and curation processes (Figure, A-D, red): Publishers would integrate the text mining resources (A) with their paper submission user interfaces (Web-UI) for authors (B) to facilitate the initial creation of the SDAs: This process would be formulated as an interactive protocol with the text-mining service. When papers are submitted for publication to the publisherʼs server, they could be forwarded to the text-mining service, possibly including annotations from authors to reduce irrelevant results (especially, specifying the relevant species for the article). After reviewers and authors agree on the annotations, the peer-reviewed SDA, now included as part of the paper, gets sent to the databases (C), and curators can decide to accept or revise annotations before adding them to their repository. Text-mining services might be used to process old publications without SDAs (D), which can be done directly via a web-UI or integrated into the curation pipeline using web services.
After the results from the FEBS experiment and BC challenge we are convinced of the feasibility of facilitating author-mediated SDA generation by including text-mining tools into the review process.
By using a multi-step approach - automated systems, authors, reviewers and curators - the quality of annotations should increase, and articles with SDAs that have not (yet) been curated by a database would inc lude some essent ia l annotations. The benefits are considerable, as we argue in the main paper. The largest benefit for the scientific community will be the significant increase in coverage of the biological repositories. An open question is the storage of these annotations. Currently, the FEBS Letters and Journal store this information internally. Alternatively, a public repository could be a more open model that links annotations back to their article by using the articleʼs DOI, storing annotations for any article and all journals.
Given that the scientific and technical elements seem to be in place, future progress is in the hands of the stakeholders. Databases and publishers, with the collaboration of authors, annotators and editors, can provide the essential connections between editorial houses and biological databases in which text mining will play an essential role.
References1. Fernández et al. iHOP web services. Nucleic Acids Res (2007) vol. 35 (2) pp. W21--W262. Hoffmann and Valencia. A gene network for navigating the literature. Nat Genet (2004) vol. 36 (7) pp.
6643. Leitner et al. Introducing meta-services for biomedical information extraction. Genome Biol (2008)
vol. 9 Suppl 2 pp. S64. Pafilis et al. Reflect: augmented browsing for the life scientist. Nat Biotechnol (2009) vol. 27 (6) pp.
508--5105. Rebholz-Schuhmann et al. Text processing through Web services: calling Whatizit. Bioinformatics
(Oxford, England) (2008) vol. 24 (2) pp. 296-86. Rebholz-Schuhmann et al. PaperMaker: validation of biomedical scientific publications.
Bioinformatics (2010) vol. 26 (7) pp. 982
Nature Biotechnology, vol. 28, no. 9 Cesareni, et al.