Embed Size (px)
Citation preview
Available online at www.sciencedirect.com
www.elsevier.com/locate/specom
Speech Communication 50 (2008) 109–125
Supervised and unsupervised learning of multidimensionallyvarying non-native speech categories
Martijn Goudbeek a,*, Anne Cutler a,b, Roel Smits a
a Max Planck Institute for Psycholinguistics, Nijmegen, The Netherlandsb MARCS Auditory Laboratories, University of Western Sydney, Australia
Received 24 October 2006; received in revised form 24 July 2007; accepted 25 July 2007
Abstract
The acquisition of novel phonetic categories is hypothesized to be affected by the distributional properties of the input, the relation ofthe new categories to the native phonology, and the availability of supervision (feedback). These factors were examined in four exper-iments in which listeners were presented with novel categories based on vowels of Dutch. Distribution was varied such that the catego-rization depended on the single dimension duration, the single dimension frequency, or both dimensions at once. Listeners were clearlysensitive to the distributional information, but unidimensional contrasts proved easier to learn than multidimensional. The native pho-nology was varied by comparing Spanish versus American English listeners. Spanish listeners found categorization by frequency easierthan categorization by duration, but this was not true of American listeners, whose native vowel system makes more use of duration-based distinctions. Finally, feedback was either available or not; this comparison showed supervised learning to be significantly superiorto unsupervised learning.� 2007 Elsevier B.V. All rights reserved.
Keywords: Category learning; Non-native categorization; Statistical learning; Vowels; Duration; Frequency
1. Introduction
It can be extremely difficult for adults to learn a non-native phonetic distinction, especially to native or near-native levels of discrimination (Burnham et al., 1991; seeStrange, 1995, for reviews). One important reason for thisdifficulty is that a native phonology is already available todetermine how speech sounds should be categorized, andthis interferes with the learning of new categorizations(Cutler and Broersma, 2005; Best and Tyler, 2007). Thelearning of non-native phonetic contrasts has been inten-sively studied, and has prompted the development of anumber of theoretical accounts, such as the Speech Learn-ing Model (SLM; Flege, 1995) and the Perceptual Assimi-
0167-6393/$ - see front matter � 2007 Elsevier B.V. All rights reserved.
doi:10.1016/j.specom.2007.07.003
* Corresponding author. Address: Department of Psychology, Univer-sity of Geneva, 40, Boulevard du Pont d’Arve, 1205 Geneva, Switzerland.Tel.: +41 22 379 9207.
E-mail address: [email protected] (M. Goudbeek).
lation Model (PAM; Best, 1995; Best et al., 1988). Thesemodels postulate several ways in which non-native speechsounds may or may not map to native categories: theymay be categorized within the phonological system of thenative language, be left uncategorized but still perceivedas speech or, more rarely, be left unassimilated and thusnot treated as speech at all.
In the latter case, as indeed predicted by PAM, categorydiscrimination is good to excellent. For example, Americanlisteners hear Zulu clicks as non-speech, but discriminatethem as well as native Zulu listeners do (Best et al.,1988). Discrimination in the case where the non-nativesounds are categorized in the native system depends onwhether the new sounds map to the same or to separatenative categories. The situation in which non-native speechsounds are considered as speech but left uncategorized (i.e.,not mapped to native speech categories) also allows for arange of discrimination possibilities. This situation ariseswhen no native phonetic categories are sufficiently close

Fig. 1. Four possible category structures in a two-dimensional perceptualspace. Lines represent the optimal solution to the categorization problem,different symbols represent separate category structures.
110 M. Goudbeek et al. / Speech Communication 50 (2008) 109–125
to the non-native ones in phonetic space to make mappingpossible. According to PAM, either one non-native cate-gory or both could be left uncategorized (Best, 1994,1995; Best and Tyler, 2007). When only one category is leftuncategorized, and the other mapped to a native category,discrimination can be very good. When both non-nativecategories are left uncategorized, discrimination can bepoor or fairly good, depending on the distance of eachnon-native category to the closest native phoneme catego-ries. SLM makes no clear predictions about discrimination,but it can be reasonably inferred that discriminationsuccess in SLM hinges on the establishment of a newnon-native category and the perceptual distance of thiscategory to already established categories (Flege, 1995).
As can be inferred from the previous paragraphs, themapping of native and non-native categories is usuallytested in a discrimination paradigm, although discrimina-tion and categorization are only indirectly related. Theability to discriminate speech sounds is a necessary condi-tion for the ability to categorize speech sounds, but not asufficient one. However, a speech recognition system withan excess of discrimination abilities without the accompa-nying categorization abilities is thought to be unlikely.
The influence of native categories on the perception ofnon-native categories has usually been studied either innaıve listeners with no knowledge of the non-native lan-guage in question, or in second-language learners who areattempting to acquire phoneme categories in the course ofacquiring the language – its words and its structures (Bestet al., 1988; Logan et al., 1991). The acquisition of a cate-gory distinction has however hardly ever been examinedas a process in its own right, independently of the languageacquisition process. An exception is the work of Francis andNusbaum (2002) who examined the way in which nativeEnglish listeners learned to attend to dimensions relevantin discriminating Korean stop consonants. Their resultsshowed that in learning new categories, listeners restructuretheir perceptual space, at least for the duration of the exper-iment; they do this mainly by reweighting its existing dimen-sions (see Francis et al., 2000), but also to a certain extent byattending to dimensions that were previously unattended.
In the current study we attempted to focus on the factorswhich control the success of non-native category learning.We presented listeners with a vowel category distinctionof an unfamiliar type, and examined their success in learn-ing and being able to apply it, as a function of threeexperimental parameters: (1) the availability of supervision(feedback) during the learning process; (2) the number ofdimensions with relevant or irrelevant variation; (3) thenumber and placement in phonetic space of native phonemecategories. For the latter comparison we made use of listen-ers with different native languages, varying in vowelrepertoire. Our experiments used classic category learningprocedures borrowed from studies of visual perception.
Whatever is being learned, the learning process willessentially depend upon the input that the learner receives.In visual category learning, the effects of the distributional
properties of the input have been extensively studied(Ashby and Maddox, 1993; Nosofsky, 1990). Perceptualcategories are defined, in this literature, as either points,collections of points, or distributions in a psychophysicalspace with continuous dimensions. Clearly, phonetic cate-gories can be considered in the same way, and auditory cat-egory learning as equivalent to recognizing the statisticalpatterns in auditory input (see, e.g., Pierrehumbert, 2003,for such a proposal). When a listener hears a sound, thissound can be evaluated on a number of dimensions (e.g.,duration, frequency) and mapped onto a point correspond-ing to its values in multidimensional auditory space.Sounds originating from the same category will be consis-tently mapped to the same area, and repeated exposureto categories leads to the formation of distinct ‘‘clouds’’that listeners can start to associate with a category label.
The distributional structure of the input will cruciallyaffect the way categorization decisions are made (Mayeand Gerken, 2000, 2001). As an illustration, we generatedfour possible stimulus structures, as displayed in Fig. 1.Exposure to the stimulus structure in the upper left panelof Fig. 1 should encourage listeners to categorize usingonly dimension 1 and ignore dimension 2; this enablesthem to optimally separate the different categories asdepicted by the crosses and the circles. Exposure to thestimulus structure in the lower left panel, in contrast,should encourage listeners to categorize using only dimen-sion 2 and ignore dimension 1. That is, in the upper leftpanel, dimension 1 displays relevant variation and dimen-sion 2 displays irrelevant variation, in the lower left panelthis situation is reversed. Exposure to the structures onthe right hand column should encourage listeners to useboth dimensions in their categorization. A categorizationstrategy that uses only one dimension in categorizing thestimuli in the panels of the right hand column would leadto many incorrect decisions.
M. Goudbeek et al. / Speech Communication 50 (2008) 109–125 111
Visual category learning experiments have shown thatsubjects initially opt for a solution involving only one dimen-sion (Feldman, 2000) and that they need the help of trial-by-trial feedback on the correctness of their response to startusing more than one dimension in their categorizations(Ashby et al., 1998). In contrast to the categories involvedin word recognition and language comprehension, the cate-gories used in these experiments are arbitrary ones. Ashbyet al. (1998) argue that there are two category learningsystems, a verbal learning system and a procedurally basedor implicit learning system. Initially, the verbal system haspriority and tries to categorize the stimuli according to arelatively simple, verbalizable, rule involving only onedimension (e.g., high frequency sounds in category A, lowfrequency sounds in category B). Rules that are more com-plex and more difficult to verbalize such as ‘‘all short andhigh frequency sounds in category A’’ only enter the verbalsystem after all unidimensional options have been tried.The other, implicit, system is based on the learning of actualskills or procedures (in the present case, for categorization).This system does not have such a preference for unidimen-sional rules, but it learns much more slowly.
Studies of unsupervised learning of visual categorieshave shown that trial-by-trial feedback is not always neces-sary, but that there are characteristic limits to performancein unsupervised learning. Ashby et al. (1999) showed thatparticipants confronted with a multidimensional categori-zation problem initially opt for a unidimensional solution(using only one dimension of variation in their categoriza-tions). Their subjects had to categorize lines differing inlength and orientation without the aid of supervision.Two groups of subjects encountered categories that wereseparable using only length or only orientation and wherethe other two dimensions displayed irrelevant variation.For the other two groups both dimensions were relevant(as in the right column of Fig. 1). By the end of theexperiment, observers in the unidimensional conditionsresponded almost perfectly, whereas those in the multidi-mensional conditions were still not able to use both stimu-lus dimensions. Only in a follow-up experiment, in whichtrial-by-trial feedback was present, could subjects entertaina solution that used more than one dimension in theircategorization. Homa and Cultice (1984) and Love (2002)also found limitations on unsupervised learning perfor-
Fig. 2. The basic experimental design of Experiments 1–4: a pretest phaseinformation (either one or two relevant dimensions) and a maintenance phase
mance with complex problems. Homa and Cultice (1984)created connected dot patterns that differed in their levelof distortion. Observers categorized these patterns withand without feedback. While feedback provided little ben-efit in learning low-distortion patterns, learning highly dis-torted patterns was only possible in the presence offeedback. Love (2002) investigated unsupervised learningwith the category learning problems constructed by Shep-ard et al. (1961). Performance was best (73% correct) whenonly one dimension was relevant; with two relevant dimen-sions, accuracy dropped to 56% correct (Love, 2002).
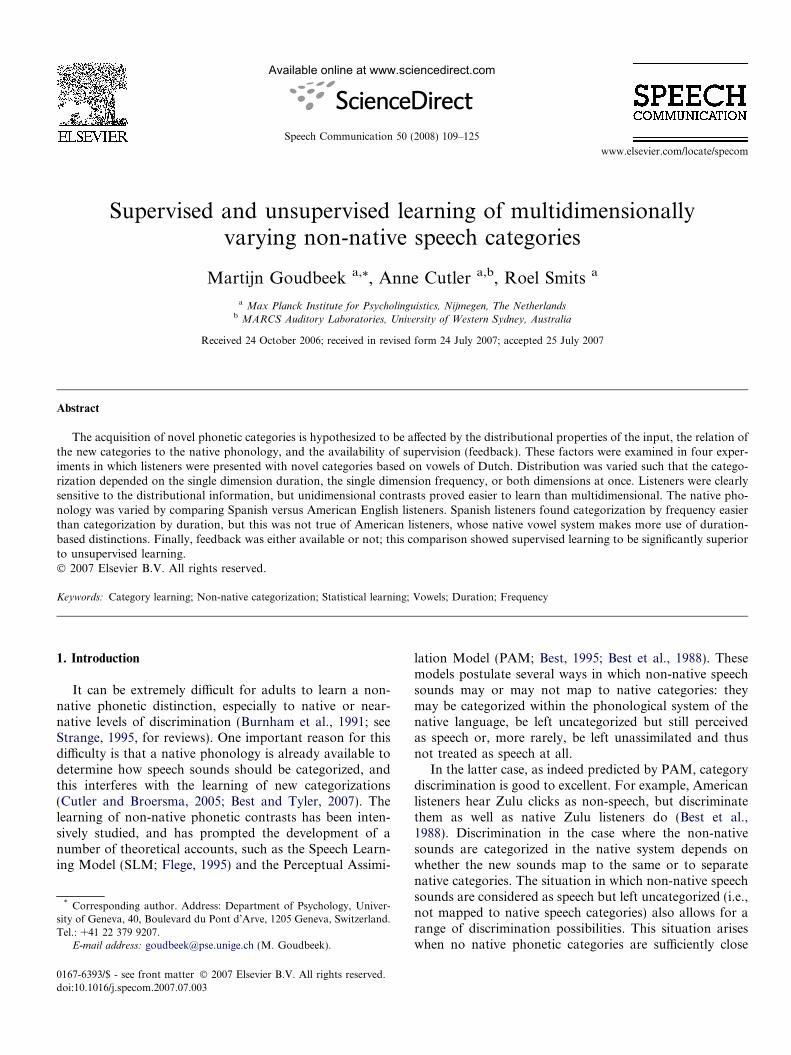
Our experiments, modeled on these studies of visual cat-egory learning, all consisted of a pretest, a learning phaseand a maintenance phase. The first panel of Fig. 2 showsthe distributional structure of the pretest. The dimensionsduration and formant frequency define the differencebetween the stimulus categories as described in Section2.1.2. The stimuli are drawn from an equidistant grid withan equal range of variation as defined by just noticeabledifferences in both stimulus dimensions. In the pretest, thisgrid is intended to neutrally scan the listener’s initial cate-gorization tendencies.
The second through fourth panel show the learningphases of the various experiments. The second and thirdpanel depict category structures called ‘‘unidimensionallearning’’. In these cases, one dimension of variation isrelevant to the classification of the vowel stimuli whileanother dimension is irrelevant for this classification. Foroptimal performance, listeners have to learn to use onlythe relevant dimension in their categorizations and ignorethe other dimension. In the second panel, listeners aretrained to use duration as a relevant dimension and ignoreformant frequency variation, while in the third panel, lis-teners have to learn to use formant frequency in categoriza-tion but ignore duration. In contrast, in the type ofcategory structure in panel four (‘‘multidimensionallearning’’), both dimensions exhibit relevant variation.For optimal performance here, listeners have to learn touse both dimensions in categorization. The use of onlyone dimension would lead to a high proportion of incorrectcategorizations. The learning phase of each experiment wasanalyzed in two parts (learning phases 1 and 2) to examinecategorization behavior over time. All experiments wererun in a single session with a short intermediate pause
without distributional information, training phases with distributionalthat is identical to the pretest.

112 M. Goudbeek et al. / Speech Communication 50 (2008) 109–125
between the two phases, and all ended with a maintenancephase consisting of the same stimuli as the pretest. Thisagain was intended to assess the listeners’ perceptual spacein the absence of distributional information. If listenerslearned a new category structure in the learning phaseand were able to transfer this learning to the maintenancephase, then performance in the maintenance phase shouldresemble that of the learning phase, and should differ fromperformance in the pretest.
The auditory categories which we manipulated werethree Dutch vowels. The Dutch vowel inventory containsthirteen monophthongs and three diphthongs (Gussenho-ven, 1999, in press; Booij, 1995), with three mid-to-highfront-central vowels: /Y/ (as in /fYt/, ‘‘fut’’; ‘‘energy’’), /y/(as in /fyt/,‘‘fuut’’; ‘‘grebe’’) and /ø/ (as in /føt/, ‘‘feut’’;‘‘freshman’’). These vowels differ primarily in the frequencyof their first formant and in their duration. The sounds /Y/and /y/ do not differ greatly in length, but /y/ has a lowerfirst formant frequency, while the sounds /ø/ and /Y/ havesimilar frequency spectra, but /ø/ has a longer duration.
To examine the role of native category structure in cat-egory acquisition, we chose listeners whose native languagehas none of these vowels (not difficult, given that Dutch iscross-linguistically atypical in having so many vowels inthis area of the vowel space). We sought to achieve the sit-uation in which category assimilation does not happen, butsounds are still recognized as speech. This should happenwhen the sounds are located in a relatively empty area ofphonetic space. A specific prediction about such cases ismade by SLM: the distance of each non-native categoryto the closest native phoneme categories will affect categoryacquisition success, with more distinct categories being eas-ier to learn (Flege, 1995; and see Aoyama et al., 2004, forconfirmation of this prediction). Furthermore, the rele-vance of the required categorization dimensions to nativecategorization decisions will also play a role. We testedlisteners with two language backgrounds: Castilian Spanishand American English.
Spanish has a relatively small vowel inventory of fivevowels: /i/, /e/, /a/, /o/, and /u/ that differ in height, back-ness and roundedness (Hammond, 2001; Bradlow, 1995;Flege, 1989). These articulatory dimensions correlate withthe first and second formants of the acoustic signal. Thehigh vowels /i/ and /u/ have low values for F1, whereasthe higher values of F1 are associated with the mid (/o/and /e/) and low (/a/) vowels. Backness and roundednessare associated with low values for F2 (/u/, /o/, and /a/)whereas front and unrounded vowels (/e/ and /i/) have ahigh value for F2 (Bradlow, 1995). Importantly, Spanishdoes not have durational contrasts between vowels asDutch does in contrasting /Y/ and /ø/ (Booij, 1995; Gus-senhoven, in press). Furthermore, the Spanish vowels areall located at the periphery of the F1/F2 vowel space. Thusthe Dutch vowels closer to the center of F1/F2 spaceoccupy an empty part of Spanish vowel space, and arearguably too far from any native Spanish vowel categoryfor assimilation to be possible.
American English has, like Dutch, a large vowel inven-tory: 15 vowels (Ladefoged, 1999), including the centralvowel schwa. Nonetheless, the area in vowel space that cor-responds to the three Dutch vowels /Y/, /y/, and /ø/ is forthe most part unused in American English. Thus again, thevowels should not be assimilated to a native category.However, given that American English has more vowel cat-egories and does not restrict vowels to the periphery of F1/F2 space, listeners may be more inclined to integrate thecloser exemplars of the Dutch stimuli into their phonolog-ical system. Furthermore, American English vowels exhibitsignificant variation in duration, the smallest minimum-to-maximum range in the adult data of Hillenbrand et al.(1995) being 182 ms for /I/, and the largest 272 ms for /u/.English listeners are highly sensitive to vowel duration asa cue to postvocalic consonantal voicing (Lisker, 1978),and cannot refrain from using this cue even when it is unin-formative (Broersma, 2006). They have also been shown tobe sensitive to duration when categorizing vowels (McAll-ister et al., 2002; Nearey, 1989). For all these reasons, wepredict that acquisition of these Dutch vowel categoriesshould be easier for American English than for Spanishlisteners.
In Experiment 1, we compared supervised learning bySpanish listeners of the contrast between /ø/ (longer dura-tion) and /Y/ (shorter duration), versus the contrast of /Y/(higher F1) with /y/ (lower F1). In Experiment 2, unsuper-vised learning of the same contrasts was investigated. InExperiment 3, supervised learning of the duration-baseddistinction between /ø/ and /Y/ by American English listen-ers was addressed, for comparison with the Spanish listen-ers’performance on the same task. Finally, in Experiment 4American English listeners were trained, with supervision,on the multidimensional distinction between /ø/ (longerduration and high F1) and /y/ (shorter duration and lowerF1). To categorize these stimuli successfully,listeners mustuse both dimensions at once, a task that is difficult for lis-teners of various language groups (Flege and Hillenbrand,1986).
2. Experiment 1
Experiment 1 investigated supervised learning of cate-gory distinctions based on one relevant dimension (eitherduration or formant frequency) in Spanish listeners.
2.1. Method
2.1.1. Subjects
Twenty Spanish exchange students from the RadboudUniversity Nijmegen participated in the experiment (tenin each condition). None spoke another language besidesEnglish, but most were engaged in learning Dutch. Theyrated their proficiency in English on a five point scale(0 = bad, 3 = average, 5 = good) as above average(l = 3.5, r = 0.90, N = 20). Their proficiency in Dutchwas low, with only a few subjects rating proficiency as

M. Goudbeek et al. / Speech Communication 50 (2008) 109–125 113
being present at all (l = 1.4, r = 0.89, N = 4). All listenersreported normal hearing and were within the normalundergraduate age range. After the experiment they filledin a questionnaire intended to assess whether they recog-nized the stimuli as vowels; they all qualified the stimulias such.
2.1.2. Stimuli
The categories of both conditions each had one relevantdimension of variation (see the second and third panel ofFig. 2). We defined the two categories as probabilitydensity functions in a multidimensional formant fre-quency · duration space. The nature of the probabilitydensity functions (their means and covariance matrices)governed the relevance of each dimension for categoryjudgments. Fig. 1 displays the actual stimulus distributionsused in the experiments.
In Condition 1, the variation in duration was relevant,whereas formant frequency varied irrelevantly with respectto category membership. The means of the two categoriescorresponded to the Dutch vowels /Y/ and /ø/ as in theDutch words ‘‘fut’’ (/fYt/, 388 Hz and 120 ms) and ‘‘feut’’(/føt/, 392 Hz and 162 ms). These vowels differ from eachother primarily in the duration dimension with /ø/ beinga lengthened version of /Y/ (Booij, 1995; see also Flege,1992 for further discussion concerning the relationshipbetween English and Dutch vowels). Native Dutch listeners
Table 1Stimulus characteristics of the phonetic categories used in Experiments 1–3
Learning stimuli
Category A ‘‘/ø/’’ as in feut
Means r
Condition 1 (duration relevant) 52.2 D 0.34 D165 ms 12.4 ms9.1 ERB 1.88 ERB392 Hz 127.0 Hz
Category A ‘‘/y/’’ as in fuut
Condition 2 (frequency relevant) 50.4 D 1.2 D113 ms 33 ms8.16 ERB 1.3 ERB328 Hz 87.7 Hz
Maintenance stimuli
Mean Min
Duration 51.1 D 50.0 D131 ms 101 ms
Frequency 9.0 ERB 7.8 ERB375 Hz 299 Hz
F2 F3
Fixed formants 19.6 ERB 22.3 ERB1657 Hz 2292 Hz
The rows presenting the stimuli of Conditions 1 (duration relevant) and 2 (formcounterpart of ms) and the values for the first formant in Hz and ERB (the perBoth conditions have the same maintenance phase stimuli. The mean, minimaMeans for the dimensions that vary in each condition are in boldface. The lageneration of all stimuli. Bandwidths were set at 10% of the frequency.
respond to gated fragments of /ø/ with a predominantresponse of /Y/ (Smits et al., 2003). In Condition 2,duration varied irrelevantly and formant frequency wassystematically varied. The means of the two categoriescorresponded to the Dutch vowels /Y/ and /y/ as in theDutch words ‘‘fut’’ (/fYt/, 388 Hz, 102 ms) and ‘‘fuut’’ (/fyt/,328 Hz 113 ms). These vowels differ from each otherprimarily in the frequency of their first formant (formantfrequency) with /y/ being a higher (more fronted) versionof /Y/ (Booij, 1995). Native listeners do not confuse gatedfragments of these vowels (Smits et al., 2003). Both vowelsoccur commonly in Dutch. The vowels were synthesizedusing the PRAAT speech synthesis program (Boersmaand Weenink, 2003).
Careful listening by native Dutch listeners (the first andthird author) confirmed that the means of the categoriesqualified as good examples of the two Dutch vowels. Thevalues for the learning stimuli were obtained by randomsampling from the two stimulus distributions.
The pretest and maintenance stimuli were identical inboth conditions. The stimulus values for the pretest andthe maintenance phase were obtained from an equidistantlyspaced grid with duration and formant frequency as dimen-sions (see the rightmost panel of Fig. 2). The formant fre-quency values in the grid ranged between the means of thestimuli from the learning phase. The range of stimulus dura-tion expressed in just noticeable differences (jnds) was equal
Category B ‘‘/Y/’’ as in fut
q Means r q
�0.10 50.1 D 0.28 D �0.08102 ms 6.6 ms9.1 ERB 1.8 ERB388 Hz 120 ms
Category B ‘‘/Y/’’as in fut
�0.08 50.1 D 0.28 D �0.10102 ms 6.6 ms9.1 ERB 1.8 ERB388 Hz 120 Hz
Max Stepsize
52.2D 0.15 D/step166 ms 5.9 ms/step
10.2 ERB 0.17 ERB/step457 Hz 11.7 Hz/step
F4 F5
26.2 ERB 28.2 ERB3607 Hz 4845 Hz
ant frequency relevant) list stimulus duration in ms and D (the perceptualceptual counterpart of Hz). Any deviation of q from 0 is due to sampling.l, and maximal duration and formant frequency values of these are listed.st row presents the values of the four fixed formants F2–F5 used in the

Fig. 3. Percentage correct (a) and d 0 (b) values for the two learning phasesof Experiment 1, as a function of relevant dimension (duration versusfrequency).
114 M. Goudbeek et al. / Speech Communication 50 (2008) 109–125
to the number of jnds of the frequency range. In the learningphase, the distance between the category means was 20 jnds;in the maintenance phase, the stimuli ranged between thesemeans in seven equidistant steps.
Table 1 lists the summary statistics for the stimuli usedin the pretest, the learning phase and the maintenancephase. Any differences between category A and B in for-mant frequency in Condition 1, or in duration in Condition2, are entirely due to sampling variation.
2.1.3. Procedure
Listeners were seated in a soundproof booth in front ofa computer screen and a two-button response box. Theirtask was to assign each stimulus to group A or B, usingthe two buttons. They were given no further informationabout the category labels or their response options.
The pretest (to detect preexisting categorization tenden-cies) and maintenance phase both consisted of 196 teststimuli (49 stimuli times 4 repetitions), whose values rangedbetween the mean values of both categories (see the ‘‘unidi-mensional learning’’ panels of Fig. 2). In the pretest andmaintenance phase no feedback was given on listeners’ cat-egorizations. Once a participant had selected a categorylabel on a trial, the monitor would display (the Spanishequivalent of) ‘‘next’’ for 700 ms and the next stimuluswas played after a 200 ms delay. In the maintenance phase,listeners were asked to continue to categorize as they haddone at the end of the learning phase.
The learning phase consisted of 448 stimuli (2 catego-ries · 2 repetitions · 112 stimuli per category) presentedat a comfortable level through Sennheiser headphones(HD 270). The stimuli were presented in random order intwo sessions, separated by a brief rest period. All 112 stim-uli from each category were presented once in each session.In contrast to the pretest and maintenance phase, trial-by-trial feedback was provided during the learning phase.Once participants had selected a category label on a trial,the monitor displayed (the Spanish equivalent of) ‘‘right’’in green letters for 700 ms immediately following theresponse if the categorization was correct, and (the Spanishequivalent of) ‘‘wrong’’ in red letters if the categorizationwas incorrect. After the visual feedback disappeared, a200 ms blank screen preceded the next stimulus.
After the experiment all participants filled out a ques-tionnaire asking them whether they had recognized thesounds as speech, whether they had labeled the groups inany way, and whether they spoke a language besidesEnglish.
2.2. Results and discussion
2.2.1. Signal detection analysis
As a first analysis, percent correct and d 0 were calculatedfor the learning phases of each condition; these are dis-played in Fig. 3a and b respectively. Recall that in the pre-test and maintenance phase a stimulus grid was usedwithout feedback, so correct and incorrect categorization
did not apply in these phases and hence these measurescannot be calculated; these phases are analyzed in detailin Section 2.2.2. Both percentage correct and d 0 show aclear increase in performance from the first to the secondlearning phase, indicative of a learning effect.
The percentage correct was significantly above chance inall phases of the experiment (minimum t [9] = 2.92,p < 0.05). To investigate the learning effect, we conductedan ANOVA with Learning phase (The first half versusthe second half of the learning phase) as within-subjectsvariable and Condition (Duration relevant versus Fre-quency relevant) as between-subjects variable. This analysisshowed the percentage correct to be significantly higher inthe second learning phase (F [1,18] = 6.30, p < 0.05), whichdid not interact with Condition. Further, the analysisshowed that when frequency was the relevant dimensionsubjects tended to achieve better categorization perfor-mance compared to when duration was the relevant dimen-sion (F [1,18] = 3.066, p < 0.097).
In all learning phases and conditions, d 0 was signifi-cantly above zero (minimum t [9] = 1.89, p < 0.05), thevalue Macmillan and Creelman (1991) associate with iden-tical distributions of perceptual effects of two stimuli. Aswith percentage correct, the main effect of Learning phasewas significant (F [1, 18] = 7.58, p < 0.05) and the effect ofCondition was close to significance (F [1,18] = 4.08, p <0.06). Again, the main effects did not interact.

M. Goudbeek et al. / Speech Communication 50 (2008) 109–125 115
The signal detection measures thus show a clear picture.There was a learning effect in both measures. There was norobust difference between conditions, although the condi-tion in which frequency was the relevant dimension tendedto be preferred. Because signal detection measures do notdifferentiate by dimension, and are not applicable to thepretest or maintenance phase, all four experimental phaseswere also analyzed with logistic regression.
2.2.2. Logistic regression
The binary choice design (every answer is either cate-gory A or category B) is very well suited to a logisticregression (Agresti, 1990). A logistic analysis yields twob-weights (which can be significant or not) indicating theextent to which each dimension explains the variation inthe data. These b-weights are calculated for each listenerindividually and then averaged. To probe for learning,the two learning phases were analyzed separately. Table 2shows mean b-weights and standard deviations of thedimensions duration and formant frequency for the pretest,the two learning phases, and the maintenance phase.
In addition to b-weights, a logistic regression procedurealso gives a significance level, indicating whether a b-weightdiffers from zero and contributes significantly to the regres-sion model. If the level was not significant for a givendimension, we concluded that listeners did not use thisdimension in their categorization. The columns ‘‘Uni’’and‘‘Multi’’ in Table 2 show how many subjects made signifi-cant use of one or of both dimensions, respectively. Thesecategories are mutually exclusive and the few subjects who
Table 2Logistic regression results of Experiment 1 in which Spanish listeners weretrained with supervision to categorize stimuli with relevant variation inone dimension and irrelevant variation in the other dimension
Condition 1, duration relevant(N = 10)
Condition 2, F1 relevant(N = 10)
l(b) r(b) Uni Multi l(b) r(b) Uni Multi
Pretest
Relevant 1.01 0.63 2 3 1.16 1.80 2 2Irrelevant 1.55 1.97 2 0.93 0.88 4
Learning phase 1
Relevant 0.71 0.75 5 3 1.67 1.74 7 1Irrelevant 0.17 0.1 1 0.24 0.17 0
Learning phase 2
Relevant 1.52 1.55 6 2 1.73 1.39 7 1Irrelevant 0.26 0.26 2 0.32 0.31 0
Maintenance phase
Relevant 1.99 1.61 4 3 2.94 2.58 5 2Irrelevant 1.06 1.10 2 0.35 0.46 1
The table displays the results of the pretest, learning phases and mainte-nance phase of Condition 1 (duration relevant) and Condition 2 (formantfrequency relevant). The mean b-weights and their standard deviations aswell as the number of listeners using one (‘‘Uni’’) or both (‘‘Multi’’)dimensions significantly are shown. Listeners using no dimension signifi-cantly are not shown.
used neither dimension have been omitted (given N, thisnumber can be easily calculated).
The results in Table 2 show the sensitivity of listeners tothe information provided to them (trial-by-trial feedbackand distributional information). In all phases except thepretest, the mean b-weights for the relevant dimension werehigher than those for the irrelevant dimension. There weresome differences between Conditions 1 and 2, possiblyreflecting the preference for formant frequency as a rele-vant dimension also indicated in the signal detection anal-ysis. First, the b-weight for the relevant dimension inCondition 1 was low in the first learning phase, suggestingan a priori reluctance to use this dimension. Similarly, inthe maintenance phase ignoring irrelevant durational vari-ation (Condition 2) appeared to be easier than ignoringirrelevant formant frequency variation (Condition 1).
These effects were evaluated with an ANOVA with Partof the experiment and Dimension (Relevant versus Irrele-vant) as within-subjects variables and Condition asbetween-subject variable. The learning effect was presentin the overall preference for the relevant over the irrelevantdimension (F [1, 18] = 7.86, p < 0.05) and in the increasein mean b-weight as the experiment progressed(F [3, 54] = 9.096, p < 0.05). There was no difference in per-formance between Conditions (F [1,18] = 0.17, n.s.). Thepreference of our listeners for formant frequency in the Pre-test resulted in a significant interaction between Part of theexperiment and Dimension (F [1, 54] = 7.45, p < 0.05).
The results of Experiment 1 show that Spanish listenerswere clearly able to learn a non-native category distinctioncharacterized by relevant variation along one dimensionand irrelevant variation along another when provided withtrial-by-trial feedback. Independently of whether the rele-vant dimension was relatively unfamiliar (recall that dura-tion does not play a significant role in the Spanish vowelsystem) or very familiar (formant frequency), our listenerswere sensitive to the cues provided to them and couldmaintain the distinction they learned in the maintenancephase.
The trial-by-trial feedback provided in this experiment isnot often available to the language learner. Infants acquir-ing a first language must rely exclusively on distributionalinformation, and adults learning a second language alsorely principally on distributional information, with feed-back applied more to production than perceptual perfor-mance. In the native language, lexical information can beused to fine-tune existing categories (Norris et al., 2003),but such information cannot by definition create new cate-gories. Therefore, in Experiment 2, unsupervised learningof the same speech categories as in Experiment 1 isinvestigated.
3. Experiment 2
Experiment 2 investigated unsupervised learning of cat-egory distinctions based on one relevant dimension (eitherduration or formant frequency) in Spanish listeners.

116 M. Goudbeek et al. / Speech Communication 50 (2008) 109–125
3.1. Method
3.1.1. Subjects
Fourteen Spanish exchange students from the RadboudUniversity Nijmegen participated in the experiment (six inCondition 1 and eight in Condition 2). None spoke anotherlanguage besides English, but most were engaged in learn-ing Dutch. Their proficiency in Dutch was low. All subjectsreported normal hearing. Again, all listeners judged thestimuli to be vowels or very vowel-like on the post-experi-ment questionnaire.
3.1.2. Stimuli and procedure
All stimuli were as in Experiment 1, and the procedurein the pretest and maintenance phase was also as in Exper-iment 1. In the learning phases, however, in contrast to theprocedure of Experiment 1, no trial-by-trial feedback wasprovided. In all four phases of the experiment, the subject’stask was to assign each stimulus to group A or B, using thetwo-key button box, after which the monitor would display(the Spanish equivalent of) ‘‘next’’ for 700 ms and the nextstimulus was played after a 200 ms blank screen. Theexperiment lasted approximately 45 min.
Fig. 4. Percentage correct (a) and d 0 (b) values for the two learning phasesof Experiment 2, as a function of relevant dimension (duration versusfrequency).
3.2. Results and discussion
3.2.1. Signal detection analysis
The signal detection measures percent correct and d 0 arepresented in Fig. 4. It is clear that performance in Condi-tion 2 was better than in Condition 1. The results show lit-tle indication of the learning effect found in Experiment 1in the difference between learning phases.
Before statistically testing these observations we firsttested whether performance differed significantly fromchance. The chance level for an experiment without feed-back is less obvious than in an experiment with supervi-sion. In order to calculate percent correct, each responsemust be labeled ‘‘right’’ or ‘‘wrong’’. In supervised learn-ing, this is done a priori by the experimenter. In unsuper-vised learning, however, the experimenter has to infer thelistener’s mapping of stimulus and category. Some listenerswill associate one category with label A and the other withlabel B, while others will use the reverse pattern.
For each listener, the category most associated withresponse A was defined as category A for subsequentanalysis. As a consequence, subjects always perform ator above chance level. Therefore, the chance level isnot simply at 50% correct but has to be adjusted. Wecalculated the expected value for chance level for 224 stim-uli from a binomial distribution and the transformedpercent correct, leading to an adjusted chance level of52.66%.
In Condition 1, when duration was the relevant dimen-sion, percentage correct did not differ from chance in thefirst (t [5] = 1.65, n.s.) or second learning phase(t [5] = 1.47, n.s.). However, in Condition 2, when formant
frequency was the relevant dimension, both the percentagecorrect of the first learning phase (t [7] = 8.23, p < 0.05)and that of the second learning phase (t [7] = 7.66,p < 0.05) differed significantly from chance. This differencebetween the two conditions also appeared in the main effectfor Condition in the ANOVA (F [1,12] = 7.77, p < 0.05)with Learning phase as within-subject variable. Perfor-mance did not improve over time, judging by the absenceof a significant effect of Learning phase (F [1, 12] = 0.012,n.s.).
The d 0 results mirror those of the percentage correct. Incondition 1 (duration relevant), none of the d 0s differed sig-nificantly from zero, whereas in condition 2 (formant fre-quency relevant) the d 0s of both learning phases differedsignificantly from zero (tmin = 4.83). The d 0s in Condition2 also were well above 1, the size traditionally associatedwith a true perceptible difference, so subjects were able todistinguish the two categories. In Condition 1, this wasnot the case. As with percentage correct, the two Condi-tions differed (F [1, 12] = 5.85, p < 0.05) and there wereno other significant effects.
Thus, according to the signal detection analysis, perfor-mance depended on which dimension was relevant. Whenformant frequency was the relevant dimension, listenersused this dimension appropriately; when duration wasrelevant, this was not the case.

M. Goudbeek et al. / Speech Communication 50 (2008) 109–125 117
3.2.2. Logistic regression
Table 3 shows the mean b-weights of Condition 1 (dura-tion relevant) and Condition 2 (formant frequency rele-vant) for all four parts of the experiment.
Unsupervised learning of category structures with rele-vant variation in only one dimension appears to be difficult.An ANOVA with Dimension (Relevant versus Irrelevant),and Part of the experiment as within-subjects variablesand Condition as between-subjects variable was conductedto assess any effect. For Dimension, no significant effectwas found (F [1,12] = 0.345, n.s.). This means that partici-pants did not show an overall preference for the relevantdimensions over the irrelevant one; instead they all preferredformant frequency over duration. While there was a signifi-cant effect of Part of the experiment (F [3,36] = 21.04,p < 0.05), this is probably due to the differences betweenthe b-weights of the training phases and the pretest/mainte-nance phases of the different conditions and not to a reallearning effect. Significant interactions between Part of theexperiment and Condition (F [3,36] = 7,25, p < 0.05) andPart of the experiment and Dimension (F [3, 36] = 3,93,p < 0.05) support this interpretation. To further investigatethis, we conducted separate analyses per condition and foreach combination of pretest/maintenance (Equidistant grid)phase and learning phase 1/learning phase 2 (Learningphase). This showed that the interactions were carried bythe interaction between the Dimension and Equidistant grid(Pretest versus Maintenance phase) in Condition 2(F [1,7] = 7.928, p < 0.05). So, only when formant fre-quency was relevant, listeners used the relevant dimensionmore in the maintenance phase than they used the irrelevantdimension in the pretest.
Table 3Logistic regression results of Experiment 2 in which Spanish listenerslearned to categorize stimuli with relevant variation in one dimension andirrelevant variation in the other dimension without supervision
Condition 1, duration relevant(N = 6)
Condition 2, F1 relevant(N = 8)
l(b) r(b) Uni Multi l(b) r(b) Uni Multi
Pretest
Relevant 1.02 1.47 2 0 1.27 1.82 2 2Irrelevant 1.19 1.35 3 1.79 1.23 4
Learning phase 1
Relevant 0.86 1.15 2 1 0.74 1.41 6 0Irrelevant 0.66 0.37 3 0.18 0.21 1
Learning phase 2
Relevant 0.93 1.35 1 1 0.53 0.77 7 0Irrelevant 0.67 0.36 4 0.13 0.12 0
Maintenance phase
Relevant 1.38 1.96 2 0 3.20 2.30 6 0Irrelevant 0.96 1.25 2 0.68 0.87 2
The table displays the results of the pretest, learning phases and mainte-nance phase of Condition 1 (duration relevant) and Condition 2 (formantfrequency relevant). The mean b-weights and their standard deviations aswell as the number of Listeners using one (‘‘Uni’’) or both (‘‘Multi’’)dimensions significantly are shown. Listeners using no dimension signifi-cantly are not shown.
Experiments 1 and 2 show that the quantitative differ-ences between supervised and unsupervised learning are con-siderable. A joint ANOVA with Supervision, Dimension,and Condition as between-subjects variable and Part of theexperiment as within-subjects variable should show a signif-icant effect of Supervision. Due to considerable variability inperformance between both experiments, and relatively smallsample sizes, the difference between supervised and unsuper-vised learning was not significant (F [1, 33] = 0.27, n.s.) norwere there any relevant interactions.
The results of Experiments 1 and 2 indicate a preferenceof our Spanish listeners for the dimension of formant fre-quency. The percentage correct levels in particular showedthat performance was better when formant frequency wasthe relevant dimension. We hypothesize that this is becauseof the phonological structure of the language, where dura-tion is not important for distinguishing vowels but formantfrequency is (Hammond, 2001).
We next tested listeners whose phonology differed fromthat of the Spanish listeners in Experiments 1 and 2; inExperiment 3, Condition 2 of Experiment 1 was repeatedwith speakers of American English. While duration maynot strictly speaking be a phonemic cue in American Eng-lish, as described above there is significant variation acrossvowels in average duration (Hillenbrand et al., 1995), andlisteners use duration for distinguishing voicing (Lisker,1978) as well as in discriminating between tense and laxvowels (Nearey, 1989). No such differentiation is necessaryin Spanish, which has only tense vowels (Hammond, 2001).Better performance by the American listeners than theSpanish listeners would indicate effects of the native pho-nological system in learning new phonetic categories.
4. Experiment 3
To investigate the influence of the native phonology,Experiment 3 compared supervised learning performanceof Spanish and American English listeners of a categorydistinction based on duration.
4.1. Method
4.1.1. Subjects
Ten undergraduate students from the University of Wis-consin, Madison, all native speakers of American English,participated in the experiment and were paid for their par-ticipation. None spoke another language besides English,and all reported normal hearing. The post-experimentquestionnaire again revealed that all listeners judged allthe sounds to be vowels.
4.1.2. Stimuli and procedure
The stimuli were identical to those in Condition 1 ofExperiments 1 and 2; duration was the relevant dimensionfor categorization, and formant frequency varied irrele-vantly. The procedure was similar to that of Experiment1: a pretest, two learning phases and a maintenance phase.
118 M. Goudbeek et al. / Speech Communication 50 (2008) 109–125
After the listeners had received instructions and signedconsent forms, they were seated in a soundproof booth.The pretest and the maintenance phase were identical: sub-jects were asked to categorize the stimuli into two groups.In the pretest this was done spontaneously, while in themaintenance phase subjects had to try to maintain theresponse pattern they had discovered in the learning phase.In the learning phase listeners assigned sounds to one oftwo buttons. If a sound was assigned correctly, a lightabove the button would light up. If a sound was notassigned correctly, the light belonging to the other buttonwould light up, giving the listener trial-by-trial feedbackabout the correct response. Listeners were asked to catego-rize correctly as many stimuli as they could with the feed-back given. In the learning phase, 112 stimuli from eachcategory were again presented twice, resulting in 448 trials.After the experiment, participants filled out a questionnaireequivalent to that used in the previous experiments.
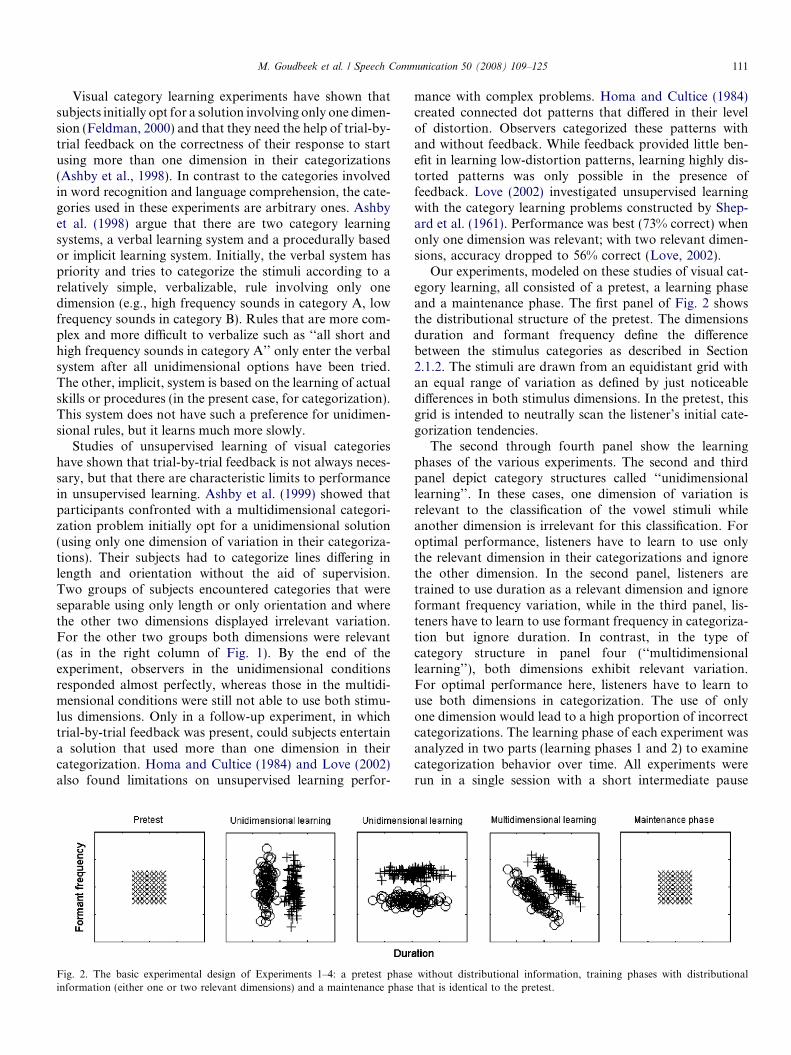
Fig. 5. Percentage correct (a) and d 0 (b) values for the two learning phasesof Experiment 3 (American English listeners), with, for comparison, theequivalent results for the Spanish listeners in Condition 1 of Experiment 1.In both cases duration was the relevant dimension of variation.
4.2. Results and discussion
4.2.1. Signal detection analysis
Again, percent correct and the d 0 were calculated foreach condition and part of the learning phase. Fig. 5 dis-plays these results. All d 0s differed significantly from zero(minimum t [9] = 6.91, p < 0.05) and all percentagescorrect were significantly above chance (minimumt [9] = 8.11, p < 0.05), this time with 50% as the expectedvalue since the categories are predefined. We comparedthe results from Condition 2 from Experiment 1 with thoseof Experiment 3 in an ANOVA with Language (Spanishversus English) as between-subjects variable and Learningphase (learning phase 1 versus learning phase 2) aswithin-subjects variable with percent correct and the d 0 asdependent measures.
There was a significant difference in performancebetween the two language groups. The performance ofEnglish listeners exceeds that of Spanish listeners both inpercent correct (F [1, 18] = 5.17, p < 0.05) and d 0 (F [1,18] = 5.45, p < 0.05) in the absence of any significant inter-actions between Learning phase and Language. The signif-icant main effect of Learning phase (F [1,18] = 8.71,p < 0.05 for both percent correct and F [1,18] = 33.57,p < 0.05 for d 0) shows that both language groups were ableto learn to use the relevant dimension, duration.
Thus categorization based on duration was more suc-cessfully achieved by English listeners, who are more famil-iar with distinguishing vowels based on duration due totheir native phonology (Mermelstein, 1978; Whalen,1989), than by Spanish listeners, who are not as familiarwith duration as a cue to vowel category identity (Navarro,1968).
1 In fact, all main effects and all interactions were significant except thethree-way interaction between Part of the experiment, Dimension, andLanguage.
4.2.2. Logistic regressionAs in Experiments 1 and 2, a logistic regression analysis
was performed. Table 4 displays the mean b-weights and
standard deviations, as well as the number of subjects usinga dimension significantly for each part of the experiment.
Fig. 5 as well as the comparison between Tables 4 and 2clearly show the differences between the two languages.The mean b-weights for the relevant dimensions werehigher for the American English listeners whereas the meanb-weights for the irrelevant dimension formant frequencywere higher for the Spanish listeners. These results indicatethat using the relevant dimension as well as suppressing anirrelevant one is more feasible when those dimensions playa role in the phonological structure of one’s language. Asignificant interaction between relevance of the dimensionand language in an ANOVA with Dimension, Languageand Part of the experiment as variables (F [1, 18] = 4.55,p < 0.05)1 warranted separate analyses for the relevantand the irrelevant dimension. For the relevant dimension(duration), there was no significant effect of Language,but for the irrelevant dimension (formant frequency) theb-weights of the Spanish listeners were significantly higher(F [1, 18] = 14.49, p < 0.05). This indicates that the Spanish
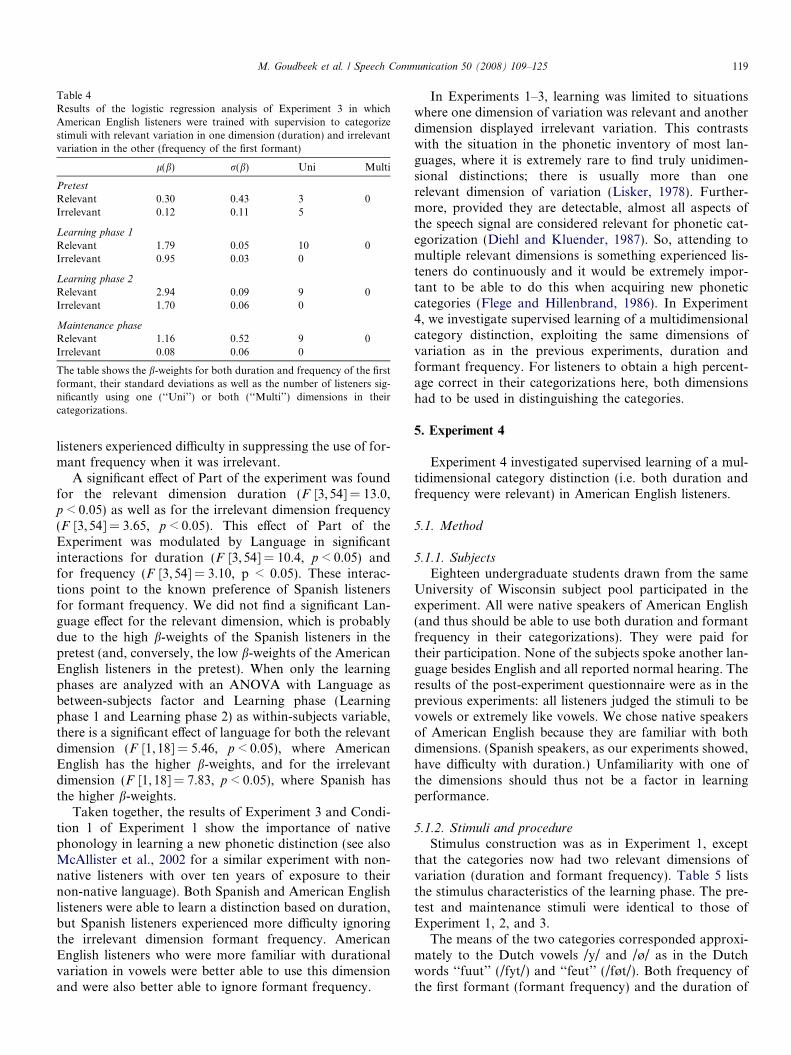
Table 4Results of the logistic regression analysis of Experiment 3 in whichAmerican English listeners were trained with supervision to categorizestimuli with relevant variation in one dimension (duration) and irrelevantvariation in the other (frequency of the first formant)
l(b) r(b) Uni Multi
Pretest
Relevant 0.30 0.43 3 0Irrelevant 0.12 0.11 5
Learning phase 1
Relevant 1.79 0.05 10 0Irrelevant 0.95 0.03 0
Learning phase 2
Relevant 2.94 0.09 9 0Irrelevant 1.70 0.06 0
Maintenance phase
Relevant 1.16 0.52 9 0Irrelevant 0.08 0.06 0
The table shows the b-weights for both duration and frequency of the firstformant, their standard deviations as well as the number of listeners sig-nificantly using one (‘‘Uni’’) or both (‘‘Multi’’) dimensions in theircategorizations.
M. Goudbeek et al. / Speech Communication 50 (2008) 109–125 119
listeners experienced difficulty in suppressing the use of for-mant frequency when it was irrelevant.
A significant effect of Part of the experiment was foundfor the relevant dimension duration (F [3,54] = 13.0,p < 0.05) as well as for the irrelevant dimension frequency(F [3,54] = 3.65, p < 0.05). This effect of Part of theExperiment was modulated by Language in significantinteractions for duration (F [3,54] = 10.4, p < 0.05) andfor frequency (F [3,54] = 3.10, p < 0.05). These interac-tions point to the known preference of Spanish listenersfor formant frequency. We did not find a significant Lan-guage effect for the relevant dimension, which is probablydue to the high b-weights of the Spanish listeners in thepretest (and, conversely, the low b-weights of the AmericanEnglish listeners in the pretest). When only the learningphases are analyzed with an ANOVA with Language asbetween-subjects factor and Learning phase (Learningphase 1 and Learning phase 2) as within-subjects variable,there is a significant effect of language for both the relevantdimension (F [1, 18] = 5.46, p < 0.05), where AmericanEnglish has the higher b-weights, and for the irrelevantdimension (F [1, 18] = 7.83, p < 0.05), where Spanish hasthe higher b-weights.
Taken together, the results of Experiment 3 and Condi-tion 1 of Experiment 1 show the importance of nativephonology in learning a new phonetic distinction (see alsoMcAllister et al., 2002 for a similar experiment with non-native listeners with over ten years of exposure to theirnon-native language). Both Spanish and American Englishlisteners were able to learn a distinction based on duration,but Spanish listeners experienced more difficulty ignoringthe irrelevant dimension formant frequency. AmericanEnglish listeners who were more familiar with durationalvariation in vowels were better able to use this dimensionand were also better able to ignore formant frequency.
In Experiments 1–3, learning was limited to situationswhere one dimension of variation was relevant and anotherdimension displayed irrelevant variation. This contrastswith the situation in the phonetic inventory of most lan-guages, where it is extremely rare to find truly unidimen-sional distinctions; there is usually more than onerelevant dimension of variation (Lisker, 1978). Further-more, provided they are detectable, almost all aspects ofthe speech signal are considered relevant for phonetic cat-egorization (Diehl and Kluender, 1987). So, attending tomultiple relevant dimensions is something experienced lis-teners do continuously and it would be extremely impor-tant to be able to do this when acquiring new phoneticcategories (Flege and Hillenbrand, 1986). In Experiment4, we investigate supervised learning of a multidimensionalcategory distinction, exploiting the same dimensions ofvariation as in the previous experiments, duration andformant frequency. For listeners to obtain a high percent-age correct in their categorizations here, both dimensionshad to be used in distinguishing the categories.
5. Experiment 4
Experiment 4 investigated supervised learning of a mul-tidimensional category distinction (i.e. both duration andfrequency were relevant) in American English listeners.
5.1. Method
5.1.1. Subjects
Eighteen undergraduate students drawn from the sameUniversity of Wisconsin subject pool participated in theexperiment. All were native speakers of American English(and thus should be able to use both duration and formantfrequency in their categorizations). They were paid fortheir participation. None of the subjects spoke another lan-guage besides English and all reported normal hearing. Theresults of the post-experiment questionnaire were as in theprevious experiments: all listeners judged the stimuli to bevowels or extremely like vowels. We chose native speakersof American English because they are familiar with bothdimensions. (Spanish speakers, as our experiments showed,have difficulty with duration.) Unfamiliarity with one ofthe dimensions should thus not be a factor in learningperformance.
5.1.2. Stimuli and procedureStimulus construction was as in Experiment 1, except
that the categories now had two relevant dimensions ofvariation (duration and formant frequency). Table 5 liststhe stimulus characteristics of the learning phase. The pre-test and maintenance stimuli were identical to those ofExperiment 1, 2, and 3.
The means of the two categories corresponded approxi-mately to the Dutch vowels /y/ and /ø/ as in the Dutchwords ‘‘fuut’’ (/fyt/) and ‘‘feut’’ (/føt/). Both frequency ofthe first formant (formant frequency) and the duration of

Table 5Stimulus properties of the multidimensional learning stimuli of Experi-ment 4
Category A ‘‘/ø/’’ as in feut Category A ‘‘/y/’’ as in fuut
Mean r q Mean r q
51.8 D 1.22 D 50.4 D 1.21 D158 ms 45.1 ms 113 ms 33.4 ms
�0.95 �0.959.9 ERB 1.32 ERB 8.16 ERB 1.33 ERB441.6 Hz 96.1 Hz 327.6 Hz 78.7 Hz
The duration in DUR (and ms) and formant frequency in ERB and theirrespective standard deviations are presented for both categories. Thepretest and maintenance stimuli are identical to those used in Experiment1 and can be found in Table 3.
120 M. Goudbeek et al. / Speech Communication 50 (2008) 109–125
the sound (duration) were varied in creating the categories:/y/ is shorter and has a lower F1 than /ø/ (see the fourthpanel of Fig. 2).
The procedure was as in Experiment 3: a pretest, twolearning phases and a maintenance phase. In the pretestand maintenance phases subjects categorized the stimuliinto two groups, in the pretest choosing labels as theywished, but in the maintenance phase trying to maintainthe rule they had discovered in the learning phases. Inthe learning phases trial-by-trial feedback was again pro-vided by lights above the response buttons.
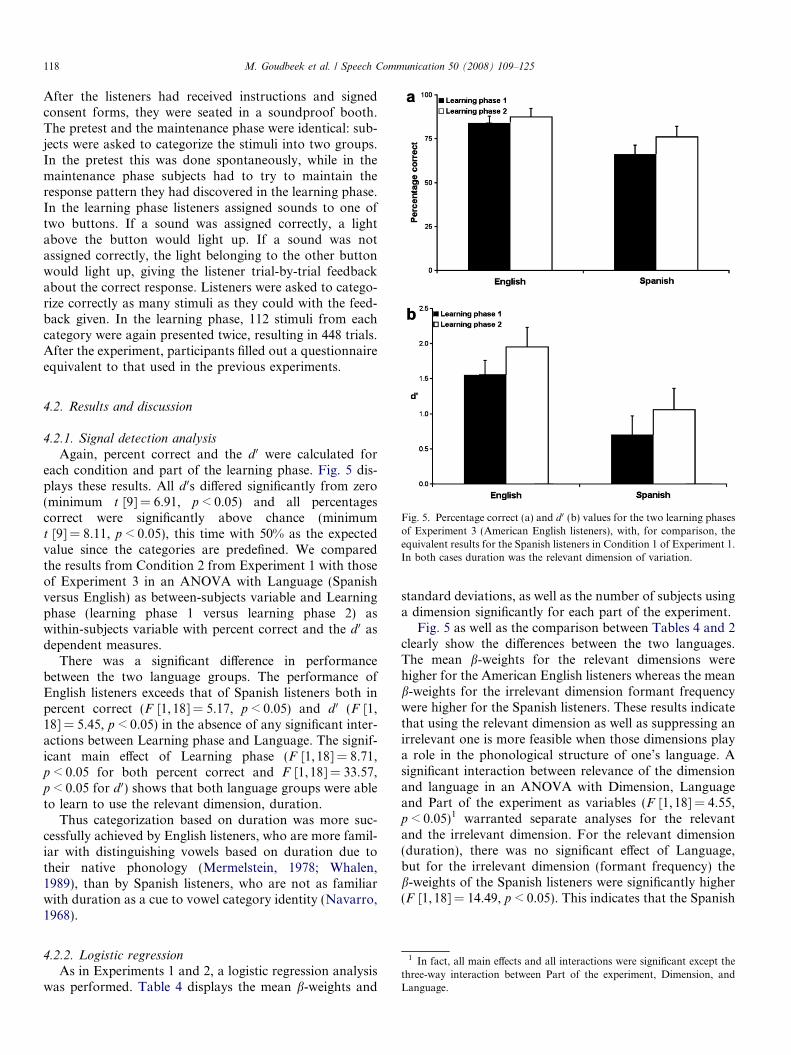
Fig. 6. Percentage correct (a) and d 0 (b) values for the two learning phasesof Experiment 4 (two relevant dimensions of variation).
5.2. Results and discussion5.2.1. Signal detection analysis
Fig. 6 shows mean percentage correct and mean d 0 forthe first and second learning phase of Experiment 4. Thepercentage correct and the d 0 differed significantly fromtheir respective chance levels (50% and 0) in all phases(minimum t [17] = 6.10, p < 0.05), but the differencebetween the first and second phase in the figures does notgive a strong indication for a learning effect. Two ANO-VAs with Learning phase as within-subject variable andpercentage correct or d 0 as dependent variables showedno significant effect for either percentage correct(F [1, 17] = 0.90, n.s.) or d 0 (F [1, 17] = 0.30, n.s.).
While the signal detection measures presented no evi-dence of learning over time, both differed significantly fromchance levels, indicating that listeners were sensitive to thedistributional information and the trial-by-trial feedbackthey received.
Fig. 7. Scatter plots of individual b-weights for the two dimensions(duration, formant frequency) in Experiment 4 (two relevant dimensionsof variation), for each of the four parts of the experiment.
5.2.2. Logistic regression
The four panels of Fig. 7 present the b-weights for dura-tion and formant frequency for each listener in each part ofthe experiment. The abscissa shows the b-weight for dura-tion and the ordinate shows the b-weight for frequency (seeNearey, 1997). Listeners who used both dimensions areidentified by asterisks, listeners who used only formant fre-quency as plus-signs, listeners who used only duration ascrosses, and listeners who used neither dimension signifi-cantly as circles. Optimal performance corresponds to a
point in the upper right hand corner of the Figure, witha u of 45� (both dimensions are given equal weight) andfar from the origin (reflecting consistent behavior).

Table 6Results of the logistic regression analysis of Experiment 4 in which Englishlisteners were trained with supervision on a category distinction whereboth dimensions were relevant
u (r) A (r) Uni Multi
Pretest
Duration 0.27 (0.28) 1.08 (0.67) 3 4F1 9
Learning phase 1
Duration 0.22 (0.20) 0.96 (0.77) 2 7F1 3
Learning phase 2
Duration 0.34 (0.28) 1.26 (0.89) 1 10F1 4
Maintenance phase
Duration 0.35 (0.24) 1.07 (0.77) 1 3F1 12
The angle u, the consistency measure A as well as their respective standarddeviations are shown, as well as the number of listeners significantly usingone (‘‘Uni’’) or both (‘‘Multi’’) dimensions in their categorizations. Lis-teners using no dimension are not shown (N = 18).
M. Goudbeek et al. / Speech Communication 50 (2008) 109–125 121
The upper left panel of Fig. 7 shows performance in thepretest. The majority of the listeners had a preference for aunidimensional solution with frequency (plus signs), whichhad also been the case in the pretest of Experiment 3. Theupper right and lower left panel show the learning phases.Over time, the number of listeners using both dimensions incategorization increases (more asterisks), as does their con-sistency (asterisks further from the origin). In the mainte-nance phase, when feedback was no longer given, muchof this learning seems to be lost and the number of listenersusing only formant frequency as the relevant dimension iseven larger than in the pretest.
Most subjects succeeded in reliably using one or moredimensions, although some failed to use any dimension sig-nificantly. It would be desirable to have a measure of themajority’s central tendency and variability, because simplycomputing the across-subjects average b-weights for eachof the dimensions would not be an effective way to charac-terize overall performance. For example, if half of thesesubjects used duration exclusively, and the others formantfrequency, the average b-weights might both exceed chancesuggesting that participants on average used both dimen-sions, even though no individuals did so. A measure thatintegrates performance on both dimensions would there-fore be useful.
Here, we derive such a measure by computing the angleformed by the line connecting each subject’s b-weight tothe origin, on a graph where the x-axis represents dura-tion,and the y axis frequency (as in Fig. 7), and also comput-ing the length of this line. These computations were done bytransforming the Cartesian coordinates of the b-weights forduration and frequency into the polar coordinates u (theangle with the horizontal axis in radians) and A (the distanceto the origin) by the following transformations:
A ¼ffiffiffiffiffiffiffiffiffiffiffiffiffiffiffiffiffiffiffiffiffiffib2
dur þ b2freq
qð1Þ
h ¼ ðbfreq=bdurÞ if bdur < 0 ð2aÞh ¼ ðbfreq=bdurÞ þ p if bdur > 0; u� 2p if u > p
ð2bÞ
In our analysis, u ranges between p and �p radians.When u equals 1/2p, listeners purely use frequency, whenu equals 0, listeners use only duration, but when u is closeto 1/4p performance lies between those two angles, i.e.both duration and frequency are used. As can be seen fromFig. 7, most listeners fall in the upper right plane, between0 and 1/2p.
The other polar coordinate, A, ranges between zero andplus infinity. A large A indicates that a subject was inter-nally consistent (though a large average A over subjectsneed not reflect consistent weights of each dimension),while a small A indicates that listeners’ categorizations tendnot to be internally consistent. In Fig. 7, the listeners whocategorized using both dimensions (the asterisks) are far-ther removed from the origin, while listeners who use nodimension significantly (the circles) are all very close to
the origin. Table 6 displays the mean values for u, A andtheir standard deviations as well as the number of listeners(total N = 18) using one or two dimensions significantly.
The central question is whether the mean u of eachlearning phase differed significantly from 0 (representinga unidimensional duration solution) and from 1/2p (repre-senting a unidimensional formant frequency solution). Thiswas tested with two t-tests corrected for the increased typeI error with Bonferroni correction for every phase of theexperiment. This resulted in significant differences withboth 0 and 1/2p in all phases (min t [17] = 2.47, allp < 0.05). The average u was multidimensional eventhough not all subjects categorized using a multidimen-sional rule (subjects using formant frequency canceledout those using duration). Importantly, the number oflisteners preferring the multidimensional solution over aunidimensional one increased during the learning phases,showing the ability of our listeners to profit from trial-by-trial feedback and distributional information. Flegeet al. (1997) show the ability of Spanish listeners to useeither duration or frequency (although seldom both simul-taneously) in identifying vowels.
The consistency measure A was statistically evaluated inan ANOVA with Part of the experiment as within-subjectvariable. As with the signal detection measures, the differ-ent phases of the experiment did not differ significantlyfrom each other (F [3,51] = 0.784, n.s.).
A final interesting comparison is that between unidimen-sional supervised learning and multidimensional supervisedlearning by our American English listeners. Percentage cor-rect and d 0 were analyzed in a joint ANOVA with Part ofthe experiment as within-subjects factor and Experiment(unidimensional versus multidimensional) as between-sub-jects factor. Performance in the unidimensional learningexperiment was consistently better for both percentage

122 M. Goudbeek et al. / Speech Communication 50 (2008) 109–125
correct (F [1, 26] = 24.67, p < 0.05 ) and d 0
(F [1, 26] = 31.14, p < 0.05).Experiment 4 thus showed that listeners were sensitive
to the distributional information and trial-by-trialfeedback provided to them in multidimensional categorylearning. However, performance in Experiment 4 wasconsiderably worse than in Experiment 3. Learning a cate-gory distinction with more than one relevant dimensionwas significantly more difficult than learning to use onedimension while simultaneously learning to ignore theother.
The amount of exposure our listeners received (448 stim-uli) was substantial for such experiments, but is insignifi-cant compared to the exposure received by infants, or byadults learning a second language. Despite this relativelysmall amount of exposure, more than half of the listenerswere able to use both dimensions after the learning phase.The loss of this ability in the maintenance phase that fol-lowed within minutes is striking. Listeners almost invari-ably prefer unidimensional solutions in category learning(Ashby et al., 1999). But although the learning phases ofExperiment 4 showed that this preference can be modified,without distributional information and trial-by-trial feed-back listeners reverted to unidimensional categorization.An explanation for this phenomenon is that our listenersmay be extremely sensitive to the removal of distributionalinformation favoring one dimension above the other. Inthe absence of this information in the maintenance phase,listeners adjusted their categorization tendencies to suit.Goudbeek et al. (in preparation), in a study with Dutch lis-teners, used a maintenance phase where feedback wasabsent, but distributional information remained present;their listeners were able to maintain the learned multidi-mensional categorization strategy in such a maintenancephase, consistent with the hypothesis that successful cate-gorization depends upon the availability of the distribu-tional information.
6. General discussion
The acquisition of speech categories by adult listeners issensitive to the distributional structure of the input, isaffected by the categories of the native phonemic inventory,and is greatly facilitated by the provision of intensivefeedback.
The stimuli in our four experiments displayed tightlycontrolled variation in dimensions known to be importantin speech perception: duration and formant frequency.Depending on condition, each type of variation was eitherrelevant or irrelevant to the category distinction listenerswere expected to learn. The first three experiments exam-ined the acquisition of a unidimensional categorization dis-tinction. In Experiment 1, Spanish listeners categorizednon-native speech sounds with the aid of trial-by-trial feed-back (supervision). The results showed that listeners couldindeed learn to attend to a relevant dimension while sup-pressing an irrelevant one. For these listeners, however,
learning and maintaining a distinction based on formantfrequency appeared easier than learning and maintaininga distinction based on duration. In Experiment 2, listenersfrom the same population categorized the same stimuli, butwithout trial-by-trial feedback, i.e., on the basis of distribu-tional information alone. Performance was worse than inExperiment 1, and was even more strongly affected bywhich dimension was relevant. Nonetheless, on severalmeasures performance did differ from chance, showing thatlisteners were sensitive to the distributional structure of theinput. In Experiment 3, American English listeners werepresented with the duration-relevant stimuli of Experi-ments 1 and 2, with trial-by-trial feedback during learning.These listeners, who are more familiar than Spanish listen-ers with durational variation in their native vowels, werebetter able than the Spanish listeners to acquire the dura-tion-based contrast.
Finally, in Experiment 4 listeners learned a categorydistinction with two relevant dimensions. Although theAmerican English listeners presented with this task wereacquainted with both dimensions involved, and althoughthey received trial-by-trial feedback on their categoriza-tions, performance was considerably impaired comparedto equivalent learning of a unidimensional distinction.Nevertheless, listeners were certainly sensitive to the distri-butional information provided and the majority of themlearned to make use of both dimensions in thecategorization.
Across all the experiments there has been a consistentappearance of sensitivity to the distributional structure ofthe input. All listeners reported (in the post-experimentquestionnaires) that the stimuli they had heard soundedlike speech sounds. Yet the sounds were not like the vowelsof either of the native languages involved, and the distribu-tional structure of the category distinction represented inthe input was unfamiliar to these listeners. Despite this,they acquired the category distinction at least to somedegree; this is quite obvious from the clear improvementacross the learning phases visible in Figs. 3 and 5, and evenevident in Figs. 4 and 6 for the harder cases, the unsuper-vised learning of Experiment 2 and the multidimensionalcategorization of Experiment 4. Tables 2–4 and 6 likewiseshow that improvement in performance across the experi-ment was consistent across listeners.
The better performance in Experiments 1 and 3 versusExperiment 4 additionally shows that learning to identifya category structure with one relevant dimension of varia-tion and one irrelevant dimension of variation is more fea-sible than learning to identify a category structure with tworelevant dimensions of variation. Nevertheless, even withas little as a few hundred presentations, listeners provedsensitive to the distributional information available tothem in Experiment 4. Learning to integrate two dimen-sions to distinguish two phonetic categories is difficult (inline with previous findings of Flege and Hillenbrand,1986), but not impossible. In summary, our results haveshown that it is certainly possible for adult listeners already

M. Goudbeek et al. / Speech Communication 50 (2008) 109–125 123
in possession of a phonological system to attend systemat-ically to the distributional structure of auditory input andlearn a new vowel categorization from it.
Notwithstanding these achievements, clear effects of thenative phonology were also manifest in our findings. Span-ish listeners found it much easier to acquire a category dis-tinction based on frequency than one based on durationalvariation; Figs. 3 and 4 make this main effect across condi-tions abundantly clear. Tables 2 and 3 likewise show that apreference for the use of frequency was evident in the pre-test and maintenance phases when no distributional cueswere present. Frequency distinctions between speech seg-ments are familiar to these listeners; durational distinctionsare not. For American listeners, durational distinctionsbetween vowels are more familiar; listeners use durationto distinguish voicing contrasts (Lisker, 1978; Flege andHillenbrand, 1986), and there are further relevant effectssuch as the distinction between tense and lax vowels inEnglish which involves (allophonic) duration differencesbetween longer tense vowels and shorter lax vowels (Nea-rey, 1989; Smiljanic and Bradlow, 2005). As Kawahara(2006) has shown with Japanese and English listeners, theduration of auditory stimuli can be perceived differentlyby listeners with differing phonologies. Given their experi-ence, the American listeners’ performance with exactly thesame durationally based categorization was far better thanthat of the Spanish listeners, as the comparison in Fig. 5again makes clear. Thus the ability to acquire a novel vowelcategorization from auditory input is modulated by thedegree to which the categorization maps to the type of dis-tinctions required by the native phonology. A distinctionrequiring the use of dimensions deemed irrelevant by thenative phonology is harder to acquire than a distinctionbased on the application of sources of information whichare exploited by the native phonology too, so that usingthem is a familiar task.
Note that we did not find inhibitory effects of the nativevowel categories themselves in our studies. For both lis-tener populations we tested, the Dutch vowels /y/, /Y/and /ø/ on which the stimuli were based are unfamiliarand fall in an empty portion of the native vowel space.However, the vowel space of American English is far moredensely populated than the vowel space of Spanish; in con-sequence, interference of native categories might haveaffected our American more than our Spanish listeners. Ifthat was so, however, then the interference was clearlynot of a kind that inhibited their ability to acquire the cat-egories they were exposed to.
Effects of native categories on the acquisition of non-native categories may also be facilitatory. As noted in theIntroduction, there are three possibilities which PAM(Best, 1995) allows for when non-native speech categoriesare categorized within a native phonological system. First,the new categories might both map to one and the samenative phoneme; then, discrimination is very difficult, awell-known example being English /r/ and /l/ which mapto a single native Japanese phonetic category. But second,
the two non-native phonemes might map (well or imper-fectly) to separate native phonetic categories. The nativeand non-native categories do not have to be identical; aslong as there is a sufficiently consistent mapping betweenthe two sets of categories, discriminating the non-nativesounds is easy. Third, one of the two categories may mapbetter than the other to a native phonetic category; in thiscase, non-native category learning depends on the relativegoodness of fit of each non-native category to the nativecategory, with a large difference in fit making discrimina-tion and non-native category learning easier. Thus two ofthese three possibilities allow mapping to the native cate-gory system to assist the acquisition of a non-native distinc-tion. However, we have no evidence for such facilitatoryeffects in our data either. Judging by the IPA vowel charts(Gussenhoven, 1999; Ladefoged, 1999), the closest Ameri-can English vowel to any of the three Dutch vowels is thevowel /f/, which is closer to /y/ than to /Y/ or /ø/. If thisdifference in proximity had exercised effects, it should havebeen to make acquisition of the distinction between /y/ and/Y/ in Experiment 4 somewhat easier, but there was littlesign of this categorization being at all easy for our Ameri-can listeners. The effects of native phonology which weobserved were confined to the effects of the type of infor-mation – duration versus formant frequency – on whichthe categorization distinctions are based.
A further effect in our data concerns the role of feed-back, or supervision. Comparison of Experiment 1 versusExperiment 2 suggests that supervised learning produceshigher levels of achievement than unsupervised learning,even when the distinction to be learned involves only onedimension of variation. The acquisition of unfamiliar audi-tory category distinctions is clearly not an easy task, andfeedback on performance trial-by-trial is useful to learners.Note that there was no differential effect of the availabilityof feedback for the easier versus the harder distinction inthis task, suggesting that listeners do not restrict themselvesto exploiting such assistance only when faced with a dis-tinction based on a type of information irrelevant to nativephonological contrasts.
The present results have significantly extended ourknowledge of the factors which control the success ofspeech category acquisition in its own right, separatelyfrom the role such acquisition must necessarily play inthe learning of a complete phonological system. To acquirenovel auditory categories, listeners simultaneously draw onthe structure of the input they receive and on their existinglinguistic knowledge. Thus the native phonological systemplays a role not only when a whole new repertoire is beingacquired; any newly acquired individual distinction can beaffected by existing phonological knowledge. The Ameri-can English participants in our studies had no priorexposure to Dutch, and presumably had no particularmotivation to acquire Dutch phonemic distinctions, butnonetheless they performed significantly above chance inacquiring the Dutch vowel distinctions, and, presum-ably by drawing on their native experience with the use

124 M. Goudbeek et al. / Speech Communication 50 (2008) 109–125
of vocalic variation in duration, were even able to performbetter than these Spanish participants who might be con-sidered as nominally motivated to acquire knowledge ofthe Dutch language (given that they were exchangestudents).
We view the role of the native phonology in speech cat-egory acquisition as not in principle different from anyother body of existing knowledge. It is simply the most rel-evant existing knowledge that the listener has. Learningprocesses are well adapted for drawing on existing knowl-edge to fine-tune perceptual performance; this can be seenin the use of lexical knowledge to fine-tune the native pho-nemic categorizations (Norris et al., 2003). This fine-tuningis held to be the process underlying listeners’ rapid adapta-tion to new talkers (Eisner and McQueen, 2005), and it iscertainly especially well adapted to the complexity ofspeech perception, in which highly complex signals consistof components which are not clearly demarcated. Nonethe-less, the same kind of fine-tuning can be drawn upon in theperception of printed text (Norris et al., 2006), whereclearly demarcated components would seem to make itunnecessary. Norris et al. (2006) argue that the ability touse information from one level of analysis to inform learn-ing about perceptual distinctions at another level has suchpower that it cannot be restricted to learning which wouldbe impossible without it. In the present case, effects of thenative phonology were exercised even though the acquisi-tion task was not explicitly one of vowel learning.
The final question is the applicability of our results tolearning of natural auditory categories in general, giventhat the factors affecting success in the learning of non-native speech categories are presumably not restricted tothis situation. Supervision is usually not available to learn-ers, certainly not on a case-by-case basis. Our resultssuggest that the role of existing knowledge – the nativephonology, in this case – is larger if no supervision is pro-vided. Without trial-by-trial feedback, listeners in Experi-ment 2 experienced more difficulty in ignoring thedimension relevant in their native phonology, even thoughthe distributional properties of the stimuli indicated other-wise. They preferred to use the dimension better known tothem, in this case formant frequency. We would suggestthat the provision of supervision amounts to the provisionof a very reliable knowledge source. That is, human learn-ing is extremely efficient and makes use of the best informa-tion available. This may be supervisory feedback, or it maybe existing phonological knowledge. As the literature onnon-native phoneme learning repeatedly demonstrates,the use of existing phonological knowledge sometimes doesnot help; this simply underlines the fact that among cate-gory acquisition tasks, the acquisition of non-native speechcategories is one of the most difficult.
Acknowledgements
The research reported in this paper was supported by aMax Planck Society doctoral scholarship. Experiments 3
and 4 were made possible by a Dutch Scientific Council(NWO) travel grant, and Experiment 1 was supported bythe NWO-SPINOZA project ‘‘Native and Non-NativeListening’’ to A.C. We thank Keith Kluender, Universityof Wisconsin, Madison, for financial assistance and consul-tation, Anita Wagner and Laurence Bruggeman for help inrecruiting and testing the Spanish listeners, and two review-ers for helpful suggestions on the manuscript. M.G. is nowat The Geneva Emotion Research Group of the Depart-ment of Psychology, University of Geneva.
References
Agresti, A., 1990. Categorical Data Analysis. John Wiley and Sons, Inc.,New York.
Aoyama, K., Flege, J.E., Guion, S.G., Akahane-Yamada, R., Yamada,T., 2004. Perceived phonetic dissimilarity and L2 speech learning:the case of Japanese /r/ and English /l/ and /r/. J. Phon. 32, 233–250.
Ashby, F.G., Maddox, W.T., 1993. Relationships between prototype,exemplar, and decision bound models of categorization. J. Math.Psychol. 37, 372–400.
Ashby, F.G., Alfonso-Reese, L.A., Turken, A.U., Waldron, E., 1998. Aneuropsychological theory of multiple systems in category learning.Psychol. Rev. 105, 442–481.
Ashby, F.G., Queller, S., Berretty, P., 1999. On the dominance ofunidimensional rules in unsupervised categorization. Percept. Psycho-phys. 61, 1178–1199.
Best, C.T., 1994. The emergence of native-language phonological influ-ences in infants: a perceptual assimilation model. In: Goodman, J.C.,Nusbaum, H.C. (Eds.), The development of speech perception. TheMIT Press, Cambridge, MA, pp. 167–224.
Best, C.T., 1995. A direct realist view of speech cross language speechperception. In: Strange, W. (Ed.), Speech Perception and LinguisticExperience: Issues in Cross-Language Research. New York Press,Baltimore, MD, pp. 171–206.
Best, C.T., Tyler, M.D., 2007. Nonnative and second language speechperception: commonalities and complementaries. In: Munro, M.J.,Bohn, O.-S. (Eds.), Second Language Speech Learning: The Role ofLanguage Experience in Speech Perception and Production. JohnBenjamins, Amsterdam, pp. 13–34.
Best, C.T., McRoberts, G.W., Sithole, N.M., 1988. Examination ofperceptual reorganization for non-native speech contrasts: Zulu clickdiscrimination by English-speaking adults and infants. J. Exp.Psychol.: Hum. Percept. Perform. 14, 345–360.
Boersma, P., Weenink, D., 2003. Praat 4.1 [Computer software]. Retrievedfrom [URL] <www.fon.hum.uva.nl/praat/>.
Booij, G., 1995. The Phonology of Dutch. Clarendon Press, Oxford.Bradlow, A.R., 1995. A comparative study of English and Spanish vowels.
J. Acoust. Soc. Amer. 97, 1916–1924.Broersma, M., 2006. Learning to ignore a perceptual cue: nonnative
listeners outperform native listeners. Poster presented at the 151stMeeting of the Acoustical Society of America, Providence. RI. J.Acoust. Soc. Amer. 119, 3270–3271 (Abstract).
Burnham, D.K., Earnshaw, L.J., Clark, J., 1991. Development ofcategorical identification of native and non-native bilabial stops:infants, children and adults. J. Child Lang. 18, 231–260.
Cutler, A., Broersma, M., 2005. Phonetic precision in listening. In:Hardcastle, W., Beck, J. (Eds.), A Figure of Speech: A Festschrift forJohn Laver. Erlbaum, Mahwah, NJ, pp. 63–91.
Diehl, R.L., Kluender, K.R., 1987. On the categorization of speechsounds. In: Harnad, S. (Ed.), Categorical Perception. CambridgeUniversity Press, Cambridge, pp. 226–253.
Eisner, F., McQueen, J.M., 2005. The specificity of perceptual learning inspeech processing. Percept. Psychophys. 67, 224–238.

M. Goudbeek et al. / Speech Communication 50 (2008) 109–125 125
Feldman, J., 2000. Minimization of Boolean complexity in humancategory learning. Nature 407, 630–633.
Flege, J., 1989. Differences in inventory size affect the location but not theprecision of tongue positioning in vowel production. Lang. Speech 32,123–147.
Flege, J.E., 1992. The intelligibility of English vowels spoken by Britishand Dutch talkers. In: Kent, R. (Ed.), In: Intelligibility in SpeechDisorders: Theory, Measurement, and Management. John Benjamins,Amsterdam, pp. 157–232.
Flege, J.E., 1995. Second language speech learning: theory, findings andproblems. In: Strange, W. (Ed.), Speech Perception and LinguisticExperience: Theoretical and Methodological Issues. York Press,Timonium, MD, pp. 233–273.
Flege, J.E., Hillenbrand, J., 1986. Differential use of temporal cues to the/s/-/z/ contrast by native and non-native speakers of English. J.Acoust. Soc. Amer. 79, 508–517.
Flege, J.E., Bohn, O., Jang, S., 1997. Effects of experience on non-nativespeakers’ production and perception of English vowels. J. Phon. 25,437–470.
Francis, A.L., Nusbaum, H.C., 2002. Selective attention and the acqui-sition of new phonetic categories. J. Exp. Psychol.: Hum. Percept.Perform 28, 349–366.
Francis, A.L., Baldwin, K., Nusbaum, H.C., 2000. Effect of training onattention to acoustic cues. Percept. Psychophys. 62, 1668–1680.
Goudbeek, M., Swingley, D., Smits, R., in preparation. Supervised andunsupervised learning of acoustic categories.
Gussenhoven, C., 1999. Illustrations of the IPA: Dutch. Handbook of theInternational Phonetic Association. Cambridge University Press,Cambridge, pp. 74–77.
Gussenhoven, C., in press. Vowel duration, syllable quantity and stress inDutch. In: Kristin Hanson, Sharon Inkelas (Eds.), The Nature of theWord: Essays in Honor of Paul Kiparsky. MIT Press, Cambridge,MA.
Hammond, R.M., 2001. The sounds of Spanish: Analysis and application.Cascadilla Press, Sommerville, MA.
Hillenbrand, J., Getty, L.A., Clark, M.J., Wheeler, K., 1995. Acousticcharacteristics of American English vowels. J. Acoust. Soc. Amer. 97,3099–3111.
Homa, D., Cultice, J.C., 1984. Role of feedback, category size, andstimulus distortion on the acquisition and utilization of ill-definedcategories. J. Exp. Psychol. – Learn. Mem. Cogn. 10, 83–94.
Kawahara, S., 2006. Contextual effects on the perception of duration.Poster presented at the 151st Meeting of the Acoustical Society ofAmerica, Providence, RI. J. Acoust. Soc. Amer. 119, 3243 (Abstract).
Ladefoged, P., 1999. American English. Handbook of the InternationalPhonetic Association. Cambridge University Press, Cambridge, pp.41–44.
Lisker, L., 1978. Rapid versus rabid: a catalogue of acoustic features thatmay cue the distinction. Haskins Laboratories Status Report in SpeechResearch SR-54, pp. 127–132.
Logan, J.S., Lively, S.E., Pisoni, D.B., 1991. Training Japanese listeners toidentify English /r/ and /l/: a first report. J. Acoust. Soc. Amer. 89,874–886.
Love, B.C., 2002. Comparing supervised and unsupervised categorylearning. Psychon. Bull. Rev. 9, 829–835.
Macmillan, N.A., Creelman, C.D., 1991. Detection Theory: A User’sGuide. Cambridge University Press, New York.
Maye, J., Gerken, L., 2000. Learning phoneme categories without minimalpairs. In: Proc. 24th Annual Boston University Conf. on LanguageDevelopment, pp. 522–533.
Maye, J., Gerken, L., 2001. Learning phonemes: how far can the inputtake us? In: A.H.-J. Do, L. Domı´ nguez, A. Johansen (Eds.), Proc. 25thAnnual Boston University Conf. on Language Development, pp. 480–490.
McAllister, R., Flege, J.E., Piske, T., 2002. The influence of L1 on theacquisition of Swedish quantity by native speakers of Spanish, Englishand Estonian. J. Phon. 30, 229–258.
Mermelstein, P., 1978. On the relationship between vowel and consonantidentification when cued by the same acoustic information. Percept.Psychophys. 23, 331–336.
Navarro, T., 1968. Studies in Spanish phonology. University of MiamiPress, Coral Gables.
Nearey, T.M., 1989. Static, dynamic, and relational properties in vowelperception. J. Acoust. Soc. Amer. 85, 2088–2113.
Nearey, T.M., 1997. Speech perception as pattern recognition. J. Acoust.Soc. Amer. 101, 3241–3254.
Norris, D., McQueen, J.M., Cutler, A., 2003. Perceptual learning inspeech. Cogn. Psychol. 47, 204–238.
Norris, D., Butterfield, S., McQueen, J.M., Cutler, A., 2006. Lexicallyguided retuning of letter perception. Q. J. Exp. Psychol. 59, 1505–1515.
Nosofsky, R.M., 1990. Exemplar-based approach to categorization,identification and recognition. In: Ashby, F.G. (Ed.), Multidimen-sional Models of Perception and Cognition. Lawrence ErlbaumAssociates, New York, pp. 363–393.
Pierrehumbert, J., 2003. Phonetic diversity, statistical learning, andacquisition of phonology. Lang. Speech 46, 115–154.
Shepard, R., Hovland, C., Jenkins, H., 1961. Learning and memorizationof classifications. Psychol. Monogr. 75, 1–42.
Smiljanic, R., Bradlow, A.R., 2005. Production and perception of clearspeech in Croatian and English. J. Acoust. Soc. Amer. 118, 1677–1688.
Smits, R., Warner, N., McQueen, J., Cutler, A., 2003. Unfolding ofphonetic information over time: a database of Dutch diphoneperception. J. Acoust. Soc. Amer. 113, 563–574.
Strange, W., 1995. Speech Perception and Linguistic Experience: Issues inCross-language Speech Research. York Press, Timonium, MD.
Whalen, D., 1989. Vowel and consonant judgments are not independentwhen cued by the same information. Percept. Psychophys. 46, 284–292.