Embed Size (px)
Citation preview
© 2009-2017 Fibozachi LLC – www.fibozachi.com. All Rights Reserved.
1
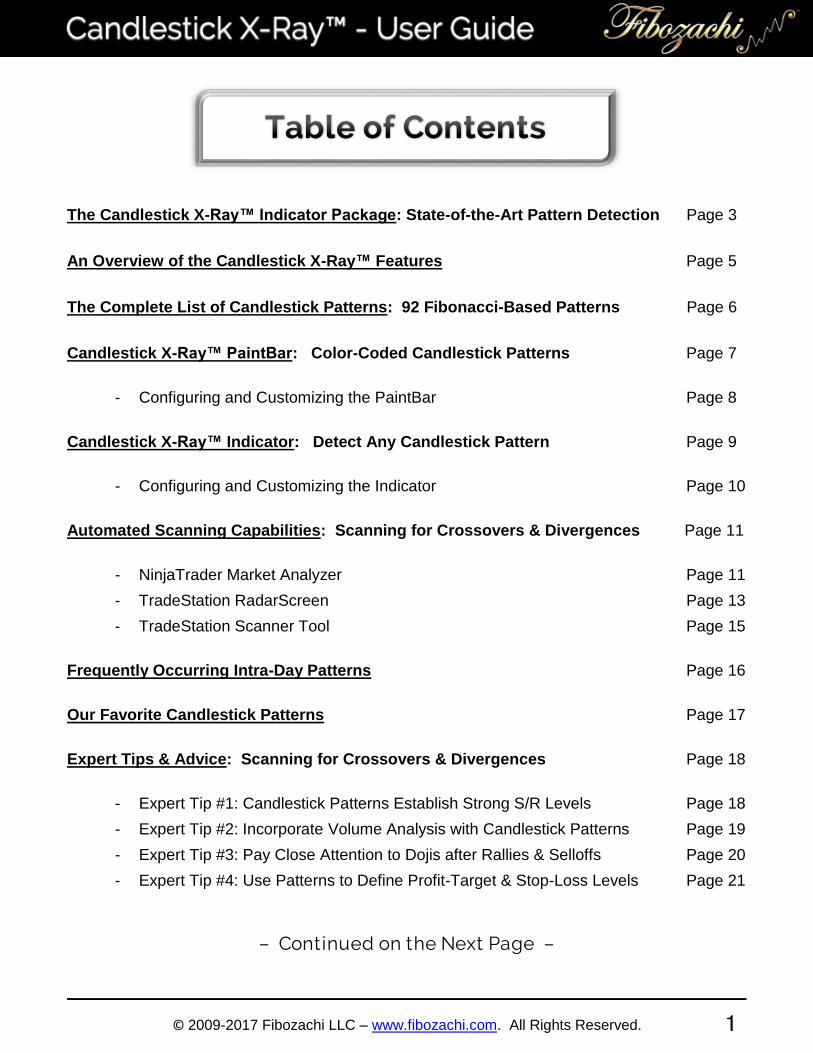
The Candlestick X-Ray™ Indicator Package: State-of-the-Art Pattern Detection Page 3
An Overview of the Candlestick X-Ray™ Features Page 5
The Complete List of Candlestick Patterns: 92 Fibonacci-Based Patterns Page 6
Candlestick X-Ray™ PaintBar: Color-Coded Candlestick Patterns Page 7
- Configuring and Customizing the PaintBar Page 8
Candlestick X-Ray™ Indicator: Detect Any Candlestick Pattern Page 9
- Configuring and Customizing the Indicator Page 10
Automated Scanning Capabilities: Scanning for Crossovers & Divergences Page 11
- NinjaTrader Market Analyzer Page 11
- TradeStation RadarScreen Page 13
- TradeStation Scanner Tool Page 15
Frequently Occurring Intra-Day Patterns Page 16
Our Favorite Candlestick Patterns Page 17
Expert Tips & Advice: Scanning for Crossovers & Divergences Page 18
- Expert Tip #1: Candlestick Patterns Establish Strong S/R Levels Page 18
- Expert Tip #2: Incorporate Volume Analysis with Candlestick Patterns Page 19
- Expert Tip #3: Pay Close Attention to Dojis after Rallies & Selloffs Page 20
- Expert Tip #4: Use Patterns to Define Profit-Target & Stop-Loss Levels Page 21
– Continued on the Next Page –
© 2009-2017 Fibozachi LLC – www.fibozachi.com. All Rights Reserved.
2
Superior Coding, Formulas, and Indicators: Filtering Out Weak Patterns Page 22
- Problem #1: Missed Signals on “Big” and “Small” Stocks Page 22
- Problem #2: Incorrect Formulas & Labeling of Candlestick Patterns Page 24
Harnessing the Power of Fibonacci: The Science behind our Formulas Page 25
Superior Customer Support Page 27
Risk Disclosure Statement Page 28
© 2009-2017 Fibozachi LLC – www.fibozachi.com. All Rights Reserved.
3
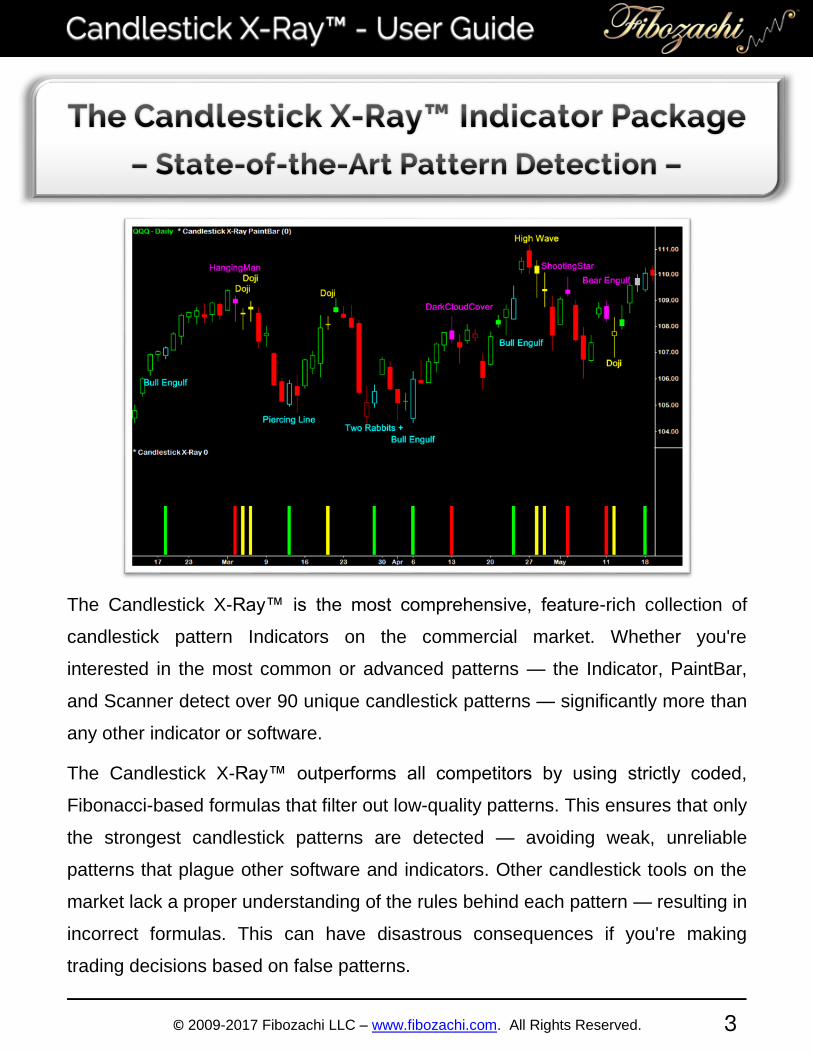
The Candlestick X-Ray™ is the most comprehensive, feature-rich collection of
candlestick pattern Indicators on the commercial market. Whether you're
interested in the most common or advanced patterns — the Indicator, PaintBar,
and Scanner detect over 90 unique candlestick patterns — significantly more than
any other indicator or software.
The Candlestick X-Ray™ outperforms all competitors by using strictly coded,
Fibonacci-based formulas that filter out low-quality patterns. This ensures that only
the strongest candlestick patterns are detected — avoiding weak, unreliable
patterns that plague other software and indicators. Other candlestick tools on the
market lack a proper understanding of the rules behind each pattern — resulting in
incorrect formulas. This can have disastrous consequences if you're making
trading decisions based on false patterns.
© 2009-2017 Fibozachi LLC – www.fibozachi.com. All Rights Reserved.
4
To solve this problem, we devised each pattern's formula after studying all the
candlestick-related literature that we could get our hands on. Since many
candlestick patterns and their respective formulas are neither qualitatively defined
nor uniformly agreed amongst candlestick "experts", we have combined their
various interpretations to determine the specific rules for each pattern. We also
went a step further to incorporate Fibonacci numbers and ratios into many of our
formulas — creating multi-faceted, extremely powerful candlestick pattern
Indicators. (More detailed information on pages 22-26).
The Candlestick X-Ray™ Indicator Package includes:
© 2009-2017 Fibozachi LLC – www.fibozachi.com. All Rights Reserved.
5
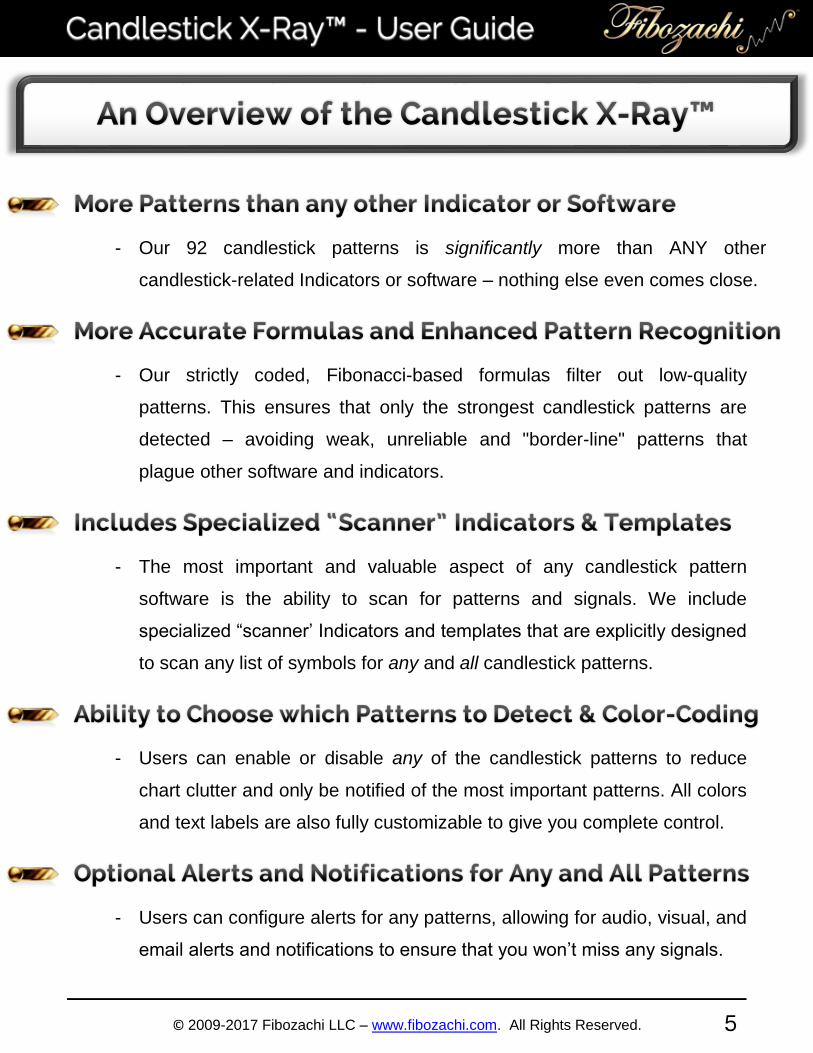
- Our 92 candlestick patterns is significantly more than ANY other
candlestick-related Indicators or software – nothing else even comes close.
- Our strictly coded, Fibonacci-based formulas filter out low-quality
patterns. This ensures that only the strongest candlestick patterns are
detected – avoiding weak, unreliable and "border-line" patterns that
plague other software and indicators.
- The most important and valuable aspect of any candlestick pattern
software is the ability to scan for patterns and signals. We include
specialized “scanner’ Indicators and templates that are explicitly designed
to scan any list of symbols for any and all candlestick patterns.
- Users can enable or disable any of the candlestick patterns to reduce
chart clutter and only be notified of the most important patterns. All colors
and text labels are also fully customizable to give you complete control.
- Users can configure alerts for any patterns, allowing for audio, visual, and
email alerts and notifications to ensure that you won’t miss any signals.

© 2009-2017 Fibozachi LLC – www.fibozachi.com. All Rights Reserved.
6
Abandoned Baby Bull
Abandoned Baby Bear
Advance Block
Bullish Engulfing
Bearish Engulfing
Bullish Kicking
Bearish Kicking
Breakaway Bullish
Breakaway Bearish
Concealed Baby Swallow Bull
Concealed Baby Swallow Bear
Dark Cloud Cover
Deliberation Bull
Deliberation Bear
Descending Hawk
Descent Block
Doji
Perfect Doji
Dragonfly
Evening Doji Star
Evening Star
Falling Three Method
Four Price Doji
Gravestone
Hammer
Perfect Hammer
Hanging Man
Perfect Hang Man
Inverted Hammer
Perfect Inverted Hammer
Harami Bullish
Harami Bearish
Harami Cross
High Price Gap Bull
High Wave
Homing Pigeon Bull
In Neck
On Neck
Ladder Bottom
Ladder Top
Low Price Gap Bear
Marubozu White
Marubozu Black
Matching Low
Matching High
Mat Hold Bullish
Mat Hold Bearish
Meeting Lines Bull
Meeting Lines Bear
Morning Doji Star
Morning Star
Piercing Line
Rising Three Method
Separating Lines Bull
Separating Lines Bear
Shooting Star
Perfect Shooting Star
Side by Side Bull
Side by Side Bear
Stick Sandwich Bull
Stick Sandwich Bear
Squeeze Alert Bull
Squeeze Alert Bear
Three Inside Up
Three Inside Down
Three Outside Up
Three Outside Down
Three White Soldiers
Three Identical Soldiers
Three Black Crows
Three Identical Crows
Three Line Strike Bull
Three Line Strike Bear
Three Stars North
Three Stars South
Three River Bottom
Three Mountain Top
Thrusting Bull
Thrusting Bear
Tidal Wave
Tri Star Bullish
Tri Star Bearish
Tweezer Top
Tweezer Bottom
Two Crows
Two Rabbits
Upside Gap Two Rabbits
Downside Gap Two Crows
Upside Gap Three Method
Downside Gap Three Method
Upside Tasuki Gap
Downside Tasuki Gap
© 2009-2017 Fibozachi LLC – www.fibozachi.com. All Rights Reserved.
7
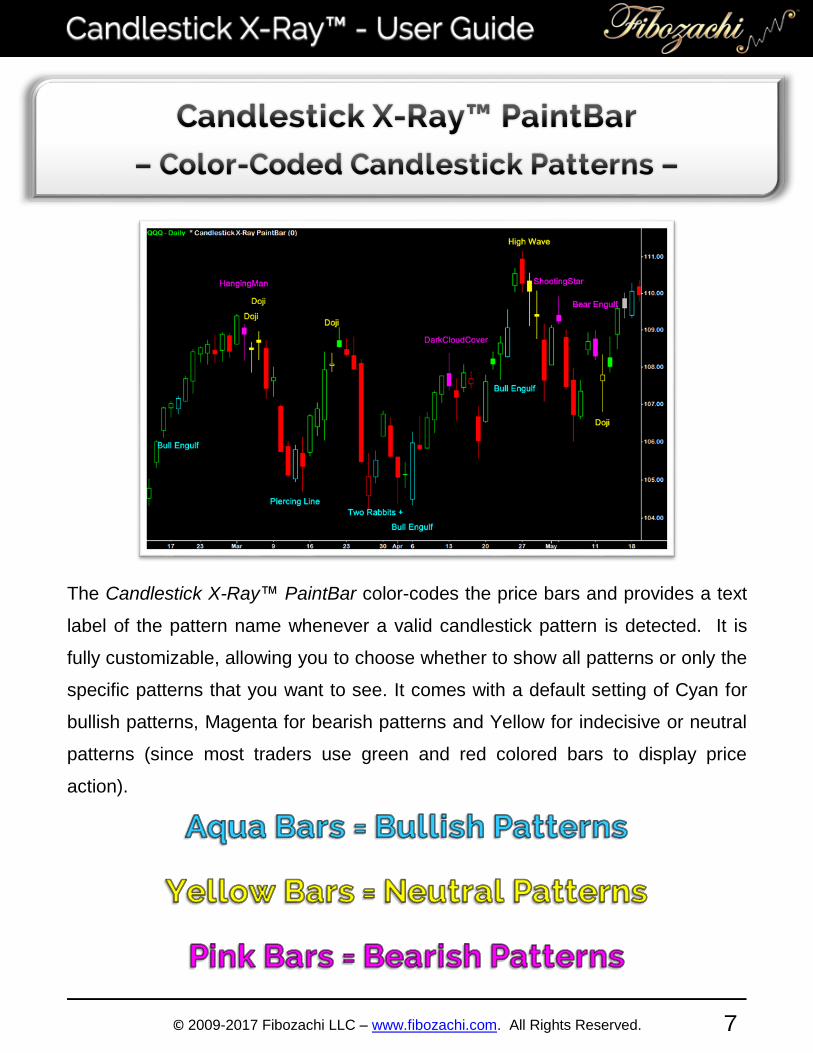
The Candlestick X-Ray™ PaintBar color-codes the price bars and provides a text
label of the pattern name whenever a valid candlestick pattern is detected. It is
fully customizable, allowing you to choose whether to show all patterns or only the
specific patterns that you want to see. It comes with a default setting of Cyan for
bullish patterns, Magenta for bearish patterns and Yellow for indecisive or neutral
patterns (since most traders use green and red colored bars to display price
action).
© 2009-2017 Fibozachi LLC – www.fibozachi.com. All Rights Reserved.
8
*** Go to Format Symbol - Scaling and make Sub-Graph Margins 10% or
more on both the top and bottom so that all the patterns and text will fit on
your chart. (this tip is for TradeStation and MultiCharts users only)
*** To disable any of the patterns, simply go to the tool’s Format / Inputs screen
where you will see each pattern listed alphabetically with On/Off and a
corresponding value of “1” next to it. To disable a pattern so that both its bar color
and text label are no longer displayed, change the value to “0”.
*** To change the color of the bar or the text for any of the patterns, simply go
to the tool’s Format / Inputs screen where you will see each pattern listed
alphabetically with a corresponding color next to it. Each pattern has two color
settings: one setting for the bar color and one setting for the text color. This
enables each user to deactivate or remove the text labels for any patterns that
they do not want, as well as the ability to change the color of the bar when a valid
pattern occurs. Choose each color you would like to use by replacing the text with
your new color choice. If you would only like to remove the text labels from some
patterns but want the bar to be a different color, you may do so by changing the
text color to match your background (most likely “black”). This is particularly useful
if you decide to remove excessive engulfing or advancing patterns that can occur
within small intraday timeframes.
© 2009-2017 Fibozachi LLC – www.fibozachi.com. All Rights Reserved.
9
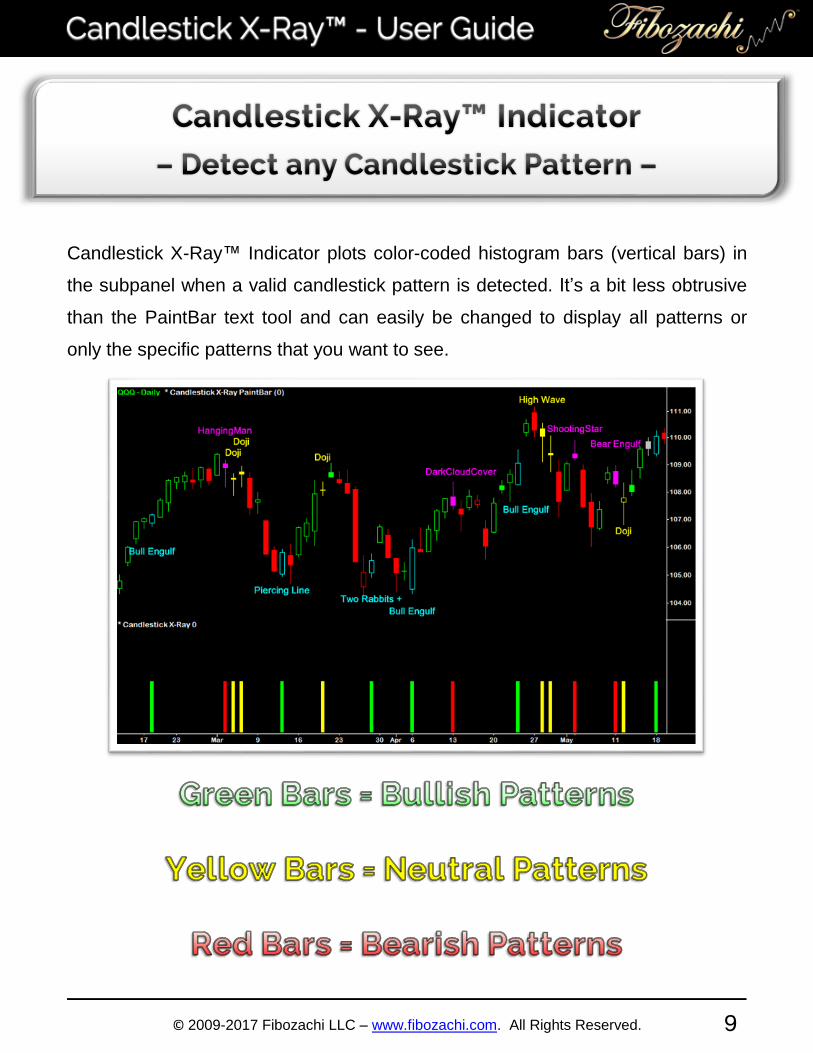
Candlestick X-Ray™ Indicator plots color-coded histogram bars (vertical bars) in
the subpanel when a valid candlestick pattern is detected. It’s a bit less obtrusive
than the PaintBar text tool and can easily be changed to display all patterns or
only the specific patterns that you want to see.
© 2009-2017 Fibozachi LLC – www.fibozachi.com. All Rights Reserved.
10
*** To disable any of the patterns, simply go to the tool’s Format / Inputs screen
where you will see each pattern listed alphabetically with On/Off and a
corresponding value of “1” next to it. To disable a pattern so that both its bar color
and text label are no longer displayed, change the value to “0”. This is particularly
useful if you decide to remove excessive engulfing or advancing patterns that can
occur within small intraday timeframes. For example, if you only wish to know
when various dojis or marubozus occur, you can simply change the On/Off values
of all the other patterns to “0”.
*** To change the color for any of the patterns, simply go to the tool’s Format /
Inputs screen where you will see each pattern listed alphabetically with a
corresponding color next to it. Choose the color you would like to use for each
pattern by replacing the text with your new color choice.

© 2009-2017 Fibozachi LLC – www.fibozachi.com. All Rights Reserved.
11
The Candlestick X-Ray™ also includes a special pre-formatted “Market Analyzer”
Indicator and template for all NinjaTrader users. All of the columns, colors, and
text are completely customizable so that you can personalize it to your own
preferences. Using the Candlestick X-Ray™ with the Market Analyzer allows you
to quickly scan an entire list of symbols for all candlestick patterns in just seconds!
© 2009-2017 Fibozachi LLC – www.fibozachi.com. All Rights Reserved.
12
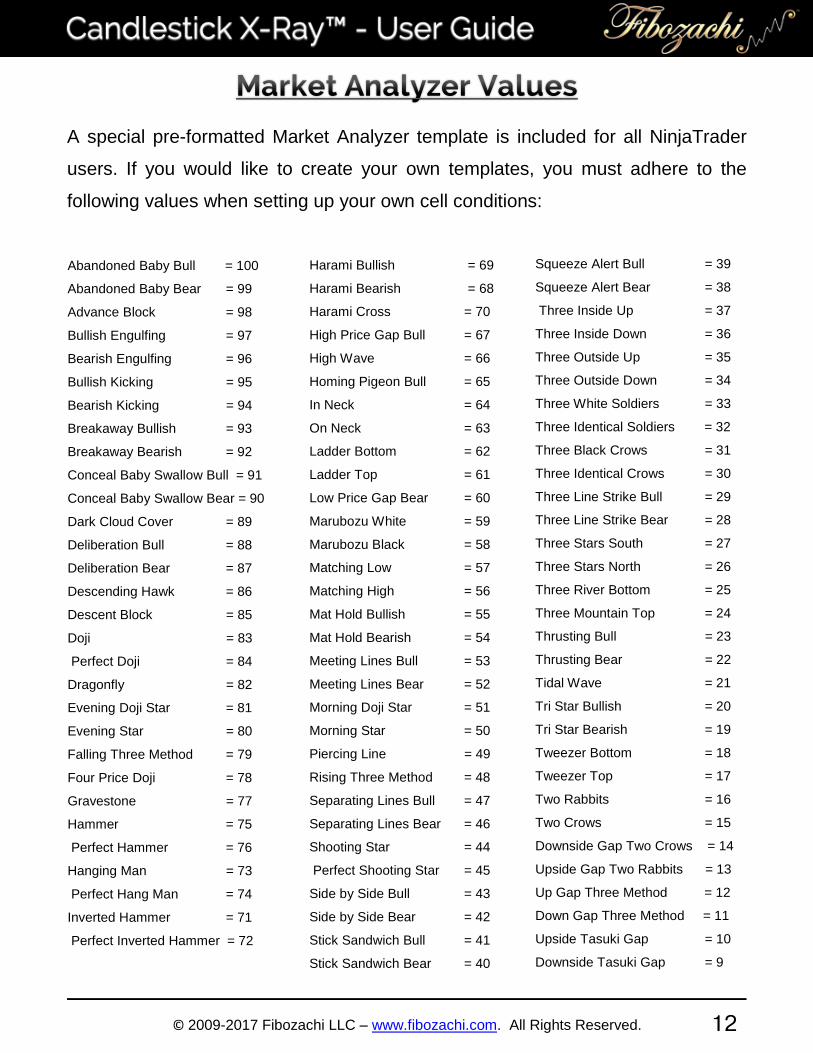
A special pre-formatted Market Analyzer template is included for all NinjaTrader
users. If you would like to create your own templates, you must adhere to the
following values when setting up your own cell conditions:
Abandoned Baby Bull = 100
Abandoned Baby Bear = 99
Advance Block = 98
Bullish Engulfing = 97
Bearish Engulfing = 96
Bullish Kicking = 95
Bearish Kicking = 94
Breakaway Bullish = 93
Breakaway Bearish = 92
Conceal Baby Swallow Bull = 91
Conceal Baby Swallow Bear = 90
Dark Cloud Cover = 89
Deliberation Bull = 88
Deliberation Bear = 87
Descending Hawk = 86
Descent Block = 85
Doji = 83
Perfect Doji = 84
Dragonfly = 82
Evening Doji Star = 81
Evening Star = 80
Falling Three Method = 79
Four Price Doji = 78
Gravestone = 77
Hammer = 75
Perfect Hammer = 76
Hanging Man = 73
Perfect Hang Man = 74
Inverted Hammer = 71
Perfect Inverted Hammer = 72
Harami Bullish = 69
Harami Bearish = 68
Harami Cross = 70
High Price Gap Bull = 67
High Wave = 66
Homing Pigeon Bull = 65
In Neck = 64
On Neck = 63
Ladder Bottom = 62
Ladder Top = 61
Low Price Gap Bear = 60
Marubozu White = 59
Marubozu Black = 58
Matching Low = 57
Matching High = 56
Mat Hold Bullish = 55
Mat Hold Bearish = 54
Meeting Lines Bull = 53
Meeting Lines Bear = 52
Morning Doji Star = 51
Morning Star = 50
Piercing Line = 49
Rising Three Method = 48
Separating Lines Bull = 47
Separating Lines Bear = 46
Shooting Star = 44
Perfect Shooting Star = 45
Side by Side Bull = 43
Side by Side Bear = 42
Stick Sandwich Bull = 41
Stick Sandwich Bear = 40
Squeeze Alert Bull = 39
Squeeze Alert Bear = 38
Three Inside Up = 37
Three Inside Down = 36
Three Outside Up = 35
Three Outside Down = 34
Three White Soldiers = 33
Three Identical Soldiers = 32
Three Black Crows = 31
Three Identical Crows = 30
Three Line Strike Bull = 29
Three Line Strike Bear = 28
Three Stars South = 27
Three Stars North = 26
Three River Bottom = 25
Three Mountain Top = 24
Thrusting Bull = 23
Thrusting Bear = 22
Tidal Wave = 21
Tri Star Bullish = 20
Tri Star Bearish = 19
Tweezer Bottom = 18
Tweezer Top = 17
Two Rabbits = 16
Two Crows = 15
Downside Gap Two Crows = 14
Upside Gap Two Rabbits = 13
Up Gap Three Method = 12
Down Gap Three Method = 11
Upside Tasuki Gap = 10
Downside Tasuki Gap = 9
© 2009-2017 Fibozachi LLC – www.fibozachi.com. All Rights Reserved.
13
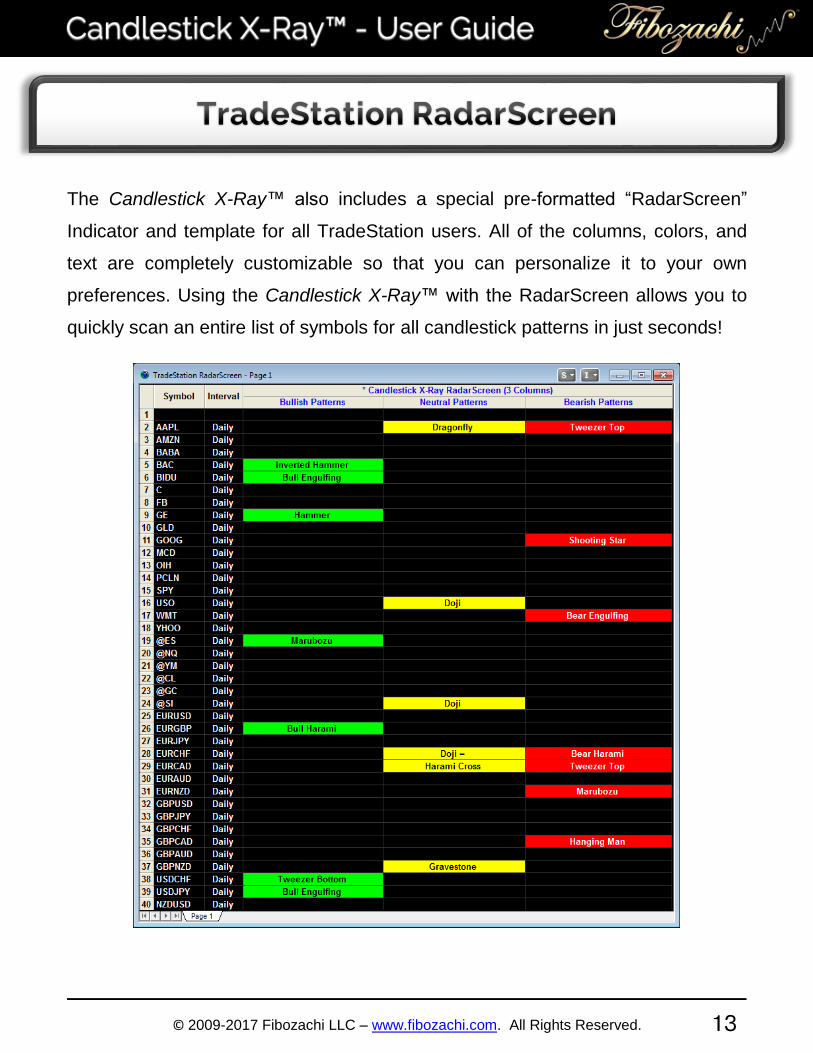
The Candlestick X-Ray™ also includes a special pre-formatted “RadarScreen”
Indicator and template for all TradeStation users. All of the columns, colors, and
text are completely customizable so that you can personalize it to your own
preferences. Using the Candlestick X-Ray™ with the RadarScreen allows you to
quickly scan an entire list of symbols for all candlestick patterns in just seconds!
© 2009-2017 Fibozachi LLC – www.fibozachi.com. All Rights Reserved.
14
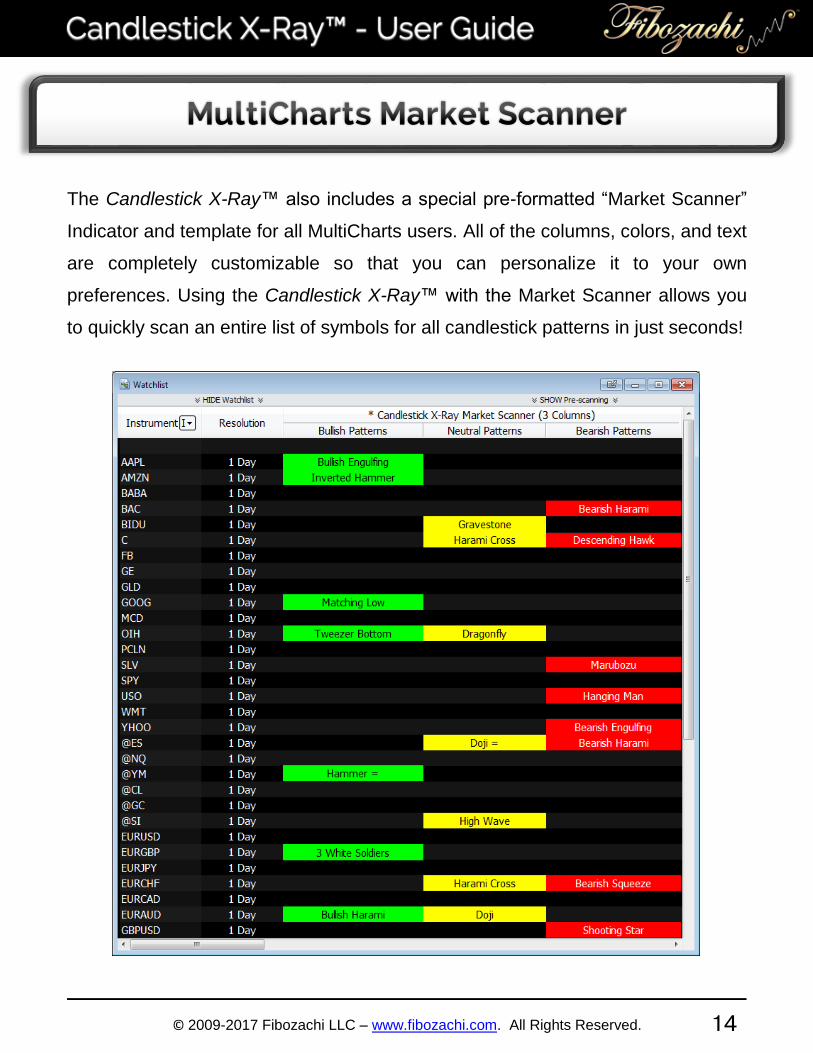
The Candlestick X-Ray™ also includes a special pre-formatted “Market Scanner”
Indicator and template for all MultiCharts users. All of the columns, colors, and text
are completely customizable so that you can personalize it to your own
preferences. Using the Candlestick X-Ray™ with the Market Scanner allows you
to quickly scan an entire list of symbols for all candlestick patterns in just seconds!
© 2009-2017 Fibozachi LLC – www.fibozachi.com. All Rights Reserved.
15
We have found that scanning intraday for our favorite patterns can be quite useful
as an “early warning” detection system, since the Candlestick X-Ray™ Scanner
can display valid daily patterns before the trading day has ended. In other words,
you can see which stocks exhibit valid pattern setups at 12 PM (EST) rather than
having to wait for the close at the end of the trading day.
*** While this screening technique allows for aggressive pre-emptive strategies,
always exercise extreme caution when doing so because a pattern that appears
valid at 12 PM (EST) may prove to be invalid at 4 PM on close.
We prefer using the Candlestick X-Ray™ Scanner to keep an eye on which
patterns are developing within a specific group of key issues at around 10:30 –
10:45 am, 2:15 – 2:30 pm and once again at 3:35 – 3:50 pm (EST).
© 2009-2017 Fibozachi LLC – www.fibozachi.com. All Rights Reserved.
16
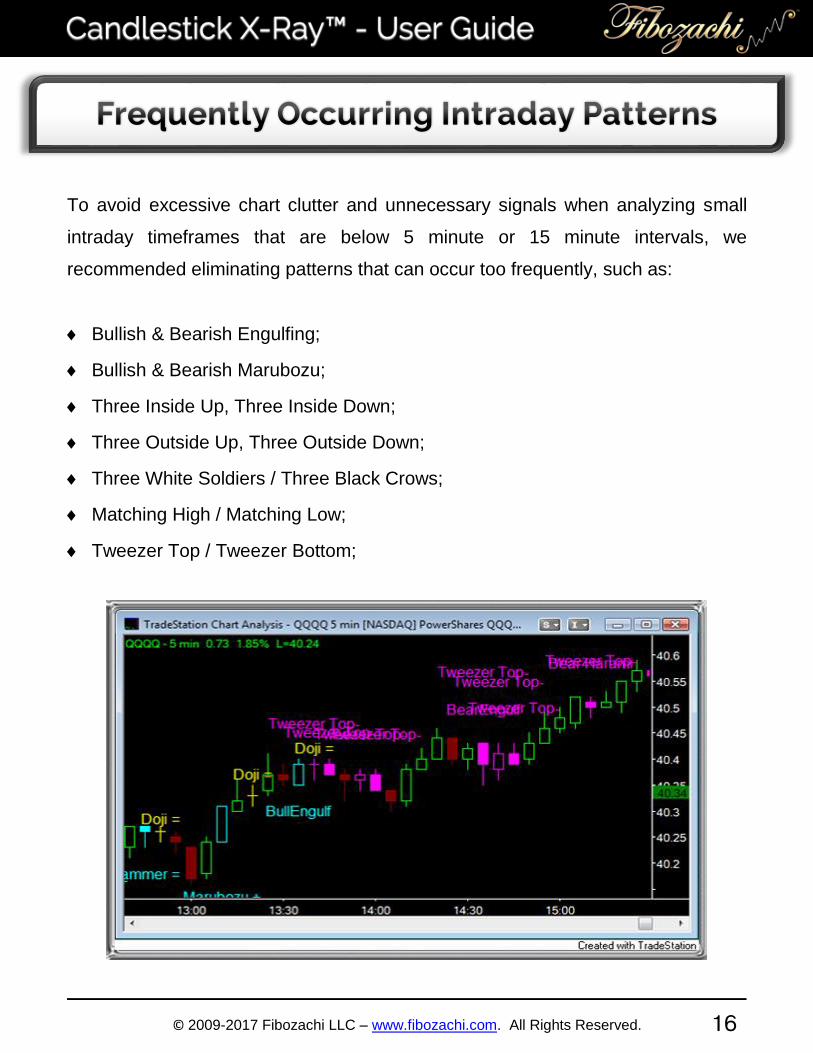
To avoid excessive chart clutter and unnecessary signals when analyzing small
intraday timeframes that are below 5 minute or 15 minute intervals, we
recommended eliminating patterns that can occur too frequently, such as:
Bullish & Bearish Engulfing;
Bullish & Bearish Marubozu;
Three Inside Up, Three Inside Down;
Three Outside Up, Three Outside Down;
Three White Soldiers / Three Black Crows;
Matching High / Matching Low;
Tweezer Top / Tweezer Bottom;
© 2009-2017 Fibozachi LLC – www.fibozachi.com. All Rights Reserved.
17
Abandoned Baby, Morning Doji Star & Evening Doji Star
- High probability reversal patterns with expanding volatility and explosive price
action
Advance Block, Descent Block, Deliberation
- These patterns often coincide with significantly overbought / oversold conditions,
signaling that trend momentum is markedly waning
High Wave
- These patterns often coincide with significant turning points in market character,
reflecting drastic changes in price action (e.g. March 6th, 2009)
Homing Pigeon & Descending Hawk
- Provide extraordinary risk / reward ratios
Piercing Line, Dark Cloud Cover, Thrusting
- High probability reversal patterns
© 2009-2017 Fibozachi LLC – www.fibozachi.com. All Rights Reserved.
18
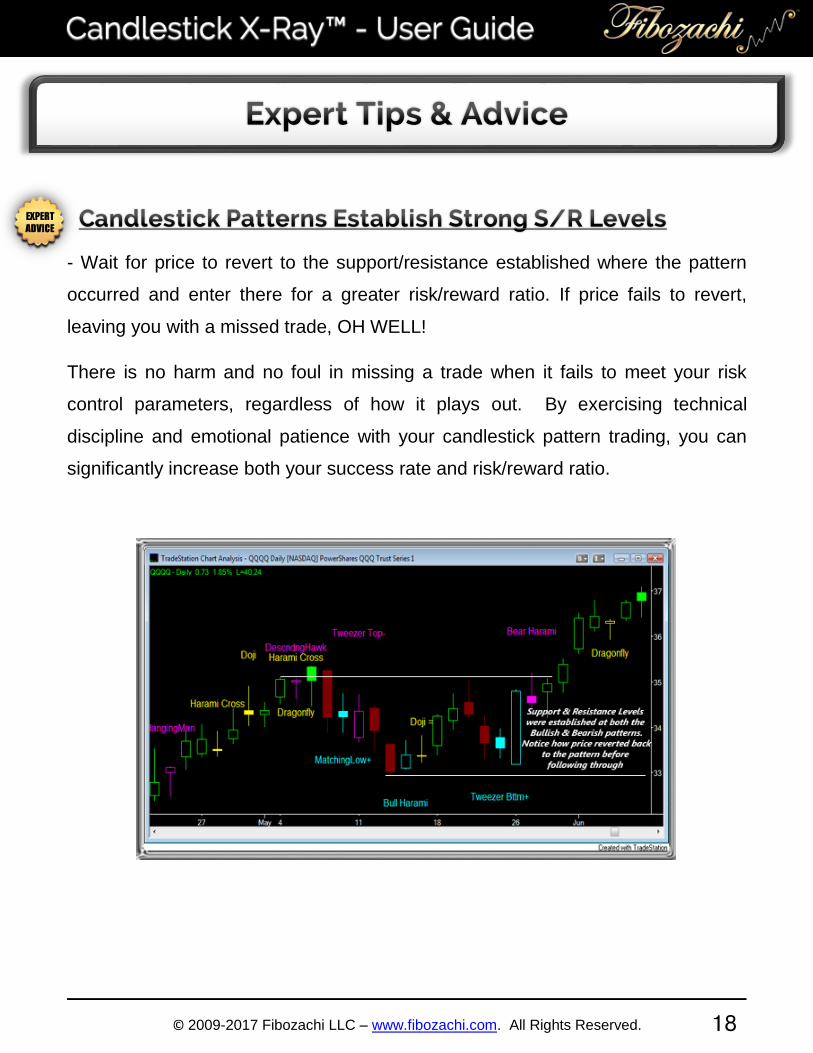
- Wait for price to revert to the support/resistance established where the pattern
occurred and enter there for a greater risk/reward ratio. If price fails to revert,
leaving you with a missed trade, OH WELL!
There is no harm and no foul in missing a trade when it fails to meet your risk
control parameters, regardless of how it plays out. By exercising technical
discipline and emotional patience with your candlestick pattern trading, you can
significantly increase both your success rate and risk/reward ratio.
© 2009-2017 Fibozachi LLC – www.fibozachi.com. All Rights Reserved.
19
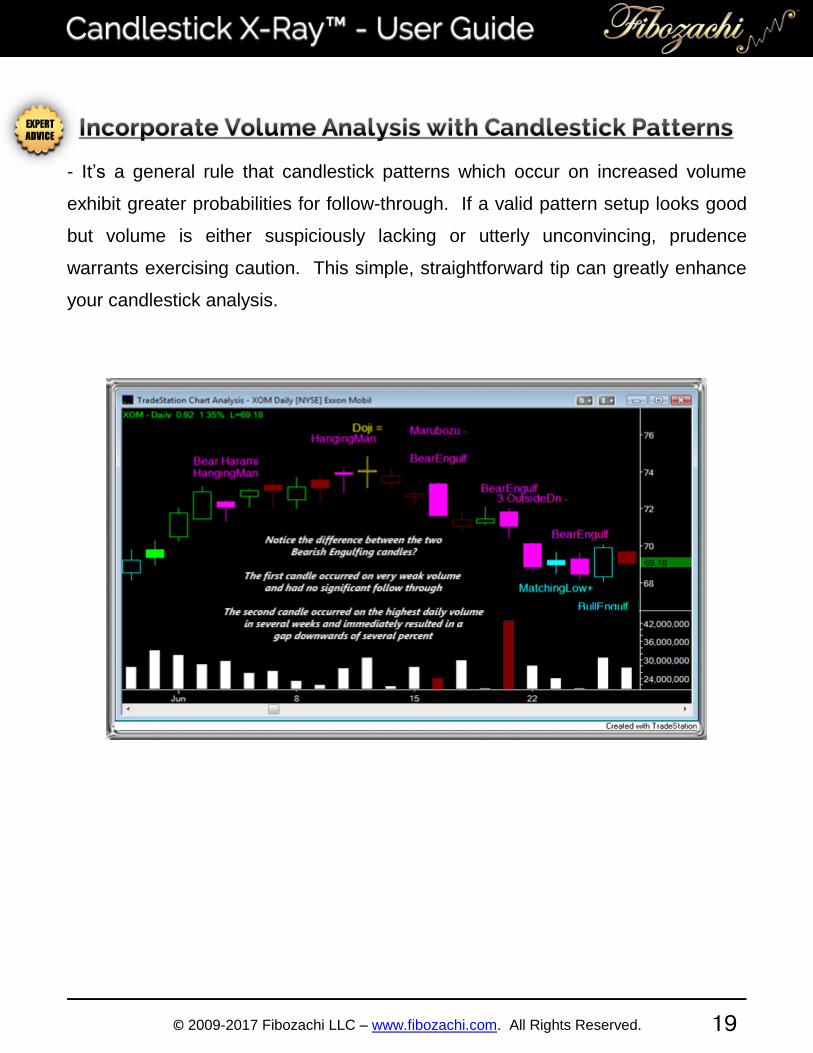
- It’s a general rule that candlestick patterns which occur on increased volume
exhibit greater probabilities for follow-through. If a valid pattern setup looks good
but volume is either suspiciously lacking or utterly unconvincing, prudence
warrants exercising caution. This simple, straightforward tip can greatly enhance
your candlestick analysis.
© 2009-2017 Fibozachi LLC – www.fibozachi.com. All Rights Reserved.
20
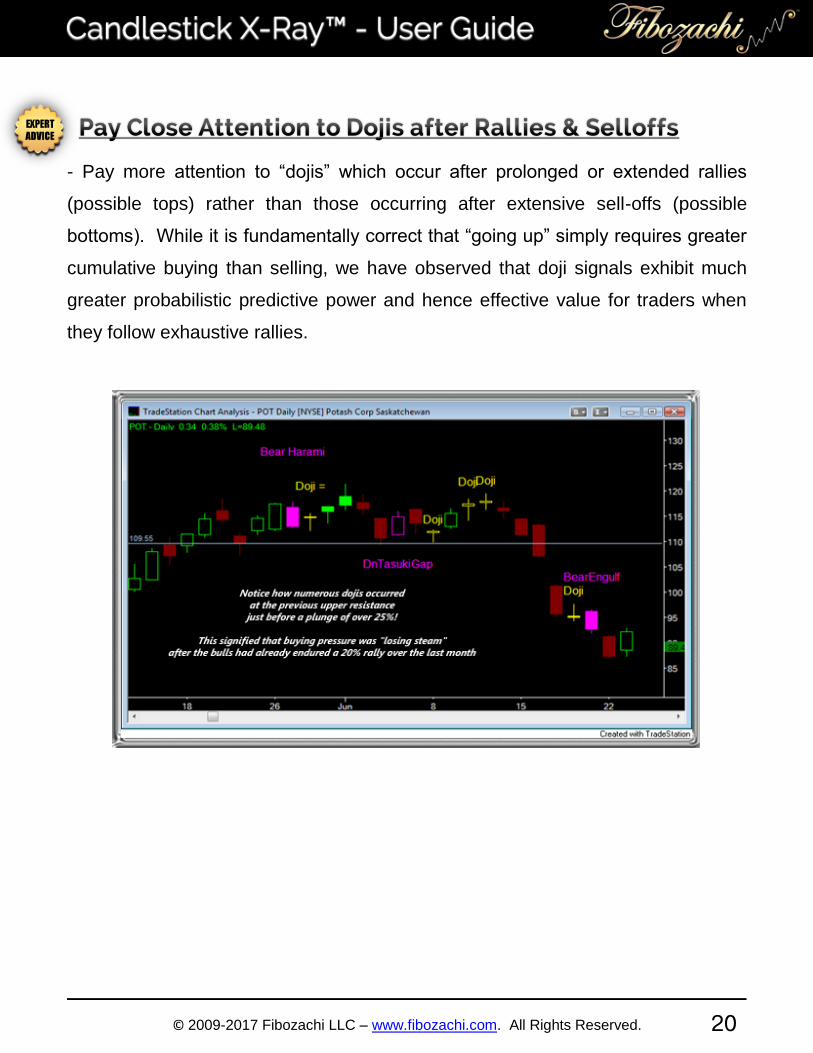
- Pay more attention to “dojis” which occur after prolonged or extended rallies
(possible tops) rather than those occurring after extensive sell-offs (possible
bottoms). While it is fundamentally correct that “going up” simply requires greater
cumulative buying than selling, we have observed that doji signals exhibit much
greater probabilistic predictive power and hence effective value for traders when
they follow exhaustive rallies.
© 2009-2017 Fibozachi LLC – www.fibozachi.com. All Rights Reserved.
21
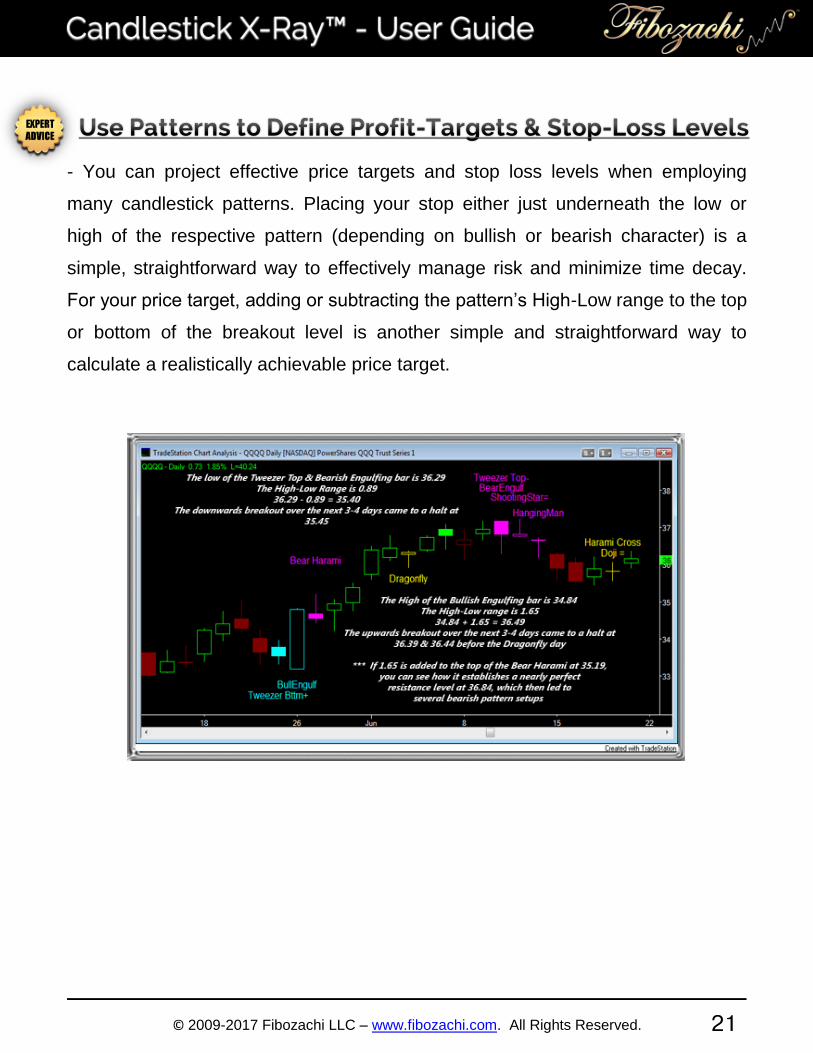
- You can project effective price targets and stop loss levels when employing
many candlestick patterns. Placing your stop either just underneath the low or
high of the respective pattern (depending on bullish or bearish character) is a
simple, straightforward way to effectively manage risk and minimize time decay.
For your price target, adding or subtracting the pattern’s High-Low range to the top
or bottom of the breakout level is another simple and straightforward way to
calculate a realistically achievable price target.
© 2009-2017 Fibozachi LLC – www.fibozachi.com. All Rights Reserved.
22
All “doji-based” as well as “matching high or low” patterns that require an equal
open, high, low and/or close are simply impossible to code for both “high-priced”
and “low-priced” issues when utilizing formulas which require precision; this
prevents many candlestick patterns from registering valid signals on “high-priced”
stocks, “penny” stocks, bonds, futures, or options.
We believe that our coding has solved this problem by requiring the definition of a
“doji” and a “matching high or low” to have a real body (Open - Close) that is less
than approximately 13% of the current bar’s trading range (High-Low). This allows
for “high-priced” stocks (e.g. several hundred dollars) such as GOOG or PCLN to
exhibit effective signals for these patterns in situations where “simple” coding falls
short. We have also provided many of the original patterns, in addition to our
custom modified patterns.
*** Patterns with an “ = ” after them are the “textbook” codes that require
exact Opens / Closes / Highs / Lows.
© 2009-2017 Fibozachi LLC – www.fibozachi.com. All Rights Reserved.
23
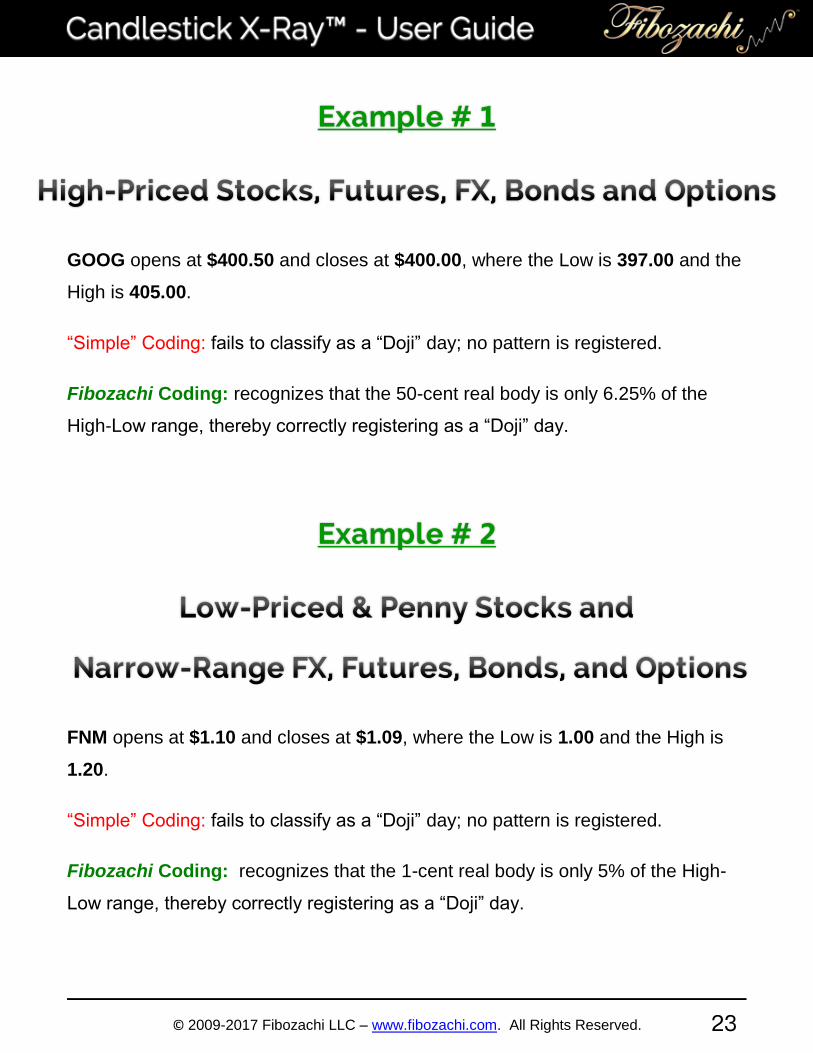
GOOG opens at $400.50 and closes at $400.00, where the Low is 397.00 and the
High is 405.00.
“Simple” Coding: fails to classify as a “Doji” day; no pattern is registered.
Fibozachi Coding: recognizes that the 50-cent real body is only 6.25% of the
High-Low range, thereby correctly registering as a “Doji” day.
FNM opens at $1.10 and closes at $1.09, where the Low is 1.00 and the High is
1.20.
“Simple” Coding: fails to classify as a “Doji” day; no pattern is registered.
Fibozachi Coding: recognizes that the 1-cent real body is only 5% of the High-
Low range, thereby correctly registering as a “Doji” day.
© 2009-2017 Fibozachi LLC – www.fibozachi.com. All Rights Reserved.
24
Many other candlestick pattern tools on the market have fundamental
misconceptions about candlestick patterns and incorrect formulas of certain
patterns; as a result, they plot invalid patterns and often miss the good ones.
As systematic candlestick traders, we find such programming errors utterly
unacceptable. We have painstakingly proofed every one of the 156,335 characters
within each of the 4,445 specific lines of code that comprise the Candlestick X-
Ray™ Package and take great pride in the quality of our work.
Understanding the inherent price action within specific patterns adds a critical
component to one’s knowledge of candlesticks. Employing such valuable
information to your candlestick analysis can significantly enhance the
effectiveness of their predictive value.
“Simple” Coding: incorrectly plots the hammer, inverted hammer, hanging man
and shooting star, due to the lack of an added rule requiring that an uptrend or
downtrend MUST be present. (Hammers that register after a selloff is much more
valuable than a hammer that registers during a rally).
Fibozachi Coding: includes an added rule, where the midpoint of the current bar
must also be above or below the 8-day SMA, which confirms the presence of an
uptrend / downtrend. This helps to properly validate candlestick pattern signals.
© 2009-2017 Fibozachi LLC – www.fibozachi.com. All Rights Reserved.
25
We have devised each formula within our candlestick patterns in a comprehensive
fashion. Since many candlestick patterns and their respective formulas are neither
qualitatively defined nor uniformly agreed upon by the several seminal authors of
candlestick literature, we have both manually and mathematically assessed the
various interpretations to determine the formula and rules behind each pattern.
Additionally, we have incorporated Fibonacci numbers and their derivative ratios
into the vast majority of our uniquely coded candlestick pattern formulas, resulting
in the creation of multifaceted and extremely powerful candlestick pattern
Indicators.
The following is a prime example of our initial frustration during the early
stages of the developmental process:
Author “X” states that a hammer’s lower shadow must be at least 2 times the
length of its real body, where author “Y” states that a hammer’s lower shadow
must be at least 3 times the length of its real body.
If we follow the guideline of Author “X” we catch all signals, though they may
be probabilistically weaker than those of Author “Y”.
If we follow the guideline of Author “Y” we may miss some signals, though
they may be probabilistically greater than those of Author “X”.
© 2009-2017 Fibozachi LLC – www.fibozachi.com. All Rights Reserved.
26
Rather than relying on amorphous guidelines, our rule states that a hammer’s
lower shadow must be at least 2.236 times the length of its real body. We also
define that the Upper Shadow * 7.618 < High-Low Range; in other words, the
upper shadow must be less than 13.13% of the bar’s entire range for the hammer
pattern to verifiably confirm itself, thereby forming a valid signal.
*** Our “Standard” Doji, Hammer, Inverted Hammer, Hanging Man, and Shooting
Star Patterns employ the “13% Rule”, where Open - Close <= 13% of the Range.
We have also included “Perfect Pattern” versions (for classic candlestick pattern
traders), wherever applicable, which employ a “3% Rule” in order to isolate only
the strongest, most “textbook” patterns that the market has to offer.
© 2009-2017 Fibozachi LLC – www.fibozachi.com. All Rights Reserved.
27
Have a question about the Candlestick X-Ray™ Indicator Package? Contact
us at [email protected]. We take great pride in our customer support
and are happy to help our fellow traders!
© 2009-2017 Fibozachi LLC – www.fibozachi.com. All Rights Reserved.
28
The terms “Company”, “us” or “we” refer to Fibozachi.com, its parent company Fibozachi LLC, and all
subsidiaries, affiliates, officers or employees therein. The term “you” refers to the user or customer of
Fibozachi.com. The terms “Content” and “Information” refer to the indicators, tools, strategies,
techniques, systems, manuals, data, communications and any other associated products or material of
the Company.
License:
You are purchasing a single user license. You may not: copy, modify, publish, retransmit, participate in
the transfer or sale of, distribute, perform, display, or create derivative works from, any of the Content or
Information in any way.
Disclaimer:
All Content and Information provided is for educational purposes only. Fibozachi.com and Fibozachi LLC
(the “Company”) is not an investment advisory service, broker-dealer, commodity trading advisor, legal
advisor, tax advisor, or registered investment advisor, and does not purport to tell or suggest which
commodities, currencies or securities customers should buy or sell for themselves. The affiliates,
employees or officers of the Company may hold positions in the commodities, currencies or securities
discussed here.
You understand and acknowledge that there is a high degree of risk involved in trading commodities,
currencies or securities. You also understand and acknowledge that there is an extremely high degree
of risk involved in trading leveraged vehicles such as futures or options, where you can lose more than
the initial sum of your investment. The Company, its subsidiaries, affiliates, officers and employees
assume no responsibility or liability for your trading or investment results.
It should not be assumed that the indicators, tools, strategies, techniques, systems, manuals, data,
communications or any other associated products and material of the Company, collectively the
“Content” and “Information,” presented in its products or services will be profitable or that they will not
result in losses. Past results of any individual trader or trading system published by Company are not
indicative of future returns by that trader or system, and are not indicative of future returns, which may or
may not be realized by you. In addition, the articles, blogs, chat, columns, indicators, methods,
strategies, systems, techniques, tools, and all other features of Company's website (collectively, the
“Information”) are provided for educational purposes only and should not be construed as investment
advice. Any articles, blogs, chat, columns, comments, discussions, drawings, and examples, including
any other items intended to illustrate Information presented on Company's website, are for educational
purposes only; such are not solicitations of any order to buy or sell. Accordingly, you should not rely
solely on the Information in making any investment. Rather, you should use the Information only as a
starting point for doing additional independent research in order to allow you to form your own opinion
regarding any investment. You should always check with your licensed financial advisor and tax advisor
to determine the suitability of any investment.
© 2009-2017 Fibozachi LLC – www.fibozachi.com. All Rights Reserved.
29
IN CONSIDERING WHETHER TO TRADE, YOU SHOULD BE AWARE OF THE FOLLOWING:
HYPOTHETICAL OR SIMULATED PERFORMANCE RESULTS HAVE CERTAIN INHERENT
LIMITATIONS. UNLIKE AN ACTUAL PERFORMANCE RECORD, SIMULATED RESULTS DO NOT
REPRESENT ACTUAL TRADING AND MAY NOT BE IMPACTED BY BROKERAGE AND OTHER
SLIPPAGE FEES. ALSO, SINCE THE TRADES HAVE NOT ACTUALLY BEEN EXECUTED, THE
RESULTS MAY HAVE UNDER- OR OVER-COMPENSATED FOR THE IMPACT, IF ANY, OF CERTAIN
MARKET FACTORS, SUCH AS LACK OF LIQUIDITY. SIMULATED TRADING PROGRAMS IN
GENERAL ARE ALSO SUBJECT TO THE FACT THAT THEY ARE DESIGNED WITH THE BENEFIT
OF HINDSIGHT. NO REPRESENTATION IS BEING MADE THAT ANY ACCOUNT WILL OR IS LIKELY
TO ACHIEVE PROFITS OR LOSSES SIMILAR TO THOSE SHOWN.
TRADING IS AN EXTREMELY DIFFICULT PROBABILISTIC ENDEAVOR THAT REQUIRES
TECHNICAL SKILL AND EMOTIONAL DISCIPLINE AT THE VERY MINIMUM. EVEN A GREAT
TRADER WITH EXCELLENT ANALYSIS, RESOURCES, TOOLS, TECHNIQUES, STRATEGIES,
PLANS, CONTINGENCIES, AND EXPLICITLY DEFINED RULES FOR MANAGING RISK EXPOSURE
IS OFTEN WRONG. THERE ALWAYS REMAIN REAL AND UNQUANTIFIABLE RISKS SUCH AS
GOVERNMENT INTERVENTION OF RULE / LAW CHANGES. RISK PREVENTION MEASURES SUCH
AS PROTECTIVE STOPS DO NOT PREVENT THE RISK OF GAP OPENINGS OR LOCK-LIMIT
MOVES.
YOU AGREE THAT NEITHER FIBOZACHI LLC, NOR ITS SUBSIDIARIES, AFFILIATES, OFFICERS
OR EMPLOYEES, SHALL BE LIABLE TO YOU OR ANY OTHER THIRD PARTY FOR ANY DIRECT,
INDIRECT, INCIDENTAL, SPECIAL, OR CONSEQUENTIAL DAMAGES. MEMBERS AND VISITORS
(“USERS”) AGREE TO INDEMNIFY AND HOLD FIBOZACHI LLC, AND ITS SUBSIDIARIES,
AFFILIATES, OFFICERS AND EMPLOYEES, HARMLESS FROM ANY CLAIM OR DEMAND,
INCLUDING REASONABLE ATTORNEYS’ FEES, MADE BY ANY THIRD PARTY DUE TO OR
ARISING OUT OF A USER’S USE OF FIBOZACHI LLC’S WEBSITE.
TradeStation Disclaimer:
“Neither TradeStation Technologies nor any of its affiliates has reviewed, certified, endorsed, approved,
disapproved or recommended, and neither does or will review, certify, endorse, approve, disapprove or
recommend, any trading software tool that is designed to be compatible with the TradeStation Open
Platform.”