Embed Size (px)
Citation preview

Superior Courts of CaliforniaSeismic Assessment Program
Superior Courts of California,Seismic Assessment Program
Summary Report ofPreliminary Findings
Prepared byRutherford & Chekene Consulting Engineers
For
January 2004
Superior Courts of CaliforniaSeismic Assessment Program


January 2004
Superior Courts of CaliforniaSeismic Assessment Program
Foreword
This Summary Report of preliminary findings for the Superior Courts ofCalifornia - Seismic Assessment Program contains the background and trendanalyses of statewide preliminary findings of a study conducted by theAdministrative Office of the Courts pursuant to the Trial Court Facilities Act of2002 (SB 1732, Escutia) as one of many steps in the process for transferringresponsibility for court facilities from counties to the state. The report describes themethodology of the investigation, the basic nature of building performance inseismic events, and the various approaches reflected in building codes and used byprofessional organizations to measure and categorize this performance, as well asoverall preliminary engineering findings for the inventory of buildings examined. Itis the intent of this study to comply with SB 1732's requirements and to assist thestate and counties in accomplishing the transfer of court facilities responsibility andownership.
In the course of the facilities transfer discussions between each county and thestate, the state's preliminary findings will be reviewed and discussed with eachcounty within the standard due diligence framework. As of the date of release ofthis preliminary report, this transfer process is in its very initial phases and thesediscussions have not yet occurred with the majority of counties or been concludedwith others. These discussions will allow for county representatives to provideadditional information on specific buildings that were not available during the study,which could prompt re-evaluation of the findings and resolution of 'pending'findings regarding a specific building. Alternatively, further structural studies may beperformed, independent of this program, or the County may appeal the engineers'evaluation, as envisioned in the implementation process of the Trial Court FacilitiesAct. Because this process has not been completed, individual building risk levelratings are not included in this issue of the report. Once the AOC and a countycomplete the due diligence process, the risk level rating of the individual buildingswill be included in subsequent periodic issuances of the Summary Report “Matrixof Evaluated Buildings”.
In a seismically active area such as the state of California, assessment of theearthquake performance of buildings is prudent in order to plan for protection of
Foreword

Foreword
occupants and physical assets. Seismic risk evaluations point out specific deficiencies and help focusresources towards efficient and effective mitigation measures. The apparently high proportion of buildingspreliminarily identified as below the acceptable threshold for transfer in this program is not surprising.Similar seismic evaluation programs conducted by the federal government, other state agencies,universities, and cities, have found that many older buildings may pose a higher risk in a “design”earthquake event than newer buildings. For example a 1993 study of 78 public buildings in San Franciscodetermined that 80% were below their acceptable threshold. A California Hospital Seismic SafetyProgram detailed assessment of pre-1973 buildings determined that 83% were below their acceptablethreshold.
The increasingly sophisticated evaluation techniques and the evolving understanding of buildingperformance in seismic events is discussed in “Describing Seismic Performance” and “Reliability ofSeismic Evaluations” sections of the Introduction as well as in the Conclusions. The findings of thisprogram do not mean that buildings were designed and built improperly, or that these buildings are lesssafe than other similarly constructed buildings. The findings represent the best available engineering andcurrent knowledge; the findings will allow informed decisions to be made about individual court buildings.
The documentation for this program comprise three distinct volumes: this Summary Report, whichprovides an overview and summary of the entire program; separate draft County Reports (numbered 01-58, by county), which provide a detailed engineering description of the evaluation process and thebuilding-by-building draft evaluations; and separate Calculation Appendices (numbered 01-58, by county),which include all the supporting engineering calculations. The draft County Reports and CalculationAppendices will be used in support of the due diligence process, and published as that process iscompleted.
The AOC team involved in this study sincerely appreciates the many hours dedicated by the engineersreviewing thousands of documents for over two hundred buildings throughout the state, for the assistancefrom the Seismic and Special Programs Unit of the Department of General Services, and for thecooperation of county public works staff who provided construction drawings of the buildings andarranged field visits for the engineers. The most experienced structural engineering practitioners inCalifornia have conducted these investigations and constantly challenged each other through the peerreview process to produce well-reasoned, consistent, and sound evaluations. We thank all who haveparticipated in these efforts and welcome the dialogue with our county colleagues during the transferdiscussions.
Kim Davis, AIAActing Director
Clifford Ham, AIASenior Project Manager
Administrative Office of the CourtsOffice of Court Construction and ManagementJanuary 2004
Superior Courts of CaliforniaSeismic Assessment Program
January 2004

Table of ContentsJanuary 2004
Superior Courts of CaliforniaSeismic Assessment Program
Executive Summary 1Summary Matrix of Evaluated Buildings 4Summary Matrix of Exempted Buildings 9
Introduction 15History 15Objective 15Overview of Program 15
Initial Screening Phase 26Background 26Procedure 29Interim Findings 31
Tier 1 Detailed Evaluation Phase 32Background 32Procedure 33Interim Findings 36
Tier 2 Detailed Evaluation Phase 41Background 41Procedure 41Interim Findings 41
Conclusions 43Summary of Preliminary Findings 43Analysis of Risk Level Assignments 45Expanded Summary Matrix of Evaluated Buildings 50
References 64Acknowledgments 65Certifications 69
Table of Contents of Summary Report


Executive Summary 1
In preparation for transfer of ownership and managementresponsibility for trial court facilities from the counties to thestate, the Office of Court Construction and Management of theAdministrative Office of the Courts initiated a seismic assessmentprogram to ascertain the seismic performance of court buildingsstatewide. This report documents the preliminary findings of thatseismic assessment program conducted in accordance with theTrial Court Facilities Act of 2002 (SB 1732, Escutia). The actestablishes the process for affecting the transfers and requires thatthe state evaluate buildings containing court facilities for seismicsafety. Buildings must meet the seismic criteria set forth in the actto be eligible to transfer, unless provisions are made forcorrection of their deficient items. Under Assembly Bill 233—theLockyer-Isenberg Trial Court Act of 1997—the Task Force onCourt Facilities conducted a statewide inventory of courtbuildings [1999-2001]. Of the 452 buildings identified in theinventory, 227 were exempted from evaluation under this programby meeting one or more of the following criteria:
The building was built in accordance with the 1988Uniform Building Code (or later code) or upgraded since1988;
The court-occupied space is less than 10,000 square feet(sf) and less than 20% of the total building area; or
The building is a leased, abandoned, modular, or storagefacility.
The Administrative Office of the Courts (AOC) selected eightprominent California consulting structural engineering firms(CSEs) to evaluate the remaining 225 buildings in the seismicassessment program. The AOC also selected a separate firm as
January 2004
Superior Courts of CaliforniaSeismic Assessment Program
Executive Summary

Executive Summary 2
supervising structural engineer (SSE) to coordinate the program.In the program's first phase, the most experienced representativesof the engineering firms screened available structural drawings. Inaddition to assigning obvious risk level ratings, they noted thatmany buildings previously identified by occupancy and use asstand-alone buildings actually consisted of multiple structures,separated by expansion or seismic joints. Because each of thesesegments required independent seismic evaluation, the database ofstructures to be evaluated increased to 300 separate entries thatmade up the 225 buildings.
The Trial Court Facilities Act of 2002 specifies that the seismicevaluations be done according to procedures developed by theCalifornia Department of General Services (DGS). The technicalevaluation method used by the DGS is based on documentsdeveloped by the Federal Emergency Management Agency(FEMA) and is currently published as ASCE 31, Standard for theSeismic Evaluation of Buildings. These procedures result in structuresbeing assigned a seismic risk level from I to VII (Risk Level Irepresenting the best performance and VII representing the worstperformance). The act specified further that Risk Levels V - VIIrepresented an “unacceptable seismic safety rating” (Gov. Code,§70301(l)). A structure rated Risk Level V or worse would requireprovision for correction of the deficient items before it could betransferred to the state.
During the evaluation process it was determined that for certainstructures, due to a lack of available information or the need foranalysis beyond that prescribed in the program, less reliable risklevel assignments had been made than for the balance of theinventory. This group of structures included 60 for whichadequate structural drawings were not available, 14 for whichadequate information was not available for complete seismicevaluation concerning the possibility of liquefaction at the site,anchorage of plaster ceilings over large assembly spaces, oranchorage of external precast concrete panels, and 7 for whichthe evaluating structural engineers included an opinion in theirreport that further analysis (e.g. a Tier 3 Evaluation) might changetheir rating. Although all 81 of these structures were evaluatedand assigned risk levels in accordance with procedures consistentwith the methods of DGS, the AOC decided to classify these
January 2004
Superior Courts of CaliforniaSeismic Assessment Program

Executive Summary 3
structures as “pending” until the issues described above areresolved.
Of the 300 structures in this assessment program, 72 were assignedpreliminary ratings of Risk Level IV or better, 147 preliminaryratings of Risk Level V or worse, and 81 were assigned to the"pending" category. Based on building area, this translates to about2.78 million square feet in structures with Risk Level IV or betterand about 11.89 million square feet in structures with Risk Level Vor worse.
Considering that knowledge of California's seismicity and ofbuilding response to earthquake shaking is constantly evolving, andthat criteria for determining acceptable levels of risk to life safetyare generally conservative, it is not surprising that many olderbuildings are assigned risk level ratings of V or worse. Othercomparable studies of institutional-type buildings have found similarratings with regard to seismic life safety standards. It must also beremembered that these ratings are based primarily on an assessmentof the level of potential risk to life safety and are not intended as ameasure of expected economic damage. Buildings assigned a RiskLevel IV could suffer structural and nonstructural damage resultingin extensive repair costs and loss of function for months. On theother hand, a building assigned a Risk Level V should not beassumed to be a threat to collapse as a result of every potentialearthquake. Many buildings, for example, survived the 1994Northridge earthquake with minimal damage. In short, under therelatively extreme shaking intensity and duration assumed forstandard seismic evaluations, damage levels in the buildings arejudged to create potentially one or more conditions that, accordingto the evaluation procedure, dictate the risk level rating assigned.
A list of the buildings evaluated in this study is presented in theSummary Matrix of Evaluated Buildings, which includes theidentifying number, name, and address of each evaluated building.In addition, the building's known gross area, the year it wascompleted, and a categorization of structural/seismic building typeare shown. For complete reference, a Summary Matrix of ExemptedBuildings is also included.
January 2004
Superior Courts of CaliforniaSeismic Assessment Program
Summary Matrix of Evaluated Buildings 4January 2004
Superior Courts of CaliforniaSeismic Assessment Program
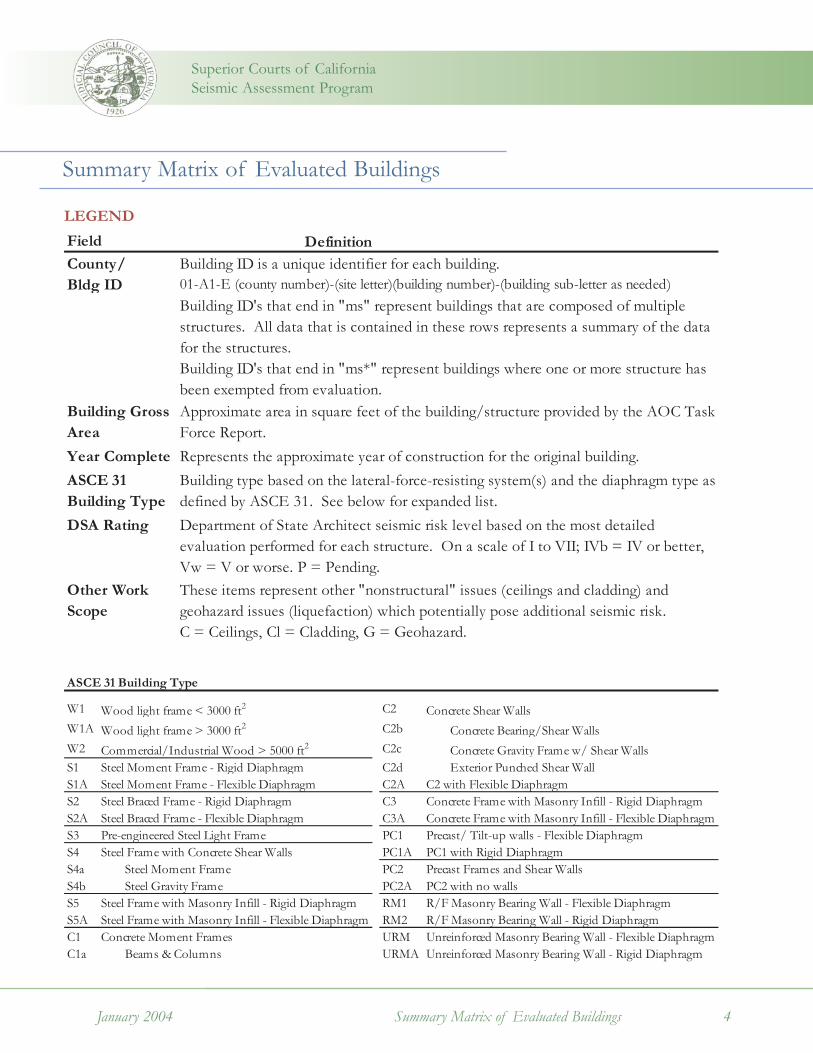
Summary Matrix of Evaluated Buildings
Definition
ASCE 31 Building Type
W1 Wood light frame < 3000 ft2 C2 Concrete Shear WallsW1A Wood light frame > 3000 ft2 C2b Concrete Bearing/Shear WallsW2 Commercial/Industrial Wood > 5000 ft2 C2c Concrete Gravity Frame w/ Shear WallsS1 Steel Moment Frame - Rigid Diaphragm C2d Exterior Punched Shear WallS1A Steel Moment Frame - Flexible Diaphragm C2A C2 with Flexible DiaphragmS2 Steel Braced Frame - Rigid Diaphragm C3 Concrete Frame with Masonry Infill - Rigid DiaphragmS2A Steel Braced Frame - Flexible Diaphragm C3A Concrete Frame with Masonry Infill - Flexible DiaphragmS3 Pre-engineered Steel Light Frame PC1 Precast/ Tilt-up walls - Flexible DiaphragmS4 Steel Frame with Concrete Shear Walls PC1A PC1 with Rigid DiaphragmS4a Steel Moment Frame PC2 Precast Frames and Shear WallsS4b Steel Gravity Frame PC2A PC2 with no wallsS5 Steel Frame with Masonry Infill - Rigid Diaphragm RM1 R/F Masonry Bearing Wall - Flexible DiaphragmS5A Steel Frame with Masonry Infill - Flexible Diaphragm RM2 R/F Masonry Bearing Wall - Rigid DiaphragmC1 Concrete Moment Frames URM Unreinforced Masonry Bearing Wall - Flexible DiaphragmC1a Beams & Columns URMA Unreinforced Masonry Bearing Wall - Rigid DiaphragmC b Sl b C l
Field
DSA Rating
ASCE 31 Building Type
Year Complete
Building Gross Area
Other Work Scope
Building ID is a unique identifier for each building. 01-A1-E (county number)-(site letter)(building number)-(building sub-letter as needed)
Department of State Architect seismic risk level based on the most detailed evaluation performed for each structure. On a scale of I to VII; IVb = IV or better, Vw = V or worse. P = Pending.
Represents the approximate year of construction for the original building.
These items represent other "nonstructural" issues (ceilings and cladding) and geohazard issues (liquefaction) which potentially pose additional seismic risk.C = Ceilings, Cl = Cladding, G = Geohazard.
Building type based on the lateral-force-resisting system(s) and the diaphragm type as defined by ASCE 31. See below for expanded list.
Building ID's that end in "ms" represent buildings that are composed of multiple structures. All data that is contained in these rows represents a summary of the data for the structures. Building ID's that end in "ms*" represent buildings where one or more structure has been exempted from evaluation.Approximate area in square feet of the building/structure provided by the AOC Task Force Report.
County/Bldg ID
LEGEND

Summary Matrix of Evaluated Buildings 5January 2004
C ount y/B ldg ID B uild ing N ame B uild ing A ddress
B uild ing Gross A rea
Y ear C omplet e
A SC E 3 1 B ldg . Type
D SA R at ing
Ot her W ork Scope
A lameda01-A1 Rene C. Davidson 1225 Fallon St., Oakland 284,120 1935 S401-A2-ms County Administrat ion Bldg. 1221 Oak St., Oakland 208,146 1961 Varies01-B1 County Probat ion Center 400 Broadway, Oakland 54,505 1963 S1/S401-B3 Wiley W. M anuel Courthouse 661 Washington St., Oakland 196,277 1977 S101-D1 Hayward Hall of Just ice 24405 Amador St., Hayward 184,785 1977 S4b01-F1 George E. M cDonald-HOJ 2233 Shoreline Dr., Alameda 25,850 1985 S101-G1 Berkeley Courthouse 2120 M art in Luther King, Jr. Way, Berkel 14,900 1958 C201-H1 Fremont Hall of Just ice 39439 Paseo Padre Pkwy., Fremont 124,100 1976 RM 2A lp ine02-A1 Alpine County Courthouse 99 Water St., M arkleeville 7,326 1928 URM /C2AA mador03-A1 Amador County Courthouse 108 Court St., Jackson 21,074 1860 URM03-B1-ms Amador Hospital/Courthouse 810 Court St., Jackson 69,107 1950 VariesB ut t e04-A1-ms* Butte County Courthouse 1 Court St., Oroville 55,810 1970 S2A04-B1 Downtown Courthouse 1931 Arlin Rhine Dr., Oroville 5,177 1968 RM 104-C1 Gridley Courthouse 239 Sycamore, Gridley 4,679 1963 W204-D1 Chico Courthouse 655 Oleander Ave., Chico 12,135 1966 RM 104-E1 Paradise Courthouse 747 Elliot Rd., Paradise 7,742 1961 RM 1C alaveras05-A1 Legal Bldg. 891 M ountain Ranch Rd., San Andreas 18,488 1964 PC1C ont ra C ost a07-A2 Old Courthouse 725 Court St., M art inez 100,657 1931 S407-A3 Bray Courts 1020 Ward St., M art inez 48,823 1986 S107-A4 Jail Annex 1010 Ward St., M art inez 12,843 1978 S1/S1A07-C1 Danville District Courthouse 640 Ygnacio Valley Rd., Walnut Creek 37,104 1973 RM 107-D1 Concord-M t. Diablo District 2970 Willow Pass Rd., Concord 8,509 1982 W1A07-E1 Pit tsburg-Delta 45 Civic Dr., Pit tsburg 23,900 1957 PC107-F1 Richmond-Bay District 100 37th St., Richmond 76,462 1953 S1/S4D el N ort e08-A1 Del Norte County Superior Court 450 'H' St., Crescent City 29,008 1950 W2El D orado09-A1 M ain St. Courthouse 495 M ain St., Placerville 17,951 1911 S509-C1 Superior Court 3321 Cameron Park Dr., Cameron Park 7,834 1984 W209-E1 Johnson Bldg. 1354 Johnson Blvd., South Lake Tahoe 37,453 1974 W2Fresno10-A1 Fresno County Courthouse. 1100 Van Ness Ave., Fresno 213,687 1962 S110-B1 North Annex Jail 1255 M St., Fresno 25,667 1985 C2c10-C1 Juvenile Delinquency Court 742 South Tenth St., Fresno 18,180 1985 W1A10-F1 Reedley Court 815 G St., Reedly 6,208 1965 RM 1Glenn11-B1 Orland Superior Court 821 E. South St., Orland 9,845 1965 RM 1Imperial13-A1 Imperial County Courthouse 939 W. M ain St., El Centro 66,000 1923 C2Inyo14-A1 Independence Superior Court 168 N. Edwards St., Independence 22,683 1922 C2Kern15-A1-ms Bakersf ield Superior Court 1415 Truxtum Ave., Bakersf ield 223,650 1956 Varies15-B1 Bakersf ield Just ice Bldg. 1215 Truxtun Ave., Bakersf ield 125,783 1980 S415-C1 Bakersf ield Juvenile Center 2100 College Ave., Bakersf ield 82,680 1990 S2/C215-D1 Delano/North Kern Court 1122 Jefferson St., Delano 14,377 1985 RM 115-E1 Shafter/Wasco Courts Bldg. 325 Central Valley Hwy., Shafter 16,836 1990 RM 1/W215-F1 Taft Courts Bldg. 311 Lincoln St., Taft 6,127 1984 W1A15-G1 East Kern Court-Lake Isabella Branch 7046 Lake Isabella Blvd., Lake Isabella 14,154 1985 RM 1/W215-H1 Arvin/ Lamont Branch 12022 M ain St., Lamont 26,680 1988 RM 115-I1 M ojave-M ain Court Facility 1773 Hwy. 58, M ojave 12,112 1974 RM 115-I2 M ojave-County Administrat ion Bldg. 1775 Hwy. 58, M ojave 8,538 1978 RM 115-J1 Ridgecrest-M ain Facility 132 E. Coso St., Ridgecrest 9,340 1974 RM 1Kings16-A1 Hanford M unicipal Court 1400 West Lacey Blvd., Hanford 18,512 1978 C1/C2A16-A2 Hanford New Superior Court 1400 West Lacey Blvd., Hanford 28,208 1991 C1c16-A3 Hanford Old Superior Court 1400 West Lacey Blvd., Hanford 11,968 1978 C2A16-A4 Hanford Juvenile Court 1400 West Lacey Blvd., Hanford 4,001 1987 W116-B1 Lemoore M unicipal Court 449 C St., Leemore 5,129 1959 RM 116-C1 Avenal M unicipal Court 501 E. Kings St.., Avenal 5,320 1965 W216-D1 Corcoran M unicipal Court 1000 Chit tanden Ave., Corcoran 5,908 1990 RM 1/W1ALake17-A3-ms Courthouse 255 N. Forbes St., Lakeport 55,588 1968 Varies17-B1 South Civic Center 7000A S. Center Dr., Clearlake 8,385 1974 RM 1Lassen18-A1 Lassen County Court 220 S. Lassen St., Susanville 29,800 1915 C3
Superior Courts of CaliforniaSeismic Assessment Program

Summary Matrix of Evaluated Buildings
Summary Matrix of Evaluated Buildings 6January 2004
C ount y/B ldg ID B uild ing N ame B uild ing A ddress
B uild ing Gross A rea
Y ear C omplet e
A SC E 3 1 B ldg . Type
D SA R at ing
Ot her W ork Scope
Los A ngeles19-AC1 San Fernando Court 900 Third St., San Fernando 191,108 1983 C219-AC2 San Fernando Courthouse Annex 919 First St., San Fernando 16,292 1952 RM 119-AD1 NewHall M unicipal Court 23747 W. Valencia Blvd., Valencia 32,124 1972 RM 119-AE1 Lancaster Courthouse M ain Bldg. 1040 W. Ave. J, Lancaster 42,388 1957 RM 119-AE2 Lancaster Courthouse Annex 1040 W. Ave. J, Lancaster 6,588 1980 W219-AF1 San Fernando Valley Juvenile Court 16350 Filbert St., Sylmar 38,902 1965 RM 219-AG1 Compton Courthouse 200 W. Compton Blvd., Compton 417,159 1978 S119-AI1 Los Padrinos Juvenile Court 7281 E. Quill Dr., Downey 34,167 1959 C219-AK1 Norwalk Courthouse 12720 Norwalk Blvd., Norwalk 208,195 1965 S2/S419-AM 1-ms Downey Court 7500 Imperial Hwy., Downey 111,223 1987 Varies19-AO1-ms Whit t ier Court 7339 Painter Ave., Whit t ier 87,895 1953 Varies19-AP1-ms Santa M onica Court 1725 M ain St., Santa M onica 122,565 1962 C219-AQ1 Beverly Hills Court 9355 Burton Way, Beverly Hills 184,882 1970 C219-AR1-ms West Los Angeles Courthouse 1633 Purdue Ave., Los Angeles 45,129 1960 C2/C2A19-AS1 M alibu Civic Center Bldg. 23525 Civic Center Way, M alibu 55,911 1970 RM 119-AV1-ms Hall of Records 320 Temple St., Los Angeles 447,000 1958 S419-AW1 Culver Court 4130 Overland Ave., Culver City 21,193 1956 W219-AX1 Van Nuys Courthouse 6230 Sylmar Ave., Van Nuys 178,048 1964 S119-AX2 Van Nuys Branch Court 14400 Erwin St. M all, Van Nuys 284,102 1989 S119-A1 Huntington Park Branch-Southeast M unicipal Court 6548 M iles Ave., Hunt ington Park 27,000 1954 C2A19-B1 Southgate Branch-Southeast M unicipal Court 8640 California Ave., South Gate 18,900 1954 C2A19-C1 South Bay Courthouse Superior and M unicipal 825 M aple Dr., Torrance 146,711 1967 C219-C2 South Bay Courthouse Annex-M unicipal 3221 Torrance Blvd., Torrance 15,126 1964 RM 119-E1 Inglewood Juvenile Court-Superior 110 Regent St., Inglewood 18,791 1950 C2b19-F1 Inglewood M unicipal Court 110 Regent St., Inglewood 174,041 1977 S119-G1-ms* Burbank Superior and M unicipal Courthouse 300 E. Olive Ave., Burbank 67,280 1952 Varies19-H1-ms Glendale Superior and M unicipal Courthouse 600 E. Broadway, Glendale 56,167 1956 S419-I1 Alhambra Superior and M unicipal Court 150 W. Commonwealth Ave., Alhambra 110,174 1970 S419-J1 Pasadena Superior Courthouse 300 E. Walnut St., Pasadena 187,120 1968 S4 19-J2 Pasadena M unicipal Courthouse 301 E. Walnut St., Pasadena 36,572 1950 C219-K1-ms Stanley M osk Courthouse 110 N. Grand Ave., Los Angeles 736,200 1957 S419-L1 Criminal Courts Bldg. 210 W. Temple St., Los Angeles 1,020,266 1972 S1/S219-N1 Santa Anita Court 300 W. M aple Ave., M onrovia 19,440 1954 W1A19-O1 Rio Hondo Court 11234 E. Valley Blvd., El M onte 129,176 1974 S119-P1 M ental Health Court 1150 North San Fernando Rd., Los Angel 27,617 1969 RM 119-Q1 Children's Court 201 Centre Plaza Dr., M onterey Park 263,623 1990 S119-R1-ms East lake Juvenile Court 1601 East lake Ave., Los Angeles 46,064 1951 Varies19-S1 Hollywood Branch Court 5925 Hollywood Blvd, Los Angeles 57,772 1984 RM 219-T1 M etropolitan Court 1945 S. Hill St., Los Angeles 250,000 1968 S419-U1 Central Arraignment Court 429 E. Bauchet St., Los Angeles 67,719 1974 C219-V1 East Los Angeles M unicipal Court 214 S. Fetterly Ave., Los Angeles 105,627 1990 S119-W1 Pomona Superior Court 400 Civic Center Plaza, Pomona 194,000 1969 S419-W2 Pomona Courthouse North 350 W. M ission Blvd., Pomona 47,267 1955 RM 219-X1-ms Citrus M unicipal Court 1427 W. Covina Pkwy., West Covina 107,998 1957 RM 119-Y1-ms Long Beach Court 415 W. Ocean Blvd., Long Beach 318,651 1958 S419-Z1 San Pedro Branch Court 505 S. Centre St., San Pedro 35,002 1969 C2DM ad era20-A1-ms M adera County Superior Ct. 209 W. Yosemite Ave., M adera 44,002 1911 Varies20-B1 Borden Court Bldg. 14241 Road 28, M adera 8,590 1965 URM A20-C1 Chowchilla Division 141 S. Second St., Chowchilla 3,222 1975 RM 120-D1 Sierra Courthouse 40601 Road 274, Bass lake 5,884 1975 VariesM ariposa22-A1 M ariposa County Courthouse 5088 Bullion St., M ariposa 5,920 1854 W2M endocino23-A1-ms County Courthouse 100 N. State St., Ukiha 57,979 1928 S423-B1 Just ice Center 700 S. Franklin St., Fort Bragg 12,286 1991 W1A23-E1 Superior Court (Willits) 125 E. Commercial, Willits 16,211 1988 W2M erced24-A1 New Courts Bldg. 627 W. 24th St., M erced 17,500 1950 C224-D1 Los Banos Judicial Center 445 " I" St., Los Banos 15,060 1980 RM 1M od oc25-A1-ms Barkley Just ice Center 205 East St., Alturas 27,740 1976 VariesM ono26-A1 Bridgeport County Courthouse State Hwy 395 North, Bridgeport 11,689 1880 W2M ont erey27-A1 Salinas Courthouse- North Wing 240 Church St., Salinas 97,630 1967 S127-A2 Salinas Courthouse- East Wing 240 Church St., Salinas 20,661 1937 C2b27-C1 M onterey Courthouse 1200 Aguajito Rd., M onterey 65,334 1968 C127-D1 King City Courthouse 250 Franciscan Way, King City 12,163 1968 W1AN ap a28-B1-ms Historical Courthouse 825 Brown St., Napa 36,109 1878 Varies
Superior Courts of CaliforniaSeismic Assessment Program

Summary Matrix of Evaluated Buildings 7January 2004
C ount y/B ldg ID B uild ing N ame B uild ing A ddress
B uild ing Gross A rea
Y ear C omplet e
A SC E 3 1 B ldg . Type
D SA R at ing
Ot her W ork Scope
N evada29-A1-ms Courthouse 201 Church St., Nevada City 23,463 1850's Varies29-A2 Annex 201 Church St., Nevada City 48,867 1968 C129-B1-ms* Superior Court in Truckee 10075 Lavone Ave, Truckee 23,068 1975 VariesOrange30-A1-ms Central Just ice Center 700 Civic Center Dr., Santa Ana 538,000 1966 S130-B1 Lamoreaux Just ice Center 341 The City Dr., Orange 248,676 1988 S130-C1-ms North Just ice Center 1275 N. Berkeley Ave., Fullerton 137,525 1968 PC1A30-C2 North Just ice Center Annex 1276 N. Berkeley Ave., Fullerton 34,600 1972 PC1A30-D1-ms West Just ice Center 8141 13th St., Westminster 190,000 1966 Varies30-E1-ms Harbor Just ice Center 4601 Jamboree, Newport Beach 106,591 1975 Varies30-F1 South Just ice Center 30143 Crown Valley Pkwy., Laguna Nigu 32,850 1968 C2Placer31-A1 Historic Courthouse 101 M aple Ave, Auburn 34,164 1894 URM A31-B1-ms Superior Court DeWitt Center 11542 'B' Ave, Auburn 33,030 1941 S231-C1 Superior Court in Roseville 300 Taylor St., Roseville 8,891 1969 PC131-E1 Superior Court in Colfax 10 Culver St, Colfax 1,785 1971 W1Plumas32-A1 Courthouse 520 M ain St., Quincy 36,187 1920 C2R iverside33-A2 1903/33 Courthouse Just ice Center area., Riverside 138,551 1903 C2b33-A3 Hall of Just ice 4100 M ain St., Riverside 144,855 1989 S133-C2 Annex Just ice Center (Indio) 46-200 Oasis St., Indio 40,715 195533-E1 Palm Springs Courts 3255 E. Tahquite Canyon Way, Palm Spri 51,336 1962 RM 1/W133-F1 Hemet 880 N. State St., Hemet 31,720 1969 RM 133-G1-ms Banning I-55 E. Hays St., Banning 35,000 1960 RM 133-H1 Temecula 41002 County Center Dr., Temecula 12,557 1988 W233-J1-ms Corona 505 S. Buena Vista, Corona 49,770 1974 Varies33-K1 Perris Bldg. A 227 North " D" St., Perris 18,407 1949 W1A33-K2 Perris Bldg. B 227 North " D" St., Perris 12,699 1949 S333-L1 Lake Elsinore Courts/Sherif f 117 S. Langstaff , Lake Elsinore 3,500 1975 RM 133-N1 Juvenile Just ice Center 9991 Country Farm Rd., Riverside 6,614 1986 C2ASacrament o34-A1 Sacramento Superior Court 720 Ninth St., Sacramento 288,896 1965 C2San B enit o35-A1 San Benito Courthouse 440 Fif th St., Hollister 26,396 1962 C2cSan B ernard ino36-A1 Central Courthouse 351 N. Arrowhead Ave, San Bernadino 89,355 1926 C236-A2 Central Courthouse - Annex 351 N. Arrowhead Ave, San Bernadino 94,751 1958 C336-B1 Juvenile Court 900 E. Gilbert St., San Bernadino 8,626 1968 RM 236-C1 Fontana Court 17780 Arrow Hwy., Fontana 32,637 1972 RM 136-D1 Redlands Court 216 Brookside Ave., Redlands 11,248 1961 RM 136-E1 Joshua Tree Court 6527 White Feather Rd., Joshua Tree 36,219 1982 S3/RM 236-F1 Rancho Cucamonga Courthouse 8303 Haven Ave., Rancho Cucamonga 242,138 1985 Base Isolated36-G1 Chino Court 13260 Central Ave., Chino 36,542 1975 RM 136-J1 Barstow Court 235 E. M ountain View Ave., Barstow 34,840 1976 RM 236-K1 Needles Court 1111 Bailey St., Needles 6,974 1974 RM 136-L1-ms* Victorville Court 14455 Civic Dr., Victorville 97,938 1973 RM 1San D iego37-A1-ms County Courthouse 220 West Broadway, San Diego 398,900 1961 S437-C1 Kearny M esa Court 8950 Clairemont M esa Blvd., San Diego 41,450 1960 RM 137-D1-ms Family Court 1501-1555 Sixth Ave, San Diego 48,880 1955 S4/C237-E1 Juvenile Court 2851 M eadowlark Dr., San Diego 46,759 1968 RM 137-F2-ms North County Regional Center - Vista Center Addit 325 S. M elrose, San Diego 215,650 1972 S137-F3 Annex 325 S. M elrose, San Diego 21,895 1973 W237-H1 South County Regional Center 500 Third Ave., Chula Vista 142,253 1981 S1/C237-I1-ms East County Regional Center 250 E. M ain St., El Cajon 304,230 1983 Varies37-J1 Ramona Courthouse 1425 M ontecito Rd., Ramona 3,134 1980 W1ASan F rancisco38-B1 Hall of Just ice 850 Bryant St., San Francisco 711,889 1958 C2San Joaquin39-A1-ms Courts Building 222 E. Weber Ave., Stockton 266,200 1963 S239-B1 Juvenile Just ice Center W. M athews Rd., French Camp 12,740 1982 RM 139-C1 M anteca Branch Court 315 E. Center St., M anteca 6,425 1965 RM 139-D2 Lodi Branch- Dept. 2 315 W. Elm St., Lodi 7,000 1968 RM 139-E1 Tracy Branch Courthouse 475 E. 10th St., Tracy 6,714 1968 RM 1San Luis Obsipo40-A1-ms San Luis Obispo Government Center 1035 Palm St., San Luis Obispo 112,000 1983 Varies
Superior Courts of CaliforniaSeismic Assessment Program

Summary Matrix of Evaluated Buildings
Summary Matrix of Evaluated Buildings 8January 2004
Superior Courts of CaliforniaSeismic Assessment Program
C ount y/B ldg ID B uild ing N ame B uild ing A ddress
B uild ing Gross A rea
Y ear C omplet e
A SC E 3 1 B ldg . Type
D SA R at ing
Ot her W ork Scope
San M at eo41-A1 Hall of Just ice 400 County Center, Redwood City 316,515 1956 S141-A2 Traff ic/ Small Claims Annex 500 County Center, Redwood City 9,714 1960 C2A41-B1 Central Branch 800 North Humbolt St., San M ateo 17,438 1961 RM 1/W241-C1-ms M unicipal Court Bldg., Northern Branch 1050 M ission Rd., South Francisco 56,647 1961 RM 141-D1 Juvenile Branch 21 Tower Rd., San M ateo 13,414 1943 RM 1Sant a B arbara42-A1 Santa Barbara County Courthouse 1100 Anacapa St., Santa Barbara 134,729 1929 C242-B1 Santa Barbara M unicipal Court 118 E. Figueroa St., Santa Barbara 44,470 1953 C242-D1-ms Lompoc M unicipal Court 115 Civic Center Plaza, Lompoc 25,587 1956 W242-F1-ms Santa M aria Courts 312 E. Cook St., Santa M aria 30,000 1970 W1A42-F3 Santa M aria M uni Clerk 314 E. Cook St., Santa M aria 4,400 1954 W1Sant a C lara43-A1 Hall of Just ice 190 W. Hedding, San Jose 127,139 1993 S1/S243-A2 San Jose M unicipal Court 200 W. Hedding, San Jose 69,810 1960 C243-B1 Downtown Superior Courthouse 191 N. First St., San Jose 126,005 1963 C2b43-B2 Old County Courthouse 161 N. First St., San Jose 33,557 1866 S4b43-D1 Palo Alto Facility 270 Grant St., Palo Alto 83,451 1960 C243-F1 Sunnyvale Facility 605 W. El Camino Real, Sunnyvale 19,994 1967 W243-G1 Santa Clara M unicipal Courts 1095 Homestead Rd., Santa Clara 33,559 1976 S243-I1-ms Los Gatos Facility 14205 Capril Dr., Los Gatos 11,572 1960 VariesSant a C ruz44-A1 M ain Courthouse 701 Ocean St., Santa Cruz 37,585 1965 C1a44-A2 County Administrat ion Bldg. 701 Ocean St., Santa Cruz 206,400 1965 PC244-B1 Watsonville Courthouse 1430 Freedom Blvd., Watsonville 14,624 1965 W2Shast a45-A1 M ain Courthouse 1500 Court St., Redding 86,428 1956 C245-A7 M ain Courthouse Annex 1451 Court St., Redding 37,270 1965 S445-B1 Shasta County Superior Court /Sherif f 's Stat ion 20509-C Shasta St., Burney 4,867 1964 W1Sierra46-A1-ms Courthouse/Sherif f Stat ion-Jail 100 Courthouse Square, Downieville 19,181 1950 C2ASiskiyou47-A1-ms Siskiyou County Courthouse, 1908 Building 311 Fourth St., Yreka 51,533 1908 S547-B1 Dorris 324 N. Pine St., Dorris 2,585 1974 W1So lano48-A1-ms Hall of Just ice 600 Union Ave., Fairf ield 139,740 1923 Varies48-A2 Law and Just ice Center - Fairf ield 530 Union Ave., Fairf ield 54,000 1988 C2b48-B1-ms* Hall of Just ice 321 Tuolumne St. Vallejo 61,840 1955 VariesSonoma49-A1-ms* Hall of Just ice 600 Administrat ion Dr., Santa Rosa 180,188 1965 C2St anislaus50-A1 M odesto M ain Courthouse 1100 I St., M odesto 108,824 1938 C250-B1 M odesto Juvenile court . 2215 Blue Gum, M odesto 9,200 1976 RM 1/RM 250-C1 Ceres M unicipal Court . 2744 Second St., Ceres 2,985 1969 RM 150-D1 Turlock M unicipal Court . 300 Starr Ave., Turlock 4,735 1975 W2Sut t er51-A1-ms Courthouse West 446 Second St., Yuba City 20,815 1899 Varies51-A2 Courthouse East 463 Second St., Yuba City 28,360 1953 C2Tehama52-A1 Historic Courthouse 633 Washington St., Red Bluff 23,371 1920 URM A52-A3 Annex No. 2 633 Washington St., Red Bluff 15,370 1988 W252-B1 Superior Court at Corning 720 Hoag St., Corning 4,500 1979 S3Trinit y53-A1-ms Trinity County Courthouse 101 Court St., Weaverville 42,789 1857 VariesTulare54-A1-ms Visalia Superior Court 2300 W. Burrel Ave., Visalia 185,111 1955 S154-B1-ms Tulare-Pixley M unicipal Court 425 E. Kern St., Tulare 11,641 1959 Varies54-C1-ms Porterville Government Center 87 E. M orton Ave., Porterville 18,936 1960 RM 1/RM 2Tuo lomne55-A1 Historic Courthouse 41 W. Yaney, Sonora 23,120 1898 URM AV ent ura56-A1-ms Hall of Just ice 800 S. Victoria Ave., Ventura 350,057 1975 S256-B1 East County Courthouse 3855 F Alamo St., Simi Valley 84,252 1989 PC1Y o lo57-A1 Courthouse 725 Court St., Woodland 45,161 1917 C257-A2 Old Jail 213 Third Street, Woodland 21,625 1969 C2bY uba58-A1-ms* Yuba County Courthouse 215 Fif th St., M arysville 142,460 1960 S4

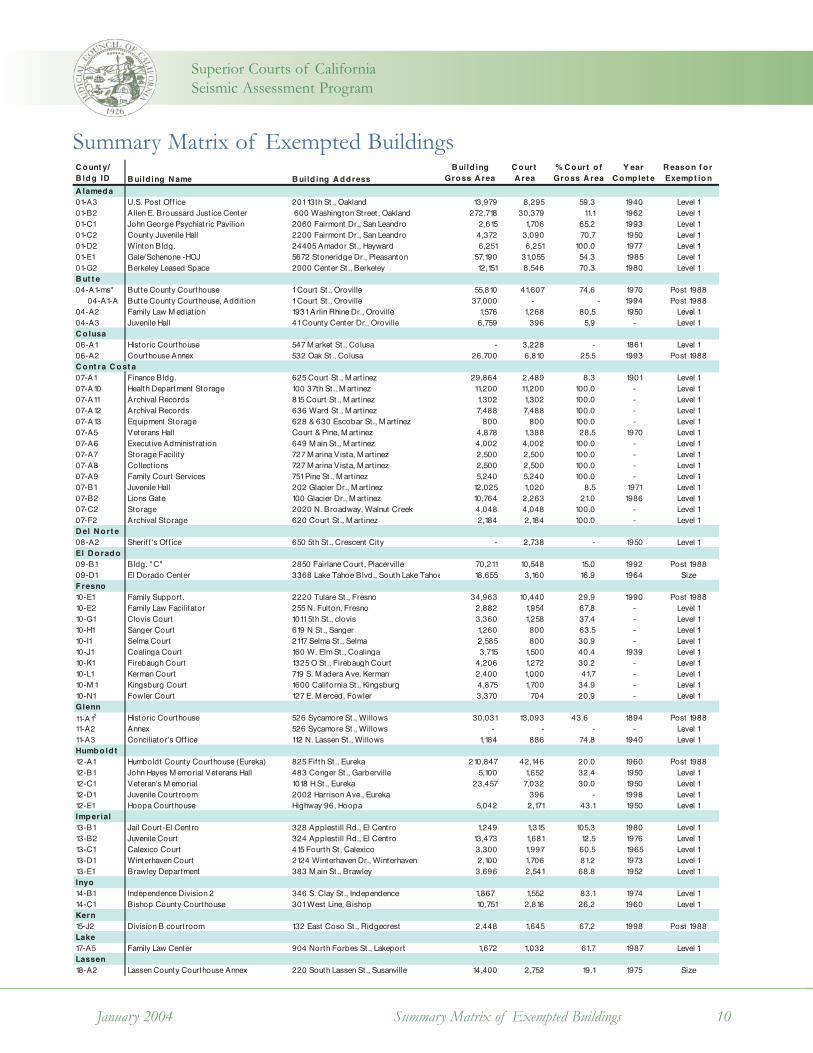
Summary Matrix of Exempted Buildings 9January 2004
Superior Courts of CaliforniaSeismic Assessment Program
Summary Matrix of Exempted Buildings
Field DefinitionCounty/Bldg ID
Building Gross AreaCourt Area
% Court of Gross Area
Court Area as a percentage of the Building Gross Area
Year Complete
Reason for Exemption
Approximate area in square feet of the court facilities within the building/structure provided by the AOC Task Force Report.
Building ID is a unique identifier for each building. 01-A1-E (county number)-(site letter)(building number)-(building sub-letter as needed)
Post 1988 = Designed to conform with the 1988 UBC or later editions.Size = Less than 20% Court facilities and less than 10,000 sf.Level 1 = Leased, abandoned, modular, or storage facility.
Represents the approximate year of construction for the original building (or the most recent retrofit/upgrade).
Building ID's that end in "ms" represent buildings that are composed of multiple structures. All data that is contained in these rows represents a summary of the data for the structures. Building ID's that end in "ms*" represent buildings where one or more structure hasbeen exempted from evaluation.
Approximate area in square feet of the building/structure provided by the AOC Task Force Report.
LEGEND
The Trial Court Facilities Act of 2002 (Senate Bill 1732) exempted the following categories ofbuildings from seismic assessment:A. “Facilities built in accordance with 1988 UBC or upgraded since 1988”;B. “Facilities less than 10,000 sf and less then 20% of total building”;C. “Leased, Abandoned, or Modular and Non Court Facilities”.
The Summary Matrix of Exempted Buildings identifies all such buildings as well as the reason forexemption.
Summary Matrix of Exempted Buildings
Summary Matrix of Exempted Buildings 10January 2004
C ount y/B ldg ID B uild ing N ame B uild ing A ddress
B uild ing Gross A rea
C ourt A rea
% C ourt o f Gross A rea
Y ear C omplet e
R eason f o r Exempt ion
A lameda01-A3 U.S. Post Off ice 201 13th St., Oakland 13,979 8,295 59.3 1940 Level 101-B2 Allen E. Broussard Just ice Center 600 Washington Street, Oakland 272,718 30,379 11.1 1962 Level 101-C1 John George Psychiatric Pavilion 2060 Fairmont Dr., San Leandro 2,615 1,706 65.2 1993 Level 101-C2 County Juvenile Hall 2200 Fairmont Dr., San Leandro 4,372 3,090 70.7 1950 Level 101-D2 Winton Bldg. 24405 Amador St., Hayward 6,251 6,251 100.0 1977 Level 101-E1 Gale/Schenone -HOJ 5672 Stoneridge Dr., Pleasanton 57,190 31,055 54.3 1985 Level 101-G2 Berkeley Leased Space 2000 Center St., Berkeley 12,151 8,546 70.3 1980 Level 1B ut t e04-A1-ms* Butte County Courthouse 1 Court St., Oroville 55,810 41,607 74.6 1970 Post 1988
04-A1-A Butte County Courthouse, Addit ion 1 Court St., Oroville 37,000 - - 1994 Post 198804-A2 Family Law M ediat ion 1931 Arlin Rhine Dr., Oroville 1,576 1,268 80.5 1950 Level 104-A3 Juvenile Hall 41 County Center Dr., Oroville 6,759 396 5.9 - Level 1C olusa06-A1 Historic Courthouse 547 M arket St., Colusa - 3,228 - 1861 Level 106-A2 Courthouse Annex 532 Oak St., Colusa 26,700 6,810 25.5 1993 Post 1988C ont ra C ost a07-A1 Finance Bldg. 625 Court St., M art inez 29,864 2,489 8.3 1901 Level 107-A10 Health Department Storage 100 37th St., M art inez 11,200 11,200 100.0 - Level 107-A11 Archival Records 815 Court St., M art inez 1,302 1,302 100.0 - Level 107-A12 Archival Records 636 Ward St., M art inez 7,488 7,488 100.0 - Level 107-A13 Equipment Storage 628 & 630 Escobar St., M art inez 800 800 100.0 - Level 107-A5 Veterans Hall Court & Pine, M art inez 4,878 1,388 28.5 1970 Level 107-A6 Execut ive Administrat ion 649 M ain St., M art inez 4,002 4,002 100.0 - Level 107-A7 Storage Facility 727 M arina Vista, M art inez 2,500 2,500 100.0 - Level 107-A8 Collect ions 727 M arina Vista, M art inez 2,500 2,500 100.0 - Level 107-A9 Family Court Services 751 Pine St., M art inez 5,240 5,240 100.0 - Level 107-B1 Juvenile Hall 202 Glacier Dr., M art inez 12,025 1,020 8.5 1971 Level 107-B2 Lions Gate 100 Glacier Dr., M art inez 10,764 2,263 21.0 1986 Level 107-C2 Storage 2020 N. Broadway, Walnut Creek 4,048 4,048 100.0 - Level 107-F2 Archival Storage 620 Court St., M art inez 2,184 2,184 100.0 - Level 1D el N ort e08-A2 Sherif f 's Off ice 650 5th St., Crescent City - 2,738 - 1950 Level 1El D orado09-B1 Bldg. " C" 2850 Fairlane Court , Placerville 70,211 10,548 15.0 1992 Post 198809-D1 El Dorado Center 3368 Lake Tahoe Blvd., South Lake Tahoe 18,655 3,160 16.9 1964 SizeFresno10-E1 Family Support . 2220 Tulare St., Fresno 34,963 10,440 29.9 1990 Post 198810-E2 Family Law Facilitator 255 N. Fulton, Fresno 2,882 1,954 67.8 - Level 110-G1 Clovis Court 1011 5th St., clovis 3,360 1,258 37.4 - Level 110-H1 Sanger Court 619 N St., Sanger 1,260 800 63.5 - Level 110-I1 Selma Court 2117 Selma St., Selma 2,585 800 30.9 - Level 110-J1 Coalinga Court 160 W. Elm St., Coalinga 3,715 1,500 40.4 1939 Level 110-K1 Firebaugh Court 1325 O St., Firebaugh Court 4,206 1,272 30.2 - Level 110-L1 Kerman Court 719 S. M adera Ave, Kerman 2,400 1,000 41.7 - Level 110-M 1 Kingsburg Court 1600 California St., Kingsburg 4,875 1,700 34.9 - Level 110-N1 Fowler Court 127 E. M erced, Fowler 3,370 704 20.9 - Level 1Glenn
11-A12 Historic Courthouse 526 Sycamore St., Willows 30,031 13,093 43.6 1894 Post 198811-A2 Annex 526 Sycamore St., Willows - - - - Level 111-A3 Conciliator's Off ice 112 N. Lassen St., Willows 1,184 886 74.8 1940 Level 1Humbold t12-A1 Humboldt County Courthouse (Eureka) 825 Fif th St., Eureka 210,847 42,146 20.0 1960 Post 198812-B1 John Hayes M emorial Veterans Hall 483 Conger St., Garberville 5,100 1,652 32.4 1950 Level 112-C1 Veteran's M emorial 1018 H St., Eureka 23,457 7,032 30.0 1950 Level 112-D1 Juvenile Courtroom 2002 Harrison Ave., Eureka 396 - 1998 Level 112-E1 Hoopa Courthouse Highway 96, Hoopa 5,042 2,171 43.1 1950 Level 1Imperial13-B1 Jail Court-El Centro 328 Applest ill Rd., El Centro 1,249 1,315 105.3 1980 Level 113-B2 Juvenile Court 324 Applest ill Rd., El Centro 13,473 1,681 12.5 1976 Level 113-C1 Calexico Court 415 Fourth St, Calexico 3,300 1,997 60.5 1965 Level 113-D1 Winterhaven Court 2124 Winterhaven Dr., Winterhaven 2,100 1,706 81.2 1973 Level 113-E1 Brawley Department 383 M ain St., Brawley 3,696 2,541 68.8 1952 Level 1Inyo14-B1 Independence Division 2 346 S. Clay St., Independence 1,867 1,552 83.1 1974 Level 114-C1 Bishop County Courthouse 301 West Line, Bishop 10,751 2,816 26.2 1960 Level 1Kern15-J2 Division B courtroom 132 East Coso St., Ridgecrest 2,448 1,645 67.2 1998 Post 1988Lake17-A5 Family Law Center 904 North Forbes St., Lakeport 1,672 1,032 61.7 1987 Level 1Lassen18-A2 Lassen County Courthouse Annex 220 South Lassen St., Susanville 14,400 2,752 19.1 1975 Size
Superior Courts of CaliforniaSeismic Assessment Program

Summary Matrix of Exempted Buildings 11January 2004
Superior Courts of CaliforniaSeismic Assessment Program
C ount y/B ldg ID B uild ing N ame B uild ing A ddress
B uild ing Gross A rea
C ourt A rea
% C ourt o f Gross A rea
Y ear C omplet e
R eason f o r Exempt ion
Los A ngeles19-AA1 Catalina Court 215 Sumner Ave., Avalon 2,500 2,021 80.8 1960 Level 119-AB1 Beacon St. Bldg. 638 South Beacon St., San Pedro 2,538 1,761 69.4 1926 Level 119-AD2 Newhall M unicipal Court Annex 23747 Valencia Blvd., Valencia 20,668 2,746 13.3 1972 Size19-AE3 Juvenile Delinquency (Old Sherif f 's Stat ion) 1010 West Ave. J, Lancaster 19,754 5,708 28.9 1960 Level 119-AE4 Jury Assembly 1040 West Ave. J, Lancaster 1,525 1,301 85.3 1995 Level 119-AE5 Dependency Court 1000 West Ave. J, Lancaster 5,964 4,826 80.9 1997 Level 119-AH1 Lynwood Regional Just ice Court 11701 Alameda St., Lynwood 183,274 23,492 12.8 1994 Level 119-AJ1 M ira Loma Detent ion Facility 45100 North 60th St. West, Lancaster 746 680 91.2 1960 Level 119-AL1 Los Cerritos Judicial Center 10025 Flower St., Bellf lower 97,207 37,554 38.6 1989 Post 198819-AN1 David M . Kenyon Juvenile Just ice Center 7625 South Central Ave., Los Angeles 18,684 8,034 43.0 1976 Level 119-AP2 Court Trailer - Div. J, K & L 1725 M ain St., Santa M onica 7,627 7,016 92.0 1980 Level 119-AR2 Jury Assembly Trailer 1633 Purdue Ave., Los Angeles 1,400 - - 1985 Level 119-AR3 Former Jury Assembly Trailer(vacant) 1633 Purdue Ave., Los Angeles 1,000 - - 1980 Level 119-AR4 Small Claims Court - 99A 1633 Purdue Ave., Los Angeles 1,350 1,315 97.4 1985 Level 119-AR5 West Los Angeles Court Annex 1645 Purdue Ave., Los Angeles 17,780 12,904 72.6 1965 Level 119-AT1 Calabasas M unicipal Court 5030 N. Pkwy. Calabasas, Calabasas 7,960 5,459 68.6 1987 Level 119-AU1 Airport Court 11701 South La Cienega Blvd., Los Angeles 304,725 106,938 35.1 1999 Post 198819-AX3 Van Nuys Civil Trailer 6230 Sylmar Ave., Van Nuys 8,193 6,191 75.6 1994 Level 119-AX4 Van Nuys Small Claims Court 6230 Sylmar Ave., Van Nuys 16,207 8,716 53.8 1994 Level 119-C3 S. Bay M uni Court Jury Assembly Trailer 825 M aple Dr., Torrance 2,874 2,874 100.0 1990 Level 119-C4 S. Bay M unicipal Traff ic Court Trailer 825 M aple Dr., Torrance 2,891 2,891 100.0 1963 Level 119-D1 S. Bay M unicipal Court Beach Cit ies Branch 117 W. Torrance Blvd., Redondo Beach 10,593 9,252 580.8 1990 Level 119-G1-ms* Burbank Superior and M unicipal Courthouse 300 E. Olive Ave., Burbank 67,280 39,040 58.0 1952 Post 1988
19-G1-A Burbank Superior and M unicipal Courthouse, 300 E. Olive Ave., Burbank - - 1992 Post 198819-M 1 Central Civil West 600 S. Commonwealth Ave., Los Angeles 135,765 75,534 55.6 1991 Post 1988M arin21-A1-ms Civic Center Courthouse 3501 Civic Center Dr., San Rafael 359,811 63,248 17.6 1962 Varies
21-A1-A Civic Center Courthouse, Hall of Just ice Wing 3501 Civic Center Dr., San Rafael 214,681 - - 1969 Post 198821-A1-E Civic Center Courthouse, Admin. Wing 3501 Civic Center Dr., San Rafael 145,130 - - 1962 Level 1
21-A2 Family Law Facilitator Lease Space 3501 Civic Center Dr., San Rafael 866 866 100.0 - Level 121-B1 Juvenile Detent ion 16 Jeanette Prandi Way, San Rafael 1,000 2,300 230.0 1975 Level 1M endocino23-C1 Just ice Court 24000 S. Hwy 1, Point Arena 5,232 2,719 52.0 1950 Level 123-D1 Veteran's Bldg. 14470 Hwy. 128, Boonville 2,526 727 28.8 1950 Level 123-F1 Superior Court Drive Thru Tree Way, Leggett 1,560 1,445 92.6 1991 Level 123-G1 Just ice Center 76270 Grange St., Covelo 997 762 76.4 1973 Level 1M erced24-A2 Adobe Bldg. 627 West 24th St., M erced 8,900 3,404 38.2 1937 Level 124-A3 Civil and Small Claims 627 West 24th St., M erced 1,440 1,343 93.3 1990 Level 124-A4 Jury Assembly 627 West 24th St., M erced 2,128 1,597 75.0 1954 Level 124-A5 Department 7&8 Courtroom 627 West 24th St., M erced 2,462 2,204 89.5 1978 Level 124-A6 Department 5 Courtroom 627 West 24th St., M erced 2,100 1,234 58.8 1990 Level 124-A7 M uni Criminal Courts 627 West 24th St., M erced 2,653 2,395 90.3 1959 Level 124-B1 Family Law Facilitator 1901 G St., M erced 5,017 3,764 75.0 1970 Level 124-C1 Juvenile Hall 1480 " G" St., M erced 2,833 2,120 74.8 1983 Level 1M odoc25-A2 M odoc County Courthouse 205 South Court St., Alturas 25,533 3,876 15.2 1915 SizeM ono26-B1 M ono Superior Courthouse 452 Old M ammoth Rd., M ammoth Lakes 9,918 6,514 65.7 1993 Post 1988M ont erey27-A3 Salinas Courthouse- West Wing 240 Church St., Salinas 49,143 6,732 13.7 1950 Size27-A4 Salinas Annex 240 Church St., Salinas 3,000 2,920 97.3 1940 Level 127-B1 M arina Courthouse 3180 Del M onte Blvd., M onterey 15,347 10,157 66.2 1997 Post 198827-E1 Juvenile Courthouse 1422 Nat ividad Rd., Salinas 892 892 100.0 1960 Level 1N apa28-A1 Criminal Court Building 1111 Third St., Napa 47,296 47,296 100.0 1999 Post 198828-C1 Juvenile Hall 2300 Old Sonoma Rd., Napa - 1,240 - 1959 Level 128-D1 Family Services 1710 Soscol Ave. # 5, Napa - 1,380 - 1985 Level 128-E1 Hall of Just ice 1125 Third St., Napa 50,000 1,200 2.4 1970 Level 1N evada29-B1-ms* Superior Court in Truckee 10075 Lavone Ave, Truckee 23,068 5,607 24.3 1975 Post 1988
29-B1-A Superior Court in Truckee, Addit ion 10075 Lavone Ave, Truckee 13,068 - - 1991 Post 1988Orange30-A2 Central Just ice Annex 909 North M ain St., Santa Ana 68,029 5,530 8.1 1980 Size30-A3 Complex Civil Court Annex 751 W. Santa Ana Blvd., Santa Ana 10,000 - 0.0 1980 Size30-B2 Computer Systems Trailer 331 The City Drive South, Orange 5,950 5,726 96.2 1997 Level 130-F2 Trailer 30143 Crown Valley Pkwy, Laguna Niguel 1,456 1,356 93.1 1980 Level 130-F3 Jury Assembly Bldg. 30143 Crown Valley Pkwy, Laguna Niguel 4,628 4,522 97.7 1980 Level 130-G1 South Just ice Annex 23141 M oulton Parkway, Laguna Hills 21,373 18,399 86.1 1990 Post 1988

Summary Matrix of Exempted Buildings
Summary Matrix of Exempted Buildings 12January 2004
C ount y/B ld g ID B uild ing N ame B uild ing A ddress
B uild ing Gross A rea
C ourt A rea
% C ourt o f Gross A rea
Y ear C omplet e
R eason f o r Exempt ion
Placer31-B2 County Jail 2775 Richardson Dr, Auburn 72,000 4,173 5.8 1985 Size31-B3 Juvenile Hall 11270 'B' Ave, Auburn 32,846 6,100 18.6 1999 Post 198831-D1 Superior Court in Lincoln 434 'G' St., Lincoln 1,659 944 56.9 - Level 131-F1 Superior Court and Government Center 2501 North Lake Blvd., Tahoe City 11,367 1,904 16.8 1958 Size31-G1 Library 24580 M ain St., Foresthill 4,855 1,170 24.1 1930 Level 1Plumas32-B1 Court Facility 161 Nevada St., Portola 1,143 893 78.1 1950 Level 132-C1 Chester Civic Complex 222 First St., Chester 4,421 1,527 34.5 1986 Level 132-D1 Just ice Court 115 Hwy 89, Greenville 1,778 1,006 56.6 1906 Level 1R iverside33-A1 Family Law Court 4175 M ain St., Riverside 71,419 36,242 50.7 1997 Post 198833-A4 Execut ive Off ices 4075 M ain St. Stuite 310, Riverside 112,000 5,868 5.2 1960 Level 133-A5 Bar Associat ion 4129 M ain St., Riverside 11,600 2,441 21.0 1957 Level 133-A6 Riverside Annex 3609 11th St., Riverside 60,000 7,620 12.7 1960 Level 133-A7 Old Riverside M unicipal Court Just ice Center Area, Riverside 60,000 8,919 14.9 1958 Level 133-B1 Riverside Juvenile Court 9991 County Farm Rd., Riverside 35,356 16,308 46.1 1990 Post 198833-C1 Larson Just ice Center 46-200 Oasis St., Indio 117,755 78,374 66.6 1997 Post 198833-D1 Blythe Courthouse - Superior Court 265 N. Broadway, Blythe 12,500 7,043 56.3 1997 Post 198833-I1 M oreno Valley 13800 Heacock Blvd., M oreno Valley 24,764 12,818 51.8 1991 Post 1988Sacrament o34-A2 Erickson Bldg. 520 9th St., Sacramento 14,130 4,127 29.2 1975 Level 134-A3 Credit Union Bldg. 800 H St., Sacramento 11,084 8,453 76.3 1980 Level 134-A4 800 9th St. 800 9th St., Sacramento 20,923 15,730 75.2 1990 Post 198834-A5 Lorenzo Pat ino Hall of Just ice 651 I St., Sacramento 17,446 12,323 70.6 1990 Post 198834-B1 Records Center 3460 Business Dr., Sacramento 25,358 23,400 92.3 1990 Post 198834-D1 Carol M iller Just ice Center 301 Bicentennial Circle, Sacramento 98,628 45,915 46.6 1991 Post 198834-E1 William Ridgeway Family Relat ions Courthous3341 Power Inn Rd., Sacramento 165,000 115,339 69.9 1999 Post 198834-F1 Elk Grove Court 8978 Elk Grove Blvd., Elk Grove 2,796 2,291 81.9 1950 Level 134-G1 Walnut Grove Court 14177 M arket St., Walnut Grove 6,433 1,252 19.5 1960 Size34-H1 Galt Court 380 Civic Dr., Galt 16,364 3,241 19.8 1970 Level 1San B enit o35-B1 Juvenile Courtroom 708 Flyn Rd., Hollister 700 700 100.0 1960 Level 1San B ernard ino36-A4 Appellate & Appeals Division 401 North Arrowhead, San Bernardino 5,500 2,700 49.1 1980 Level 136-B2 Juvenile Court Trailer 900 East Gilbert St., San Bernardino 5,411 2,963 54.8 1968 Level 136-B3 Juvenile Traff ic Court 175 West Fif th St., San Bernardino 2,556 2,556 100.0 1980 Level 136-C2 Fontana Jury Assembly Room 17830 Arrow Ave., San Bernardino 796 796 100.0 1980 Level 136-F2 Juvenile Traff ic Court 9567 Arrow Highway, Rancho Cucamonga 2,000 600 30.0 1980 Level 136-H1 Twin Peaks Court 26010 State Highway, Twin Peaks 16,292 2,850 17.5 1976 Size36-I1 Big Bear Court 477 Summit Blvd., Big Bear 22,985 3,232 14.1 1977 Size36-L1-ms* Victorville Court 14455 Civic Dr., Victorville 97,938 51,386 52.5 1973 Post 1988
36-L1-B Victorville Court 14455 Civic Dr., Victorville 10,000 - - Post 198836-L1-C Victorville Court 14455 Civic Dr., Victorville 30,000 - - Post 198836-L1-D Victorville Court 14455 Civic Dr., Victorville 10,000 - - Post 198836-L1-E Victorville Court 14455 Civic Dr., Victorville 7,900 - - Post 1988
36-M 1 Court M ental Health Division 400 N. Pepper Ave., Colton 1,198 1,173 97.9 1999 Level 136-N1 Court Records Center 790 South Gif ford St., San Bernardino 12,423 12,423 100.0 1980 Level 136-N2 Court Records Center 791 South Gif ford St., San Bernardino 4,800 4,812 100.3 1980 Level 136-N3 Court Records Center 776 South Gif ford St., San Bernardino 4,812 4,812 100.0 1980 Level 1San D iego37-A2 Hall of Just ice 330 West Broadway, San Diego 400,675 117,766 29.4 1996 Post 198837-B1 M adge Bradley Bldg. 1409 Fourth Ave, San Diego 43,188 19,900 46.1 1995 Post 198837-C2 Traff ic Court KM 3 Trailer 8950 Clairemont M esa Blvd., San Diego 962 962 100.0 1980 Level 137-C3 Traff ic Court KM 4 -Trailer 8950 Clairemont M esa Blvd., San Diego 962 962 100.0 1980 Level 137-E2 Department A Trailer 2851 M eadowlark Dr., San Diego 875 875 100.0 1990 Level 137-E3 Department 9 Trailer 2851 M eadowlark Dr., San Diego 875 875 100.0 1990 Level 137-E4 Department 10 Trailer 2851 M eadowlark Dr., San Diego 875 875 100.0 1980 Level 137-F1 North County Regional Center - South 325 South M elrose, Vista 206,930 82,455 39.8 1999 Post 198837-F4 Department H Trailer 325 South M elrose, Vista 1,346 1,346 100.0 1980 Level 137-F5 Department L Trailer 325 South M elrose, Vista 1,346 1,341 99.6 1980 Level 137-F6 Department M Trailer 325 South M elrose, Vista 1,346 1,341 99.6 1980 Level 137-F7 Department N Trailer 325 South M elrose, Vista 1,346 1,341 99.6 1980 Level 137-G1 San M arcos Traff ic Court 338 Via Vera Cruz, San M arcos 27,422 9,636 35.1 1980 Level 1San F rancisco38-A1 Civic Center Courthouse 400 M cAllister St., San Francisco 228,595 130,752 57.2 1998 Post 198838-A2 Polk St. Annex 575 Polk St., San Francisco 9,812 6,298 64.2 1990 Level 138-C1 Youth Guidance Center 375 Woodside Ave., San Francisco 84,090 8,698 10.3 1950 Size
Superior Courts of CaliforniaSeismic Assessment Program

Summary Matrix of Exempted Buildings 13January 2004
Superior Courts of CaliforniaSeismic Assessment Program
C ount y/B ldg ID B uild ing N ame B uild ing A ddress
B uild ing Gross A rea
C ourt A rea
% C ourt o f Gross A rea
Y ear C omplet e
R eason f o r Exempt ion
San Joaquin39-A2 The M arket Place 302 East M ain St., Stockton 20,000 5,000 25.0 1960 Level 139-B1 Juvenile Just ice Center 535 W. M athews Rd., French Camp 116,714 7,428 6.4 1982 Size39-C2 M odular A: Off ice 315 East Center St., M anteca 1,440 1,135 78.8 1988 Level 139-C3 M odular B: Courtroom 315 East Center St., M anteca 1,440 1,359 94.4 1988 Level 139-C4 Residence: Records 205 Sherman Ave., M anteca 1,500 1,300 86.7 1975 Level 139-D1 Lodi Branch- Dept. 1 230 W. Elm St., Lodi 5,845 4,381 75.0 1968 Level 139-E2 M odular 1: Support 475 East Tenth St., Tracy 1,440 853 59.2 1986 Level 139-E3 M odular 2: Courtroom 475 East Tenth St., Tracy 1,440 1,404 97.5 1986 Level 139-E4 Agriculture Dept. 503 East Tenth St., Tracy 1,600 500 31.3 1960 Level 1San Luis Ob ispo40-B1 Veterans M emorial Bldg. 801 Grand Ave., San Luis Obispo 22,452 1,435 6.4 1965 Level 140-C1 Juvenile Services Center 1065 Kansas Ave., San Luis Obispo 16,609 850 5.1 1980 Size40-D1 Paso Robles Branch 549 Tenth St., Paso Robles 5,493 5,493 100.0 1968 Level 140-E1 Grover Beach Branch 214 S 16th St., Grover Beach 3,768 3,768 100.0 1968 Level 1San M at eo41-A3 Redwood City Warehouse 602 M iddlef ield Rd., Redwood City 5,000 5,000 100.0 1980 Level 141-B2 Central Records Storage 1133 Industrial Rd., San M ateo 5,000 5,000 100.0 1960 Level 141-C2 Northern Branch Jail Annex 1050 M ission Rd., South San Francisco 11,724 2,082 17.8 1983 SizeSant a B arbara42-C1 Santa Barbara Juvenile Court 4500 Hollister Ave., Santa Barbara 2,856 1,784 62.5 1998 Post 198842-F2 Santa M aria M uni Court 313 East Cook St., Santa M aria - - - - Level 142-G1 Santa Barbara Jury Assembly Bldg. 1108 Santa Barbara, Santa Barbara 8,520 5,610 65.8 1996 Post 198842-H1 Santa M aria Juvenile Court 812-B West Foster Rd. , Santa M aria - 1,850 - - Level 1Sant a C lara43-A3 Probat ion Bldg. 840 Guadelupe Pkwy., San Jose 72,682 8,694 12.0 1991 Size43-B3 Probate Invest igators 111 North M arket St., San Jose 4,224 1,036 24.5 1917 Level 143-B4 Superior Court Administrat ion 191 North First St., San Jose 12,527 1,950 15.6 1984 Size43-C1 Criminal Courts Annex 115 Terraine St., San Jose 41,620 32,129 77.2 1970 Level 143-E1 Family Court Facility 170 Park Center Plaza, San Jose 28,918 23,889 82.6 1972 Post 198843-H1 South County Facility 12425 M onterey Rd., San M art in 23,792 18,285 76.9 1995 Post 198843-J1 Traff ic Facility 935 Ruff Dr., San Jose 17,020 13,114 77.1 1965 Level 143-K1 Record Storage 1553 Berger Dr., San Jose 6,570 6,570 100.0 1975 Level 143-L1 Record Storage 774 North Ninth St., San Jose 19,700 19,700 100.0 1975 Level 1Sant a C ruz44-A3 M odular Bldg.s 701 Ocean St., Santa Cruz 6,756 6,372 94.3 1989 Level 144-C1 Jail Courtroom 259 Water St., Santa Cruz - 1,401 - 1990 Level 144-D1 Juvenile Court 3650 Graham Hill Rd., Santa Cruz - 3,444 - 1994 Level 1Shast a45-A2 Just ice Center 1655 West St., Redding 28,224 6,909 24.5 1985 Level 145-A3 Jury Assembly Hall 1500 Court St., Redding 2,659 2,149 80.8 1950 Level 145-A4 Court Reporter's Off ice 1388 Court St., Redding 1,145 976 85.2 1960 Level 145-A5 Family Law Off ice 1640 West St., Redding - 2,236 - - Level 145-A6 Collector's Off ice 1610 West St., Redding - 1,883 - - Level 145-C1 Juvenille Hall 2680 Radio Lane, Redding 21,755 1,607 7.4 1950 SizeSiskiyou47-C1 Weed Satellite Court 550 M ain St., Weed 6,000 2,982 49.7 - Level 147-D1 Tulelake Satellite Court Tulelake City Hall, Tulelake 2,500 459 18.4 1935 Size47-E1 Happy Camp 4th St., Happy Camp 1,500 193 12.9 1768 Size47-F1 Family Courthouse 500 M ain St., Yreka 2,300 1,984 86.3 1994 Level 1So lano48-B1-ms* Hall of Just ice 321 Tuolumne St. Vallejo 61,840 54,313 87.8 1955 Post 1988
48-B1-B Hall of Just ice, 1999 Addit ion 321 Tuolumne St. Vallejo 7,440 - - 1999 Post 1988Sonoma49-A1-ms* Hall of Just ice 600 Administrat ion Dr., Santa Rosa 180,188 67,508 37.5 1974 Level 1
49-A1-B Old Jail House 600 Administrat ion Dr., Santa Rosa 1974 Level 149-C1 Coddingtown Annex 1450 Guerneville Rd., Santa Rosa 10,880 8,816 81.0 1980 Level 149-C2 Coddingtown Annex B2 1450 Guerneville Rd., Santa Rosa 2,000 2,000 100.0 1980 Level 149-D1 LG Juvenile Court 133 Pythian Rd., Santa Rosa 6,126 1,837 30.0 1950 Level 149-E1 City Hall Annex 100 Santa Rosa Ave., Santa Rosa 1,700 1,700 100.0 1972 Level 149-F1 Police Annex 965 Sonoma Ave., Santa Rosa 1,200 900 75.0 1979 Level 1St anislaus50-E1 Department 16 948 11th St.., M odesto 4,025 960 23.9 1980 Level 150-F1 M odesto Traff ic Court 2260 Floyd Ave., M odesto 1,400 1,400 100.0 1985 Level 1Sut t er51-B1 Family Court Facility 430 Center St., Yuba City 1,440 1,000 69.4 - Level 1Tehama52-A2 Annex No. 1 633 Washington St., Red Bluff 33,857 - - - Size52-A4 Family Law 633 Washington St., Red Bluff 1,125 693 61.6 - Level 1Trinit y53-B1 Courthouse Tulecreek Rd., Hayfork 444 355 80.0 1980 Level 153-C1 Trinity Center Rt 3, Trinity Center 444 370 83.3 1960 Level 1

Summary Matrix of Exempted Buildings 14
Superior Courts of CaliforniaSeismic Assessment Program
January 2004
C ount y/B ldg ID B uild ing N ame B uild ing A ddress
B uild ing Gross A rea
C ourt A rea
% C ourt o f Gross A rea
Y ear C omplet e
R eason f o r Exempt ion
Tulare54-D1 Tulare Co. Juvenile Facility 11200 Ave. 368, Visalia 65,416 21,904 33.5 1998 Post 198854-E1 Dinuba Courthouse 640 South Aita Ave., Dinumba 20,606 5,586 27.1 2000 Post 198854-F1 Adult Pre-Trial Court 36650 Road 112, Visalia 5,000 3,115 62.3 2000 Level 1Tuo lomne55-B1-ms Washington St. Branch 60 Washington St., Sonora 5,800 4,258 73.4 1927 Post 1988
55-B1-A Washington St. Branch, 60 Washington St., Sonora 4,800 - - 1927 Post 198855-B1-B Washington St. Branch, Judge's Chamber 60 Washington St., Sonora 1,000 - - 1927 Post 1988
V ent ura56-C1 Ventura College of Law 4475 M arket St., Ventura 2,050 2,050 100.0 1986 Level 156-D1 Ralston Ave. Storage Facility 5122 Ralston Ave., Ventura 13,000 13,000 100.0 1980 Level 156-E1 Johnson Dr. Storage Facility 2630 Johnson Dr., Ventura 150 150 100.0 1980 Level 1Y o lo57-A4 I.O.O.F. Bldg. 725 Court St., Woodland 2,300 2,300 100.0 1935 Level 1Y uba58-A1-ms* Yuba County Courthouse 215 Fif th St., M arysville 142,460 29,694 20.8 1960 Post 1988
58-A1-A Yuba County Courthouse, Addit ion 215 Fif th St., M arysville 45,000 - - 1992 Post 1988
Summary Matrix of Exempted Buildings
2 Although included in the Matrix of Exempted Buildings for the purposes of this Preliminary Report, the Glenn County Historic Courthouse will undergoseismic assessment subsequently, based upon new information received.

Introduction 15January 2004
Superior Courts of CaliforniaSeismic Assessment Program
Introduction
70327. (a) Prior to thecompletion of thenegotiations concerningthe transfer ofresponsibility for courtfacilities in a building, thestate shall provide for alicensed structuralengineer to inspect andevaluate the buildingcontaining the courtfacilities for seismic safetyif the building was builtunder a building codeprior to the 1988Uniform Building Codeand the building has notbeen upgraded since 1988for seismic safety. Theinspection shall be madeusing the method andcriteria for seismic safetydeveloped by theDepartment of GeneralServices’ Real EstateServices Division.
HISTORYThe Trial Court Facilities Act of 2002 (SB 1732, Escutia) establisheda process for transferring ownership and management responsibilityfrom the counties to the state for California’s court facilities, thatcontain about ten million usable square feet of court area. Amongother requirements, the legislation stipulated that the state evaluatebuildings containing court facilities for seismic safety, in preparationfor this transfer of responsibility. The legislation requires that thestate base the seismic evaluations on the risk-acceptability methodsand criteria developed by the California Department of GeneralServices (DGS) for use on state-owned buildings. As a result, theAdministrative Office of the Courts (AOC) developed andimplemented the Superior Courts of California Seismic AssessmentProgram described in this report.
OBJECTIVE
The objective of the Seismic Assessment Program is to developreliable seismic risk level assessments in an expeditious andresponsible manner for the identified court buildings in accordancewith the requirements of the Trial Court Facilities Act of 2002.
OVERVIEW OF PROGRAM
Evaluating Engineers
In October 2002, the AOC solicited qualifications from structuralengineering firms in California to perform the seismic evaluations.The AOC selected eight firms—all highly experienced in seismicevaluation and several with staff who are prominent in thedevelopment of codes and standards for seismic evaluation andretrofit—as consulting structural engineers (CSEs) to perform theevaluations. These firms are:

Introduction 16January 2004
Superior Courts of CaliforniaSeismic Assessment Program
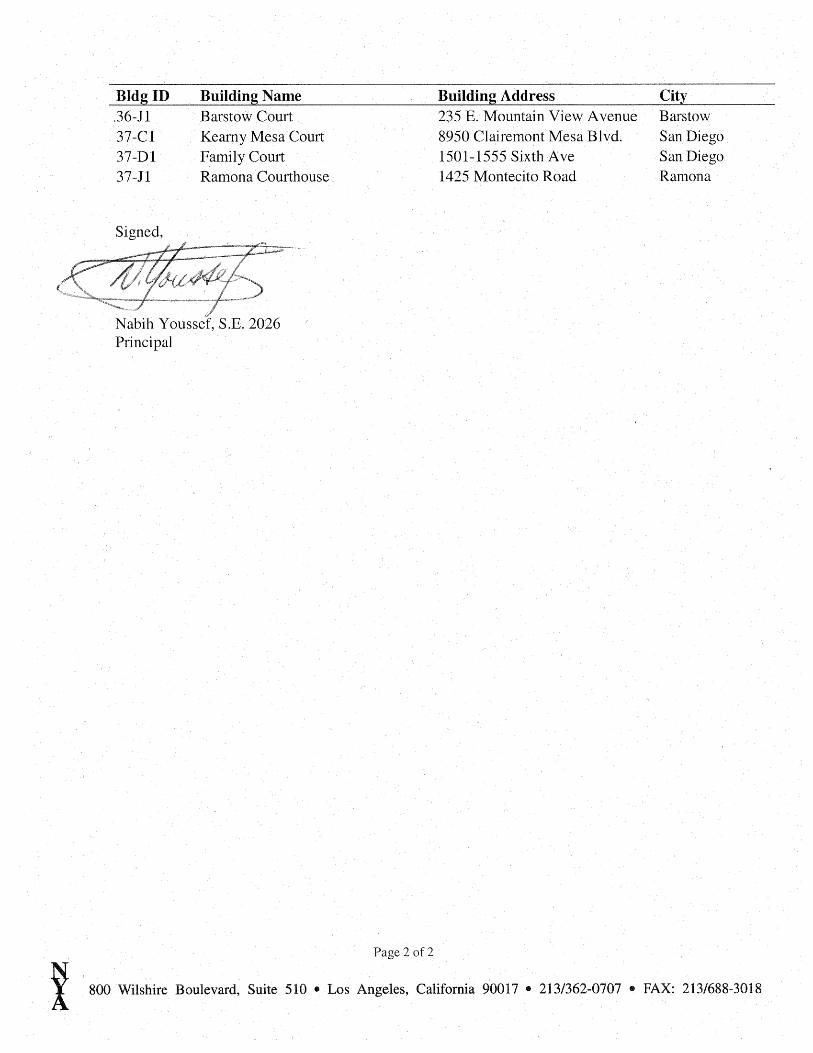
Cole, Yee, Schubert & Associates, SacramentoDegenkolb Engineers, San FranciscoEnglekirk & Sabol Consulting, Los AngelesForell/Elsesser Engineers, San FranciscoIntegrated Design Services, TustinMiddlebrook + Louie, San FranciscoNabih Youssef & Associates, Los AngelesSimpson, Gumpertz & Heger, San Francisco
In addition, the AOC selected Rutherford & Chekene Consulting Engineers ofOakland, California—another highly respected and experienced firm—as thesupervising structural engineer (SSE) for the program. The SSE has served astechnical intermediary between the AOC and the consulting structural engineers,formalized the evaluation criteria, assured consistency and quality in the evaluations,and assisted the AOC with overall program management.
Seismic Evaluation Criteria
SB 1732 called for the state to conduct seismic evaluations using the method andcriteria for seismic safety developed by the California Department of GeneralServices. The primary measurement parameter of those criteria is a set of seismicperformance descriptions, called risk levels, which were originally developed by theCalifornia Division of the State Architect (DSA) in 1994. The State has used theserisk levels extensively in evaluating its buildings, starting with the seismic evaluationand retrofit program that was mandated and financed by Proposition 122 after theLoma Prieta earthquake of 1989. In this report, these performance descriptions arereferred to as “DSA Risk Levels.”
The technical evaluation method used by the DGS to determine compliance withRisk Level IV or better (lower on the risk-level scale) is found in documentsdeveloped by the Federal Emergency Management Agency (FEMA). The method isintended to be applicable nationwide to determine if buildings meet a standardizedlife-safety level of performance. The methods and documents have evolved over theyears of the DGS program, but as the AOC assessment program began FEMA 310:Handbook for the Seismic Evaluation of Buildings—A Prestandard, was in use. InNovember 2002, the American Society of Civil Engineers (ASCE) completed itsstandardization of that document, which was then republished as ASCE 31:Standard for the Seismic Evaluation of Buildings. The DGS is converting to the useof ASCE 31 as its evaluation standard in 2004. Consistent with past DGS policy,buildings that meet the ASCE 31 standard for life safety are assigned Risk Level IVor better.

Introduction 17January 2004
Table 1, DSA Risk Level Descriptions
Superior Courts of CaliforniaSeismic Assessment Program
Very few older buildings will merit a Risk Level III rating, and none should be expected to be rated as RiskLevel I or II (refer to “Describing Seismic Performance” article for new building comparison). On the other

Introduction 18January 2004
Superior Courts of CaliforniaSeismic Assessment Program
hand, buildings that do not meet the ASCE 31 life-safetystandard will be assigned a Risk Level V, VI, or VII. RiskLevel VII buildings are in such poor condition that it isunlikely they would be occupied, and none is expected in theinventory of court buildings. Risk Level VI designatesbuilding types with an established history of poorperformance and occasional collapse in earthquakes, and feware expected in the court’s inventory. Thus, it is anticipatedthat the vast majority of existing court buildings will be ratedRisk Level IV or V. The evaluating engineer assigned theappropriate risk level based on the extent and severity of thedeficiencies identified during the evaluation process.
It should be noted that, in general, there are no state or locallaws or ordinances that require seismic retrofit of olderbuildings, regardless of the risk level rating. Exceptionsinclude local ordinances in some communities that targetparticularly hazardous buildings, such as those withunreinforced masonry walls, or that require seismic evaluationand possible retrofit in conjunction with significant alterationsto a building. The Trial Court Facilities Act requires that courtbuildings be evaluated for seismic risk and any deficient itemsbe addressed as part of the transfer process.
The Court Building Database
A courts building database was created by the AOC, from thestatewide database of the Task Force on Court Facilitiesinventory prepared in 1999 - 2001. Each building was given aunique identifier, based on the county in which it is located (anumber assigned by the alphabetical order of the counties),the site within the county (a letter assigned to each sitecontaining court buildings in each county), and a numberassigned to each building on each site. As a result of thedetailed review of drawings and field conditions during thisassessment program, the original inventory database wasrefined. Many line items in the database initially identified asstand-alone buildings actually comprise two or morestructurally separate segments, many of different ages andconstruction types. Each structural segment in these cases was

Introduction 19January 2004
Superior Courts of CaliforniaSeismic Assessment Program
Document Collection:Pursuant to SB 1732, thecounties provided allrelevant design andconstruction documentsabout the identified courtbuildings. The AOCretained seven teams ofconsulting architects andengineers that were assignedto contact the responsiblecounty agencies, to visit theagencies’ drawing libraries,and to collect and duplicateall structural andarchitectural documentsthat described the existingbuildings to be evaluated.Also collected wereconstruction documents forseismic retrofits,geotechnical reports,damage assessment reportsas well as any previousstructural or seismicevaluations for theidentified court buildings.All documents weretransmitted to the AOC,cataloged, and provided tothe SSE. During the initialscreening and the detailedevaluation phases the AOC,CSEs, and SSE continuedto search for and collectmissing structuraldocuments.
then assigned an additional sub-letter. The final database identifiersystem is as shown in the example below:
01-A1B
where 01 designates the county listed in alphabetical order (“01”is Alameda County);
A designates the site in alphabetical order within each county;
1 designates building number 1 on site A; and
B designates one of several substructures making up building number 1 (where applicable).
In this report, the term building refers to a single structure or groupof contiguous structures that functions as a single unit as defined bythe counties or the AOC. The term structure refers to a building orpart of a building that is sufficiently separated from adjacentstructures to respond independently to earthquake shaking. Eachstructure requires an independent seismic evaluation.
Although this assessment was performed on a structure-by structurebasis, functional planning has often been done on a building basis,and summary assessment results are reported for both.

Introduction 20January 2004
Superior Courts of CaliforniaSeismic Assessment Program
Describing Seismic PerformanceSeismic performance is the expected response of or damage to a structure for a given earthquakeshaking intensity. The shaking intensity can be specified probabilistically, by considering all futurepotential shaking at the site regardless of the causative fault, or deterministically, by describing theexpected shaking at the site for a given sized earthquake on a given fault. The damage level canbe described using one of several existing scales, including the DSA risk levels and theperformance levels developed by FEMA in its long-running program to mitigate seismic risks inexisting buildings.
Describing Shaking IntensityThe building code for new buildings has for some time described the earthquake shaking to beused in design probabilistically as that shaking at a given site with a 10 percent chance of beingexceeded in a 50-year time period—50 years being judged as the average life of a building and 10percent exceedance being judged as acceptable risk. As with storms or floods, this level ofseismic hazard can also be expressed as the shaking with a return period of 475 years. (For ease,the return period is often rounded to 500 years, and since actual earthquake events are moreunderstandable than probabilistic shaking, the slightly inaccurate term the 500-year event has comeinto common use.) Implicit in this approach is the fact that shaking levels specified in areas oflow seismicity are lower than those specified for areas of high seismicity near active faults.Nationally applicable building codes are based on the level of shaking intensity expected at anysite once every 500 years (on average). But engineers in several areas of the country (mostnotably Salt Lake City, Utah; Charleston, South Carolina; and Memphis, Tennessee) felt that thisstandard failed to provide sufficient safety in their regions, where exceptionally large earthquakescould—very rarely—occur, producing shaking intensities several times that of the 500-yearevent. Should such a rare earthquake occur, the building code design would not provide the sameprotection provided in areas of high seismicity, particularly California. That is because rare,exceptionally large earthquakes in California are estimated to be only about one and one-halftimes larger than a 500-year event. The technical committee responsible for the national codedecided to base the national parameters on a much longer return period—one that wouldencompass the rare events in the regions at issue. A level of shaking with a 2,500-year returnperiod was chosen and became known as the maximum considered event, or MCE. The codecommittee also judged it unnecessary and undesirable to significantly change seismic designpractices in California, so the MCE was multiplied by two-thirds to keep California designshaking levels as they had been. (Multiply the MCE—about one and one-half times that ofCalifornia’s 500-year event—by two-thirds, and the final design parameter remains unchanged.)However, in a region of low seismicity, where the MCE is three times the previously used 500-year event, the new parameter of two-thirds of the MCE results in a shaking level that is twicethe previous standard, which provides the sought-after additional level of safety. Thus, nationalstandards such as ASCE 31 now define the level of shaking for evaluation of existing buildingsas two-thirds of the MCE, or about the same as that of a 500-year event for much of California.

Introduction 21January 2004
Describing Damage LevelsAlthough several descriptions of damage performance levels are currently in use in California (e.g.,for the University of California and for California hospitals), those originally developed by FEMAand set forth in ASCE 31 and the DSA risk-level scale are of most interest for this assessment.Descriptions of FEMA performance levels summarized from FEMA 273: NEHRP Guidelines for theSeismic Rehabilitation of Buildings (FEMA, 1996) are given below:
Operational: Buildings meeting this performance level are expected to sustain minimal or nodamage to their structural and nonstructural components. The building will be suitable for itsnormal occupancy and use, although possibly in a slightly impaired mode, with power, water, andother required utilities provided from emergency sources. The risk to life safety is extremely low.
Immediate Occupancy: Buildings meeting this performance level are expected to sustain minimalor no damage to their structural elements and only minor damage to their nonstructuralcomponents. Although immediate re-occupancy of the building will be possible, it may be necessaryto perform some cleanup and repair and await the restoration of utility service to function in anormal mode. The risk to life safety is very low.
Life Safety: Buildings meeting this performance level may sustain extensive damage to structuraland nonstructural components. Structural repair may be required before reoccupancy, and thecombination of structural and nonstructural repairs may be deemed economically impractical. Therisk to life safety is low.
Collapse Prevention: Buildings meeting this performance level will not suffer complete or partialcollapse nor drop massive portions of their structure or cladding onto the adjacent property.Internal damage may be severe, including local structural and nonstructural damage that poses riskto life safety. However, because the building itself does not collapse, gross loss of life is avoided.Many buildings in this damage state will be a complete economic loss.
ASCE 31, the evaluation document used in this assessment program, is primarily intended todetermine if buildings will meet the life-safety level for the design earthquake motion (two-thirds ofMCE), but the document also contains guidelines for evaluating to the Immediate Occupancy level.Although there is no official translation between the FEMA system and the DSA risk levels, theDGS has a well-established practice of using FEMA methods to evaluate compliance with life safetyas a test for meeting Risk Level IV. The equality of Risk Level IV and FEMA Life Safety wasoriginally suggested in Provisional Commentary for Seismic Retrofit published by the California SeismicSafety Commission (Rutherford & Chekene, 1994).
Current building codes for new buildings incorporate damage-control measures that are not directlyrelated to life safety. As a result, it is generally accepted that the expected performance of newbuildings is better than FEMA Life Safety but falls far short of FEMA Immediate Occupancy and,in DGS terms, is between DSA Risk Levels III and IV, closer to III than IV.
Superior Courts of CaliforniaSeismic Assessment Program

Introduction 22January 2004
Superior Courts of CaliforniaSeismic Assessment Program
Evaluation Process
Seismic assessment programs of large inventories are normally done in phaseswhich involve ever-increasing levels of evaluation intensity, during which buildingsthat obviously meet or fail to meet preset criteria are immediately screened out. Forexample, an unretrofitted unreinforced masonry building in a zone of highseismicity would most often be judged as failing to meet life safety standardswithout the need for detailed analysis; conversely, a one story wood frame buildingbuilt after 1975, especially in a zone of low seismicity, would most often be judgedas meeting life safety standards without the need for detailed analysis.
Similarly, this evaluation process consisted of several initial steps designed toconfirm and improve the building inventory data and screen out buildings that didnot require detailed engineering evaluations. The AOC first reviewed the availableinventory of court buildings and eliminated buildings that were exempt pursuant toSB 1732 (see Summary Matrix of Exempted Buildings). The most experiencedrepresentatives of the CSE firms then reviewed the construction drawings for theremaining buildings and categorized those few, generally smaller buildings, whichreliably could be assigned a risk level without a detailed evaluation, removing themfrom further analysis. At that point, the formal evaluation process prescribed byASCE 31 began. The process consisted of two phases, called Tiers. Consultingstructural engineers first performed the relatively brief Tier 1 Evaluation—intendedto identify quickly those buildings that obviously met or did not meet the evaluationstandards—and assigned risk level ratings for those buildings that could be readilyand reliably categorized. The largest, most complex buildings (including those forwhich the risk levels were borderline or not obvious) were advanced to the ASCE31 Tier 2 Evaluation, which requires a more extensive analysis of the building forlateral forces.
ASCE 31 also allows use of analysis methods even more advanced and morecomplete than the Tier 2 prescriptive procedures to set performance ratings. Thesemethods are termed the Tier 3 Evaluation. In general, this analysis consists ofchecking the acceptability of the entire structure and its components against therequirements of existing retrofit standards or local ordinances that result inapproved performance, or with the requirements for new buildings. Tier 3Evaluations are seldom, if ever, included in the assessment of large inventories, and,consistent with the State of California DGS procedures, are not utilized in thisprogram to establish the preliminary findings contained herein as a matter of policy.Further, in accordance with ASCE 31, material properties were obtained from thedrawings, or standard default values were used. As the results of Tier 1 and Tier 2procedures are not highly sensitive to material strengths, field material testing

Introduction 23January 2004
Superior Courts of CaliforniaSeismic Assessment Program
programs are usually not associated with these evaluation procedures, and they werenot utilized to establish the preliminary findings contained herein.
The supervising structural engineer reviewed all phases of the process and allevaluation decisions for reasonableness and consistency. The sections of the reportthat follow describe the phases of the process more fully, and the process is definedin complete detail in ASCE 31, itself supplemented by the Instruction Manual forConsulting Structural Engineers, prepared for this assessment program by the SSEand included in each County Report.
Before the CSEs began the evaluation process, the SSE presented the instructionmanual to the participating engineers during a half-day seminar. The manualexplained the AOC’s working inventory, defined the various steps and reviews, andclarified the evaluation procedure and criteria. All of the CSEs were familiar withthe FEMA 310/ASCE 31 evaluation methods, and most had previously performedevaluations for the DGS. However, to ensure consistency with the previous use ofFEMA 310 by the DGS and to improve consistency within the project, severalclarifications to ASCE 31 were made and are documented in the Instruction Manualfor Consulting Structural Engineers. These clarifications, as well as the entireinstruction manual, were reviewed and approved by the DGS Seismic and SpecialProjects Unit. The clarifications were in two general areas:
ASCE 31 includes as mandatory certain processes and procedures that werepreviously not enforced by the DGS and are unnecessary for the purposesof this program, considering the high level of professional seismicassessment experience of the evaluating team. The rules governing theseprocedures were clarified.
ASCE 31 (and FEMA 310 before it) includes an evaluation of nonstructuralbuilding components to establish compliance with a life-safety level ofperformance. This category includes such components as mechanical andelectrical equipment, piping and ductwork, ceilings, light fixtures, partitions,and exterior cladding. The DGS had not previously required a rigorousevaluation of this kind for state buildings, nor does the general standard ofpractice in California for seismic evaluation of other buildings. However,California structural engineers are aware of certain severe falling hazardsthat can be present in buildings and generally identify them whenperforming a structural seismic evaluation. A similar procedure wasformalized in the project instruction manual by modifying ASCE 31 toinclude only nonstructural components proven in past earthquakes to be ahigh risk to occupants or passersby, such as large plaster ceilings or heavyexterior cladding.

In addition to establishing the evaluation process and criteria, the SSE acted as acentral point of communication among the CSEs to update criteria and distributevaluable insights that resulted from the evaluation of any one building. The SSEalso performed detailed peer review of each evaluation and risk level assignment atevery step and resolved inconsistencies in approach and judgment.
Reliability of Seismic Evaluations
It is generally acknowledged that structural engineers do not yet have the technicalability to predict the exact damage pattern in a building for a given ground motion.It is known that there will be a wide variation of damage to the building stock in anearthquake, partly due to the variation in ground motion and partly due to thevarying response of buildings, even to similar buildings. In addition, engineerscannot know the exact signature of the earthquake that may test a given building inthe future. Design and evaluation of buildings are performed using only the mostgeneral parameters of expected future ground motions gleaned from past records.Seismic engineers and code writers have therefore been generally conservative,adopting practices that attempt to ensure that most or all buildings will at least meetthe minimum performance target. This effort is partly based on predictive scienceand partly on observations of damage after earthquakes. Almost every damagingearthquake results in the tuning of technical provisions of design and evaluation tobetter meet the performance targets without being overly conservative. Ongoingresearch will improve predictive methods and facilitate performance-basedengineering. It has been estimated that, given design ground motions, one to twopercent of new buildings may fail to meet their expected performance (ATC 3-06,1978). Due to unknown variations in older existing buildings, the failure rate inevaluation and retrofit is expected to be slightly greater.
The level of engineering effort is another factor that could affect conclusions ofseismic evaluation. More effort in confirming in-situ material properties, moreeffort in making more complex (and presumably more accurate) computer models,and more direct consideration of the behavioral changes of structures as they aredamaged (nonlinear behavior) are expected to provide improved results. Themultistage assessment process used for this study acknowledges this principle bypassing buildings with non-obvious risk levels from initial screening to ASCE 31Tier 1 and finally to ASCE 31 Tier 2. As mentioned previously, ASCE 31 alsoincludes a Tier 3, but this high level of analysis and evaluation is seldom performedin multiple building assessments because of the significant cost and time requiredfor such, and is not performed in this program, consistent with state practices. In afew circumstances, it is possible that a Tier 3 Evaluation could change the risk level
Introduction 24January 2004
Superior Courts of CaliforniaSeismic Assessment Program

Introduction 25
assignment. In those cases in which the evaluating engineers felt that a Tier 3Evaluation (or any other more detailed evaluation technique) could change a risklevel rating, particularly from Risk Level V to IV, a note has been placed in theindividual building reports suggesting further analysis. 1
Finally, there were insufficient data in some cases to form a highly reliableengineering judgment about certain seismic deficiencies or to assign a reliable risklevel rating. The level of effort required to obtain adequate information to performa complete Tier 1 or Tier 2 evaluation by first performing field measurement anddestructive investigation is extensive and normally considered unrealistic. Themissing information invariably will affect the assignment of a deficiency in theASCE methodology; however, and these buildings would thus almost always beassigned a Risk Level V. The lack of adequate drawings is noted in individualbuilding reports, which also include a statement of engineering judgment as towhether complete drawings could change the risk level assignment. Also, in certainbuildings there was insufficient information to determine the extent of seismicdeficiency from potential liquefaction at the site, and from potential falling hazardsfrom plaster ceilings and exterior precast concrete cladding. This lack ofinformation and its potential significance is similarly noted in the reports. 1
January 2004
Superior Courts of CaliforniaSeismic Assessment Program
1 A “pending” classification which encompasses these structures has been added to this Summary Report ofPreliminary Findings; see Conclusions section.


January 2004
Initial Screening Phase
BACKGROUND
As required by AB 233, the Lockyer-Isenberg Trial Court Funding Act of 1997, theTask Force on Court Facilities developed an inventory of existing trial courtfacilities in order to document their condition and the need to construct new ormodified facilities. This inventory consisted of some 452 buildings and includedbuildings that were owned or leased by counties for court use, as well as buildingsthat, for a variety of reasons, had little or no public court function. Beforebeginning the seismic study required by SB 1732, the AOC used the followingadministrative criteria to screen out buildings, reducing the inventory to a databaseof 225 buildings. Buildings were eliminated for the following reasons:
They were built in accordance with the 1988 UBC (or later code) orupgraded since 1988;
They contain court-occupied space that comprises less than 10,000 sf andless than 20% of the total building area; or
They are leased, abandoned, modular, or storage facilities.
The Initial Screening Phase, which culminated in a four-day screening workshopattended by principals of the CSE firms, was designed to judge the adequacy of theconstruction drawings collected by the AOC, to identify buildings that may consistof more than one structure, and to screen out any building that could reliably beassigned a risk level rating without further investigation. Any buildings eliminatedduring the initial screening either clearly met ASCE 31 Life Safety standards orclearly did not meet ASCE 31 Life Safety standards. The participating CSEsreviewed buildings at the screening workshop and placed each into one of threecategories described below.
Category A (DSA IV or better, IV-)
These buildings were eliminated and did not undergo a detailed evaluation.Candidates for this category were buildings that had been designed to editions ofthe Uniform Building Code that qualify them as “benchmark” per ASCE 31. A
Initial Screening Phase 26
Superior Courts of CaliforniaSeismic Assessment Program

Initial Screening Phase 27January 2004
Superior Courts of CaliforniaSeismic Assessment Program
Table 2, Benchmark Buildings

Initial Screening Phase 28
benchmark building is one designed to a specific code, published on or after aspecific year, which generally has been shown in past earthquakes to satisfy life-safety performance goals (see table 2). In addition, per ASCE 31:
Representatives from two CSE firms and the SSE agreed that the buildinghad no obvious characteristic that would override the structural benchmarkstatus;
The building had no apparent conditions that presented a potential forviolating the hazards-reduced nonstructural performance level (see theNonstructural Performance Checklists discussion, in the Tier 1 DetailedEvaluation Phase section, for description); and
Engineers familiar with the local conditions reviewed the geologicalhazards—which are checked for every site by a global information system(GIS) to identify the potential for fault rupture, liquefaction, or landslide—and judged them to be applicable. Deterioration of foundations orsettlement issues was also checked by communication with site personnel.
Category B (To Be Evaluated, TBE)
These buildings underwent a Tier 1 detailed evaluation.
Category C (DSA V or worse, V+)
These buildings were eliminated and did not undergo a detailed evaluation.Candidates for this category initially were identified by assignment to historicallymore vulnerable ASCE 31 common building types, such as unreinforced masonrybearing wall and non-ductile concrete frame. Subsequently, the following activitiesconfirmed the appropriateness of this assignment:
Representatives from two CSE firms and the SSE agreed that the buildingcould not meet the intent of the ASCE 31 structural evaluation criteria. Thespecific reason for noncompliance was documented. Note that the apparentfailure to meet the nonstructural or geological hazards evaluation standardwas not sufficient for a building to be assigned to this category; unless theselatter conditions were somehow confirmed to result in the building’sinability to meet life-safety standards, buildings with apparent nonstructuralor geologic hazards were put into Category B.
January 2004
Superior Courts of CaliforniaSeismic Assessment Program
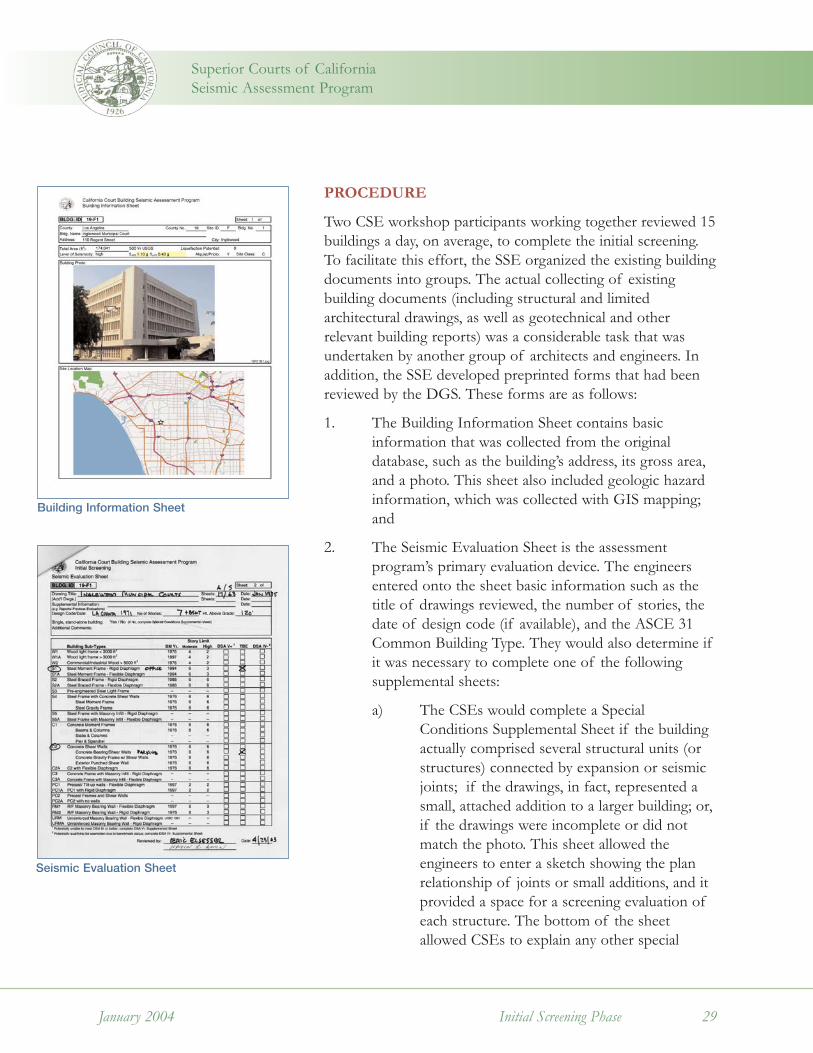
Initial Screening Phase 29
PROCEDURE
Two CSE workshop participants working together reviewed 15buildings a day, on average, to complete the initial screening.To facilitate this effort, the SSE organized the existing buildingdocuments into groups. The actual collecting of existingbuilding documents (including structural and limitedarchitectural drawings, as well as geotechnical and otherrelevant building reports) was a considerable task that wasundertaken by another group of architects and engineers. Inaddition, the SSE developed preprinted forms that had beenreviewed by the DGS. These forms are as follows:
1. The Building Information Sheet contains basicinformation that was collected from the originaldatabase, such as the building’s address, its gross area,and a photo. This sheet also included geologic hazardinformation, which was collected with GIS mapping;and
2. The Seismic Evaluation Sheet is the assessmentprogram’s primary evaluation device. The engineersentered onto the sheet basic information such as thetitle of drawings reviewed, the number of stories, thedate of design code (if available), and the ASCE 31Common Building Type. They would also determine ifit was necessary to complete one of the followingsupplemental sheets:
a) The CSEs would complete a SpecialConditions Supplemental Sheet if the buildingactually comprised several structural units (orstructures) connected by expansion or seismicjoints; if the drawings, in fact, represented asmall, attached addition to a larger building; or,if the drawings were incomplete or did notmatch the photo. This sheet allowed theengineers to enter a sketch showing the planrelationship of joints or small additions, and itprovided a space for a screening evaluation ofeach structure. The bottom of the sheetallowed CSEs to explain any other special
January 2004
Superior Courts of CaliforniaSeismic Assessment Program
Seismic Evaluation Sheet
Building Information Sheet

Initial Screening Phase 30
conditions that may have affected thescreening evaluation;
b) The CSEs would complete a DSA IV-Supplemental Sheet if the building’s designcode appeared on the drawings and indicatedthe building to be post benchmark andtherefore potentially qualified for DSA IV-rating. This sheet is intended to meet thespirit of the requirements of ASCE 31 toexempt a building from seismic evaluationonly after thorough consideration. Hence,even if the design qualifies as a benchmark,ASCE 31 suggests that the building may stillbe incorrectly formulated, and that thepotential for gross errors must beinvestigated. The form provided engineers theopportunity to document that there were noapparent features that would negate thebenchmark status. Secondly, the CSEs reviewed the building for conditions that could havepresented a major nonstructural hazard and entered the results on the form. Lastly, theynoted geologic hazards that may have needed further investigation to allow properevaluation of the building; if such a condition existed and there was no evidence ofmitigation in the design, they placed the building in the TBE category. If all of the aboveconditions were met, the evaluators indicated Recommend exempting from evaluationpending site call (see below). If one or more of the above conditions was not met,evaluators checked the TBE box on the Seismic Evaluation Sheet; or
c) The CSEs would complete a DSA V+ Supplemental Sheet if the building was a URM (un-reinforced masonry) bearing wall or a nonductile concrete frame without walls, or if it hadother features that would clearly prevent it from meeting the structural life-safety standardsof ASCE 31, and therefore potentially qualified for a rating of DSA V+. This is a free-form sheet to allow the evaluator to document conditions that would prevent the buildingfrom being found compliant, should a detailed evaluation ever be performed.
For each building, the CSEs checked the evaluation category box on the Seismic Evaluation Sheetopposite the appropriate ASCE 31 Common Building Type. If the building was clearly not a DSA IV- or aDSA V+, the reviewers checked the TBE box and entered their names in the bottom of the form. Thiscompleted the screening evaluation. If a DSA IV- or DSA V+ box was checked, but the building failed toqualify for these categories after the completion of supplemental forms, the TBE box was also checked.The reviewers’ names were then entered on the bottom of the form, and the screening evaluation wascomplete.
January 2004
Special Conditions Supplemental Sheet
Superior Courts of CaliforniaSeismic Assessment Program

Initial Screening Phase 31
It should be noted that ASCE 31 also calls for the investigation of foundationdeterioration or obvious settlement problems prior to exempting a building fromevaluation. The implication here is that in any inventory of buildings, no buildingcan be excused from a review and, probably, a site visit—even those designed andconstructed in the last few years. The SSE recommended the exercise ofjudgment in this area; however, and the issue for the modern buildings in thisprogram was addressed through a site call, or phone discussion, with sitepersonnel.
INTERIM FINDINGS
Two significant findings, not directly related to the assignment of risk-levelratings, resulted from the engineers’ screening review of drawings provided by theAOC. First, there were several buildings listed in the database for evaluation forwhich the structural drawings were missing or inadequate. This resulted in arenewed, targeted effort to retrieve the necessary drawings from the counties. Inaddition, the SSE prepared special instructions (and added them to theInstruction Manual for Consulting Structural Engineers) for conducting Tier 1Evaluations of buildings without drawings. Second, it was found that many of thebuildings listed in the database actually comprised two or more independentstructures, created by expansion or seismic joints. In some cases the separatesegments were built at the same time and separated for structural reasons. Inother cases segments were added at a later date, but kept structurally separatefrom the original building.
Of the 225 buildings screened, 19 were judged as obviously meeting theevaluation standards (Risk Level IV or better). Most of these were smaller,recently built buildings. Another 14 were judged as obviously not meeting theevaluation standards (Risk Level V or worse). Most of these were masonrystructures with inadequate roof-to-wall ties. Thus, 33 buildings did not requiredetailed evaluation.
January 2004
Superior Courts of CaliforniaSeismic Assessment Program

Tier 1 Detailed Evaluation Phase 32January 2004
Tier 1 Detailed Evaluation Phase
BACKGROUND
The Tier 1 Detailed Evaluation Phase began with a total of 192 buildings(representing 264 structures) being recommended for evaluation. In addition it waslearned during the initial screening phase that several of these buildings hadincomplete or missing structural drawings; hence, some special procedures for thesebuildings would be required.
To conduct the evaluations, the AOC had selected only engineers with exceptionalexperience in seismic evaluation. Further, the supervising structural engineer haddeveloped a process of overview and comparative analysis to ensure theconsistency of evaluations. For these reasons, the SSE concluded that the CourtBuilding Seismic Assessment Program could use a modified version of ASCE 31.After discussion and concurrence with the DGS, the SSE adopted the formalASCE 31 evaluation methodology for the courts buildings, with the final step ofsetting the DSA risk level (particularly the critical difference between Risk Level IVand V) by judgment, based on the extent and seriousness of deficiencies assessedby the formal evaluation. This final step was included in FEMA 178, the sourcedocument for ASCE 31, but is not explicitly stated in ASCE 31, perhaps due to theneed to use definitive standards language. For the purposes of this program thelanguage of FEMA 178 was reinstituted as follows:
1.3.3.3 TThe FFinal EEvaluationAt the conclusion of the analysis and the examination of special concerns, theengineer should assemble the results and compile a list of deficiencies. The evaluationwill be enhanced by further investigation of the elements that do not meet the basicacceptance criteria. The earthquake portion of the demand (denoted by DE) iscompared to the capacity that is available to resist the earthquake forces (denoted byCE). The elements with the highest DE/CE ratios are the ones of most concern andtheir importance must be assessed in terms of how high the DE/CE ratios are andthe consequences of the failure of these elements.
Superior Courts of CaliforniaSeismic Assessment Program

Tier 1 Detailed Evaluation Phase 33
The assessment also should include qualitative answers to the other concerns. Themost difficult task in the evaluation is to make a reasonable judgment concerningthe building so that the building is not incorrectly identified as a life-safety hazard.
The incorporation of this direction in the final evaluation protocol is consistentwith the procedure used to establish seismic risk levels for typical state-ownedbuildings.
The Tier 1 Detailed Evaluation Phase yielded the following:
The assignment of a DSA Risk Level;
Recommendations concerning the conducting of a more detailed Tier 2Evaluation;
A qualitative description of conceptual retrofit actions needed to improveto Risk Level IV those buildings with ratings of Risk Level V or worse; and
In the case of buildings with no drawings, recommendations for additionalfield exploration accompanied by an outline of what specific information, ifobtained, might allow assignment of an improved DSA Risk Level rating.
PROCEDURE
Consulting structural engineers followed ASCE 31 procedures in Tier 1Evaluations, including site visits which were arranged with, and often accompaniedby, county representatives, except as noted below:
1. The CSEs used ASCE 31 table 3-2 (Checklists Required for a Tier 1Evaluation) to determine the appropriate checklists for each evaluation, withthe following modifications and refinements:
a) The setting of the Nonstructural Performance Level as “HazardsReduced” required the use of a single, special nonstructural checklistfor all sites, as described in the Instruction Manual for ConsultingStructural Engineers, included in the county reports (see NonstructuralPerformance Checklist discussion below); and
b) The SSE developed additional commentary in the Instruction Manualfor Consulting Structural Engineers to define the level of effort expectedto complete the Geologic Site Hazards and Foundations Checklistfor the Tier 1 Evaluation.
2. The final step of the Tier 1 Evaluation was the assignment of a DSA RiskLevel rating. After weighing the building-specific data against deficiencies
January 2004
Superior Courts of CaliforniaSeismic Assessment Program

Tier 1 Detailed Evaluation Phase 34
identified by the ASCE 31 checklists, the evaluatorsexercised professional judgment to make the keydifferentiation between DSA IV (meeting ASCE 31Structural Life Safety) and DSA V (not meeting ASCE31 Structural Life Safety) using a procedure that wasdeveloped for this program and described in theInstruction Manual for Consulting StructuralEngineers.
3. Evaluators departed from strictly following ASCE 31table 3-3 (Further Evaluation Requirements) asdescribed below:
a) When recommended by the CSE andapproved by the SSE, evaluators sometimesreached their conclusions and assigned a DSARisk Level rating after a Tier 1 Evaluation onbuildings requiring a Tier 2 Evaluationaccording to ASCE 31.
4. Evaluators used special procedures developed by theSSE to evaluate buildings for which no structuraldrawings were available. Destructive exploration ortesting and/or development of as-built drawings werenot authorized.
a) Tier 1 Evaluation procedures for buildingswith no available structural drawings weresimilar to the typical procedure. They includedmaking a site visit, interviewing county stafffamiliar with the building, filling out checkliststo identify deficiencies, and making ajudgment to assign a Tier 1 DSA Risk Level.Not surprisingly, the answer to many checklistquestions was “Unknown.” The summary listof deficiencies began with a list of knowndeficiencies and followed with a list ofchecklist questions answered “Unknown.”
January 2004
Superior Courts of CaliforniaSeismic Assessment Program

Sample Tier 1 Evaluation Checklists for Nonstructural Components
Tier 1 Detailed Evaluation Phase 35
Nonstructural Performance Checklists
For this assessment program, the SSE adopted a nonstructural performance level similar tothat previously used in the DGS-administered State Building Seismic Program, whichidentifies only major nonstructural risks. This level has been commonly used over the past 30years in California for seismic evaluations and is similar to the “Hazards Reduced” level ofFEMA 273 and FEMA 356. Although largely judgmental in nature, engineers performingstructural seismic evaluations normally identify nonstructural components that haveexperienced vulnerability and potentially high consequence of failure, such as unreinforcedparapets, heavy cladding, and ceilings over large public assembly areas. To that end, the SSEdeveloped a subset of the ASCE 31 nonstructural checklists to focus the evaluator onpotential high-level nonstructural risks, but not to constrain the evaluator from identifyingother similar risks or to require strict conformance to the ASCE 31 requirements foracceptance of each item. As with the structural checklists, evaluators were required to make afinal judgment as to the significance of each deficiency identified by the nonstructuralchecklist by considering its contribution to the recommended DSA Risk Level.
January 2004
Superior Courts of CaliforniaSeismic Assessment Program

Tier 1 Detailed Evaluation Phase 36
INTERIM FINDINGS
The site visits that were part of a Tier 1 Evaluation enabled the engineers to expandgreatly the level of detail in the inventory database. During these site visits, CSEsoccasionally found additional drawings that were useful for the seismic evaluations.In some cases, the additional drawings not only enabled a full evaluation, but alsoindicated that buildings that were apparently single constructs actually comprisedtwo or more independent structures. This still left, however, 60 buildings withinadequate structural drawings.
In addition to evaluating the ability of the structural system to resist seismic loads,the assessment program also investigated major potential falling hazards fromnonstructural components, such as large plaster ceilings and heavy exterior cladding,and potential geologic hazards, such as liquefaction. The program identified asignificant number of buildings as possibly presenting one or more of these other -“nonstructural” risks.
Courtrooms commonly feature highly decorative ceilings, many of whichare plaster. Strong shaking from earthquakes has often caused the dislodgingof large pieces of plaster in such ceilings, particularly in older buildings.Structural drawings often do not detail the support of these ceilings, andpertinent information is difficult to access in the field, so the level of riskpresented can only be estimated. The assessment program identified 53structures with unacceptable or unknown support of major plaster ceilings.Individual reports note if this potential deficiency is a significant factor inthe assignment of the risk level. In these cases, the availability of specificsuspension details of the ceilings could affect the results. 1
Exterior precast concrete cladding panels also present a potential fallinghazard. Often these panels and their attachments are designed by thecontractor and documented in shop drawings—which frequently are notkept as permanent records—rather than in structural drawings. Further, it isgenerally impossible to inspect the connection details without the localdestruction of finishes. Particularly on flexible buildings such as older steelmoment-frame buildings, the connections of precast panels may not beadequate to accept the differential floor movement expected in a strongearthquake shaking. The failure of some connections could allow the panelto fall. The program identified 38 structures with unacceptable or unknownconnection details for precast concrete cladding. Individual reports note ifthis potential deficiency is a significant factor in the assignment of the risklevel. In these cases, the availability of specific connection details couldaffect the results. 1
January 2004
Superior Courts of CaliforniaSeismic Assessment Program

Tier 1 Detailed Evaluation Phase 37
Liquefaction is a sudden loss of soil strength in certain sandy, saturated soils.It can occur in thin layers of soil, causing only minor settling, or in layersthick enough under a building to cause significant subsidence or horizontalmovements leading to structural failures. The building’s foundation type alsohas an impact on how much structural damage liquefaction may cause.Extensive knowledge of site soil conditions is needed to confirm liquefactionpotential and estimate its extent. Field testing or other collection of suchdetailed site data was not included in this assessment program. The programidentified 57 structures as being potentially subjected to liquefaction.Individual reports note if liquefaction is a significant factor in the assignmentof the risk level. In these cases, the availability of more extensive site-specificsoil data could affect the results. 1
Of the 264 structures that underwent a Tier 1 evaluation, the program assigned RiskLevel IV to 38 structures, Risk Level V to 115 structures and Risk Level VI to 3structures. The remaining 108 structures proceeded to Tier 2 Evaluations.
Superior Courts of CaliforniaSeismic Assessment Program
January 2004
1 A “pending” classification which encompasses these structures has been added to this Summary Report ofPreliminary Findings; see Conclusions section.

Tier 1 Detailed Evaluation Phase 38January 2004
ASCE 31, a national standard for seismic evaluation of buildings developed by the American Society of Civil Engineers,is the result of a long evolution of evaluation documents. The first, ATC 14, Evaluating the Seismic Resistance of ExistingBuildings, published in 1987 by the Applied Technology Council, was cross referenced to the Uniform Building Code(used for new buildings) and was intended primarily for the western zones of high seismicity. The Federal EmergencyManagement Agency, needing an evaluation method to form a part of their national program to reduce the seismic riskin existing buildings, sponsored the conversion of ATC 14 to FEMA 178, NEHRP Handbook for the Seismic Evaluation ofExisting Buildings, (1992), more nationally applicable and cross referenced to the NEHRP Provisions for new buildings.As part of the standardization process, ASCE requires documents to be presented in prescribed formats and languageand in 1998, FEMA 310, Handbook for the Seismic Evaluation of Buildings—A Prestandard was published for this purpose,based on FEMA 178. Finally, in late 2002, FEMA 310 was approved and converted into ASCE 31.
The State of California, in its program to evaluate State-owned buildings following the Loma Prieta earthquake in 1989(a program funded by Proposition 122 in 1990), began using FEMA 178 and converted to FEMA 310 when it waspublished. ASCE 31 only became available shortly before the start of the court assessment program, and wassubstituted for FEMA 310 with the approval of the Department of General Services.
The basic premise and format of each of these documents is the same, using field observations after earthquakes toidentify conditions in various building types that have led to significant damage. The identified characteristics areorganized as lists of statements in the document that the evaluating engineer must systematically investigate byobservation in the field or by reviewing the construction drawings. The applicable lists of potential deficiencies aredependent on the building type, a predefined family of model buildings identified in general by the structural gravity andlateral force resisting system. If a condition that represents a potential seismic deficiency is identified, it is immediatelynoted, or in some cases requires confirmation by calculation. ATC 14 and FEMA 178 were based on determination ofan acceptable level of Life Safety for a building. A higher level of performance, Immediate Occupancy, can also beevaluated using FEMA 310 and ASCE 31. These performance levels are determined for the same design earthquakeshaking used for the design of new buildings.
In ASCE 31, there are three levels of evaluation, called Tiers. Tier 1, the simplest and most expedient, consists of a sitevisit, review of available drawings, and a first-pass review of the deficiency statement list for the particular building type.In some cases, the compliance or non-compliance with the Life Safety standard can be determined at the end of Tier 1.If not, a Tier 2 Evaluation, characterized primarily by more extensive mathematical modeling and analysis of thestructure, is performed. The basic, and most often used, evaluation process is completed with Tier 2. However, a Tier 3Evaluation, requiring extensive computer modeling and state of the art nonlinear analysis, is also defined.
The model building types used to organize and direct evaluations are sometimes called the FEMA Model Building Types,because they are featured in a dozen or more FEMA documents on existing buildings. These building types are alsoprominent in this seismic assessment program. The description of these Common Building Types that is contained inASCE 31 is reproduced on the following pages.
ASCE 31, A Standard for Seismic Evaluation of Existing Buildings
Superior Courts of CaliforniaSeismic Assessment Program

Tier 1 Detailed Evaluation Phase 39January 2004
Superior Courts of CaliforniaSeismic Assessment Program
ASCE 31 Common Building Types

Tier 1 Detailed Evaluation Phase 40January 2004
Superior Courts of CaliforniaSeismic Assessment Program
ASCE 31 Common Building Types

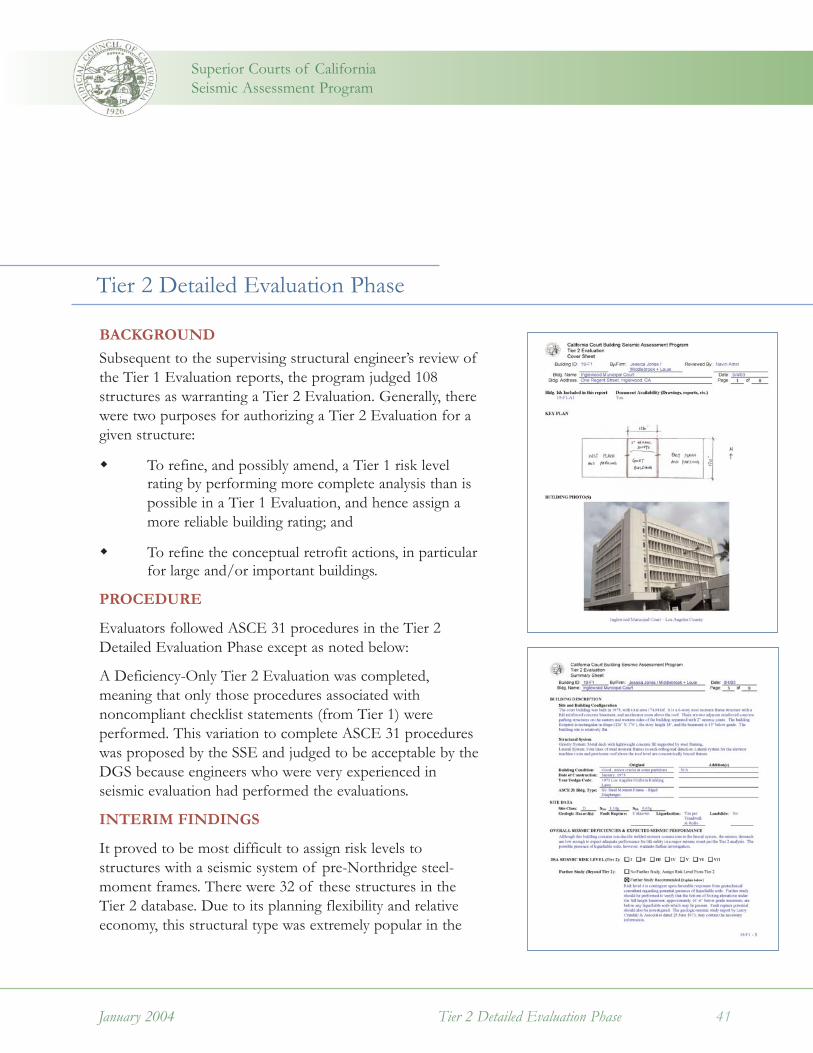
Tier 2 Detailed Evaluation Phase 41
BACKGROUNDSubsequent to the supervising structural engineer’s review ofthe Tier 1 Evaluation reports, the program judged 108structures as warranting a Tier 2 Evaluation. Generally, therewere two purposes for authorizing a Tier 2 Evaluation for agiven structure:
To refine, and possibly amend, a Tier 1 risk levelrating by performing more complete analysis than ispossible in a Tier 1 Evaluation, and hence assign amore reliable building rating; and
To refine the conceptual retrofit actions, in particularfor large and/or important buildings.
PROCEDURE
Evaluators followed ASCE 31 procedures in the Tier 2Detailed Evaluation Phase except as noted below:
A Deficiency-Only Tier 2 Evaluation was completed,meaning that only those procedures associated withnoncompliant checklist statements (from Tier 1) wereperformed. This variation to complete ASCE 31 procedureswas proposed by the SSE and judged to be acceptable by theDGS because engineers who were very experienced inseismic evaluation had performed the evaluations.
INTERIM FINDINGS
It proved to be most difficult to assign risk levels tostructures with a seismic system of pre-Northridge steel-moment frames. There were 32 of these structures in theTier 2 database. Due to its planning flexibility and relativeeconomy, this structural type was extremely popular in the
January 2004
Superior Courts of CaliforniaSeismic Assessment Program
Tier 2 Detailed Evaluation Phase

Tier 2 Detailed Evaluation Phase 42
decade or two prior to the 1994 Northridge earthquake.During those years the system was also considered to be oneof the better seismic systems. However, in the 1994Northridge earthquake, many of these buildings sustaineddamage due to brittle fractures at the connection of thebeams to the columns. The Federal Emergency ManagementAgency (FEMA) funded a major research and developmenteffort — known as the SAC study — to determine the causeof these failures and to develop an acceptable comparablesystem (Mahin, 2003). In part, the study concluded that whilethis class of buildings does not present a severe risk to lifesafety, each individual building requires evaluation becausethe building class cannot be assumed to meet traditional life-safety standards. The ASCE 31 document includes data fromthe FEMA study for evaluation of these buildings, but Tier 2only approximates the much more extensive analysis that isspecified in the SAC study for complete evaluation.Individual reports note if the evaluating engineer believedthat a Tier 3 or SAC-type evaluation could affect the reportconclusions. 1
Of the 108 structures evaluated by the Tier 2 procedures, 14were assigned Risk Level IV or better, 94 were assigned RiskLevel V or worse.
January 2004
Superior Courts of CaliforniaSeismic Assessment Program
Prior to the 1994 Northridgeearthquake, steel moment-resisting frame connectionsgenerally consisted of completepenetration flange welds and abolted or welded shear tabconnection to the web. This typeof beam-to-column connection,which was an industry standardfrom 1970 to 1995, was thoughtto be ductile and capable ofdeveloping the full capacity ofthe beam sections. However, alarge number of buildingsexperienced extensive brittledamage to this type ofconnection during theNorthridge earthquake. As aresult, an emergency codechange was made to the 1994UBC (ICBO, 1994) removing theprequalification of this type ofconnection.
Pre-Northridge-Type Connection(Excerpt from ASCE 31) 1 A “pending” classification which encompasses these structures has been added
to this Summary Report of Preliminary Findings; see Conclusions section.
Conclusions 43
Superior Courts of CaliforniaSeismic Assessment Program
January 2004
Conclusions
SUMMARY OF PRELIMINARY FINDINGS
Addition of the “Pending” Classification
The reliability of the risk level rating for 81 structures is affected by a lack ofdefinitive structural or nonstructural information, or recommendations for furtheranalysis. Although these structures were evaluated and assigned preliminary risklevels in accordance with procedures consistent with the methods of DGS, theAOC has classified these structures as “pending” until the issues regarding theavailable information have been resolved. Future discovery or development ofadditional drawings or geotechnical reports, or more advanced analysis may changethe risk levels initially assigned to some of these structures. The pending group ofstructures include 60 for which adequate structural drawings were not available, 14for which adequate information was not available for complete seismic evaluationconcerning the possibility of liquefaction at the site, anchorage of plaster ceilingsover large assembly spaces, or anchorage of external precast concrete panels, and 7for which the evaluating structural engineers included an opinion in their reportthat further analysis (e.g. a Tier 3 Evaluation) might change their rating.
Seismic Risk Level of Court Building Inventory
During the course of this study, it was found that 52 of the 225 court buildingsconsidered in the seismic assessment program were comprised of multiplestructures that required individual evaluations. This finding resulted in the need toperform a total of 300 structural evaluations. It is of interest, however, to considerthe results by building because the entire functional unit may be affected by thedisruption of retrofit construction, even if only one of the component structuresdoes not meet the evaluation standards. By this measure, of the 225 buildings, 47were rated entirely Risk Level IV or better, 25 were found to be rated partially RiskLevel V or worse, 101 were rated entirely Risk Level V or worse, and 52 wereclassified as pending.
Another picture of the overall seismic condition of the court facilities inventory, asmeasured by DSA Risk Level, can be obtained by studying the ratings, either by

Conclusions 44
number of structures or by total square footage of structure area. The overallsummary of preliminary findings follows:
As shown, of the 300 structures evaluated in this program, 72 were preliminarilyassigned Risk Level IV or better, being judged to meet the applicable evaluationstandard of seismic life safety for transfer. Considering that knowledge ofCalifornia’s seismicity and of building response to earthquake shaking is constantlyevolving, and that criteria for determining acceptable levels of risk to life safety aregenerally conservative, it is not surprising that many older buildings warrant risklevel ratings of V or worse. Other comparable studies of institutional-type buildingshave found similar ratings with regard to seismic life safety standards. It must also beremembered that these ratings are based primarily on an assessment of the level ofpotential risk to life safety and are not intended as a measure of expected economicdamage. Buildings assigned a Risk Level IV could suffer structural and nonstructuraldamage resulting in extensive repair costs and loss of function for months. On theother hand, every building assigned a Risk Level V should not be assumed to be athreat to collapse as a result of every potential earthquake. Many buildings, forexample, survived the 1994 Northridge earthquake with minimal damage. In short,under the relatively extreme shaking intensity and duration assumed for standardseismic evaluations, damage levels in the buildings are judged to create potentiallyone or more conditions that, according to the rules of the evaluation procedure,dictate the risk level rating assigned.
Refinement of Inventory Data
It is notable that of the 452 buildings identified in the inventory of court buildingsby the Task Force on Court Facilities under Assembly Bill 233, only 225 were
January 2004
Superior Courts of CaliforniaSeismic Assessment Program
Risk Level Number of Structures
(Preliminary Assignment) Approx. Square Footage
(Million Sq. Ft.) I 0 0 II 0 0 III 0 0 IV 72 2.78 V 146 11.89 VI 1 3 0.089 3 VII 0 0
Pending 81 3.78 Totals 300 18.53
3 This structure is currently scheduled to undergo a seismic retrofit.

Conclusions 45
evaluated in this seismic assessment program. The balance were found to beexempted from evaluation because they were built in accordance with the 1988UBC (or later) code, their court-occupied space is less than 10,000 square feet andless than 20% of the total building area, or they represent a leased, abandoned,modular, or storage facility.
As a further refinement to the inventory data as a consequence of this program, itwas found that many of the buildings listed in the database actually comprised twoor more independent structures, created by expansion or seismic joints. In addition,it was learned that adequate original construction documents are not currentlyavailable for 60 of the structures considered.
Potential Additional Risk from Other – “Nonstructural” – Factors
Included in this seismic assessment program is consideration of several factors notdirectly related to the structural seismic force resisting system. The most significantof these are the potential interior failing hazard from heavy plaster ceiling overassembly areas (such as courtrooms), the potential exterior failing hazard fromprecast concrete cladding, and the potential hazards posed by liquefaction of thesite soils. In many cases, sufficient information was not available to evaluatingengineers to confirm the level of risk presented by these factors, and a concerndeveloped that the potential for these risks was biasing the results of theseassessments. Although all of the structures associated with these unconfirmed riskswere subsequently classified as pending, it was found that on a building area basisthe area assigned a Risk Level V or worse solely due to one of these three otherfactors is approximately one million square feet, or about 5% of the total buildingarea considered in the inventory.
ANALYSIS OF RISK LEVEL ASSIGNMENTSSummary by Building Type
Figure 1 shows the total number of structures and the total area of structuresclassified into each of the model building types used in the ASCE 31 evaluationstandard. A legend for the abbreviations used for building types is included with theexpanded summary matrix at the end of this section. Each bar is split into thequantity meeting and not meeting the standard set forth in the Trial Court FacilitiesAct of 2002, or currently classified as pending. As shown, over half of the courtfacilities are housed in buildings with lateral systems of concrete shear walls(concrete framing systems, type C2) and steel moment frames (type S1). Another18% are in steel frame buildings with concrete shear walls (type S4). Thesestructural systems are commonly used for larger buildings in urban areas. On theother hand, the largest numbers of structures are not constructed of steel, but of
January 2004
Superior Courts of CaliforniaSeismic Assessment Program

Conclusions 46
reinforced masonry (type RM1) or reinforced concrete (type C2). These buildingtypes, often with wood floors and roofs, are common for smaller buildings. Thereis no significant trend of specific building types meeting the evaluation standardmore frequently than others. Wood building types clearly have the highest pass rate,but only a small percentage of the inventory is of this type.
Summary by Age
Dates of construction were associated with each building during the initialcollection of the inventory, although they were poorly defined. In some cases thedates entered were apparently dates of preparation of construction-relateddocuments and in other cases appeared to be the completion of construction.During the program the date of construction completion and/or the date ofdesign were clarified where possible; this is reflected in the Expanded SummaryMatrix. In any case, these dates can be used to group buildings roughly intodecades of construction, as shown in Figure 2. Both area of construction andnumber of structures are shown and, similar to Figure 1, the bars are split into thequantity meeting and not meeting the evaluation standard, or currently classified aspending. A trend can be seen that a larger percentage of more recently constructedbuildings meet the standard, as would be expected. Over 70% of the current courtbuilding area was constructed in the 1950’s, 60’s, or 70’s, a period for which codedesign requirements, particularly for concrete, are now considered inadequate.
Further Analysis of the Preliminary Findings
Depending on the type of information desired, the overall results of this seismicassessment program, as well as the data contained in the individual evaluationreports, can be variously analyzed. Only a few analyses are presented in this report.Selected characteristics of the inventory that generated interest during theevaluation process are described below:
“Pre-Northridge” steel moment frames—type S1 with construction datesbetween 1975 and 1995—comprise 2,650,000 square feet, or about 15%, ofthe inventory. Most of this area was assigned Risk Level V or pending.Sophisticated evaluation procedures such as those documented in reportsby the SAC Joint Venture (SAC, 2000) may reveal that some of thebuildings in this category, although vulnerable to damage, will meet theevaluation standards of SB 1732.
Superior Courts of CaliforniaSeismic Assessment Program
January 2004

Conclusions 47
A large number of smaller court buildings are constructed of reinforcedmasonry walls with wood floors and roof—56, or 18%, of the total numberof structures. Most of these buildings, unless built in the last five years,have deficient wall-to-diaphragm anchorages that are relatively inexpensiveto retrofit. In the many cases where this is the only deficiency, retrofit andassociated disruption may be relatively minor.
Beginning in 1997, it was recognized in building codes for new buildingsthat ground shaking very near the source fault will be more severe thanaccounted for in past codes. ASCE 31 also incorporates this phenomenon,so the seismic demand considered in evaluation for older buildings withinabout 15 kilometers of active faults will automatically be greater than theiroriginal design load. Although the acceptability criteria contained in ASCE31 is more lenient than those used for new buildings, the increased loadingin these areas will undoubtedly contribute to the number of structures notmeeting the evaluation standards. A query of the database indicated thatabout 6.8 million square feet (37%) of the area of court buildings evaluatedin the program are located in these “near field” zones. Within these areas, ahigh percentage of those structures not meeting the evaluation standardswas recorded, as would be expected.
January 2004
Superior Courts of CaliforniaSeismic Assessment Program

Conclusions 48January 2004
Superior Courts of CaliforniaSeismic Assessment Program
Summary By Building Type
0 1 2 3 4 5 6
Base IsolatedC1C2C3
PC1PC2RM1RM2
S1/S1AS2/S2A
S3S4S5
URM/URMAW1/W1A
W2General/Mixed
Bu
ildin
g T
ype
(AS
CE
31)
Building Area (Millions sf)
IVb
Vw
P
0 10 20 30 40 50 60 70
Base IsolatedC1
C2C3
PC1
PC2RM1RM2
S1/S1AS2/S2A
S3S4
S5URM/URMA
W1/W1A
W2General/Mixed
Bu
ildin
g T
ype
(AS
CE
31)
Number of Structures
IVb
Vw
P
Figure 1. Preliminary Number and Area of Structures Meeting and Not Meeting Evaluation Standardsby Building Type. (See the Detailed Matrix at the end of this section for a legend of Building Types.)

Conclusions 49January 2004
Superior Courts of CaliforniaSeismic Assessment Program
Results by Decade
0 1 2 3 4 5 6
Pre 1900's
1900's
1910's
1920's
1930's
1940's
1950's
1960's
1970's
1980's
1990's
Dec
ade
Building Area (Millions sf)
IVb
Vw
P
0 10 20 30 40 50 60 70 80 90
Pre 1900's
1900's
1910's
1920's
1930's
1940's
1950's
1960's
1970's
1980's
1990's
Dec
ade
Number of Structures
IVb
Vw
P
Figure 2. Preliminary Number and Area of Structures Meeting and Not Meeting EvaluationStandards by Age.

Conclusions 50
Superior Courts of CaliforniaSeismic Assessment Program
January 2004
EXPANDED SUMMARY MATRIX OF EVALUATED BUILDINGS
The Expanded Summary Matrix of Evaluated Buildings follows. The list ofbuildings is the same as that found in the Summary Matrix of Evaluated Buildingsin the Executive Summary, but it contains additional information such as separateentries for multiple-structure buildings, the area and percentage of total areabelieved to be attributable to court facilities for each structure, the number ofstories, the evaluation level at which the risk level assignment was made, and anidentification of other-”nonstructural” deficiencies. Given the amount ofinformation provided, each page of the matrix has been printed to read as a two-sheet spread.

Expanded Summary Matrix 51
Field DefinitionCounty/Bldg ID
Building Gross AreaCourt Area
% Court of Gross Area
Court Area as a percentage of the Building Gross Area.
No. Stories
Year CompleteDesign Code Retrofit DateASCE 31 Building TypeEvaluation Level
The highest level of evaluation completed. Screening, Tier 1, or Tier 2.
DSA Rating
Other WorkScope
Approximate area in square feet of the building/structure provided by the AOC Task Force Report.
Notes: 1) See Summary Matrix of Evaluated Buildings Legend for ASCE 31 Building Type.
These items represent other "nonstructural" issues (ceilings and cladding) and geohazard issues (liquefaction) which potentially pose additional seismic risk.C = Ceilings, Cl = Cladding, G = Geohazard.
Building ID is a unique identifier for each building. 01-A1-E (county number)-(site letter)(building number)-(building sub-letter as needed)
The number of stories in the building/structure. B = Basement; PH = Penthouse.
Year and building code specified in building documentation, or year of retrofit.UBC = Uniform Building Code, LABC = Los Angeles Building Code
Department of State Architect seismic risk level based on the most detailed evaluation performed for each structure. On a scale of I to VII; IVb = IV or better, Vw = V or worse. P = Pending
Represents the approximate year of construction for the original building.
Building type based on the lateral-force-resisting system(s) and the diaphragm type as defined by ASCE 31. See note 1, below.
Approximate area in square feet of the court facilities within the building/structure provided by the AOC Task Force Report.
Building ID's that end in "ms" represent buildings that are composed of multiple structures. All data that is contained in these rows represents a summary of the data for the structures. Building ID's that end in "ms*" represent buildings where one or more structure has been exempted from evaluation.
Expanded Summary Matrix
LEGEND
Superior Courts of CaliforniaSeismic Assessment Program
January 2004

Expanded Summary Matrix 52
C ount y/B ldg ID B uild ing N ame B uild ing A ddress
B uild ing Gross A rea C ourt A rea
% C ourt o f Gross A rea
A lameda0 1- A 1 R ene C . D avidson 12 2 5 Fallon St . , Oakland 2 8 4 ,12 0 114 ,6 17 4 0 .30 1- A 2 - ms C ount y A dminist rat ion B ldg . 12 2 1 Oak St . , Oakland 2 0 8 ,14 6 3 6 ,12 6 17.4
01-A2-E County Administrat ion Bldg. 1221 Oak St., Oakland 196,850 - - 01-A2-A Vert ical Addit ion 1221 Oak St., Oakland 11,296 - -
0 1- B 1 C ount y Probat ion C ent er 4 0 0 B roadway, Oakland 54 ,50 5 12 ,9 9 1 2 3 .80 1- B 3 W iley W . M anuel C ourt house 6 6 1 W ashing t on St . , Oakland 19 6 ,2 77 10 1,59 9 51.80 1- D 1 Hayward Hall o f Just ice 2 4 4 0 5 A mador St . , Hayward 18 4 ,78 5 110 ,53 4 59 .80 1- F1 George E. M cD onald - HOJ 2 2 3 3 Shoreline D r., A lameda 2 5,8 50 14 ,14 4 54 .70 1- G1 B erkeley C ourt house 2 12 0 M art in Lut her King , Jr . W ay, B erk 14 ,9 0 0 5,52 3 3 7.10 1- H1 Fremont Hall o f Just ice 3 9 4 3 9 Paseo Padre Pkwy., F remont 12 4 ,10 0 6 2 ,4 6 4 50 .3A lp ine0 2 - A 1 A lp ine C ount y C ourt house 9 9 W at er St . , M arkleevil le 7,3 2 6 2 ,56 8 3 5.1A mador0 3 - A 1 A mador C ount y C ourt house 10 8 C ourt St . , Jackson 2 1,0 74 12 ,3 4 8 58 .60 3 - B 1- ms A mador Hosp it al/ C ourt house 8 10 C ourt St . , Jackson 6 9 ,10 7 3 6 ,8 53 53 .3
03-B1-A Amador Hospital/Courthouse, 1958 Addit ion 810 Court St., Jackson 21,400 - - 03-B1-B Amador Hospital/Courthouse, 1969 Addit ion 810 Court St., Jackson 18,807 - - 03-B1-C Amador Hospital/Courthouse, 1985 Addit ion 810 Court St., Jackson 11,300 - - 03-B1-E Amador Hospital/Courthouse 810 Court St., Jackson 17,600 - -
B ut t e0 4 - A 1- ms* B ut t e C ount y C ourt house 1 C ourt St . , Orovil le 55,8 10 4 1,6 0 7 74 .6
04-A1-E Butte County Courthouse, Original 1 Court St., Oroville 18,810 - - 0 4 - B 1 D ownt own C ourt house 19 3 1 A rlin R hine D r., Orovil le 5,177 3 ,54 6 6 8 .50 4 - C 1 Grid ley C ourt house 2 3 9 Sycamore, Grid ley 4 ,6 79 1,9 8 3 4 2 .40 4 - D 1 C hico C ourt house 6 55 Oleander A ve., C hico 12 ,13 5 7,6 6 8 6 3 .20 4 - E1 Parad ise C ourt house 74 7 Ell io t R d ., Parad ise 7,74 2 2 ,9 71 3 8 .4C alaveras0 5- A 1 Legal B ldg . 8 9 1 M ount ain R anch R d ., San A ndreas 18 ,4 8 8 6 ,2 59 3 3 .9C ont ra C ost a0 7- A 2 Old C ourt house 72 5 C ourt St . , M art inez 10 0 ,6 57 4 3 ,8 0 6 4 3 .50 7- A 3 B ray C ourt s 10 2 0 W ard St . , M art inez 4 8 ,8 2 3 2 5,78 6 52 .80 7- A 4 Jail A nnex 10 10 W ard St . , M art inez 12 ,8 4 3 7,8 0 5 6 0 .80 7- C 1 D anvil le D ist r ict C ourt house 6 4 0 Y gnacio V alley R d ., W alnut C reek 3 7,10 4 2 6 ,19 9 70 .60 7- D 1 C oncord - M t . D iab lo D ist r ict 2 9 70 W illow Pass R d ., C oncord 8 ,50 9 6 ,70 2 78 .80 7- E1 Pit t sburg - D elt a 4 5 C ivic D r., Pit t sburg 2 3 ,9 0 0 16 ,4 76 6 8 .90 7- F1 R ichmond- B ay D ist r ict 10 0 3 7t h St . , R ichmond 76 ,4 6 2 3 7,0 4 7 4 8 .5D el N ort e0 8 - A 1 D el N ort e C ount y Superio r C ourt 4 50 'H' St . , C rescent C it y 2 9 ,0 0 8 9 ,8 4 6 3 3 .9El D orado0 9 - A 1 M ain St . C ourt house 4 9 5 M ain St . , Placervil le 17,9 51 11,6 6 2 6 5.00 9 - C 1 Superio r C ourt 3 3 2 1 C ameron Park D r., C ameron Park 7,8 3 4 5,6 9 8 72 .70 9 - E1 Johnson B ldg . 13 54 Johnson B lvd ., Sout h Lake Tahoe 3 7,4 53 14 ,710 3 9 .3Fresno10 - A 1 Fresno C ount y C ourt house. 110 0 V an N ess A ve., F resno 2 13 ,6 8 7 110 ,4 3 0 51.710 - B 1 N ort h A nnex Jail 12 55 M St . , F resno 2 5,6 6 7 11,0 8 3 4 3 .210 - C 1 Juvenile D elinquency C ourt 74 2 Sout h Tent h St . , F resno 18 ,18 0 9 ,3 9 4 51.710 - F1 R eed ley C ourt 8 15 G St . , R eed ly 6 ,2 0 8 3 ,6 2 1 58 .3Glenn11- B 1 Orland Superio r C ourt 8 2 1 E. Sout h St . , Orland 9 ,8 4 5 3 ,0 3 9 3 0 .9Imperial13 - A 1 Imperial C ount y C ourt house 9 3 9 W . M ain St . , El C ent ro 6 6 ,0 0 0 2 6 ,78 2 4 0 .6Inyo14 - A 1 Independence Superio r C ourt 16 8 N . Edwards St . , Independence 2 2 ,6 8 3 5,153 2 2 .7Kern15- A 1- ms B akersf ield Superio r C ourt 14 15 T ruxt um A ve., B akersf ield 2 2 3 ,6 50 8 4 ,517 3 7.8
15-A1-A Bakersf ield Superior Court , West Wing 1415 Truxtum Ave., Bakersf ield 97,210 - - 15-A1-B Bakersf ield Superior Court , Central Wing 1415 Truxtum Ave., Bakersf ield 73,850 - - 15-A1-C Bakersf ield Superior Court , Jury Services 1415 Truxtum Ave., Bakersf ield 52,590 - -
15- B 1 B akersf ield Just ice B ldg . 12 15 T ruxt un A ve., B akersf ield 12 5,78 3 55,9 56 4 4 .515- C 1 B akersf ield Juvenile C ent er 2 10 0 C o llege A ve., B akersf ield 8 2 ,6 8 0 2 2 ,3 59 2 7.015- D 1 D elano / N ort h Kern C ourt 112 2 Jef f erson St . , D elano 14 ,3 77 9 ,4 52 6 5.715- E1 Shaf t er / W asco C ourt s B ldg . 3 2 5 C ent ral V alley Hwy., Shaf t er 16 ,8 3 6 12 ,8 8 7 76 .515- F1 Taf t C ourt s B ldg . 3 11 Linco ln St . , Taf t 6 ,12 7 4 ,54 8 74 .215- G1 East Kern C ourt - Lake Isabella B ranch 70 4 6 Lake Isabella B lvd ., Lake Isabella 14 ,154 4 ,2 2 5 2 9 .915- H1 A rvin/ Lamont B ranch 12 0 2 2 M ain St . , Lamont 2 6 ,6 8 0 11,8 2 1 4 4 .315- I1 M o jave- M ain C ourt Facil i t y 1773 Hwy. 58 , M o jave 12 ,112 3 ,14 1 2 5.915- I2 M o jave- C ount y A dminist rat ion B ldg . 1775 Hwy. 58 , M o jave 8 ,53 8 2 ,2 8 8 2 6 .815- J1 R idgecrest - M ain Facil i t y 13 2 E. C oso St . , R idgecrest 9 ,3 4 0 4 ,772 51.1
Expanded Summary Matrix
Superior Courts of CaliforniaSeismic Assessment Program
January 2004
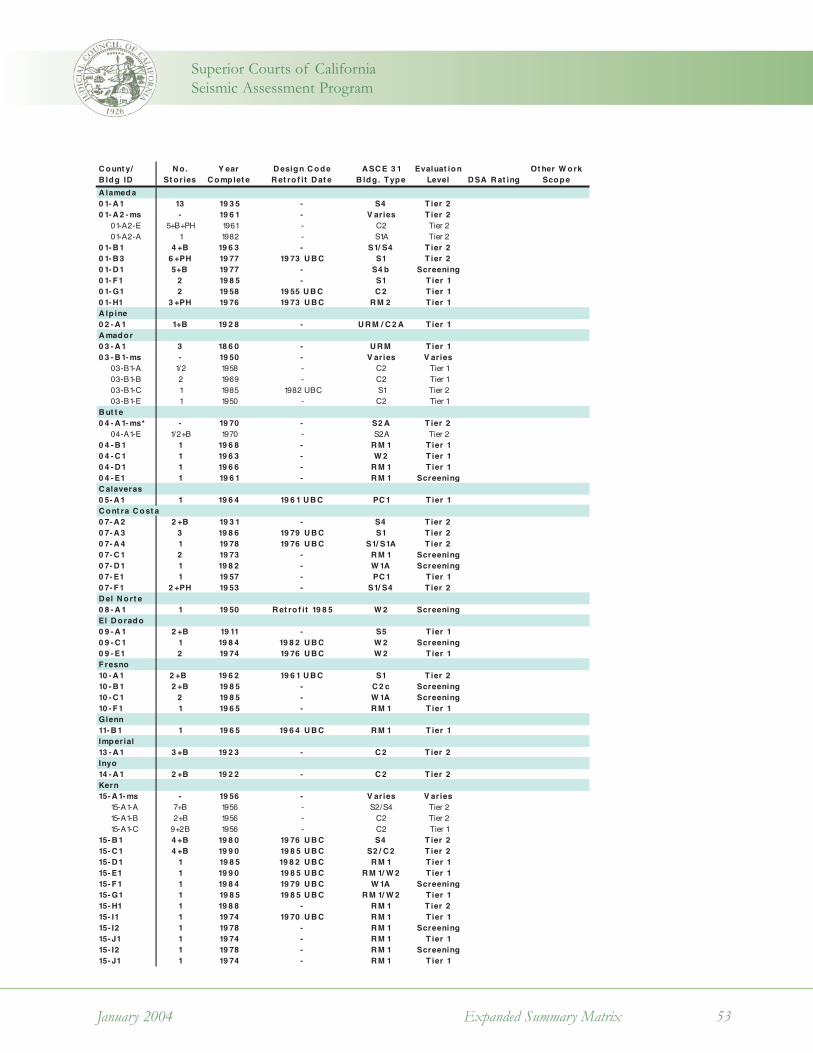
Expanded Summary Matrix 53January 2004
C ount y/B ldg ID
N o . St o r ies
Y ear C omplet e
D esign C odeR et ro f it D at e
A SC E 3 1 B ldg . Type
Evaluat ion Level D SA R at ing
Ot her W ork Scope
A lameda0 1- A 1 13 19 3 5 - S4 T ier 20 1- A 2 - ms - 19 6 1 - V aries T ier 2
01-A2-E 5+B+PH 1961 - C2 Tier 201-A2-A 1 1982 - S1A Tier 2
0 1- B 1 4 +B 19 6 3 - S1/ S4 T ier 20 1- B 3 6 +PH 19 77 19 73 U B C S1 T ier 20 1- D 1 5+B 19 77 - S4 b Screening0 1- F1 2 19 8 5 - S1 T ier 10 1- G1 2 19 58 19 55 U B C C 2 T ier 10 1- H1 3 +PH 19 76 19 73 U B C R M 2 T ier 1A lp ine0 2 - A 1 1+B 19 2 8 - U R M / C 2 A T ier 1A mador0 3 - A 1 3 18 6 0 - U R M Tier 10 3 - B 1- ms - 19 50 - V aries V aries
03-B1-A 1/2 1958 - C2 Tier 103-B1-B 2 1969 - C2 Tier 103-B1-C 1 1985 1982 UBC S1 Tier 203-B1-E 1 1950 - C2 Tier 1
B ut t e0 4 - A 1- ms* - 19 70 - S2 A T ier 2
04-A1-E 1/2+B 1970 - S2A Tier 20 4 - B 1 1 19 6 8 - R M 1 T ier 10 4 - C 1 1 19 6 3 - W 2 T ier 10 4 - D 1 1 19 6 6 - R M 1 T ier 10 4 - E1 1 19 6 1 - R M 1 ScreeningC alaveras0 5- A 1 1 19 6 4 19 6 1 U B C PC 1 T ier 1C ont ra C ost a0 7- A 2 2 +B 19 3 1 - S4 T ier 20 7- A 3 3 19 8 6 19 79 U B C S1 T ier 20 7- A 4 1 19 78 19 76 U B C S1/ S1A T ier 20 7- C 1 2 19 73 - R M 1 Screening0 7- D 1 1 19 8 2 - W 1A Screening0 7- E1 1 19 57 - PC 1 T ier 10 7- F1 2 +PH 19 53 - S1/ S4 T ier 2D el N ort e0 8 - A 1 1 19 50 R et ro f it 19 8 5 W 2 ScreeningEl D orado0 9 - A 1 2 +B 19 11 - S5 T ier 10 9 - C 1 1 19 8 4 19 8 2 U B C W 2 Screening0 9 - E1 2 19 74 19 76 U B C W 2 T ier 1F resno10 - A 1 2 +B 19 6 2 19 6 1 U B C S1 T ier 210 - B 1 2 +B 19 8 5 - C 2 c Screening10 - C 1 2 19 8 5 - W 1A Screening10 - F1 1 19 6 5 - R M 1 T ier 1Glenn11- B 1 1 19 6 5 19 6 4 U B C R M 1 T ier 1Imperial13 - A 1 3 +B 19 2 3 - C 2 T ier 2Inyo14 - A 1 2 +B 19 2 2 - C 2 T ier 2Kern15- A 1- ms - 19 56 - V aries V aries
15-A1-A 7+B 1956 - S2/S4 Tier 215-A1-B 2+B 1956 - C2 Tier 215-A1-C 9+2B 1956 - C2 Tier 1
15- B 1 4 +B 19 8 0 19 76 U B C S4 T ier 215- C 1 4 +B 19 9 0 19 8 5 U B C S2 / C 2 T ier 215- D 1 1 19 8 5 19 8 2 U B C R M 1 T ier 115- E1 1 19 9 0 19 8 5 U B C R M 1/ W 2 T ier 115- F1 1 19 8 4 19 79 U B C W 1A Screening15- G1 1 19 8 5 19 8 5 U B C R M 1/ W 2 T ier 115- H1 1 19 8 8 - R M 1 T ier 215- I1 1 19 74 19 70 U B C R M 1 T ier 115- I2 1 19 78 - R M 1 Screening15- J1 1 19 74 - R M 1 T ier 115- I2 1 19 78 - R M 1 Screening15- J1 1 19 74 - R M 1 T ier 1
Superior Courts of CaliforniaSeismic Assessment Program

Expanded Summary Matrix 54
C ount y/B ldg ID B uild ing N ame B uild ing A ddress
B uild ing Gross A rea C ourt A rea
% C o urt o f Gross A rea
Kings16 - A 1 Hanf ord M unicipal C ourt 14 0 0 W est Lacey B lvd ., Hanf o rd 18 ,512 14 ,4 2 8 77.916 - A 2 Hanf ord N ew Superio r C ourt 14 0 0 W est Lacey B lvd ., Hanf o rd 2 8 ,2 0 8 19 ,9 4 1 70 .716 - A 3 Hanf ord Old Superio r C ourt 14 0 0 W est Lacey B lvd ., Hanf o rd 11,9 6 8 8 ,9 9 2 75.116 - A 4 Hanf ord Juvenile C ourt 14 0 0 W est Lacey B lvd ., Hanf o rd 4 ,0 0 1 1,6 0 6 4 0 .116 - B 1 Lemoore M unicipal C ourt 4 4 9 C St . , Leemore 5,12 9 2 ,9 4 1 57.316 - C 1 A venal M unicipal C ourt 50 1 E. Kings St . . , A venal 5,3 2 0 2 ,56 1 4 8 .116 - D 1 C orcoran M unicipal C ourt 10 0 0 C hit t anden A ve., C orcoran 5,9 0 8 3 ,2 2 7 54 .6Lake17- A 3 - ms C ourt house 2 55 N . Forbes St . , Lakeport 55,58 8 11,2 4 4 2 0 .2
17-A3-E Courthouse 255 N. Forbes St., Lakeport 47,323 - - 17-A3-A Pedestrian Bridge/Walkway 255 N. Forbes St., Lakeport 490 - - 17-A3-B South Wing Addit ion 255 N. Forbes St., Lakeport 7,775 - -
17- B 1 Sout h C ivic C ent er 70 0 0 A S. C ent er D r., C lear lake 8 ,3 8 5 3 ,3 3 2 3 9 .7Lassen18 - A 1 Lassen C ount y C ourt 2 2 0 S. Lassen St . , Susanvil le 2 9 ,8 0 0 6 ,112 2 0 .5Los A ngeles19 - A C 1 San Fernando C ourt 9 0 0 Third St . , San Fernando 19 1,10 8 10 8 ,8 0 6 56 .919 - A C 2 San Fernando C ourt house A nnex 9 19 F irst St . , San Fernando 16 ,2 9 2 12 ,4 9 4 76 .719 - A D 1 N ewHall M unicipal C ourt 2 3 74 7 W . V alencia B lvd ., V alencia 3 2 ,12 4 19 ,14 9 59 .619 - A E1 Lancast er C ourt house M ain B ldg . 10 4 0 W . A ve. J, Lancast er 4 2 ,3 8 8 2 6 ,2 56 6 1.919 - A E2 Lancast er C ourt house A nnex 10 4 0 W . A ve. J, Lancast er 6 ,58 8 5,58 8 8 4 .819 - A F1 San Fernando V alley Juvenile C ourt 16 3 50 F ilbert St . , Sylmar 3 8 ,9 0 2 11,19 1 2 8 .819 - A G1 C ompt on C ourt house 2 0 0 W . C ompt on B lvd ., C ompt on 4 17,159 159 ,3 8 3 3 8 .219 - A I1 Los Padrinos Juvenile C ourt 72 8 1 E. Quil l D r . , D owney 3 4 ,16 7 10 ,111 2 9 .619 - A K1 N orwalk C ourt house 12 72 0 N orwalk B lvd ., N orwalk 2 0 8 ,19 5 10 9 ,4 74 52 .619 - A M 1- ms D owney C ourt 750 0 Imperial Hwy., D owney 111,2 2 3 55,4 3 0 4 9 .8
19-AM 1-A Downey Court 7500 Imperial Hwy., Downey 103,553 - - 19-AM 1-B M echanical Tower 7500 Imperial Hwy., Downey 7,670 - -
19 - A O1- ms W hit t ier C ourt 73 3 9 Paint er A ve., W hit t ier 8 7,8 9 5 4 4 ,6 3 4 50 .819-AO1-A 1959 Addit ion 7339 Painter Ave., Whit t ier 17,151 - - 19-AO1-B 1972 Addit ion 7339 Painter Ave., Whit t ier 58,502 - - 19-AO1-E Whit t ier Court 7339 Painter Ave., Whit t ier 12,242 - -
19 - A P1- ms Sant a M onica C ourt 172 5 M ain St . , Sant a M onica 12 2 ,56 5 54 ,9 79 4 4 .919-AP1-A Santa M onica Court , North Wing 1725 M ain St., Santa M onica 36,855 - - 19-AP1-B Santa M onica Court , Central Wing 1725 M ain St., Santa M onica 33,855 - - 19-AP1-C Santa M onica Court , South Wing 1725 M ain St., Santa M onica 51,855 - -
19 - A Q1 B everly Hil ls C ourt 9 3 55 B urt on W ay, B everly Hil ls 18 4 ,8 8 2 3 4 ,9 6 3 18 .919 - A R 1- ms W est Los A ngeles C ourt house 16 3 3 Purdue A ve., Los A ngeles 4 5,12 9 2 2 ,2 6 5 4 9 .3
19-AR1-A West Los Angeles Courthouse, Addit ion 1633 Purdue Ave., Los Angeles 25,129 - - 19-AR1-E West Los Angeles Courthouse 1633 Purdue Ave., Los Angeles 20,000 - -
19 - A S1 M alibu C ivic C ent er B ldg . 2 3 52 5 C ivic C ent er W ay, M alibu 55,9 11 19 ,3 8 4 3 4 .719 - A V 1- ms Hall o f R ecords 3 2 0 Temple St . , Los A ngeles 4 4 7,0 0 0 2 2 ,6 3 2 5.1
19-AV1-A Hall of Records, Administrat ion Bldg 320 Temple St., Los Angeles 350,000 - - 19-AV1-B Hall of Records, Records Bldg 320 Temple St., Los Angeles 97,000 - -
19 - A W 1 C ulver C ourt 4 13 0 Overland A ve., C ulver C it y 2 1,19 3 11,774 55.619 - A X 1 V an N uys C ourt house 6 2 3 0 Sylmar A ve., V an N uys 178 ,0 4 8 10 6 ,173 59 .619 - A X 2 V an N uys B ranch C ourt 14 4 0 0 Erwin St . M all , V an N uys 2 8 4 ,10 2 14 0 ,6 2 9 4 9 .519 - A 1 Hunt ing t on Park B ranch- Sout heast M unici 6 54 8 M iles A ve., Hunt ing t on Park 2 7,0 0 0 16 ,19 9 6 0 .019 - B 1 Sout hgat e B ranch- Sout heast M unicipal C o8 6 4 0 C alif o rnia A ve., Sout h Gat e 18 ,9 0 0 10 ,8 0 5 57.219 - C 1 Sout h B ay C ourt house Superio r and M uni 8 2 5 M ap le D r., To rrance 14 6 ,711 8 4 ,554 57.619 - C 2 Sout h B ay C ourt house A nnex- M unicipal 3 2 2 1 Torrance B lvd ., To rrance 15,12 6 4 ,9 2 1 3 2 .519 - E1 Ing lewood Juvenile C ourt - Superio r 110 R egent St . , Ing lewood 18 ,79 1 11,3 6 1 6 0 .519 - F1 Ing lewood M unicipal C ourt 110 R egent St . , Ing lewood 174 ,0 4 1 6 1,3 4 8 3 5.219 - G1- ms* B urbank Superio r and M unicipal C ourt hou3 0 0 E. Olive A ve., B urbank 6 7,2 8 0 3 9 ,0 4 0 58 .0
19-G1-E Burbank Superior and M unicipal Courthouse 300 E. Olive Ave., Burbank 67,280 - - 19 - H1- ms Glendale Superio r and M unicipal C ourt ho 6 0 0 E. B roadway, Glendale 56 ,16 7 3 1,59 2 56 .2
19-H1-E Glendale Superior and M unicipal Courthouse 600 E. Broadway, Glendale 48,000 - - 19-H1-A Glendale Superior and M unicipal Courthouse 600 E. Broadway, Glendale 7,400 - -
19 - I1 A lhambra Superio r and M unicipal C ourt 150 W . C ommonwealt h A ve., A lhambra 110 ,174 58 ,50 0 53 .119 - J1 Pasadena Superio r C ourt house 3 0 0 E. W alnut St . , Pasadena 18 7,12 0 6 6 ,8 9 0 3 5.719 - J2 Pasadena M unicipal C ourt house 3 0 1 E. W alnut St . , Pasadena 3 6 ,572 2 3 ,6 3 7 6 4 .619 - K1- ms St anley M osk C ourt house 110 N . Grand A ve., Los A ngeles 73 6 ,2 0 0 4 0 7,50 9 55.4
19-K1-A Stanley M osk Courthouse, West Wing 110 N. Grand Ave., Los Angeles 220,860 - - 19-K1-B Stanley M osk Courthouse, East Wing 111 N. Hill St., Los Angeles 515,340 - -
19 - L1 C riminal C ourt s B ldg . 2 10 W . Temple St . , Los A ngeles 1,0 2 0 ,2 6 6 3 4 3 ,0 3 2 3 3 .619 - N 1 Sant a A nit a C ourt 3 0 0 W . M ap le A ve., M onrovia 19 ,4 4 0 12 ,8 8 8 6 6 .319 - O1 R io Hondo C ourt 112 3 4 E. V alley B lvd ., El M ont e 12 9 ,176 4 7,8 55 3 7.019 - P1 M ent al Healt h C ourt 1150 N ort h San Fernando R d ., Los A ng 2 7,6 17 15,6 18 56 .619 - Q1 C hild ren's C ourt 2 0 1 C ent re Plaza D r., M ont erey Park 2 6 3 ,6 2 3 171,0 8 3 6 4 .9
Expanded Summary Matrix
Superior Courts of CaliforniaSeismic Assessment Program
January 2004

Expanded Summary Matrix 55January 2004
Superior Courts of CaliforniaSeismic Assessment Program
C ount y/B ldg ID
N o . St o r ies
Y ear C omplet e
D esign C odeR et ro f it D at e
A SC E 3 1 B ldg . Type
Evaluat ion Level D SA R at ing
Ot her W ork Scope
Kings16 - A 1 1 19 78 19 73 U B C C 1/ C 2 A T ier 216 - A 2 1/ 2 19 9 1 19 8 5 U B C C 1c Screening16 - A 3 2 19 78 19 73 U B C C 2 A T ier 216 - A 4 1 19 8 7 19 8 5 U B C W 1 T ier 116 - B 1 1 19 59 - R M 1 T ier 216 - C 1 1 19 6 5 19 76 U B C W 2 Screening16 - D 1 1 19 9 0 19 8 5 U B C R M 1/ W 1A T ier 1Lake17- A 3 - ms - 19 6 8 - V aries T ier 2
17-A3-E 4 1968 - S1 Tier 217-A3-A 1 - - Varies Tier 217-A3-B 3 1986 Retrof it 1982 S2 Tier 2
17- B 1 1 19 74 - R M 1 ScreeningLassen18 - A 1 2 +B 19 15 - C 3 ScreeningLos A ngeles19 - A C 1 4 19 8 3 19 71 LA B C C 2 T ier 119 - A C 2 1 19 52 - R M 1 T ier 119 - A D 1 1 19 72 19 6 8 LA B C R M 1 T ier 119 - A E1 1/ 2 19 57 - R M 1 T ier 119 - A E2 1 19 8 0 - W 2 T ier 119 - A F1 1 19 6 5 - R M 2 T ier 119 - A G1 12 +B 19 78 19 71 LA B C S1 T ier 219 - A I1 1 19 59 - C 2 T ier 119 - A K1 7 19 6 5 - S2 / S4 T ier 219 - A M 1- ms - 19 8 7 19 8 2 U B C V aries V aries
19-AM 1-A 4+B 1987 1982 UBC S1 Tier 219-AM 1-B 5+B 1987 1982 UBC C2 Tier 1
19 - A O1- ms - 19 53 - V aries V aries19-AO1-A 1+B 1959 1956 UBC RM 1 Tier 119-AO1-B 3+B 1972 1969 LABC C2 Tier 219-AO1-E 3 1953 - C2 Screening
19 - A P1- ms - 19 6 2 - C 2 V aries19-AP1-A 2+PH 1962 1961 UBC C2 Tier 119-AP1-B 2+PH 1950 - C2 Tier 219-AP1-C 3+PH 1962 1961 UBC C2 Tier 1
19 - A Q1 4 19 70 19 6 5 LA B C C 2 T ier 219 - A R 1- ms - 19 6 0 - C 2 / C 2 A Screening
19-AR1-A 3 1976 - C2/C2A Screening19-AR1-E 2 1960 - C2/C2A Screening
19 - A S1 1+B +PH 19 70 - R M 1 Screening19 - A V 1- ms - 19 58 19 57 LA B C S4 V aries
19-AV1-A 17 1958 1957 LABC S4 Tier 219-AV1-B 13 1958 1957 LABC C2 Tier 1
19 - A W 1 1+B 19 56 - W 2 T ier 119 - A X 1 7 19 6 4 19 58 U B C S1 T ier 219 - A X 2 10 19 8 9 19 8 2 LA B C S1 T ier 219 - A 1 2 19 54 - C 2 A Screening19 - B 1 1 19 54 - C 2 A T ier 219 - C 1 2 / 5 19 6 7 16 6 1 U B C C 2 T ier 219 - C 2 1 19 6 4 19 6 1 U B C R M 1 T ier 119 - E1 2 +B 19 50 19 4 9 U B C C 2 b T ier 119 - F1 7+B 19 77 19 71 LA B C S1 T ier 219 - G1- ms* - 19 52 - V aries T ier 1
19-G1-E 2+B 1952 - C2 Tier 119 - H1- ms 2 +PH 19 56 - S4 V aries
19-H1-E 2+PH 1956 - S4 Tier 219-H1-A 2 1956 - S4 Tier 1
19 - I1 4 +B 19 70 - S4 T ier 219 - J1 6 +B 19 6 8 19 6 5 U B C S4 T ier 219 - J2 2 +B 19 50 - C 2 T ier 219 - K1 - 19 57 19 52 U B C S4 T ier 2
19-K1-A 9+B+PH 1957 1952 UBC S4 Tier 219-K1-B 7+B+PH 1957 1952 UBC S4 Tier 2
19 - L1 19 19 72 - S1/ S2 T ier 219 - N 1 1 19 54 - W 1A T ier 119 - O1 4 19 74 19 71 LA B C S1 T ier 219 - P1 1 19 6 9 - R M 1 T ier 119 - Q1 7 19 9 0 - S1 T ier 2
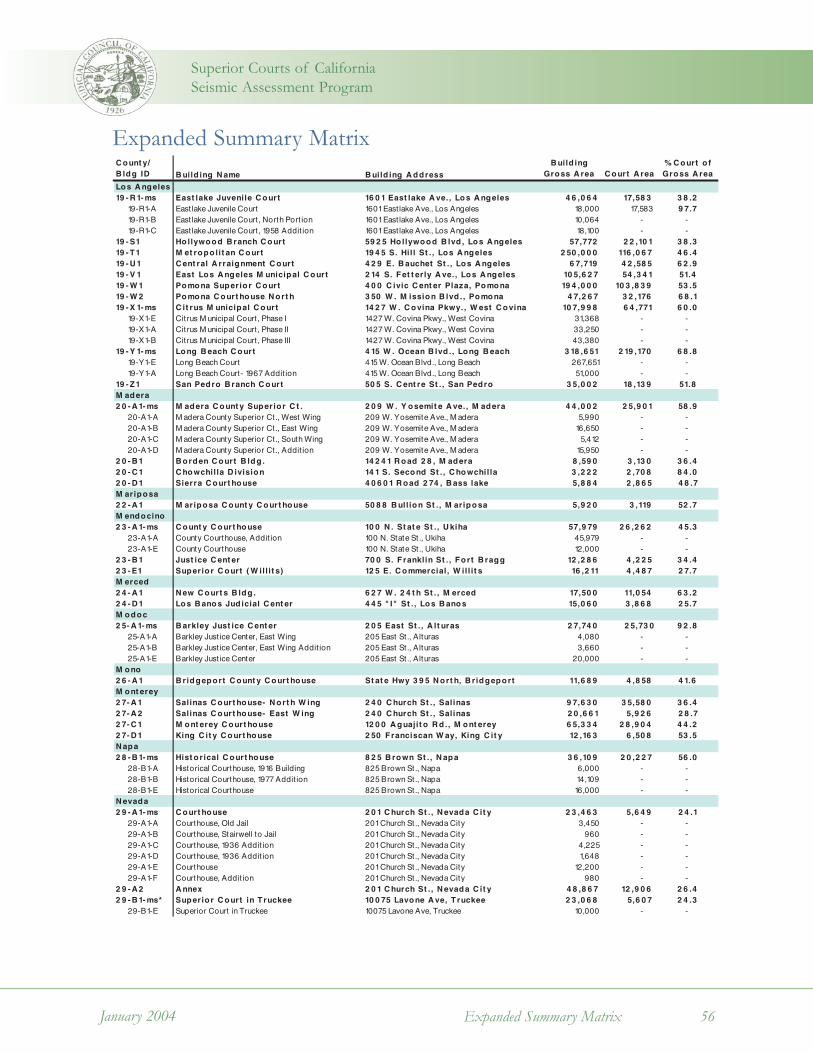
Expanded Summary Matrix 56
Superior Courts of CaliforniaSeismic Assessment Program
January 2004
C ount y/B ldg ID B uild ing N ame B uild ing A ddress
B uild ing Gross A rea C ourt A rea
% C ourt o f Gross A rea
Los A ngeles19 - R 1- ms East lake Juvenile C ourt 16 0 1 East lake A ve., Los A ngeles 4 6 ,0 6 4 17,58 3 3 8 .2
19-R1-A East lake Juvenile Court 1601 East lake Ave., Los Angeles 18,000 17,583 9 7.719-R1-B East lake Juvenile Court , North Port ion 1601 East lake Ave., Los Angeles 10,064 - - 19-R1-C East lake Juvenile Court , 1958 Addit ion 1601 East lake Ave., Los Angeles 18,100 - -
19 - S1 Ho llywood B ranch C ourt 59 2 5 Ho llywood B lvd , Los A ngeles 57,772 2 2 ,10 1 3 8 .319 - T1 M et ropo lit an C ourt 19 4 5 S. Hil l St . , Los A ngeles 2 50 ,0 0 0 116 ,0 6 7 4 6 .419 - U 1 C ent ral A rraignment C ourt 4 2 9 E. B auchet St . , Los A ngeles 6 7,719 4 2 ,58 5 6 2 .919 - V 1 East Los A ngeles M unicipal C ourt 2 14 S. Fet t er ly A ve., Los A ngeles 10 5,6 2 7 54 ,3 4 1 51.419 - W 1 Pomona Superio r C ourt 4 0 0 C ivic C ent er Plaza, Pomona 19 4 ,0 0 0 10 3 ,8 3 9 53 .519 - W 2 Pomona C ourt house N ort h 3 50 W . M ission B lvd ., Pomona 4 7,2 6 7 3 2 ,176 6 8 .119 - X 1- ms C it rus M unicipal C ourt 14 2 7 W . C ovina Pkwy., W est C ovina 10 7,9 9 8 6 4 ,771 6 0 .0
19-X1-E Citrus M unicipal Court , Phase I 1427 W. Covina Pkwy., West Covina 31,368 - - 19-X1-A Citrus M unicipal Court , Phase II 1427 W. Covina Pkwy., West Covina 33,250 - - 19-X1-B Citrus M unicipal Court , Phase III 1427 W. Covina Pkwy., West Covina 43,380 - -
19 - Y 1- ms Long B each C ourt 4 15 W . Ocean B lvd ., Long B each 3 18 ,6 51 2 19 ,170 6 8 .819-Y1-E Long Beach Court 415 W. Ocean Blvd., Long Beach 267,651 - - 19-Y1-A Long Beach Court- 1967 Addit ion 415 W. Ocean Blvd., Long Beach 51,000 - -
19 - Z1 San Pedro B ranch C ourt 50 5 S. C ent re St . , San Pedro 3 5,0 0 2 18 ,13 9 51.8M adera2 0 - A 1- ms M adera C ount y Superio r C t . 2 0 9 W . Y osemit e A ve., M adera 4 4 ,0 0 2 2 5,9 0 1 58 .9
20-A1-A M adera County Superior Ct., West Wing 209 W. Yosemite Ave., M adera 5,990 - - 20-A1-B M adera County Superior Ct., East Wing 209 W. Yosemite Ave., M adera 16,650 - - 20-A1-C M adera County Superior Ct., South Wing 209 W. Yosemite Ave., M adera 5,412 - - 20-A1-D M adera County Superior Ct., Addit ion 209 W. Yosemite Ave., M adera 15,950 - -
2 0 - B 1 B orden C ourt B ldg . 14 2 4 1 R oad 2 8 , M adera 8 ,59 0 3 ,13 0 3 6 .42 0 - C 1 C howchil la D ivision 14 1 S. Second St . , C howchil la 3 ,2 2 2 2 ,70 8 8 4 .02 0 - D 1 Sierra C ourt house 4 0 6 0 1 R oad 2 74 , B ass lake 5,8 8 4 2 ,8 6 5 4 8 .7M ariposa2 2 - A 1 M ariposa C ount y C ourt house 50 8 8 B ull ion St . , M ariposa 5,9 2 0 3 ,119 52 .7M endocino2 3 - A 1- ms C ount y C ourt house 10 0 N . St at e St . , U kiha 57,9 79 2 6 ,2 6 2 4 5.3
23-A1-A County Courthouse, Addit ion 100 N. State St., Ukiha 45,979 - - 23-A1-E County Courthouse 100 N. State St., Ukiha 12,000 - -
2 3 - B 1 Just ice C ent er 70 0 S. F ranklin St . , Fo rt B ragg 12 ,2 8 6 4 ,2 2 5 3 4 .42 3 - E1 Superio r C ourt ( W ill i t s) 12 5 E. C ommercial, W il l i t s 16 ,2 11 4 ,4 8 7 2 7.7M erced2 4 - A 1 N ew C ourt s B ldg . 6 2 7 W . 2 4 t h St . , M erced 17,50 0 11,0 54 6 3 .22 4 - D 1 Los B anos Jud icial C ent er 4 4 5 " I" St . , Los B anos 15,0 6 0 3 ,8 6 8 2 5.7M odoc2 5- A 1- ms B arkley Just ice C ent er 2 0 5 East St . , A lt uras 2 7,74 0 2 5,73 0 9 2 .8
25-A1-A Barkley Just ice Center, East Wing 205 East St., Alturas 4,080 - - 25-A1-B Barkley Just ice Center, East Wing Addit ion 205 East St., Alturas 3,660 - - 25-A1-E Barkley Just ice Center 205 East St., Alturas 20,000 - -
M ono2 6 - A 1 B ridgeport C ount y C ourt house St at e Hwy 3 9 5 N ort h, B r idgeport 11,6 8 9 4 ,8 58 4 1.6M ont erey2 7- A 1 Salinas C ourt house- N ort h W ing 2 4 0 C hurch St . , Salinas 9 7,6 3 0 3 5,58 0 3 6 .42 7- A 2 Salinas C ourt house- East W ing 2 4 0 C hurch St . , Salinas 2 0 ,6 6 1 5,9 2 6 2 8 .72 7- C 1 M ont erey C ourt house 12 0 0 A guajit o R d ., M ont erey 6 5,3 3 4 2 8 ,9 0 4 4 4 .22 7- D 1 King C it y C ourt house 2 50 F ranciscan W ay, King C it y 12 ,16 3 6 ,50 8 53 .5N apa2 8 - B 1- ms Hist o r ical C ourt house 8 2 5 B rown St . , N apa 3 6 ,10 9 2 0 ,2 2 7 56 .0
28-B1-A Historical Courthouse, 1916 Building 825 Brown St., Napa 6,000 - - 28-B1-B Historical Courthouse, 1977 Addit ion 825 Brown St., Napa 14,109 - - 28-B1-E Historical Courthouse 825 Brown St., Napa 16,000 - -
N evada2 9 - A 1- ms C ourt house 2 0 1 C hurch St . , N evada C it y 2 3 ,4 6 3 5,6 4 9 2 4 .1
29-A1-A Courthouse, Old Jail 201 Church St., Nevada City 3,450 - - 29-A1-B Courthouse, Stairwell to Jail 201 Church St., Nevada City 960 - - 29-A1-C Courthouse, 1936 Addit ion 201 Church St., Nevada City 4,225 - - 29-A1-D Courthouse, 1936 Addit ion 201 Church St., Nevada City 1,648 - - 29-A1-E Courthouse 201 Church St., Nevada City 12,200 - - 29-A1-F Courthouse, Addit ion 201 Church St., Nevada City 980 - -
2 9 - A 2 A nnex 2 0 1 C hurch St . , N evada C it y 4 8 ,8 6 7 12 ,9 0 6 2 6 .42 9 - B 1- ms* Superio r C ourt in T ruckee 10 0 75 Lavone A ve, T ruckee 2 3 ,0 6 8 5,6 0 7 2 4 .3
29-B1-E Superior Court in Truckee 10075 Lavone Ave, Truckee 10,000 - -
Expanded Summary Matrix

Expanded Summary Matrix 57January 2004
C ount y/B ldg ID
N o . St o r ies
Y ear C omplet e
D esign C odeR et ro f it D at e
A SC E 3 1 B ldg . Type
Evaluat ion Level D SA R at ing
Ot her W ork Scope
Los A ngeles19 - R 1- ms 1 19 51 19 50 LA B C V aries T ier 2
19-R1-A 1 1951 1950 LABC RM 2 Tier 219-R1-B 1 1958 1950 LABC RM 2 Tier 219-R1-C 1 1958 1950 LABC S2A/RM 1 Tier 2
19 - S1 2 +PH 19 8 4 - R M 2 T ier 219 - T1 8 +3 B +PH 19 6 8 19 6 4 U B C S4 T ier 219 - U 1 2 19 74 - C 2 T ier 219 - V 1 5 19 9 0 19 8 5 U B C S1 T ier 219 - W 1 7+B +PH 19 6 9 19 6 4 U B C S4 T ier 219 - W 2 2 19 55 - R M 2 T ier 119 - X 1- ms 1+B 19 57 - R M 1 V aries
19-X1-E 1+B 1957 1956 UBC RM 1 Tier 219-X1-A 1+B 1967 1962 LABC RM 1 Tier 119-X1-B 1+B 1973 1968 LABC RM 1 Tier 1
19 - Y 1- ms 6 +B 19 58 - S4 T ier 119-Y1-E 6+B 1958 - S4 Tier 119-Y1-A 6+B 1967 - S1 Tier 1
19 - Z1 2 19 6 9 - C 2 D ScreeningM adera2 0 - A 1- ms 1 19 11 - V aries T ier 1
20-A1-A 1 1911 - URM Tier 120-A1-B 1 1911 - URM Tier 120-A1-C 1 1954 - Varies Tier 120-A1-D 1 1962 1958 UBC PC1 Tier 1
2 0 - B 1 1 19 6 5 - U R M A Tier 12 0 - C 1 1 19 75 19 73 U B C R M 1 T ier 22 0 - D 1 1 19 75 - V aries T ier 1M ariposa2 2 - A 1 2 18 54 - W 2 T ier 1M endocino2 3 - A 1- ms - 19 2 8 - S4 T ier 1
23-A1-A 4 1949 - S4 Tier 123-A1-E 3+B 1928 - S4 Tier 1
2 3 - B 1 1 19 9 1 19 8 5 U B C W 1A Screening2 3 - E1 2 19 8 8 19 8 5 U B C W 2 T ier 2M erced2 4 - A 1 1 19 50 - C 2 T ier 12 4 - D 1 1 19 8 0 - R M 1 T ier 1M odoc2 5- A 1- ms - 19 76 - V aries V aries
25-A1-A 1 1967 1964 UBC RM 1 Tier 125-A1-B 1 1990 - W1 Tier 125-A1-E 2+B 1914 - C2 Tier 2
M ono2 6 - A 1 2 18 8 0 - W 2 T ier 1M ont erey2 7- A 1 3 +B 19 6 7 - S1 T ier 12 7- A 2 2 +PH 19 3 7 - C 2 b T ier 12 7- C 1 1+B 19 6 8 - C 1 Screening2 7- D 1 1 19 6 8 19 70 U B C W 1A Tier 1N apa2 8 - B 1- ms - 18 78 - V aries T ier 1
28-B1-A 2 1916 Retrof it 1991 C2 Tier 128-B1-B 3 1977 1976 UBC RM 2 Tier 128-B1-E 2 1878 - URM Tier 1
N evada2 9 - A 1- ms - 18 50 's - V aries T ier 1
29-A1-A 3 1850's - URM Tier 129-A1-B 3 1930's - C2 Tier 129-A1-C 1 1936 - S4 Tier 129-A1-D 1+B 1936 - C2 Tier 129-A1-E 3 1850's - URM Tier 129-A1-F 1 1900's - C2A Tier 1
2 9 - A 2 3 +PH 19 6 8 - C 1 T ier 12 9 - B 1- ms* 2 19 75 - V aries T ier 1
29-B1-E 2 1975 - Varies Tier 1
Superior Courts of CaliforniaSeismic Assessment Program

Expanded Summary Matrix 58
Superior Courts of CaliforniaSeismic Assessment Program
January 2004
C ount y/B ldg ID B uild ing N ame B uild ing A ddress
B uild ing Gross A rea C ourt A rea
% C o urt o f Gross A rea
Orange3 0 - A 1- ms C ent ral Just ice C ent er 70 0 C ivic C ent er D r., Sant a A na 53 8 ,0 0 0 3 57,2 9 9 6 6 .4
30-A1-A Central Just ice Center 700 Civic Center Dr., Santa Ana 300,000 - - 30-A1-B Central Just ice Center 700 Civic Center Dr., Santa Ana 59,000 - - 30-A1-C Central Just ice Center 700 Civic Center Dr., Santa Ana 179,000 - -
3 0 - B 1 Lamoreaux Just ice C ent er 3 4 1 The C it y D r., Orange 2 4 8 ,6 76 12 5,2 2 0 50 .43 0 - C 1- ms N ort h Just ice C ent er 12 75 N . B erkeley A ve., Fullert on 13 7,52 5 10 3 ,8 9 9 75.5
30-C1-A North Just ice Center Addit ion 1275 N. Berkeley Ave., Fullerton 73,300 - - 30-C1-E North Just ice Center 1275 N. Berkeley Ave., Fullerton 64,225 - -
3 0 - C 2 N ort h Just ice C ent er A nnex 12 76 N . B erkeley A ve., Fullert on 3 4 ,6 0 0 2 7,6 8 0 8 0 .03 0 - D 1- ms W est Just ice C ent er 8 14 1 13 t h St . , W est minst er 19 0 ,0 0 0 12 9 ,0 78 6 7.9
30-D1-A West Just ice Center 8141 13th St., Westminster 115,150 - - 30-D1-B West Just ice Center 8141 13th St., Westminster 32,000 - - 30-D1-C West Just ice Center 8141 13th St., Westminster 18,820 - - 30-D1-D West Just ice Center 8141 13th St., Westminster 5,210 - - 30-D1-E West Just ice Center 8141 13th St., Westminster 18,820 - -
3 0 - E1- ms Harbor Just ice C ent er 4 6 0 1 Jamboree, N ewport B each 10 6 ,59 1 59 ,4 16 55.730-E1-A Harbor Just ice Center, Phase II 4601 Jamboree, Newport Beach 44,060 - - 30-E1-E Harbor Just ice Center, Phase I 4601 Jamboree, Newport Beach 62,530 - -
3 0 - F1 Sout h Just ice C ent er 3 0 14 3 C rown V alley Pkwy., Laguna N ig 3 2 ,8 50 2 2 ,8 71 6 9 .6Placer3 1- A 1 Hist o r ic C ourt house 10 1 M ap le A ve, A uburn 3 4 ,16 4 15,2 8 1 4 4 .73 1- B 1- ms Superio r C ourt D eW it t C ent er 1154 2 'B ' A ve, A uburn 3 3 ,0 3 0 2 4 ,2 4 0 73 .4
31-B1-A Superior Court DeWitt Center 11542 'B' Ave, Auburn 16,515 - - 31-B1-E Superior Court DeWitt Center 11542 'B' Ave, Auburn 16,515 - -
3 1- C 1 Superio r C ourt in R osevil le 3 0 0 Taylo r St . , R osevil le 8 ,8 9 1 6 ,9 8 6 78 .63 1- E1 Superio r C ourt in C o lf ax 10 C ulver St , C o lf ax 1,78 5 1,3 4 9 75.6Plumas3 2 - A 1 C ourt house 52 0 M ain St . , Quincy 3 6 ,18 7 7,0 4 6 19 .5R iverside3 3 - A 2 19 0 3 / 3 3 C ourt house Just ice C ent er area., R iverside 13 8 ,551 4 4 ,3 52 3 2 .03 3 - A 3 Hall o f Just ice 4 10 0 M ain St . , R iverside 14 4 ,8 55 9 8 ,6 3 9 6 8 .13 3 - C 2 A nnex Just ice C ent er ( Ind io ) 4 6 - 2 0 0 Oasis St . , Ind io 4 0 ,715 19 ,0 52 4 6 .83 3 - E1 Palm Springs C ourt s 3 2 55 E. Tahquit e C anyon W ay, Palm Sp 51,3 3 6 18 ,54 3 3 6 .13 3 - F1 Hemet 8 8 0 N . St at e St . , Hemet 3 1,72 0 2 2 ,0 17 6 9 .43 3 - G1- ms B anning I- 55 E. Hays St . , B anning 3 5,0 0 0 2 3 ,50 2 6 7.1
33-G1-A Banning, Addit ion I-55 E. Hays St., Banning 22,000 - - 33-G1-E Banning, Original I-55 E. Hays St., Banning 13,000 - -
3 3 - H1 Temecula 4 10 0 2 C ount y C ent er D r., Temecula 12 ,557 5,772 4 6 .03 3 - J1- ms C orona 50 5 S. B uena V ist a, C orona 4 9 ,770 17,4 72 3 5.1
33-J1-A Corona 505 S. Buena Vista, Corona 40,300 - - 33-J1-B Corona 505 S. Buena Vista, Corona 9,470 - -
3 3 - K1 Perr is B ldg . A 2 2 7 N ort h " D " St . , Perr is 18 ,4 0 7 6 ,3 79 3 4 .73 3 - K2 Perr is B ldg . B 2 2 7 N ort h " D " St . , Perr is 12 ,6 9 9 10 ,76 2 8 4 .73 3 - L1 Lake Elsinore C ourt s/ Sherif f 117 S. Langst af f , Lake Elsinore 3 ,50 0 2 ,53 3 72 .43 3 - N 1 Juvenile Just ice C ent er 9 9 9 1 C ount ry Farm R d ., R iverside 6 ,6 14 1,0 0 0 15.1Sacrament o3 4 - A 1 Sacrament o Superio r C ourt 72 0 N int h St . , Sacrament o 2 8 8 ,8 9 6 174 ,2 3 2 6 0 .3San B enit o3 5- A 1 San B enit o C ourt house 4 4 0 F if t h St . , Ho ll ist er 2 6 ,3 9 6 8 ,4 6 6 3 2 .1San B ernard ino3 6 - A 1 C ent ral C ourt house 3 51 N . A rrowhead A ve, San B ernad ino 8 9 ,3 55 6 3 ,555 71.13 6 - A 2 C ent ral C ourt house - A nnex 3 51 N . A rrowhead A ve, San B ernad ino 9 4 ,751 54 ,8 8 4 57.93 6 - B 1 Juvenile C ourt 9 0 0 E. Gilbert St . , San B ernad ino 8 ,6 2 6 5,4 2 3 6 2 .93 6 - C 1 Font ana C ourt 1778 0 A rrow Hwy., Font ana 3 2 ,6 3 7 2 0 ,0 3 9 6 1.43 6 - D 1 R ed lands C ourt 2 16 B rookside A ve., R ed lands 11,2 4 8 6 ,19 3 55.13 6 - E1 Joshua T ree C ourt 6 52 7 W hit e Feat her R d ., Joshua T ree 3 6 ,2 19 2 1,9 78 6 0 .73 6 - F1 R ancho C ucamonga C ourt house 8 3 0 3 Haven A ve., R ancho C ucamonga 2 4 2 ,13 8 14 5,0 54 59 .93 6 - G1 C hino C ourt 13 2 6 0 C ent ral A ve., C hino 3 6 ,54 2 18 ,79 3 51.43 6 - J1 B arst ow C ourt 2 3 5 E. M ount ain V iew A ve., B arst ow 3 4 ,8 4 0 2 2 ,0 4 6 6 3 .33 6 - K1 N eed les C ourt 1111 B ailey St . , N eed les 6 ,9 74 3 ,9 71 56 .93 6 - L1- ms* V ict o rvil le C ourt 14 4 55 C ivic D r., V ict o rvil le 9 7,9 3 8 51,3 8 6 52 .5
36-L1-A 14455 Civic Dr., Victorville 40,000 - -
Expanded Summary Matrix
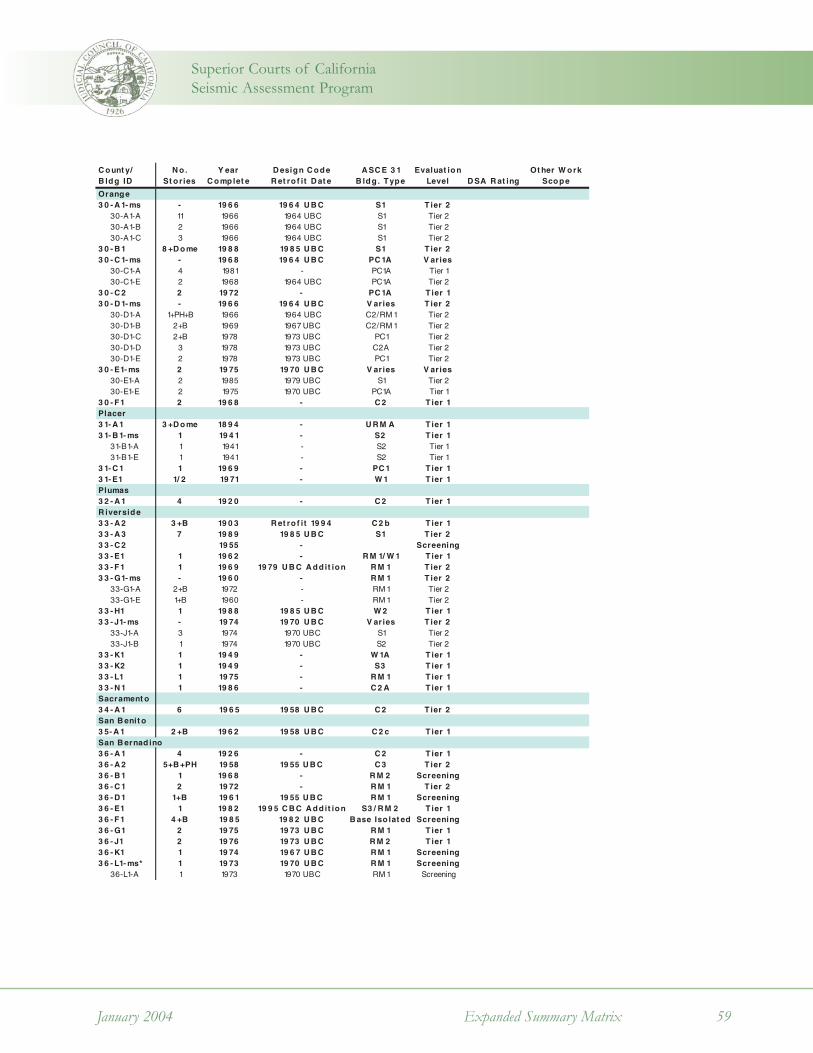
Expanded Summary Matrix 59January 2004
C ount y/B ldg ID
N o . St o r ies
Y ear C omplet e
D esign C odeR et ro f it D at e
A SC E 3 1 B ldg . Type
Evaluat ion Level D SA R at ing
Ot her W ork Scope
Orange3 0 - A 1- ms - 19 6 6 19 6 4 U B C S1 T ier 2
30-A1-A 11 1966 1964 UBC S1 Tier 230-A1-B 2 1966 1964 UBC S1 Tier 230-A1-C 3 1966 1964 UBC S1 Tier 2
3 0 - B 1 8 +D ome 19 8 8 19 8 5 U B C S1 T ier 23 0 - C 1- ms - 19 6 8 19 6 4 U B C PC 1A V aries
30-C1-A 4 1981 - PC1A Tier 130-C1-E 2 1968 1964 UBC PC1A Tier 2
3 0 - C 2 2 19 72 - PC 1A T ier 13 0 - D 1- ms - 19 6 6 19 6 4 U B C V aries T ier 2
30-D1-A 1+PH+B 1966 1964 UBC C2/RM 1 Tier 230-D1-B 2+B 1969 1967 UBC C2/RM 1 Tier 230-D1-C 2+B 1978 1973 UBC PC1 Tier 230-D1-D 3 1978 1973 UBC C2A Tier 230-D1-E 2 1978 1973 UBC PC1 Tier 2
3 0 - E1- ms 2 19 75 19 70 U B C V aries V aries30-E1-A 2 1985 1979 UBC S1 Tier 230-E1-E 2 1975 1970 UBC PC1A Tier 1
3 0 - F1 2 19 6 8 - C 2 T ier 1Placer3 1- A 1 3 +D ome 18 9 4 - U R M A Tier 13 1- B 1- ms 1 19 4 1 - S2 T ier 1
31-B1-A 1 1941 - S2 Tier 131-B1-E 1 1941 - S2 Tier 1
3 1- C 1 1 19 6 9 - PC 1 T ier 13 1- E1 1/ 2 19 71 - W 1 T ier 1Plumas3 2 - A 1 4 19 2 0 - C 2 T ier 1R iverside3 3 - A 2 3 +B 19 0 3 R et ro f it 19 9 4 C 2 b T ier 13 3 - A 3 7 19 8 9 19 8 5 U B C S1 T ier 23 3 - C 2 19 55 - Screening3 3 - E1 1 19 6 2 - R M 1/ W 1 T ier 13 3 - F1 1 19 6 9 19 79 U B C A dd it ion R M 1 T ier 23 3 - G1- ms - 19 6 0 - R M 1 T ier 2
33-G1-A 2+B 1972 - RM 1 Tier 233-G1-E 1+B 1960 - RM 1 Tier 2
3 3 - H1 1 19 8 8 19 8 5 U B C W 2 T ier 13 3 - J1- ms - 19 74 19 70 U B C V aries T ier 2
33-J1-A 3 1974 1970 UBC S1 Tier 233-J1-B 1 1974 1970 UBC S2 Tier 2
3 3 - K1 1 19 4 9 - W 1A T ier 13 3 - K2 1 19 4 9 - S3 T ier 13 3 - L1 1 19 75 - R M 1 T ier 13 3 - N 1 1 19 8 6 - C 2 A T ier 1Sacrament o3 4 - A 1 6 19 6 5 19 58 U B C C 2 T ier 2San B enit o3 5- A 1 2 +B 19 6 2 19 58 U B C C 2 c T ier 1San B ernad ino3 6 - A 1 4 19 2 6 - C 2 T ier 13 6 - A 2 5+B +PH 19 58 19 55 U B C C 3 T ier 23 6 - B 1 1 19 6 8 - R M 2 Screening3 6 - C 1 2 19 72 - R M 1 T ier 23 6 - D 1 1+B 19 6 1 19 55 U B C R M 1 Screening3 6 - E1 1 19 8 2 19 9 5 C B C A dd it ion S3 / R M 2 T ier 13 6 - F1 4 +B 19 8 5 19 8 2 U B C B ase Iso lat ed Screening3 6 - G1 2 19 75 19 73 U B C R M 1 T ier 13 6 - J1 2 19 76 19 73 U B C R M 2 T ier 13 6 - K1 1 19 74 19 6 7 U B C R M 1 Screening3 6 - L1- ms* 1 19 73 19 70 U B C R M 1 Screening
36-L1-A 1 1973 1970 UBC RM 1 Screening
Superior Courts of CaliforniaSeismic Assessment Program
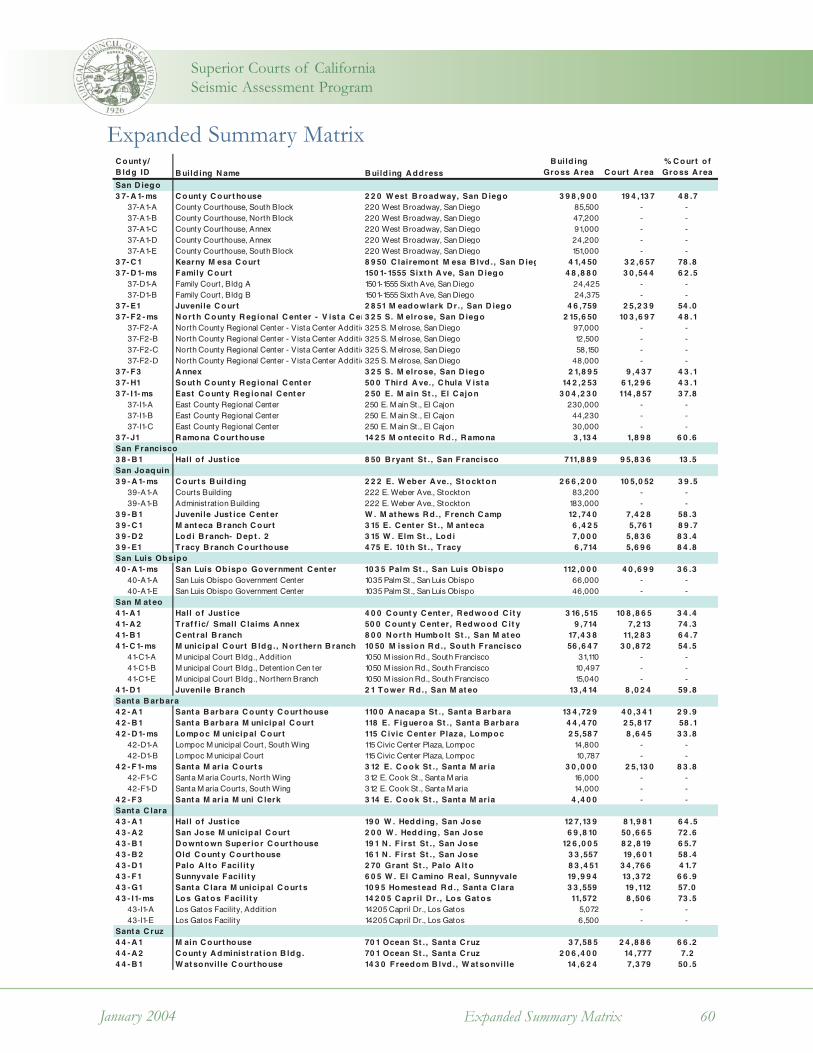
Expanded Summary Matrix 60
Superior Courts of CaliforniaSeismic Assessment Program
January 2004
C ount y/B ldg ID B uild ing N ame B uild ing A ddress
B uild ing Gross A rea C ourt A rea
% C o urt o f Gross A rea
San D iego3 7- A 1- ms C ount y C ourt house 2 2 0 W est B roadway, San D iego 3 9 8 ,9 0 0 19 4 ,13 7 4 8 .7
37-A1-A County Courthouse, South Block 220 West Broadway, San Diego 85,500 - - 37-A1-B County Courthouse, North Block 220 West Broadway, San Diego 47,200 - - 37-A1-C County Courthouse, Annex 220 West Broadway, San Diego 91,000 - - 37-A1-D County Courthouse, Annex 220 West Broadway, San Diego 24,200 - - 37-A1-E County Courthouse, South Block 220 West Broadway, San Diego 151,000 - -
3 7- C 1 Kearny M esa C ourt 8 9 50 C lairemont M esa B lvd ., San D ieg 4 1,4 50 3 2 ,6 57 78 .83 7- D 1- ms Family C ourt 150 1- 1555 Sixt h A ve, San D iego 4 8 ,8 8 0 3 0 ,54 4 6 2 .5
37-D1-A Family Court , Bldg A 1501-1555 Sixth Ave, San Diego 24,425 - - 37-D1-B Family Court , Bldg B 1501-1555 Sixth Ave, San Diego 24,375 - -
3 7- E1 Juvenile C ourt 2 8 51 M eadowlark D r., San D iego 4 6 ,759 2 5,2 3 9 54 .03 7- F2 - ms N ort h C ount y R eg ional C ent er - V ist a C en3 2 5 S. M elrose, San D iego 2 15,6 50 10 3 ,6 9 7 4 8 .1
37-F2-A North County Regional Center - Vista Center Addit io325 S. M elrose, San Diego 97,000 - - 37-F2-B North County Regional Center - Vista Center Addit io325 S. M elrose, San Diego 12,500 - - 37-F2-C North County Regional Center - Vista Center Addit io325 S. M elrose, San Diego 58,150 - - 37-F2-D North County Regional Center - Vista Center Addit io325 S. M elrose, San Diego 48,000 - -
3 7- F3 A nnex 3 2 5 S. M elrose, San D iego 2 1,8 9 5 9 ,4 3 7 4 3 .13 7- H1 Sout h C ount y R eg ional C ent er 50 0 Third A ve., C hula V ist a 14 2 ,2 53 6 1,2 9 6 4 3 .13 7- I1- ms East C ount y R eg ional C ent er 2 50 E. M ain St . , El C ajon 3 0 4 ,2 3 0 114 ,8 57 3 7.8
37-I1-A East County Regional Center 250 E. M ain St., El Cajon 230,000 - - 37-I1-B East County Regional Center 250 E. M ain St., El Cajon 44,230 - - 37-I1-C East County Regional Center 250 E. M ain St., El Cajon 30,000 - -
3 7- J1 R amona C ourt house 14 2 5 M ont ecit o R d ., R amona 3 ,13 4 1,8 9 8 6 0 .6San F rancisco3 8 - B 1 Hall o f Just ice 8 50 B ryant St . , San F rancisco 711,8 8 9 9 5,8 3 6 13 .5San Joaquin3 9 - A 1- ms C ourt s B uild ing 2 2 2 E. W eber A ve., St ockt on 2 6 6 ,2 0 0 10 5,0 52 3 9 .5
39-A1-A Courts Building 222 E. Weber Ave., Stockton 83,200 - - 39-A1-B Administrat ion Building 222 E. Weber Ave., Stockton 183,000 - -
3 9 - B 1 Juvenile Just ice C ent er W . M at hews R d ., F rench C amp 12 ,74 0 7,4 2 8 58 .33 9 - C 1 M ant eca B ranch C ourt 3 15 E. C ent er St . , M ant eca 6 ,4 2 5 5,76 1 8 9 .73 9 - D 2 Lod i B ranch- D ep t . 2 3 15 W . Elm St . , Lod i 7,0 0 0 5,8 3 6 8 3 .43 9 - E1 Tracy B ranch C ourt house 4 75 E. 10 t h St . , T racy 6 ,714 5,6 9 6 8 4 .8San Luis Obsipo4 0 - A 1- ms San Luis Ob ispo Government C ent er 10 3 5 Palm St . , San Luis Ob ispo 112 ,0 0 0 4 0 ,6 9 9 3 6 .3
40-A1-A San Luis Obispo Government Center 1035 Palm St., San Luis Obispo 66,000 - - 40-A1-E San Luis Obispo Government Center 1035 Palm St., San Luis Obispo 46,000 - -
San M at eo4 1- A 1 Hall o f Just ice 4 0 0 C ount y C ent er , R edwood C it y 3 16 ,515 10 8 ,8 6 5 3 4 .44 1- A 2 Traf f ic/ Small C laims A nnex 50 0 C ount y C ent er , R edwood C it y 9 ,714 7,2 13 74 .34 1- B 1 C ent ral B ranch 8 0 0 N ort h Humbo lt St . , San M at eo 17,4 3 8 11,2 8 3 6 4 .74 1- C 1- ms M unicipal C ourt B ldg ., N ort hern B ranch 10 50 M ission R d ., Sout h F rancisco 56 ,6 4 7 3 0 ,8 72 54 .5
41-C1-A M unicipal Court Bldg., Addit ion 1050 M ission Rd., South Francisco 31,110 - - 41-C1-B M unicipal Court Bldg., Detent ion Cen ter 1050 M ission Rd., South Francisco 10,497 - - 41-C1-E M unicipal Court Bldg., Northern Branch 1050 M ission Rd., South Francisco 15,040 - -
4 1- D 1 Juvenile B ranch 2 1 Tower R d ., San M at eo 13 ,4 14 8 ,0 2 4 59 .8Sant a B arbara4 2 - A 1 Sant a B arbara C ount y C ourt house 110 0 A nacapa St . , Sant a B arbara 13 4 ,72 9 4 0 ,3 4 1 2 9 .94 2 - B 1 Sant a B arbara M unicipal C ourt 118 E. F igueroa St . , Sant a B arbara 4 4 ,4 70 2 5,8 17 58 .14 2 - D 1- ms Lompoc M unicipal C ourt 115 C ivic C ent er Plaza, Lompoc 2 5,58 7 8 ,6 4 5 3 3 .8
42-D1-A Lompoc M unicipal Court , South Wing 115 Civic Center Plaza, Lompoc 14,800 - - 42-D1-B Lompoc M unicipal Court 115 Civic Center Plaza, Lompoc 10,787 - -
4 2 - F1- ms Sant a M aria C ourt s 3 12 E. C ook St . , Sant a M aria 3 0 ,0 0 0 2 5,13 0 8 3 .842-F1-C Santa M aria Courts, North Wing 312 E. Cook St., Santa M aria 16,000 - - 42-F1-D Santa M aria Courts, South Wing 312 E. Cook St., Santa M aria 14,000 - -
4 2 - F3 Sant a M aria M uni C lerk 3 14 E. C ook St . , Sant a M aria 4 ,4 0 0 - - Sant a C lara4 3 - A 1 Hall o f Just ice 19 0 W . Hedd ing , San Jose 12 7,13 9 8 1,9 8 1 6 4 .54 3 - A 2 San Jose M unicipal C ourt 2 0 0 W . Hedd ing , San Jose 6 9 ,8 10 50 ,6 6 5 72 .64 3 - B 1 D ownt own Superio r C ourt house 19 1 N . F irst St . , San Jose 12 6 ,0 0 5 8 2 ,8 19 6 5.74 3 - B 2 Old C ount y C ourt house 16 1 N . F irst St . , San Jose 3 3 ,557 19 ,6 0 1 58 .44 3 - D 1 Palo A lt o Facil i t y 2 70 Grant St . , Palo A lt o 8 3 ,4 51 3 4 ,76 6 4 1.74 3 - F1 Sunnyvale Facil i t y 6 0 5 W . El C amino R eal, Sunnyvale 19 ,9 9 4 13 ,3 72 6 6 .94 3 - G1 Sant a C lara M unicipal C ourt s 10 9 5 Homest ead R d ., Sant a C lara 3 3 ,559 19 ,112 57.04 3 - I1- ms Los Gat os Facil i t y 14 2 0 5 C april D r . , Los Gat os 11,572 8 ,50 6 73 .5
43-I1-A Los Gatos Facility, Addit ion 14205 Capril Dr., Los Gatos 5,072 - - 43-I1-E Los Gatos Facility 14205 Capril Dr., Los Gatos 6,500 - -
Sant a C ruz4 4 - A 1 M ain C ourt house 70 1 Ocean St . , Sant a C ruz 3 7,58 5 2 4 ,8 8 6 6 6 .24 4 - A 2 C ount y A dminist rat ion B ldg . 70 1 Ocean St . , Sant a C ruz 2 0 6 ,4 0 0 14 ,777 7.24 4 - B 1 W at sonvil le C ourt house 14 3 0 F reedom B lvd ., W at sonvil le 14 ,6 2 4 7,3 79 50 .5
Expanded Summary Matrix

Expanded Summary Matrix 61January 2004
C ount y/B ldg ID
N o . St o r ies
Y ear C omplet e
D esign C odeR et ro f it D at e
A SC E 3 1 B ldg . Type
Evaluat ion Level D SA R at ing
Ot her W ork Scope
San D iego3 7- A 1- ms - 19 6 1 19 55 U B C S4 V aries
37-A1-A 8+B 1957 1955 UBC S4 Tier 237-A1-B 4+B 1957 1955 UBC S4 Tier 237-A1-C 6 1962 - S4 Tier 137-A1-D 6 1962 - S4 Tier 137-A1-E 8+B 1957 1955 UBC S4 Tier 2
3 7- C 1 1+B 19 6 0 - R M 1 T ier 13 7- D 1- ms 1/ 2 19 55 - S4 / C 2 T ier 1
37-D1-A 1 1955 - S4 Tier 137-D1-B 2 1955 - C2 Tier 1
3 7- E1 2 19 6 8 19 73 U B C R M 1 Screening3 7- F2 - ms 1+B 19 72 - S1 T ier 1
37-F2-A 1+B+PH 1972 - S2 Tier 137-F2-B 1+B+PH 1972 - S2 Tier 137-F2-C 1+B+PH 1972 - S2 Tier 137-F2-D 1/2 1986 1982 UBC C2 Tier 1
3 7- F3 1 19 73 19 6 0 U B C W 2 T ier 13 7- H1 3 19 8 1 19 76 U B C S1/ C 2 T ier 23 7- I1- ms - 19 8 3 - V aries T ier 2
37-I1-A 10 1983 - S1 Tier 237-I1-B 5 1983 - S2/S4 Tier 237-I1-C 2 1983 - S2/S4 Tier 2
3 7- J1 1 19 8 0 19 55 U B C W 1A Tier 1San F rancisco3 8 - B 1 9 19 58 - C 2 T ier 1San Joaquin3 9 - A 1- ms 3 / 7 19 6 3 19 58 U B C S2 T ier 1
39-A1-A 3 1963 1958 UBC S2 Tier 139-A1-B 7 1963 1958 UBC S2 Tier 1
3 9 - B 1 1 19 8 2 19 79 U B C R M 1 T ier 13 9 - C 1 1 19 6 5 19 8 8 U B C A dd it ion R M 1 T ier 13 9 - D 2 1 19 6 8 - R M 1 T ier 13 9 - E1 1 19 6 8 - R M 1 T ier 1San Luis Obsipo4 0 - A 1- ms 3 19 8 3 19 6 1 U B C V aries V aries
40-A1-A 3 1983 1979 UBC S2/S2A Tier 240-A1-E 3 1963 1961 UBC C2/RM 2 Tier 1
San M at eo4 1- A 1 8 19 56 - S1 T ier 24 1- A 2 1 19 6 0 - C 2 A Screening4 1- B 1 1+B 19 6 1 - R M 1/ W 2 T ier 14 1- C 1- ms - 19 6 1 - R M 1 T ier 1
41-C1-A 1+B 1970 - RM 1 Tier 141-C1-B 2 1981 1979 UBC RM 1 Tier 141-C1-E 1+B 1961 - RM 1 Tier 1
4 1- D 1 1+B 19 4 3 - R M 1 T ier 1Sant a B arbara4 2 - A 1 2 19 2 9 - C 2 T ier 14 2 - B 1 2 19 53 - C 2 T ier 14 2 - D 1- ms - 19 56 - W 2 T ier 1
42-D1-A 1 1956 1995 CBC Addit ion W2 Tier 142-D1-B 2 - - W2 Tier 1
4 2 - F1- ms 2 19 70 - W 1A T ier 242-F1-C 2 1954 - W1A Tier 242-F1-D 2 1963 1961 UBC W1A Tier 2
4 2 - F3 1 19 54 - W 1 T ier 1Sant a C lara4 3 - A 1 6 19 9 3 19 8 5 U B C S1/ S2 T ier 24 3 - A 2 4 19 6 0 19 52 U B C C 2 T ier 24 3 - B 1 5+B +PH 19 6 3 19 6 1 U B C C 2 b T ier 14 3 - B 2 3 +B 18 6 6 R et ro f it 19 8 8 S4 b Screening4 3 - D 1 4 +B 19 6 0 - C 2 T ier 24 3 - F1 1 19 6 7 - W 2 T ier 14 3 - G1 2 +B 19 76 19 73 U B C S2 T ier 24 3 - I1- ms 1 19 6 0 - V aries T ier 1
43-I1-A 1 1975 1973 UBC W1 Tier 143-I1-E 1 1960 - RM 1 Tier 1
Sant a C ruz4 4 - A 1 1 19 6 5 19 6 1 U B C C 1a T ier 24 4 - A 2 5+B +PH 19 6 5 19 6 1 U B C PC 2 T ier 24 4 - B 1 1 19 6 5 - W 2 T ier 1
Superior Courts of CaliforniaSeismic Assessment Program

Expanded Summary Matrix 62
Superior Courts of CaliforniaSeismic Assessment Program
January 2004
C ount y/B ldg ID B uild ing N ame B uild ing A ddress
B uild ing Gross A rea C ourt A rea
% C o urt o f Gross A rea
Shast a4 5- A 1 M ain C ourt house 150 0 C ourt St . , R edd ing 8 6 ,4 2 8 2 9 ,16 0 3 3 .74 5- A 7 M ain C ourt house A nnex 14 51 C ourt St . , R edd ing 3 7,2 70 - - 4 5- B 1 Shast a C ount y Superio r C ourt / Sherif f ' s S 2 0 50 9 - C Shast a St . , B urney 4 ,8 6 7 1,6 6 3 3 4 .2Sierra4 6 - A 1- ms C ourt house/ Sherif f St at ion- Jail 10 0 C ourt house Square, D ownievil le 19 ,18 1 4 ,8 53 2 5.3
46-A1-A Courthouse/Sherif f Stat ion-Jail, Stairwell 100 Courthouse Square, Downieville - - - 46-A1-E Courthouse/Sherif f Stat ion-Jail 100 Courthouse Square, Downieville 19,181 - -
Siskiyou4 7- A 1- ms Siskiyou C ount y C ourt house, 19 0 8 B uild in3 11 Fourt h St . , Y reka 51,53 3 11,9 9 2 2 3 .3
47-A1-A Siskiyou County Courthouse, 1952 Building 311 Fourth St., Yreka 28,350 - - 47-A1-E Siskiyou County Courthouse, 1908 Building 311 Fourth St., Yreka 7,906 - -
4 7- B 1 D orr is 3 2 4 N . Pine St . , D orr is 2 ,58 5 1,2 11 4 6 .8So lano4 8 - A 1- ms Hall o f Just ice 6 0 0 U nion A ve., Fair f ield 13 9 ,74 0 6 1,4 76 4 4 .0
48-A1-A Hall of Just ice, 1973 Addit ion 600 Union Ave., Fairf ield 74,740 - - 48-A1-E Hall of Just ice 600 Union Ave., Fairf ield 65,000 - -
4 8 - A 2 Law and Just ice C ent er - Fair f ield 53 0 U nion A ve., Fair f ield 54 ,0 0 0 2 2 ,0 8 7 4 0 .94 8 - B 1- ms* Hall o f Just ice 3 2 1 Tuo lumne St . V allejo 6 1,8 4 0 54 ,3 13 8 7.8
48-B1-A Hall of Just ice, 1974 Addit ion 321 Tuolumne St. Vallejo 30,400 - - 48-B1-E Hall of Just ice 321 Tuolumne St. Vallejo 24,000 - -
Sonoma4 9 - A 1- ms* Hall o f Just ice 6 0 0 A dminist rat ion D r., Sant a R osa 18 0 ,18 8 6 7,50 8 3 7.5
49-A1-A Hall of Just ice 600 Administrat ion Dr., Santa Rosa 180,188 67,508 37.5St anislaus50 - A 1 M odest o M ain C ourt house 110 0 I St . , M odest o 10 8 ,8 2 4 6 4 ,2 78 59 .150 - B 1 M odest o Juvenile court . 2 2 15 B lue Gum, M odest o 9 ,2 0 0 4 ,8 4 2 52 .650 - C 1 C eres M unicipal C ourt . 2 74 4 Second St . , C eres 2 ,9 8 5 2 ,2 4 9 75.350 - D 1 Turlock M unicipal C ourt . 3 0 0 St arr A ve., Turlock 4 ,73 5 3 ,12 3 6 6 .0Sut t er51- A 1- ms C ourt house W est 4 4 6 Second St . , Y uba C it y 2 0 ,8 15 14 ,4 9 3 6 9 .6
51-A1-A Courthouse West, West Annex 446 Second St., Yuba City 6,272 - - 51-A1-E Courthouse West 446 Second St., Yuba City 14,543 - -
51- A 2 C ourt house East 4 6 3 Second St . , Y uba C it y 2 8 ,3 6 0 6 ,0 79 2 1.4Tehama52 - A 1 Hist o r ic C ourt house 6 3 3 W ashing t on St . , R ed B luf f 2 3 ,3 71 8 ,571 3 6 .752 - A 3 A nnex N o . 2 6 3 3 W ashing t on St . , R ed B luf f 15,3 70 10 ,59 5 6 8 .952 - B 1 Superio r C ourt at C orning 72 0 Hoag St . , C orning 4 ,50 0 3 ,9 0 0 8 6 .7Trinit y53 - A 1- ms Trinit y C ount y C ourt house 10 1 C ourt St . , W eavervil le 4 2 ,78 9 9 ,4 9 3 2 2 .2
53-A1-A Trinity County Courthouse, 1950's Addit ion 101 Court St., Weaverville 16,924 - - 53-A1-B Trinity County Courthouse, West Addit ion 101 Court St., Weaverville 14,589 - - 53-A1-E Trinity County Courthouse 101 Court St., Weaverville 11,276 - -
Tulare54 - A 1- ms V isalia Superio r C ourt 2 3 0 0 W . B urrel A ve., V isalia 18 5,111 6 0 ,0 4 8 3 2 .4
54-A1-A Visalia Superior Court 2300 W. Burrel Ave., Visalia 185,111 - - 54-A1-A1 Visalia Superior Court , East Wing 2300 W. Burrel Ave., Visalia 20,000 - - 54-A1-B Visalia Superior Court , Addit ion 2300 W. Burrel Ave., Visalia 58,000 - -
54 - B 1- ms Tulare- Pixley M unicipal C ourt 4 2 5 E. Kern St . , Tulare 11,6 4 1 7,3 0 0 6 2 .754-B1-A Tulare-Pixley M unicipal Court 425 E. Kern St., Tulare - - - 54-B1-E Tulare-Pixley M unicipal Court 425 E. Kern St., Tulare 11,641 - -
54 - C 1- ms Port ervil le Government C ent er 8 7 E. M ort on A ve., Port ervil le 18 ,9 3 6 8 ,9 75 4 7.454-C1-A Porterville Government Center 87 E. M orton Ave., Porterville 8,936 - - 54-C1-B Porterville Government Center, Addit ion 87 E. M orton Ave., Porterville 10,000 - -
Tuo lomne55- A 1 Hist o r ic C ourt house 4 1 W . Y aney, Sonora 2 3 ,12 0 11,10 8 4 8 .0V ent ura56 - A 1- ms Hall o f Just ice 8 0 0 S. V ict o r ia A ve., V ent ura 3 50 ,0 57 16 5,56 2 4 7.3
56-A1-A Hall of Just ice, Second Wing 800 S. Victoria Ave., Ventura 150,057 - - 56-A1-B Hall of Just ice, M ain Wing 800 S. Victoria Ave., Ventura 200,000 - -
56 - B 1 East C ount y C ourt house 3 8 55 F A lamo St . , Simi V alley 8 4 ,2 52 3 9 ,0 9 6 4 6 .4Y o lo57- A 1 C ourt house 72 5 C ourt St . , W ood land 4 5,16 1 2 8 ,2 4 2 6 2 .557- A 2 Old Jail 2 13 Third St reet , W ood land 2 1,6 2 5 6 ,710 3 1.0Y uba58 - A 1- ms* Y uba C ount y C ourt house 2 15 F if t h St . , M arysvil le 14 2 ,4 6 0 2 9 ,6 9 4 2 0 .8
58-A1-E Yuba County Courthouse 215 Fif th St., M arysville 97,460 - -
Expanded Summary Matrix

Expanded Summary Matrix 63January 2004
C ount y/B ldg ID
N o . St o r ies
Y ear C omplet e
D esign C odeR et ro f it D at e
A SC E 3 1 B ldg . Type
Evaluat ion Level D SA R at ing
Ot her W ork Scope
Shast a4 5- A 1 4 19 56 19 56 U B C C 2 T ier 24 5- A 7 3 19 6 5 19 6 4 U B C S4 T ier 24 5- B 1 1 19 6 4 19 6 1 U B C W 1 T ier 1Sierra4 6 - A 1- ms - 19 50 - C 2 A V aries
46-A1-A 2 1993 - RM 2 Tier 146-A1-E 2+B 1950 - C2A Tier 2
Siskiyou4 7- A 1- ms 2 19 0 8 - S5 T ier 1
47-A1-A 2 1952 - C2 Tier 147-A1-E 2 1908 - S5 Tier 1
4 7- B 1 1 19 74 - W 1 T ier 1So lano4 8 - A 1- ms 3 19 2 3 - V aries V aries
48-A1-A 3 1973 - C2 Tier 248-A1-E 3 1923 - C2A Tier 1
4 8 - A 2 5 19 8 8 19 8 2 U B C C 2 b Screening4 8 - B 1- ms* - 19 55 - V aries V aries
48-B1-A 1 1974 - C2 Tier 248-B1-E 1/2 1955 - C2A Tier 1
Sonoma4 9 - A 1- ms* 2 19 6 5 19 6 1 U B C C 2 T ier 2
49-A1-A 2 1965 1961 UBC C2 Tier 2St anislaus50 - A 1 2 +B 19 3 8 - C 2 T ier 150 - B 1 1 19 76 - R M 1/ R M 2 T ier 150 - C 1 1 19 6 9 - R M 1 T ier 150 - D 1 1 19 75 - W 2 T ier 1Sut t er51- A 1- ms - 18 9 9 - V aries V aries
51-A1-A 1 1961 - C2 Tier 251-A1-E 2+B 1899 - URM Tier 1
51- A 2 1/ 2 19 53 - C 2 T ier 1Tehama52 - A 1 2 19 2 0 - U R M A Screening52 - A 3 1/ 2 19 8 8 19 8 2 U B C W 2 Screening52 - B 1 1 19 79 19 76 U B C S3 T ier 1T r init y53 - A 1- ms - 18 57 - V aries T ier 1
53-A1-A 2+B 1950 - RM 2 Tier 153-A1-B 1+B 1977 1976 UBC RM 1 Tier 153-A1-E 2+B 1857 - URM Tier 1
Tulare54 - A 1- ms 3 +PH 19 55 - S1 T ier 2
54-A1-A 3+PH 1955 - S1 Tier 254-A1-A1 1+B 1955 - S1 Tier 254-A1-B 3+B 1988 1985 UBC S1 Tier 2
54 - B 1- ms 1 19 59 19 73 U B C V aries V aries54-B1-A 1 1985 1985 UBC RM 1 Screening54-B1-E 1 1976 1973 UBC PC1 Tier 1
54 - C 1- ms 1/ 2 19 6 0 19 58 U B C R M 1/ R M 2 T ier 154-C1-A 1/2 1960 1958 UBC RM 1/RM 2 Tier 154-C1-B 2 1975 1973 UBC RM 1/RM 2 Tier 1
Tuo lomne55- A 1 3 18 9 8 - U R M A Tier 1V ent ura56 - A 1- ms 3 / 4 19 75 19 73 U B C S2 T ier 2
56-A1-A 3+B 1975 1973 UBC S2 Tier 256-A1-B 4+PH+B 1975 1973 UBC S2 Tier 2
56 - B 1 2 19 8 9 - PC 1 T ier 1Y o lo57- A 1 3 / 4 19 17 - C 2 T ier 157- A 2 1 19 6 9 - C 2 b ScreeningY uba58 - A 1- ms* 3 +B 19 6 0 19 58 U B C S4 T ier 2
58-A1-E 3+B 1960 1958 UBC S4 Tier 2
Superior Courts of CaliforniaSeismic Assessment Program


Superior Courts of CaliforniaSeismic Assessment Program
January 2004
References
American Society of Civil Engineers (ASCE), 1998, Handbook for the SeismicEvaluation of Buildings—A Prestandard, FEMA 310, Federal EmergencyManagement Agency, Washington D.C.
Applied Technology Council (ATC), 1978, Tentative Provisions for the Development ofSeismic Regulations for Buildings, ATC-3-06, funded by National ScienceFoundation and the National Bureau of Standards, Washington, D.C.
ASCE, 2000, Prestandard and Commentary for the Seismic Rehabilitation of Buildings,FEMA 356, Federal Emergency Management Agency, Washington D.C.
ASCE, 2002, Seismic Evaluation of Buildings, ASCE 31-02, Structural EngineeringInstitute of the American Society of Civil Engineers, Reston, VA
Building Seismic Safety Council (BSSC), 1992, NEHRP Handbook for the SeismicEvaluation of Existing Buildings, FEMA 178, Federal EmergencyManagement Agency, Washington D.C.
BSSC, 1997, NEHRP Guidelines for the Seismic Rehabilitation of Buildings, FEMA273, Federal Emergency Management Agency, Washington D.C.
Mahin et al., 2003, “Overview of the U. S. Program for Reduction of EarthquakeHazards in Steel Moment-Frame Structures,” Earthquake Spectra Volume19, Number 2, May 2003, Earthquake Engineering Research Institute,Oakland, CA.
Rutherford & Chekene, Consulting Engineers, 1994, Provisional Commentary forSeismic Retrofit, SSC 94-02, State of California Seismic Safety Commission,Sacramento, CA.
SAC Joint Venture (SAC), 2000, Recommended Seismic Evaluation and Upgrade Criteriafor Existing Welded Steel Moment-Frame Buildings, Federal EmergencyManagement Agency, Washington, D.C.
Task Force on Court Facilities, March 31, 2001, Phase 4 Report—Trial CourtFacilities: Inventory, Evaluation, and Planning Options.
References 64


Acknowledgments 65January 2004
Superior Courts of CaliforniaSeismic Assessment Program
Acknowledgments
ADMINISTRATIVE OFFICE OF THE COURTS/OFFICE OF COURT CONSTRUCTION AND MANAGEMENTClifford Ham, Senior Project ManagerScott Shin, Assistant Project ManagerConnie Delago, Administrative AssistantSusan Green, Database Manager
CALIFORNIA DEPARTMENT OF GENERAL SERVICE SEISMIC &SPECIAL PROGRAMS UNITJoel McRonald, ChiefSalinder Dutta, Senior Structural Engineer
SUPERVISING STRUCTURAL ENGINEERRutherford and Chekene Consulting Engineers:William Holmes, Principal/Structural EngineeringPeter Revelli, Principal/Project ManagementAfshar Jalalian, Project ManagerDanya Mohr, Project Coordinator Ayse Celikbas, Project EngineerJamie Curry, Project EngineerHelen Fehr, Project EngineerAlan Kren, Project EngineerWalterio López, Project EngineerDan Manheim, Project EngineerJoseph Ungerer, Project EngineerJoseph Uzarski, Project EngineerTed Ramirez, TechnicianMona Astalis, Production CoordinatorMichelle Gale, Graphic Design

Acknowledgments 66
Vanir Construction Management, Inc.:Mani Subramanian, Principal Cost EstimatorVahid (Ben) Sabati, Project Cost Estimator
Minner, Stinnett, Koo & Agbayani:Robert Stinnett, Project Engineer
CONSULTING STRUCTURAL ENGINEERSCole, Yee, Schubert & Associates:Kenneth Luttrell, Vice President/Structural EngineerGene Cole, Structural EngineerEdward Nicholson, Structural EngineerDieter Siebauld, Structural EngineerMathew Arroyo, Project EngineerAndrew Coffey, Project EngineerErin Cummings, Project EngineerSheri Makihele, Project EngineerJaclyn Noda, Project EngineerFrancisco Medina, Project EngineerFarida Tsiros, Project Engineer
Degenkolb Engineers:John Dal Pino, Principal/Structural EngineeringSharon Gallant, Project EngineerLarry Wong, Project EngineerLucie Fougner, Project EngineerBob Pekelnicky, Project EngineerAnnie Tran, Project EngineerLaurie Johnston, Project Engineer
Englekirk & Sabol Consulting Engineers:Tom Sabol, PrincipalBill Wallace, Vice PresidentPeter Hatalsky, Project Structural EngineerCheng-Ming Lin, Project Structural EngineerTom Negen, Project Structural EngineerThomas Nishi, Project Structural EngineerNagi Abo-Shadi, Project EngineerJulie Birtcher, Engineer
January 2004
Superior Courts of CaliforniaSeismic Assessment Program
Acknowledgments 67
Rajnikanth Gedhada, EngineerMohamed Hassan, EngineerDeepansh Kathuria, EngineerMichael Riddell, EngineerRoman Smith, EngineerDavid Pohlmeier, Senior DesignerDaniel Shubin, Senior DesignerMirlon Miranda, DrafterRon Thiphavong, DrafterRajnikanth Gedhada, EngineerMohamed Hassan, EngineerDeepansh Kathuria, EngineerMichael Riddell, EngineerRoman Smith, EngineerDavid Pohlmeier, Senior DesignerDaniel Shubin, Senior DesignerMirlon Miranda, DrafterRon Thiphavong, Drafter
Forrell/Elsesser Engineers, Inc.:Eric Elsesser, Principal/Structural EngineeringSarah Besser, Project EngineerLynn Deutschbauer, Project EngineerMark Tobin, Project EngineerDerek Westphal, Project EngineerMason Walters, Project Management
Integrated Design Services:Rami Elhassan, Principal/Structural EngineeringSaid Hilmy, Structural EngineerRoger Li, Ph.D., SEJames Lin, Structural EngineerJack Yeh, Structural EngineerBen Faircloth, PE
Middlebrook + Louie, Inc.:Navin Amin, Principal/Structural EngineeringBob McCartney, Structural EngineerRoumen Mladjov, Structural EngineerCarlos Chang, Structural Engineer
January 2004
Superior Courts of CaliforniaSeismic Assessment Program

Acknowledgments 68
Sue Chen, Structural EngineerDavid Figueira, Structural EngineerJessica Jones, Structural EngineerDanil Botoshansky, Project EngineerJiri Pertold, Project EngineerVivian Wan, Project EngineerMartin Wu, Project EngineerCharles Li, Project EngineerFrancisco Kameko, Project Engineer
Nabih Youssef & Associates with Jacobs Engineers:Nabih Youssef, Principal/Structural EngineeringKenny Lee, Structural EngineerDavid Chieng, Project EngineerJohn Labib, Project EngineerOwen Hata, Senior AnalystCharles Tan, Project EngineerMichael Bryson, Senior EngineerJosh Gebelein, Senior EngineerKirk Hodge, Structural DesignerIgnacio Villa, Engineering Admin.
Simpson Gumpertz & Heger, Inc.:Ron Hamburger, Principal/Structural EngineeringJohn D. Meyer, Principal/Structural EngineeringDavid McCormick, Structural EngineerStephen Harris, Structural EngineerTaryn Williams, Senior EngineerKenneth T. Tam, Staff EngineerUgo G. Costa, Staff EngineerLee D. Pursell, Senior Staff EngineerJennifer Lovejoy, Engineer
Superior Courts of CaliforniaSeismic Assessment Program
January 2004

Certifications 69
Jack Barr, Jr. – Department of General Services (June 24, 2003)Jack Barr, Jr. – Department of General Services (December 31, 2003)Kenneth A. Lutrell – Cole, Yee, Schubert & AssociatesJohn Dal Pino, Sharon M. Gallant – Degenkolb EngineersWilliam A. Wallace – Englekirk & Sabol Consulting EngineersEric Elsesser – Forell/Elsesser Engineers, Inc.Rami Elhassan – Integrated Design Services, Inc.Navinchandra R. Amin – Middlebrook + Louie, Inc.Nabih Youssef – Nabih Youssef & AssociatesRonald O. Hamburger – Simpson Gumpertz & Heger, Inc.
Superior Courts of CaliforniaSeismic Assessment Program
January 2004
Certifications