Embed Size (px)
Citation preview

Superintendent/Treasurer Update!
Upper Arlington Board of Education September 13, 2016
Welcome back students & staff!
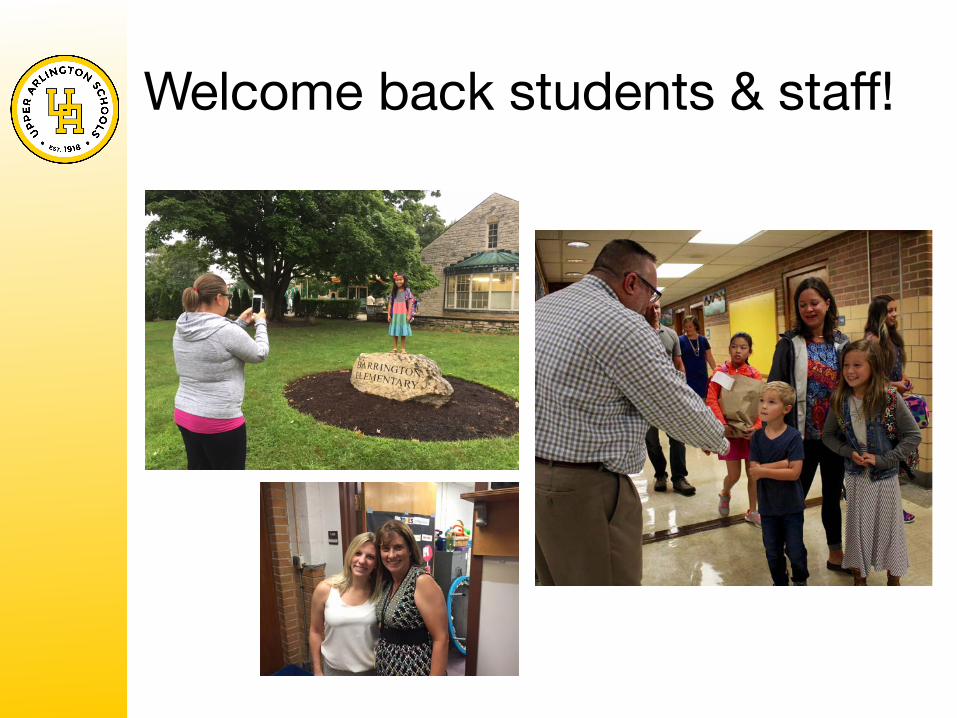
#UAloves2learn staff development

Congratulations to staff honorees!

… and Dr. Homer Mincy!
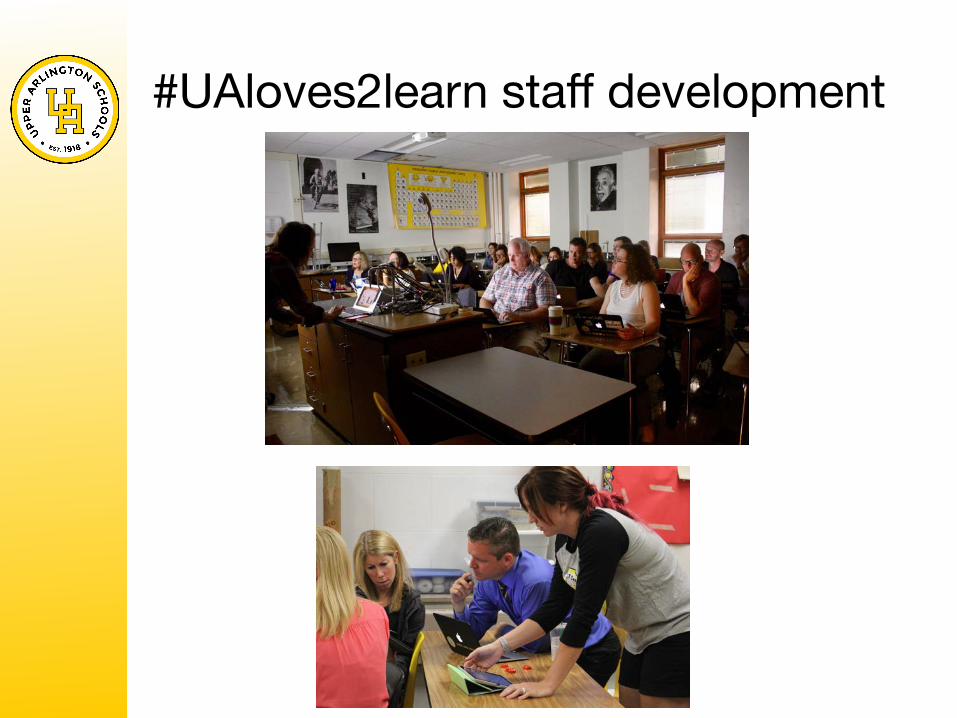
New space at Tremont
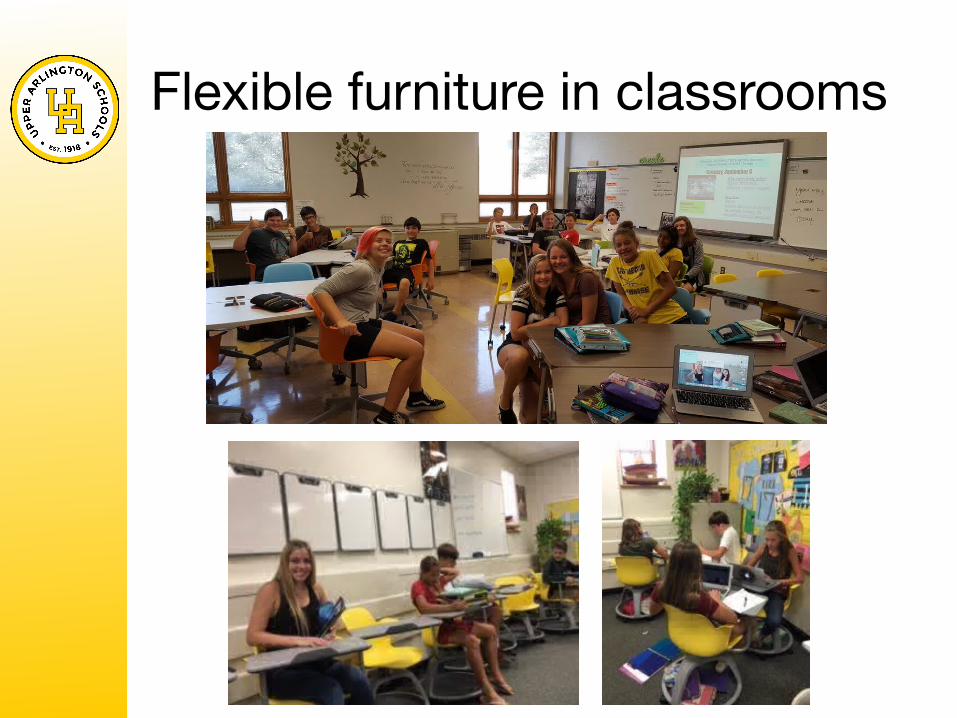
Flexible furniture in classrooms
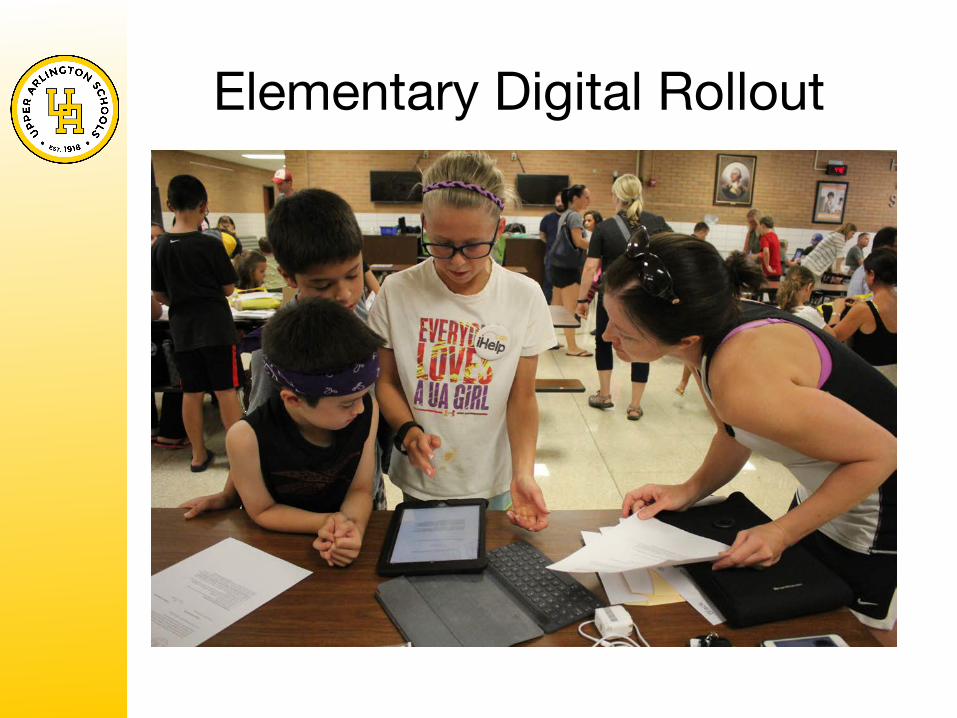
Elementary Digital Rollout
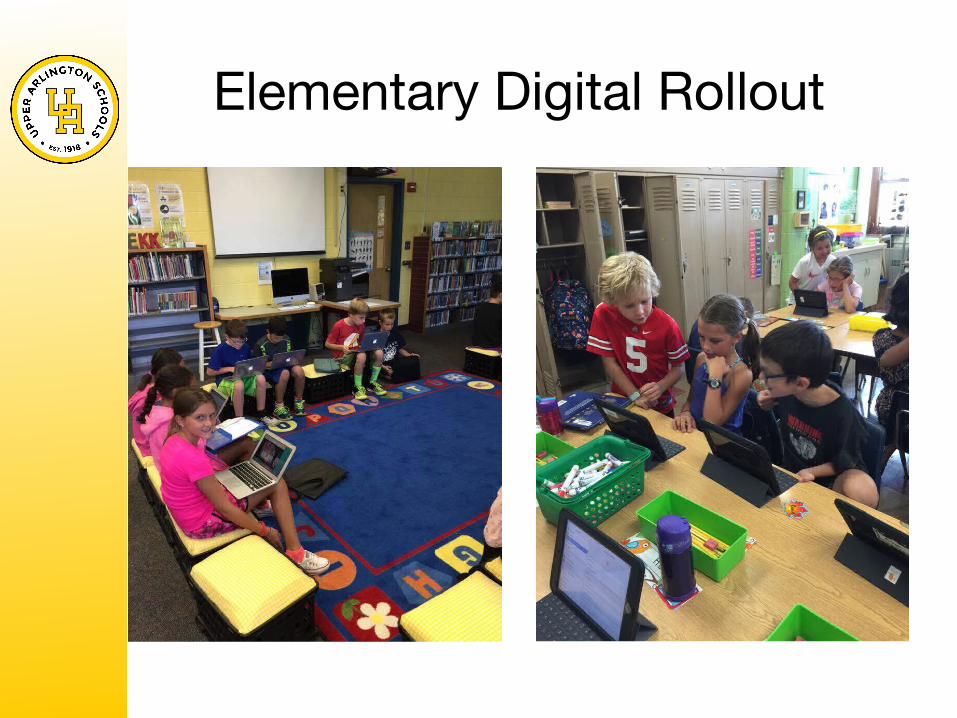
Elementary Digital Rollout

HIP Day & HOP Day at Hastings
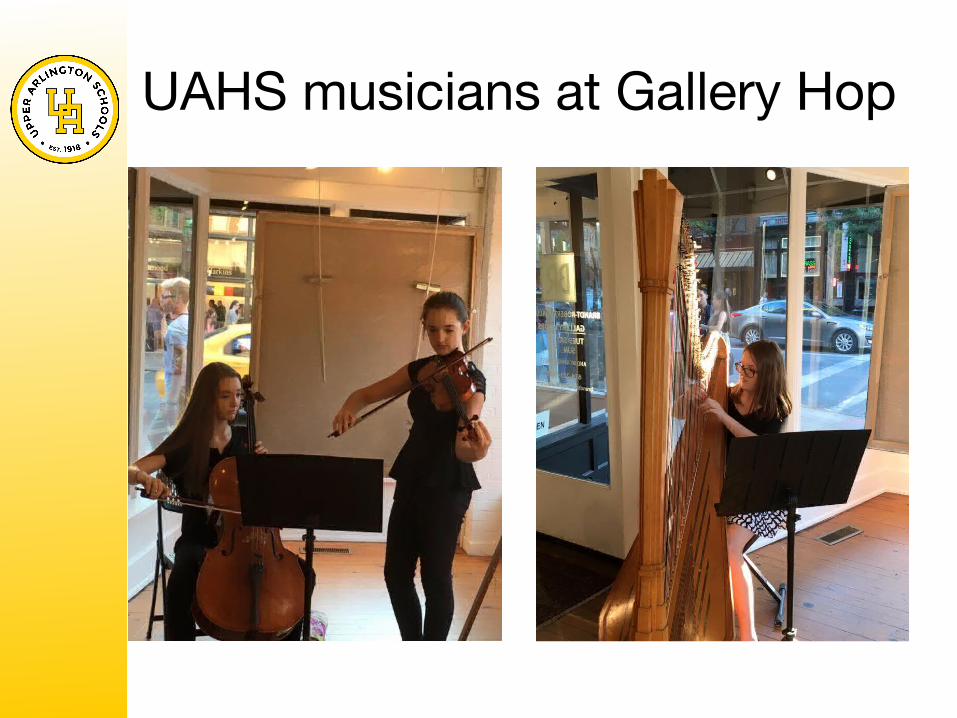
UAHS musicians at Gallery Hop
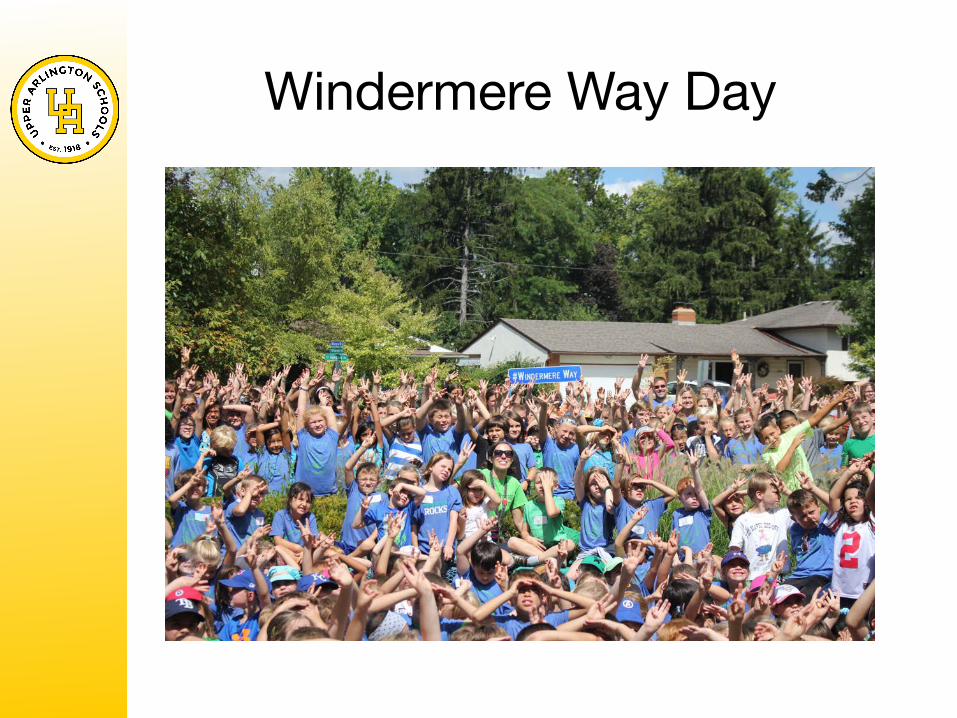
Windermere Way Day
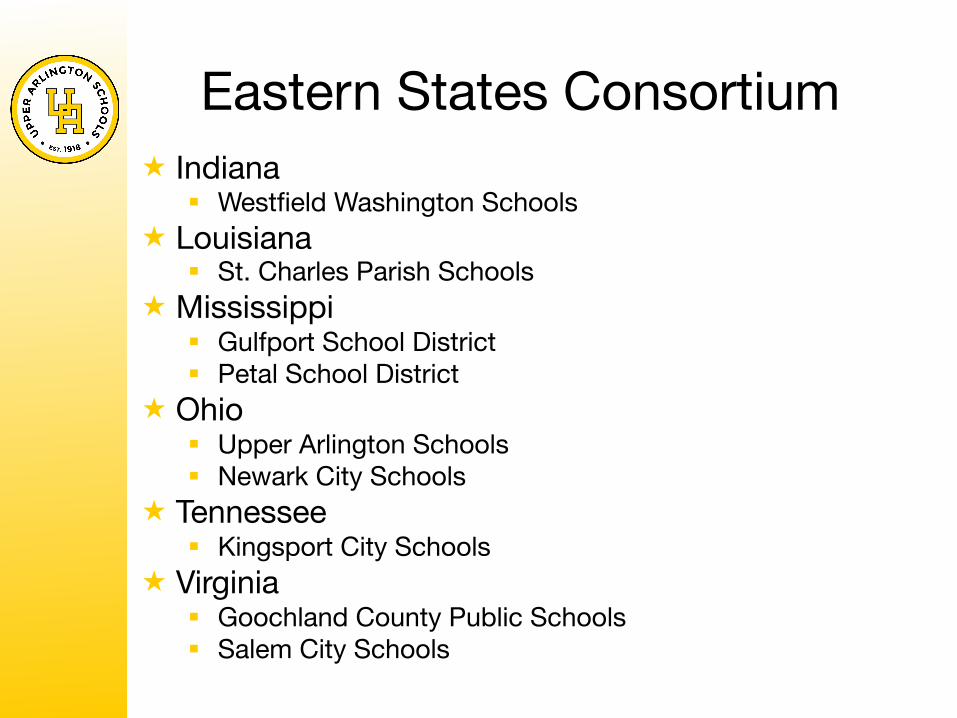
Eastern States Consortium « Indiana
§ Westfield Washington Schools « Louisiana
§ St. Charles Parish Schools « Mississippi
§ Gulfport School District § Petal School District
« Ohio § Upper Arlington Schools § Newark City Schools
« Tennessee § Kingsport City Schools
« Virginia § Goochland County Public Schools § Salem City Schools
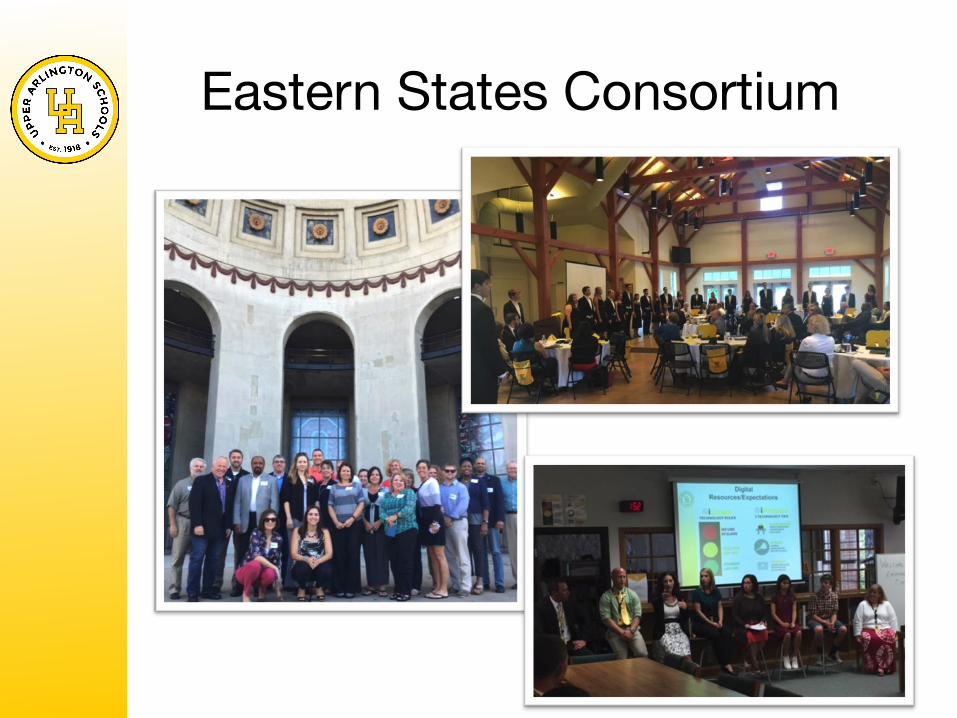
Eastern States Consortium
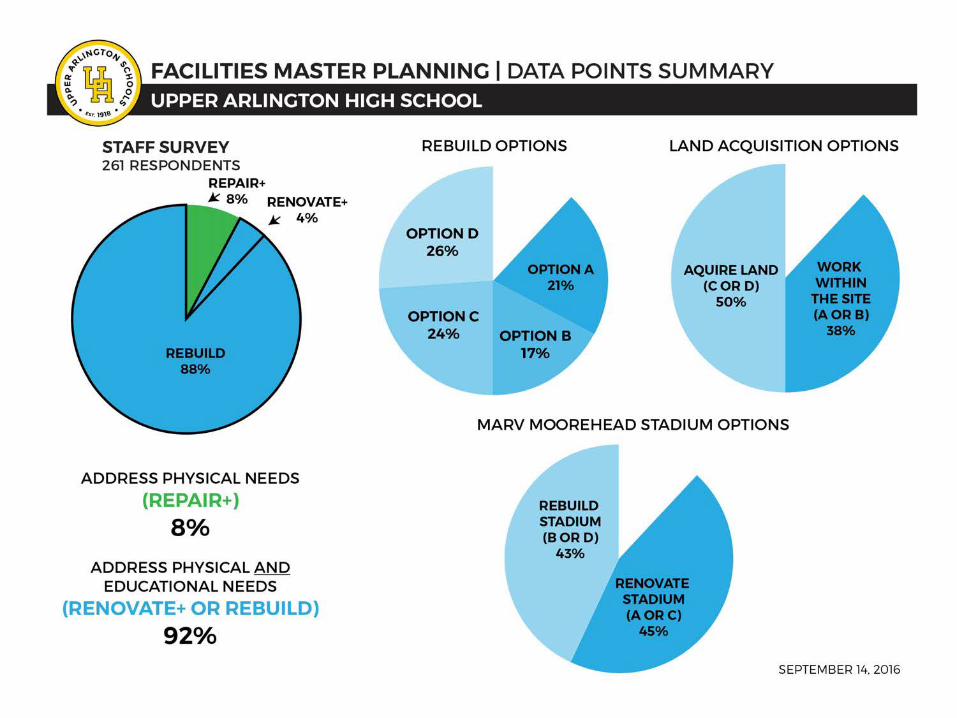
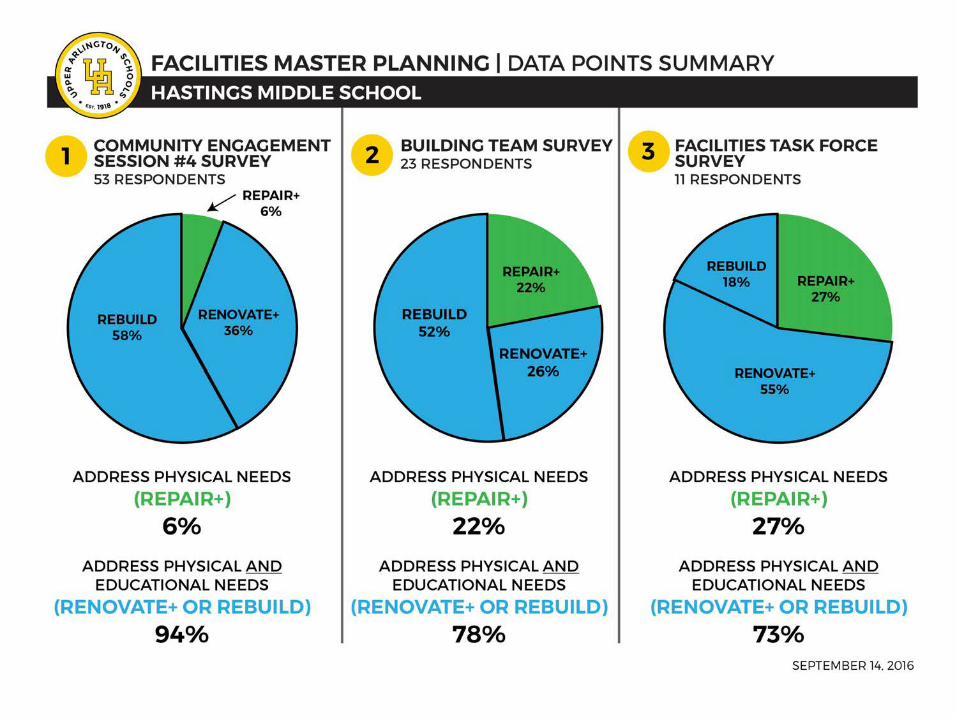
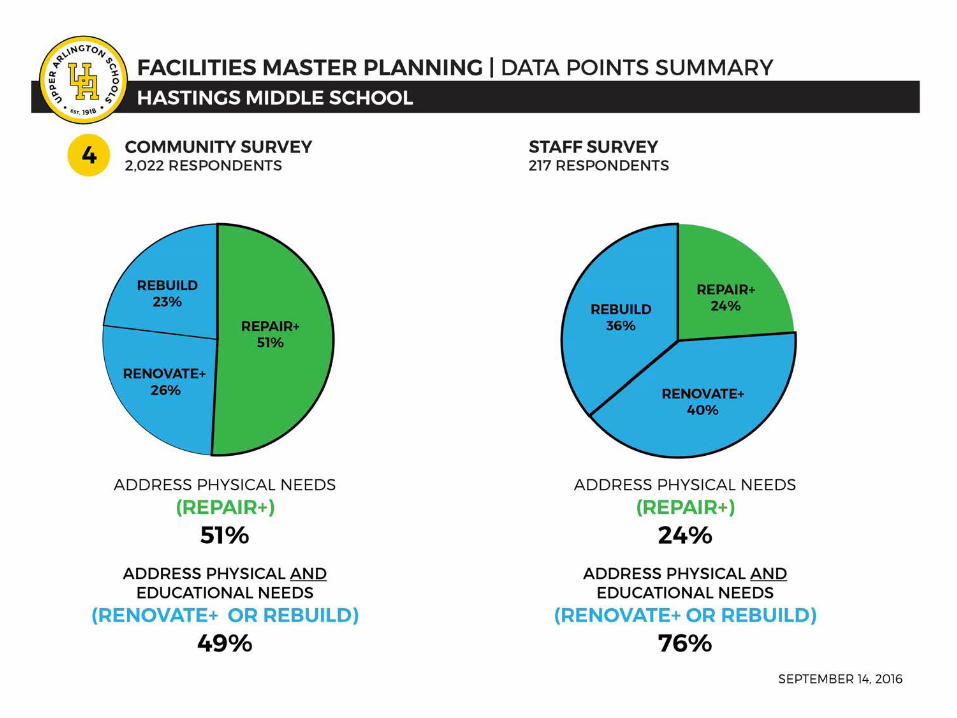
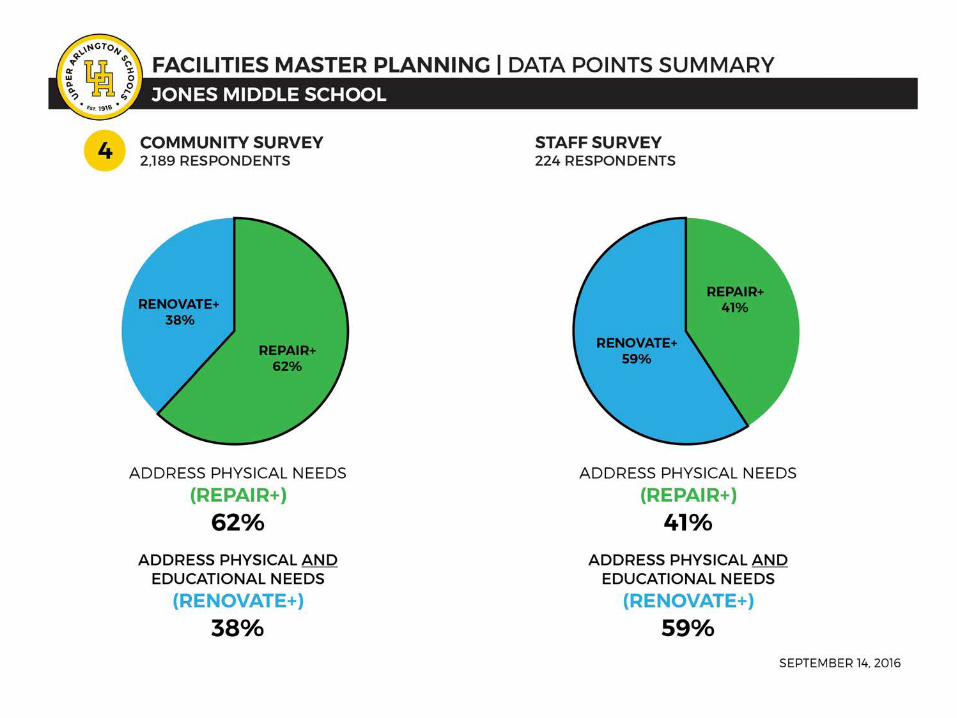
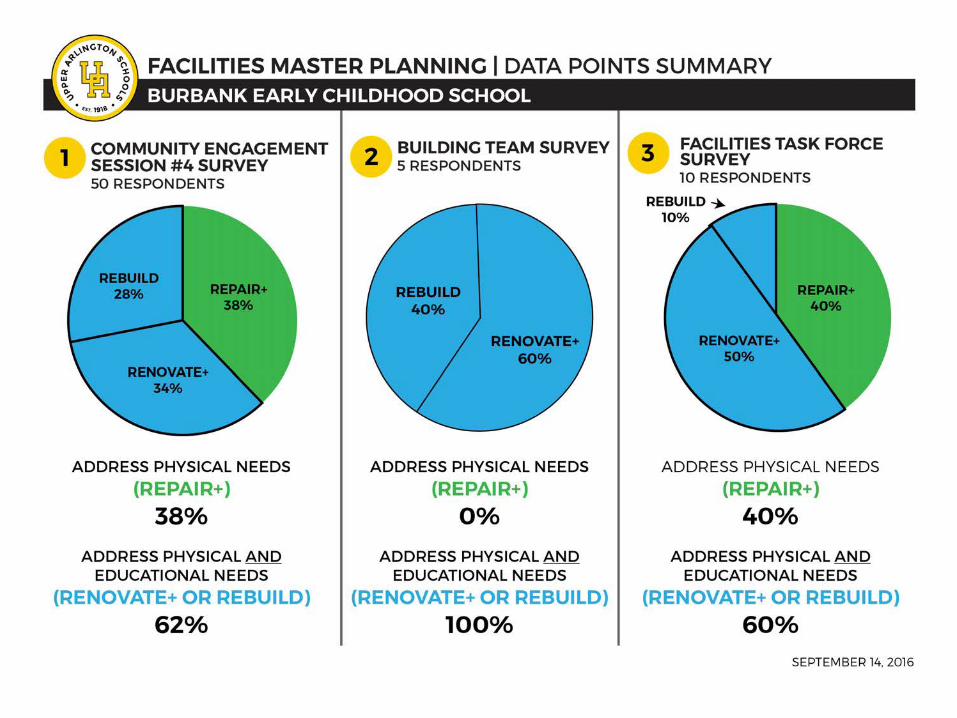
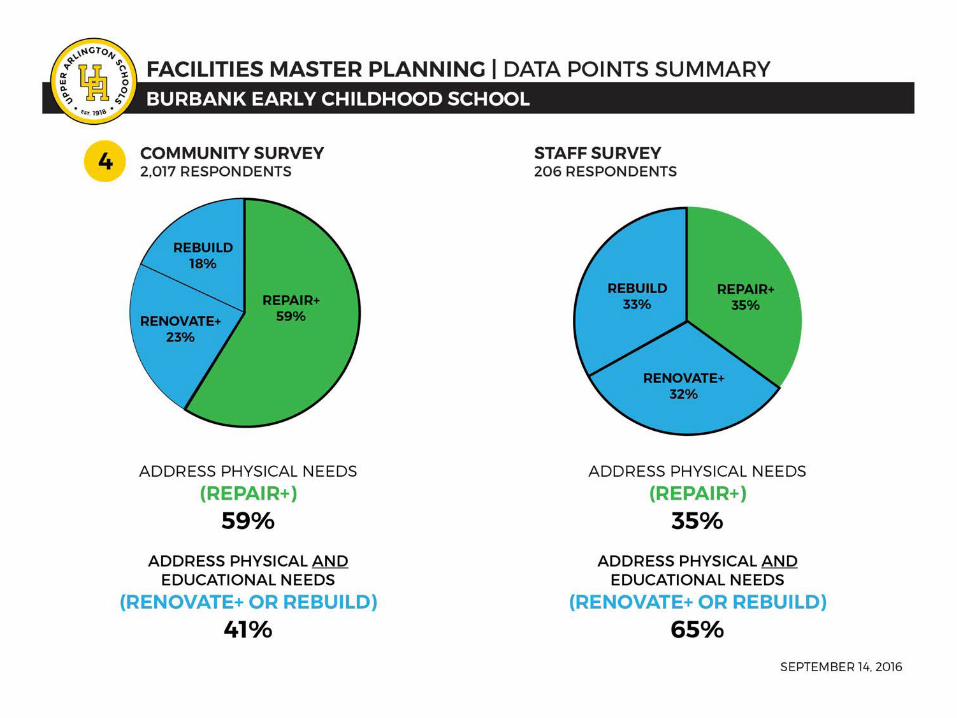
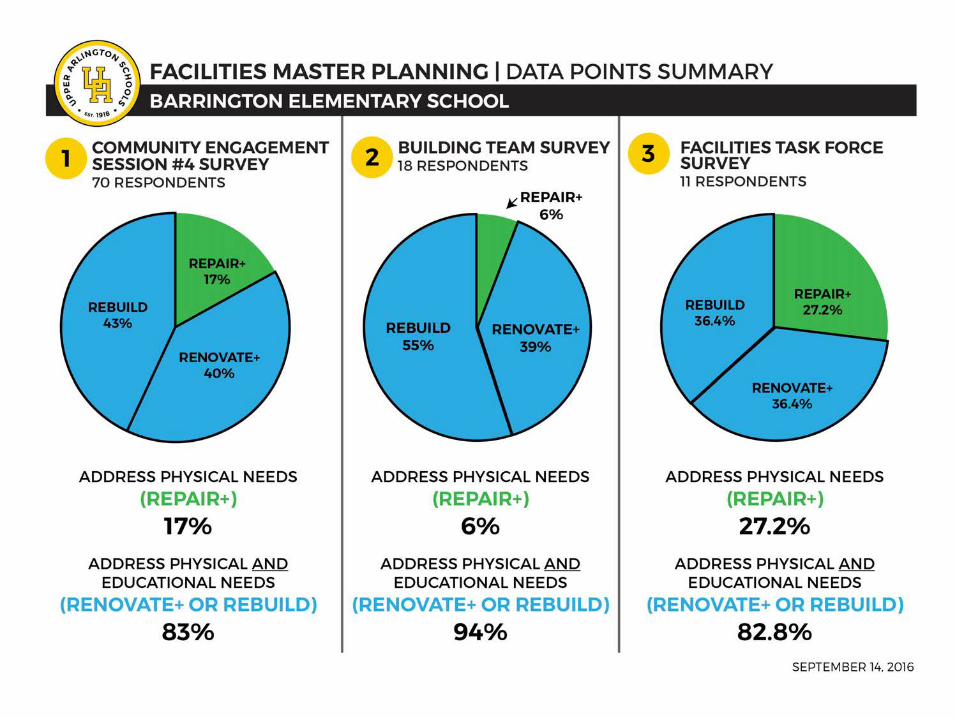
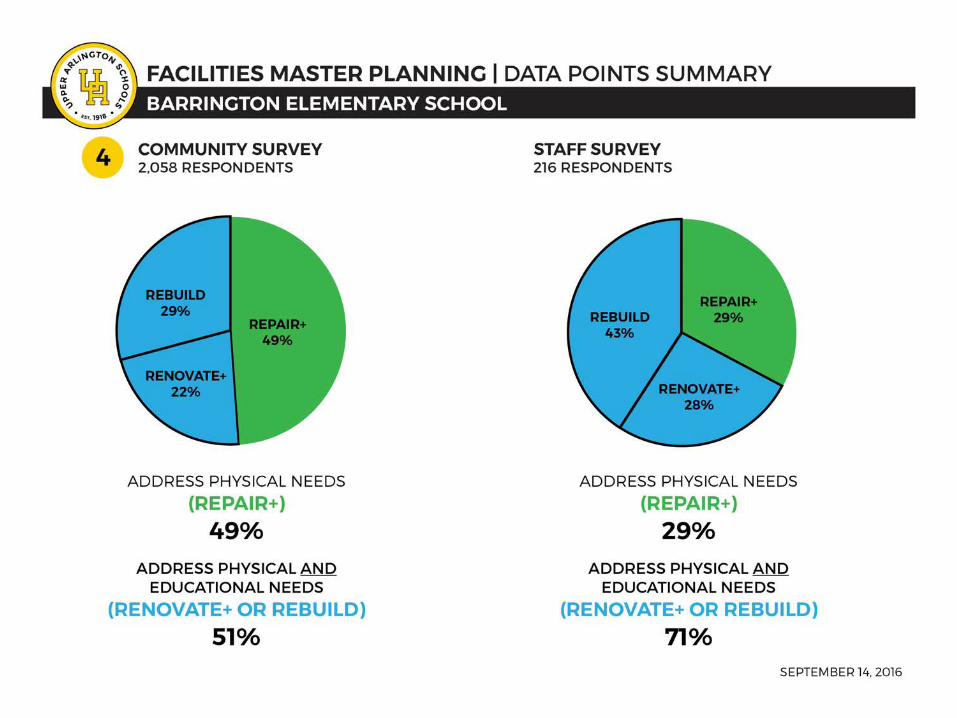
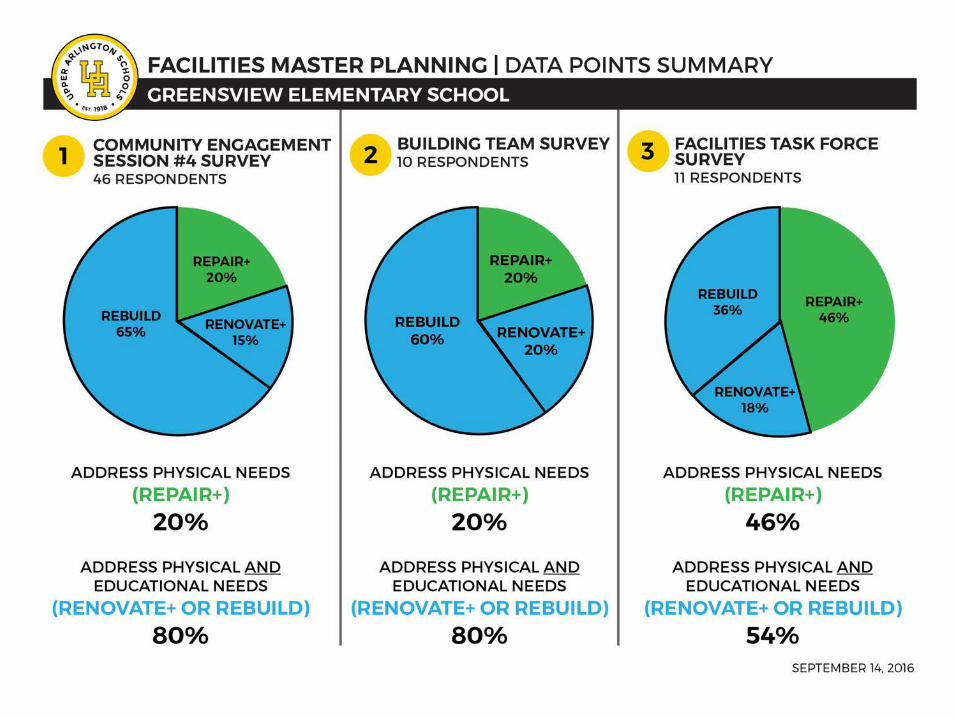
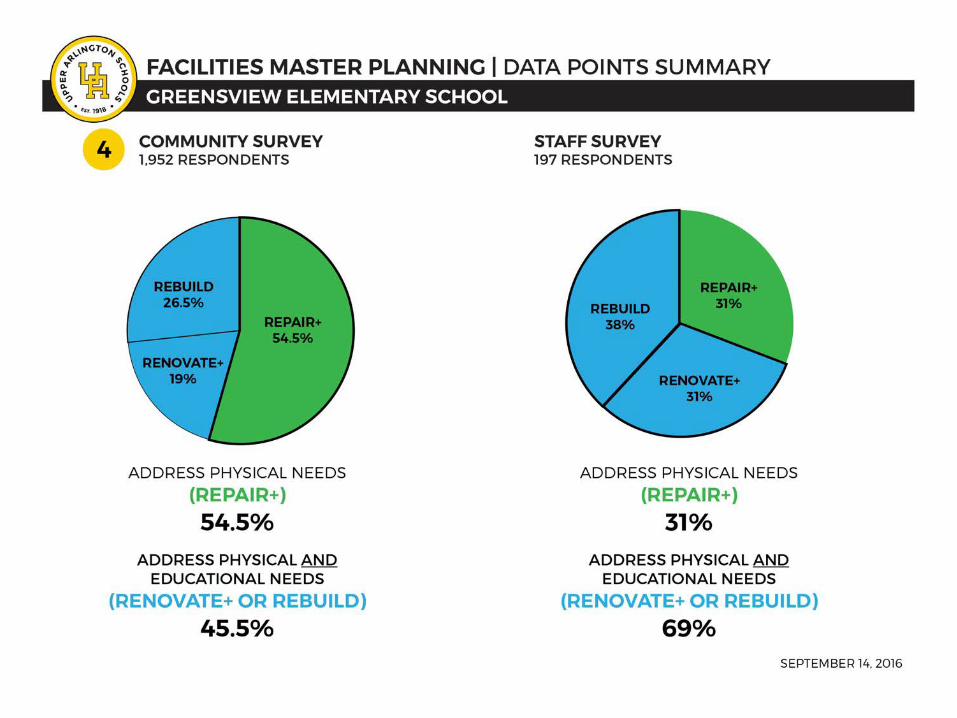
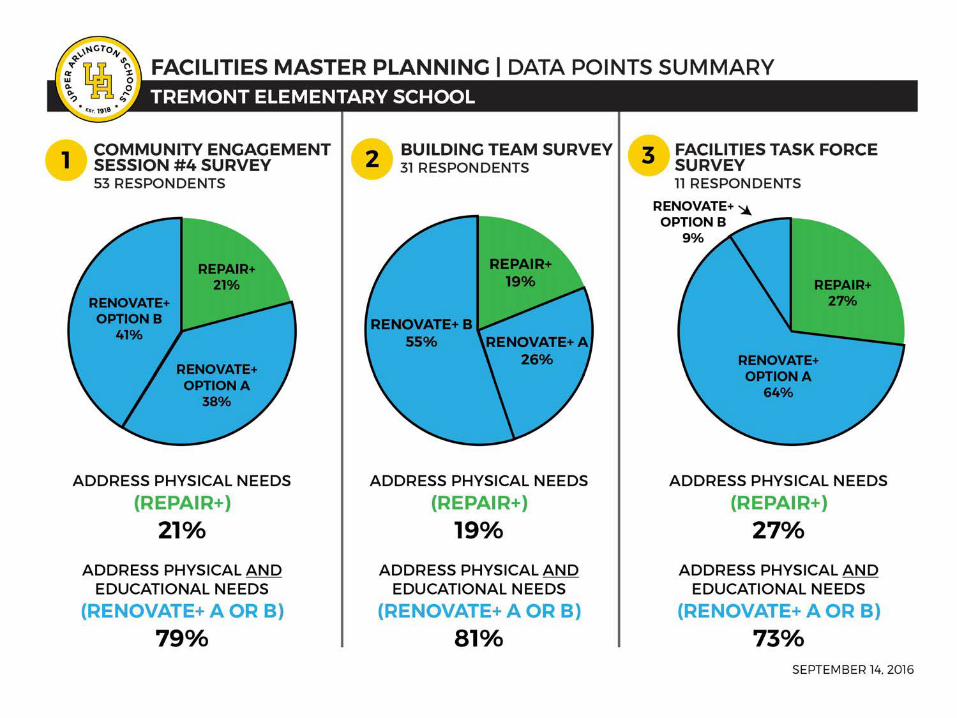
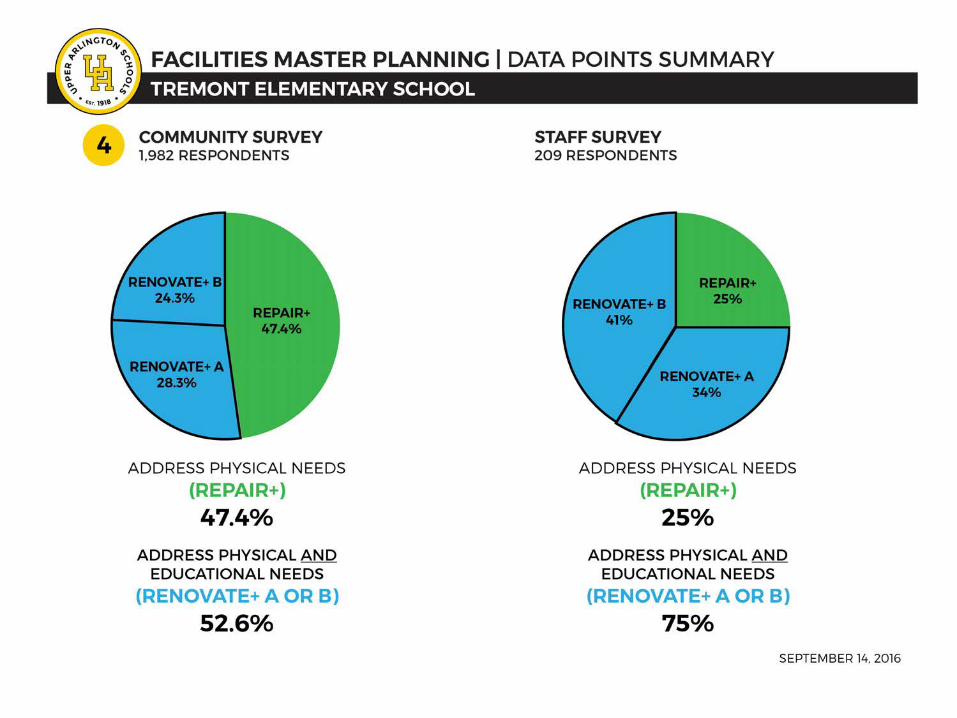
FACILITIES MASTER PLANNINGSTRATEGIC PLAN EFFICIENCY GOAL

Building Team Summit
« 7 pm, Wednesday, September 14 at UAHS « Agenda:
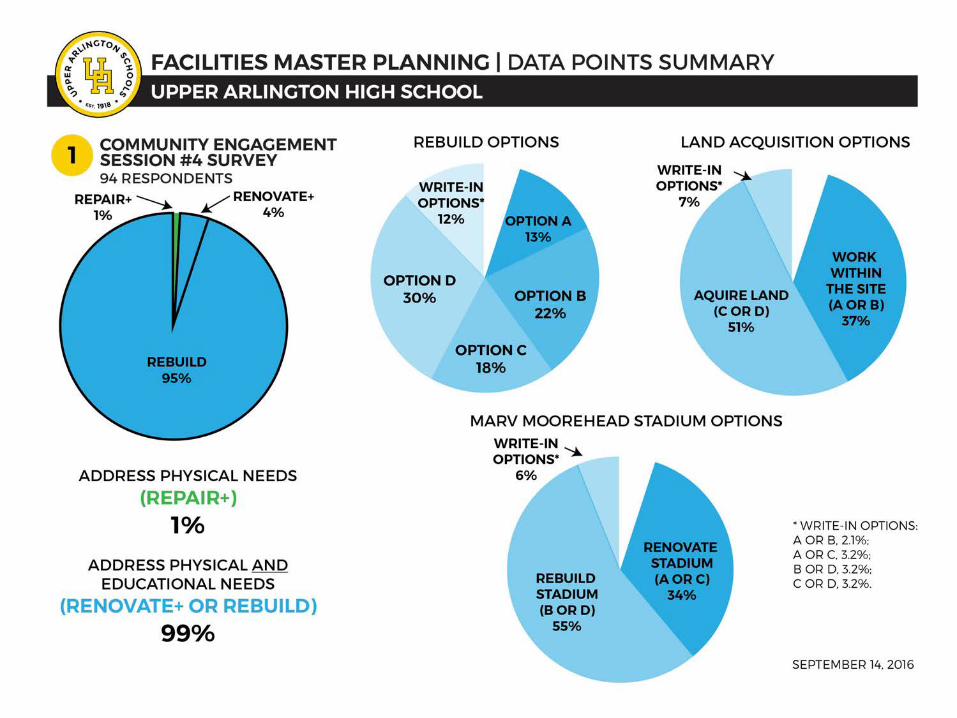
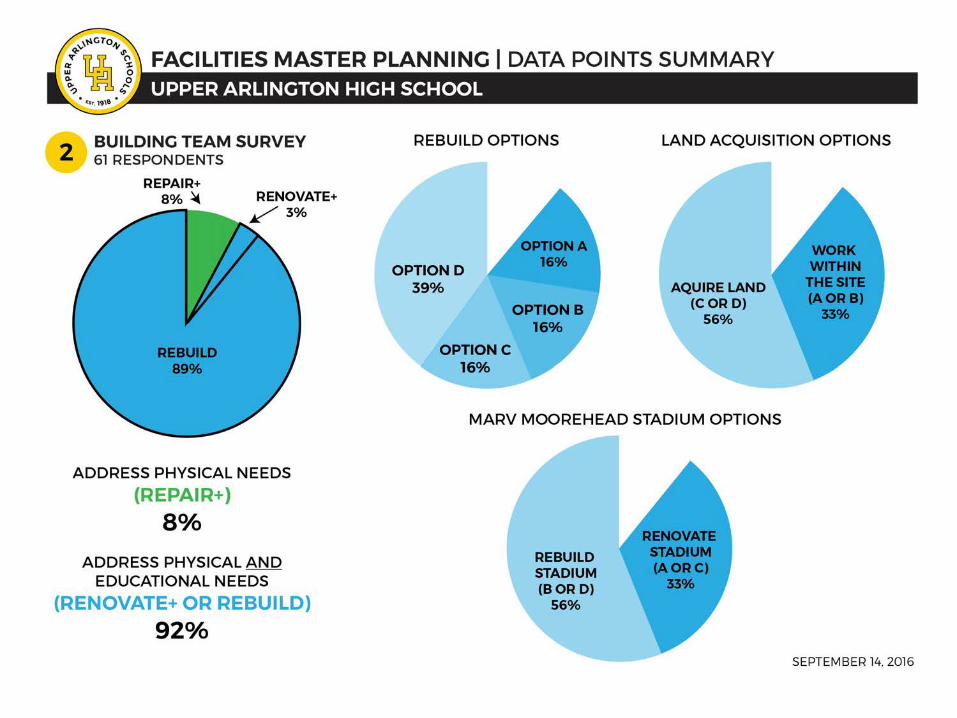
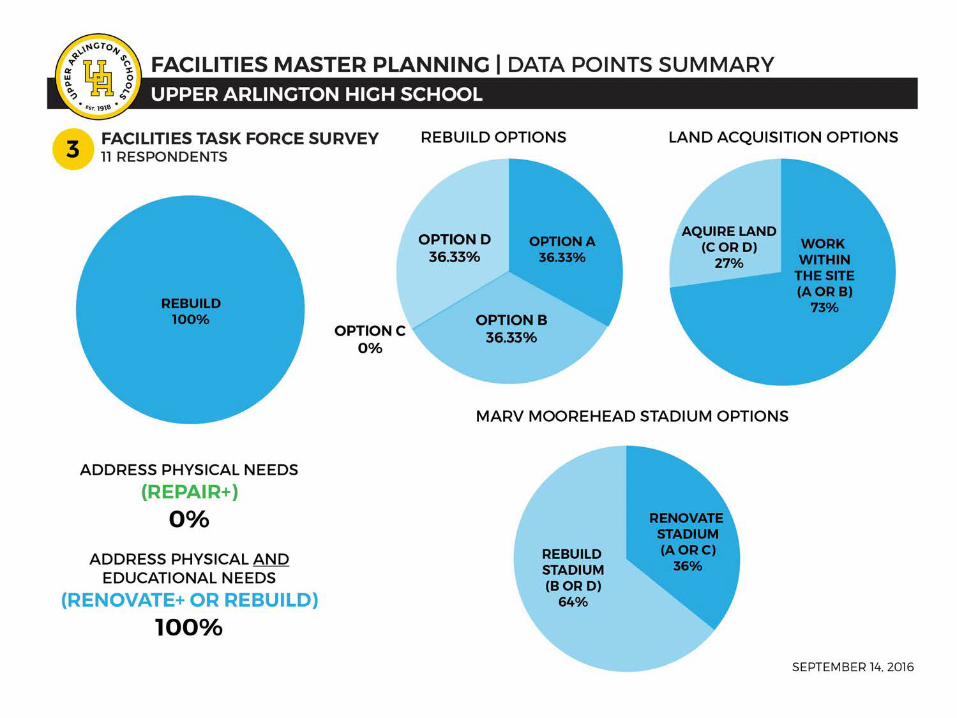
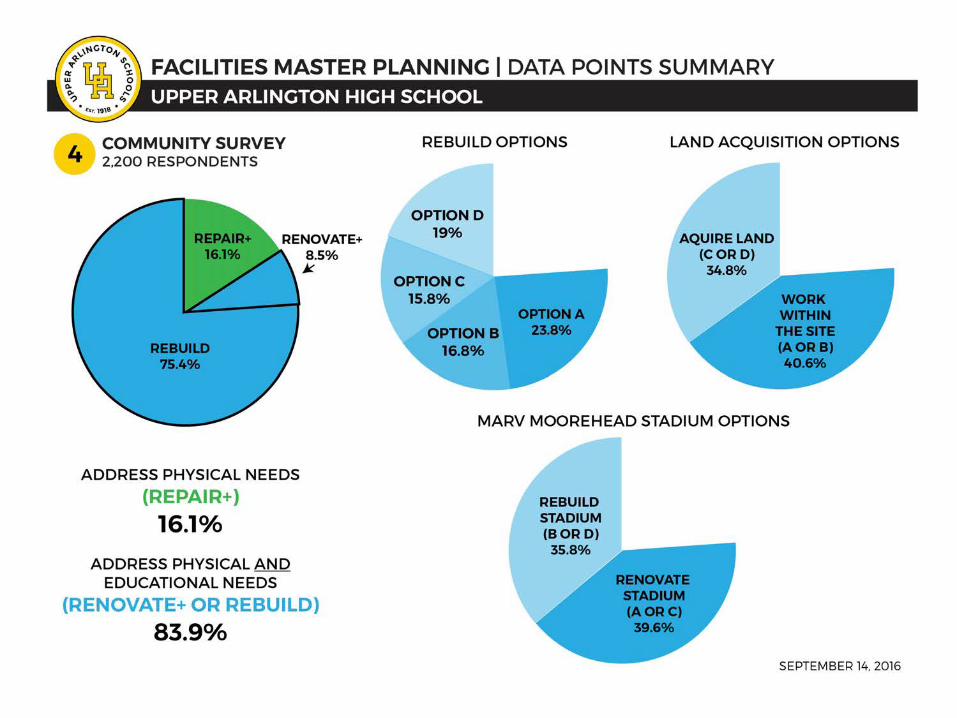
§ Review process to date § Enrollment projections § Data points § High school and Jones updates § Feedback activity § Next steps

High School Question
Is there any way to have two baseball fields, two softball fields and increased
parking without acquiring land?
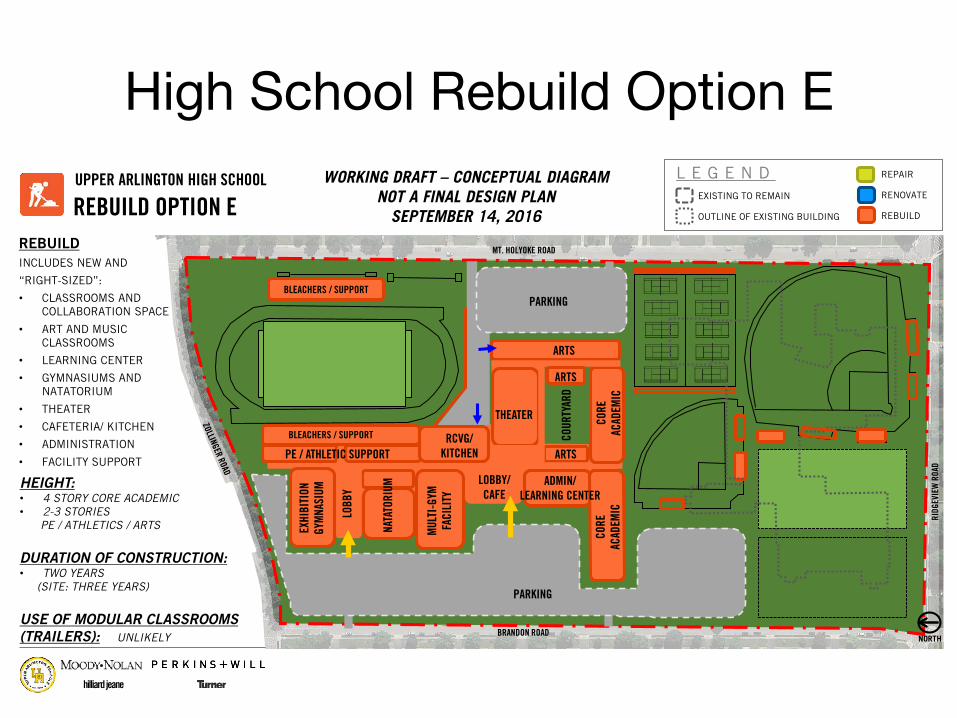
High School Rebuild Option E
MT. HOLYOKE ROAD
RIDG
EVIE
W R
OAD
BRANDON ROADNORTH
UPPER ARLINGTON HIGH SCHOOL WORKING DRAFT – CONCEPTUAL DIAGRAM NOT A FINAL DESIGN PLAN
SEPTEMBER 14, 2016
REPAIR
RENOVATE
REBUILD
L E G E N DEXISTING TO REMAIN
OUTLINE OF EXISTING BUILDING
REBUILDINCLUDES NEW AND
“RIGHT-SIZED”:
• CLASSROOMS AND COLLABORATION SPACE
• ART AND MUSIC CLASSROOMS
• LEARNING CENTER
• GYMNASIUMS AND NATATORIUM
• THEATER
• CAFETERIA/ KITCHEN
• ADMINISTRATION
• FACILITY SUPPORT
hilliardjeane
REBUILD OPTION E
BLEACHERS / SUPPORT
ARTS
BLEACHERS / SUPPORT
THEATER
ARTS
MULT
I-GYM
FACI
LITY
PE / ATHLETIC SUPPORT
CORE
AC
ADEM
IC
LOBB
Y
NATA
TORI
UMARTS
RCVG/KITCHEN
CORE
AC
ADEM
IC
EXHI
BITI
ONGY
MNAS
IUM LOBBY/
CAFEADMIN/
LEARNING CENTER
COUR
TYAR
D
HEIGHT:• 4 STORY CORE ACADEMIC• 2-3 STORIES
PE / ATHLETICS / ARTS
DURATION OF CONSTRUCTION:• TWO YEARS
(SITE: THREE YEARS)
USE OF MODULAR CLASSROOMS (TRAILERS): UNLIKELY
PARKING
PARKING
PARKING
High School Rebuild Option F
MT. HOLYOKE ROAD
RIDG
EVIE
W R
OAD
BRANDON ROAD NORTH
UPPER ARLINGTON HIGH SCHOOL WORKING DRAFT – CONCEPTUAL DIAGRAM NOT A FINAL DESIGN PLAN
SEPTEMBER 14, 2016
REPAIR
RENOVATE
REBUILD
L E G E N DEXISTING TO REMAIN
OUTLINE OF EXISTING BUILDING
REBUILDINCLUDES NEW AND
“RIGHT-SIZED”:
• CLASSROOMS AND COLLABORATION SPACE
• ART AND MUSIC CLASSROOMS
• LEARNING CENTER
• GYMNASIUMS AND NATATORIUM
• THEATER
• CAFETERIA/ KITCHEN
• ADMINISTRATION
• FACILITY SUPPORT
hilliardjeane
REBUILD OPTION F
BLEACHERS / SUPPORT
HEIGHT:• 4 STORY CORE ACADEMIC• 2-3 STORIES
PE / ATHLETICS / ARTS
DURATION OF CONSTRUCTION:• TWO YEARS
(SITE: THREE YEARS)
USE OF MODULAR CLASSROOMS (TRAILERS): UNLIKELY
2 STORY PARKING
DECK
MULTI-GYMFACILITY
BLEACHERS / SUPPORT
NATATORIUMLOBBY/CAFE
THEATER
ARTS
EXHIBITIONGYMNASIUM
ARTS PE / ATHLETIC SUPPORT
PARKING PARKING
RCVG/KITCHEN/SUPPORT
PARKING
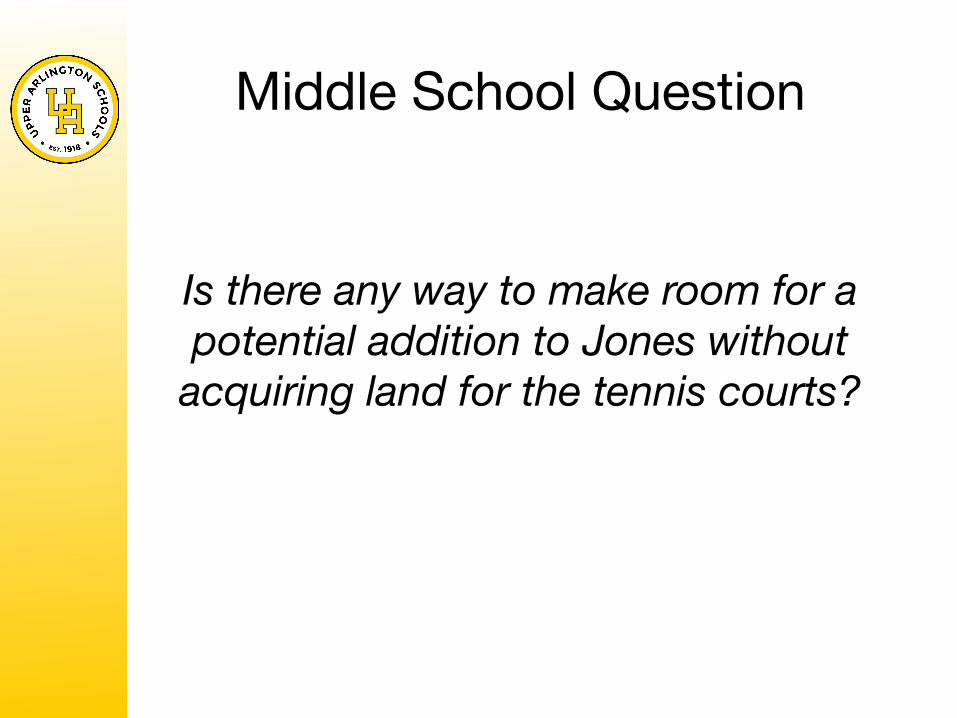
Middle School Question
Is there any way to make room for a potential addition to Jones without
acquiring land for the tennis courts?
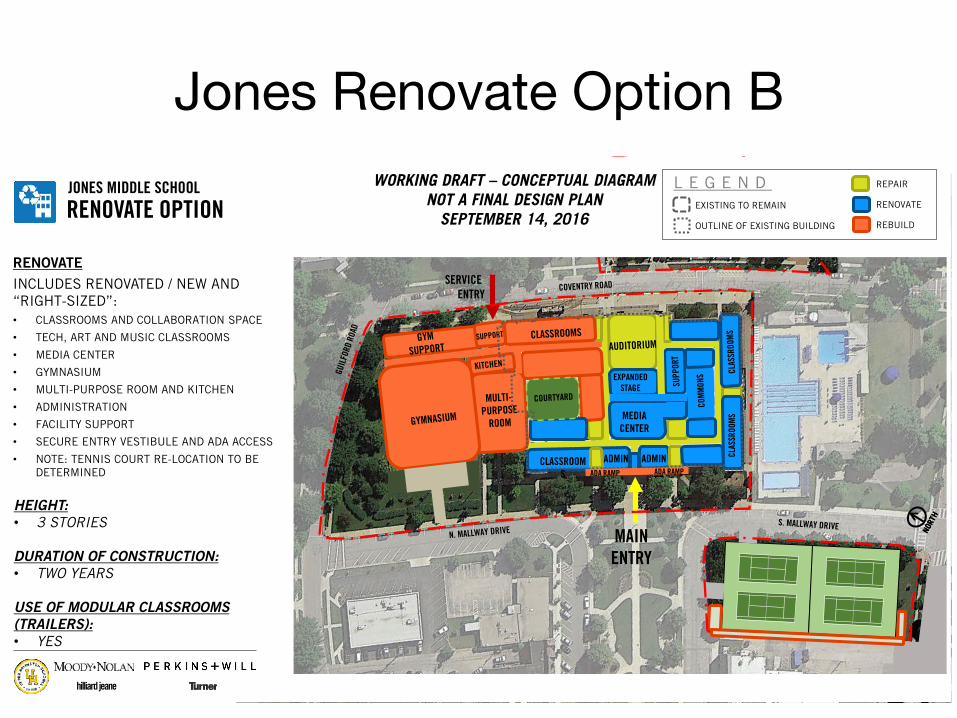
Jones Renovate Option B
CLASSROOMS
CLAS
SROO
MS
EXPANDED STAGE
MEDIACENTER
SERVICE ENTRY
ADA RAMP ADA RAMPADMIN ADMIN
MAIN ENTRY
JONES MIDDLE SCHOOL
RENOVATEINCLUDES RENOVATED / NEW AND “RIGHT-SIZED”: • CLASSROOMS AND COLLABORATION SPACE
• TECH, ART AND MUSIC CLASSROOMS
• MEDIA CENTER
• GYMNASIUM
• MULTI-PURPOSE ROOM AND KITCHEN
• ADMINISTRATION
• FACILITY SUPPORT
• SECURE ENTRY VESTIBULE AND ADA ACCESS
• NOTE: TENNIS COURT RE-LOCATION TO BE DETERMINED
HEIGHT:• 3 STORIES
DURATION OF CONSTRUCTION:• TWO YEARS
USE OF MODULAR CLASSROOMS (TRAILERS): • YES
WORKING DRAFT – CONCEPTUAL DIAGRAM NOT A FINAL DESIGN PLAN
SEPTEMBER 14, 2016RENOVATE OPTIONREPAIR
RENOVATE
REBUILD
L E G E N DEXISTING TO REMAIN
OUTLINE OF EXISTING BUILDING
hilliardjeane

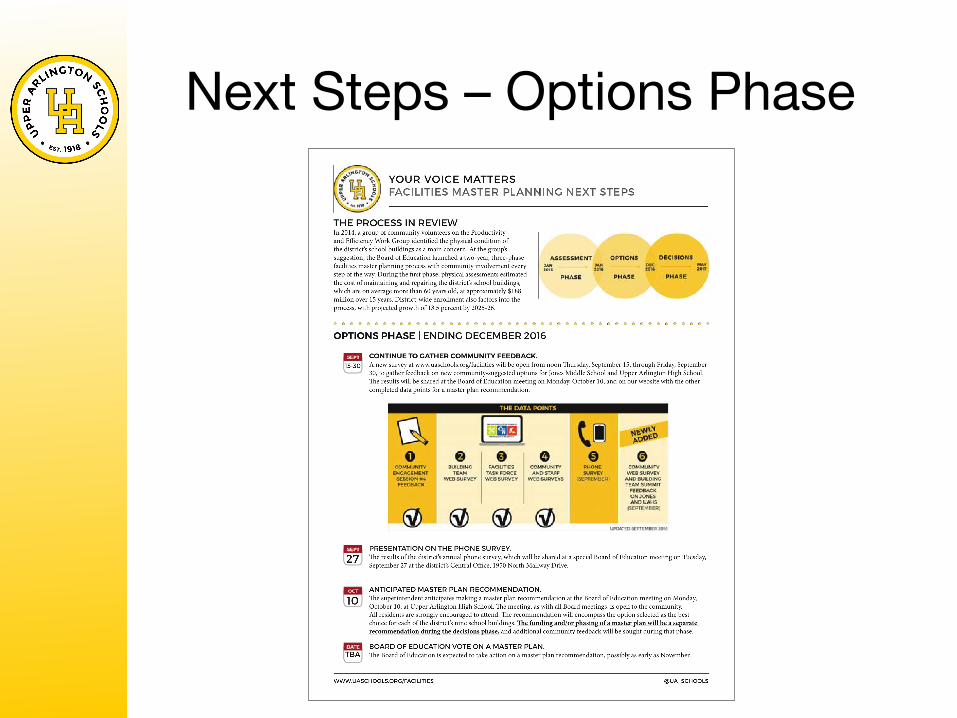
Next Steps – Options Phase
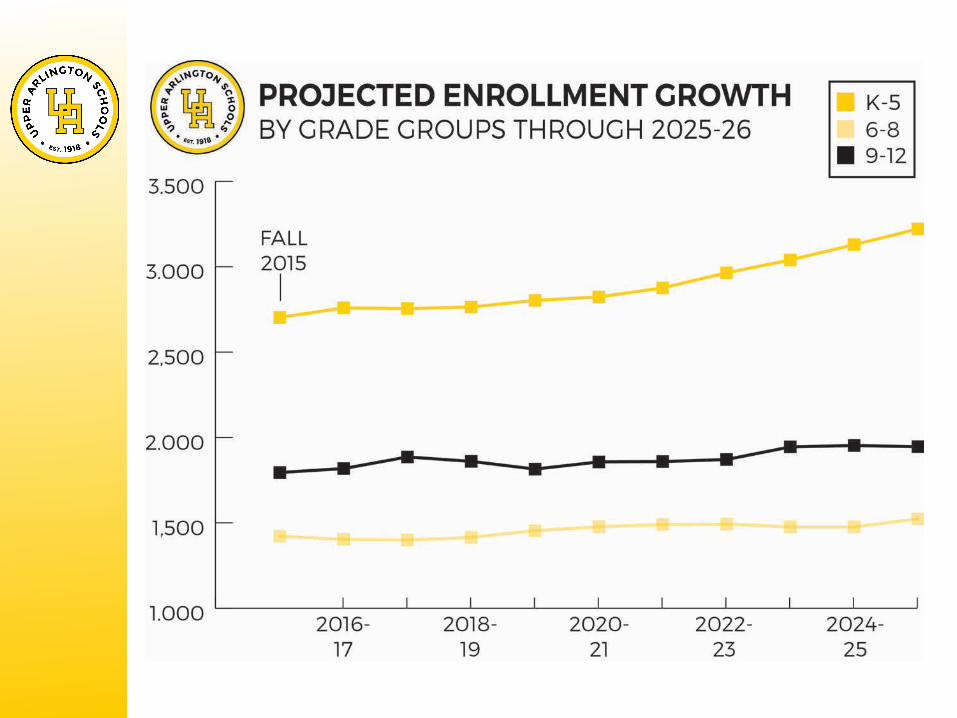
ENROLLMENT UPDATE
Enrollment Data Multiple sources for enrollment data, including: • Annual enrollment study by Planning Advocates, Inc. • Fall 2015, UA community population study conducted by
MORPC for the UA Library • Fall 2014, enrollment study also conducted as part of the
OFCC evaluation Monitor enrollment monthly, looking at data on: • Changes in overall class sizes • Special services numbers (Intervention Specialists, TAG, Reading
Intervention, and Paraprofessional Tutors) • Number of specialists (art, music, PE) • Any additional needs for Assistant Teachers
Enrollment Data « Enrollment projections consider multiple data
points, including: § Historical data for both the schools and community § Live birth counts (data available by county) § Residents attending elsewhere (private, parochial,
open enrollment, community schools) § Current housing information § Real estate market
• Planned but not built housing • Sales • Zoning changes • Unplanned new housing activity • Land saturation analysis
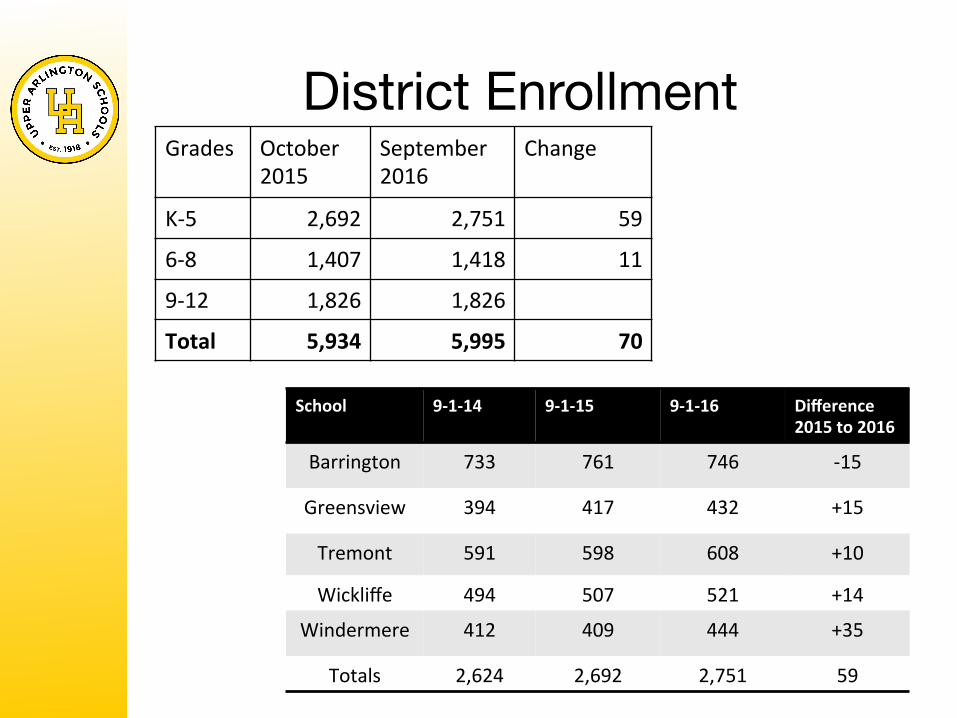
District Enrollment Grades October
2015 September 2016
Change
K-‐5 2,692 2,751 59
6-‐8 1,407 1,418 11
9-‐12 1,826 1,826
Total 5,934 5,995 70
School 9-‐1-‐14 9-‐1-‐15 9-‐1-‐16 Difference 2015 to 2016
Barrington 733 761 746 -‐15
Greensview 394 417 432 +15
Tremont 591 598 608 +10
Wickliffe 494 507 521 +14
Windermere 412 409 444 +35
Totals 2,624 2,692 2,751 59
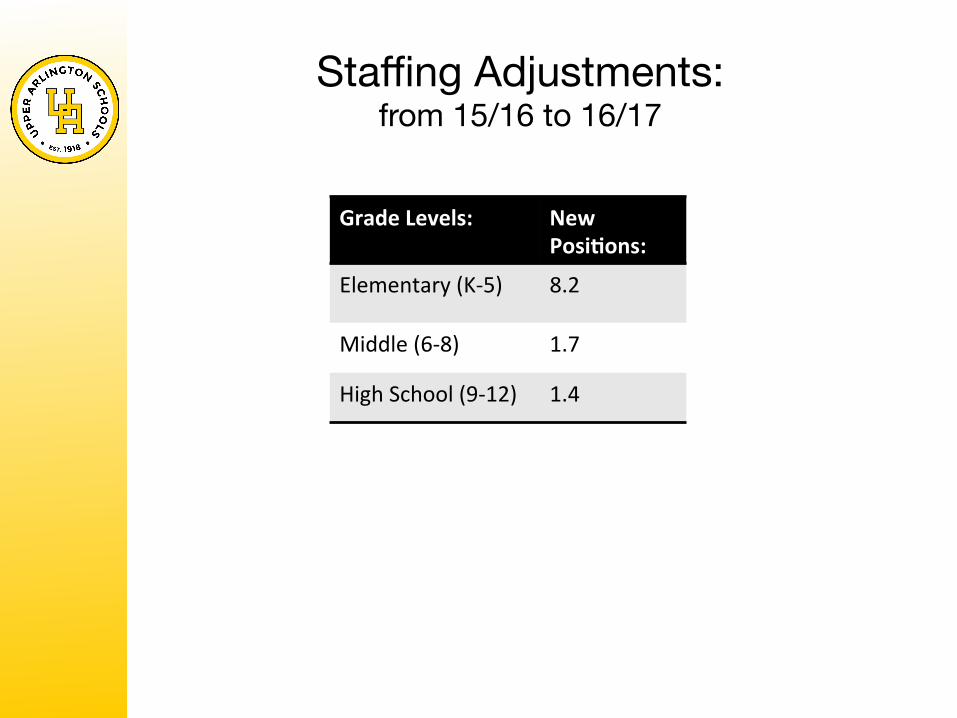
Staffing Adjustments:from 15/16 to 16/17
Grade Levels: New PosiDons:
Elementary (K-‐5) 8.2
Middle (6-‐8) 1.7
High School (9-‐12) 1.4
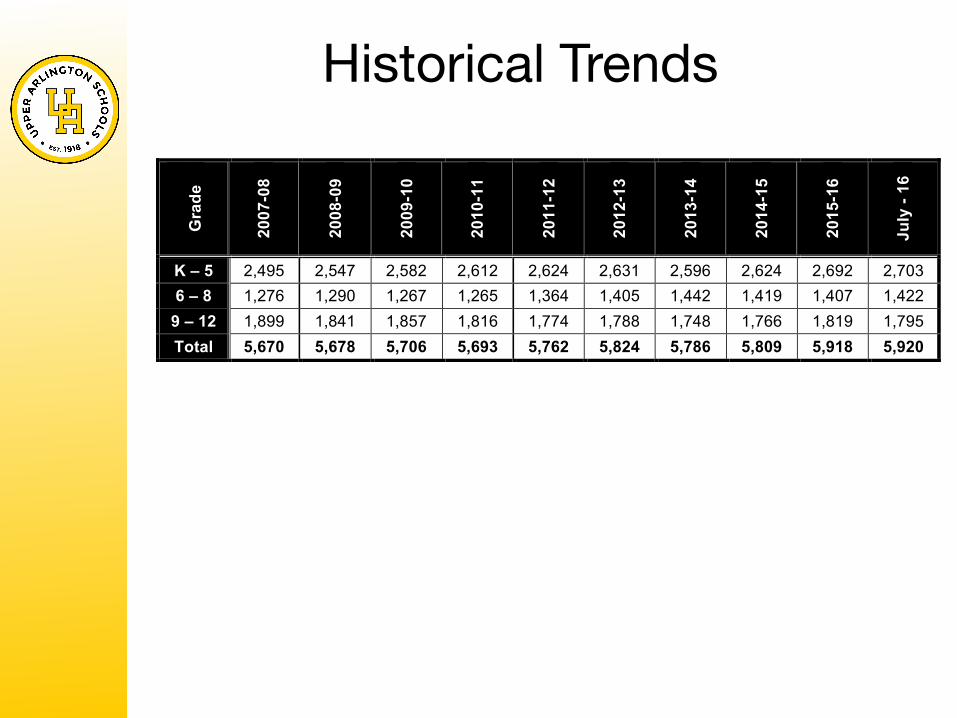
Historical Trends
G
rade
2007
-08
2008
-09
2009
-10
2010
-11
2011
-12
2012
-13
2013
-14
2014
-15
2015
-16
July
- 16
K – 5 2,495 2,547 2,582 2,612 2,624 2,631 2,596 2,624 2,692 2,703 6 – 8 1,276 1,290 1,267 1,265 1,364 1,405 1,442 1,419 1,407 1,422
9 – 12 1,899 1,841 1,857 1,816 1,774 1,788 1,748 1,766 1,819 1,795 Total 5,670 5,678 5,706 5,693 5,762 5,824 5,786 5,809 5,918 5,920
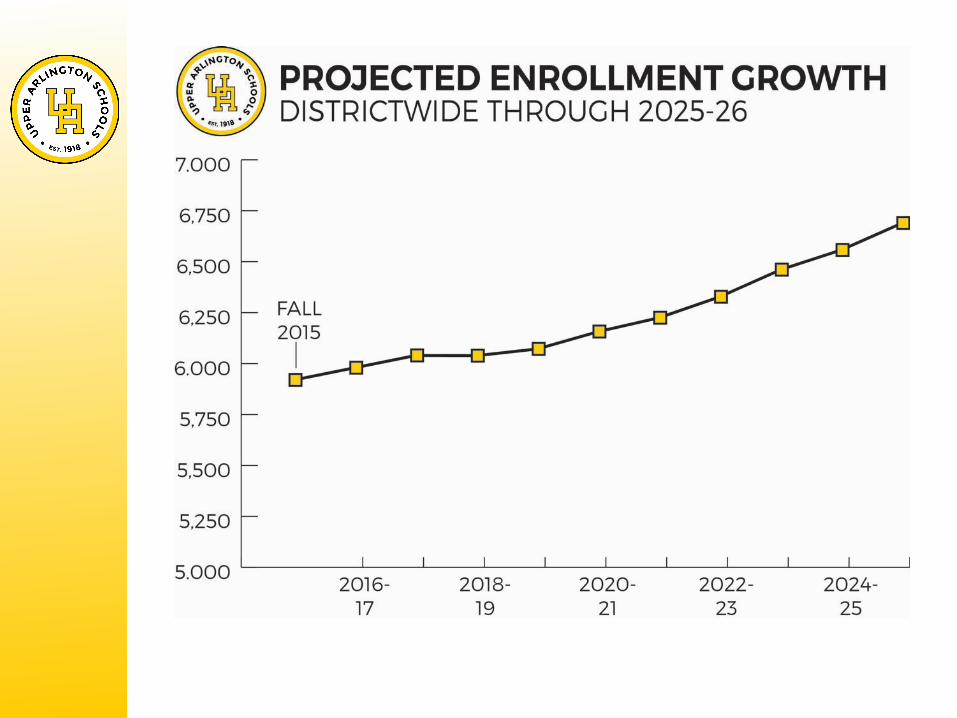
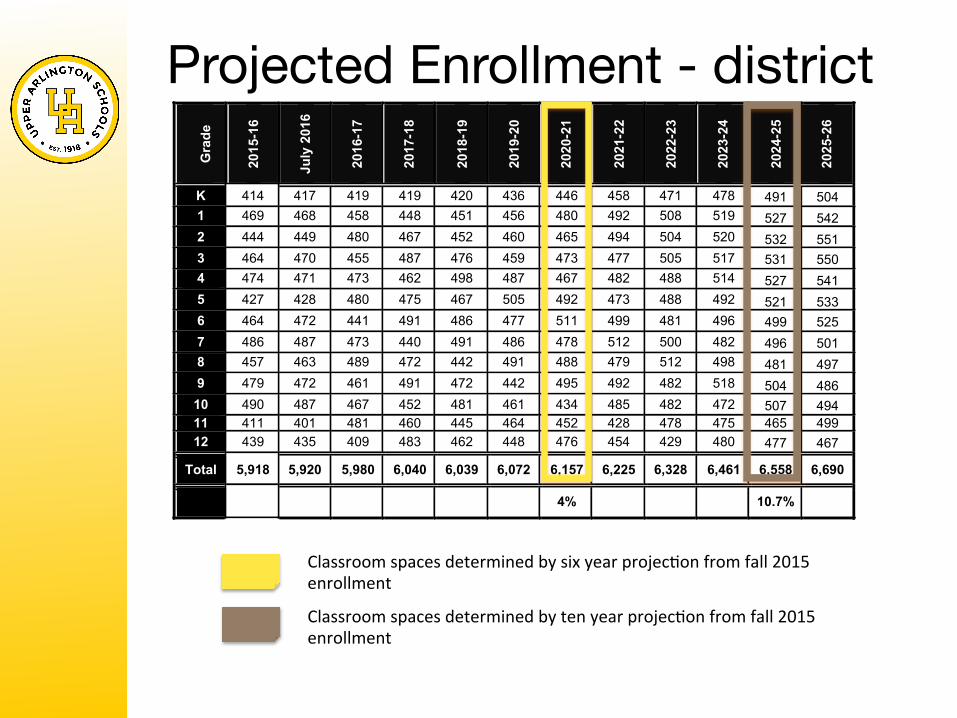
Projected Enrollment - district
G
rade
2015
-16
July
201
6
2016
-17
2017
-18
2018
-19
2019
-20
2020
-21
2021
-22
2022
-23
2023
-24
2024
-25
2025
-26
K 414 417 419 419 420 436 446 458 471 478 491 504 1 469 468 458 448 451 456 480 492 508 519 527 542 2 444 449 480 467 452 460 465 494 504 520 532 551 3 464 470 455 487 476 459 473 477 505 517 531 550 4 474 471 473 462 498 487 467 482 488 514 527 541 5 427 428 480 475 467 505 492 473 488 492 521 533 6 464 472 441 491 486 477 511 499 481 496 499 525 7 486 487 473 440 491 486 478 512 500 482 496 501 8 457 463 489 472 442 491 488 479 512 498 481 497 9 479 472 461 491 472 442 495 492 482 518 504 486
10 490 487 467 452 481 461 434 485 482 472 507 494 11 411 401 481 460 445 464 452 428 478 475 465 499 12 439 435 409 483 462 448 476 454 429 480 477 467
Total 5,918 5,920 5,980 6,040 6,039 6,072 6,157 6,225 6,328 6,461 6,558 6,690
4% 10.7%
Classroom spaces determined by ten year projecSon from fall 2015 enrollment
Classroom spaces determined by six year projecSon from fall 2015 enrollment
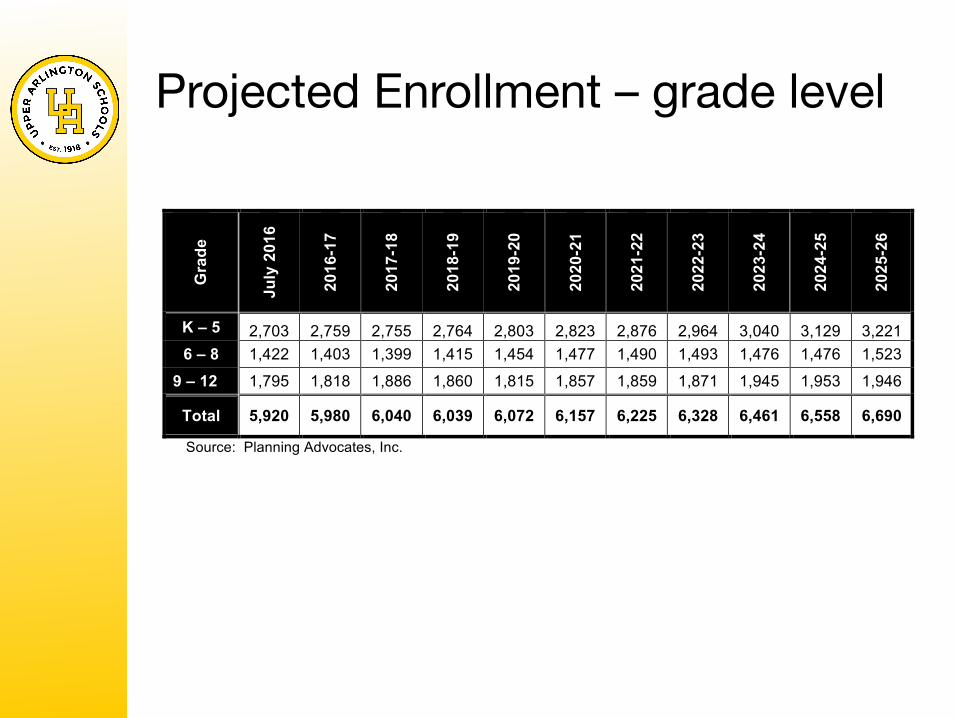
Projected Enrollment – grade level
Gra
de
July
201
6
2016
-17
2017
-18
2018
-19
2019
-20
2020
-21
2021
-22
2022
-23
2023
-24
2024
-25
2025
-26
K – 5 2,703 2,759 2,755 2,764 2,803 2,823 2,876 2,964 3,040 3,129 3,221 6 – 8 1,422 1,403 1,399 1,415 1,454 1,477 1,490 1,493 1,476 1,476 1,523
9 – 12 1,795 1,818 1,886 1,860 1,815 1,857 1,859 1,871 1,945 1,953 1,946
Total 5,920 5,980 6,040 6,039 6,072 6,157 6,225 6,328 6,461 6,558 6,690
Source: Planning Advocates, Inc.
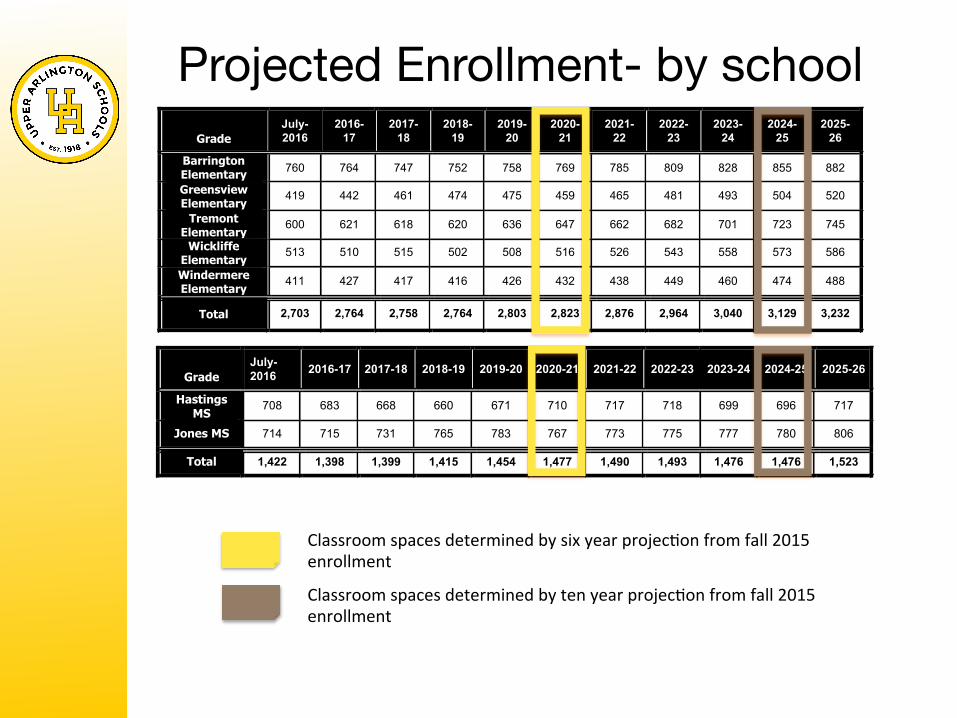
Projected Enrollment- by school
Grade July- 2016
2016-17
2017-18
2018-19
2019-20
2020-21
2021-22
2022-23
2023-24
2024-25
2025-26
Barrington Elementary 760 764 747 752 758 769 785 809 828 855 882
Greensview Elementary
419 442 461 474 475 459 465 481 493 504 520
Tremont Elementary
600 621 618 620 636 647 662 682 701 723 745
Wickliffe Elementary
513 510 515 502 508 516 526 543 558 573 586
Windermere Elementary
411 427 417 416 426 432 438 449 460 474 488
Total 2,703 2,764 2,758 2,764 2,803 2,823 2,876 2,964 3,040 3,129 3,232
Grade
July- 2016 2016-17 2017-18 2018-19 2019-20 2020-21 2021-22 2022-23 2023-24 2024-25 2025-26
Hastings MS
708 683 668 660 671 710 717 718 699 696 717
Jones MS 714 715 731 765 783 767 773 775 777 780 806
Total 1,422 1,398 1,399 1,415 1,454 1,477 1,490 1,493 1,476 1,476 1,523
Classroom spaces determined by ten year projecSon from fall 2015 enrollment
Classroom spaces determined by six year projecSon from fall 2015 enrollment
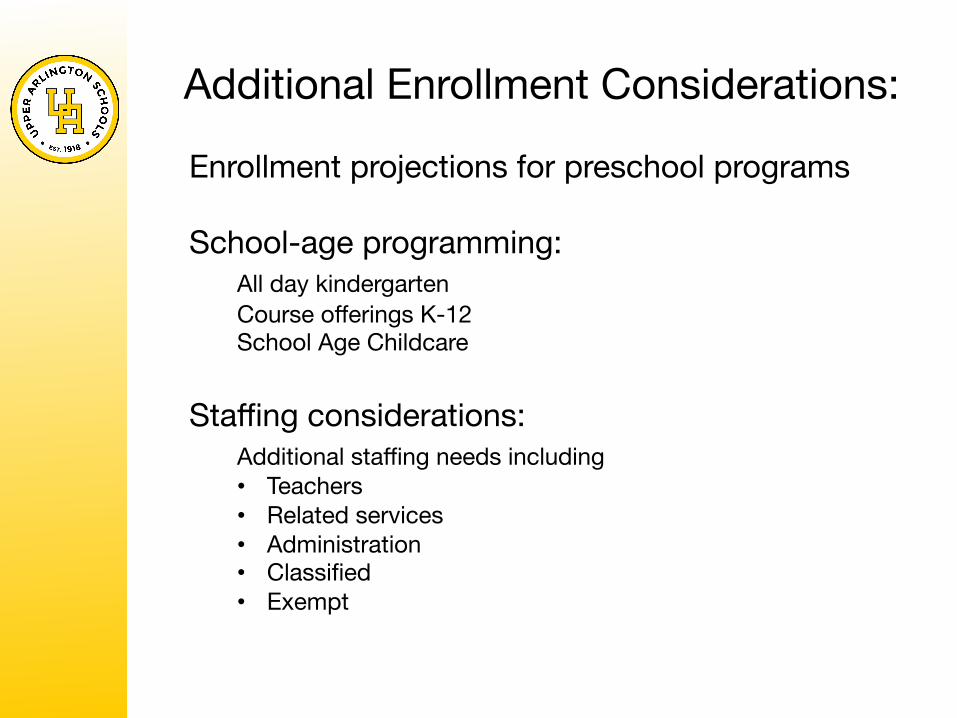
Additional Enrollment Considerations:
Enrollment projections for preschool programs School-age programming:
All day kindergarten Course offerings K-12 School Age Childcare
Staffing considerations:
Additional staffing needs including • Teachers • Related services • Administration • Classified • Exempt
POLICY UPDATES
DIGITAL CONVERSION UPDATESTRATEGIC PLAN PERSONALIZATION GOAL

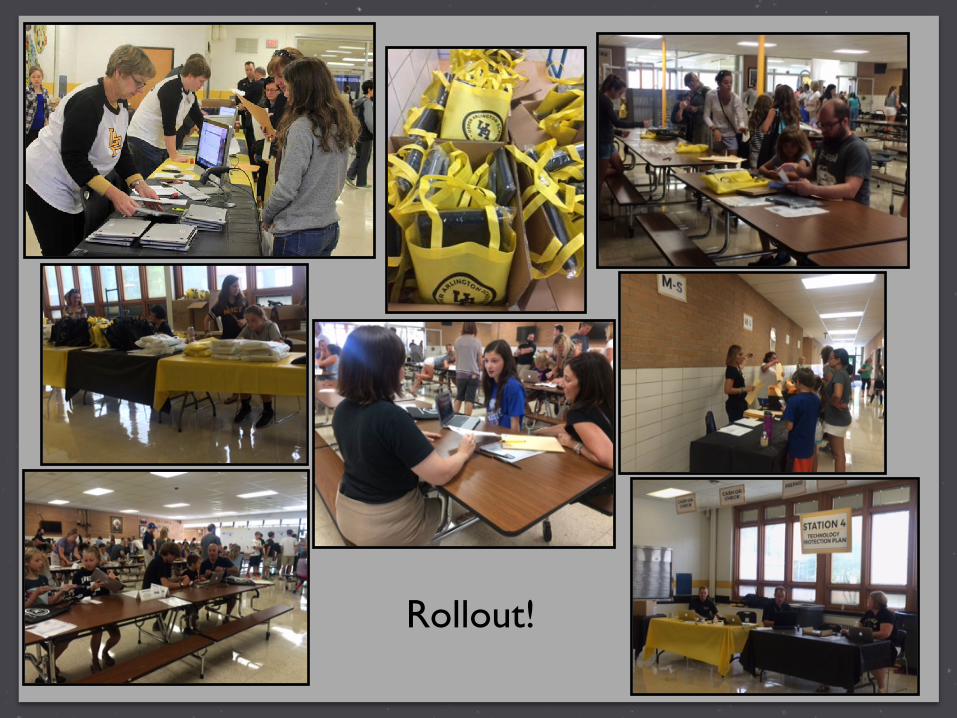
Rollout!
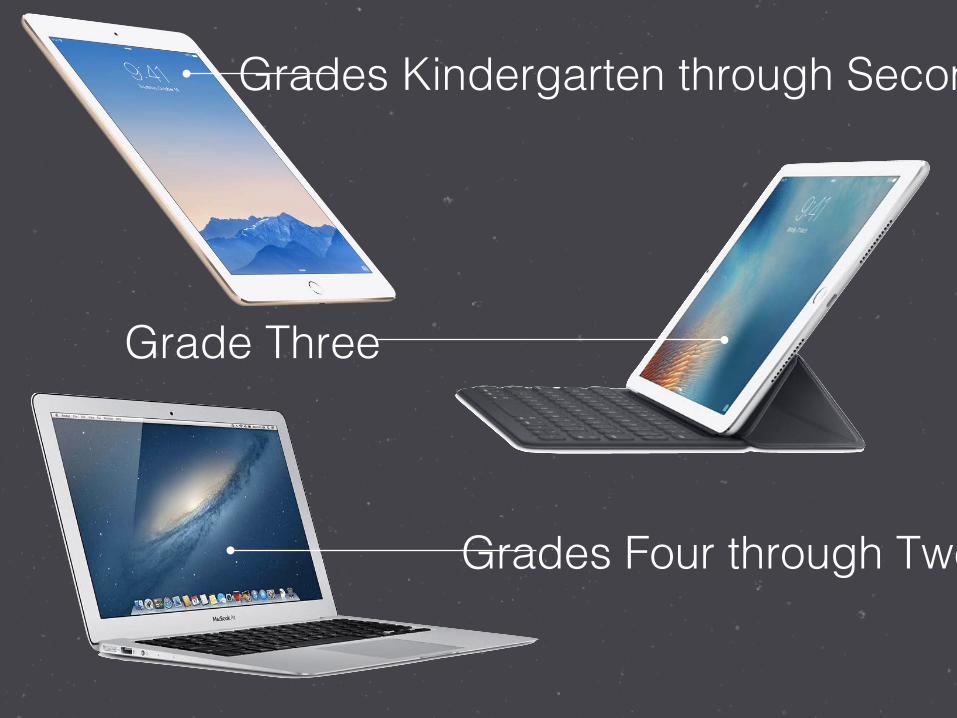
Grades Kindergarten through Second!
Grade Three!
Grades Four through Twelve!
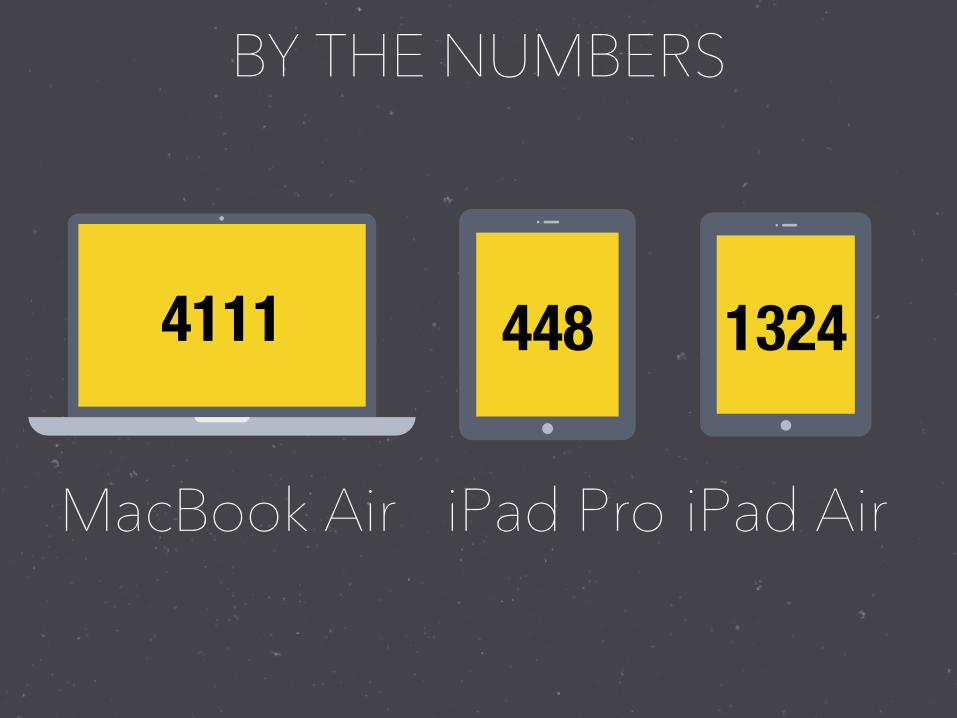
448 4111
BY THE NUMBERS
1324
MacBook Air iPad Pro iPad Air
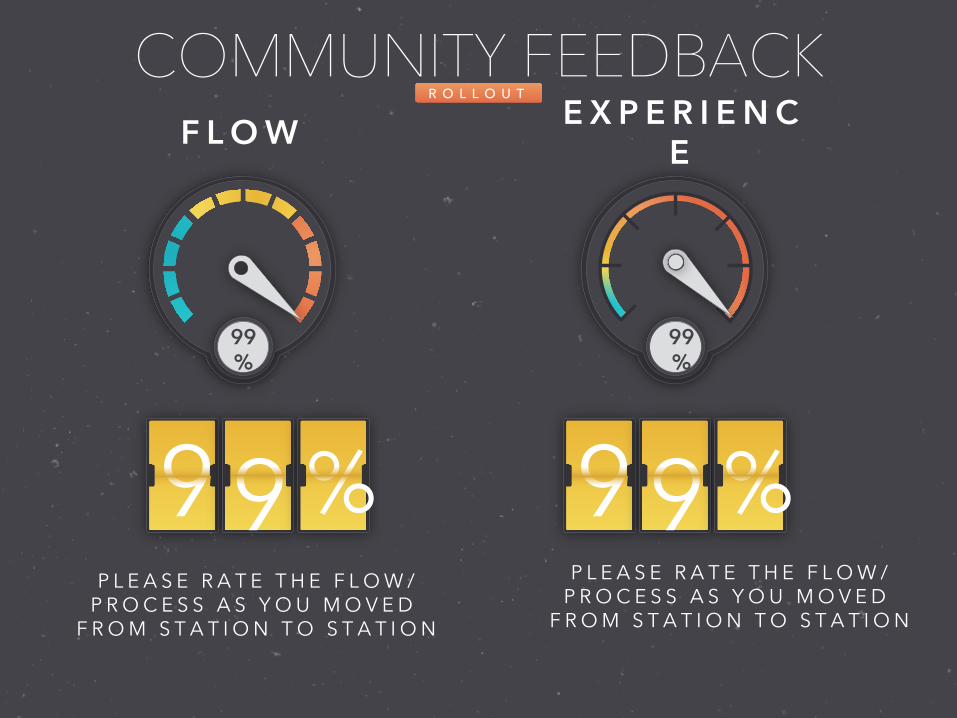
COMMUNITY FEEDBACK R O L L O U T
99%
F L O W
99%
9 9 % 9 9 %P L E A S E R A T E T H E F L O W /
P R O C E S S A S Y O U M O V E D F R O M S T A T I O N T O S T A T I O N
E X P E R I E N CE
P L E A S E R A T E T H E F L O W /P R O C E S S A S Y O U M O V E D
F R O M S T A T I O N T O S T A T I O N
UA Schools-I am AT HOME filling this out at 9 a.m (with iPad in hand) having had an 8 a.m. appointment. This process was unbelievably streamlined. The signage, abundance of staff & volunteers, and systematic stations were incredible. I certainly appreciate your consideration of families' time and the amazing amount of planning that must have gone into executing this process. High fives for all involved UA!
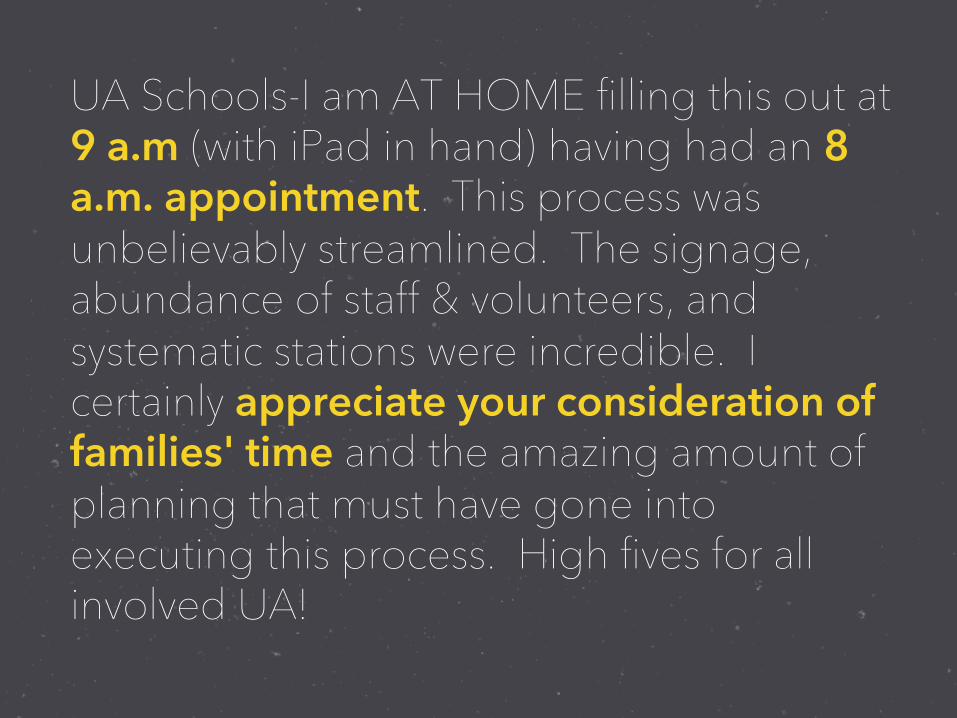
UA Schools-I am AT HOME filling this out at 9 a.m (with iPad in hand) having had an 8 a.m. appointment. This process was unbelievably streamlined. The signage, abundance of staff & volunteers, and systematic stations were incredible. I certainly appreciate your consideration of families' time and the amazing amount of planning that must have gone into executing this process. High fives for all involved UA!
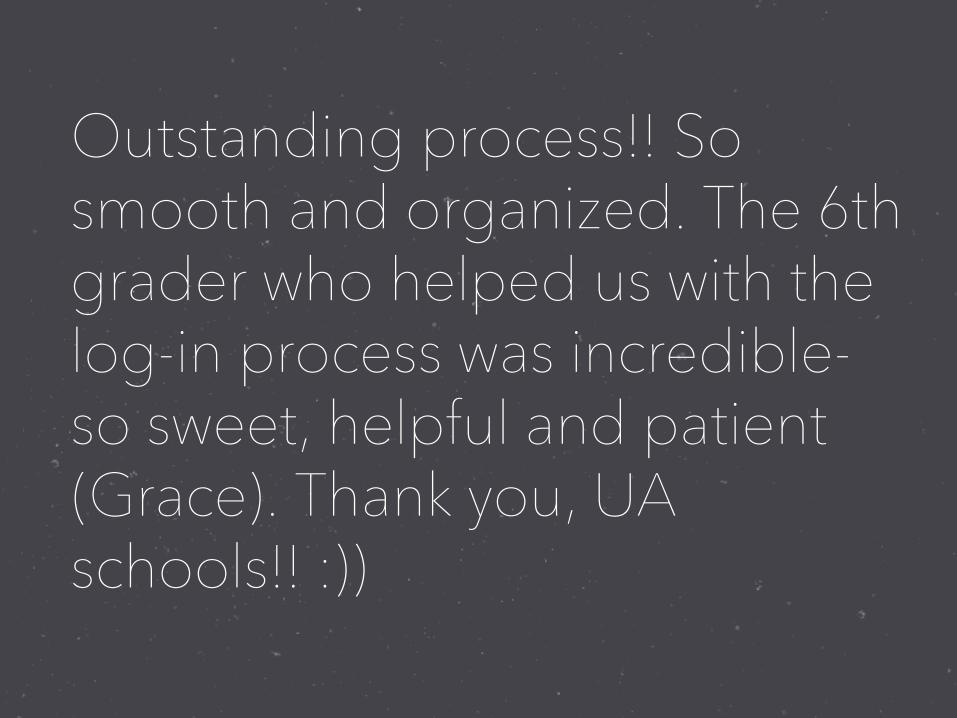
Outstanding process!! So smooth and organized. The 6th grader who helped us with the log-in process was incredible- so sweet, helpful and patient (Grace). Thank you, UA schools!! :))
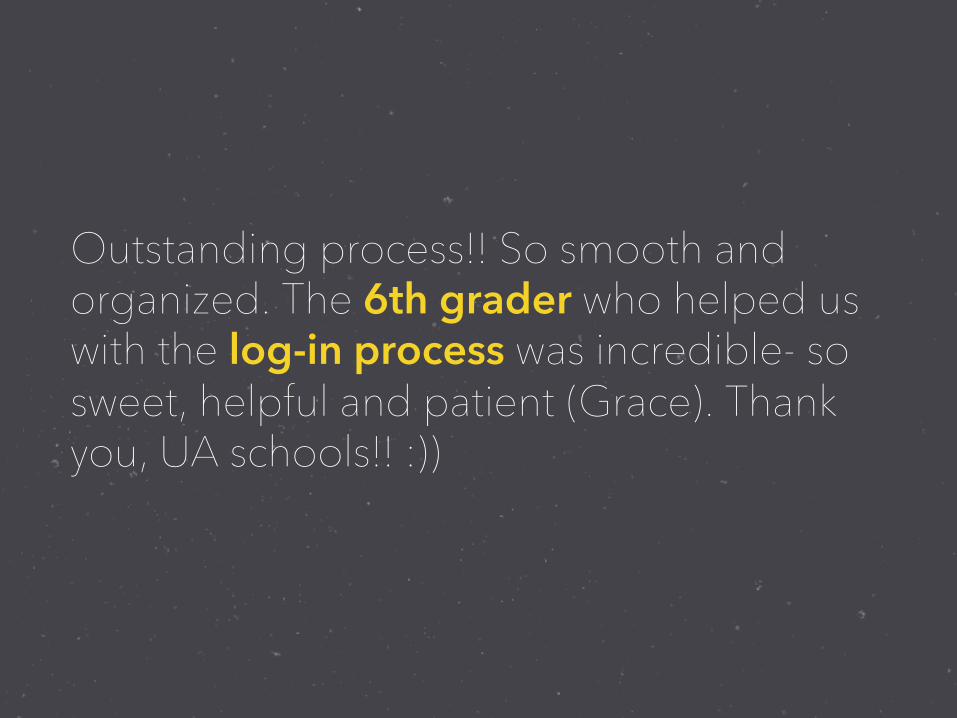
Outstanding process!! So smooth and organized. The 6th grader who helped us with the log-in process was incredible- so sweet, helpful and patient (Grace). Thank you, UA schools!! :))

Objective 2.2. Educators personalize instruction by leveraging technological resources and engaging in well-structured and meaningful collaborative planning time. Data Source: Building schedules, PowerSchool, and staff survey.

Objective 2.2. Educators personalize instruction by leveraging technological resources and engaging in well-structured and meaningful collaborative planning time. Data Source: Building schedules, PowerSchool, and staff survey.

STATE REPORT CARD UPDATE

2016 Ohio School Report Cards
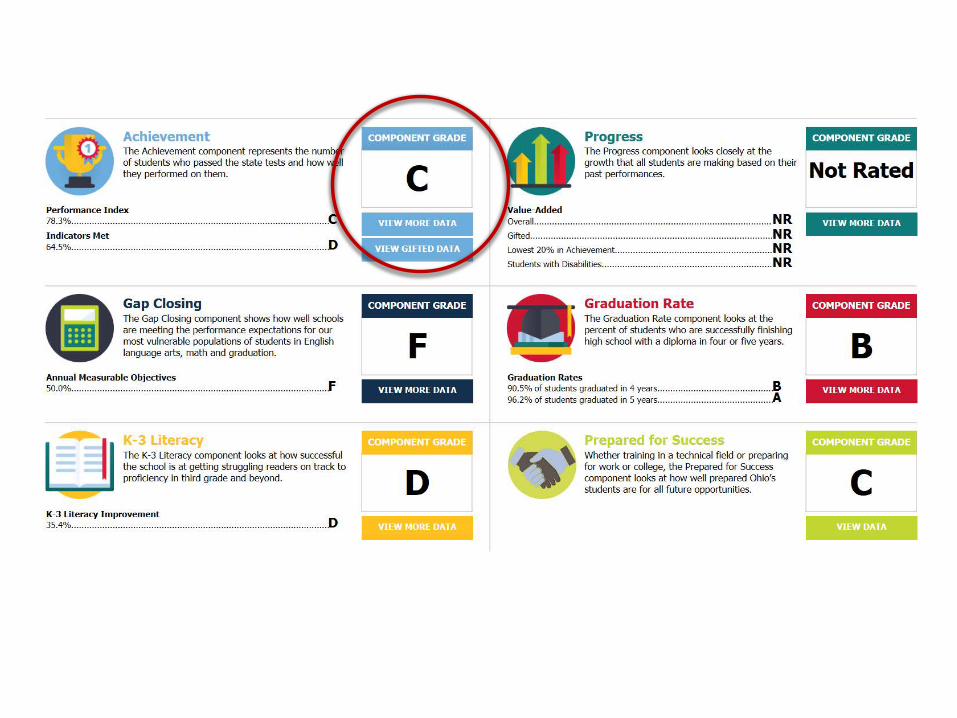
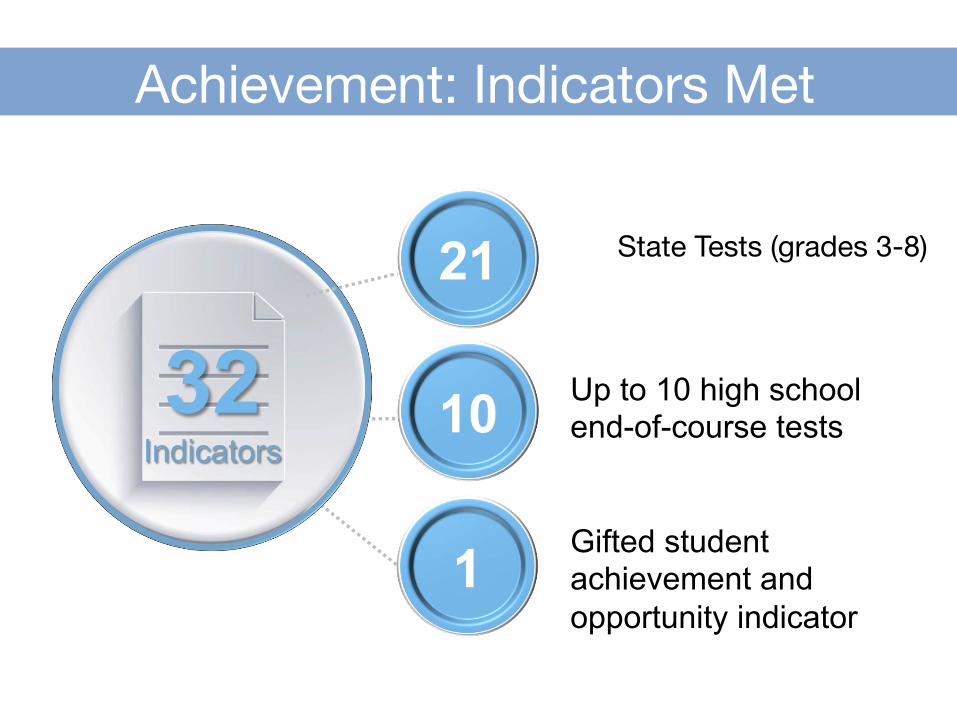
32 Indicators
State Tests (grades 3-8)
Achievement: Indicators Met
Up to 10 high school end-of-course tests
Gifted student achievement and opportunity indicator

Established Indicators Exam 2015
Indicators 2016 Indicators Indicators 2017 and
Beyond Grade 10 OGT Math 80% No 2016 Indicator No 2017 Indicator Grade 10 OGT Reading 80% No 2016 Indicator No 2017 Indicator Grade 10 OGT Science 80% No 2016 Indicator No 2017 Indicator Grade 10 OGT Social Studies 80% No 2016 Indicator No 2017 Indicator Grade 10 OGT Writing 80% No 2016 Indicator No 2017 Indicator Grade 11 OGT Math 85% 85% No 2017 Indicator Grade 11 OGT Reading 85% 85% No 2017 Indicator Grade 11 OGT Science 85% 85% No 2017 Indicator Grade 11 OGT Social Studies 85% 85% No 2017 Indicator Grade 11 OGT Writing 85% 85% No 2017 Indicator
Achievement: Indicators Met
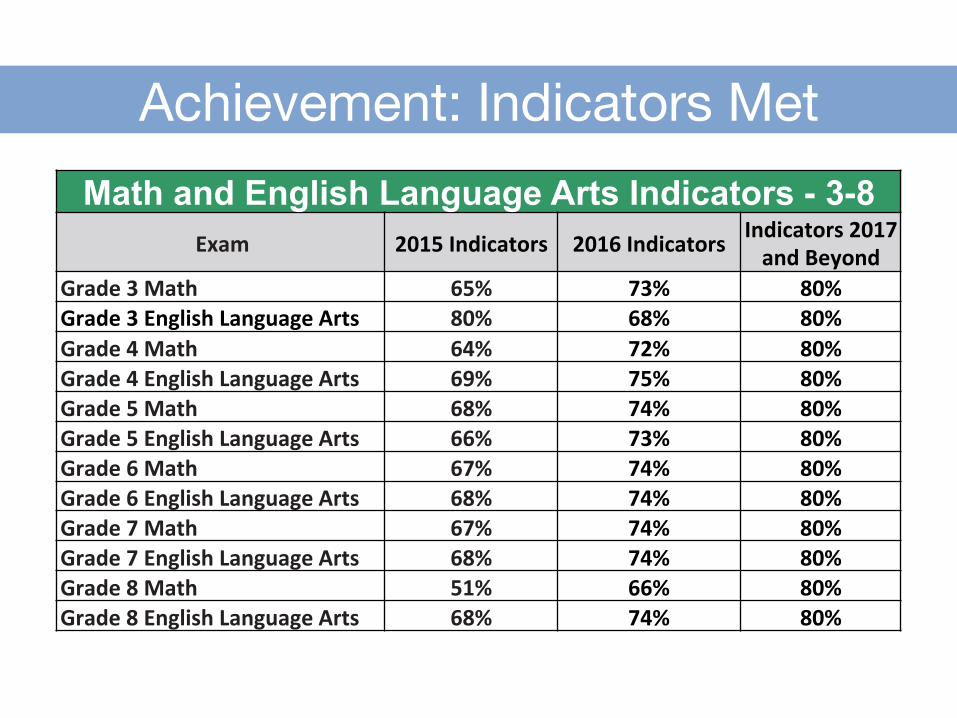
Math and English Language Arts Indicators - 3-8 Exam 2015 Indicators 2016 Indicators Indicators 2017 and Beyond
Grade 3 Math 65% 73% 80% Grade 3 English Language Arts 80% 68% 80% Grade 4 Math 64% 72% 80% Grade 4 English Language Arts 69% 75% 80% Grade 5 Math 68% 74% 80% Grade 5 English Language Arts 66% 73% 80% Grade 6 Math 67% 74% 80% Grade 6 English Language Arts 68% 74% 80% Grade 7 Math 67% 74% 80% Grade 7 English Language Arts 68% 74% 80% Grade 8 Math 51% 66% 80% Grade 8 English Language Arts 68% 74% 80%
Achievement: Indicators Met
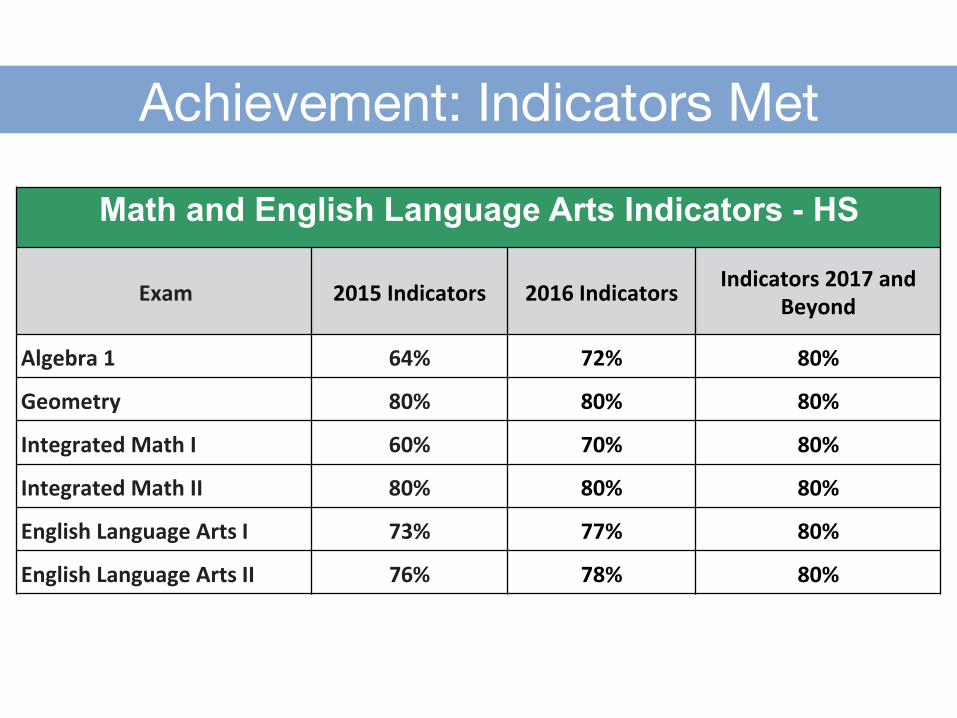
Math and English Language Arts Indicators - HS
Exam 2015 Indicators 2016 Indicators Indicators 2017 and Beyond
Algebra 1 64% 72% 80%
Geometry 80% 80% 80%
Integrated Math I 60% 70% 80%
Integrated Math II 80% 80% 80%
English Language Arts I 73% 77% 80%
English Language Arts II 76% 78% 80%
Achievement: Indicators Met
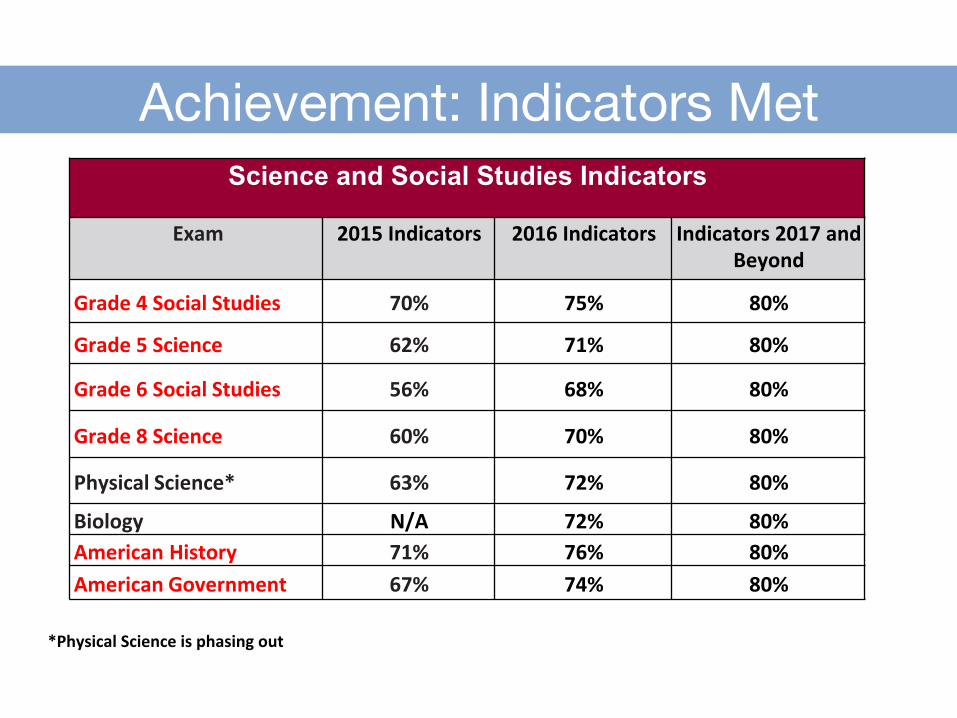
Science and Social Studies Indicators
Exam 2015 Indicators 2016 Indicators Indicators 2017 and Beyond
Grade 4 Social Studies 70% 75% 80%
Grade 5 Science 62% 71% 80%
Grade 6 Social Studies 56% 68% 80%
Grade 8 Science 60% 70% 80%
Physical Science* 63% 72% 80%
Biology N/A 72% 80% American History 71% 76% 80% American Government 67% 74% 80%
*Physical Science is phasing out
Achievement: Indicators Met
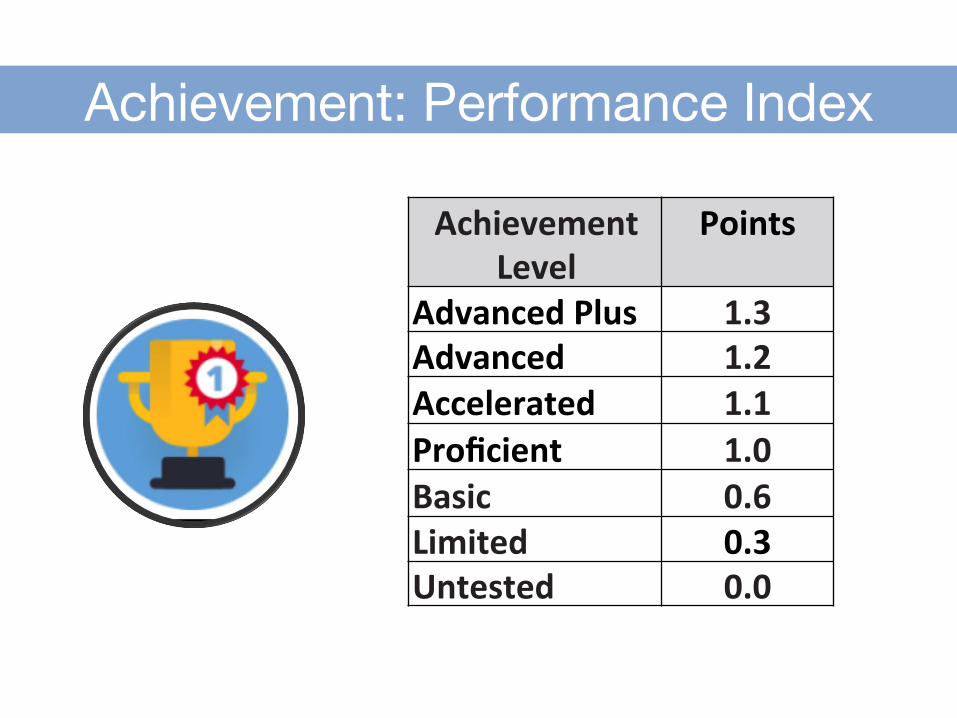
Achievement Level
Points
Advanced Plus 1.3 Advanced 1.2 Accelerated 1.1 Proficient 1.0 Basic 0.6 Limited 0.3 Untested 0.0
Achievement: Performance Index
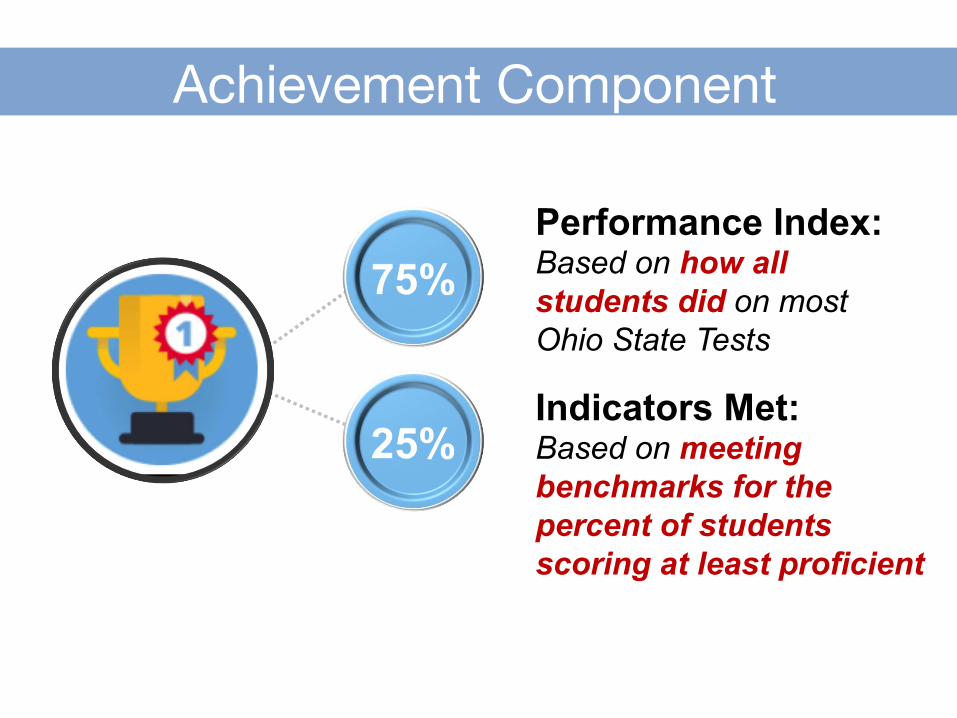
Achievement Component
Performance Index: Based on how all students did on most Ohio State Tests
Indicators Met: Based on meeting benchmarks for the percent of students scoring at least proficient
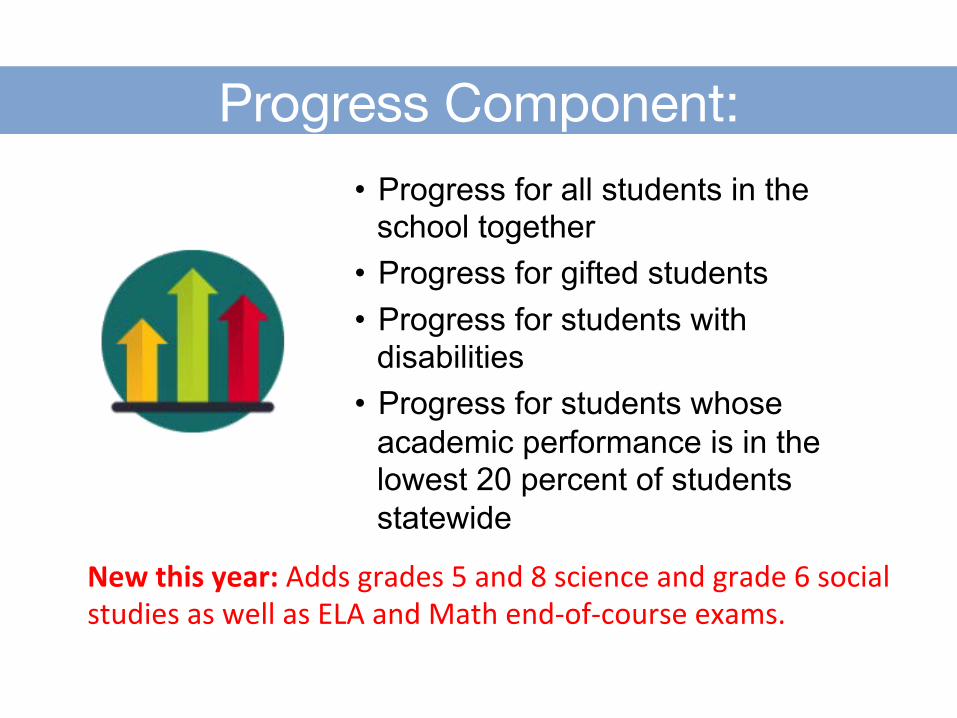
Progress Component: • Progress for all students in the
school together • Progress for gifted students • Progress for students with
disabilities • Progress for students whose
academic performance is in the lowest 20 percent of students statewide
New this year: Adds grades 5 and 8 science and grade 6 social studies as well as ELA and Math end-‐of-‐course exams.
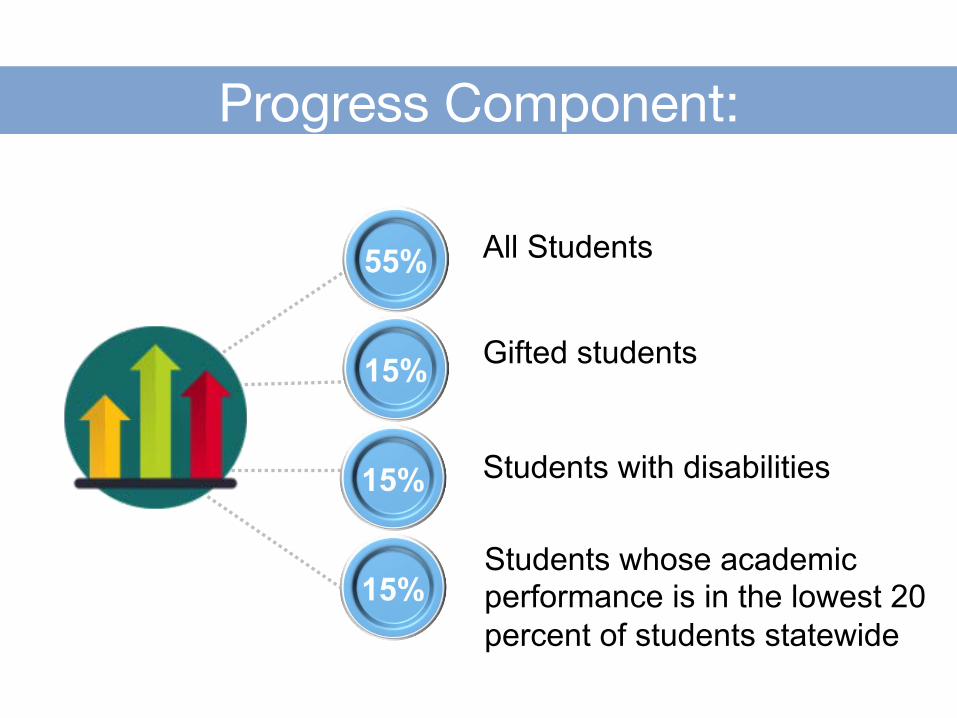
Progress Component:
All Students
Gifted students
Students with disabilities
Students whose academic performance is in the lowest 20 percent of students statewide
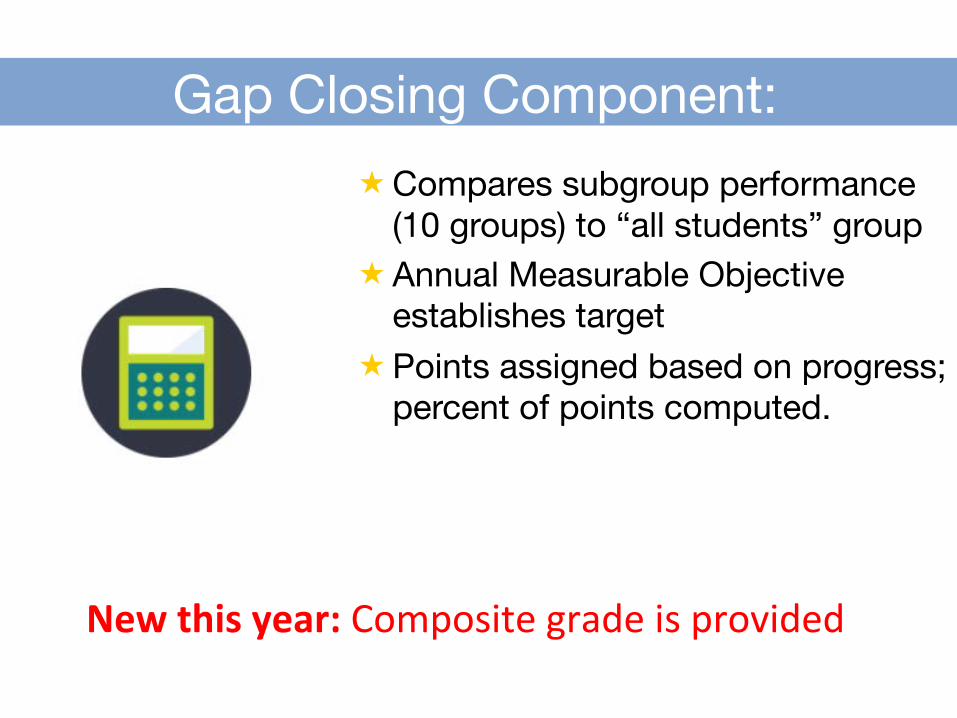
Gap Closing Component: « Compares subgroup performance
(10 groups) to “all students” group « Annual Measurable Objective
establishes target « Points assigned based on progress;
percent of points computed.
New this year: Composite grade is provided
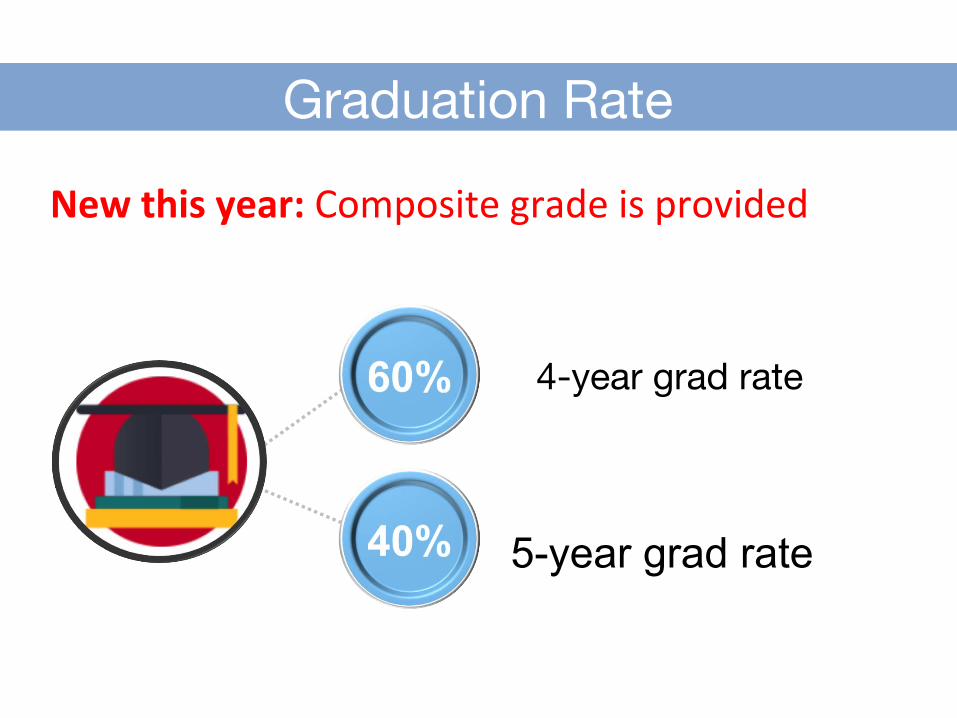
Graduation Rate
4-year grad rate
5-year grad rate
New this year: Composite grade is provided
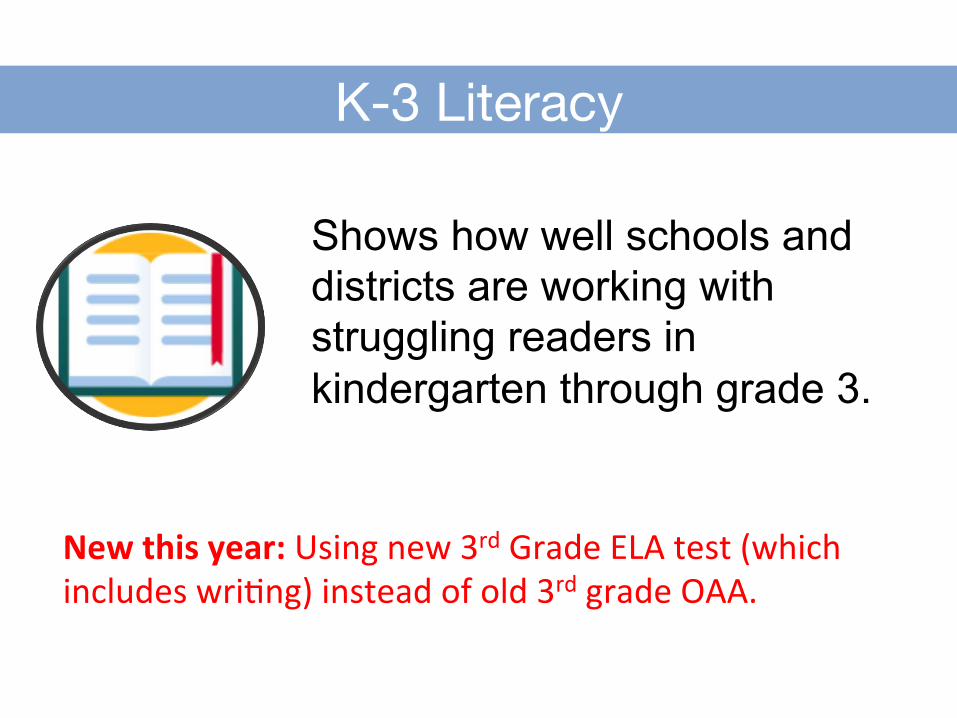
K-3 Literacy
Shows how well schools and districts are working with struggling readers in kindergarten through grade 3.
New this year: Using new 3rd Grade ELA test (which includes wriSng) instead of old 3rd grade OAA.
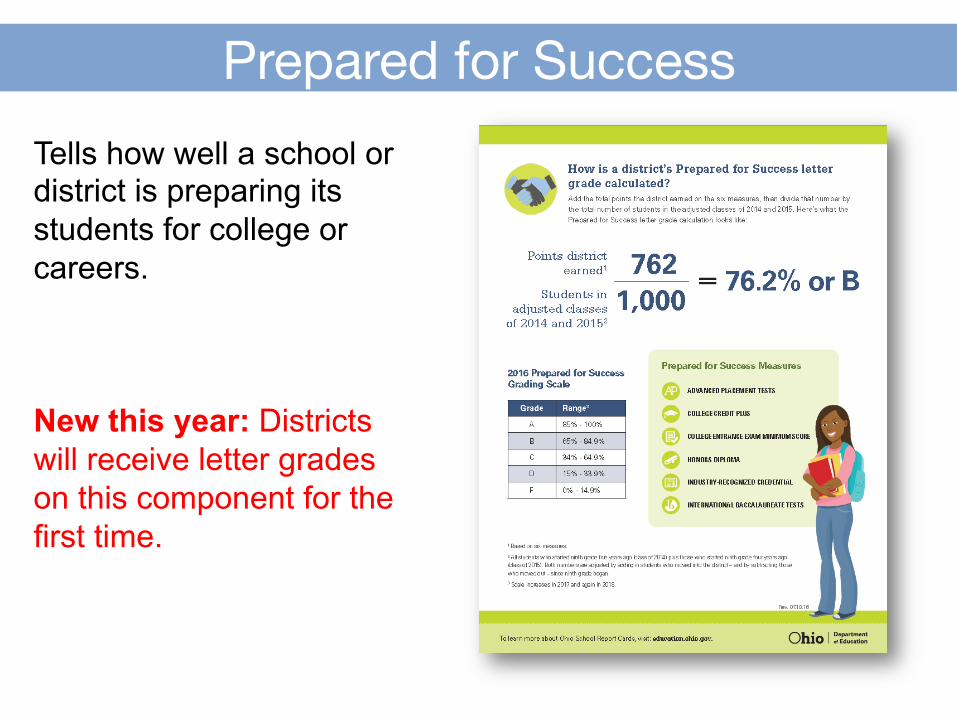
Prepared for Success Tells how well a school or district is preparing its students for college or careers. New this year: Districts will receive letter grades on this component for the first time.
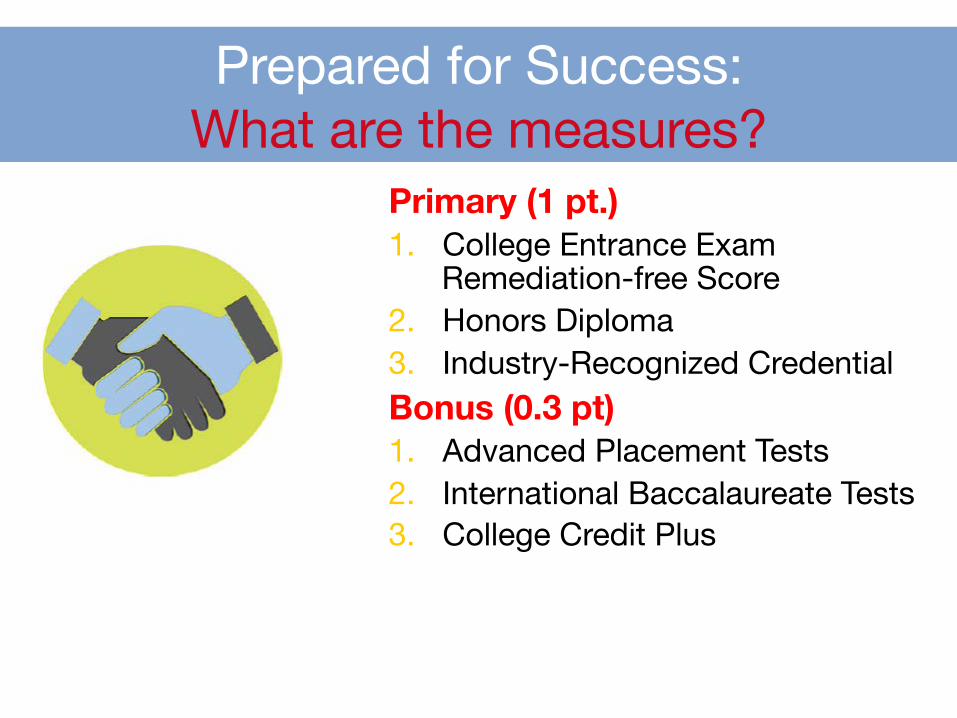
Prepared for Success: What are the measures?
Primary (1 pt.) 1. College Entrance Exam
Remediation-free Score 2. Honors Diploma 3. Industry-Recognized Credential Bonus (0.3 pt) 1. Advanced Placement Tests 2. International Baccalaureate Tests 3. College Credit Plus
Key Messages
The report card reflects what the Ohio Department EducaDon considers higher standards. State tests are more rigorous and are aligned to new Ohio Learning Standards. There are many changes on the report card – new tests, different indicators, higher benchmarks.
Key Messages Some measures – like the Achievement Measures – can’t be compared to last year’s results because they are based on new tests and new indicator targets.
Teachers, schools and the district will use this report card as one source of informaSon to support discussions about teaching and learning and to make informed decisions about instrucDonal pracDces.
Key Messages
The district will conDnue to put emphasis on the development of the whole child through its Quality Profile. There’s more to a child’s learning than what is measured on the report card. The report card is one – but certainly not the only – measure of school and district performance.

Report Card Resources
Resources available:
• 2016 Report Card Guide
• Component Fact Sheets www.education.ohio.gov Search: Report Card Resources
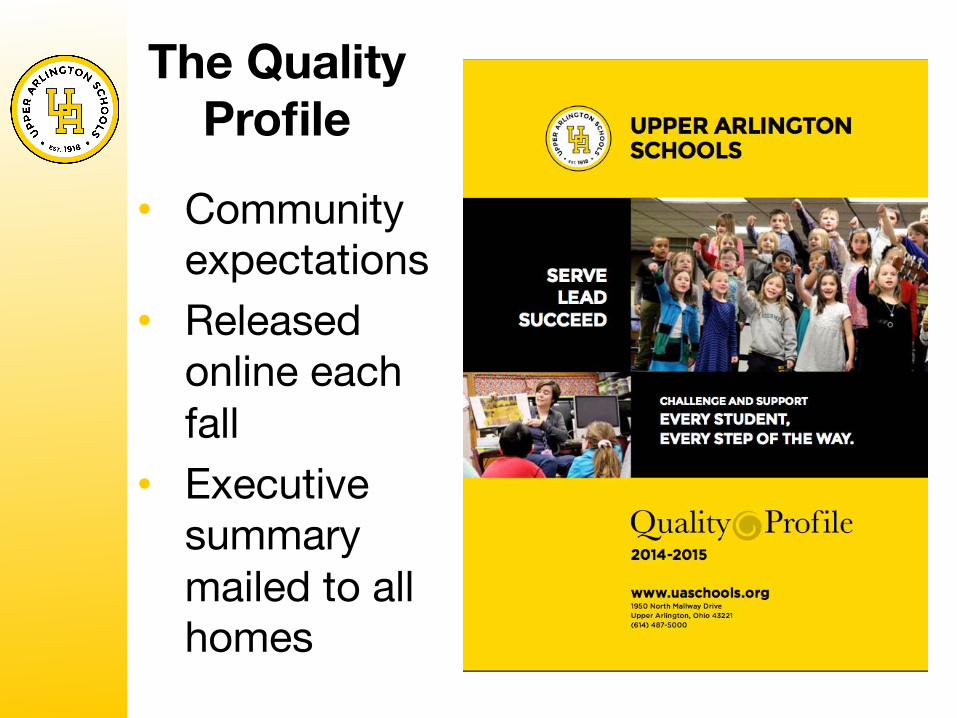
The Quality Profile
• Community expectations
• Released online each fall
• Executive summary mailed to all homes
TREASURER’S REPORT
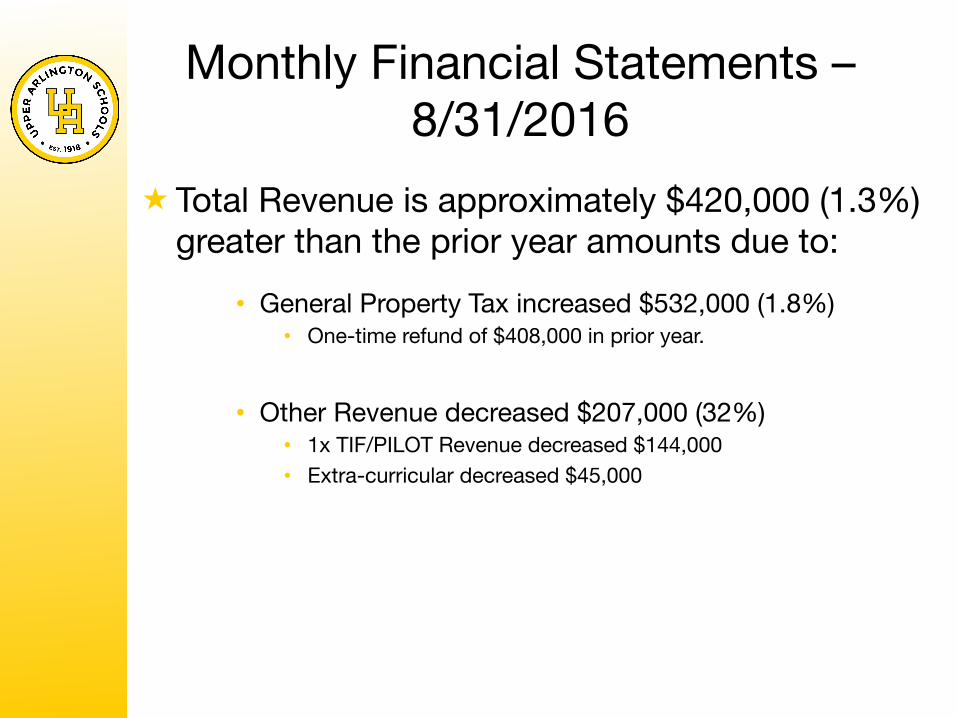
Monthly Financial Statements – 8/31/2016
« Total Revenue is approximately $420,000 (1.3%) greater than the prior year amounts due to:
• General Property Tax increased $532,000 (1.8%) • One-time refund of $408,000 in prior year.
• Other Revenue decreased $207,000 (32%) • 1x TIF/PILOT Revenue decreased $144,000 • Extra-curricular decreased $45,000
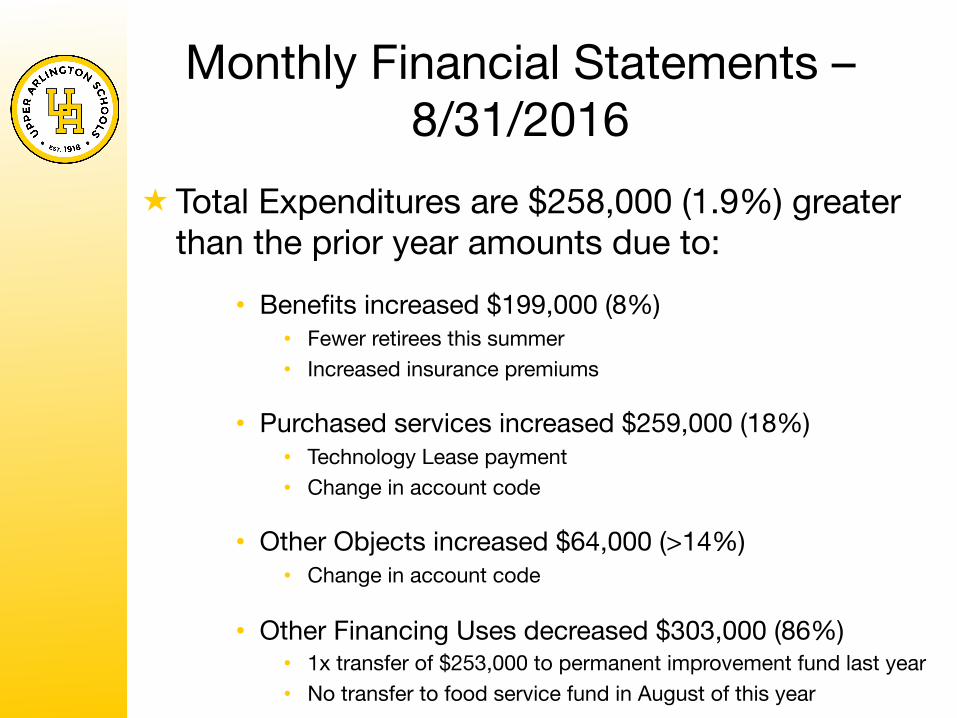
Monthly Financial Statements – 8/31/2016
« Total Expenditures are $258,000 (1.9%) greater than the prior year amounts due to:
• Benefits increased $199,000 (8%) • Fewer retirees this summer • Increased insurance premiums
• Purchased services increased $259,000 (18%) • Technology Lease payment • Change in account code
• Other Objects increased $64,000 (>14%) • Change in account code
• Other Financing Uses decreased $303,000 (86%) • 1x transfer of $253,000 to permanent improvement fund last year • No transfer to food service fund in August of this year
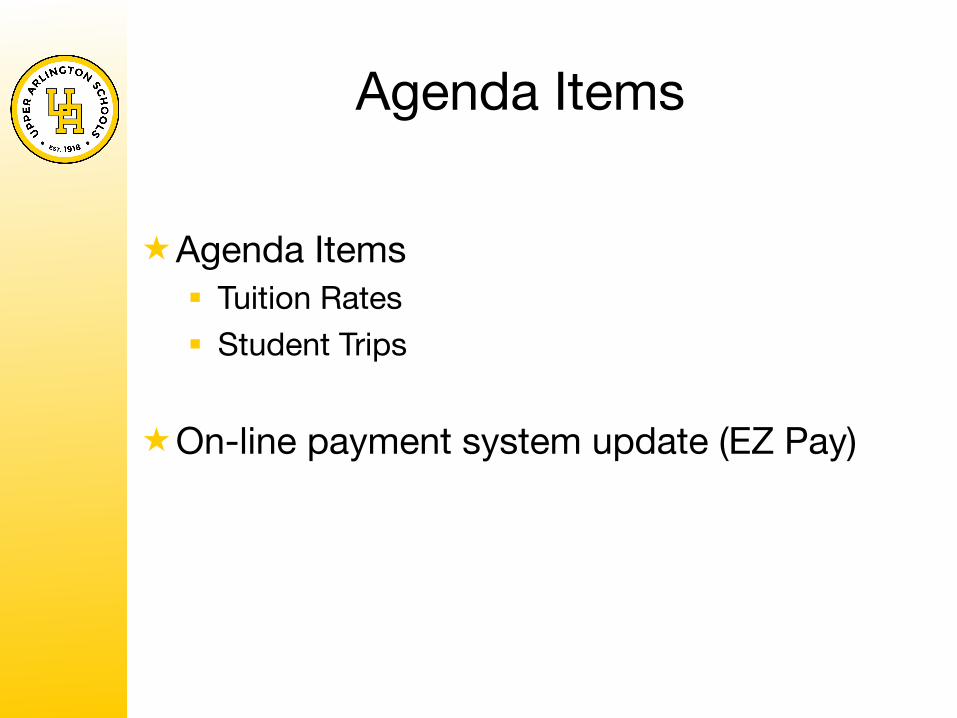
Agenda Items
« Agenda Items § Tuition Rates § Student Trips
« On-line payment system update (EZ Pay)
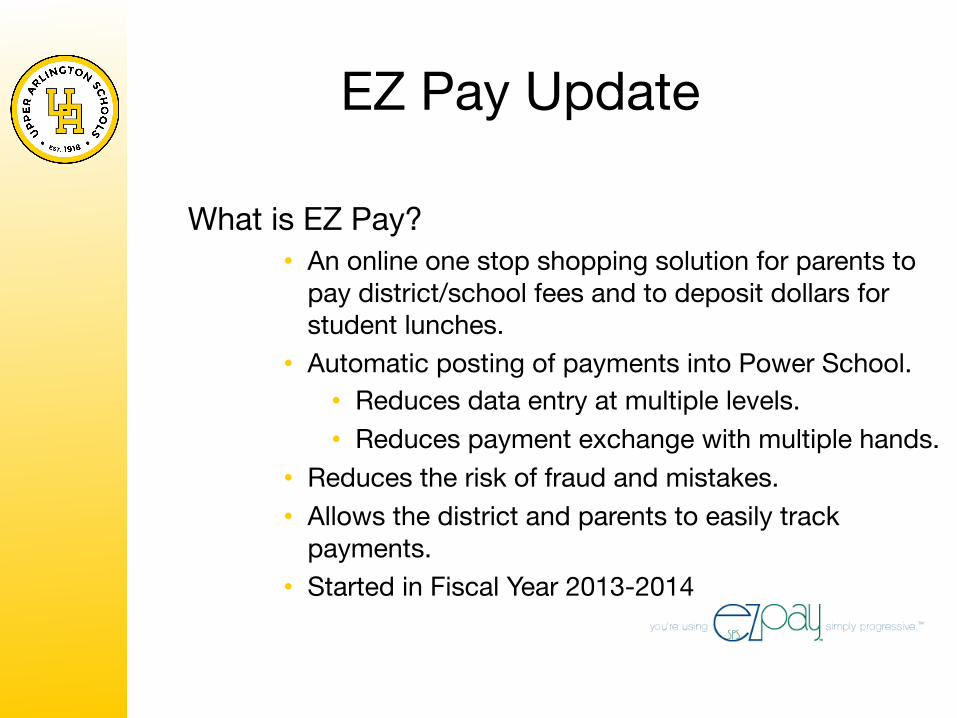
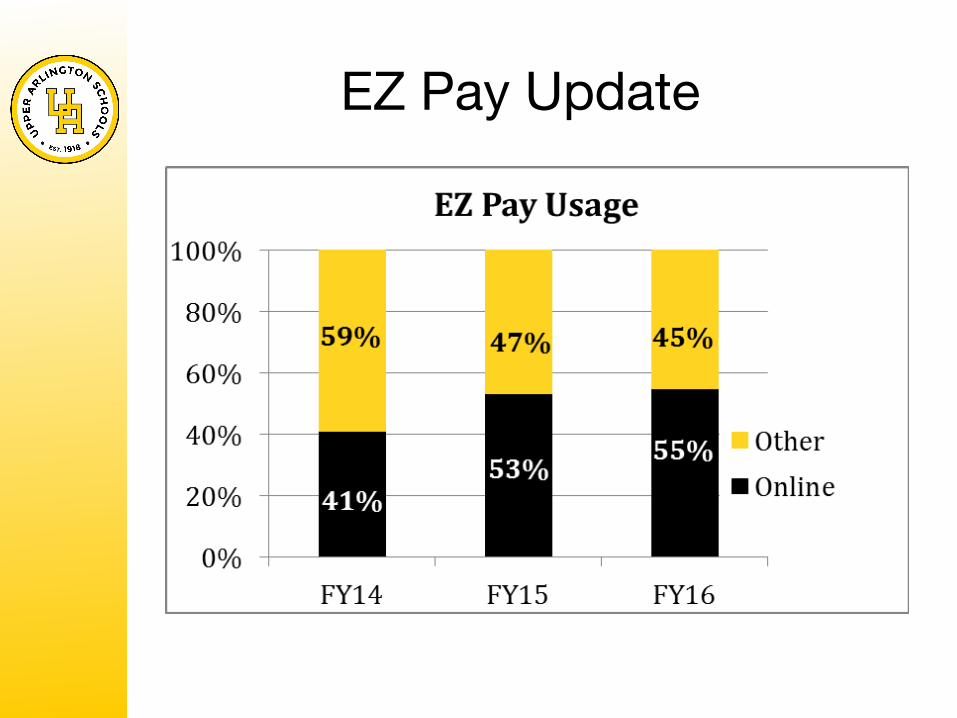
EZ Pay Update
What is EZ Pay? • An online one stop shopping solution for parents to
pay district/school fees and to deposit dollars for student lunches.
• Automatic posting of payments into Power School. • Reduces data entry at multiple levels. • Reduces payment exchange with multiple hands.
• Reduces the risk of fraud and mistakes. • Allows the district and parents to easily track
payments. • Started in Fiscal Year 2013-2014

EZ Pay Update
0
1,000
2,000
3,000
4,000
5,000
6,000
FY15 FY16
FY17
# of Stude
nts
EZ Pay Usage -‐ (# of Students with a payment)
July -‐ August
EnDre Fiscal Year
EZ Pay Update
EZ Pay Update
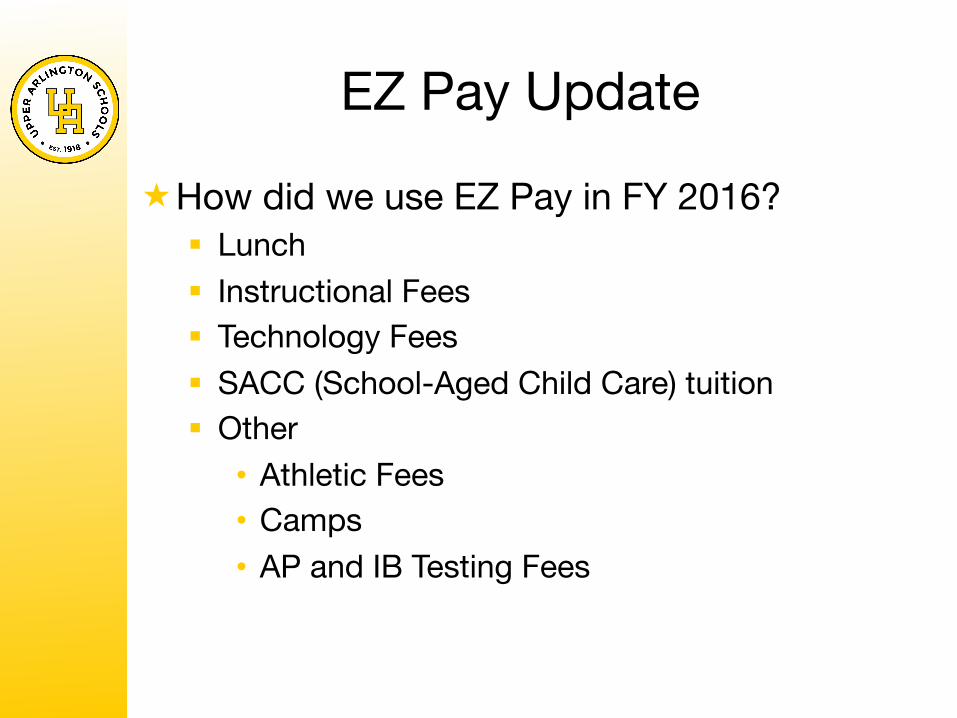
« How did we use EZ Pay in FY 2016? § Lunch § Instructional Fees § Technology Fees § SACC (School-Aged Child Care) tuition § Other
• Athletic Fees • Camps • AP and IB Testing Fees
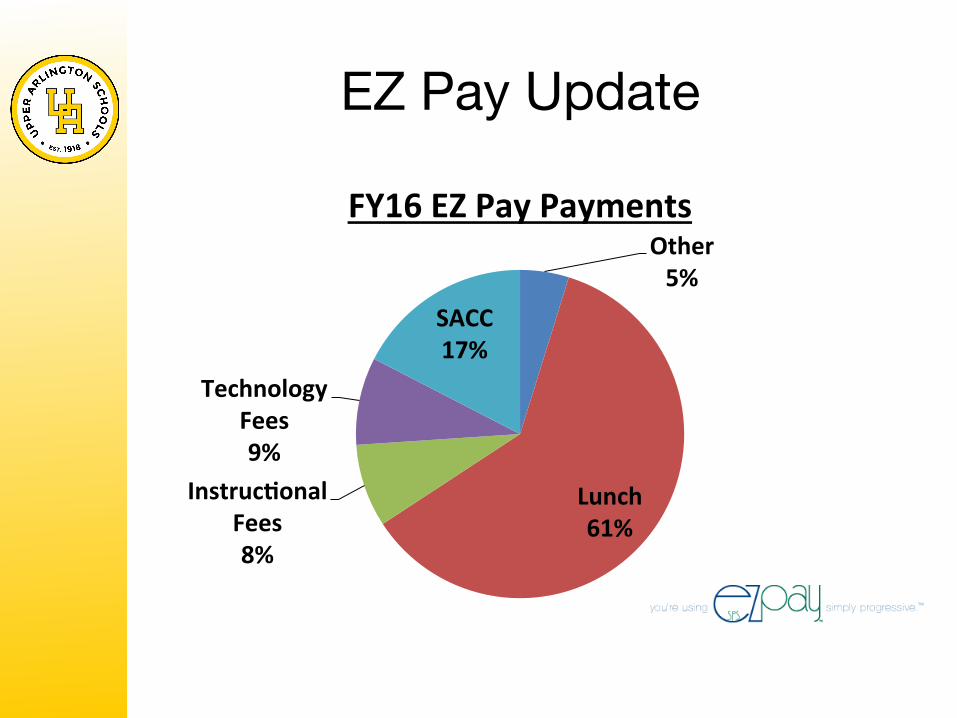
EZ Pay Update
Other 5%
Lunch 61%
InstrucDonal Fees 8%
Technology Fees 9%
SACC 17%
FY16 EZ Pay Payments

![CSD Paraprofessional Handbook - Home - · Web viewCSD Paraprofessional Handbook Page 13 of 13 [Type here][Type here][Type here] Chamberlain School District Paraprofessional Handbook](https://img.pdfslide.us/doc/110x75/5aa3aaf67f8b9ab4208e8de9/csd-paraprofessional-handbook-home-viewcsd-paraprofessional-handbook-page.jpg)