Embed Size (px)
Citation preview

2616 Anal. Chem. 1989, 61, 2616-2624
Supercritical Fluid Chromatography/Flame Photometric Detection: Determination of High Molecular Weight Compounds Lars A. Pekay and Susan V. Olesik* Department of Chemistry, The Ohio State University, 120 West 18th Avenue, Columbus, Ohio 43210
The determination of organosulfur compounds by supercritical fluid chromatographyMlame photometrlc detectbn (SFCIFPD) was further characterlzed. The noise characteristics of the optimized flame photometric detector were determined. The detection hlt was found to be shot-noise-lknlted for detection of anaiytes from capillary SFC uslng supercritical carbon di- oxlde as the moblle phase. The sensltivlty of SFC/FPD was found to be greater than that of SFC/FID (flame Ionization detection). The use of highly tapered restrlctors substantially lowered the variation of the base line of the FPD durlng pressure programs. Also, the application of SFCIFPD to the separation and detection of hlgh molecular weight polymers was shown. The detection iimlt increased sllghtly with in- creasing molecular welght of the sample. The effect of re- placing carbon atoms in the sample wlth sulfur atoms on SFC retention was studied. Retention of the organosulfur com- pounds on a cyano-substltuted statlonary phase wlth super- crltical carbon dioxkle as the mobne phase was sknllar to that found for normal-phase llquid chromatography. The retention behavior of Lewis bases showed that interactions wlth free sHaM groups on the stationary phase signlfkantly contrlbuted to the retention on the cyano phase.
INTRODUCTION The applications of supercritical fluid chromatography are
multiplying rapidly. Supercritical fluid chromatography (SFC) is not supplanting gas chromatography (GC) or high-per- formance liquid chromatography (HPLC), but instead SFC is most useful in many applications where neither GC nor HPLC is viable. To further widen the scope of utility of supercritical fluid chromatography, the easy interface of SFC with selective detectors has been successfully demonstrated
We recently showed that if properly optimized, a single- flame, flame photometric detector (FPD) is a viable SFC detector for selectively determining the presence of sulfur in chromatographed analytes (4 ) . In a previous report (4), the SFC/FPD technique was found to have some characteristics similar to those of GC/FPD and others that were unique. For example, the optimized SFC/FPD and GC/FPD both have detectivity ranges of 1 X g/s. Also, the slopes of the log-log calibration curves in SFC/FPD and GC/FPD are statistically the same for the same compound. This in- formation was significant evidence that the mechanisms for sulfur dimer formation and chemiluminescence were similar in both SFC/FPD and GC/FPD. Conversely, the quenching effect on the sulfur dimer chemiluminescence caused by the presence of hydrocarbons in the flame was found to be smaller in SFC/FPD than in GC/FPD (5) or in HPLC/FPD due to differences in flame conditions (6).
This paper includes the further characterization of the SFC/FPD technique. This characterization involved (1) an investigation of possible methods to eliminate the variation in the base line during pressure programming, (2) an analysis of the noise sources that limit sulfur detection, (3) a com- parison of the sensitivity of SFC/FPD and SFC/flame ion-
(1-3).
to 1 X
ization detection (FID), (4) a demonstration of possible ap- plications of SFC/FPD such as the determination of pesti- cides, organosulfur drugs, and model coal compounds, (5) a demonstration that SFC/FPD can be used for the sulfur analysis of high molecular weight compounds, and (6) a study on the effect of sulfur atoms in a molecule on the retention in SFC.
EXPERIMENTAL SECTION The instrumentation used in this study was described previously
(4 ) . The flame photometric detector (FPD) was a Hewlett- Packard Model 19256.4, which is a single-flame device. For the experiments described in this paper, pressure programming was necessary. Pressure programming was achieved by controlling the syringe pump, an ISCO p-LC500 (ISCO, Lincoln, NE), with an analog signal that was produced by a digital to analog converter, Model DT2821 (Data Translations, Marlboro, MA), incorporated in the Zenith 2-200 computer system. The data collection from the FPD, data analysis, and pressure programming were accom- plished by using original programs written in the ASYST labo- ratory analysis and programming environment (ASYST Software Technology, Rochester, NY). Frequency domain spectra of the base-line noise on the FPD output were obtained by placing a current amplifier, Model 427 (Keithley Instruments, Cleveland, OH), and a low band-pass filter, Model 3340 (Krohn-Hite Corp., Avon, MA), in series between the photomultiplier’s current output signal and an analog to digital converter (Data Translations Model DT2821).
The fuel and oxidant gases for the FPD were instrument-grade hydrogen and oxygen (Matheson Gas Products, Chicago, IL). All analytes in this study were used as delivered and were injected into the supercritical fluid chromatograph as solutes dissolved in either spectrophotometric grade methanol or anhydrous grade acetone (Mallinckrodt Chemical, Inc., Paris, KY). Methyl-p-tolyl sulfide, thiophenol, benzo[b]thiophene, phenyl sulfide, dibenzo- thiophene, phenyl disulfide, 1,4,8,1l-tetrathiacyclotetradecane, and 1,5,9,13-tetrathiacyclohexadecane were obtained from Aldrich Chemical, Milwaukee, WI. Quinomethionate and Ovex were obtained from Chem Service, West Chester, PA. Carbon disulfide was purchased from Mallinckrodt. Tolbutamide was provided by UpJohn Chemical Co., Kalamazoo, MI. Thiokol LP-3 was obtained from Polysciences, Inc., Warrington, PA.
The chromatographic separations were attained by using a 12 m long, 220 wm i.d. fused silica column coated with 0.25-wm film thickness of 7% cyanopropyl, 7% phenyl methyl siloxane sta- tionary phase, BP-10, (Scientific Glass Engineering, Austin, TX.) This column was further cross-linked with azo-tert-butane (7) before using it with a supercritical fluid mobile phase. The mobile phase for all separations was supercritical grade carbon dioxide (Scott Specialty Gases). The restrictors used in this study were made in-house with untreated 50 wm i.d. fused silica tubing (Polymicro Technologies). The diameter of the restrictor at its terminus was carefully lowered by heating until the restriction was approximately micrometers in dimension.
RESULTS AND DISCUSSION 1. Analysis of Noise Characteristics of the SFC/FPD
System. In ref 4, the detecton limit for the optimized SFC/FPD was found to be approximately nanograms of sample injected into the column with a detectivity of low pg/s. A technique that has even lower detection limits and the capability of measuring the sulfur composition in high mo-
0003-2700/89/0361-26i6$0i.50/0 0 1969 American Chemical Society

ANALYTICAL CHEMISTRY, VOL. 61, NO. 23, DECEMBER 1, 1989 2617
2 0 10
A
:::! oO"Nse60
x~ 0" 5 0
, I 2 0 10
0 100 2 0 0 3 0 0
nz
6 6 0 -
2 0 - 10-
0 1 00 2 0 0 300
W z
6 0
.Ol I C
0 100 2 0 0 3 0 0
Hz
D 60 :!\L 1. , * 2 0 1 0
0 I 0 0 2 0 0 3 00
so 40 30
HZ
0 1 00 2 0 0 300
HZ
Figure 1. Amplitude noise spectra of SFCIFPD system. Shown is count rate versus frequency (hertz) of the noise. Experimental conditions: (A) flow rate of H, 270 mL/min, 0, 54 mLlmin, flame on, no CO, added; (B) flow rate of H, 167 mL/min, 0, 93 mL/min, flame on, no C02 added; (C) same as B but 40 pL/min CO, added; (D) same as A but 80 pL/min CO, added; (E) same as A with 40 pL/min COP with 5.3 mM CS,.
lecular weight species would find numerous applications. For example, with the continued growth in the area of biotech- nology, new analytical techniques are needed to monitor possible pollutants from the effluent of production plants. Sulfur analysis would be highly useful in detecting bacteria in the water that is exhausted from such a production facility (8).
Numerous instrumental and software methods exist for signal-to-noise enhancement (9). To apply the most appro- priate method of signal-to-noise enhancement to the SFC/ FPD technique, more information on the limiting variables was desired. An analysis of the noise characteristics of the SFC/FPD system was undertaken to determine the proba- bility of lowering the detection limit below its present limit. That is, the most important question was: What noise source controls the detection limit of SFC/FPD?
In several studies of GC/FPD with hydrogen/air flames the assumption was made that the most significant type of noise was flicker noise from the flame (IO, 11). Later, a thorough study of analytical flames showed that in general "high temperature" flames were l/f-noise-limited; while "cool" flames such as hydrogen/air flames were shot-noise-limited (12). If flame noise has a pure l / f dependence, then no signal-to-noise increase is gained by enhancement techniques such as signal averaging. Alternatively, if the most significant noise is primarily shot noise, then the signal-to-noise ratio improves with the square root of the number of data points taken. Because of the divergent opinions on the noise sources in a hydrogenlair flame and the lack of information of the hydrogen/oxygen flame, which was used in the optimized SFC/FPD, an analysis of the significant noise sources in capillary SFC/FPD was undertaken.
Noise spectra of the capillary SFCIFPD detector were measured under various experimental conditions. The current output from the photomultiplier was amplified with a current amplifier. This signal was filtered with a variable frequency low band-pass filter. The filtered signal was then sampled by a high-speed analog-to-digital converter a t a rate approx-
imately 3 times the frequency of the band-pass filter's cutoff to fulfill the Nyquist sampling limit. The frequency domain noise spectrum for each set of conditions was obtained by taking the Fourier transform of the time domain data. The frequency domain spectrum of the FPD detector without the flame lit (dark current measurement) included shot noise with an average current of 1 X lo4 A and interference noise at 60 Hz. For comparison, the frequency domain spectrum of a constant current supply with an average current of 1 x A was measured. Minimal 60-Hz noise was detected under those conditions. Therefore, the 60-Hz interference noise was primarily picked up by the FPD and not the current amplifier and/or the low-pass filter that were used to characterize the noise spectrum of the system. Figure 1A shows the noise spectrum of the FPD system with the flame on, the flame gas (H,/O,) flow rates a t the optimum conditions for SFC/FPD but without carbon dioxide added, and the photomultiplier on. The strongest characteristic in the spectrum is the in- terference noise at 60 Hz. Also, additional interference noise was noted a t 134 and 266 Hz. The shot noise increased by a factor of 50% over that attributed to the dark current of the photomultiplier dark current.
Next, the noise spectrum of the system under the same conditions as in Figure 1A (good signal-to-noise conditions) was measured with 14 mL/min (STP) carbon dioxide flowing into the flame, which corresponded to 40 pL/min at 170 atm and 60 OC in the column. The frequency spectrum under these conditions was the same as shown in Figure 1A with the type of characteristic noise and the amplitude of the noise being identical. That is, for low flow rates of carbon dioxide and optimum flame gas conditions, the addition of carbon dioxide has no effect on the measured noise. Figure 1B shows the noise spectrum under the same conditions, except the flame gas flow rates were those that provided a poor signal-to-noise ratio in SFC/FPD (4). Under these conditions the shot noise level was increased by 164% compared to that observed under the good S / N conditions shown in Figure 1A.
The noise frequency spectrum was also measured for the

2618 ANALYTICAL CHEMISTRY, VOL. 61, NO. 23, DECEMBER 1, 1989
same carbon dioxide flow but under conditions of H2/02 flame gas flow rates that provided a poor signal-to-noise ratio (same flame gas flow rates as in Figure 1B). Under those conditions the addition of carbon dioxide did have an effect on the noise spectrum (Figure 1C). The random noise increased slightly in this case. Also, a new band at approximately 10 Hz was produced in addition to the 60-Hz interference noise. Similar interference noise has been observed in the flame ionization detector with a hydrogen/air flame (13).
The effect of three different types of flow restrictors, in- tegral, reduced diameter, and Lee Scientific frit type, on the flame noise was studied. The type of restrictor had no effect on the measured flame noise amplitude and frequency spec- trum when low C02 volumetric flow rates such as 14 mL/min (STP) were used.
Figure 1D shows the effect of increasing the flow of carbon dioxide into the flame to a rate of approximately 28 mL/min (STP) for optimum H2/02 At the higher flow rates of carbon dioxide the low-frequency noise components in the frequency spectrum preferentially increased. Finally, Figure 1E shows the noise on the signal that was observed when a continuous flow of carbon disulfide (dissolved in carbon dioxide) was injected into the flame a t a rate of 14 mL/min (STP). From these data it is clear that when the signal level is increased above the detection limit, the predominate noise source is white noise.
In summary, the noise in the optimized SFC/FPD at flow rates comparable to those used in capillary SFC/FPD is predominately interference noise at 60 Hz and shot noise. The 60-Hz interference noise can be eliminated by software or hardware filtering. The optimized SFC/FPD would therefore be primarily shot-noise-limited, which is similar to the noise characteristics in H2/air flames (12). Signal-to-noise en- hancement can be obtained by signal averaging, with the final limitation on the extent of averaging allowable being controlled by the eventual degradation of the detected resolution of the separation.
11. Possible Methods To Eliminate t h e Variation in the Base Line of the Chromatogram dur ing Pressure or Density Programming. In ref 4 the variation in the signal intensity and the background intensity of the flame photo- metric detector was studied as a function of the Hz/02 flame gas ratio. A statistical optimization revealed response surfaces for the signal and the background that were practically op- posite in behavior. That is, when the H2/02 ratio increased, the signal intensity increased and the background intensity decreased. Under optimum conditions the background in- tensity could be diminished to levels that corresponded to the dark current of the photomultiplier. In the original statistical optimization the flux of carbon dioxide entering the flame was held constant. Accordingly, carbon dioxide was not used as a variable in the optimization. The primary reason for doing this was that the carbon dioxide flow rate should be primarily controlled by the desired chromatographic efficiency.
A pressure-programmed separation was shown in ref 4. The base line of the FPD increased with increasing quantities of carbon dioxide entering the flame. The hypothesis was made that because the base line and the signal were inversely de- pendent on flame gas flow rates, then perhaps feedback control between the pressure of carbon dioxide imposed on the column and the flow rate of hydrogen could allow the base line to stay constant with minimal effects on the signal intensity. The following results show a test of this hypothesis.
Under optimum flame gas conditions the calibration curve of carbon disulfide was determined for a column temperature of 60 "C and carbon dioxide pressure of 170 atm, which corresponded to a flow rate of 33 yL/min through the column. Next, the pressure of carbon dioxide in the column was in-
/+ 6.10 r h - r" 5 .48 .
G 0
4.86 .
0 .50 0 .80 1.10 1.40 1 . 7 0 2.00
LOG (ng CS, injected)
Figure 2. log (sulfur signal) vs log (nanograms of carbon disulfide) injected for two mass flow rates of carbon dioxide. The fuel gas flow rates were changed in B until the base-line background signal was lowered to a value equal to that that found in A. The column was 12 m long, BP-10 with film thickness of 0.25 pm; temperatwe was 60 O C .
For A (+) CO, pressure = 170 atm, H, flow rate = 240 mL/min, O2 flow rate = 45 mL/min. For B (e) CO, pressure = 238 atm, H, flow rate = 280 mL/min, O2 flow rate = 45 mL/min.
creased to 238 atm, which corresponded to a column flow rate of 41.2 pL/min, and another calibration curve was measured. Then, the hydrogen flow rate was increased until the back- ground counts due to the presence of carbon dioxide in the flame were identical to that found for the case of 170 atm of carbon dioxide in the column. The resulting calibration curves for this experiment are shown in Figure 2. Unfortunately, the results obtained show that when the higher carbon dioxide and hydrogen flow rates were used, the signal intensity was lowered. Feedback of this sort will not achieve the desired goal of allowing easy quantitation of the sulfur signal by eliminating the background because the sulfur signal changes as well.
In retrospect, these findings are not surprising. From in- formation in ref 4, a global statement could be made that as the background emission decreased, the signal increased. A closer look at the behavior of both the background emission intensity and the sulfur emission intensity reveals a more complicated interrelationship between background and signal emission. Especially near the optimum conditions for flame gas flow rates, the signal intensity varied considerably as the flame gas flow rates were moved from the optimum conditions. The background emission was not as variant with flame gas conditions. Also, the results in Figure 2 strongly support the two hypotheses purported in ref 4. First, the background emission was predominately controlled by flame temperature; and second, the signal intensity was more strongly affected by the radical reaction chemistry that involved carbon dioxide and hydrogen than by flame temperature ( 4 ) .
Another means of decreasing the base-line variation in pressure programs was, however, discovered. Figure 3A and the other chromatograms in this paper show minimal variation in the base line when the pressure was changed. The base-line variation in Figure 9 of ref 4 was much greater than that found in Figure 3A. No base-line subtraction technique was used to cosmetically improve the appearance of the base lines of the chromatograms in this paper. The attenuation used for the chromatograms in this paper was lower than that in previous studies, which should have made the base-line var- iation with pressure even more perceptible in this study. Also, the flame gas flow rates in both cases were the same. The only change made in the chromatographic method was that highly tapered restrictors were used to control the flow for the chromatographic analyses in this paper. However, in previous work, short 15 Fm i.d. linear restrictors were used. With linear

ANALYTICAL CHEMISTRY, VOL. 61, NO. 23, DECEMBER 1, 1989 2619
Table I. Comparison of Detection Limits for SFC/FPD and SFC/FID
A SFC/FPD
0 10 2 0 30 4 0 5 0 6 0
RETENTION TIME (min)
B SFC/FID
7
0 10 2 0 30 4 0 5 0 60
RETENTION TIME (min) Figure 3. Chromatogram obtained with same column as in Figure 2 at 70 OC, with an initial C02 pressure of 102 atm held for 30 min, followed by a ramp of 2.72 atmlmin to a final pressure of 129 atm. Chromatogram A used FPD with H, = 240 mLlmin and O2 = 5 mllmin. Chromatogram B used FID with H, = 130 mL/min and O2 = 55 mLlmin. Compounds were in order of elution: 1, carbon di- sulfide; 2, tetrahydrothiophene; 3, cydohexyl mercaptan; 4, thiophenol; 5, benzo[b]thiophene; 6, diphenylmethane; 7, dibenzyl; 8, phenyl sulfide; 9, dibenzothiophene; 10, phenyl disulfide.
restrictors both the mass flow rate of the gas and the velocity of the gas increase with pressure (14). For highly tapered restrictors the mass flow rate continues to increase with pressure, but the velocity of the gas remains constant at the exit of the restrictor. The variation in speed of the gas with linear restrictors therefore must adversely affect the base-line variation. The need to correct for base-line variation as a function of pressure with steep tapered restriction is clearly not as important as with linear restrictors.
111. Comparison of SFC/FPD and SFC/FID. The flame ionization detector is the most commonly used detector in gas chromatography. For example, 54% of gas chroma- tographic analyses that were published in 1982 were done with a flame ionization detector (15). Flame ionization is also becoming highly important in SFC as well. Accordingly, a comparison of SFC/FPD and SFC/FID was made.
For gas chromatography the advantages of the flame ion- ization detector are that it (1) responds to almost all organic compounds, (2) has high sensitivity, and (3) has a wide linear dynamic range. In supercritical fluid chromatography similar advantages have been assumed, but not verified.
A comparison was made of the sensitivity of the SFC/FPD and SFC/FID. To make a fair comparison, the flame gas flow rates used in the SFC/FID were optimized by using the Simplex V optimization program (Statistical Programs, Houston, TX). The optimized flame gas conditions were 65 mL/min for hydrogen and 215 mL/min for oxygen a t a con-
compound detection limits," ng FPD FID
thiophenol 1.4 3.2 phenyl sulfide 1.3b 3.7 dibenzothiophene 1.9b 8.4
Based on a signal-to-noise ratio of 3. *Taken from ref 4.
stant flow of carbon dioxide into the flame of approximately 75 rL/min a t 102 atm and 70 "C. These values are different from the suggested values described by the manufacturer of 40 mL/min hydrogen and 400 mL/min for air (which corre- sponds to a flow rate of 84 mL/min oxygen) for gas chro- matographic conditions using helium carrier gas. This initial optimization caused an increase in the signal-to-noise ratio of approximately a factor of 3.
Table I shows a comparison of the detection limits for three organosulfur compounds using SFC/FPD and SFC/FID. For all three compounds the detection limits are lower for SFC/FPD than in SFC/FID. For example, for dibenzo- thiophene, the FPD detection limit is a factor of 4 larger than in FID, and for thiophenol the FPD has a detection limit 2 times lower than that obtained with the FID.
Figure 3A shows the SFC/FPD chromatogram of a test mixture of organosulfur compounds separated on a capillary column coated with BP-10 stationary phase by use of flame gas flow rates that are optimum for the SFC/FPD. With the column still attached to the injector and the restrictor, the same test mixture was separated under identical chromato- graphic conditions and detected with the flame ionization detector. As mentioned previously, the flow rate for this experiment and all others was controlled by a highly tapered flow restrictor. To separate the test mixture, a pressure program was used. In the pressure program, the pressure was initially held at 102 atm for 30 min and then ramped at a rate of 2.72 atm/min to a final value of 129 atm. The temperature of the separation was 70 OC. The base line increased more significantly over this pressure program in the SFC/FID system than in the SFC/FPD system. For example, for the same pressure program, the background signal in SFC/FID varies from 16 to 127 counts/s (a factor of 8 increase in background noise), while in SFC/FPD the background signal varies from 11 to 27 counts/s (a factor of 2.4). For benzo- [blthiophene, a compound that elutes early in the pressure program, the ratio of signal-to-background in FPD to sig- nal-to-background in FID was 5.0. The same ratio for di- benzothiophene, a compound that eluted much later in the pressure program, was 20. Therefore, variation in base line caused by pressure programming was significantly less in the FPD than in the FID when a highly tapered restrictor was used.
-In summation, of the two detectors studied, the flame photometric detector was found to be more sensitive than the flame ionization detector. Also, from the aforementioned data, the effect of the base-line variation should have minimal effect on quantitation in SFC/FPD compared to that in SFC/FID. Other workers recently showed preliminary data on a new FID design for SFC with improved detection limits (16). In gas chromatography, the flame ionization detector has a lower detection limit compared to that of the FPD. In GC, the FID has a detection limit of 1-100 pg of analyte injected, which is 1-2 orders of magnitude lower than that of FPD (17).
The difference in sensitivity of the two detectors for su- percritical fluid chromatographic detection is probably due to a diminution of sensitivity for the flame ionization detector when considerable amounts of carbon dioxide are added to

2620 ANALYTICAL CHEMISTRY, VOL. 61, NO. 23, DECEMBER 1, 1989
the flame. Previous research that studied the effect of carrier gas in GC/FID substantiates this belief. For example, Schafer (18) demonstrated decreased sensitivity of flame ionization detection when the carrier gas was carbon dioxide as compared to nitrogen, helium, argon, or hydrogen. The decrease in sensitivity in SFC/FID with carbon dioxide mobile phase may be an amplification of this effect. The lower sensitivity with carbon dioxide as the carrier gas in GC was attributed to the high heat capacity of carbon dioxide. That is, as a noncom- bustible gas, such as carbon dioxide, is added to the flame, the temperature in the combustion zone decreases. Therefore, a decrease in the extent of ionization also occurs (18).
Conclusive evidence identifying the cause of decreased sensitivity when carbon dioxide is the carrier gas is not yet available. However, recent work has substantiated more thoroughly the importance of the flame temperature on the maximum extent of ionization in the FID. For various hy- drogen/air flame gas compositions, with different noncom- bustible gases being added, the maximum extent of ionization always occurred a t approximately the same temperature in the reaction zone of the flame (19).
IV. Separation of a Disulfide Polymer: Possible Use of SFC/FPD for Sulfur Analysis of High Molecular Weight Compounds. The combination of a chromatographic technique capable of efficiently separating high molecular weight compounds with a sulfur-specific detector is highly desirable. For example, the quantity of and type of sulfur in coal and coal liquefaction products are still not easily deter- mined. Also, in many applications, such as those that are biotechnological, not only is an efficient separation technique needed, but also very small quantities of the material are available. Therefore, a highly sensitive sulfur detector is necessary. The combination of HPLC with a flame photo- metric detector for sulfur detection is less than ideal for these analyses. For example, the detection limits are considerably higher for HPLC/FPD than for GC/FPD. Also, substantial quenching effects due to the presence of hydrocarbons have been reported in HPLC/FPD (6). We report herein a study on the possible use of SFC/FPD for the analysis of sulfur in high molecular weight compounds.
The polymeric system studied was Thiokol LP-3. Thiokol is the trade name for disulfide polymers produced by Morton Thiokol, Inc. Thiokol LP-3 is a polydisulfide elastomer that is used as a sealant and as a feedstock in the polymer industry. The predominant application of these elastomers is based on their high solvent resistance, which is directly proportional to the quantity of sulfur in the elastomer (20). Thiokol LP (liquid polymer) elastomers are produced by reacting bis(2- chloroethy1)formal with an inorganic disulfide such as sodium disulfide (21) (reaction 1). For Thiokol LP-3, 2% of a tri- halide, such as 1,2,3-trichloropropane, is used as a cross-linking reagent (reaction 2) (21). C1CH2CHzOCH20CH2CH2C1 + Na2S2 -
(SCH2CH2OCH20CHZCH,S), (1)
(2) CICH2CHCH2CI + Naps2 - (SCH2CHCH2S),
The approximate number-average molecular weight, M,, and weight-average molecular weight, M,, of Thiokol LP-3 are 540 and 1500 amu, respectively (22). The approximate molecular structure of the polymeric repeating unit is as follows (this structure does not include the subunits from the cross-linking reaction):
CI S I I
HS-(C2H40-CH2O-C2H,-SS),-C2H,O-CHzO-C2H~-SH Figure 4 shows the chromatographic separation of the ol-
igomers of the Thiokol LP-3 elastomer. This separation is atypical compared to other polymeric separations achieved by HPLC and SFC in that the number of oligomeric units
RETENTION TIME (mid
Figure 4. Thiokol LP-3 oligomer separation performed with same column as in Figure 2 at 90 OC using carbon dioxide as the mobile phase. COP pressure was 102 atm for 15 min, followed by a ramp of 3.4 atmlmin ending in a final pressure of 306 atm.
separated was small and the distribution of the oligomers appeared nonrandom. This polymer also has unusual reaction chemistry. Polysulfide polymers that are endcapped with mercaptan linkages undergo a continuous interchange reaction between the mercaptan and the disulfide in the repeating unit. This reaction tends to keep the dispersivity of these polymers low (23). Also, the nonrandom distribution may be due to the occurrence of the interchange reaction in the production of the polydisulfide polymer or the extent of the interchange reaction during this process. Considerable debate on the extent and kinetics of the interchange reaction for each of the liquid Thiokols has been published (24) .
To make certain that the chromatogram was a true rep- resentation of the Thiokol LP-3 oligomers, three possible causes of a nonstatistical representation of the elastomer system were considered. First, were the chromatographic conditions degrading the polymer; second, was the injection process causing a mass discrimination effect on some of the higher molecular weight polymers; and third, was some fraction of the polymer permanently adsorbed onto the col- umn?
To test for the possibility of the chromatographic conditions degrading the polymer, the oligomers were separated a t tem- peratures ranging from 40 to 110 "C and pressures from 75 to 276 atm. Over this range the efficiency of the separation changed, but the number of component peaks in the chro- matogram did not. The lack of degradation of the Thiokol LP-3 over this temperature range is not surprising. Numerous studies have shown that at least in liquids the elastomer is stable up to temperatures as high as 150 "C (21).
To determine if some of the oligomers were irreversibly adsorbed onto the stationary phase, two tests were run. First, after each efficient separation the pressure in the column was ramped to 410 atm to cause further solvation of any adsorbed oligomers. No rise in base line or additional peaks were de- tected during this process. In the second test the column was replaced by an open tube. A 200-nL aliquot of the same solution used for the chromatogram in Figure 5 was injected into the open tube. The flow rate was also controlled by the same restrictor, and the same pressure program was run. The integration of the resulting sulfur signal from this slug was compared to the integrated sulfur signal of the chromatogram. The integrated areas were found to be statistically the same within 10% error, which is within the reproducibility expected for run-to-run variation for high-pressure injections in SFC (25) .
The fact that high-pressure injection devices can cause some discrimination in SFC against high molecular weight com- ponents of a mixture has been documented (26). The most serious discrimination occurs when the valve is cycled between

ANALYTICAL CHEMISTRY, VOL. 61, NO. 23, DECEMBER 1, 1989 2621
6 . 5 0 - - 4 5 . 8 0 ' a 5 5 . 1 0 v)
4 .40
J 3 .70
Y
:: 3.00 '
2.50 2.90 3.30 3 .70 4.10 4.50
LOG [ng OLIGOMER INJECTED] Flgure 5. Thiokol LP-3 oligomer calibration curve obtained under chromatographic conditions of Figure 4: (A) sulfur signal for peak eluting at 25.4 min; (0) sulfur signal for peak eluting at 48.5 min. log (sulfur signal) was plotted vs log (nanograms of Thiokoi polymer in- jected).
the inject and load positions during one injection. Cycling the valve is commonly desirable to provide a symmetric slug injection. During this process in SFC the accompanying pressure drop in the injector also causes precipitation of the high molecular weight component of the mixture. To make certain that minimum error was introduced in the quantitation of these oligomers, the valve was moved to inject and left in that position during the chromatographic run. Also, the in- jector was operated over the temperature range of 40-90 "C without any change in the measured components in the chromatogram.
From the data obtained in the experiments described above, we felt justified in assuming that all the injected sample had reached the detector during the chromatographic separation. Because the M,, value of Thiokol LP-3 was 540, the chroma- tographic band with the highest intensity is tentatively as- signed to an oligomer with n = 2. The subsequent chroma- tographic bands are probably due to increasingly larger oli- gomeric units. Also, because the oligomeric system is cross- linked, the cluster of smaller bands around each oligomeric unit is most likely due to different degrees of cross-linking in the oligomers.
The mass spectrum of the Thiokol LP-3 was obtained by using fast atom bombardment (FAB) and laser desorption ionization. Each technique has been used previously to de- termined the molecular weight distribution of polymers (27, 28).
In the FAB mass spectrum, the largest m/z value detected was 927, but the preponderance of ion signal was found at mass/charge e270 m/z. This behavior is strongly indicative of the sample undergoing substantial fragmentation during the FAB ionization process. In the laser desorption Fourier transform/ion cyclotron resonance (FT/ICR) mass spectrum, the largest m/z value detected was 1391, but again the pre- ponderance of ion signal was found at m/z values C250. Accordingly, the laser desorption technique also caused con- siderable fragmentation of the polymer. Due to extensive fragmentation of the elastomer for each ionization technique, neither was able to show the oligomeric distribution of the Thiokol LP-3. However, with appropriate standards the su- percritical fluid chromatographic analysis may be useful for this purpose.
Calibration curves for chromatographic peaks for the oli- gomers that had retention times of 25 and 48 min are shown in Figure 5. For sulfur detection the FPD response follows the relationship
I = C[sp where I is the detected chemiluminescence signal, C is a
'*sc I I I I I I I I
0 10 2 0 3 0 4 0 5 0 60 7 0 8 0 RETENTION TIME (min)
Figure 6. Sulfur cross-linked Thiokol LP-3 oligomer separation under the same chromatographic conditions as in Figure 4.
constant, [SI is the concentration of sulfur, and n is a constant exponent.
Calibration curves for sulfur in FPD analysis are always log-log plots such as in Figure 6 with the slope of the plot being the n exponent. The exponent, n, theoretically should have a value of 2 because the detected emission is due to the sulfur dimer which is formed in the flame.
Experimental values of n range from 1.69 to 2.00 (29). Burnett et al. (29) showed that in GC/FPD the n value was compound dependent. in previous work (4) , the n value was found to be dependent on the compound in SFC/FPD as well. Also, the n values determined under SFC/FPD conditions were found to be statistically the same as those found for GC/FPD (4). Although the variation of the n value with compound type is well documented, not enough information has been collected to date to allow prediction of the n value for a specific compound. For example, information is un- available on the variation of the exponent, n, for a homologous series of sulfur compounds. The oligomers of an elastomer make up a homologous series. For all the oligomers of the Thiokol LP-3, the n value was the same, n = 1.69. The value of n may be constant across a homologous series of sulfur compounds as these data imply, but more homologues must be studied to verify this trend. An extensive study (30) of homologues of phosphorus compounds showed that the slope of the calibration curve was invariant across a homologous series for the FPD but only for homologous series.
The detection limits for the first and second oligomers in Figure 6 were determined for a signal-to-noise ratio of 3 (the IUPAC definition of detection limit). For the first oligomeric series, the detection limit was 44 ng of oligomer injected (200-nL injection); and for the second oligomeric series, the detection limit was 54 ng of oligomer injected. These data clearly show that SFC/FPD can sensitively detect sulfur in compounds of moderately high molecular weight (ca. 2000 m u ) . By comparison, the detection limb €or small molecules, such as benzo[b]thiophene, were in the nanograms injected range. The percentage of sulfur in a molecule of benzo[b]- thiophene is approximately 24%. The percentage of sulfur in an oligomer of Thiokol LP-3 is approximately 38%. Therefore, in comparison the detection limit of the polymer was strongly affected by the large molecular weight of the oligomers and is not a simple function of the percentage of sulfur in the sample.
V. Applications of SFC/FPD. One application that is readily suitable to SFC/FPD is the analysis of sulfur vul- canization of polymers. Cross-linking or vulcanization of natural rubbers and synthetic polymers by the interaction of elemental sulfur with the polymers remains a standard method to increase the elasticity of a polymer. Figure 6 illustrates the use of SFC/FPD to monitor the changes in the polymeric structure after the interaction of the polymer with elemental sulfur. The SFC chromatogram in Figure 6 is of the Thiokol

2622 ANALYTICAL CHEMISTRY, VOL. 61, NO. 23, DECEMBER 1,
Table 11. Effect of Sulfur Atom on Retention
1989
compound retention time, min k fa
cyclohexyl mercaptan methylcyclohexane thiophenol toluene benzol b] thiophene indene phenyl sulfide diphenylmethane dibenzothiophene diphenylethane phenyl disulfide bibenzyl
8.62 0.162 7.0 0.038 8.99 0.212 7.79 0.050
11.16 0.504 9.18 0.237
19.54 1.633 14.76 0.989 26.08 2.515 19.98 1.693 27.62 2.722 16.89 1.276
Capacity factor k’calculated with respect to acetone or carbon disulfide, both of which were unretained on the column.
LP-3 elastomer after it was allowed to interact with elemental sulfur for 2 h at a temperature of 110 “C. The resulting cross-linked polymer was not as soluble in the acetone as the original sample of Thiokol LP-3. Accordingly, the chroma- tographic bands of the oligomers, after vulcanization with sulfur, are shifted to higher retention times compared to those in Figure 4 due to the increased molecular weight of the vulcanized oligomers. Also, a new chromatographic band appeared with a retention time of approximately 74 min. This new band may correspond to a new oligomer unit in the vulcanized polymer.
The characterization of sulfur vulcanization is an application that is uniquely suited to SFC/FPD. The GC/FPD cannot be used for this analysis due to the molecular weight range of the oligomers. HPLC/FPD has numerous problems as- sociated with sulfur detection such as high detection limits and serious quenching interactions of hydrocarbons with the excited sulfur dimer. Sulfur is used to cross-link natural rubber, butyl rubbers, and styrene-butadiene rubber. These polymeric systems are relatively nonpolar. Therefore, except for the possible concern that the polymer molecular weight may be too large to allow solvation in a supercritical fluid, the supercritical solvent and the application seem ideally matched. This type of application also has the potential of contributing to a more thorough understanding of the cross-linking reaction mechanism because the effect of vulcanization on each oli- gomer unit can be monitored.
Disulfide compounds or polymers are good examples of the types of compounds that are best suited for separation by SFC and detection by a selective detector such as FPD. Disulfide compounds are often typically thermally labile and relatively nonpolar (31). These characteristics are ideally suited to SFC analysis. The analysis of disulfides can find use in a broad range of applied chemistries, such as polymer analysis and biochemistry. For example, a-lipoic acid (a disulfide) plays a crucial role in metabolism (31). In addition, the S-S linkage is highly important in stabilizing the three-dimensional structure in proteins (32).
VI. Effect of Sulfur Atoms in a Molecule on Reten- tion. With the development of new applications comes the desire to provide predictive information on retention behavior of the organosulfur compounds in SFC. Therefore, the effect on retention in SFC of replacing a carbon-bearing subunit of a molecule (methyl, methylene, etc.) with a sulfur atom was studied. Table I1 shows the results of an experiment in which the retention times of organosulfur compounds were compared to those of the corresponding carbonaceous homologues. The capacity factors were measured for constant pressure and temperature conditions of 70 OC and 102 atm with the BP-10 stationary phase. For each set of homologues, the replacement
160’ C _--__-__--_-_-___-
I I I I I I I I I
0 10 20 30 4 0 50 60 7 0 80 9 0 RETENTION TIME ( m i d
Figure 7. Chromatogram of organosulfur compounds separated on same column as in Figure 2 by using carbon dioxide as the mobile phase with the Indicated pressure and temperature programs. Eluted samples are listed in Table 111.
of a carbon atom with a sulfur atom caused increased reten- tion. This behavior is identical with that found in normal- phase liquid chromatography in which the more polar com- pound interacts more strongly with the polar sites of the stationary group and therefore is retained longer.
Previous studies of the effect of sulfur atoms on retention in isocratic, reverse-phase liquid chromatography showed a mechanism that was much more complicated (33). For ex- ample, with linear and cyclic alkanes, the replacement of carbon with sulfur caused a decrease in retention. This de- crease was attributed to the formation of a solvent “patch” around the sulfur atom in the molecule. Alternatively, the replacement of an aromatic carbon with a sulfur atom had the effect of increasing the retention. The explanation given for this behavior was that the solvent “patch” could not form around the aromatic sulfur atoms due to steric hindrance (33).
Thus, for reverse-phase HPLC the solvation sphere around specific types of sulfur moieties was believed to strongly affect the retention of the molecule. In the supercritical state, the number of solvent molecules per sphere is smaller than in the liquid state. But, the interactions between the solute mole- cules and the solvent sphere may be stronger in the super- critical state than in the liquid state. Also, the size of the solvent sphere is highly variable with the conditions in the supercritical state. I t is therefore somewhat surprising that the selective solvation of sulfur atoms does not have a strong effect on the retention of different species in SFC. Our results tend to cast doubt on the assumption in the HPLC studies that the mechanistic differences were totally solvent-con- trolled.
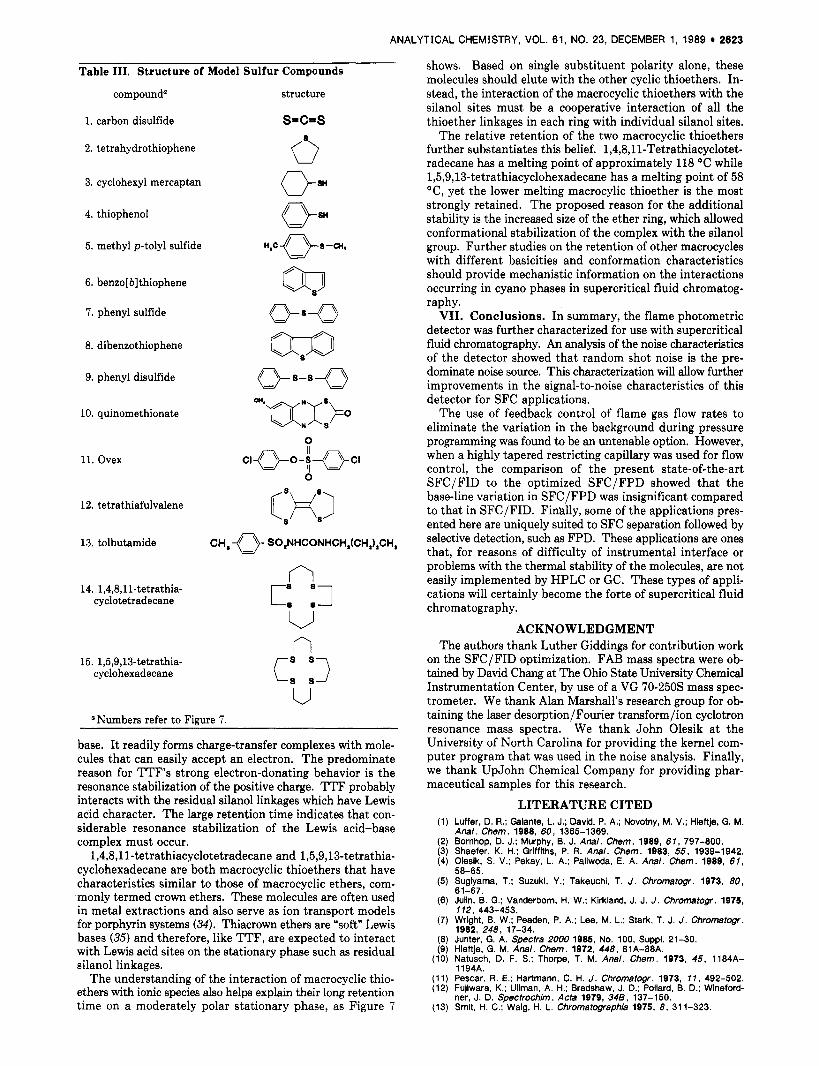
Figure 7 illustrates other possible applications of SFC/FPD for the determination of molecules such as model coal com- pounds, pesticides, and organosulfur drugs. In addition, further information on retention behavior of sulfur compounds in normal-phase SFC can be obtained by analyzing the re- tention behavior in the chromatogram shown in Figure I . The structures of the model compounds are given in Table 111. The retention in this chromatogram can be characterized as typical normal-phase behavior in which the more polar compounds are retained longer, with the exception of three molecules, tetrathiafulvalene (TTF), 1,4,8,11-tetrathiacyclotetradecane, and 1,5,9,13-tetrathiacyclohexadecane. All three of these molecules are retained longer than expected on grounds of substituent polarity alone.
Significant interaction of these three molecules with residual silanol groups is strongly suspected. TTF is a strong Lewis
ANALYTICAL CHEMISTRY, VOL. 61, NO. 23, DECEMBER 1, 1989 2623
Table 111. Structure of Model Sulfur Compounds
compounda structure
1. carbon disulfide s=c=s 2. tetrahydrothiophene
3. cyclohexyl mercaptan
4. thiophenol
5. methyl p-tolyl sulfide
6. benzo[b]thiophene
7. phenyl sulfide
8. dibenzothiophene
9. phenyl disulfide
10. quinomethionate
11. Ovex
12. tetrathiafulvalene
13. tolbutamide
14. 1,4,8,11-tetrathia- cyclotetradecane
15. 1,5,9,13-tetrathia- cyclohexadecane
Numbers refer to Figure 7.
base. I t readily forms charge-transfer complexes with mole- cules that can easily accept an electron. The predominate reason for TTF’s strong electron-donating behavior is the resonance stabilization of the positive charge. TTF probably interacts with the residual silanol linkages which have Lewis acid character. The large retention time indicates that con- siderable resonance stabilization of the Lewis acid-base complex must occur.
1,4,8,11-tetrathiacyclotetradecane and 1,5,9,13-tetrathia- cyclohexadecane are both macrocyclic thioethers that have characteristics similar to those of macrocyclic ethers, com- monly termed crown ethers. These molecules are often used in metal extractions and also serve as ion transport models for porphyrin systems (34). Thiacrown ethers are “soft” Lewis bases (35) and therefore, like TTF, are expected to interact with Lewis acid sites on the stationary phase such as residual silanol linkages.
The understanding of the interaction of macrocyclic thio- ethers with ionic species also helps explain their long retention time on a moderately polar stationary phase, as Figure 7
shows. Based on single substituent polarity alone, these molecules should elute with the other cyclic thioethers. In- stead, the interaction of the macrocyclic thioethers with the silanol sites must be a cooperative interactian of all the thioether linkages in each ring with individual silanol sites.
The relative retention of the two macrocyclic thioethers further substantiates this belief. 1,4,8,11-Tetrathiacyclotet- radecane has a melting point of approximately 118 “C while 1,5,9,13-tetrathiacyclohexadecane has a melting point of 58 “C, yet the lower melting macrocylic thioether is the most strongly retained. The proposed reason for the additional stability is the increased size of the ether ring, which allowed conformational stabilization of the complex with the silanol group. Further studies on the retention of other macrocycles with different basicities and conformation characteristics should provide mechanistic information on the interactions occurring in cyano phases in supercritical fluid chromatog- raphy.
VII. Conclusions. In summary, the flame photometric detector was further characterized for use with supercritical fluid chromatography. An analysis of the noise characteristics of the detector showed that random shot noise is the pre- dominate noise sowce. This characterization will allow further improvements in the signal-to-noise characteristics of this detector for SFC applications.
The use of feedback control of flame gas flow rates to eliminate the variation in the background during pressure programming was found to be an untenable option. However, when a highly tapered restricting capillary was used for flow control, the comparison of the present state-of-the-art SFC/FID to the optimized SFC/FPD showed that the base-line variation in SFC/FPD was insignificant compared to that in SFC/FID. Finally, some of the applications pres- ented here are uniquely suited to SFC separation followed by selective detection, such as FPD. These applications are ones that, for reasons of difficulty of instrumental interface or problems with the thermal stability of the molecules, are not easily implemented by HPLC or GC. These types of appli- cations will certainly become the forte of supercritical fluid chromatography.
ACKNOWLEDGMENT The authors thank Luther Giddings for contribution work
on the SFC/FID optimization. FAB mass spectra were ob- tained by David Chang at The Ohio State University Chemical Instrumentation Center, by use of a VG 70-2503 mass spec- trometer. We thank Alan Marshall’s research group for ob- taining the laser desorption/Fourier transform/ion cyclotron resonance mass spectra. We thank John Olesik a t the University of North Carolina for providing the kernel com- puter program that was used in the noise analysis. Finally, we thank UpJohn Chemical Company for providing phar- maceutical samples for this research.
LITERATURE CITED Luffer, D. R.; Galante, L. J.; David, P. A.; Novotny, M. V.; Hieftje, G. M. Anal. Chem. 1988p 60, 1365-1369. Bornhop, D. J.; Murphy, B. J. Anal. Chem. 1989, 67, 797-800. Shaefer, K. H.; Griffihs, P. R. Anal. Chem. 1983, 55, 1939-1942. Olesik, S. V.; Pekay, L. A.; Pallwoda, E. A. Anal. Chem. 1989, 61,
Sugiyama, T.; Suzuki, Y.; Takeuchi, T. J . Chromatogr. 1973, 80, 58-65.
61-67 - . Julin, B. G.; Vanderborn, H. W.; Kirkland, J. J. J . Chromatogr. 1975,
Wriaht. B. W.: Peaden. P. A.: Lee. M. L.: Stark. T. J. J . Chromatoar. 772, 443-453.
. . 1983, 248, 77-34, ’
Junter. G. A. Spectra 2000 1985, No. 100, Suppl. 21-30. Hieftje, G. M. Anal. Chem. 1972, 448, 81A-88A. Natusch, D. F. S.; Thorpe, T. M. Anal. Chem. 1973, 45, 1184A- 1194A.
”
Pescar, R. E.; Hartmann, C. H. J . Chromarogr. 1973, 7 7 , 492-502. Fujiwara, K.; Ullman, A. H.; Bradshaw, J. D.; Pollard, B. D.; Wineford- ner. J. D. Spectrochim. Acta 1979, 348, 137-150. Smit, H. C.; Walg, H. L. Chromatographia 1975, 8 , 31 1-323.

2624 Anal. Chem. 1989, 6 I, 2624-2630
(14) Olesik, S. V.; Pekay, L. A., submitted for publication in Chromatograp- hia .
(15) Berezkin, V. G. CRC Crif. Rev. Anal. Chem. 1989, 20, 291-316. (16) Richter. B. E.; Bornhop, D. J.; Swanson, J. T.; Wangsgaard, J. G.:
Andersen. M. R. J . Chromatogr. Sci. 1989, 27, 303-308. (17) Buffington, R.; Wilson, M. K. Detectors for Gas Chromatography; Hew-
lett-Packard: Avondale, PA, 1987. (18) Schaefer, B. A. J . Chromatogr. Sci. 1978, 16, 211-217. (19) Schaefer, B. A. Combusf. Flame 1983, 50, 9-18. (20) Johnson, R. N. I n Encyclopedia of Polymer Science Technology; Bi-
kales, N. M.. Mark, H. F., Gaylord, N. G., Eds.; Wiiey: New York, 1969; Vol. 11, pp 425-447.
(21) Bertozzi, E. R. Rubber Chem. Technol. 1968, 4 1 , 115-157. (22) Personal communicatlon with Douglas Doster of Morton Thiokol, Mor-
ton Chemicals Division, Woodstock, IL. (23) Tobolsky, A. V. The Chemistry of Sulfides; Interscience Publishers:
New York, 1968. (24) Shlyakhter, R. A.; Ehrenburg, E. G.; Nassonowa, T. P.; Piskarewa, E.
P. J . Appl. Polym. Sci. 1987, 11, 567-574. (25) Richter, B. E.; Knowles, D. E.; Andersen, M. R.; Porter, N. L.; Camp-
bell, E. R.; Later, D. W. HRC CC, J . High Resolut. Chromatogr. Chro- mafogr. Commun. 1988, 11, 29-32.
(26) Richter, B. E. The Pittsburgh Conference and Exposition on Analytical Chemistry and Applied Spectroscopy, February 22-26, 1988, New Or- leans, LA. paper 425.
(27) Michael, R.; Stulik, D. Appl. Surf. Sci. 1987, 28, 367-381. (28) Marshall, A. 0.; Shomo, R. E., 11.; Verdun, F. R. 35fh ASMS Confer-
ence Absfracts; May 1987, Denver, CO, 938-939. (29) Burnett, C. H.; Adams, D. F.; Farwell, A. J . Chromatogr. Sci. 1978,
16, 68-73. (30) Sass, S.: Parker, G. A. J . Chromatogr. 1980, 189, 331-349. (31) Oae, S. Organic Chemisfry ofSu/fur; Plenum Press: New York, 1977, (32) Harper, H. A. Review of Physiological Chemistry, 14th ed.: Lange
Medical Publications: California, 1973. (33) Mockel, H. J. in Advances in Chromafography; Giddings, J. C., Grush-
ka. E., Brown, P. R., Eds.; Marcel Dekker: New York, 1987; Voi. 26, pp 1-65.
(34) DeSimone, R. E.; Giick, M. D. J . Am. Chem. SOC. 1976, 98, 762-767.
(35) Saito, K.; Masuda, Y.; Sekido, E. Anal. Chim. Acta 1983, 151, 447-455.
RECEIVED for review July 3, 1989. Accepted September 6, 1989. Financial support of this project was provided by the Ohio Coal Development Office, Grant No. R-86-026-01-OH, and the Ohio Mineral and Mining Resource Research Insti- tute, which granted a fellowship to L. Pekay.
Whole Column Detection: Application to High-Performance Liquid Chromatography
Kathy L. Rowlen, Kenneth A. Duell,’ James P. Avery,’ and John W. Birks* Department of Chemistry and Biochemistry and Cooperative Inst i tute for Research in Environmental Sciences (CIRES). Uniuersity of Colorado, Boulder, Colorado 80309
Whole column detection (WCD) chromatography is imple- mented for the first time In high-performance liquid chroma- tography, and several advantages of the technique are dem- onstrated. The three-dimensional (peak height, position, and time) data set is found to contaln significantly more Informa- tion than conventional postcolumn detection. I t is shown that this addklonai information makes possible (1) slgnlflcant time savings as a result of peak quantltation at the earliest moment that adequate resolution occurs on column, (2) potential time savings resulting from the ability to predlct whether adequate resolution will occur during an ongoing chromatographic run, (3) more accurate and precise measurements of capacity factors, (4) a simple solution to the general elution problem, (5) a measure of the rate of equilibration between the mobile and stationary phases, (6) a direct measure of capacity factor versus percent organic modifier behavior during gradient elution, (7) experimental verification of the interconversion between capacity factors determined during a gradient and isocraticaily determined capacity factors, and (8) simplified method development for process control and other automated analyses.
The purpose of this paper is to explore the potential ad- vantages of continuously monitoring the entire length of a high-performance liquid chromatography (HPLC) column. Several experimental cases in which whole column detection (WCD) offers a unique view of separation and can provide significant time savings are demonstrated. Although presented here as multiple-site UV absorbance detection along a nor-
Depar tment of Elect r ica l and Computer Engineering and CIRES. LTniversity of Colorado, Boulder, CO 80309.
mal-bore HPLC column, WCD could be accomplished with a variety of on-column methods such as photoacoustic ( I ) , fluorescence (2), refractive index (3), and electrochemical (4 ) detection.
In this work we show that WCD produces a three-dimen- sional data set of peak height, position and time, which can provide significantly more information about the chromato- graphic process than conventional postcolumn detection. Specifically, we demonstrate that this multidimensional data set provides easy visual access to parameters such as (1) a complete trace of each peak’s path through the column, in- cluding the location of highly or “permanently” retained peaks, (2) exact exit time from the column, (3) earliest time at which adequate resolution occurs, and (4) column quality. It is also shown that (1) quantitation can be carried out the moment adequate resolution occurs, resulting in relaxed requirements for solvent and time optimization, (2) linear velocities mea- sured along the length of a column provide improved accuracy and precision in capacity factor data, (3) the rate of equili- bration between mobile and stationary phases can be mea- sured (in this case due to the limited number of detector sites, 14, an upper limit for the rate is established), (4) capacity factor versus percent organic modifier behavior during gra- dient elution can be followed directly, and (5) the intercon- version between capacity factors determined during a gradient and isocratically determined capacity factors can be experi- mentally verified. The application of WCD to method de- velopment for process control analyses is presented as an example of the versatility and time optimization power of WCD. It is shown that the peak tracing capability of WCD provides unique insight and allows the operator to utilize peak “crossover” information to advantage without the use of mathematical estimation methods ( 5 ) .
In 1968, Brumbaugh and Ackers (6) developed a method they titled “scanning gel chromatography” (SGC). Using SGC
0003-2700/89/0361-2624$01.50:0 ‘C 1989 American Chemical Society