Embed Size (px)
Citation preview
1
Professional Science Masters – Solar Energy Engineering & Commercialization Arizona State University
July 30, 2013
SUNSHINE ACRES CHILDREN’S HOME SOLAR ARRAY SYSTEM MONITORING AND MAINTENANCE
Tyler G. Pearce Professional Science Masters Student in Solar Energy Engineering & Commercialization
Sunshine Acres Children’s Home 3405 N. Higley Road
Mesa, AZ, USA
ABSTRACT
Sunshine Acres Children’s Home (SA) has installed nearly
500 kWdc of solar arrays across their campus over the past five
years. In the next five years, SA hopes to double that figure in
order to annually self-generate all the energy the property
requires. As their solar portfolio grows, monitoring and
maintenance of SA’s photovoltaic (PV) systems will become
increasingly important. For this reason, the purpose of this
applied project was to provide SA: (1) a proof-of-concept, real-
time monitoring system and educational display, or dashboard,
which tracks and assesses the performance of the Dining Hall’s
PV system and (2) a site wide maintenance program. This paper
discusses the development of the dashboard and the use therein
of the performance metrics Performance Ratio and Performance
Index. To obtain a Performance Index, three performance test
methods, including PVUSA, are applied to a set of collected
performance data, and the results of the regressions are
compared. The dashboard and the maintenance program that
was developed for SA are also described.
INTRODUCTION The “miracle in the desert” known as Sunshine Acres
Children’s Home (SA) was founded in 1954 when James and
Vera Dingman purchased 125 acres in rural Mesa for the
express purpose of taking in and caring for the community’s
displaced children. The family and friends of Mr. and Ms.
Dingman carry on that noble ministry today. Consequently, SA
continues to be a tremendous force for good in Mesa and a
beneficiary of the community’s generosity.
One testament to the liberality of the community is SA’s
success in advancing their solar power initiative. When SA was
developing their master plan in 2008, they decided that they
would self-generate as much energy as they consume by the
year 2018 through the use of photovoltaic (PV) panels. Since
that time many people have contributed time, money, expertise,
and materials (including PV panels) in order for SA to realize a
portion of that vision. Five years later, SA has nearly 500
kWdc of PV generating electricity for 18 of their 40 buildings,
and it is estimated that this amount of solar power is supplying
half of the property’s energy needs. This means that SA, in
order to fully realize their goal, will add at least 500 kWdc over
the next five years. When finished, the campus will be home to
over 1 MWdc of PV panels.
Self-generation, however, is just as much a responsibility
as it is a blessing for SA. While a 300 kWdc array is operated
and maintained by Green Choice Solar through a Power
Purchase Agreement, the upkeep of the remaining 200 kWdc
falls to the staff of SA – a crew that is not very familiar with the
technology. Naturally, SA’s Facilities Management Office and
Solar Committee are interested to know how well their PV
systems are performing and what they must do to maintain the
power production of the arrays. In addition, SA is anxious to
tell its solar story to the residents (many of whom are young
and curious), staff, and community supporters.
The challenge of this applied project was to address all
three of these needs – educational outreach, performance
evaluation, and maintenance planning. Consequently, this
project’s objectives were twofold: (1) implement a monitoring
system/educational display for one of SA’s many arrays (2) and
create a site-wide maintenance program that is applicable for all
of SA’s existing and future solar arrays. This paper details what
was done to accomplish these two aims.
2
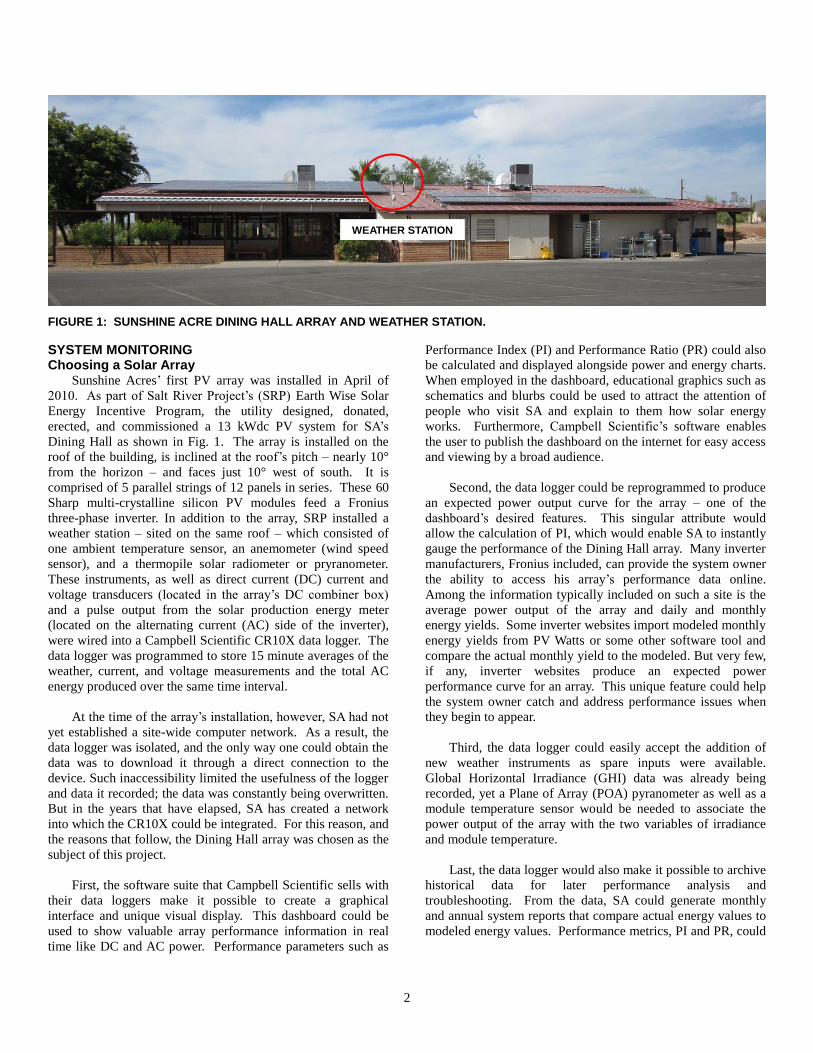
FIGURE 1: SUNSHINE ACRE DINING HALL ARRAY AND WEATHER STATION.
SYSTEM MONITORING Choosing a Solar Array
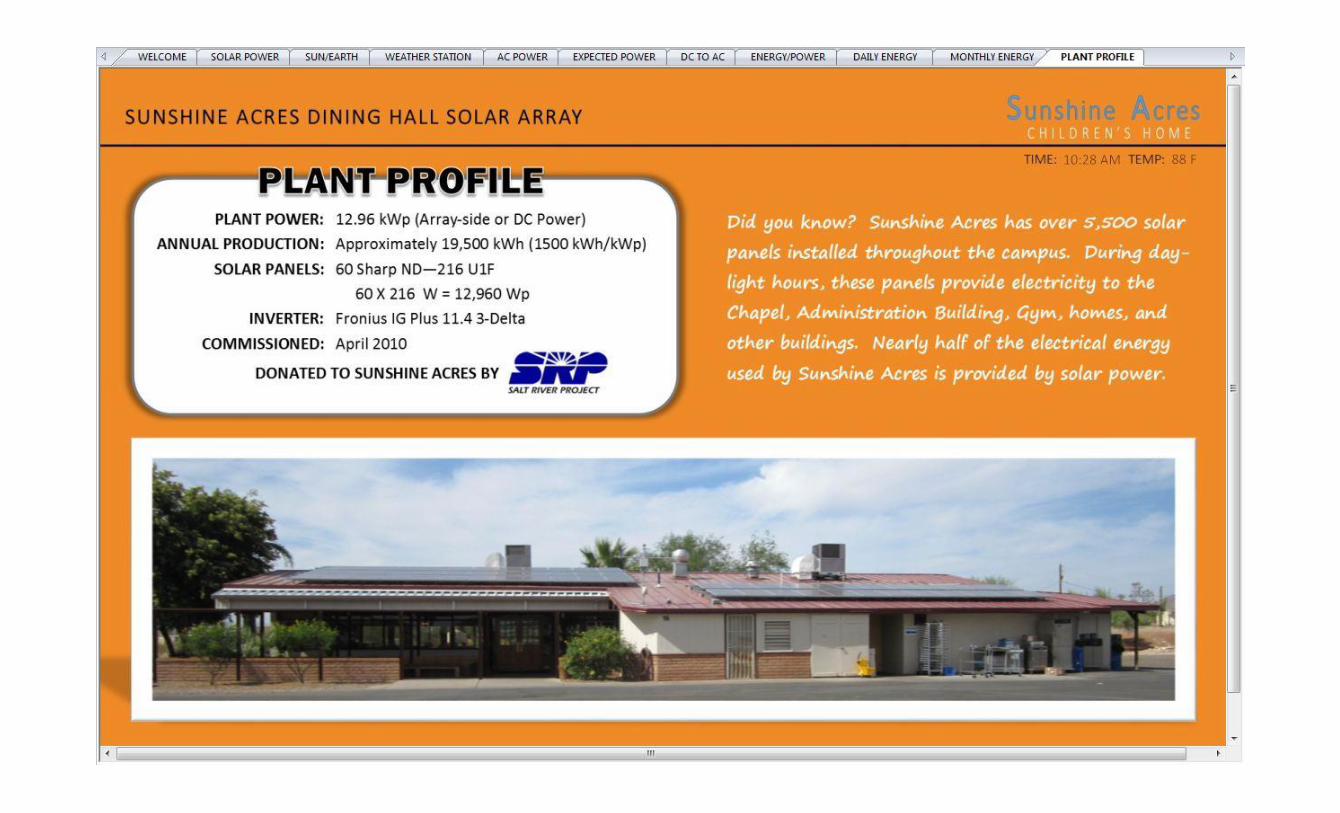
Sunshine Acres’ first PV array was installed in April of
2010. As part of Salt River Project’s (SRP) Earth Wise Solar
Energy Incentive Program, the utility designed, donated,
erected, and commissioned a 13 kWdc PV system for SA’s
Dining Hall as shown in Fig. 1. The array is installed on the
roof of the building, is inclined at the roof’s pitch – nearly 10°
from the horizon – and faces just 10° west of south. It is
comprised of 5 parallel strings of 12 panels in series. These 60
Sharp multi-crystalline silicon PV modules feed a Fronius
three-phase inverter. In addition to the array, SRP installed a
weather station – sited on the same roof – which consisted of
one ambient temperature sensor, an anemometer (wind speed
sensor), and a thermopile solar radiometer or pryranometer.
These instruments, as well as direct current (DC) current and
voltage transducers (located in the array’s DC combiner box)
and a pulse output from the solar production energy meter
(located on the alternating current (AC) side of the inverter),
were wired into a Campbell Scientific CR10X data logger. The
data logger was programmed to store 15 minute averages of the
weather, current, and voltage measurements and the total AC
energy produced over the same time interval.
At the time of the array’s installation, however, SA had not
yet established a site-wide computer network. As a result, the
data logger was isolated, and the only way one could obtain the
data was to download it through a direct connection to the
device. Such inaccessibility limited the usefulness of the logger
and data it recorded; the data was constantly being overwritten.
But in the years that have elapsed, SA has created a network
into which the CR10X could be integrated. For this reason, and
the reasons that follow, the Dining Hall array was chosen as the
subject of this project.
First, the software suite that Campbell Scientific sells with
their data loggers make it possible to create a graphical
interface and unique visual display. This dashboard could be
used to show valuable array performance information in real
time like DC and AC power. Performance parameters such as
Performance Index (PI) and Performance Ratio (PR) could also
be calculated and displayed alongside power and energy charts.
When employed in the dashboard, educational graphics such as
schematics and blurbs could be used to attract the attention of
people who visit SA and explain to them how solar energy
works. Furthermore, Campbell Scientific’s software enables
the user to publish the dashboard on the internet for easy access
and viewing by a broad audience.
Second, the data logger could be reprogrammed to produce
an expected power output curve for the array – one of the
dashboard’s desired features. This singular attribute would
allow the calculation of PI, which would enable SA to instantly
gauge the performance of the Dining Hall array. Many inverter
manufacturers, Fronius included, can provide the system owner
the ability to access his array’s performance data online.
Among the information typically included on such a site is the
average power output of the array and daily and monthly
energy yields. Some inverter websites import modeled monthly
energy yields from PV Watts or some other software tool and
compare the actual monthly yield to the modeled. But very few,
if any, inverter websites produce an expected power
performance curve for an array. This unique feature could help
the system owner catch and address performance issues when
they begin to appear.
Third, the data logger could easily accept the addition of
new weather instruments as spare inputs were available.
Global Horizontal Irradiance (GHI) data was already being
recorded, yet a Plane of Array (POA) pyranometer as well as a
module temperature sensor would be needed to associate the
power output of the array with the two variables of irradiance
and module temperature.
Last, the data logger would also make it possible to archive
historical data for later performance analysis and
troubleshooting. From the data, SA could generate monthly
and annual system reports that compare actual energy values to
modeled energy values. Performance metrics, PI and PR, could
WEATHER STATION
3
also be trended over time to provide SA further insight into the
operation of the Dining Hall array.
For these reasons, the Dining Hall array, along with its
accompanying data logger, provided the possibility and
functionality necessary to meet the first project objective. A
Letter of Recommendation was written to SA’s Solar
Committee recommending the Dining Hall array as the prime
candidate for the project. The required hardware, software, and
support was also requested in the letter. SRP was contacted,
and the utility generously furnished two newly calibrated
pyranometers (LiCor LI200X), a module temperature sensor, a
network link for the data logger, the data logger software, and
wiring diagrams.
In May 2013, the new instruments and hardware were
installed and wired to the data logger per the provided
instructions and schematics. The module temperature sensor
was placed in the center of a cell on a PV panel at the front and
center of the array. One pyranometer was installed level to the
horizon to acquire GHI measurements while the other LI200X
was aligned to the tilt and orientation of the array – as near as
was possible – in order to obtain the POA irradiance. The data
logger was reprogrammed to accept the two new inputs and
provide 5 and 15 minute averages/totals. The GHI and ambient
temperature readings were then verified against measurements
being made by a local weather station, NREL’s Southwest Solar
Research Park, which is at Phoenix Sky Harbor Airport
approximately 20 miles away. These readings seemed to be in
general agreement, and the POA irradiance, given its small tilt
angle, and module temperature values seemed reasonable.
With the weather station fully functional, array performance
data could be collected and analyzed to determine the
relationship between the AC power output of the array and at
least two of the following independent variables: irradiance,
ambient temperature, wind speed, and/or module temperature.
TABLE 1: DATA LOGGER INSTRUMENTS & READINGS
Instrument Measurement
LI200X (1) Global Horizontal Irradiance (W/m2)
LI200X (2) Plane of Array Irradiance (W/m2)
108 L Ambient Temperature (°C)
110 PV PV Module Temperature (°C)
03101 L Wind Speed (m/s)
VT7-010B DC Voltage Transducer (V)
CTL-100/101 DC Current Transducer (A)
KYZ Pulse AC Energy – from Inverter (kWh)
Determining the Expected Power Output Curve
Background – Several methods currently exist to relate
two or more of the above independent variables to the AC
power output of a PV array for the purpose of determining a
power rating at a certain reporting condition. Only three
approaches will be considered here. For each of these methods,
data for each of the independent variables must be collected
over a certain period of time using a data acquisition system
(DAS) such as the CR10X data logger.
The simplest method, employed by Senior Engineer Jim
Hansen of Arizona Public Service for rating their PV power
plants [1], states that the relationship between the temperature-
corrected AC power, PTC is proportional to the POA irradiance
as signified by the following equation:
𝑃𝑇𝐶 = 𝐴 ∙ (𝑃𝑂𝐴) (1)
Where A is a constant of the regression. PTC is found using the
module temperature, Tm, and the PV panel manufacturer-
provided temperature coefficient for power, CT (%/°C), in this
expression:
𝑃𝑇𝐶 = 𝑃𝑚𝑒𝑎𝑠/{1 + 𝐶𝑇 ∙ (𝑇𝑚 − 𝑇0)} (2)
Where:
Pmeas = Measured AC power (W)
T0 = Reporting condition temperature or 25°C
The expected or estimated power output of the array, Pest, can
then be calculated by:
𝑃𝑒𝑠𝑡 = 𝐴 ∙ 𝑃𝑂𝐴 ∙ {1 + 𝐶𝑇 ∙ (𝑇𝑚 − 𝑇0)} (3)
In plain terms, Eq. (3) implies that the power output of the
array is most significantly influenced by the irradiance lighting
upon it and is slightly affected by the module temperature but
adjusted accordingly. Any power losses resulting from voltage
drops or wire resistance or inverter inefficiency are implicitly
compensated for by considering only the array’s AC power
output.
Another popular system for rating the DC or AC power
output of a PV array is the PVUSA method [2, 3]. This method
has been extensively tested and widely used by the PV industry.
It was developed as part of the PVUSA project sponsored by
Pacific Gas & Electric in the late 1980s and early 1990s.
ASTM standard E2848-11 recommends its use for “acceptance
testing of newly installed photovoltaic systems, reporting of
DC or AC system performance, and for monitoring
photovoltaic system performance” [4]. The PVUSA equation is
as follows:
𝑃 = 𝐼 ∙ (𝐴 + 𝐵 ∙ 𝐼 + 𝐶 ∙ 𝑇𝑎 + 𝐷 ∙ 𝑊𝑆) (4)
Where:
P = AC power (W)
I = Plane of array irradiance (W/m2)
𝑇𝑎= Ambient temperature (C)
WS = Wind speed (m/s)
A-D = Regression constants derived from collected data

4
The PVUSA equation makes use of the fact that real AC
electrical power is the product of current, voltage, and power
factor. Array current is directly proportional to POA irradiance
whereas array voltage is a function of the module temperature.
Module temperature, when it is not measured, can be estimated
5
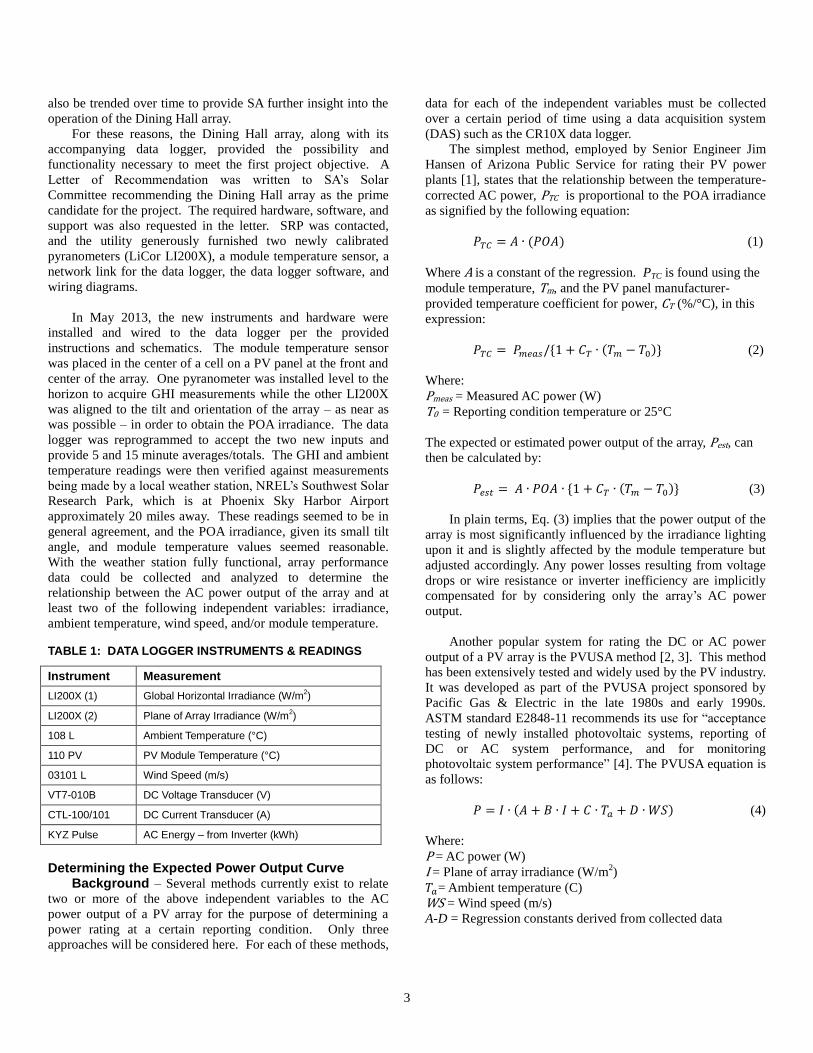
FIGURE 2: POA IRRADIANCE & AC POWER, JUNE 16-28 – FILTERED DAYS CIRLCLED.
when irradiance, ambient temperature, and wind speed are
known. Therefore, the PVUSA employs these variables to
represent the affect each of them may have on system voltage.
Power factor, for most grid-tied inverters, is unity. Like the
Hansen method, power losses of the system are imbedded in
the expression.
The third regression analysis system considered here is
known as the King 3-Part method [3]. This approach was
developed by David King of Sandia National Laboratories as
an integrated product of the array performance and inverter
models that were also developed at Sandia. In truth, it is a
three-part method which consists of (1) determining the
effective solar irradiance; (2) defining the operating
temperature of the module using an explicit expression that
accounts for irradiance, temperature, and wind speed; and (3)
employing the results of (1) and (2) to assess the electrical
performance of the array and the inverter in the equation that
follows:
𝑃 = 𝐴1 ∙ 𝐼𝑒 + 𝐴2 ∙ 𝐼𝑒 ∙ (𝑇𝑚 + 273) ∙ ln(𝐼𝑒) +
𝐴3 ∙ 𝐼𝑒 ∙ [(𝑇𝑚 + 273) ∙ ln(𝐼𝑒)]2 +
𝐴4 ∙ 𝐼𝑒 ∙ (𝑇𝑚 − 𝑇0) (5)
Where:
P = AC power (W)
𝐼𝑒 = Effective irradiance (dimensionless)
Tm = Module temperature (C)
A1-A4 = Regression coefficients
According to King, there are several ways to calculate the
effective irradiance; the method being dependent on the type of
device being used to measure the irradiance, e.g., reference cell
or thermopile pyranometer or photodiode [5]. When using a
photodiode such as the LI200X, the effective irradiance is
defined as the quotient of the measured irradiance divided by
the reference irradiance or 1000 W/m2. If soiling is present, the
result may be adjusted using a soiling factor. The module
temperature, if it is not being measured, may be determined
using an empirical expression King defines elsewhere [3,5].
Methodology – On the morning of June 10, 2013, the
Dining Hall array was washed, and data collection commenced.
Data was gathered over the next eighteen days – from June 10
through June 28. Using the on-site weather station and other
sensors, global horizontal and POA irradiances, ambient and
module temperatures, wind speed, and DC current and voltage
measurements were collected every 10 seconds and averaged
over both 5 & 15 minute intervals. The AC energy, measured
by a pulse output from the solar production meter, was totalized
over the same time interval. Once the data was obtained, the
average AC power was calculated and plotted along with the
POA irradiance as shown in Figure 2. Figure 2 depicts only the
last twelve days of the data set since the first six days were
cloudy days.
ASTM E2848-11 guidelines were followed in filtering the
data set for the analysis. For example, the standard and another
publication by Kimber et al. stated that the regression model
error would be minimized by only analyzing clear days, i.e.,
days where the AC power and irradiance trace an almost perfect
bell curve. Thus, data from June 21, 22, & 24 were eliminated.
The data was also screened to remove data points associated
with POA irradiance conditions of less than 500 W/m2. As a
result of both filters, the data set was reduced to 278 data points
(15 minute averages) or nearly 70 hours of excellent data – a
very robust data set as defined by the standard.
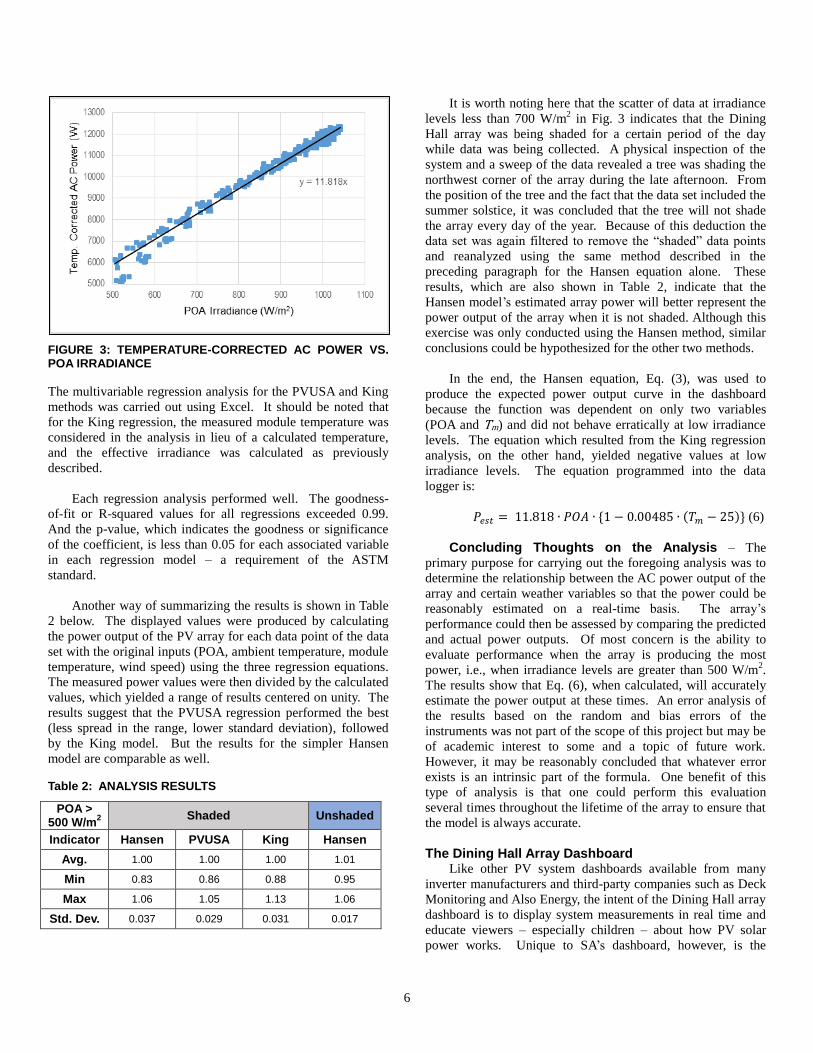
Results & Discussion – The regression analyses were
carried out on the filtered data set in the following way. For the
Hansen method, the measured power output of the array was
temperature-corrected using the measured module temperature
and CT = -0.485 %/°C in Eq. (2). The temperature corrected
power values were then plotted against corresponding POA
irradiance values as shown in Fig. 3. Excel’s linear regression
analysis calculated the equation displayed on the chart.
6
FIGURE 3: TEMPERATURE-CORRECTED AC POWER VS. POA IRRADIANCE
The multivariable regression analysis for the PVUSA and King
methods was carried out using Excel. It should be noted that
for the King regression, the measured module temperature was
considered in the analysis in lieu of a calculated temperature,
and the effective irradiance was calculated as previously
described.
Each regression analysis performed well. The goodness-
of-fit or R-squared values for all regressions exceeded 0.99.
And the p-value, which indicates the goodness or significance
of the coefficient, is less than 0.05 for each associated variable
in each regression model – a requirement of the ASTM
standard.
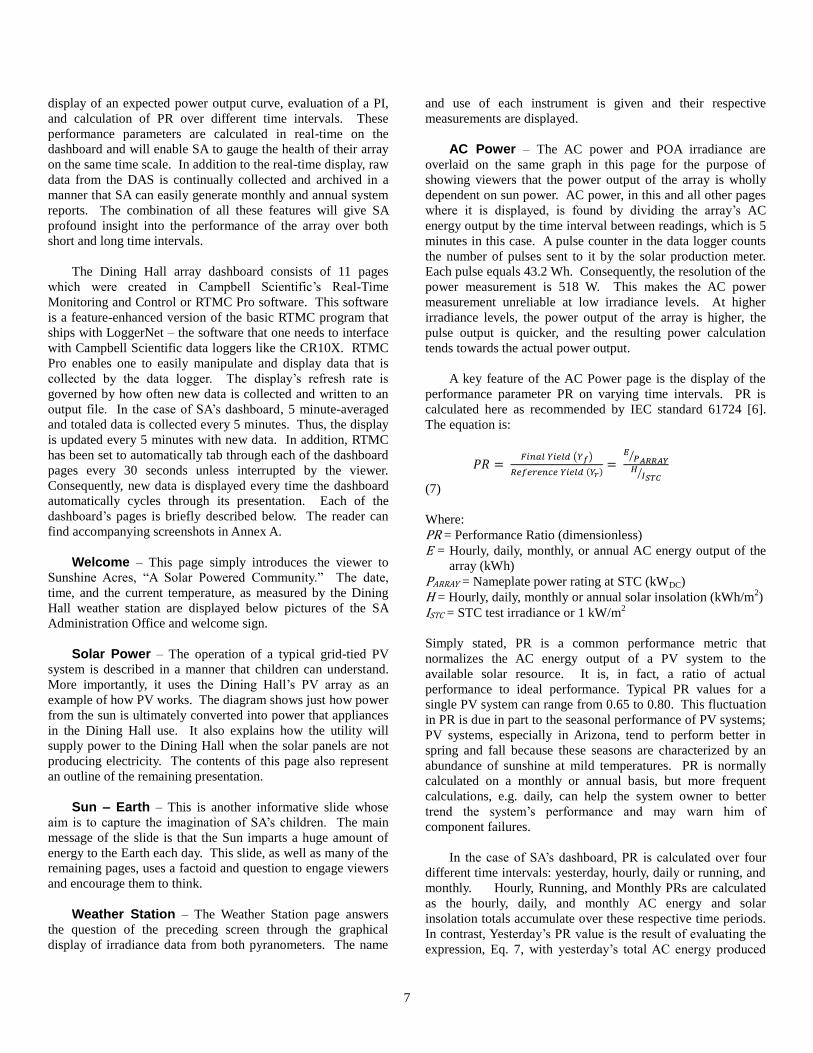
Another way of summarizing the results is shown in Table
2 below. The displayed values were produced by calculating
the power output of the PV array for each data point of the data
set with the original inputs (POA, ambient temperature, module
temperature, wind speed) using the three regression equations.
The measured power values were then divided by the calculated
values, which yielded a range of results centered on unity. The
results suggest that the PVUSA regression performed the best
(less spread in the range, lower standard deviation), followed
by the King model. But the results for the simpler Hansen
model are comparable as well.
Table 2: ANALYSIS RESULTS
POA > 500 W/m
2
Shaded Unshaded
Indicator Hansen PVUSA King Hansen
Avg. 1.00 1.00 1.00 1.01
Min 0.83 0.86 0.88 0.95
Max 1.06 1.05 1.13 1.06
Std. Dev. 0.037 0.029 0.031 0.017
It is worth noting here that the scatter of data at irradiance
levels less than 700 W/m2 in Fig. 3 indicates that the Dining
Hall array was being shaded for a certain period of the day
while data was being collected. A physical inspection of the
system and a sweep of the data revealed a tree was shading the
northwest corner of the array during the late afternoon. From
the position of the tree and the fact that the data set included the
summer solstice, it was concluded that the tree will not shade
the array every day of the year. Because of this deduction the
data set was again filtered to remove the “shaded” data points
and reanalyzed using the same method described in the
preceding paragraph for the Hansen equation alone. These
results, which are also shown in Table 2, indicate that the
Hansen model’s estimated array power will better represent the
power output of the array when it is not shaded. Although this
exercise was only conducted using the Hansen method, similar
conclusions could be hypothesized for the other two methods.
In the end, the Hansen equation, Eq. (3), was used to
produce the expected power output curve in the dashboard
because the function was dependent on only two variables
(POA and Tm) and did not behave erratically at low irradiance
levels. The equation which resulted from the King regression
analysis, on the other hand, yielded negative values at low
irradiance levels. The equation programmed into the data
logger is:
𝑃𝑒𝑠𝑡 = 11.818 ∙ 𝑃𝑂𝐴 ∙ {1 − 0.00485 ∙ (𝑇𝑚 − 25)} (6)
Concluding Thoughts on the Analysis – The
primary purpose for carrying out the foregoing analysis was to
determine the relationship between the AC power output of the
array and certain weather variables so that the power could be
reasonably estimated on a real-time basis. The array’s
performance could then be assessed by comparing the predicted
and actual power outputs. Of most concern is the ability to
evaluate performance when the array is producing the most
power, i.e., when irradiance levels are greater than 500 W/m2.
The results show that Eq. (6), when calculated, will accurately
estimate the power output at these times. An error analysis of
the results based on the random and bias errors of the
instruments was not part of the scope of this project but may be
of academic interest to some and a topic of future work.
However, it may be reasonably concluded that whatever error
exists is an intrinsic part of the formula. One benefit of this
type of analysis is that one could perform this evaluation
several times throughout the lifetime of the array to ensure that
the model is always accurate.
The Dining Hall Array Dashboard Like other PV system dashboards available from many
inverter manufacturers and third-party companies such as Deck
Monitoring and Also Energy, the intent of the Dining Hall array
dashboard is to display system measurements in real time and
educate viewers – especially children – about how PV solar
power works. Unique to SA’s dashboard, however, is the
7
display of an expected power output curve, evaluation of a PI,
and calculation of PR over different time intervals. These
performance parameters are calculated in real-time on the
dashboard and will enable SA to gauge the health of their array
on the same time scale. In addition to the real-time display, raw
data from the DAS is continually collected and archived in a
manner that SA can easily generate monthly and annual system
reports. The combination of all these features will give SA
profound insight into the performance of the array over both
short and long time intervals.
The Dining Hall array dashboard consists of 11 pages
which were created in Campbell Scientific’s Real-Time
Monitoring and Control or RTMC Pro software. This software
is a feature-enhanced version of the basic RTMC program that
ships with LoggerNet – the software that one needs to interface
with Campbell Scientific data loggers like the CR10X. RTMC
Pro enables one to easily manipulate and display data that is
collected by the data logger. The display’s refresh rate is
governed by how often new data is collected and written to an
output file. In the case of SA’s dashboard, 5 minute-averaged
and totaled data is collected every 5 minutes. Thus, the display
is updated every 5 minutes with new data. In addition, RTMC
has been set to automatically tab through each of the dashboard
pages every 30 seconds unless interrupted by the viewer.
Consequently, new data is displayed every time the dashboard
automatically cycles through its presentation. Each of the
dashboard’s pages is briefly described below. The reader can
find accompanying screenshots in Annex A.
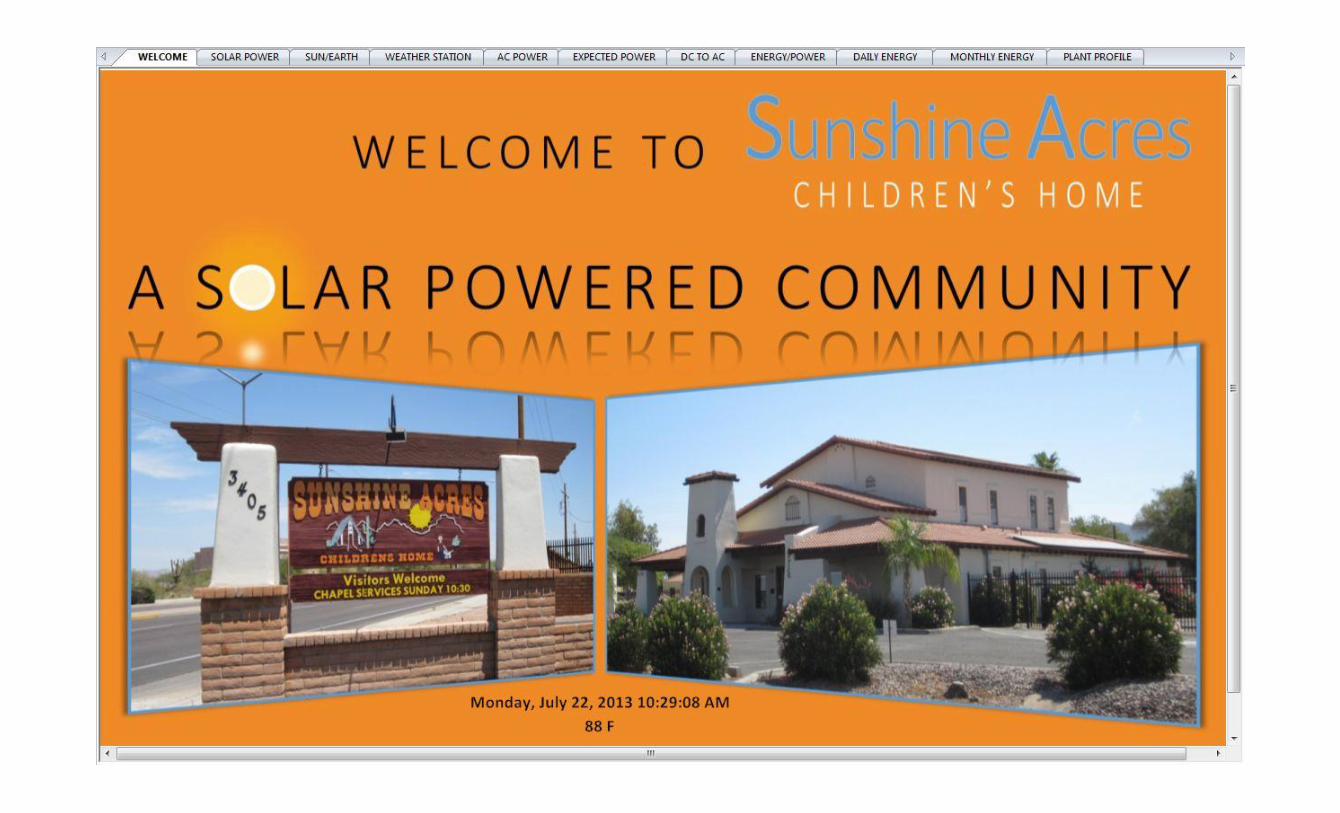
Welcome – This page simply introduces the viewer to
Sunshine Acres, “A Solar Powered Community.” The date,
time, and the current temperature, as measured by the Dining
Hall weather station are displayed below pictures of the SA
Administration Office and welcome sign.
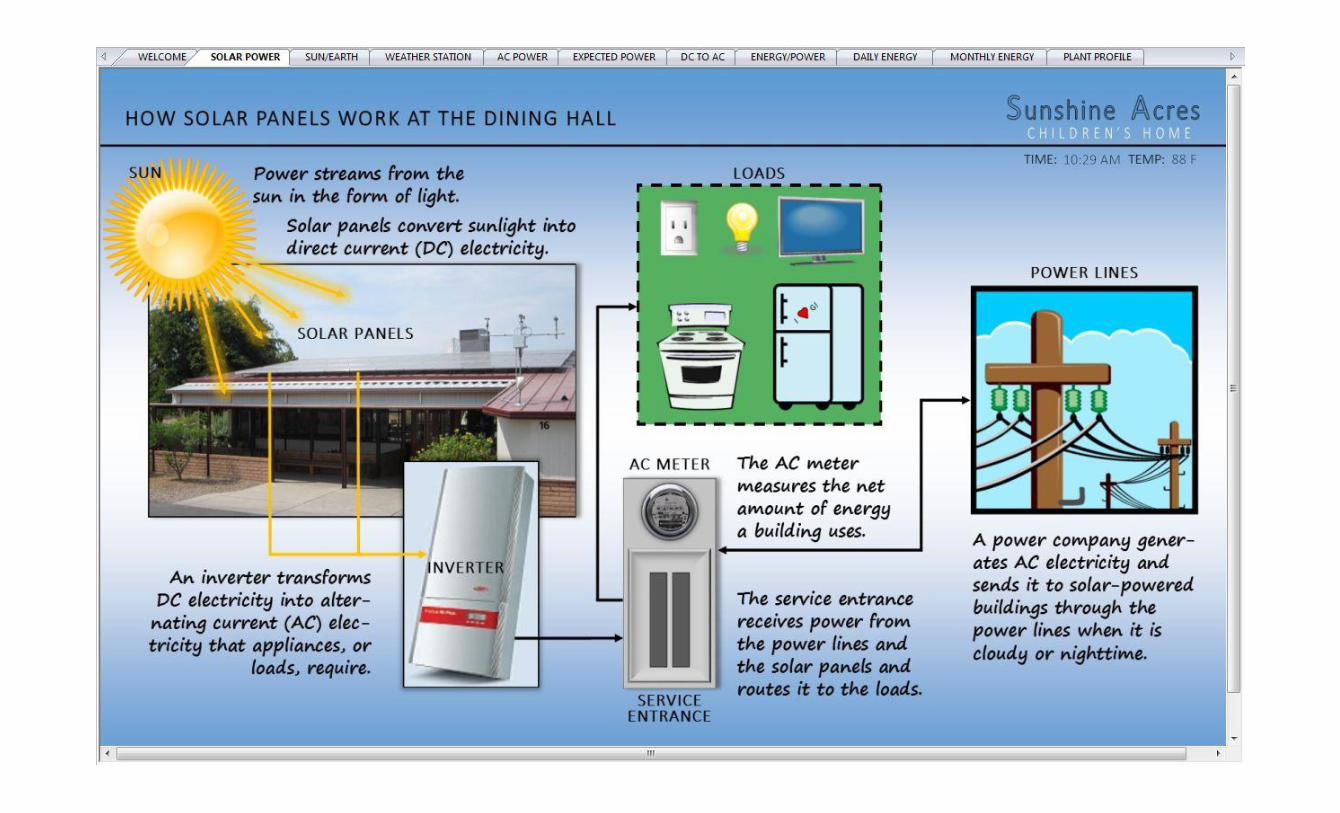
Solar Power – The operation of a typical grid-tied PV
system is described in a manner that children can understand.
More importantly, it uses the Dining Hall’s PV array as an
example of how PV works. The diagram shows just how power
from the sun is ultimately converted into power that appliances
in the Dining Hall use. It also explains how the utility will
supply power to the Dining Hall when the solar panels are not
producing electricity. The contents of this page also represent
an outline of the remaining presentation.
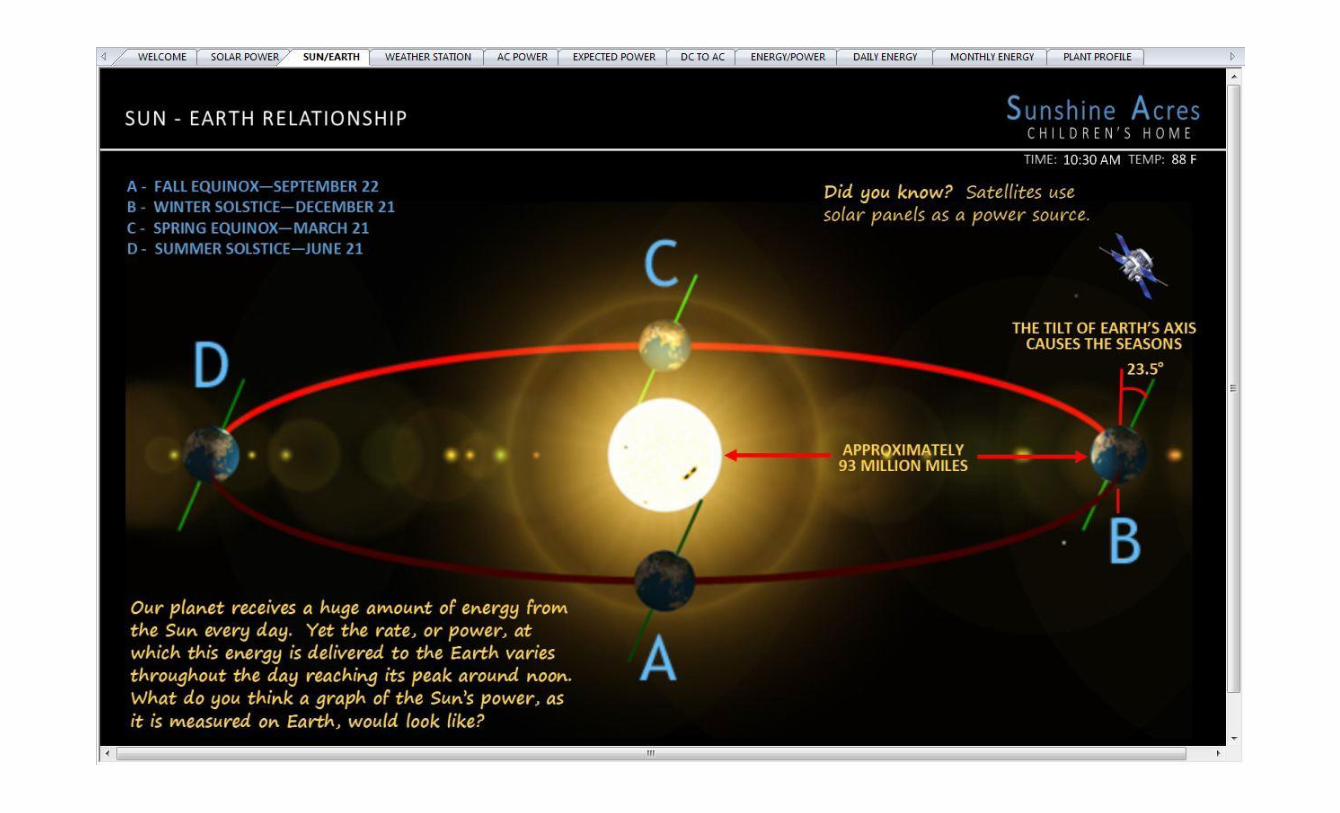
Sun – Earth – This is another informative slide whose
aim is to capture the imagination of SA’s children. The main
message of the slide is that the Sun imparts a huge amount of
energy to the Earth each day. This slide, as well as many of the
remaining pages, uses a factoid and question to engage viewers
and encourage them to think.
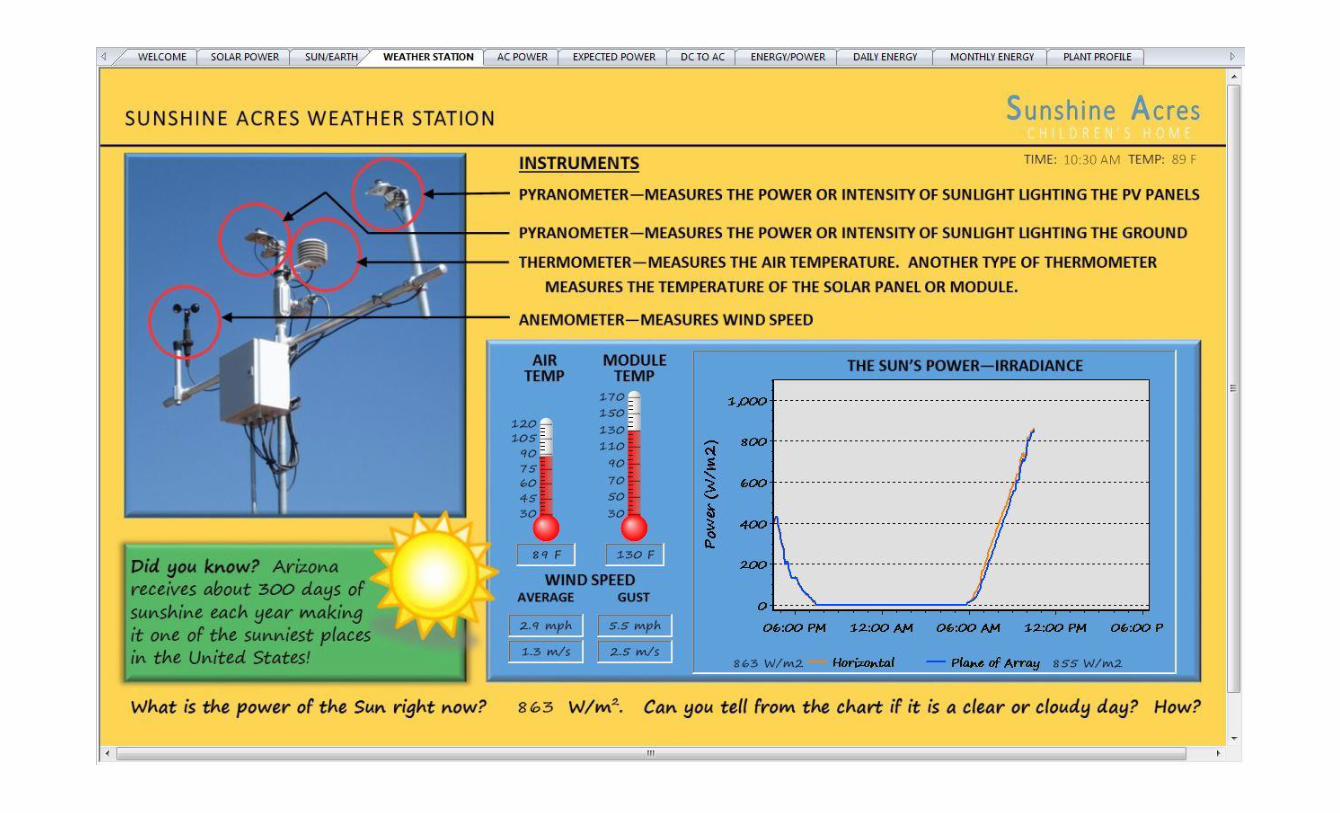
Weather Station – The Weather Station page answers
the question of the preceding screen through the graphical
display of irradiance data from both pyranometers. The name
and use of each instrument is given and their respective
measurements are displayed.
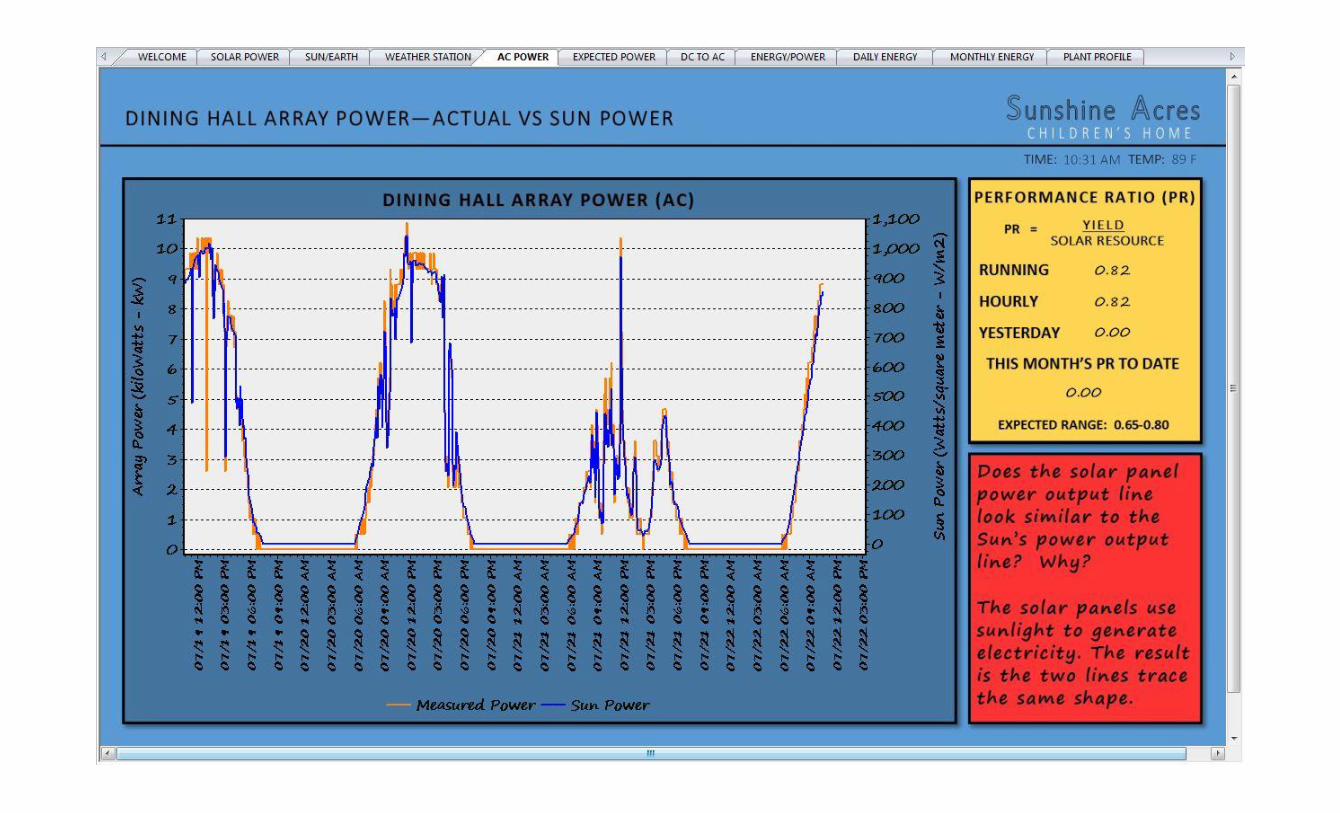
AC Power – The AC power and POA irradiance are
overlaid on the same graph in this page for the purpose of
showing viewers that the power output of the array is wholly
dependent on sun power. AC power, in this and all other pages
where it is displayed, is found by dividing the array’s AC
energy output by the time interval between readings, which is 5
minutes in this case. A pulse counter in the data logger counts
the number of pulses sent to it by the solar production meter.
Each pulse equals 43.2 Wh. Consequently, the resolution of the
power measurement is 518 W. This makes the AC power
measurement unreliable at low irradiance levels. At higher
irradiance levels, the power output of the array is higher, the
pulse output is quicker, and the resulting power calculation
tends towards the actual power output.
A key feature of the AC Power page is the display of the
performance parameter PR on varying time intervals. PR is
calculated here as recommended by IEC standard 61724 [6].
The equation is:
𝑃𝑅 = 𝐹𝑖𝑛𝑎𝑙 𝑌𝑖𝑒𝑙𝑑 (𝑌 )
𝑅𝑒𝑓𝑒𝑟𝑒𝑛𝑐𝑒 𝑌𝑖𝑒𝑙𝑑 (𝑌 )=
𝐸𝑃 ⁄
𝐻𝐼 ⁄
(7)
Where:
PR = Performance Ratio (dimensionless) E = Hourly, daily, monthly, or annual AC energy output of the
array (kWh)
PARRAY = Nameplate power rating at STC (kWDC)
H = Hourly, daily, monthly or annual solar insolation (kWh/m2)
ISTC = STC test irradiance or 1 kW/m2
Simply stated, PR is a common performance metric that
normalizes the AC energy output of a PV system to the
available solar resource. It is, in fact, a ratio of actual
performance to ideal performance. Typical PR values for a
single PV system can range from 0.65 to 0.80. This fluctuation
in PR is due in part to the seasonal performance of PV systems;
PV systems, especially in Arizona, tend to perform better in
spring and fall because these seasons are characterized by an
abundance of sunshine at mild temperatures. PR is normally
calculated on a monthly or annual basis, but more frequent
calculations, e.g. daily, can help the system owner to better
trend the system’s performance and may warn him of
component failures.
In the case of SA’s dashboard, PR is calculated over four
different time intervals: yesterday, hourly, daily or running, and
monthly. Hourly, Running, and Monthly PRs are calculated
as the hourly, daily, and monthly AC energy and solar
insolation totals accumulate over these respective time periods.
In contrast, Yesterday’s PR value is the result of evaluating the
expression, Eq. 7, with yesterday’s total AC energy produced
8
and total solar insolation received. This quantity is more useful
to the system owner as hourly and running PR can fluctuate
over the course of the day. The running monthly PR may also
be a valuable performance parameter if the owner notices that it
changes greatly from day to day. A true monthly PR is
calculated elsewhere (outside the dashboard) with monthly
energy totals.
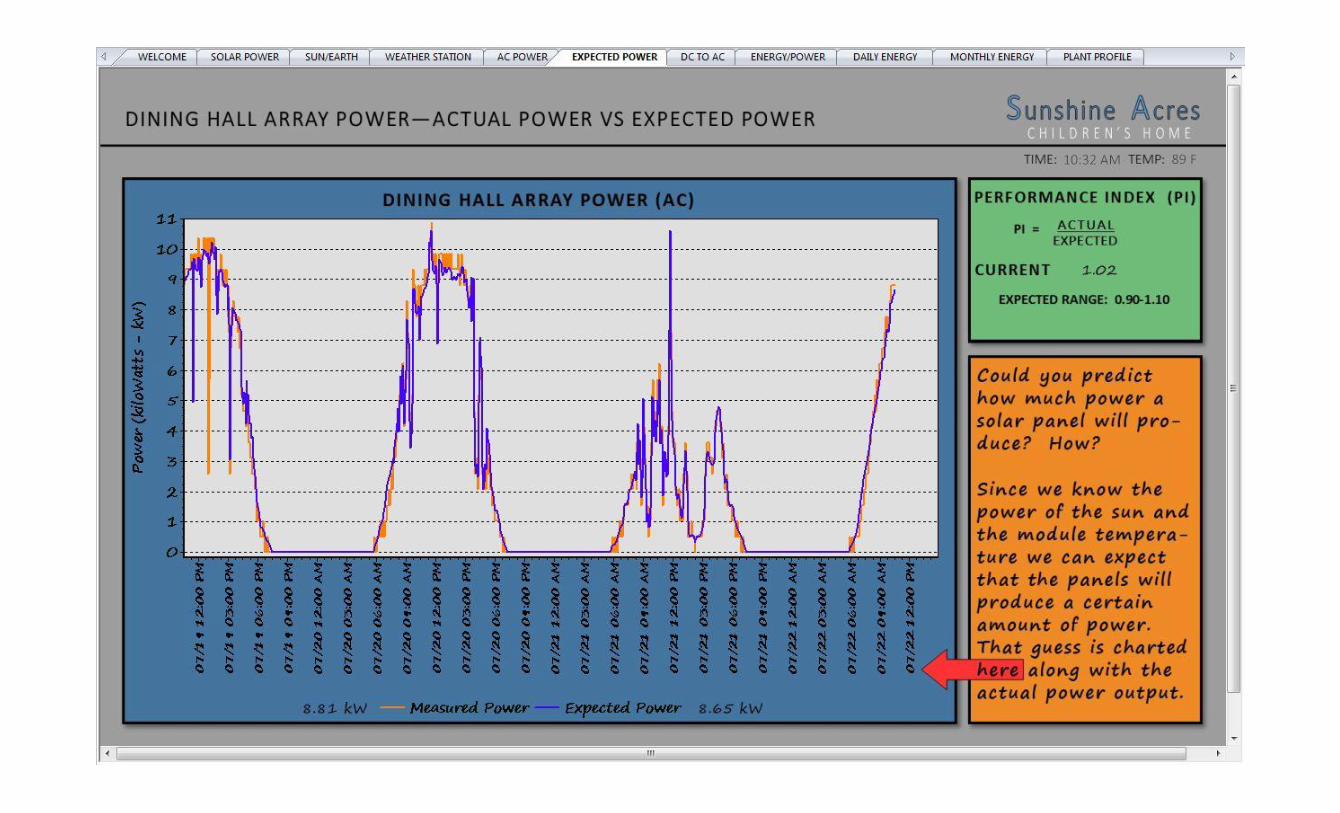
Expected Power – This page tells viewers that the power
output of the PV array can be estimated when the values of
solar irradiance and module temperature are known. The actual
AC power and expected AC power curves are overlaid on the
chart as a visual representation of how well the two quantities
agree. Digital readouts of these values are also shown near the
graph’s legend. The performance parameter, PI, is defined as
the ratio of actual power to expected power [7]:
𝑃𝐼 = (𝐴𝑐𝑡𝑢𝑎𝑙 𝑃𝑜𝑤𝑒𝑟)/(𝐸𝑥𝑝𝑒𝑐𝑡𝑒𝑑 𝑃𝑜𝑤𝑒𝑟) (8)
Because it is a power ratio and not an energy ratio, PI is a real-
time assessment of the array’s performance, and it is used here
to warn the owner of serious system operational issues. In the
case of this dashboard, the usefulness of PI is limited by the
accuracy of Eq. (6) and the resolution of the power
measurement or calculation. The expected range of PI values
over the course of the day (irradiance greater than 500 W/m2) is
from 0.90-1.10 as shown in the display page. However, for PI
calculations made at higher irradiance levels, the PI range
narrows. Thus, the owner will have a better opportunity to
catch more minor operational anomalies if he takes notice of PI
within an hour or two of noon. Average daily PI values are
calculated and stored outside the dashboard as well.
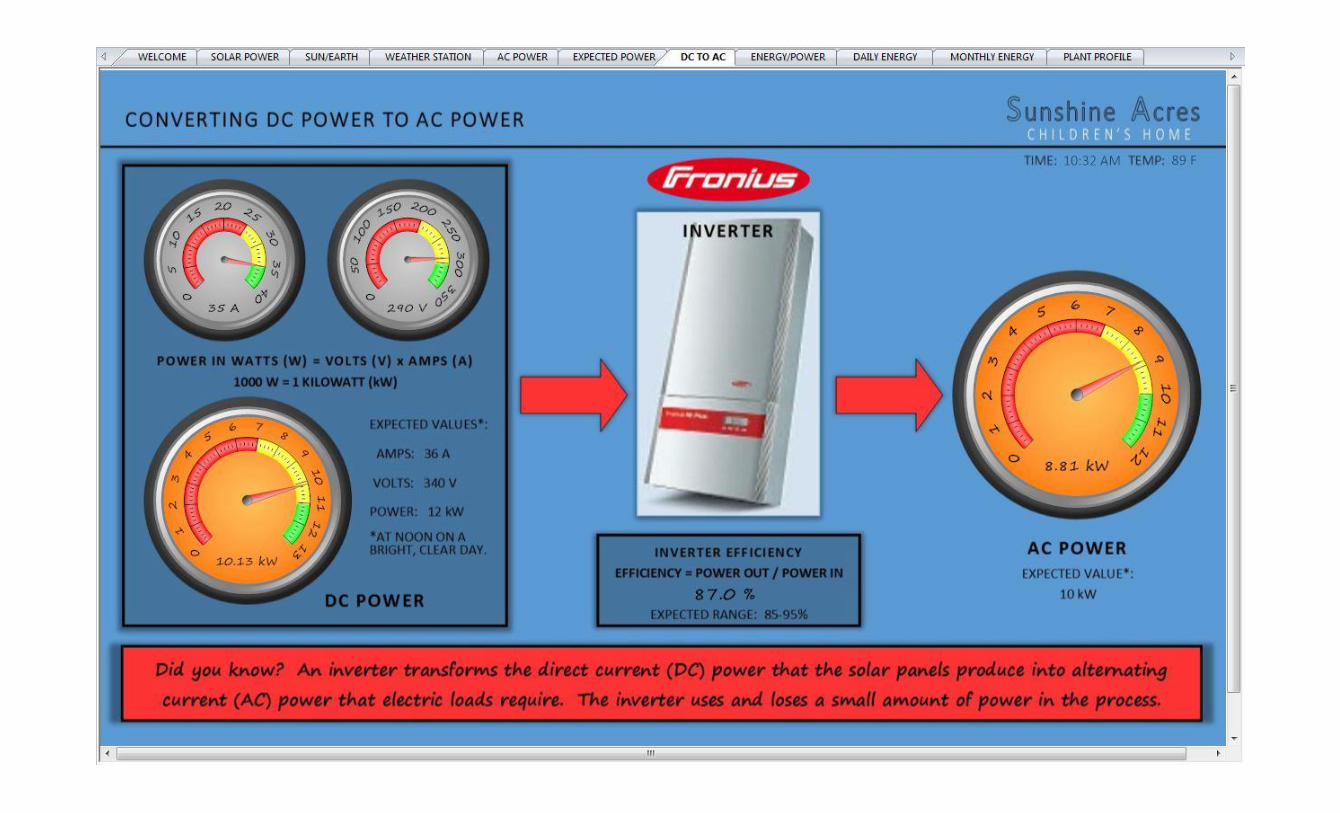
DC to AC – DC voltage and current measurements are
displayed with gauges and digital readouts on this page. DC
power (voltage x current) is calculated and shown in its own
gauge as well. The AC power is calculated and likewise
displayed. Typical values of all above quantities are provided
with the note that such values will occur near noon on a clear
sunny day. The inverter efficiency in percent is displayed as a
digital read-out and is calculated as the ratio of outgoing AC
power to incoming DC power. From an analysis conducted on
historical data, the inverter efficiency should fall within the
range of 85-95% and averages 90%. This single parameter can
help the system owner to determine if any changes in the power
output of the array are related to inverter performance issues.
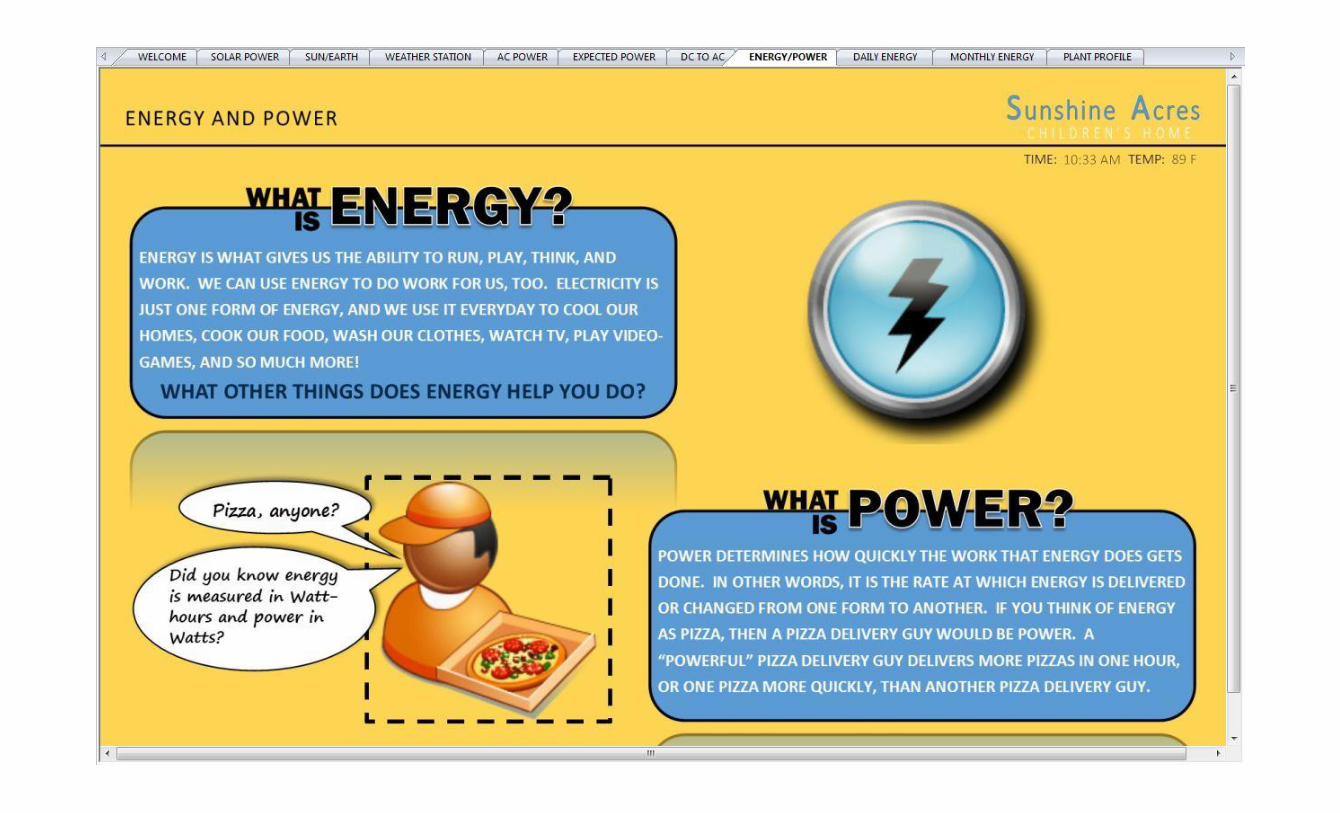
Energy/Power – The Energy/Power slide is used to
transition the viewer from the previous “power” pages to the
pending “energy” pages of the dashboard. Both energy and
power are generally defined here in terms children can
understand. The viewer can read that electricity is just one form
of energy, and it is delivered to all kinds of electrical gadgets by
power. Customary units of energy and power are also given so
the viewer can better understand information contained in the
other pages of the dashboard.
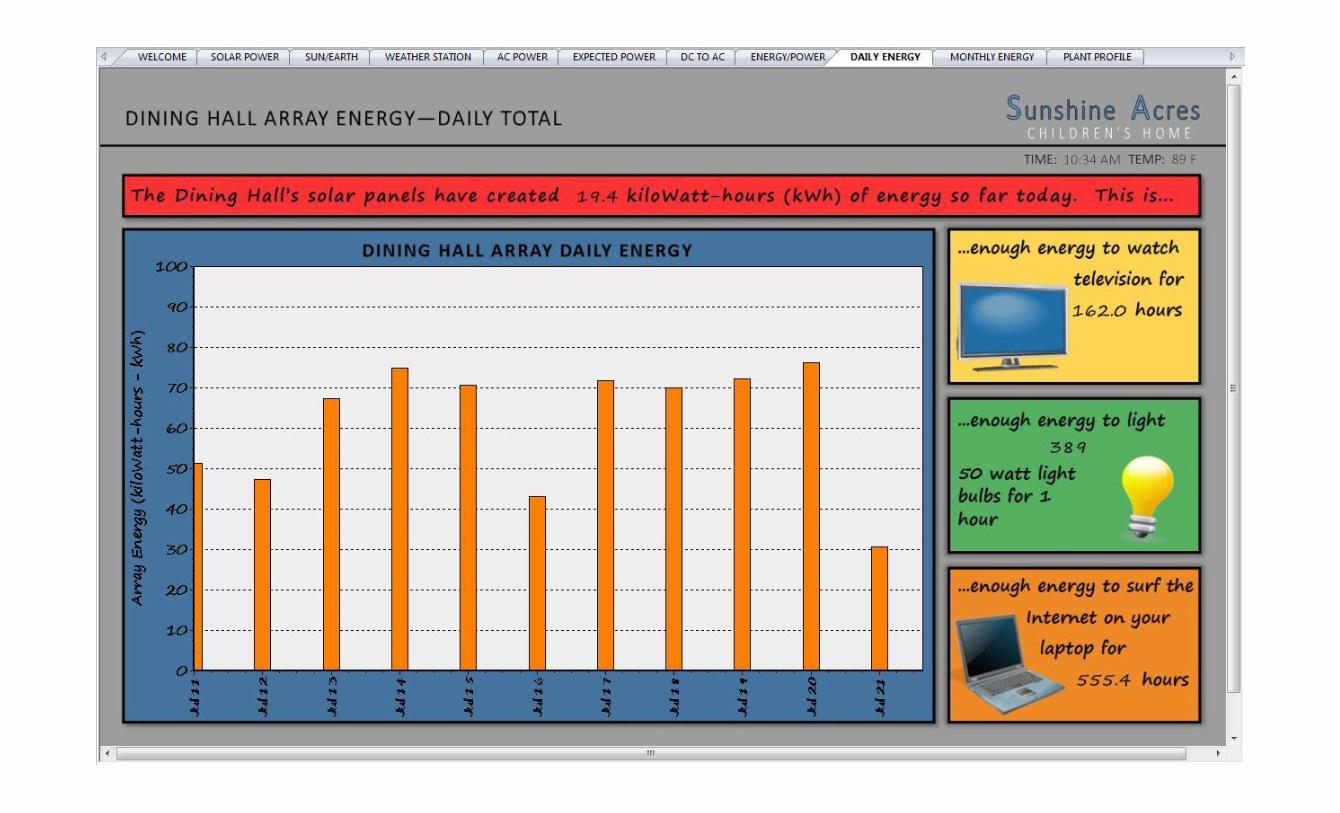
Daily Energy – In this page, the energy production of the
Dining Hall array over the past week is displayed in a bar graph
as daily totals – the newest record being yesterday’s total. A
digital readout at the top of the screen shows the current day’s
running energy total. In order for the viewer to comprehend
just how much energy has been produced, he is shown just how
many hours of TV he could watch or how many 50 W light
bulbs he could turn on for an hour or how many hours he could
surf the internet on his laptop. These are devices and activities
to which each viewer can readily relate.
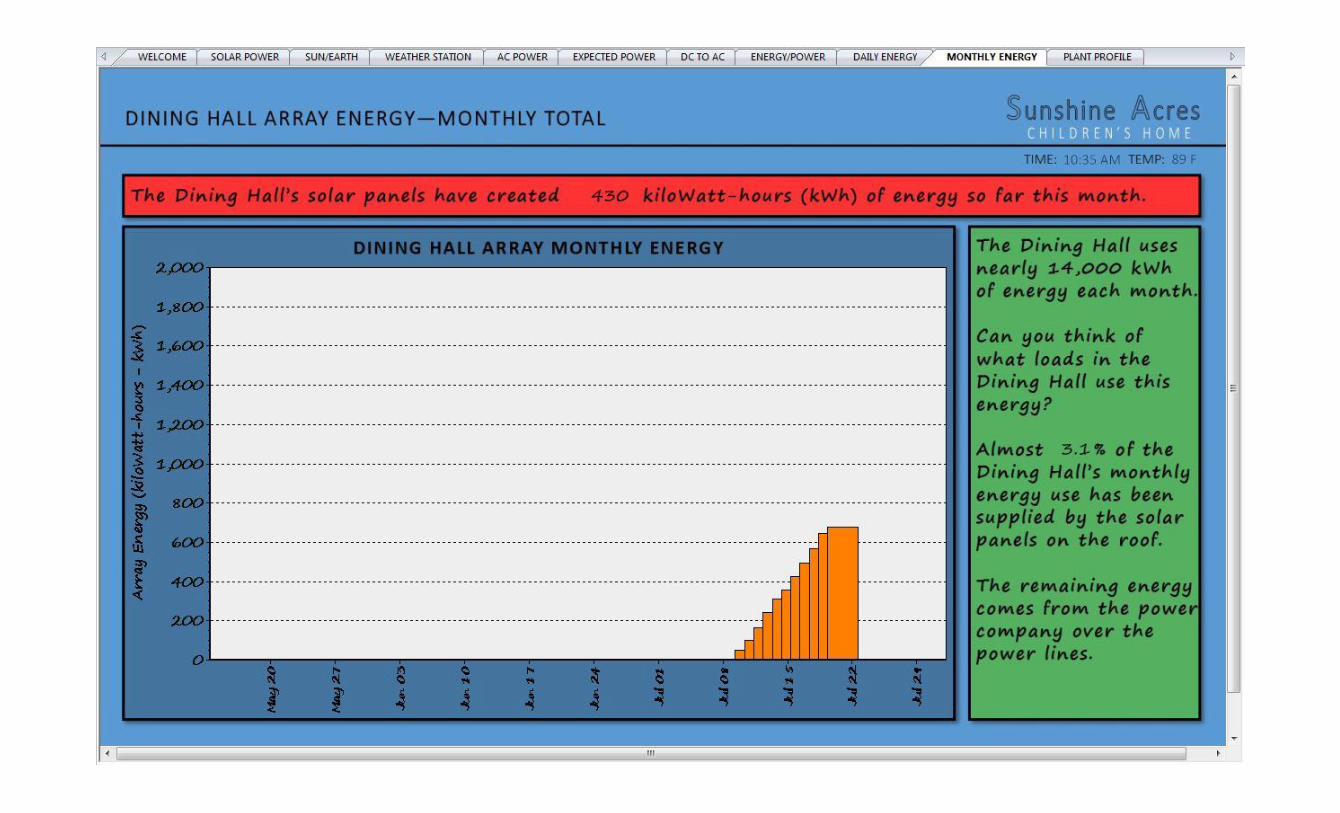
Monthly Energy – The Monthly Energy depicts the total
amount of energy the array has produced over the past three
months in another bar graph. This graph, however, displays the
totals differently than the Daily Energy total bar graph; each bar
represents the aggregate of all daily energy totals for all the
previous days of the month. Thus, the height of the last bar
signifies the current month’s running energy total through
yesterday. The most current running total is displayed as a
digital read-out at the top of the screen. The Dining Hall uses,
on average, nearly 14,000 kWh per month. The newest
monthly total is divided by this quantity to show how much of
the Dining Hall’s monthly energy requirement has been
provided by the array.
Plant Profile – This last page provides some detail about
the Dining hall array, that it was donated to SA by SRP and that
it is only one of several PV arrays on the property providing
power to the site.
SYSTEM MAINTENANCE The need for a maintenance program for SA’s solar arrays
is clear. Like so many other individuals and groups, SA has
made a significant investment in PV power systems because it
reduces their operating expenses which in turn increases their
financial ability to develop other important areas of their
enterprise. For SA their most important mission is helping
children in need. As a result, an appropriate maintenance
program will allow SA’s to protect their investment and enlarge
their ministry. The goal here was to create a maintenance
program that is thoughtful of the time commitment required of
SA staff and fitting to their level of expertise.
The first step in creating SA’s solar maintenance program
was to take an inventory of their current solar assets. Each
array was located and key information was collected. Such
information included the PV panel manufacturer; PV panel
STC power rating; the number of modules in the array; the
number of inverters per array, and the inverter manufacturer,
model, and size. Electrical 3-line diagrams for most of the
arrays were located, and technical manuals for each inverter
were downloaded from the respective manufacturer’s website.
A site-plan for the whole of the SA campus was obtained and
updated with the location of each of the arrays inventoried. All
of the above information was placed in, or linked to, a single
9
spreadsheet (SA Solar O&M Spreadsheet) that will be given to
SA maintenance staff. Manuals and data sheets for the Dining
Hall’s weather station and DAS were also included the file.
The inventory revealed that there are just over 80 central
inverters and 50 micro-inverters installed on the 500 kWdc of
PV arrays at SA. Of this total, SA is responsible for the upkeep
and maintenance of 38 central inverters, all of the micro
inverters, and nearly 1300 PV panels. Each central inverter, on
average, accepts power from 40 PV panels making SA’s solar
portfolio inverter intensive. It is well known that inverters are
the most frequently the cause of PV system failures and lost
energy production. For these reasons, it seemed justifiable to
focus SA’s monitoring and maintenance efforts at the inverter
level.
The inverter technical manuals were reviewed in order to
discover the manufacturer-recommended maintenance
procedures and the frequency of such activities. The Sunny
Boy manual indicated that regular inverter maintenance ensures
long operating life but did not specifically define “regular” as
monthly, semi-annual, or annual. On the other hand, Power
One recommended an annual inspection of enclosures and wire
terminations and annual cleaning of the inverter. Other
literature on PV systems operation and maintenance and the
Dining Hall array operating manual provided by SRP suggested
that inverters should be inspected twice a year [8].
Consequently, a semi-annual preventative maintenance
schedule was developed in the spreadsheet containing the
inventory and site plan for each of SA’s solar assets. The
schedule recommends which month each array should be
formally inspected, and it contains spaces for linking the
completed inspection report, recording recommended inverter
readings, and making annotations of site observations and
action items. The Dining Hall weather station is also included
on the schedule, and monthly inspection of the system is
suggested mainly to ensure that irradiance readings are not
affected by soiling.
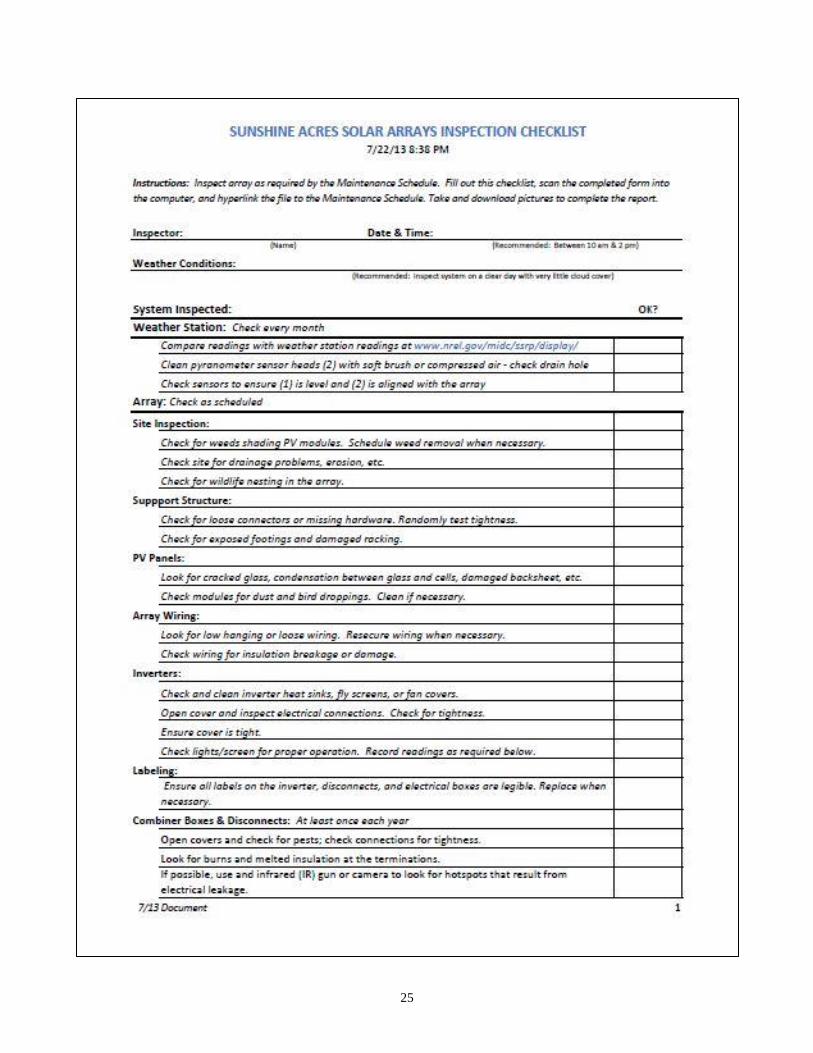
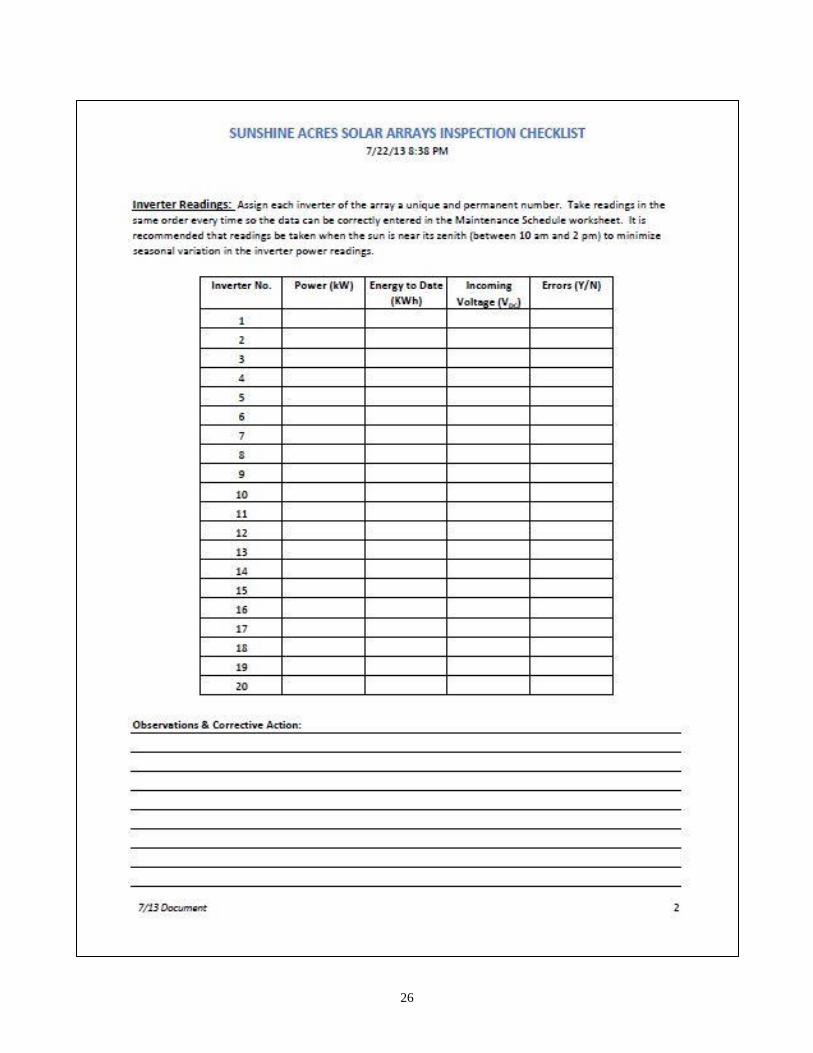
An “Array Inspection Checklist Form” was also created to
help SA staff know what to look for when inspecting the
weather station and solar array. A copy of the form is included
in Annex B for the reader’s reference. The checklist requires
the inspector to note the system inspected, date and time, and
current weather conditions. He is to check the weather station
instruments and clean both pyranometers. The solar array site
is to be inspected for overgrown weeds, destructive erosion,
and wildlife. Array PV panels, wiring and wire management,
support structure, and labeling are also to be checked. It is
suggested in the checklist that the inverters be checked for
proper operation and certain readings taken so array
performance can be trended over time. At least once a year, the
combiner boxes, disconnects, and inverter should be opened
and the condition of the wiring and wiring terminals examined
for loose connections and arcing. Lastly, a place for notes is
also provided. Instructions at the top of the form direct the
inspector to complete and archive the form so a record of
maintenance activity may be kept. Aside from opening
disconnects, electrical boxes, and inverters, the site inspection
does not require an in-depth knowledge of electricity or PV
power systems to be helpful. SA’s staff, if proficient in other
areas of maintenance, should be able to provide discerning eyes
that will prevent system failures and hazards from occurring.
In addition to formal semi-annual inspections and reports,
it is recommended that SA staff make quick informal monthly
walk-throughs of the array sites to check for weeds, dust on the
panels, and the inverter’s operational status. SA should also
make note of the monthly energy yield of each array as reported
by SRP in their electric bills as a bare minimum check of
system performance. A tab in the spreadsheet was created as a
place to record these numbers, and expected energy yield, as
calculated by PV Watts or the like, will be added in the future
for comparison. Doing this very small thing will help SA to
assess the performance of each array on a cursory level. It will
also assure them the PV system is operating properly or alert
them of malfunctioning equipment.
A more ideal system of monthly reporting would include
calculating PR and comparing it with an expected value as
recommended by PV maintenance experts [8, 9]. With the
DAS in place, this can easily be done for the Dining Hall array.
The data logger is programmed to output a data file containing
15 minute averages and totals of the measurements and
calculations it performs. Another spreadsheet was created
(Dining Hall Data – Performance Reports) and connected to
this constantly updating data file for the purpose of calculating
key performance metrics for the PV system. When the
spreadsheet is opened, it automatically imports the newest data,
calculates daily energy yield, PR, average PI, and average
inverter efficiency. This data automatically populates in charts
created for each month of the year. July’s chart is given below
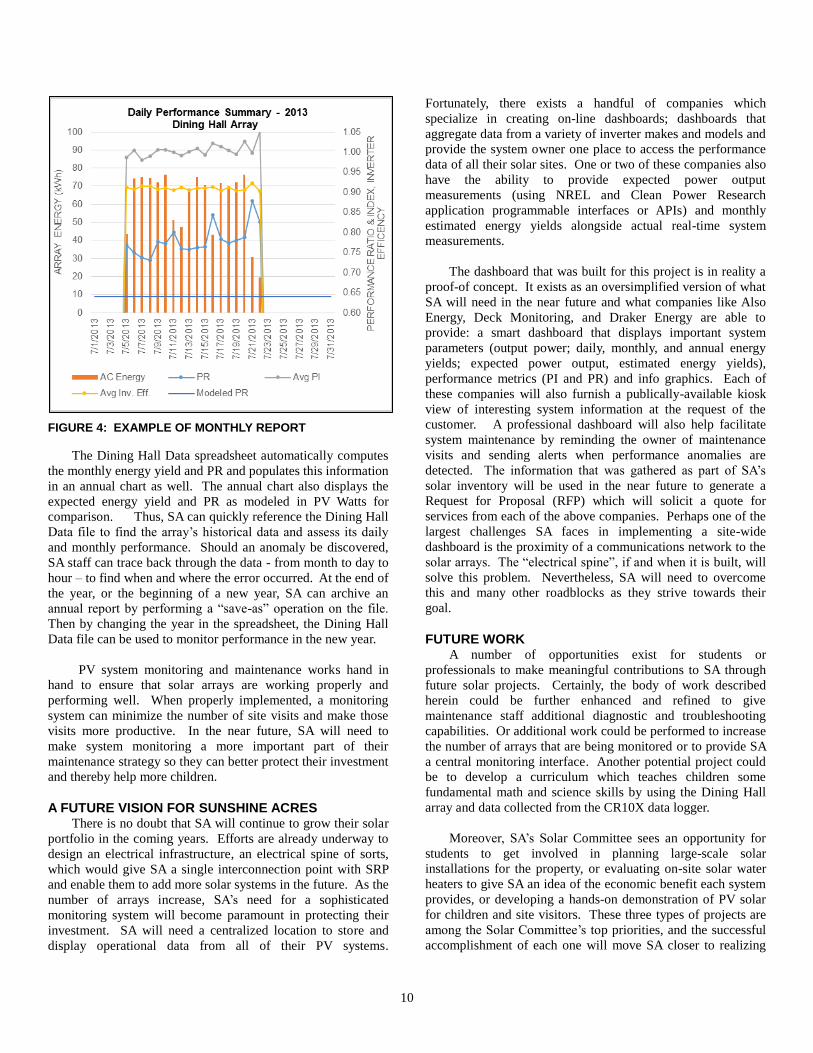
in Fig. 4 as an example of a nearly complete monthly report.
10
FIGURE 4: EXAMPLE OF MONTHLY REPORT
The Dining Hall Data spreadsheet automatically computes
the monthly energy yield and PR and populates this information
in an annual chart as well. The annual chart also displays the
expected energy yield and PR as modeled in PV Watts for
comparison. Thus, SA can quickly reference the Dining Hall
Data file to find the array’s historical data and assess its daily
and monthly performance. Should an anomaly be discovered,
SA staff can trace back through the data - from month to day to
hour – to find when and where the error occurred. At the end of
the year, or the beginning of a new year, SA can archive an
annual report by performing a “save-as” operation on the file.
Then by changing the year in the spreadsheet, the Dining Hall
Data file can be used to monitor performance in the new year.
PV system monitoring and maintenance works hand in
hand to ensure that solar arrays are working properly and
performing well. When properly implemented, a monitoring
system can minimize the number of site visits and make those
visits more productive. In the near future, SA will need to
make system monitoring a more important part of their
maintenance strategy so they can better protect their investment
and thereby help more children.
A FUTURE VISION FOR SUNSHINE ACRES There is no doubt that SA will continue to grow their solar
portfolio in the coming years. Efforts are already underway to
design an electrical infrastructure, an electrical spine of sorts,
which would give SA a single interconnection point with SRP
and enable them to add more solar systems in the future. As the
number of arrays increase, SA’s need for a sophisticated
monitoring system will become paramount in protecting their
investment. SA will need a centralized location to store and
display operational data from all of their PV systems.
Fortunately, there exists a handful of companies which
specialize in creating on-line dashboards; dashboards that
aggregate data from a variety of inverter makes and models and
provide the system owner one place to access the performance
data of all their solar sites. One or two of these companies also
have the ability to provide expected power output
measurements (using NREL and Clean Power Research
application programmable interfaces or APIs) and monthly
estimated energy yields alongside actual real-time system
measurements.
The dashboard that was built for this project is in reality a
proof-of concept. It exists as an oversimplified version of what
SA will need in the near future and what companies like Also
Energy, Deck Monitoring, and Draker Energy are able to
provide: a smart dashboard that displays important system
parameters (output power; daily, monthly, and annual energy
yields; expected power output, estimated energy yields),
performance metrics (PI and PR) and info graphics. Each of
these companies will also furnish a publically-available kiosk
view of interesting system information at the request of the
customer. A professional dashboard will also help facilitate
system maintenance by reminding the owner of maintenance
visits and sending alerts when performance anomalies are
detected. The information that was gathered as part of SA’s
solar inventory will be used in the near future to generate a
Request for Proposal (RFP) which will solicit a quote for
services from each of the above companies. Perhaps one of the
largest challenges SA faces in implementing a site-wide
dashboard is the proximity of a communications network to the
solar arrays. The “electrical spine”, if and when it is built, will
solve this problem. Nevertheless, SA will need to overcome
this and many other roadblocks as they strive towards their
goal.
FUTURE WORK A number of opportunities exist for students or
professionals to make meaningful contributions to SA through
future solar projects. Certainly, the body of work described
herein could be further enhanced and refined to give
maintenance staff additional diagnostic and troubleshooting
capabilities. Or additional work could be performed to increase
the number of arrays that are being monitored or to provide SA
a central monitoring interface. Another potential project could
be to develop a curriculum which teaches children some
fundamental math and science skills by using the Dining Hall
array and data collected from the CR10X data logger.
Moreover, SA’s Solar Committee sees an opportunity for
students to get involved in planning large-scale solar
installations for the property, or evaluating on-site solar water
heaters to give SA an idea of the economic benefit each system
provides, or developing a hands-on demonstration of PV solar
for children and site visitors. These three types of projects are
among the Solar Committee’s top priorities, and the successful
accomplishment of each one will move SA closer to realizing
11
their vision of a much more green and sustainable campus.
Without a doubt, Sunshine Acres provides solar students the
chance and challenge to grow professionally, and the
experience is rewarding.
ACKNOWLEDGMENTS The author would like to here acknowledge the
contribution of several key people and organizations that made
this project possible. First, to the staff of Sunshine Acres
Children’s Home, Kevin Humphrey, Jon Markwell, Larry Paap,
and Milt Laflen, thank you for all your help. Thank you, Joel
Dickinson of Salt River Project and Devarajan Srinivasan of
Via Sol Energy for your generous donation of material and
expertise. Also much thanks goes to Gilbert Palomino, John
Balfour, and Jim Hansen of Arizona Public Service for their
advising and expertise.
REFERENCES [1] Personal conference with Jim Hansen of APS
[2] Whitaker, C.M., et al., 1997, “Application and Validation of
a New PV Performance Characterization Method,” Proceedings
of the 26th
IEEE PVSC, pp. 1253-1256.
[3] Kimber, A., et al., 2009, “Improved Test Method to Verify
the Power Rating of a Photovoltaic (PV) Project,” Proceedings
of the 34th
IEEE PVSC, pp. 316-321.
[4] ASTM E2848-11e1, “Standard Test Method for Reporting
Photovoltaic Non-Concentrator System Performance.”
[5] King, D.L., Boyson, W.E., Kratochvil, J.A., 2004,
“Photovoltaic Array Performance Model,” SAND2004-3535,
Sandia National Laboratories, Albuquerque, NM.
[6] IEC 61724, “Photovoltaic System Performance Monitoring
– Guidelines for Measurement, Data Exchange, and Analysis.”
[7] Newmiller, J., et al., 1995, “PVUSA Instrumentation and
Data Analysis Techniques for Photovoltaic Systems,” Report
Number 95-30910000.3, Pacific Gas & Electric, San Ramon,
CA.
[8] Endbar, N., Key, T., 2010, “Addressing Solar Photovoltaic
Operations and Maintenance Challenges,” 1021496, EPRI, Palo
Alto, CA.
[9] Banke, B., 2009, “Solar Electric Facility O&M: Now
Comes the Hard Part,” RenewableEnergyWorld.com.
12
ANNEX A
MONITORING DISPLAY SCREENSHOTS
13
14
15
16
17
18
19
20
21
22
23

24
ANNEX B
MAINTENANCE CHECKLIST
25
26

27
ANNEX C
LIST OF PROJECT FILES
1. SA Regression Analysis REV1 – Excel Spreadsheet
2. SA Solar O&M Spreadsheet – Excel Spreadsheet
3. Dining Hall Data – Performance Reports – Excel Spreadsheet


![[Array, Array, Array, Array, Array, Array, Array, Array, Array, Array, Array, Array]](https://img.pdfslide.us/doc/110x75/56816460550346895dd63b8b/array-array-array-array-array-array-array-array-array-array-array.jpg)