Embed Size (px)
Citation preview

Sunrise Communications Group AG
Q3 2018 financial results –8 November 2018

Agenda
1 Summary & operational update O. Swantee (CEO)2 Financials A. Krause (CFO)3 Conclusion O. Swantee (CEO)4 Q & A
2

Summary: Q3 with organic EBITDA growth and strong customer momentum, as expected
3
• Customer growth momentum in key focus areas continued
• Strong growth in mobile postpaid (+7.9% YoY), internet (+9.4% YoY) and TV (+17.2%)
• Supported by continued B2B customer wins (Q3 includes: Canton Luzern, Edelweiss Air)
• Revenue up +1.9% YoY 1); service revenue up +1.4% with customer growth momentum more than offsetting lower ARPUs
• Gross profit growth of +1.4% YoY 1); lower run rate than in Q2 (+2.2%) due to summer roaming promotions; acceleration expected in Q4 in-line with guidance
• Adj. EBITDA up +1.3% 1) when excl. higher network service fees after tower disposal (incl. down -0.6%); B2B transition on-track with GP and EBITDA entering growth territory
• Guidance 2018 reiterated
• Q3’18 in this presentation is based on numbers excl. IFRS 15 impact, except where indicated differently; IFRS 15 impact is CHF +0.3m (CHF +0.9m) on Q3’18 revenue (adj. EBITDA)
1) Incl. IFRS 15: Q3 revenue +1.9%, service revenue +1.3%; GP +1.2%, adj EBITDA 0.0%, adj. EBITDA (excl. tower) +1.8% YoY

Strongest primary SIM net adds since 2012
4
• Postpaid driven by primary SIMs, leading to 1.69m total subscriptions (+7.9% YoY)
• Primary SIMs driven by B2B, Yallo, Sunrise ONE, strong network quality, broad product offering with attractive price performance ratio, and diversified distribution channels
• Roaming summer promotion supported momentum, but weighted on ARPU and gross margin
• Secondary data SIMs supported by demand for mobile broadband and Apple Watch
• Prepaid with ongoing pre- to postpaid migration, leading to 677k total subscriptions
• Q3 positively impacted by seasonality as in previous years; focus on valuable customer in-take maintained
• Targeted promotions supported pre- to postpaid migration
21 20 20 21 23
11 11 9 86
31
Q3’17
2731
Q4’17 Q2’18
30
Q1’18 Q3’18
31
Secondary (data)
Primary-10
-39
-30
-40
-9
Q1’18Q4’17Q3’17 Q3’18Q2’18
Postpaid mobile net adds (‘000) Prepaid mobile net adds (‘000)

• Internet customer base continues to grow: Sunrise now has 449k internet subscriptions
• Converged tariff ‘Sunrise ONE’ supported growth: 65k or 39% of billed 4P customer base already on Sunrise ONE (Q2: 60k or 38%)
• Focus on service excellence including hassle-free switching; ’more for more’ move implemented in Q3 1)
7
119
1212
Q3’18Q2’18Q1’18Q4’17Q3’17
Growing internet and TV customer base, with increasing share of fiber
5
• TV with solid growth: Sunrise now has 236k TV subscriptions
• Supported by attractive Sunrise TV offering and improved TV sports content with Sky and Teleclub
• 23% YoY increase in 4P billed customer base
69
7
1313
Q4’17Q3’17 Q2’18Q1’18 Q3’18
Internet net adds (‘000)
TV net adds (‘000)
1) Internet Start tariff moved from CHF45 (40Mbit/s) to CHF50 (50Mbit/s); Internet Comfort moved from CHF65 (100Mbit/s) to CHF70 (200Mbit/s); implemented for new (July) and existing (August) customers; customers could choose to opt-out at existing terms
Stable order in-take
2017
2018
OctJulApr
• June 17 promo more successful than June 18 promo, leading to less June orders getting activated (=net add) in Q3 this year; YTD and Q3 order in-take stable YoY
• Extending time delay between order in-take and activation as fiber share is rising; ̴ 70% of Q3 internet net adds via fiber technology
• Market liquidity continues to be limited, specially during summer months
Internet & TV order in-take
June Promo

ARPU: Mobile impacted by roaming promo – continuation of landline trends
6
• Internet & TV: supported by ‘more for more’ move in Q3’18
• Trends also impacted by mix effects (e.g. Sunrise ONE) and promotions
• Blended ARPU up CHF +1.9 YoY to CHF 50.1, driven by TV customer growth
• Landline voice down CHF -2.7 YoY due to migration to flat rate packages and fixed to mobile/OTT migration resulting in reduced voice usage
-1.6
• Blended mobile ARPU stable YoY, as increasing postpaid subscriptions have higher ARPU than decreasing prepaid subscriptions
• Postpaid decrease accelerated to CHF -1.9 YoY (Q2 CHF -0.8 YoY) mainly due to roaming promo; continued 2nd SIM dilution
• Prepaid down CHF -1.1 (Q2: CHF -1.6 YoY): high value prepaid customers migrating to postpaid and shift to OTT
22.422.923.825.025.1
Q3’17 Q3’18
YoY
36.435.835.735.635.5
-1.1 -1.1 -2.1-0.6
Blended mobile ARPU:
+0.5
Blended mobile ARPU (CHF, incl. IFRS 15 1))
Landline voice ARPU (CHF, incl. IFRS 15)
Internet & TV ARPU (CHF, incl. IFRS 15)
+0.1
-4.8
-0.2
-4.6
+0.5
-0.3
YoY
-4.8
+0.2
+0.5
-1.6 -1.1 -1.1 -2.1
32.932.330.531.5
-1.6
Q3’17
33.0
-1.4MTR
Q3’18
+0.1 +0.5
YoY
+0.2
1) Q3’18 ARPUs excl. IFRS 15: Blended mobile CHF 33.0; landline voice CHF 22.4; internet CHF 36.3; TV CHF 25.9
+0.3
-3.9
+0.7
-0.1
-2.7
+0.9Internet ARPU:
26.226.126.426.326.5
Q3’18Q3’17
+1.5 +0.5 +0.3 +0.5 -0.3TV ARPU:

7
Points reached (max 30)
19.7
20.8
Salt
Swisscom
Sunrise 22.5
20.2
21.0
UPC
Swisscom
Sunrise 23.0
21.0
21.0
UPC
Swisscom
Sunrise 23.0• Sunrise was once more rated the best universal provider for mobile, internet, TV and landline voice in residential and SME categories
• Result confirms quality strategy of Sunrise
• Customer survey based test with 9k participants
1) Residential results; Source: BILANZ 09 2018
Again strong score in 2018 BILANZ telecom ranking
Mobile 1)
Internet 1)
TV 1)

B2B transition on-track
8
Major customer wins over past quarters
• Positive momentum confirmed by improving gross profit and EBITDA trend
• Focus on customer acquisition in the enterprise segment and cross selling initiatives at SMEs
• Q3 launch of 5G compatible ‘Indoor Coverage as a Service’ (ICaaS) and ‘Mobile Service Management’ (MSM)
• Recent investments into B2B sales force and support center; further investments expected to support momentum
5%-1%
Q2 Q3’18Q1
-11%
Q4’17
-16%
B2B EBITDA YoY(excl. IFRS 15):
Positive B2B momentum
5%9%
Q4’17
-6%
Q3’18Q2Q1
0%
B2B gross profit YoY(excl. IFRS 15):

Financials
A. Krause (CFO)
9
Financial Overviewexcl. IFRS 15 1)
10
+1.9%
460
Q3’17 Q3’18
469
+1.3%
Q3’18
160
Q3’17
158
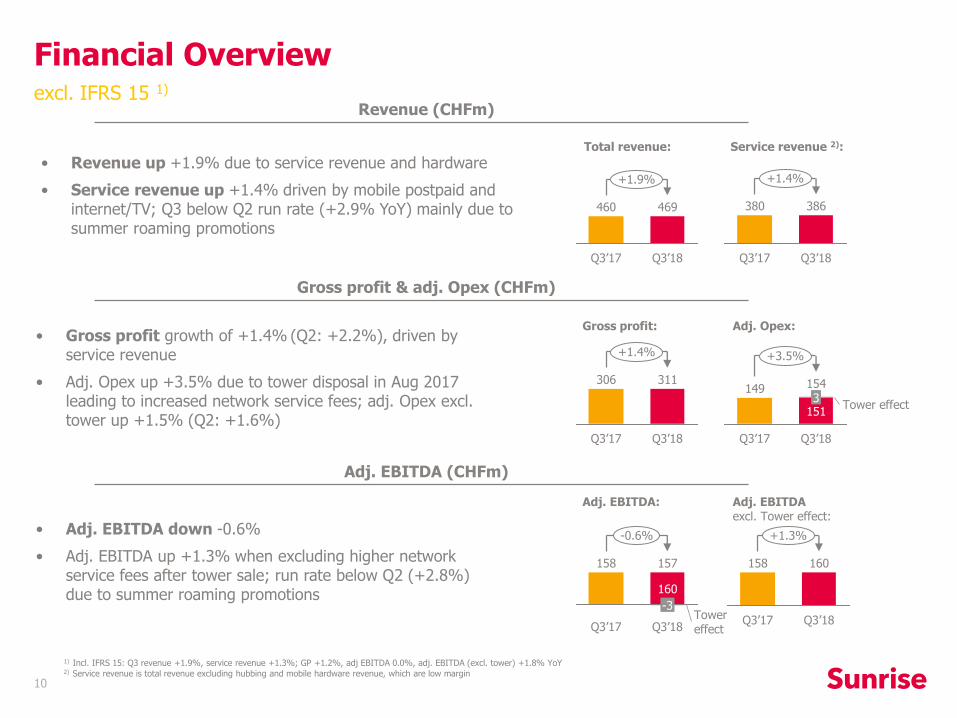
• Revenue up +1.9% due to service revenue and hardware
• Service revenue up +1.4% driven by mobile postpaid and internet/TV; Q3 below Q2 run rate (+2.9% YoY) mainly due to summer roaming promotions
• Adj. EBITDA down -0.6%
• Adj. EBITDA up +1.3% when excluding higher network service fees after tower sale; run rate below Q2 (+2.8%) due to summer roaming promotions
Tower effect
+3.5%
Q3’18
154
1513
Q3’17
149
• Gross profit growth of +1.4% (Q2: +2.2%), driven by service revenue
• Adj. Opex up +3.5% due to tower disposal in Aug 2017 leading to increased network service fees; adj. Opex excl. tower up +1.5% (Q2: +1.6%)
2) Service revenue is total revenue excluding hubbing and mobile hardware revenue, which are low margin
+1.4%
Q3’18
311
Q3’17
306
Gross profit: Adj. Opex:
Total revenue:
+1.4%
Q3’18
386
Q3’17
380
Service revenue 2):
Revenue (CHFm)
Gross profit & adj. Opex (CHFm)
Adj. EBITDA (CHFm)
Adj. EBITDA excl. Tower effect:
Adj. EBITDA:
-0.6%
Tower effectQ3’18
157
160
-3
Q3’17
158
1) Incl. IFRS 15: Q3 revenue +1.9%, service revenue +1.3%; GP +1.2%, adj EBITDA 0.0%, adj. EBITDA (excl. tower) +1.8% YoY

469
9
7
464
11
460
469
Q3’18 Revenue IFRS 15
IFRS 15 0
Q3’18 Revenue w/o IFRS 15
Δ other -2
Δ internet/TV
Δ landline voice -2
Δ mobile prepaid -7
Δ mobile postpaid
Service Revenue
Δ hubbing (low-margin)
-8
Δ mobile hw(low-margin)
Q3’17 Revenue
0%
+1%
+1%
Service revenue growth slowed due to roaming promos
11
• Hubbing: international trading business which is volatile by nature
• Postpaid: Slowdown from CHF +11m YoY in Q2, as strong customer growth was partly offset by lower ARPU due to roaming promotions
• Internet/TV: strong customer growth
• Prepaid: pre- to postpaid migration and shift to OTT; prepaid accounting for ̴ 5% of total revenue
• Landline voice: fixed to mobile substitution, migration to flat rates, and OTT; landline voice accounting for ̴ 7% of total revenue
• Other: includes lower-margin areas such as volatile B2B equipment sales and wholesale
Revenue bridge (CHFm)
• Mobile hardware: depends on handset innovation, launches and pricing; variations across quarters lead to revenue volatility

GP growth partly reinvested into operational momentum
12
+2.2Tower adj.
Tower effect
Q3’18
154
151
3
Q3’17
149
• Adj. Opex up to CHF 154m, partly driven by tower deconsolidation, following disposal in Aug 2017, leading to higher network service fees (CHF 3m)
• Costs excl. tower up to CHF 151m: cost savings reinvested into operational momentum, such as commercial expenses and front line (e.g. shops, B2B staff, B2B support center)
• Continued commercial push expected in Q4
• Gross profit +1.4% in Q3, driven by service revenue growth
• Service gross margin 1) flat: Positive impacts of MTR and utility access deals offset by roaming promotions and revenue mix effects
+4.3
Q3’18
311
Q3’17
306
Service GM 1)80.6%80.6%
1) Service gross margin is calculated as total gross profit divided by service revenue (i.e. revenue excluding low-margin hardware and hubbing revenue)
Gross profit Adjusted Opex
1.4%
2.2%
2.9%
0.3%0.2%
Q3’17 Q3’18
Growth YoY
In CHFm
1.5%1.6%
3.1%2.4%
-0.9%
Q3’17 Q3’18
Growth YoY excl. tower
In CHFm

eFCF with different Capex seasonality, as expected
13
69
eFCF normalised
190
NWCnormalization
20
Capex normalization
eFCF 101
Other financ.
activities(20)
Interest (35)
Tax (47)
Capex (349)
Δ NWC (35)
Reported EBITDA
586 586
(16)
(322)
(48)
(35)
(23)
142
• NWC LTM down due to higher handset prices and settlement of accrued roaming discounts
Q3’18 LTM Q2’18 LTM
Equity Free Cash Flow (CHFm) 1)
Leverage ratio 1)
Net debt/adj. EBITDA
Capex (CHFm)
1) IFRS 15 has no impact on total eFCF as the impact on EBITDA is offset by the impact on NWC; eFCF chart: LTM EBITDA and ∆NWC are based on IFRS 15 for 2018 and are without IFRS 15 for 2017 quarters; Leverage ratio: LTM EBITDA is based on IFRS 15 for 2018 and without IFRS 15 for 2017 quarters; 2017 leverage ratio is pro forma taking into account annualized network service fees related to tower disposal
Strategic investments
Tower disposal
Q3’18
2.08
Q3’17
1.97
Q2’17
2.76
201 224
4644
454139
Q3’18 LTM
349
Q2’18 LTM
32231
Infrastructure & Δ Capex payables
Innovation & Development
Customer growth
Landline access
2) CHF 30m one-off Capex after tower disposal as communicated on 24 May 2017
• Capex driven by different seasonality than last year; expect YoY decrease in Q4 in-line with guidance
• Other includes installment of Swisscom access deal
• Capex norm.: CHF 30m one-off in Q4’17 2); landline access
• NWC norm.: higher hand-set prices and settlement of accrued roaming discounts
61
20
223

14
O. SwanteeCEO
Conclusion

Customer interface
Investing into 3 strategic growth priorities
15
• Sunrise amongst first European telcos offering mobile services on new Apple and Samsung Galaxy Watch; Sunrise TV remote control now also via Apple Watch
• Internet tariffs with ‘more for more’ in Q3’18; reduced to one ethnic mobile brand (‘Lebara’); introduced 2 new ‘Yallo’ high-end tariffs
• B2B with launch of ‘Mobile Service Management’ (MSM) and 5G compatible ‘Indoor Coverage as a Service’ (ICaaS); Q3 customer wins include Canton Luzern and Edelweiss Air
• Outstanding mobile network with leading dropped call ratios, 28Mbit/s average experienced download speed, and 99.9%/95.8% LTE population/geographic coverage covering 68% YoY data growth
• First 5G antenna started live operations in mid 2018; second 5G network planned in Laax as per end of Nov; spectrum auction in Jan 2019
• Landline access via FTTH, xDSL, and MBB
• No. 1 of ‘large providers’ in BILANZ residential category ‘Support’
• Leading ‘connect’ mobile shop test in DACH region 3); ongoing shop refurbishment and opening of new shop in Q3; pilot project with shop-in-shop and pop-up store concepts
• Increasing online distribution channel share and digital service transactions
Networkquality
Innovative converged products
3) Source: Connect 07 2018
Leading European network quality 1)
Drive convergence
Sunrise
1) Source: P3 as per 24 November 2017; see FY’17 investor presentation for more details
2) Source: BILANZ 09 2018; referring to residential results; average rating across Mobile Telephony, TV, and Internet Service Provider except for Salt which is Mobile Telephony only in ranking
‘Support’ category in BILANZ ranking 2)
4,84,4
Swiss-com
Salt
3,9
UPC
4,3
Sunrise

• Equity FCF as expected; reduced leverage after tower disposal gives flexibility for strategic investments
• Adj. EBITDA (excl. tower effect) up with GP growth partly reinvested into operational momentum; Q3 growth run rate below Q2 due to summer roaming promo
• Service Revenue growth driven by customer momentum
Q3 conclusionGrowing GP and customer base – confirming guidance
16
• Continued strong subscriber growth in mobile postpaid, internet and TV; supported by B2B
Customers
Revenue
Profitability
Cash Flow
• Revenue: CHF 1,830 - 1,870m
• Adj. EBITDA: CHF 595 - 605m
• Capex 1): CHF 283 - 323m
• Dividend: CHF 4.15 - 4.25
Guidance is incl. IFRS 15 impact 2)
FY’18 guidance reiterated
1) Includes CHF 56m upfront investments for fibre access at SFN, IWB and SIG
2) See IFRS 15 update in appendix

Q & A
17

Appendix
18
IFRS 15 update
19
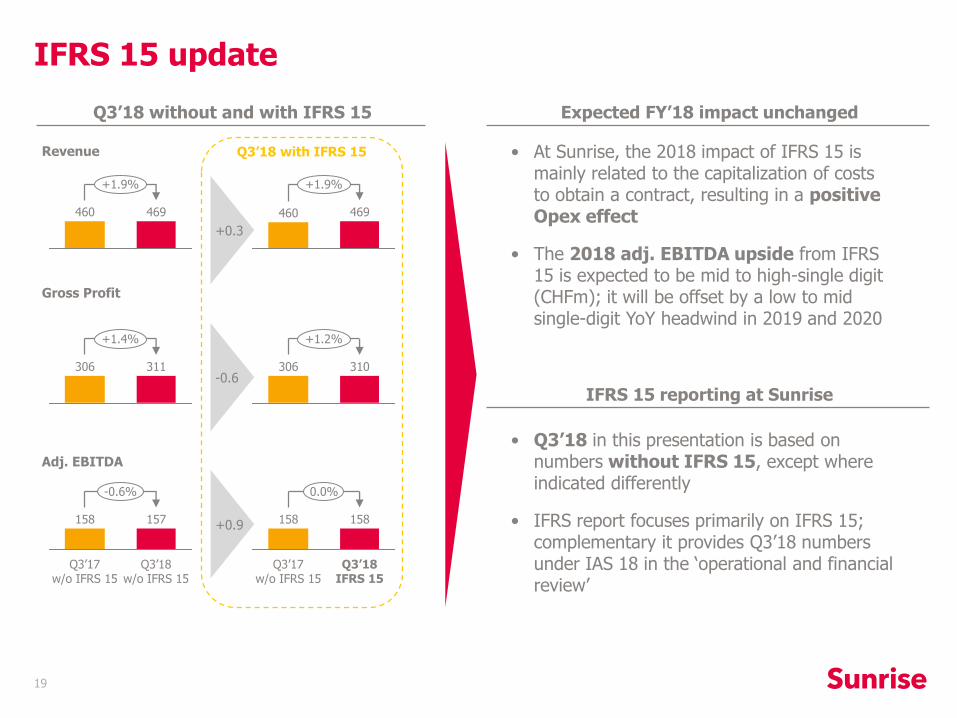
IFRS 15 reporting at Sunrise
• Q3’18 in this presentation is based on numbers without IFRS 15, except where indicated differently
• IFRS report focuses primarily on IFRS 15; complementary it provides Q3’18 numbers under IAS 18 in the ‘operational and financial review’
+1.9%
469460
Q3’18 without and with IFRS 15
+1.9%
469460
Revenue
Adj. EBITDA
-0.6%
Q3’18w/o IFRS 15
157
Q3’17w/o IFRS 15
158
0.0%
Q3’18IFRS 15
158
Q3’17w/o IFRS 15
158
+1.4%
311306
Gross Profit
Q3’18 with IFRS 15
+1.2%
310306
+0.3
+0.9
-0.6
• At Sunrise, the 2018 impact of IFRS 15 is mainly related to the capitalization of costs to obtain a contract, resulting in a positive Opex effect
• The 2018 adj. EBITDA upside from IFRS 15 is expected to be mid to high-single digit (CHFm); it will be offset by a low to mid single-digit YoY headwind in 2019 and 2020
Expected FY’18 impact unchanged

Bridge adjusted to reported EBITDA
20
154
157
Reported EBITDA Q3’18
Non-recurring / non-operating events
-3
Prior year events 0
Share based paymentexpenses
0
Adj. EBITDA Q3’18• Share-based payment provisions for multi-year
compensation plans
• Prior year related events mainly include adjustments of provisions/accruals based on newly available information
• Non-recurring / non-operating events mainly represent costs for one-time expenses, e.g. advisory fees related to spectrum auction preparation, expenses related to head office relocation, and costs for early employee contract terminations
Q3’18 EBITDA bridge
21
17
23
Mobile
Internet
TV
Landlinevoice
Sunrise Swisscom UPC
3
5
Quality
Innovation
PriceFlexibility
Support
Sunrise Swisscom Salt
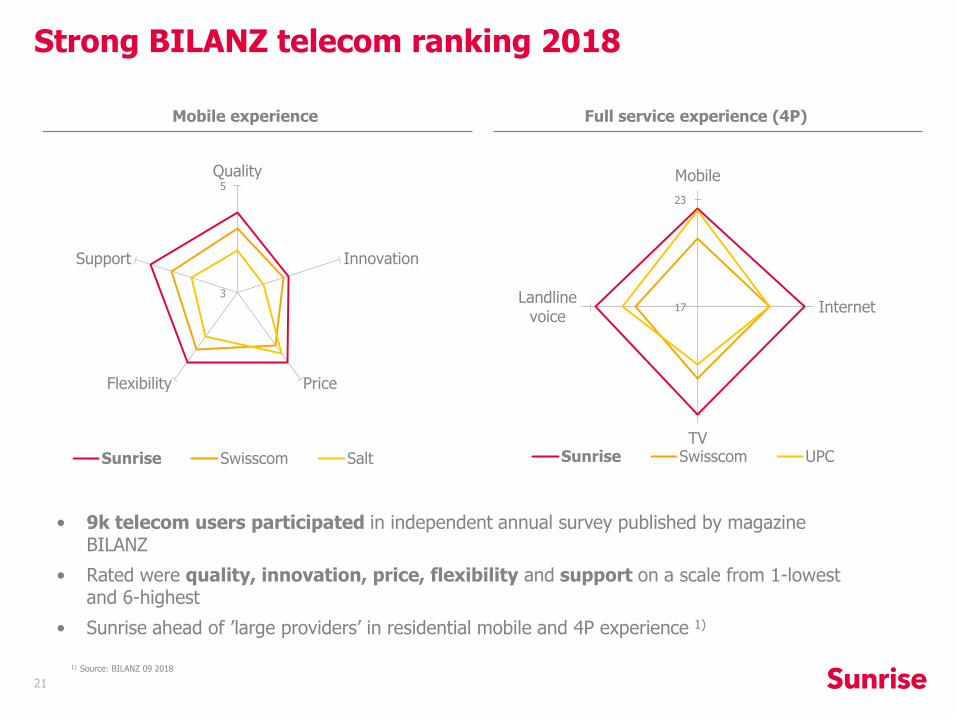
Mobile experience Full service experience (4P)
Strong BILANZ telecom ranking 2018
1) Source: BILANZ 09 2018
• 9k telecom users participated in independent annual survey published by magazine BILANZ
• Rated were quality, innovation, price, flexibility and support on a scale from 1-lowest and 6-highest
• Sunrise ahead of ’large providers’ in residential mobile and 4P experience 1)

Income Statement
22
P&L (CHFm)Q3 2018
incl. IFRS 15
Q3 2018
excl. IFRS 15
Q3 2017
excl. IFRS 15
Mobile services 321 321 309
thereof mobile postpaid 208 208 201thereof mobile prepaid 25 25 31thereof hardware 65 65 53
Landline services 77 77 89
thereof landline voice 31 31 33
thereof hubbing 19 19 27
Landline internet & TV 72 71 63
Total revenue 469 469 460% YoY growth 1.9% 1.9% (3.7%)
Service revenue (total excl. hubbing & hardware) 385 386 380% YoY growth 1.3% 1.4% (0.9%)
COGS (159) (158) (154)
Gross profit 310 311 306% YoY growth 1.2% 1.4% 0.2%
% margin 66.1% 66.2% 66.6%
Opex (156) (157) (152)
EBITDA 154 154 154% YoY growth 0.2% (0.3%) (1.4%)
Adjusted EBITDA 158 157 158% YoY growth (0.0%) (0.6%) -2.5%
% margin 33.6% 33.5% 34.3%
% margin (excluding hubbing revenues) 35.1% 34.9% 36.4%
Depreciation and amortization (106) (106) (106)% YoY growth (0.1%) (0.1%) 6.2%
Operating income 49 48 49
Net financial items (9) (9) (18)
Gain on disposal of subsidiary - - 420
Income taxes (8) (8) (9)
Net income 32 31 442Thereof (before tax impact):
PPA effect (32) (32) (31)
Additional information:
Net income excl. gain on disposal of subsidiary 32 31 22
EPS excl. gain on disposal of subsidiary 0.70 0.70 0.49
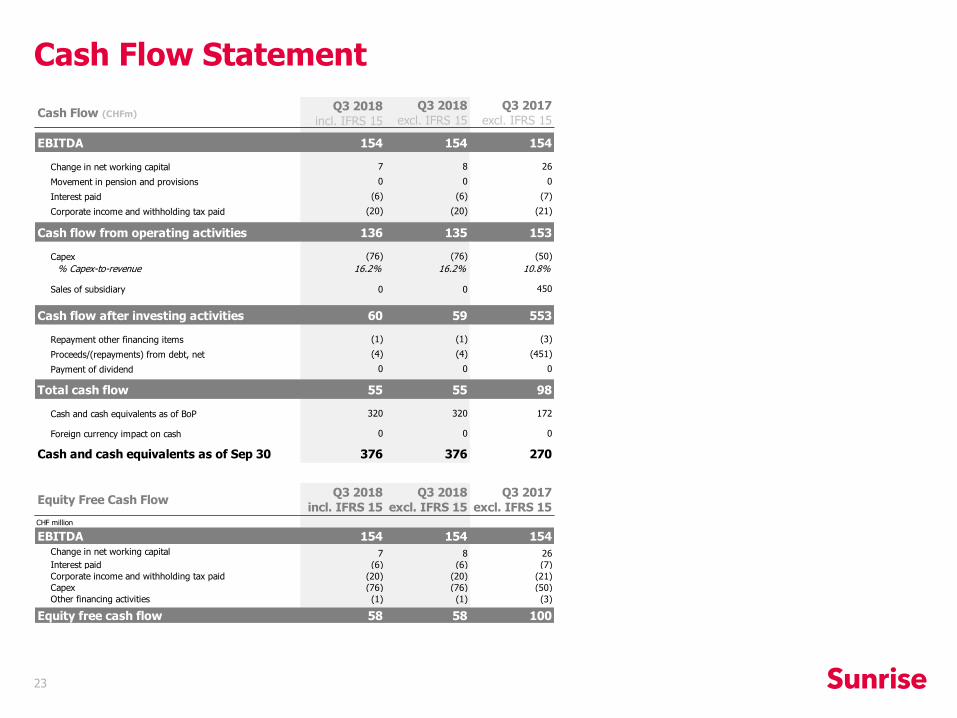
Cash Flow (CHFm)Q3 2018
incl. IFRS 15
Q3 2018
excl. IFRS 15
Q3 2017
excl. IFRS 15
EBITDA 154 154 154
Change in net working capital 7 8 26
Movement in pension and provisions 0 0 0
Interest paid (6) (6) (7)
Corporate income and withholding tax paid (20) (20) (21)
Cash flow from operating activities 136 135 153
Capex (76) (76) (50)
% Capex-to-revenue 16.2% 16.2% 10.8%
Sales of subsidiary 0 0 450
Cash flow after investing activities 60 59 553
Repayment other financing items (1) (1) (3)
Proceeds/(repayments) from debt, net (4) (4) (451)
Payment of dividend 0 0 0
Total cash flow 55 55 98
Cash and cash equivalents as of BoP 320 320 172
Foreign currency impact on cash 0 0 0
Cash and cash equivalents as of Sep 30 376 376 270
Equity Free Cash FlowQ3 2018
incl. IFRS 15
Q3 2018
excl. IFRS 15
Q3 2017
excl. IFRS 15CHF million
EBITDA 154 154 154Change in net working capital 7 8 26
Interest paid (6) (6) (7)
Corporate income and withholding tax paid (20) (20) (21)
Capex (76) (76) (50)
Other financing activities (1) (1) (3)
Equity free cash flow 58 58 100
Cash Flow Statement
23

Net debt (CHFm)September 30,
2018
June 30,
2018
December 31,
2017
September 30,
2017
Senior Secured Notes issued February 2015 0 0 500 500
Term loan B 1'410 1'410 910 910
Senior Secured Notes issued June 2018 200 200 0 0
Total cash-pay borrowings 1'610 1'610 1'410 1'410
Financial lease 5 7 9 11
Total debt 1'615 1'617 1'419 1'421
Cash & Cash Equivalents (376) (320) (272) (270)
Net debt 1'239 1'297 1'147 1'151
Net debt / pro forma adj. EBITDA 1) 2.1x 2.2x 2.0x 2.0x
Leverage ratio
24
1) Based on pro forma view until June 30 2018, taking into account annualized network service fees related to tower disposal

25

26
Uwe Schiller
Stephan Gick
www.sunrise.ch/ir
+41 58 777 96 86
Contact
Information
Investor Relations

Disclaimer
27
This document and any materials distributed in connection herewith (including any oral statements) (together, the “Presentation”) do not constitute or form a part of, and should not be construed as, an offer for sale or subscription of or solicitation of any offer to purchase or subscribe for any securities, and neither this Presentation nor anything contained herein shall form the basis of, or be relied upon in connection with, or act as an inducement to enter into, any contract or commitment whatsoever.
The information contained in this Presentation has not been independently verified and no representation or warranty, express or implied, is made as to, and no reliance should be placed on, the fairness, accuracy, completeness, reasonableness or correctness of the information or opinions contained herein. None of Sunrise Communications Group AG, its subsidiaries or any of their respective employees, advisers, representatives or affiliates shall have any liability whatsoever (in negligence or otherwise) for any loss howsoever arising from any use of this document or its contents or otherwise arising in connection with this Presentation. The information contained in this Presentation is provided as at the date of this Presentation and is subject to change without notice.
Statements made in this Presentation may include forward-looking statements. These statements may be identified by the fact that they use words such as “anticipate”, “estimate”, “should”, “expect”, “guidance”, “project”, “intend”, “plan”, “believe”, and/or other words and terms of similar meaning in connection with, among other things, any discussion of results of operations, financial condition, liquidity, prospects, growth, strategies or developments in the industry in which we operate. Such statements are based on management’s current intentions, expectations or beliefs and involve inherent risks, assumptions and uncertainties, including factors that could delay, divert or change any of them. Forward-looking statements contained in this Presentation regarding trends or current activities should not be taken as a representation that such trends or activities will continue in the future. Actual outcomes, results and other future events may differ materially from those expressed or implied by the statements contained herein. Such differences may adversely affect the outcome and financial effects of the plans and events described herein and may result from, among other things, changes in economic, business, competitive, technological, strategic or regulatory factors and other factors affecting the business and operations of the company. Neither Sunrise Communications Group AG nor any of its affiliates is under any obligation, and each such entity expressly disclaims any such obligation, to update, revise or amend any forward-looking statements, whether as a result of new information, future events or otherwise. You should not place undue reliance on any such forward-looking statements, which speak only as of the date of this Presentation.
It should be noted that past performance is not a guide to future performance. Please also note that interim results are not necessarily indicative of full-year results.