Embed Size (px)
Citation preview
1(a) (i)
(In Singapore dollars)
Oct-Dec
2014
Oct-Dec
2013 + / ( - )
Jan-Dec
2014
Jan-Dec
2013 + / ( - )
$'000 $'000 % $'000 $'000 %
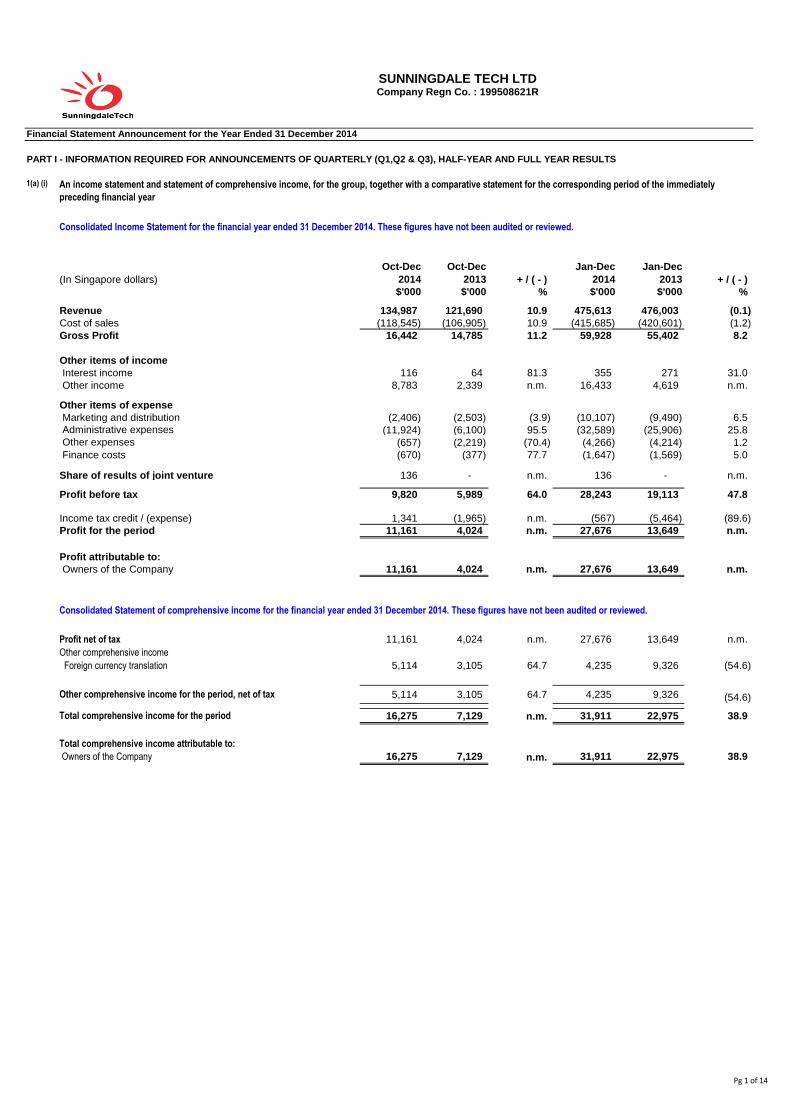
Revenue 134,987 121,690 10.9 475,613 476,003 (0.1)
Cost of sales (118,545) (106,905) 10.9 (415,685) (420,601) (1.2)
Gross Profit 16,442 14,785 11.2 59,928 55,402 8.2
Other items of income
Interest income 116 64 81.3 355 271 31.0
Other income 8,783 2,339 n.m. 16,433 4,619 n.m.
Other items of expense
Marketing and distribution (2,406) (2,503) (3.9) (10,107) (9,490) 6.5
Administrative expenses (11,924) (6,100) 95.5 (32,589) (25,906) 25.8
Other expenses (657) (2,219) (70.4) (4,266) (4,214) 1.2
Finance costs (670) (377) 77.7 (1,647) (1,569) 5.0
Share of results of joint venture 136 - n.m. 136 - n.m.
9,820 5,989 64.0 28,243 19,113 47.8
Income tax credit / (expense) 1,341 (1,965) n.m. (567) (5,464) (89.6)
11,161 4,024 n.m. 27,676 13,649 n.m.
Profit attributable to:
Owners of the Company 11,161 4,024 n.m. 27,676 13,649 n.m.
Profit net of tax 11,161 4,024 n.m. 27,676 13,649 n.m.
Foreign currency translation 5,114 3,105 64.7 4,235 9,326 (54.6)
5,114 3,105 64.7 4,235 9,326 (54.6)
16,275 7,129 n.m. 31,911 22,975 38.9
Total comprehensive income attributable to:
Owners of the Company 16,275 7,129 n.m. 31,911 22,975 38.9
SUNNINGDALE TECH LTDCompany Regn Co. : 199508621R
Financial Statement Announcement for the Year Ended 31 December 2014
PART I - INFORMATION REQUIRED FOR ANNOUNCEMENTS OF QUARTERLY (Q1,Q2 & Q3), HALF-YEAR AND FULL YEAR RESULTS
An income statement and statement of comprehensive income, for the group, together with a comparative statement for the corresponding period of the immediately
preceding financial year
Consolidated Income Statement for the financial year ended 31 December 2014. These figures have not been audited or reviewed.
Profit before tax
Profit for the period
Total comprehensive income for the period
Consolidated Statement of comprehensive income for the financial year ended 31 December 2014. These figures have not been audited or reviewed.
Other comprehensive income
Other comprehensive income for the period, net of tax
Pg 1 of 14
1(a)(ii)
Oct-Dec
2014
Oct-Dec
2013 + / ( - )
Jan-Dec
2014
Jan-Dec
2013 + / ( - )
$'000 $'000 % $'000 $'000 %
(6,425) (6,375) 0.8 (24,080) (25,882) (7.0)
(17) (1,407) n.m. 228 (1,465) n.m.
(140) (136) 2.9 (322) (191) 68.6
- - n.m. 5,227 - n.m.
(81) 50 n.m. (19) 49 n.m.
(25) (304) n.m. 149 (295) n.m.
(31) 250 n.m. (186) 60 n.m.
- 1,363 n.m. - 1,363 n.m.
(111) (397) (72.0) (447) (1,051) (57.5)
Impairment loss on club membership (15) - n.m. (15) - n.m.
Negative goodwill (Note 1)
4,523 - n.m. 4,523 - n.m.
Foreign exchange gain 3,292 341 n.m. 1,427 316 n.m.
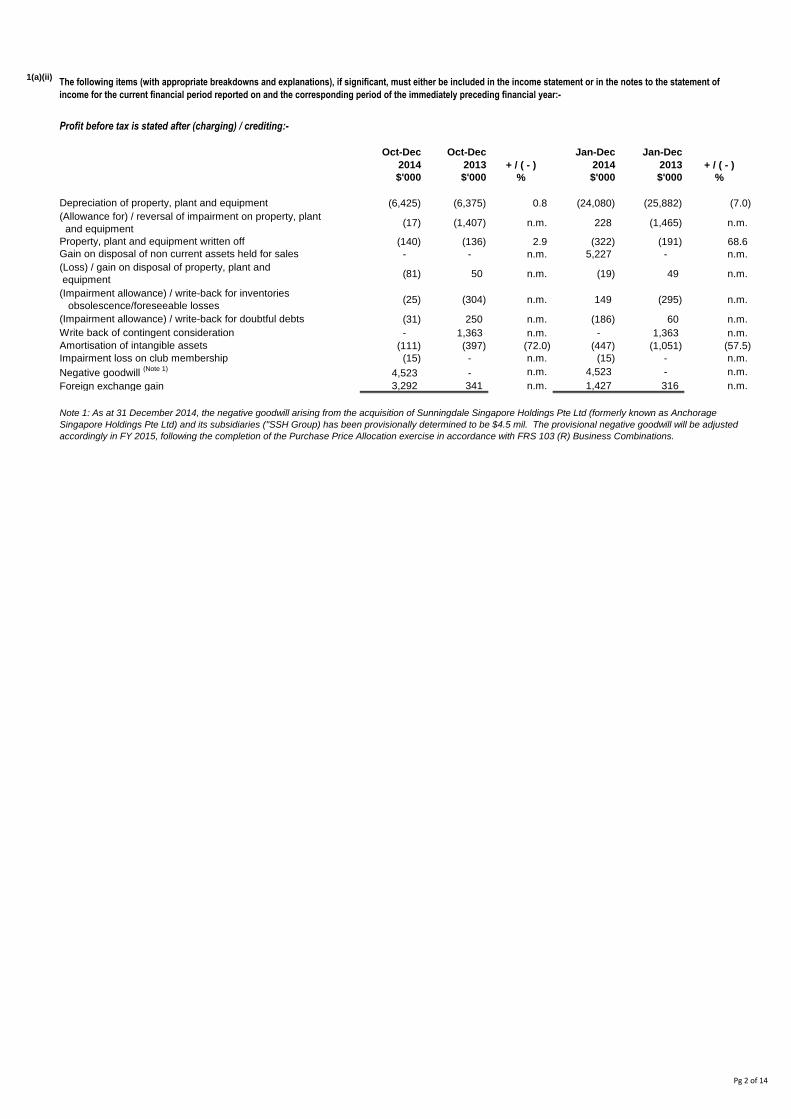
Note 1: As at 31 December 2014, the negative goodwill arising from the acquisition of Sunningdale Singapore Holdings Pte Ltd (formerly known as Anchorage
Singapore Holdings Pte Ltd) and its subsidiaries ("SSH Group) has been provisionally determined to be $4.5 mil. The provisional negative goodwill will be adjusted
accordingly in FY 2015, following the completion of the Purchase Price Allocation exercise in accordance with FRS 103 (R) Business Combinations.
The following items (with appropriate breakdowns and explanations), if significant, must either be included in the income statement or in the notes to the statement of
income for the current financial period reported on and the corresponding period of the immediately preceding financial year:-
Profit before tax is stated after (charging) / crediting:-
Depreciation of property, plant and equipment
(Impairment allowance) / write-back for doubtful debts
(Impairment allowance) / write-back for inventories
obsolescence/foreseeable losses
(Allowance for) / reversal of impairment on property, plant
and equipment
Write back of contingent consideration
Gain on disposal of non current assets held for sales
Amortisation of intangible assets
Property, plant and equipment written off
(Loss) / gain on disposal of property, plant and
equipment
Pg 2 of 14
1(b)(i)
(In Singapore dollars)
As at 31.12.14 31.12.13 + / ( - ) 31.12.14 31.12.13 + / ( - )
$'000 $'000 % $'000 $'000 %
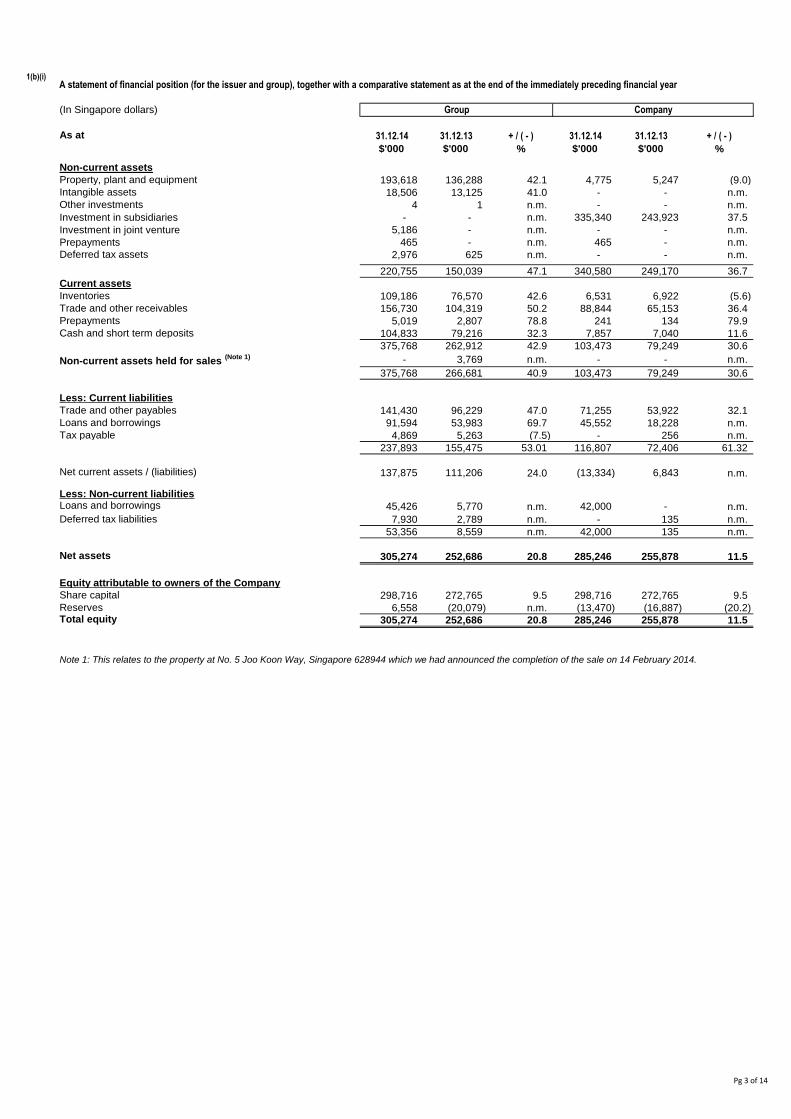
Non-current assets
Property, plant and equipment 193,618 136,288 42.1 4,775 5,247 (9.0)
Intangible assets 18,506 13,125 41.0 - - n.m.
Other investments 4 1 n.m. - - n.m.
Investment in subsidiaries - - n.m. 335,340 243,923 37.5
Investment in joint venture 5,186 - n.m. - - n.m.
Prepayments 465 - n.m. 465 - n.m.
Deferred tax assets 2,976 625 n.m. - - n.m.
220,755 150,039 47.1 340,580 249,170 36.7
Current assets
Inventories 109,186 76,570 42.6 6,531 6,922 (5.6)
Trade and other receivables 156,730 104,319 50.2 88,844 65,153 36.4
Prepayments 5,019 2,807 78.8 241 134 79.9
Cash and short term deposits 104,833 79,216 32.3 7,857 7,040 11.6
375,768 262,912 42.9 103,473 79,249 30.6
Non-current assets held for sales (Note 1) - 3,769 n.m. - - n.m.
375,768 266,681 40.9 103,473 79,249 30.6
Less: Current liabilities
Trade and other payables 141,430 96,229 47.0 71,255 53,922 32.1
Loans and borrowings 91,594 53,983 69.7 45,552 18,228 n.m.
Tax payable 4,869 5,263 (7.5) - 256 n.m.
237,893 155,475 53.01 116,807 72,406 61.32
Net current assets / (liabilities) 137,875 111,206 24.0 (13,334) 6,843 n.m.
Less: Non-current liabilitiesLoans and borrowings 45,426 5,770 n.m. 42,000 - n.m.
Deferred tax liabilities 7,930 2,789 n.m. - 135 n.m.
53,356 8,559 n.m. 42,000 135 n.m.
Net assets 305,274 252,686 20.8 285,246 255,878 11.5
Equity attributable to owners of the Company
Share capital 298,716 272,765 9.5 298,716 272,765 9.5
Reserves 6,558 (20,079) n.m. (13,470) (16,887) (20.2) Total equity 305,274 252,686 20.8 285,246 255,878 11.5
Note 1: This relates to the property at No. 5 Joo Koon Way, Singapore 628944 which we had announced the completion of the sale on 14 February 2014.
A statement of financial position (for the issuer and group), together with a comparative statement as at the end of the immediately preceding financial year
Group Company
Pg 3 of 14
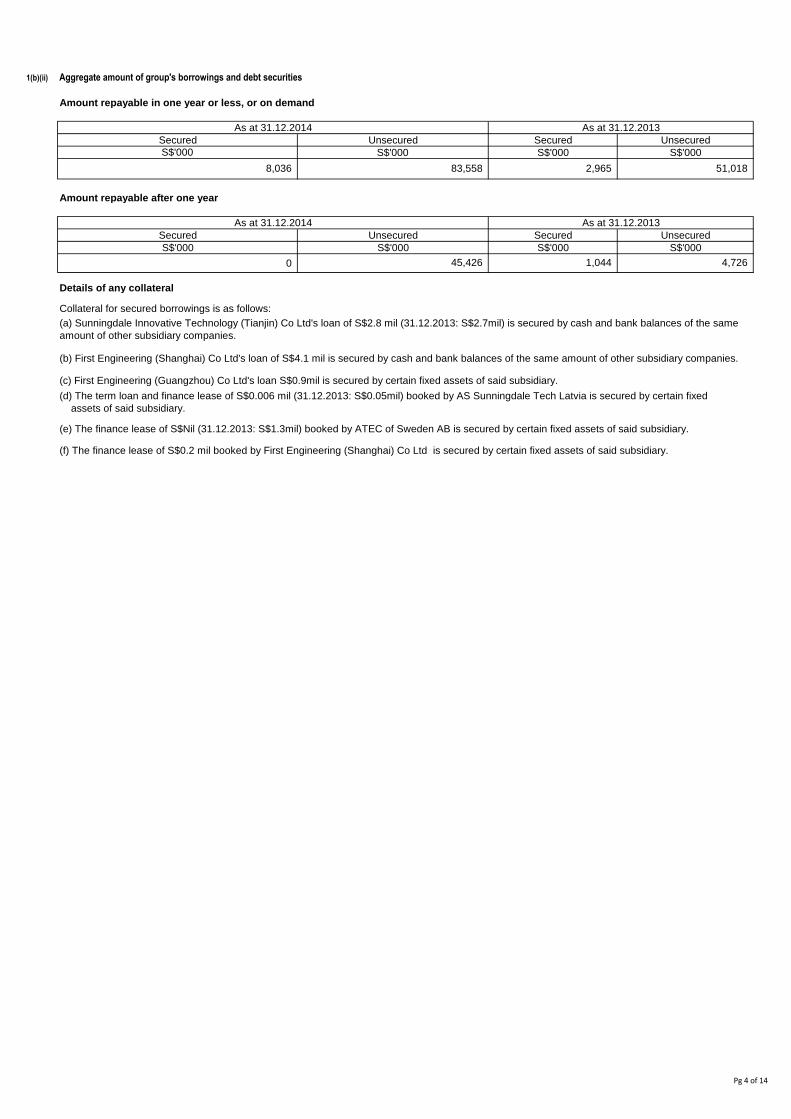
1(b)(ii) Aggregate amount of group's borrowings and debt securities
Amount repayable in one year or less, or on demand
Secured
S$'000
Amount repayable after one year
Secured
S$'000
0
Details of any collateral
(c) First Engineering (Guangzhou) Co Ltd's loan S$0.9mil is secured by certain fixed assets of said subsidiary.
S$'000
2,965 51,018
Unsecured Secured
Collateral for secured borrowings is as follows:
(a) Sunningdale Innovative Technology (Tianjin) Co Ltd's loan of S$2.8 mil (31.12.2013: S$2.7mil) is secured by cash and bank balances of the same
amount of other subsidiary companies.
(d) The term loan and finance lease of S$0.006 mil (31.12.2013: S$0.05mil) booked by AS Sunningdale Tech Latvia is secured by certain fixed
assets of said subsidiary.
(e) The finance lease of S$Nil (31.12.2013: S$1.3mil) booked by ATEC of Sweden AB is secured by certain fixed assets of said subsidiary.
(f) The finance lease of S$0.2 mil booked by First Engineering (Shanghai) Co Ltd is secured by certain fixed assets of said subsidiary.
S$'000 S$'000
1,044 4,726
S$'000
45,426
(b) First Engineering (Shanghai) Co Ltd's loan of S$4.1 mil is secured by cash and bank balances of the same amount of other subsidiary companies.
As at 31.12.2013
8,036
S$'000
83,558
As at 31.12.2014
Unsecured
As at 31.12.2014 As at 31.12.2013
Secured Unsecured
Unsecured
S$'000
Pg 4 of 14
(In Singapore dollars)
Oct-Dec
2014
Oct-Dec
2013
Jan-Dec
2014
Jan-Dec
2013 $'000 $'000 $'000 $'000
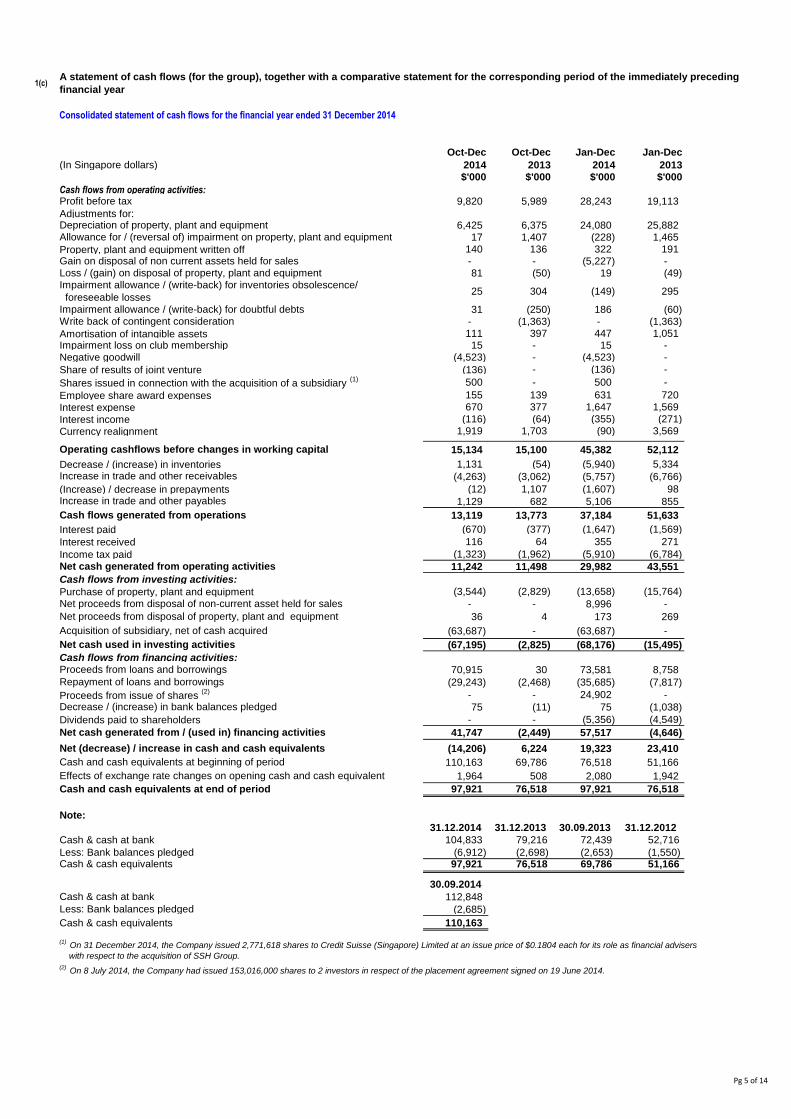
Cash flows from operating activities:9,820 5,989 28,243 19,113
Adjustments for:6,425 6,375 24,080 25,882
17 1,407 (228) 1,465
Property, plant and equipment written off 140 136 322 191 - - (5,227) - 81 (50) 19 (49)
25 304 (149) 295
31 (250) 186 (60) - (1,363) - (1,363)
Amortisation of intangible assets 111 397 447 1,051 Impairment loss on club membership 15 - 15 - Negative goodwill (4,523) - (4,523) -
Share of results of joint venture (136) - (136) -
500 - 500 -
Employee share award expenses 155 139 631 720
Interest expense 670 377 1,647 1,569
Interest income (116) (64) (355) (271)
Currency realignment 1,919 1,703 (90) 3,569
15,134 15,100 45,382 52,112
Decrease / (increase) in inventories 1,131 (54) (5,940) 5,334
(4,263) (3,062) (5,757) (6,766)
(Increase) / decrease in prepayments (12) 1,107 (1,607) 98
1,129 682 5,106 855
13,119 13,773 37,184 51,633
Interest paid (670) (377) (1,647) (1,569)
Interest received 116 64 355 271
Income tax paid (1,323) (1,962) (5,910) (6,784)
11,242 11,498 29,982 43,551
Cash flows from investing activities:
Purchase of property, plant and equipment (3,544) (2,829) (13,658) (15,764)
- - 8,996 -
36 4 173 269
(63,687) - (63,687) -
(67,195) (2,825) (68,176) (15,495)
Cash flows from financing activities:
70,915 30 73,581 8,758
(29,243) (2,468) (35,685) (7,817)
- - 24,902 -
75 (11) 75 (1,038)
Dividends paid to shareholders - - (5,356) (4,549)
41,747 (2,449) 57,517 (4,646)
(14,206) 6,224 19,323 23,410
110,163 69,786 76,518 51,166
1,964 508 2,080 1,942
97,921 76,518 97,921 76,518
Note:
31.12.2014 31.12.2013 30.09.2013 31.12.2012
Cash & cash at bank 104,833 79,216 72,439 52,716
Less: Bank balances pledged (6,912) (2,698) (2,653) (1,550)Cash & cash equivalents 97,921 76,518 69,786 51,166
30.09.2014
Cash & cash at bank 112,848
Less: Bank balances pledged (2,685)
Cash & cash equivalents 110,163
Impairment allowance / (write-back) for inventories obsolescence/
foreseeable lossesImpairment allowance / (write-back) for doubtful debts
Gain on disposal of non current assets held for salesLoss / (gain) on disposal of property, plant and equipment
Proceeds from loans and borrowings
Repayment of loans and borrowings
Cash and cash equivalents at end of period
(1) On 31 December 2014, the Company issued 2,771,618 shares to Credit Suisse (Singapore) Limited at an issue price of $0.1804 each for its role as financial advisers
with respect to the acquisition of SSH Group.
(2) On 8 July 2014, the Company had issued 153,016,000 shares to 2 investors in respect of the placement agreement signed on 19 June 2014.
Net cash generated from operating activities
Net cash used in investing activities
Proceeds from issue of shares (2)
Allowance for / (reversal of) impairment on property, plant and equipment
1(c) A statement of cash flows (for the group), together with a comparative statement for the corresponding period of the immediately preceding
financial year
Consolidated statement of cash flows for the financial year ended 31 December 2014
Operating cashflows before changes in working capital
Cash flows generated from operations
Depreciation of property, plant and equipment
Shares issued in connection with the acquisition of a subsidiary (1)
Acquisition of subsidiary, net of cash acquired
Net cash generated from / (used in) financing activities
Net (decrease) / increase in cash and cash equivalents
Effects of exchange rate changes on opening cash and cash equivalent
Cash and cash equivalents at beginning of period
Decrease / (increase) in bank balances pledged
Increase in trade and other receivables
Increase in trade and other payables
Profit before tax
Net proceeds from disposal of non-current asset held for sales
Net proceeds from disposal of property, plant and equipment
Write back of contingent consideration
Pg 5 of 14

1(d)(i)
(In Singapore dollars)
Group
Share Capital
Retained
Earnings
Foreign
Currency
Translation
Reserve
Other
Reserve Total
$'000 $'000 $'000 $'000 $'000
Balance at 01.01.2013 271,529 (29,350) (16,835) 8,196 233,540
- 2,313 - - 2,313
Other comprehensive income
Foreign currency translation - - 5,128 138 5,266
- - - 209 209
271,529 (27,037) (11,707) 8,543 241,328
Balance at 31.03.2013 271,529 (27,037) (11,707) 8,543 241,328
Profit for the period - 3,516 - - 3,516
Other comprehensive income
Foreign currency translation - - 2,920 156 3,076
Contributions by and distributions to owners
Grant of equity-settled share awards to employees - - - 186 186
Dividends paid - (4,549) - - (4,549)
271,529 (28,070) (8,787) 8,885 243,557
Balance at 30.06.2013 271,529 (28,070) (8,787) 8,885 243,557
Profit for the period - 3,796 - - 3,796
Other comprehensive income
Foreign currency translation - - (2,088) (33) (2,121)
Contributions by and distributions to owners
Grant of equity-settled share awards to employees - - - 186 186
Transfer from revaluation reserve - 453 - (453) -
271,529 (23,821) (10,875) 8,585 245,418
Balance at 30.09.2013 271,529 (23,821) (10,875) 8,585 245,418
Profit for the period - 4,024 - - 4,024
Other comprehensive income
Foreign currency translation - - 3,021 84 3,105
Contributions by and distributions to owners
Grant of equity-settled share awards to employees - - - 139 139
Issue of share under share awards 1,236 - - (1,236) -
Transfer to revaluation reserve - (453) - 453 -
Transfer to statutory reserve - (708) - 708 -
272,765 (20,958) (7,854) 8,733 252,686
Balance at 31.12.2013 272,765 (20,958) (7,854) 8,733 252,686
Grant of equity-settled share awards to employees
Total transactions with owners in their capacity as owners
Total transactions with owners in their capacity as owners
Total transactions with owners in their capacity as owners
Total transactions with owners in their capacity as owners
Profit for the period
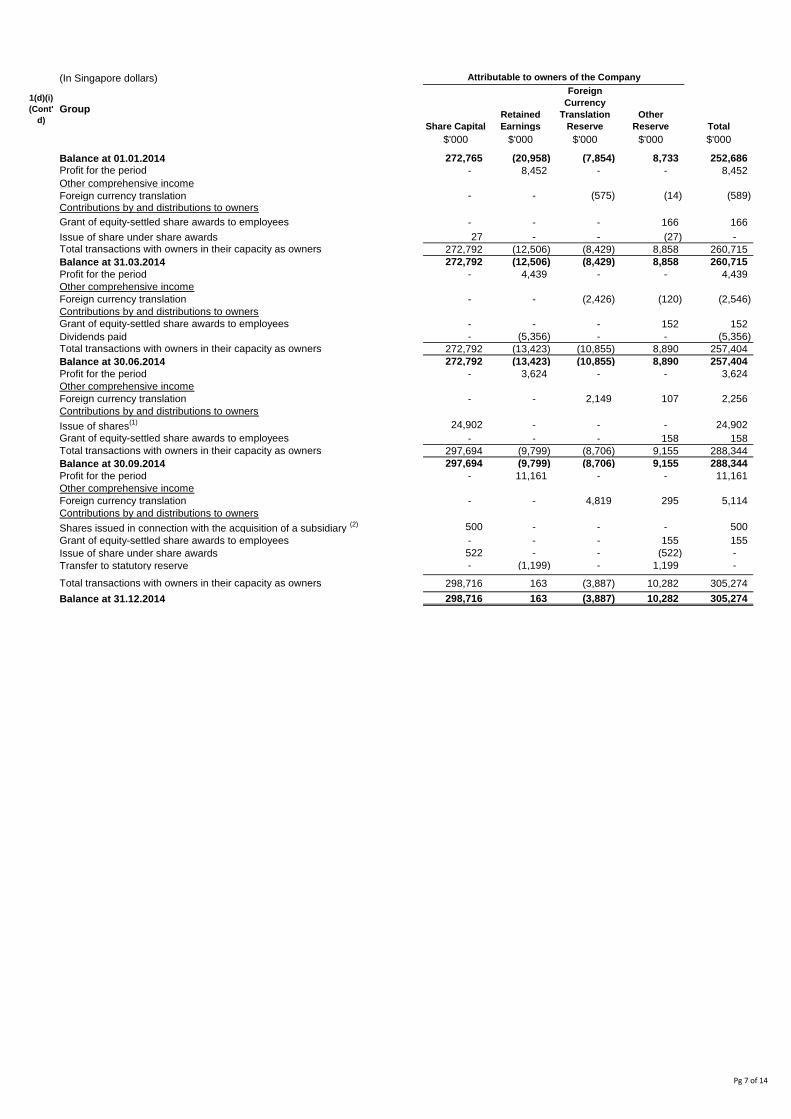
A statement (for the issuer and group) showing either (i) all changes in equity or (ii) changes in equity other than those arising from capitalisation issues and distributions to
shareholders, together with a comparative statement for the corresponding period of the immediately preceding financial year
Statement of Changes in Equity for the financial year ended 31 December 2014
Attributable to owners of the Company
Contributions by and distributions to owners
Pg 6 of 14
(In Singapore dollars)
1(d)(i)
(Cont'
d)
Group
Share Capital
Retained
Earnings
Foreign
Currency
Translation
Reserve
Other
Reserve Total
$'000 $'000 $'000 $'000 $'000
Balance at 01.01.2014 272,765 (20,958) (7,854) 8,733 252,686
- 8,452 - - 8,452
Other comprehensive income
Foreign currency translation - - (575) (14) (589)
- - - 166 166
Issue of share under share awards 27 - - (27) -
272,792 (12,506) (8,429) 8,858 260,715
Balance at 31.03.2014 272,792 (12,506) (8,429) 8,858 260,715
Profit for the period - 4,439 - - 4,439
Other comprehensive income
Foreign currency translation - - (2,426) (120) (2,546)
Contributions by and distributions to owners
- - - 152 152
Dividends paid - (5,356) - - (5,356)
272,792 (13,423) (10,855) 8,890 257,404
Balance at 30.06.2014 272,792 (13,423) (10,855) 8,890 257,404
Profit for the period - 3,624 - - 3,624
Other comprehensive income
Foreign currency translation - - 2,149 107 2,256
Contributions by and distributions to owners
Issue of shares(1) 24,902 - - - 24,902
- - - 158 158
297,694 (9,799) (8,706) 9,155 288,344
Balance at 30.09.2014 297,694 (9,799) (8,706) 9,155 288,344
Profit for the period - 11,161 - - 11,161
Other comprehensive income
Foreign currency translation - - 4,819 295 5,114
Contributions by and distributions to owners
Shares issued in connection with the acquisition of a subsidiary (2) 500 - - - 500
Grant of equity-settled share awards to employees - - - 155 155
Issue of share under share awards 522 - - (522) -
Transfer to statutory reserve - (1,199) - 1,199 -
298,716 163 (3,887) 10,282 305,274
Balance at 31.12.2014 298,716 163 (3,887) 10,282 305,274
Grant of equity-settled share awards to employees
Total transactions with owners in their capacity as owners
Total transactions with owners in their capacity as owners
Total transactions with owners in their capacity as owners
Profit for the period
Grant of equity-settled share awards to employees
Total transactions with owners in their capacity as owners
Grant of equity-settled share awards to employees
Attributable to owners of the Company
Contributions by and distributions to owners
Pg 7 of 14

(In Singapore dollars)
CompanyShare
Capital
Retained
Earnings
Other
Reserve Total
$'000 $'000 $'000 $'000
Balance at 01.01.2013 271,529 (20,007) 1,204 252,726
- 860 - 860
- - 209 209
Total transactions with owners in their capacity as owners 271,529 (19,147) 1,413 253,795
Balance at 31.03.2013 271,529 (19,147) 1,413 253,795
- 893 - 893
Contributions by and distributions to owners
Grant of equity-settled share awards to employees - - 186 186
Dividends paid - (4,549) - (4,549)
Total transactions with owners in their capacity as owners 271,529 (22,803) 1,599 250,325
Balance at 30.06.2013 271,529 (22,803) 1,599 250,325
- (303) - (303)
- - 186 186
271,529 (23,106) 1,785 250,208
Balance at 30.09.2013 271,529 (23,106) 1,785 250,208
- 5,531 - 5,531
Grant of equity-settled share awards to employees - - 139 139
Issue of share under share awards 1,236 - (1,236) -
272,765 (17,575) 688 255,878
Balance at 31.12.2013 272,765 (17,575) 688 255,878
Balance at 01.01.2014 272,765 (17,575) 688 255,878
- 340 - 340
Grant of equity-settled share awards to employees - - 166 166
Issue of share under share awards 27 - (27) -
Total transactions with owners in their capacity as owners 272,792 (17,235) 827 256,384
Balance at 31.03.2014 272,792 (17,235) 827 256,384
- 1,461 - 1,461
Contributions by and distributions to owners
- - 152 152
Dividends paid - (5,356) - (5,356)
Total transactions with owners in their capacity as owners 272,792 (21,130) 979 252,641
Balance at 30.06.2014 272,792 (21,130) 979 252,641
- 376 - 376
Issue of shares(1) 24,902 - - 24,902
- - 158 158
Total transactions with owners in their capacity as owners 297,694 (20,754) 1,137 278,077
Balance at 30.09.2014 297,694 (20,754) 1,137 278,077
- 6,514 - 6,514
500 - - 500
Grant of equity-settled share awards to employees - - 155 155
Issue of share under share awards 522 - (522) -
298,716 (14,240) 770 285,246
Balance at 31.12.2014 298,716 (14,240) 770 285,246
Contributions by and distributions to owners
Total transactions with owners in their capacity as owners
(1) On 8 July 2014, the Company had issued 153,016,000 shares to 2 investors in respect of the placement agreement signed on 19 June 2014.
(2) On 31 December 2014, the Company issued 2,771,618 shares to Credit Suisse (Singapore) Limited at an issue price of $0.1804 each for its role as financial advisers
with respect to the acquisition of Anchorage Singapore Holdings Pte Ltd.
Shares issued in connection with the acquisition of a subsidiary (2)
Grant of equity-settled share awards to employees
Profit for the period
Grant of equity-settled share awards to employees
Profit for the period
Contributions by and distributions to owners
Contributions by and distributions to owners
Grant of equity-settled share awards to employees
Total transactions with owners in their capacity as owners
Profit for the period
Contributions by and distributions to owners
Total transactions with owners in their capacity as owners
Contributions by and distributions to owners
Profit for the period
Loss for the period
Attributable to owners of the Company
Grant of equity-settled share awards to employees
Profit for the period
Profit for the period
Profit for the period
Contributions by and distributions to owners
Pg 8 of 14

1(d)(ii)
Issued and fully paid
1(d)(iii)
1(d)(iv)
2
The figures are not audited or reviewed.
3 Where the figures have been audited or reviewed, the auditors' report (including any qualifications or emphasis of matter)
Not applicable
4
5
6
1.21 0.53 3.30 1.80
1.19 0.51 3.22 1.75 (b) on a fully diluted basis (cents)
Earnings per ordinary share is calculated on the Group profit for the financial periods attributable to the shareholders of the Company divided by the
weighted average number of ordinary share of 919,530,780 and 839,633,047 (4Q13: 762,722,154, financial year ended 31.12.2013: 759,307,215) for
the 4th quarter ended 31.12.2014 and financial year ended 31.12.2014 respectively.
Earnings per ordinary share (diluted basis) is computed based on the same basis as earnings per share by applying the weighted average number of
ordinary shares in issuance during the period under review and adjusted to include all potential dilutive ordinary shares up to 31.12.2014. The adjusted
weighted average number of ordinary shares is 938,776,563 and 859,393,118 (4Q13: 781,637,176, financial year ended 31.12.2013: 780,782,733) for
4th quarter ended 31.12.2014 and financial year ended 31.12.2014 respectively.
The Group has applied the same accounting policies and methods of computation in the financial statements for the current reporting period compared
with the audited financial statements for the period ended 31.12.2013 as well as applicable Financial Reporting Standards (FRS) which became
effective for financial years beginning on or after 01.01.2014.
If there are any changes in the accounting policies and methods of computation, including any required by an accounting standard, what has
changed, as well as the reasons for, and the effect of, the change
The adoption of the new/revised FRS did not result in any material impact on the Group's results.
Earnings per ordinary share of the group for the current period reported on and the corresponding period of the immediately preceding
financial year, after deducting any provision for preference dividends
Earnings per ordinary share (EPS) for the period based on net profit attributable to
(a) on weighted average number of ordinary shares (cents)
To show the total number of issued shares excluding treasury shares as at the end of the current financial period and as at the end of the
immediately preceding year.
The Company does not have treasury shares as at 31.12.2014 (as at 31.12.13 : nil)
A Statement showing all sales, transfers, disposal, cancellation and/or use of treasury shares as at the end of the current financial period
reported on.
There was no sales, transfers, disposal, cancellation and/or use of treasury shares as at 31.12.2014.
Whether the figures have been audited, or reviewed and in accordance with which auditing standard or practice.
Whether the same accounting policies and methods of computation as in the issuer's most recently audited annual financial statements have
been applied
Group Group
Jan-Dec 13 Jan-Dec 14 4th Qtr 13 4th Qtr 14
As at 31.12.2014, the share capital of the Company comprised 927,324,011 shares.
Balance as at 31.12.2013 764,931,393
Issue of shares to employees under STL RSP on 30 January 2014 150,000
Issue of shares on 08 July 2014 under placement agreement signed on 19 June 2014 153,016,000
Details of any changes in the company's share capital arising from rights issue, bonus issue, share buy-backs, exercise of share options or warrants, conversion of other
issues of equity securities, issue of shares or cash or as consideration for acquisition or for any other purpose since the end of the previous period reported on. State also
the number of shares that may be issued on conversion of all the outstanding convertibles as at the end of the current financial period reported on and as at the end of the
corresponding period of the immediately preceding financial year
Ordinary Share
The number of shares that may be issued on conversion of share awards as at 31 December 2014 was 19,789,000 (31 December 2013: 20,323,000)
shares.
Issue of shares to employees under STL RSP on 12 December 2014 6,455,000
2,771,618 Issue of shares on 31 December 2014 which was approved at the EGM held on 6 November 2014
Balance as at 31.12.2014 927,324,011
Pg 9 of 14

7
31.12.14 At 31.12.13 31.12.14 At 31.12.13
32.92 33.03 30.76 33.45
31.12.14 At 31.12.13 31.12.14 At 31.12.13
30.92 31.32 30.76 33.45
8
4Q14 4Q13 Inc/(Dec)
$’000 $’000 %
Automotive 37,839 26,472 42.9
Consumer/IT 55,434 57,533 (3.6)
Healthcare 10,882 8,399 29.6
Mould Fabrication 30,832 29,286 5.3
134,987 121,690 10.9
FY14 FY13 Inc/(Dec)
$’000 $’000 %
Automotive 121,572 105,546 15.2
Consumer/IT 210,882 225,049 (6.3)
Healthcare 37,697 34,649 8.8
Mould Fabrication 105,462 110,759 (4.8)
475,613 476,003 (0.1)
Net asset value (for the issuer and group) per ordinary share based on the total number of issued shares excluding treasury shares of the
issuer at the end of the (a) current period reported on and (b) immediately preceding financial year
Net tangible asset value per ordinary share
Net tangible asset value per ordinary share based on existing issued share capital as at the
end of period (cents)
A review of the performance of the group, to the extent necessary for a reasonable understanding of the group's business. The review must
discuss any significant factors that affected the turnover, costs, and earnings of the group for the current financial period reported on and
any material factors that affected the cash flow, working capital, assets or liabilities of the group during the current financial period reported
on
During the period, gross profit increased by 11.2% from $14.8 million in 4Q13 to $16.4 million in 4Q14, in line with the increase in revenue. Gross
margin improved marginally from 12.1% in 4Q13 to 12.2% in 4Q14.
The increase in other income was mainly due to foreign exchange gain of $3.3 million in 4Q14 as compared to $0.3 million recorded in 4Q13 and a
provisional negative goodwill of $4.5 million recognised in 4Q14 arising from the acquisition of SSH Group.
The increase in Administrative expenses in 4Q14 compared to 4Q13 was mainly due to acquisition expenses of $4.9 million in respect to the acquisition
of SSH Group.
The decrease in other expenses in 4Q14 was mainly due to the impairment loss on property, plant and equipment of $1.4 million recorded in 4Q13 as
compared to only $0.017 million recorded in 4Q14.
The increase in finance costs was mainly due to additional loans obtained for funding the acquisition of SSH Group.
The decrease in income tax expenses was mainly due to deferred tax assets recorded in a subsidiary in Malaysia and overprovision of income tax in
previous year.
The Group achieved a net profit of $11.2 million in 4Q14 compared to $4.0 million in 4Q13. Excluding the provisional negative goodwill, acquisition
expenses and foreign exchange gain, the net profit would have been $8.3 million in 4Q14 and $3.7 million in 4Q13. The contribution from SSH Group
including its share of results of joint venture to 4Q14 was $0.6 million.
Group Company
#Sunningdale Singapore Holdings Pte Ltd (“SSH”) (formerly known as Anchorage Singapore Holdings Pte Ltd) and its subsidiaries (“SSH Group”) contributed $16.3
million to the Group’s revenue in 4Q14
January – December 2014 (“FY14”)
The Group’s revenue decreased marginally by 0.1% from $476.0 million in FY13 to $475.6 million in FY14. The comparison of revenue for FY14 versus
FY13 is as shown below :
Net asset value per ordinary share
Net asset value per ordinary share based on existing issued share capital as at the end of
period (cents)
Group Company
CONSOLIDATED INCOME STATEMENT
October – December 2014 (“4Q14”)
The Group’s revenue increased by 10.9% from $121.7 million in 4Q13 to $135.0 million in 4Q14. The increase in revenue was from all business
segments except for Consumer/IT business segment. Revenue from the Consumer/IT business segment decreased mainly due to the shut-down of our
operations in Sweden.
#Sunningdale Singapore Holdings Pte Ltd (“SSH”) (formerly known as Anchorage Singapore Holdings Pte Ltd) and its subsidiaries (“SSH Group”) contributed $16.3
million to the Group’s revenue in FY14
Pg 10 of 14
8
(Cont'
d)
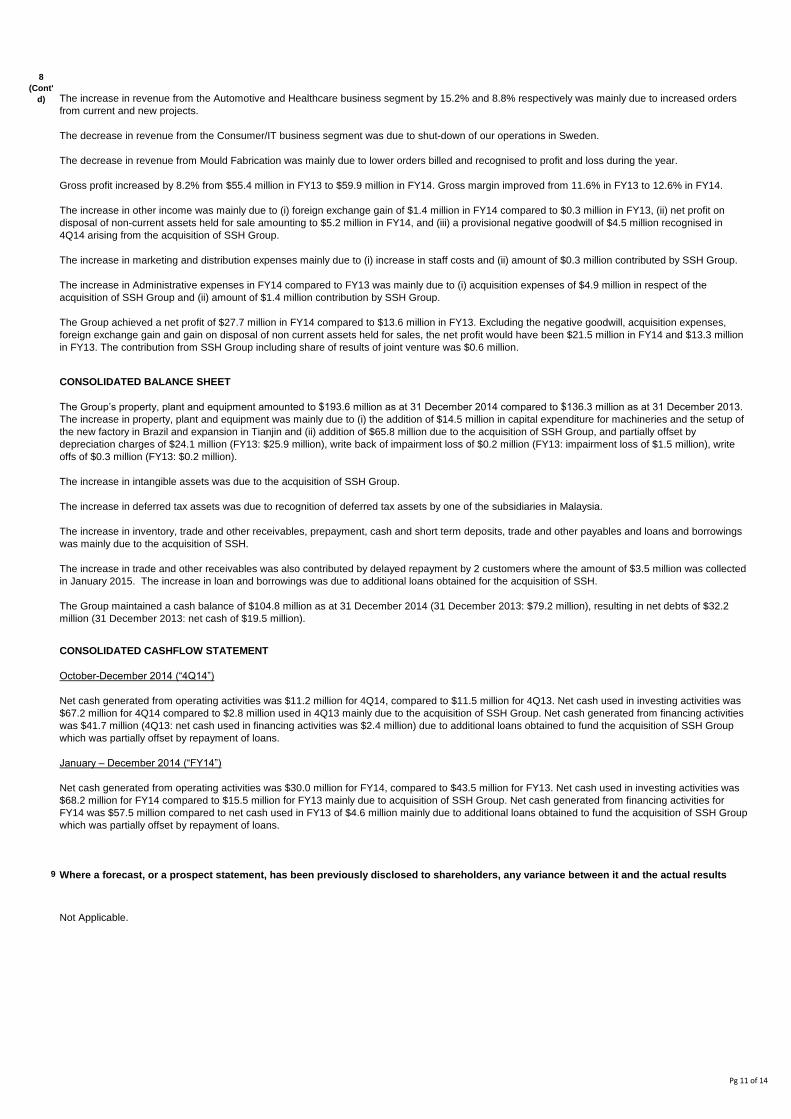
9
Not Applicable.
Where a forecast, or a prospect statement, has been previously disclosed to shareholders, any variance between it and the actual results
The increase in revenue from the Automotive and Healthcare business segment by 15.2% and 8.8% respectively was mainly due to increased orders
from current and new projects.
The decrease in revenue from the Consumer/IT business segment was due to shut-down of our operations in Sweden.
The decrease in revenue from Mould Fabrication was mainly due to lower orders billed and recognised to profit and loss during the year.
Gross profit increased by 8.2% from $55.4 million in FY13 to $59.9 million in FY14. Gross margin improved from 11.6% in FY13 to 12.6% in FY14.
The increase in other income was mainly due to (i) foreign exchange gain of $1.4 million in FY14 compared to $0.3 million in FY13, (ii) net profit on
disposal of non-current assets held for sale amounting to $5.2 million in FY14, and (iii) a provisional negative goodwill of $4.5 million recognised in
4Q14 arising from the acquisition of SSH Group.
The increase in marketing and distribution expenses mainly due to (i) increase in staff costs and (ii) amount of $0.3 million contributed by SSH Group.
The increase in Administrative expenses in FY14 compared to FY13 was mainly due to (i) acquisition expenses of $4.9 million in respect of the
acquisition of SSH Group and (ii) amount of $1.4 million contribution by SSH Group.
The Group achieved a net profit of $27.7 million in FY14 compared to $13.6 million in FY13. Excluding the negative goodwill, acquisition expenses,
foreign exchange gain and gain on disposal of non current assets held for sales, the net profit would have been $21.5 million in FY14 and $13.3 million
in FY13. The contribution from SSH Group including share of results of joint venture was $0.6 million.
CONSOLIDATED BALANCE SHEET
The Group’s property, plant and equipment amounted to $193.6 million as at 31 December 2014 compared to $136.3 million as at 31 December 2013.
The increase in property, plant and equipment was mainly due to (i) the addition of $14.5 million in capital expenditure for machineries and the setup of
the new factory in Brazil and expansion in Tianjin and (ii) addition of $65.8 million due to the acquisition of SSH Group, and partially offset by
depreciation charges of $24.1 million (FY13: $25.9 million), write back of impairment loss of $0.2 million (FY13: impairment loss of $1.5 million), write
offs of $0.3 million (FY13: $0.2 million).
The increase in intangible assets was due to the acquisition of SSH Group.
The increase in deferred tax assets was due to recognition of deferred tax assets by one of the subsidiaries in Malaysia.
The increase in inventory, trade and other receivables, prepayment, cash and short term deposits, trade and other payables and loans and borrowings
was mainly due to the acquisition of SSH.
The increase in trade and other receivables was also contributed by delayed repayment by 2 customers where the amount of $3.5 million was collected
in January 2015. The increase in loan and borrowings was due to additional loans obtained for the acquisition of SSH.
The Group maintained a cash balance of $104.8 million as at 31 December 2014 (31 December 2013: $79.2 million), resulting in net debts of $32.2
million (31 December 2013: net cash of $19.5 million).
CONSOLIDATED CASHFLOW STATEMENT
October-December 2014 (“4Q14”)
Net cash generated from operating activities was $11.2 million for 4Q14, compared to $11.5 million for 4Q13. Net cash used in investing activities was
$67.2 million for 4Q14 compared to $2.8 million used in 4Q13 mainly due to the acquisition of SSH Group. Net cash generated from financing activities
was $41.7 million (4Q13: net cash used in financing activities was $2.4 million) due to additional loans obtained to fund the acquisition of SSH Group
which was partially offset by repayment of loans.
January – December 2014 (“FY14”)
Net cash generated from operating activities was $30.0 million for FY14, compared to $43.5 million for FY13. Net cash used in investing activities was
$68.2 million for FY14 compared to $15.5 million for FY13 mainly due to acquisition of SSH Group. Net cash generated from financing activities for
FY14 was $57.5 million compared to net cash used in FY13 of $4.6 million mainly due to additional loans obtained to fund the acquisition of SSH Group
which was partially offset by repayment of loans.
Pg 11 of 14
10
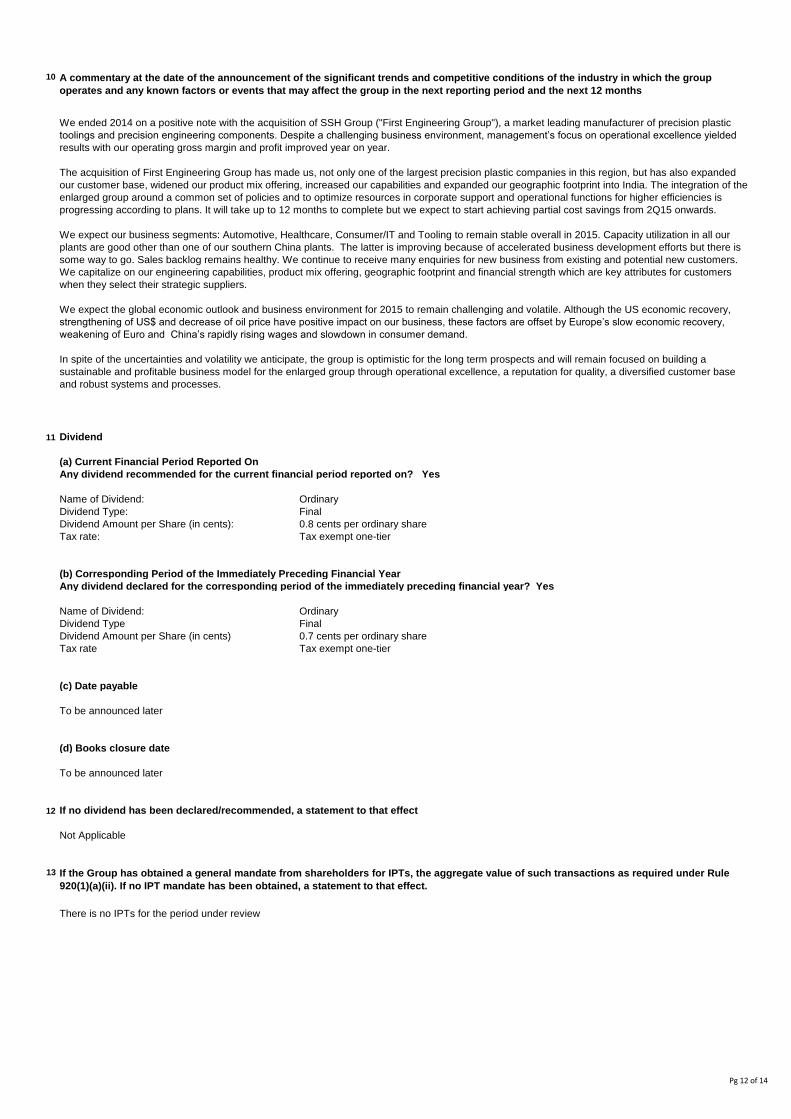
11 Dividend
(a) Current Financial Period Reported On
Any dividend recommended for the current financial period reported on? Yes
Name of Dividend: Ordinary
Dividend Type: Final
Dividend Amount per Share (in cents): 0.8 cents per ordinary share
Tax rate: Tax exempt one-tier
(b) Corresponding Period of the Immediately Preceding Financial Year
Any dividend declared for the corresponding period of the immediately preceding financial year? Yes
Name of Dividend: Ordinary
Dividend Type Final
Dividend Amount per Share (in cents) 0.7 cents per ordinary share
Tax rate Tax exempt one-tier
(c) Date payable
To be announced later
(d) Books closure date
To be announced later
12 If no dividend has been declared/recommended, a statement to that effect
Not Applicable
13
There is no IPTs for the period under review
A commentary at the date of the announcement of the significant trends and competitive conditions of the industry in which the group
operates and any known factors or events that may affect the group in the next reporting period and the next 12 months
We ended 2014 on a positive note with the acquisition of SSH Group ("First Engineering Group"), a market leading manufacturer of precision plastic
toolings and precision engineering components. Despite a challenging business environment, management’s focus on operational excellence yielded
results with our operating gross margin and profit improved year on year.
The acquisition of First Engineering Group has made us, not only one of the largest precision plastic companies in this region, but has also expanded
our customer base, widened our product mix offering, increased our capabilities and expanded our geographic footprint into India. The integration of the
enlarged group around a common set of policies and to optimize resources in corporate support and operational functions for higher efficiencies is
progressing according to plans. It will take up to 12 months to complete but we expect to start achieving partial cost savings from 2Q15 onwards.
We expect our business segments: Automotive, Healthcare, Consumer/IT and Tooling to remain stable overall in 2015. Capacity utilization in all our
plants are good other than one of our southern China plants. The latter is improving because of accelerated business development efforts but there is
some way to go. Sales backlog remains healthy. We continue to receive many enquiries for new business from existing and potential new customers.
We capitalize on our engineering capabilities, product mix offering, geographic footprint and financial strength which are key attributes for customers
when they select their strategic suppliers.
We expect the global economic outlook and business environment for 2015 to remain challenging and volatile. Although the US economic recovery,
strengthening of US$ and decrease of oil price have positive impact on our business, these factors are offset by Europe’s slow economic recovery,
weakening of Euro and China’s rapidly rising wages and slowdown in consumer demand.
In spite of the uncertainties and volatility we anticipate, the group is optimistic for the long term prospects and will remain focused on building a
sustainable and profitable business model for the enlarged group through operational excellence, a reputation for quality, a diversified customer base
and robust systems and processes.
If the Group has obtained a general mandate from shareholders for IPTs, the aggregate value of such transactions as required under Rule
920(1)(a)(ii). If no IPT mandate has been obtained, a statement to that effect.
Pg 12 of 14
PART II - ADDITIONAL INFORMATION REQUIRED FOR FULL YEAR ANNOUNCEMENT
(This part is not applicable to Q1, Q2, Q3 or Half Year Results)
14
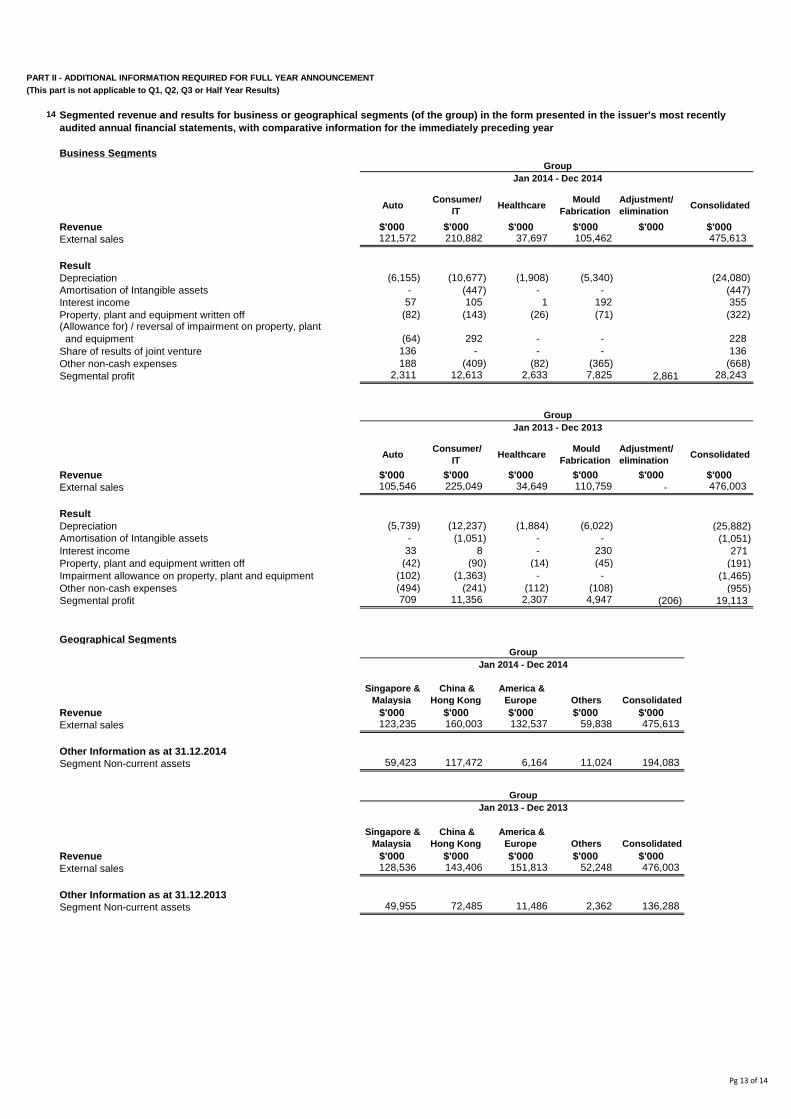
Business Segments
Auto Consumer/
IT Healthcare
Mould
Fabrication
Adjustment/
elimination Consolidated
Revenue $'000 $'000 $'000 $'000 $'000 $'000
External sales 121,572 210,882 37,697 105,462 475,613
Result
Depreciation (6,155) (10,677) (1,908) (5,340) (24,080)
- (447) - - (447)
Interest income 57 105 1 192 355
Property, plant and equipment written off (82) (143) (26) (71) (322)
(64) 292 - - 228
Share of results of joint venture 136 - - - 136
Other non-cash expenses 188 (409) (82) (365) (668)
Segmental profit 2,311 12,613 2,633 7,825 2,861 28,243
Auto Consumer/
IT Healthcare
Mould
Fabrication
Adjustment/
elimination Consolidated
Revenue $'000 $'000 $'000 $'000 $'000 $'000
External sales 105,546 225,049 34,649 110,759 - 476,003
Result
Depreciation (5,739) (12,237) (1,884) (6,022) (25,882)
- (1,051) - - (1,051)
Interest income 33 8 - 230 271
Property, plant and equipment written off (42) (90) (14) (45) (191)
Impairment allowance on property, plant and equipment (102) (1,363) - - (1,465)
Other non-cash expenses (494) (241) (112) (108) (955)
Segmental profit 709 11,356 2,307 4,947 (206) 19,113
Geographical Segments
Singapore &
Malaysia
China &
Hong Kong
America &
Europe Others Consolidated
Revenue $'000 $'000 $'000 $'000 $'000
External sales 123,235 160,003 132,537 59,838 475,613
Other Information as at 31.12.2014
Segment Non-current assets 59,423 117,472 6,164 11,024 194,083
Singapore &
Malaysia
China &
Hong Kong
America &
Europe Others Consolidated
Revenue $'000 $'000 $'000 $'000 $'000
External sales 128,536 143,406 151,813 52,248 476,003
Other Information as at 31.12.2013
Segment Non-current assets 49,955 72,485 11,486 2,362 136,288
Segmented revenue and results for business or geographical segments (of the group) in the form presented in the issuer's most recently
audited annual financial statements, with comparative information for the immediately preceding year
Group
Jan 2014 - Dec 2014
Group
Amortisation of Intangible assets
Group
Jan 2014 - Dec 2014
(Allowance for) / reversal of impairment on property, plant
and equipment
Group
Jan 2013 - Dec 2013
Jan 2013 - Dec 2013
Amortisation of Intangible assets
Pg 13 of 14
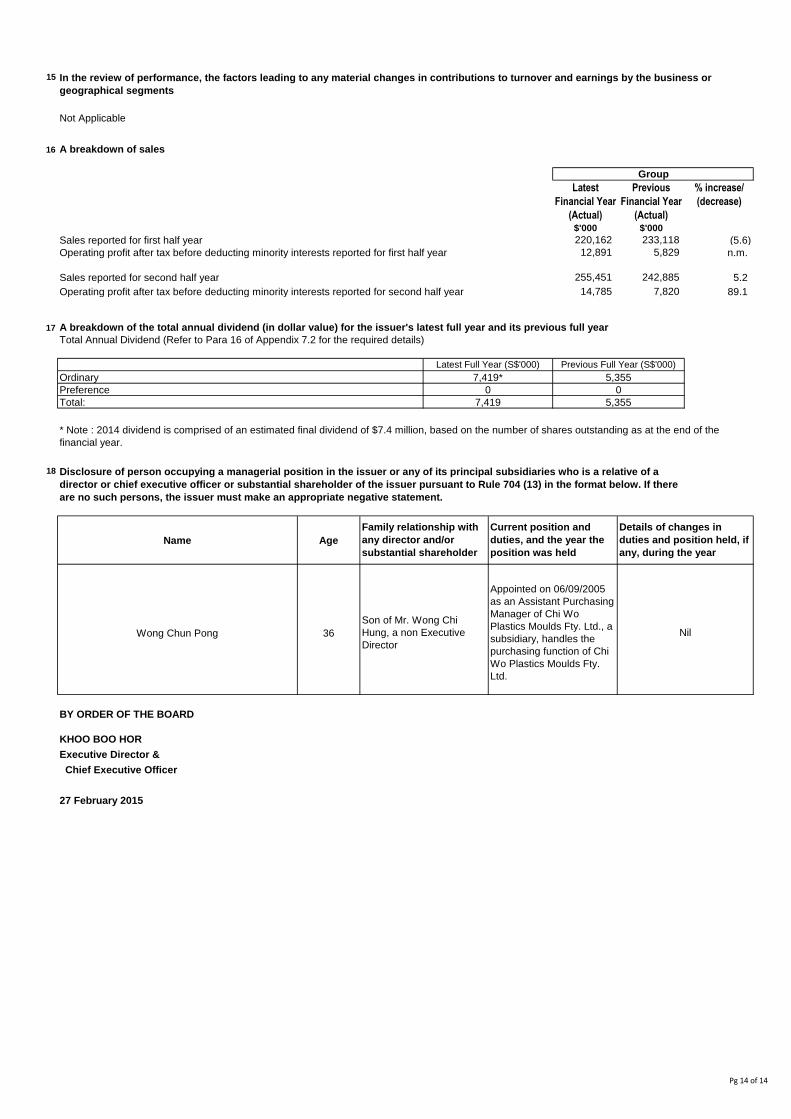
15
Not Applicable
16 A breakdown of sales
Latest Previous % increase/
Financial Year Financial Year (decrease)
(Actual) (Actual)$'000 $'000
Sales reported for first half year 220,162 233,118 (5.6)
Operating profit after tax before deducting minority interests reported for first half year 12,891 5,829 n.m.
Sales reported for second half year 255,451 242,885 5.2
14,785 7,820 89.1
17
Total Annual Dividend (Refer to Para 16 of Appendix 7.2 for the required details)
18
Name Age
Wong Chun Pong 36
BY ORDER OF THE BOARD
KHOO BOO HOR
Executive Director &
Chief Executive Officer
27 February 2015
A breakdown of the total annual dividend (in dollar value) for the issuer's latest full year and its previous full year
Latest Full Year (S$'000) Previous Full Year (S$'000)
Son of Mr. Wong Chi
Hung, a non Executive
Director
Appointed on 06/09/2005
as an Assistant Purchasing
Manager of Chi Wo
Plastics Moulds Fty. Ltd., a
subsidiary, handles the
purchasing function of Chi
Wo Plastics Moulds Fty.
Ltd.
Nil
Preference 0 0
Total: 7,419 5,355
* Note : 2014 dividend is comprised of an estimated final dividend of $7.4 million, based on the number of shares outstanding as at the end of the
financial year.
Disclosure of person occupying a managerial position in the issuer or any of its principal subsidiaries who is a relative of a
director or chief executive officer or substantial shareholder of the issuer pursuant to Rule 704 (13) in the format below. If there
are no such persons, the issuer must make an appropriate negative statement.
Family relationship with
any director and/or
substantial shareholder
Current position and
duties, and the year the
position was held
Details of changes in
duties and position held, if
any, during the year
Ordinary 7,419* 5,355
Operating profit after tax before deducting minority interests reported for second half year
In the review of performance, the factors leading to any material changes in contributions to turnover and earnings by the business or
geographical segments
Group
Pg 14 of 14