Embed Size (px)
Citation preview

i
A Model to Explore the Impact of Tourism Infrastructure on Destination
Image for Effective Tourism Marketing
Sunitha Kavunkil Haneef
School of the Built Environment
University of Salford, UK
Submitted in Partial Fulfilment of the Requirements of the Degree of
Doctor of Philosophy, April 2017

ii
Table of Contents
Title Page i
Table of contents ii
List of tables vii
List of figures ix
Acknowledgement x
Abstract xi
Chapter 1- Introduction
1.1 An overview of tourism infrastructure 1
1.2 The tourism industry 4
1.3 Tourism marketing : The driving forces 10
1.4 Importance of destination image in tourism 12
1.5 Rationale for the study 15
1.6 Significance of the study 16
1.7 Research Questions 19
1.8 Aim 21
1.9 Objectives 21
1.10 Research Methods 21
1.11 Research Outcome 22
1.12 Structure of the Report 23
Chapter 2 Literature Review and Conceptual framework 27
2.1 Introduction 27
2.2 Tourism infrastructure 27
2.2.1 Formation of tourism infrastructure 30
2.2.2 Attraction infrastructure 33
2.2.3 Accommodation infrastructure 36
2.2.4 Accessibility infrastructure 39
iii
2.2.5 Amenity infrastructure 41
2.3 Destination Image 42
2.3.1 Definition 43
2.3.2 Infrastructure and destination image 47
2.3.3 Primary versus secondary image 48
2.3.4 Pre-visit versus post-visit image 49
2.3.5 Destination Image Formation 50
2.3.6 Factors Influencing Image formation 52
2.3.7 Destination image and Destination selection decision 54
2.4 Tourist Satisfaction 56
2.4.1 Destination image and tourist satisfaction 59
2.5 Tourist’s future intention 61
2.5.1 Tourist Satisfaction and future intention 63
2.6 Tourism Marketing 64
2.6.1 An overview of destination marketing 67
2.6.2 Determinants of Destination Marketing 68
2.6.3 Destination image and tourism marketing 70
2.6.4 The interrelationship between destination marketing and destination
Image 73
2.6.5 The role of tourism infrastructure in marketing destinations 75
2.6.6 People – the 5th
P’ of Marketing Mix 77
2.7 Summary of the review of relevant concepts of the study 79
2.8 Structural Equation Modeling in Tourism studies 82
2.9 Conceptual framework and hypotheses 91
2.9.1 Validation of the relationships in the hypotheses 104
2.10 Summary 108
Chapter 3 Research Methodology 111
3.1 Introduction 111
3.2 Research Philosophy 112
3.3 Research Purpose 113
3.4 Logic of Research 114
3.5 Research Process 115

iv
3.6 Methods of data collection 116
3.6.1 Questionnaire 119
3.6.1.1 Formation of Variable 120
3.6.1.1.1 Literature review 121
3.6.1.1.2 Pilot Study 125
3.6.1.2 Questionnaire Design and Measurement of variables 132
3.6.1.3 Sample design and data collection 135
3.6.2 Case study 137
3.7 Case study: An overview of Dubai Tourism 140
3.7.1 Infrastructure of Dubai 141
3.7.1.1 Dubai: Attraction infrastructure 142
3.7.1.2 Dubai: Accommodation infrastructure 143
3.7.1.3 Dubai: Accessibility infrastructure 144
3.7.1.4 Dubai: Amenity infrastructure 145
3.7.2 Infrastructure and destination image of Dubai 146
3.7.3 The role of tourism infrastructure in Dubai’s destination marketing 148
3.7.4 An overall evaluation of Dubai’s tourism infrastructure 151
3.8 Data Analysis Methods used in the Research 158
3.9 Research Phases 159
3.9.1 Phase 1- Research Planning Phase 159
3.9.2 Phase 2 - Research Development Phase 160
3.9.3 Phase 3 - Research Validation Phases 160
3.10 Summary 162
Chapter 4 Data Analysis and Discussion 163
4.1 Introduction 163
4.2 Selection of appropriate statistical technique 164
4.2.1 Partial Least Squares (PLS) 170
4.3 Respondents' Socio - demographic characteristics 180
4.4 Preliminary analysis to determine the impact of Tourism Infrastructure on
Destination Image in a comparative context of pre and post destination
image 184
4.5 Validation of the research model 192

v
4.5.1 Measurement Model 193
4.5.1.1 Validity and Reliability 195
4.5.1.2 Convergent Validity 195
4.5.1.3 Discriminant Validity 197
4.5.2 Structural Equation Modeling Result 198
4.5.2.1 Confirmation of Hypotheses 199
4.6 Summary 203
Chapter 5 Discussion of Findings 205
5.1 Introduction 205
5.2 Key findings of the Literature Review and Survey 205
5.3 General findings 213
5.4 Summary 222
Chapter 6 Conclusion and Implications 224
6.1 Introduction 224
6.2 Conclusion 226
6.3 Contribution to knowledge 229
6.4 Limitations of This Research 232
6.5 Future Areas of the research 233
References 235
Appendices 286
Appendix 1 Questionnaire 286
Appendix 2 Respondents’ Socio - Demographic Characteristics – Graphs 294
Appendix 3 Date Analysis for Questionnaire – Graphs 299
Appendix 4 Variables Frequency Tables and graphs 307
Appendix 5 Paired Samples mean comparison 309
Appendix 6 Overall Quality of Infrastructure 310

vi
Appendix 7 Tourist Satisfaction 311
Appendix 8 Future Intention 315
Appendix 9 Gantt chart 316

vii
List of tables
Table 2.1 The 4 A’s of tourism infrastructure 32
Table 2.2 Definitions of destination image 44
Table 2.3 Service Dimensions for Tourism Marketing 66
Table 2.4 List of previous studies with Structural Equation Modeling (SEM)
in tourism 85
Table 2.5 Interrelationships of the Research Questions, Objectives of the study
and Hypotheses of the study 101
Table 2.6 Validation of the significance of the relationships/paths in
the hypotheses 106
Table 3.1 Formation of Variables from the previous studies 121
Table 3.2 Categorisation of variables before the pilot study 126
Table 3.3 Categorisation of variables after the pilot study 130
Table 3.4 Progress of Dubai’s tourism infrastructure – Hotels 152
Table 3.5 Progress of Dubai’s tourism infrastructure – Activities 153
Table 3.6 Progress of Dubai’s tourism infrastructure – Attractions 154
Table 3.7 Tourist arrival statistics of Dubai 155
Table 4.1 Criterion to assess the fitness of measurement model 179
Table 4.2 Respondents’ Socio - Demographic Characteristics 180
Table 4.3 Pre and post visit destination image statements 188
Table 4.4 Paired Samples Statistics 189
Table 4.5 Paired Samples mean comparison 189
Table 4.6 Paired Samples Correlations 190
Table 4.7 Paired Samples Test – Differences 191
Table 4.8 Convergent Validity of Constructs 196
Table 4.9 Discriminant validity 198
Table 4.10 Hypotheses confirmation results 201

viii
Table 5.1 Summary of general findings related to the research questions and
Objectives of the study 219

ix
List of figures
Figure 1.1 UNWTO Tourism Towards 2030: Actual trend and forecast
1950-2030 7
Figure 1.2 Research Methods 22
Figure 1.3 The structure of the report 24
Figure 2.1 The tourist destination experience 29
Figure 2.2 Framework of Destination Image Formation Agents 53
Figure 2.3 A Model on Destination Image 88
Figure 2.4 A Model on Destination Image, Satisfaction & Future Intention 89
Figure 2.5 A Model on Marketing 89
Figure 2.6 A Model on Infrastructure 90
Figure 2.7 The conceptual framework of the study 91
Figure 2.8 The relationships in the hypotheses 100
Figure 3.1 Research Approach 111
Figure 3.2 Process of Data Collection 118
Figure 3.3 Questionnaire Design process 133
Figure 3.4 Research Phases 161
Figure 4.1 Measurement Model 194
Figure 4.2 The bootstrapping results 200
Image 3.1 Development of Dubai – Then & Now 156
Image 3.2 Development of Dubai – Then & Now 157
Image 3.3 Development of Dubai – Then & Now 157
Image 3.4 Development of Dubai 157

x
Acknowledgment
“All praises to almighty Allah for His blessings in completing this thesis”.
I would like to thank everyone who was directly or indirectly been associated with
my work and contributed to the success of this project.
I would like to express my sincere gratitude to my supervisor, Professor
Mohammed Arif for his generous support, guidance, encouragement and
patience.
I would like to acknowledge Dr. Aftab H. Rizvi for his continuous support.
I also would like to express my heartfelt thanks to Dr. Zakiya Ansari for her
assistance with the proof reading.
Special thanks to my students, who encouraged me throughout this thesis
writing.
I also want to express my deepest gratitude to my parents and Grandparents for
their unconditional love & prayers.
Many thanks to my beloved brother and sister, although we live far away from
each other, their encouragements are always with me.
Lastly, and most importantly, I wish to thank my husband Niyaz, who has been
my biggest support and also my little daughter Raaidah for all their love and
patience. I would not have made it this far without them. To them I dedicate this
piece of work.

xi
Abstract
Tourism is no more an occasional past-time for wealthy and adventurous people.
Nowadays, everyone is participating in the tourism industry, may it be a catering
company, a hotel or an entertainment business. In fact, tourism has an
impressive impact on its host country’s economy. It increases the growth rate,
national profit, investment and country’s popularity as well, going from short term
to long term improvements.
The growing attention for quality from the customer perspective is an important
development in the tourism industry. The World Tourism Organization (WTO)
also endorses this advancement, and includes this as a major thrust area in its
'Tourism Vision 2020', which is a strategic thinking on priorities needed for
countries seeking tourism development.
Tourism infrastructure holds much potential to attract visitors and to enhance
sustainability in tourism. Infrastructure plays a distinctive role in the development
of this ever-expanding industry. The decision-making process concerning tourism
destination selections is strictly related to the availability of tourism infrastructure.
Tourism infrastructure acts as the push and pull market factors of the travel
industry.
In order to be successfully promoted in the targeted markets, a destination must
be favourably differentiated from its competition, or positively positioned, in the
minds of the consumers. A key component of this positioning process is the
creation and management of a distinctive and appealing image of the destination
through appropriate marketing strategy.

xii
Destination image is the most important factor which tourists value highly to
determine their destination. Infrastructure directly impacts to form destination
image, which can be the primary or secondary image of the destination.
Previous experiences or information sources favour to form a destination image,
which is considered as the pre visit image. Thus, there is a need for creating a
post visit destination image to ensure repeat visitation and word of mouth
publicity, which works as a catalyst for Destination Marketing.
The purpose of this study is to investigate the impact of Infrastructure on
destination image for effective Tourism Marketing. The study will specifically
examine the impact of Infrastructure on two phases of the destination image:
before actual visitation and after actual visitation and the study will also assess
how the tourist satisfaction and tourist’s future intentions will impact Destination
Marketing.
This research has used the combination of quantitative and qualitative data
methods and adopted an approach of observation, literature review, survey and
case study to meet the objectives. The empirical study was carried out in Dubai,
UAE. A case study of Dubai has also been chosen for this research to identify
the context of the study “Tourism Infrastructure” in a wider perspective and also
to provide an extra input for the direction of the overall research.
The advanced technique of Structural Equation Modeling (SEM – SmartPLS)
was used for the data analysis. Large scale survey questionnaire data were used
to test the model and confirm the hypotheses. The findings confirm the impact of
infrastructure on destination image in order to facilitate effective tourism
marketing.

xiii
The research makes several significant theoretical and managerial contributions.
This study which is specifically related to the impact of Infrastructure on
destination image is a relatively new concept or is rarely reported. Therefore, this
study would contribute to the tourism infrastructure and marketing literature.
A further contribution to knowledge is the study’s investigation of the impact of
Infrastructure on two phases of the destination image: before actual visitation
and after actual visitation to assess how the tourist satisfaction and tourists future
intentions will influence Destination Marketing. This is the first study to
empirically test a model comprising of these particular concepts within this
specific context.
Tourism Infrastructure and Destination Image are considered essential inputs in
the destination marketing efforts, and this forms the major focus of the study.
1
Chapter 1- Introduction
1.1 An overview of tourism infrastructure
Tourism is to a great extent dependent on the range and type of infrastructure
available at the destination. Infrastructure is a core area of the tourism industry
and plays a distinctive role in the development of this ever-expanding industry.
Several countries have recognised the significance of Infrastructure in relation to
the tourism industry and their governments has coordinated their activities with
the tourism industry by providing tourism specific infrastructural facilities.
Destinations are fundamental to tourism: destinations are the places which
initially attract visitors, where the delivery of tourism takes place, where
businesses are based, and where the tourism product is consumed (Stanford,
2017).
Infrastructure is the key to develop a successful tourism destination. Tourism
industry stimulates investments in new infrastructure, most of which improves the
living conditions of local residents as well as tourists. Tourism development
projects can include airports, roads, marinas, sewage systems, water treatment
plants, restoration of cultural monuments, museums, and nature centres.
It has become critically important for destinations to ensure that their
infrastructure facilities are of high standard, such as offering telecommunications
services, environmental management, health and sanitation, and perhaps most
critical, safety and security. The travel industry has seen many examples of
destinations losing both business and their long-term reputation because they

2
have failed to adequately meet these standards of infrastructure services and
facilities.
The packaging of these components in the various styles desired by the
identified market segments in a variety and capacity that is most profitable to the
destination or supplier of the product is considered the individualised tourism
offer. Service providers, in particular incoming agents or tour operators, generally
take care of product mix formulation.
Tourist attractions form a powerful component of the supply side of tourism —
enticing, luring and stimulating interest in travel. Attractions, Accommodation,
Accessibility and Amenities are the other basic components to form a tourist
destination and they are the prime components of the necessary tourism specific
infrastructure required to form a tourist destination. Their interdependence
dictates a need for a strategic wide-angle approach to tourism infrastructure
development. There has to be a good mix and balance between the basic
components that are essential to a successful destination. These are
Accommodation, Accessibility, Activities, Amenities, and Attractions (IATA 2015).
Destinations can only succeed in attracting visitors if they have a good choice of
ways to get there, places to stay, and things to do.
The importance of infrastructure for tourism has been emphasized by Crouch
and Ritchie, (1999) who analyse the product in the context of comparative and
competitive advantage, they emphasized that, tourism planning and development
would not be possible without roads, airports, harbours, electricity, sewage, and
potable water. The Tourism Task Force (2003) of Australia asserts that
infrastructure is a big part of the tourist equation.

3
The highest potential infrastructure, that is, tourism infrastructure that has the
uppermost likelihood of generating economic returns and tourism sector growth /
investment is therefore infrastructure that facilitates efficient and affordable
access to areas with an existing critical mass of tourism product.
The difficulty of defining quantifiable criteria for setting tourism infrastructure
development priorities remains a challenge. It arises from the weaknesses
associated with applying a blanket approach to prioritization over a diverse
geographic area, varying levels of need and urgency, allocated funding, and
political imperatives.
Identifying and prioritizing tourism specific infrastructure projects will enhance the
tourism offering and increase visitor satisfaction of the destination. But
structuring and delivery of modern infrastructure facilities are extremely complex.
According to Grzinic and Saftic (2012) there are 7 actions which can ensure
adequate tourist and related infrastructure: 1) ensure accessibility to and within
the destination, 2) improve the communal infrastructure, 3) develop new
accommodation capacities, 4) advance the service quality of the provided
services, 5) develop the necessary infrastructure, 6) upgrade the existing
accommodation capacities, and 7) focus in destination safety and cleanliness.
The infrastructure is contributing positively to tourist arrivals hence the sufficient
and proper development of tourism specific infrastructure is essential to develop
a mature tourist destination.

4
1.2 The tourism industry
Tourism is the world’s fastest growing industry. Tourism has been considered as
one of the few viable economic opportunities in large part of the developed
countries (Michael Grosspietsch, 2005). It is not only the developed countries,
but also the developing countries have been identified tourism as a significant
contribution or a major source of income. Tourism is, however, not a single,
tangible product. It comprises a range of tangible and non-tangible products.
Tourism is multi-dimensional functions interrelated with all aspects of tourists and
destination, activities occurred from either direct or indirect interaction of them.
The concept of tourism has been defined in many ways and there is no
agreement on the definition of tourism (Amelung, et al., I999). According to
United Nations World Tourism Organisation (UNWTO), tourism is defined as “an
activity of persons travelling to and staying in places outside their usual
environment for not more than one consecutive year for leisure, business or
other purposes not related to the exercise of an activity remunerated from within
the place visited”(UNWTO, 2002).
Another definition of tourism was put forward by Mathieson and Wall. According
to them tourism is “the temporary movement of people to destinations outside
their normal place of work and residence, the activities undertaken during their
stay in those destinations and the facilities created to cater to their needs”
(Mathieson and Wall, 1982).
According to UNWTO (2015) an ever-increasing number of destinations
worldwide has opened up to, and invested in tourism, turning it into a key driver

5
of socio-economic progress through the creation of jobs and enterprises, export
revenues, and infrastructure development. Over the past six decades, tourism
has experienced continued expansion and diversification, to become one of the
largest and fastest-growing economic sectors in the world. Many new
destinations have emerged in addition to the traditional favourites of Europe and
North America.
World Tourism Organisation (WTO; 1998) has recognized the potential of the
tourism sector for the purpose of poverty alleviation by increased job creation in
the developing countries. The significance of travel and tourism industry goes
beyond purely economic considerations; it also brings in many non-economic
benefits. These benefits include social, cultural, political and educational
exchanges. From the social and cultural point of view, tourism industry produces
an interaction between the culture of the tourists and those of the host
population, thereby encouraging public involvement and helping to create pride
within the community.
Despite the prevailing global economic ambiguity, demand for tourism industry
continues to exhibit uninterrupted growth in many regions of the world (UNWTO,
2015; WTTC, 2012). According to UNWTO (2011) international tourist arrivals
worldwide increased year on year from mere 25 million globally in 1950 to to 278
million in 1980, 527 million in 1995, and 806 million in 2005. In 2008,
international arrivals reached 924 million and was estimated to have declined to
880 million in 2009 due to the economic recession that started in late 2008
(UNWTO, 2010). Growth returned to international tourism in the last three
months of the year 2009 and tourist arrival reached 982 million in 2011, with

6
about 85% of countries recording positive growth. Global travel and tourism
direct employment also experienced growth, rising by 1.2 million in the year 2011
(WTTC, 2012) and the International tourist arrivals International tourist arrivals
(overnight visitors) hit a record 1133 million worldwide in 2014, up from 1087
million in 2013 (UNWTO, 2015). Likewise, international tourism receipts earned
by destinations worldwide have surged from US$ 2 billion in 1950 to US$ 104
billion in 1980, US$ 415 billion in 1995 and US$ 1245 billion in 2014. Demand
continued to be strong in most source markets and destinations, despite ongoing
geopolitical, economic and health challenges in some parts of the world.
International tourist arrivals worldwide are expected to increase by 3.3% a year
between 2010 and 2030 (UNWTO, 2015). According to the United Nations
World Tourism Organization, UNWTO’s , long term forecast Tourism Towards
2030, international tourist arrivals (that is to say, tourists travelling outside their
home country) will double in the next fifteen years, from 880 million in 2009 to
just under 1.6 billion by 2020, and to reach 1.8 billion by 2030. Between 2010
and 2030, arrivals in emerging destinations (+4.4% a year) are expected to
increase at twice the rate of those in advanced economies (+2.2% a year). The
market share of emerging economies increased from 30% in 1980 to 45% in
2014, and is expected to reach 57% by 2030, equivalent to over 1 billion
international tourist arrivals. The WTO also forecasts that in this same period,
Travel and Tourism industry growth will benefit all regions of the world. Figure
1.1 illustrates this forecast growth, by region.

7
Figure 1.1 UNWTO Tourism Towards 2030: Actual trend and forecast 1950-
2030
Source: UNWTO Tourism Highlights, 2015 Edition
According to the United Nations World Tourism Organization (UNWTO, 2015) ,
International tourist arrivals worldwide is expected to increase by 3.3% a year
between 2010 and 2030 to reach 1.8 billion by 2030, according to UNWTO’s long
term forecast Tourism Towards 2030. Between 2010 and 2030, arrivals in
emerging destinations (+4.4% a year) are expected to increase at twice the rate
of those in advanced economies (+2.2% a year). The market share of emerging
economies increased from 30% in 1980 to 45% in 2014, and is expected to
reach 57% by 2030, equivalent to over 1 billion international tourist arrivals.
Tourism is an “export” industry in any country that hosts or receives international
visitors. International tourism is the world’s largest export earner and an

8
important factor in the balance of payments of many countries. International and
domestic tourism combine to generate up to 10% of the world’s Gross Domestic
Product (GDP) and often a higher share in many small nations and developing
countries. Tourism is already the largest foreign exchange earner in 46 of the 49
poorest countries in the world, and it can truly provide benefits of development by
creating employment, empowering citizens and raising living standards.
The tourism product in essence is an amalgam of components that span a range
of sectors such as attractions, accommodations, accessibility, amenities and
services. A critical element of a strategy to attract and disperse tourists is the
provisions of tourism-specific infrastructures. Tourism economy helps support the
local public infrastructure and services.
The highest potential infrastructure, that is, tourism infrastructure (attractions,
accommodations, accessibility and amenities) that facilitates the efficient and
consistent visitors flow to tourist attracting areas has the uppermost likelihood of
generating economic returns and tourism sector growth / investment in the tourist
destination area.
It is important to develop the tourism-specific infrastructure of the tourist
destination as it helps to encourage the conservation and protection of an area's
historical, cultural and natural resources (Archer and Cooper, 1994). Tourism-
specific infrastructures play a significant role in the marketing continuum.
The primary purpose of the tourist destination region is to identify and prioritize
tourism specific infrastructure that will enhance the tourism offering and increase
visitor satisfaction of the destination.

9
A destination is a geographic area which can be defined at various levels of
aggregation e.g. village, town, region or country. Cooper et al (2008) grouped
destination attributes into four categories – attractions, access, amenities and
ancillary services. These attributes can be considered as tourism-specific
infrastructures which generates the enormous demand for a destination. The
appropriate tourism-specific infrastructures create and manage a distinctive and
attractive image of the destination. A destination must be positively differentiated
from its competition, or satisfactorily positioned, in the minds of the consumers in
order to successfully promote in the targeted markets.
Destination image is the important factor which tourists value highly to determine
their destination. If a destination wishing to influence traveler decision-making
and choice, It is important to create positive images of a destination. According
to Jeong & Holland (2012) image of a destination has been recognized as one of
the significant concepts in tourists’ choice of destination selection process
because destination image affects the individual’s destination perception,
subsequent behavior and choice of destination.
To review the various aspects of the destination image it is important to identify
the underlying quality attributes of the tourist destination and tourists' satisfaction
of these factors. Tasci and Gartner (2007) point out that: First, [from the
demand-side] destination oriented marketing activities are dynamic (controllable)
factors that aim to polish and project a positive image for the destination.
According to Tasci & Gartner (2007) destination image plays an integral role in
successful destination marketing, and thus, destinations with strong positive
images are more likely to be considered and selected by consumers (Echtner &

10
Ritchie 2003; Prayag 2009) and the performance of destination features would
stimulate satisfactory emotions and eventually lead to favorable tourist future
intentions (Basri Rashid, 2013). Therefore, destination marketers have sought to
identify the most effective factors that influence a destination image. Thus, the
image of a destination becomes significantly effective for the decisions of tourists
(Yilmaz et al. 2009).
1.3 Tourism marketing: The driving forces
Tourism marketing and promotional efforts are the basic activities to link the
destination with the potential tourist market both at national and international
levels. Marketing is also about anticipating demand, recognizing it, stimulating it
and finally satisfying it. Destination marketing and destination development are
clearly interrelated with each other. Thus tourism marketing is important for the
success of tourism development of a destination.
Wang (2011), states that “destination marketing and management can be
defined as a proactive, visitor-centered approach to the economic and cultural
development of a destination that balances and integrates the interests of
visitors, service providers and the community”. This definition shows that
destination marketing and management is a complex issue that requires a
holistic and systematic approach which must include research.
A tourist destination required to formulate a marketing strategy on a reliable base
and to set up the factors, which have a particular influence on the decision-
making process of the tourist’s regarding the intention to visit a particular

11
destination. In addition, the destination products are intangible & inseparable in
nature, and also customers are likely to differ from one another, thus, marketing
policy should be continuously and carefully considered to manage customers’
demand in the tourism sector. As a result, marketing research is required to
analyse tourist behaviour, motivation to travel abroad, attitudes and images
towards particular destinations, tourism development of a destination etc.
According to Kotler (2000) marketing is the key to achieving organizational goals
consists in determining the needs and wants of target markets and delivering the
desired satisfactions more effectively and efficiently than competitors.
Considering this definition, it is essential for a destination to be distinctively
unique in their tourism specific infrastructure to attract and to satisfy the
prospective tourist and to create a positive image of the destination through the
destination development.
According to Hall (2000) although destinations have long promoted themselves
to potential visitors, there has been a qualitative change in the nature of place
promotion since the early 1980s, when shifts occurred to reduce the role of the
state in a globalizing economy. Within the tourism sector, tourism destination
could be identified and marketed based on a number of factors, which combine
to attract guests to stay at the destination. These factors of the destination mix
are in most cases, inherited from the information about tourism specific
infrastructure given by the marketers of a tourist destination. However the
marketer has no control over these factors as it entirely depends on the tourism
specific infrastructure of the destination.

12
The government and the National tourism development offices of the
destinations are responsible to create tourism specific infrastructure for the
destination development and to market a destination by providing a core strategy
document. This will outline the way in which private and public sector
organizations can coordinate resources to develop and promote a destination. In
some instances; a tourism authority will achieve some degree of success in
planning tourism development, monitoring progress in communicating the
principles and targets widely. Therefore, official organizations should put into
consideration internal marketing, which plays a significant role in the promotion
of tourist destinations.
In order to promote the tourist destination more effectively, destination marketers
can create an actual destination image in the minds of the potential tourists
therefore the prospective and actual tourists may find it more attractive. So one
of the most important tasks of marketing management within the tourism
organizations is to develop or maintain the destination image in line with the
visitor groups being targeted. Image is therefore considered integral to the
destination and is a well-researched area in tourism (Gartner, 1993).
1.4 Importance of destination image in tourism
Destination image has been one of the most investigated topics in the marketing
scholarship in tourism studies (Stepchenkova and Li, 2013; Cherifi, Smith,
Maitland, & Stevenson, 2014; Sun et al., 2015; Fu et al., 2016).

13
The study of tourist destination image, first emerging in the early 70s, has now
grown into one of the most pervasive areas in tourism studies (Pike, 2002). A
successful tourism destination is, among others, evaluated by the positive
revelations of visitors to the area, the amount of money spent per capita and
prospects of repeat visits to the destination.
Destination image can be discussed in different contexts, when it is about tourist
image, it is about the impression and feelings that one can have for a place.
Image in the context of tourism has an important role in experiencing of a given
destination.
According to Somnez and Sirakaya (2002), a good destination image is an asset
to any country or region that is participating in the tourism industry. Destinations
with positive images have a high probability of succeeding than those with
negative destination images. The authors emphasize that a positive image is an
added advantage when competing for international tourists. A positive image in a
destination influences the decision making process of potential visitors to a
destination.
Destination image has become a very important issue in the marketing research
in the tourism industry, since many countries use, promotion and global
marketing to support their image and to compete with other destinations (Lin and
Huang, 2008, Kamenidou et al, 2009).
Destination image is largely recognized as a most relevant construct in consumer
behaviour and marketing research in tourism, because holiday choices are
frequently taken based on destination images, rather than on knowledge of

14
realities (e.g. Baloglu & McCleary, 1999; Bigne´, Sa´nchez, & Sanz, 2009).
Destination choices are frequently undertaken at a spatial, temporal, and cultural
distance (Kastenholz, 2010), making destination images relevant for risk
reduction. Destination image permits the development of expectations, the
imagination of destination qualities prior to travel, and the prolonging of the
enjoyable tourism experience or “vicarious consumption” afterwards (MacInnis &
Price, 1987). That is why, there is a large consensus on the influential role of
destination image in consumer behaviour and its corresponding importance of
destination marketing (e.g. Baloglu & McCleary, 1999; Bigne´, M. Sa´nchez, & J.
Sa´nchez, 2001; Bigne´ et al., 2009; Chon, 1991; Crompton, 1979; Echtner &
Ritchie, 1993; Fakeye & Crompton, 1991; Gartner, 1993; Kozak, Bigne´,
Gonza´lez, & Andreu, 2003; Marques, 2011; Walmsley & Jenkins, 1993). In a
holistic perspective, destination image may be understood as the sum of the
beliefs, ideas, and impressions that people have of a place or destination
(Crompton, 1979). Several researchers particularly highlight the cognitive (Bigne´
et al., 2009; Fakeye & Crompton, 1991) or the affective dimension (Marques,
2011; Walmsley & Jenkins, 1993) of destination image, while some explicitly
include both cognitive and affective components (Baloglu & McCleary, 1999;
Silva, 2012). The cognitive image component consists of beliefs and knowledge
about a destination, primarily focusing on tangible physical attributes (Pike &
Ryan, 2004; Smith, 2010). The affective image component, on the other hand,
represents feelings about a destination (Baloglu & Brinberg, 1997)
According to Lee (2009) destination image directly affects satisfaction and
indirectly affects future behaviour. Destination image has been recognized as
one of the influential concepts in tourists’ destination choice process because

15
image affects the individual’s subjective perception, subsequent behaviour and
destination choice (Jeong & Holland 2012).
1.5 Rationale for the study
A number of studies have been carried out on the subject of Infrastructure,
Destination Image and Tourism Marketing. The impact of Infrastructure on
Destination Image for effective Tourism Marketing has received very little or no
specific research attention.
It is widely presumed that Infrastructure is a leading factor responsible for
Destination Image. The number of studies that have been carried out on the
subject of Tourism Infrastructure is indicative of the importance associated to the
subject. Researchers (Ionel, 2013; Grzinic and Saftic, 2012) have explored the
context of essential elements of successful tourism infrastructure and the actions
related to it. A tourism resource rich region requires plausible planning and
management for the development of such infrastructure.
The ultimate goal of any destination is to influence possible tourists’ travel-
related decision making and choice through marketing activities. Understanding
the images of a destination is essential for a destination which wishes to
influence traveler decision-making and choice. Destination image has been
recognized as one of the influential concepts in tourists’ destination choice
process because image affects the individual’s subjective perception,
subsequent behaviour and destination choice (Jeong & Holland 2012).

16
Destination Image is not static but changes depending on the Infrastructural
attributes of the destination. Therefore the image after visitation is much more
realistic and complex than the one formed before the visitation, through
secondary information (Beerli & Martín, 2014). In this respect, it is suggested that
although many people have an image of destinations they have not yet visited,
the most accurate, personal and comprehensive is formed through visiting there
(Molina, Gómez and Martín-Consuegra, 2010).
Tourism marketers try to strategically establish, reinforce and, change the image
of their destination. Hence consideration of the development of tourism
Infrastructure is important for effective Tourism Marketing of the destination.
From the foregoing, there is a strong basis for research in the investigation of
impact of Infrastructure for effective Marketing of the destination and that
empirically investigates destination image by developing a conceptual model that
explains the destination image: before actual visitation & after actual visitation.
Hence, this study will identify the implications of Infrastructure in tourism
Marketing. It will also give recommendations in relation to positive destination
image formation for the development and better economy of the tourist
destination.
1.6 Significance of the study
The purpose of this study is to develop a structural model to investigate the
impact of Infrastructure on destination image for effective Tourism Marketing.

17
Increasing globalization and frequent travel increase people's exposure to
products and services outside their daily environment. People are thus likely to
dispose of pre-determined images when thinking about a certain country (Arnett,
2002). Despite considerable criticism about country image research's relevance
(c.f. Samiee, 2010; Zeugner-Roth & Diamantopoulos, 2010) “all nations have
images, whether deliberately cultivated or not” (Rojas-Méndez, Murphy, &
Papadopoulos, 2013). Morakabati, Beavis, & Fletcher (2014), believe that there
is a strong connection between a positive image and continued tourism growth.
Lopes (2011) and Echtner and Ritchie (2003) underline the crucial role of
destination image in the destination marketing perspective. More specifically,
Lopes (2011) supports that when tourists choose a tourist destination, they are
influenced significantly by the image of the destination. Infrastructures influence
tourism development and create an image of the destination or tourism region
(Decrop, 2010; Beerli & Martın, 2004). A destination with a lack of infrastructure
has been the center of concern for many tourist destinations but the studies
specifically related to the impact of Infrastructure on destination image are rarely
reported. Therefore, accomplishing the aim and objectives delineated below
would contribute to the tourism infrastructure and marketing literature.
This study will explore various infrastructural attributes related to tourists' holiday
experience. A further contribution to knowledge will be the study’s investigation
of the impact of Infrastructure on two phases of the destination image: before
actual visitation & after actual visitation to assess how the tourists’ satisfaction
and tourists’ future intentions will influence Destination Marketing.

18
This study will determine the impact of infrastructural facilities on destination
image for effective tourism marketing. This is the first study to empirically test a
model comprising of these particular concepts within this specific context.
Research of this topic will definitely be an important contribution to destination
pursuers, destination marketers, tour operators, government agencies and other
stakeholders.
This research will give recommendations in relation to positive destination image
formation for the development of an enriched tourist destination and better
economy of the destination. The research findings, as a reference, will assist
destination marketers and other entities. The research will add on to existing
knowledge on impact of Infrastructure on destination image and tourism
marketing.
In addition to the theoretical importance, this study also has practical purposes.
Destination marketing organizations (DMOs) are interested in encouraging non-
visitors to visit and previous visitors to revisit specific destinations. Repeat
visitation is a stabilizing influence, and repeat visitors are a cost-effective market
segment for most destinations. They provide continued revenues and lower costs
in market communication (Kastenholz et al., 2013; Lau and McKercher, 2004;
Zhang et al., 2014). A good appreciation of the differences between previous
visitors and non-visitors and the contributory factors to these differences will help
DMOs design appropriate strategies for different segments of consumers.

19
1.7 Research questions
According to Stanford (2017) tourist destinations are the places which initially
attract visitors, where the delivery of tourism takes place, where businesses are
based, and where the tourism product is consumed. Infrastructure is the key to
develop a successful tourism destination. Hence, it has become critically
important for destinations to ensure that their infrastructure facilities are of high
standard.
In order to be successfully promoted in the targeted markets, a destination must
be favourably differentiated from its competition, or positively positioned, in the
minds of the consumers. A key component of this positioning process is the
creation and management of a distinctive and appealing image of the destination
through appropriate marketing strategy.
A unanimous view prevails that effective marketing is critical for the success of a
tourist destination. Destination Marketing is different from marketing of services
or products. A destination is much more complicated to manage than any other
operation, because destination marketers are not only confronted with tourism's
well known particularities of intangibility, inseparability, heterogeneity,
perishability etc., but they also have to deal with a number of different actors that
are independent operators in their own right.
Effective tourism marketing and management require an understanding of the
existing market segments (Park & Yoon, 2009). The growing importance of
quality, as demanded by the customers and the growing intensity of competition
will impact the tourism development efforts initiated at a destination level.
Matching the company's capabilities and the wants of its customers is at the core

20
of marketing (McDonald & Wilson, 2011). The Infrastructure is a necessary
element for tourism development and Destination Image. Understanding the
images of a destination is essential for attracting new visitors. Destination Image
has been recognized as one of the influential concepts in tourists’ destination
choice process because image affects the individual’s subjective perception,
subsequent behaviour and destination choice (Jeong & Holland 2012).
There is an extensive body of literature (Ionel, 2013; Grzinic and Saftic, 2012)
concerned with the subject of Infrastructure, Destination Image and Tourism
Marketing, but the impact of the Infrastructure on Destination Image for effective
tourism marketing has been neglected. Hence, the proposed study will be
attempted to answer the following research questions:
How does the Destination Image and Tourism Marketing influence
tourists’ decision on destination selection?
What are the various tourism specific infrastructural attributes affecting the
pre visit & post visit destination image?
What is the impact of specific infrastructural attributes on destination
image, and how do they differ in tourists' pre visit & post visit image of
destination?
What are the effects of destination image factors on the tourists' overall
holiday satisfaction and future intention/tourist impression with the
destination?
How do tourism infrastructural facilities and destination image influence
tourism marketing and tourist’s future intention?

21
1.8 Aim
To develop an assessment model that evaluates the impact of infrastructure on
destination image in order to facilitate effective tourism marketing.
1.9 Objectives
To review the role of destination image and tourism marketing in tourists’
decision on destination selection.
To explore various tourism specific Infrastructural attributes affecting the
pre visit & post visit Destination Image.
To assess the impact of Infrastructure on Destination Image.
To identify the relationship between tourist satisfaction and future
intention.
To set out and validate a model to determine the impact of infrastructural
facilities on destination image for effective tourism marketing.
To draw conclusions and identify suggestions for destination development
and marketing.
1.10 Research Methods
This research used the combination of quantitative and qualitative data collection
methods and has adopted an approach of observation, literature review, case
study, expert opinion and survey to meet the objectives. The study followed two-
stages, comprising qualitative and quantitative stage.

22
Below given figure 1.2 shows the Research Methods
Figure 1.2 Research Methods
1.11 Research Outcome
The main outcome of the research will be the structural model to explore
the impact of tourism infrastructure on destination image for effective tourism
marketing. Government officials may use this study to identify the tourism specific
infrastructural attributes to enhance tourism offering of the country. Tour operators
Quantitative
Questionnaire Expert opinion
Qualitative
Pilot test (Expert
opinion)
Literature Review Case Study
Validation of the
relationships in the
hypotheses- Expert
opinion
Research Methods

23
and travel industry representatives may use this study to understand the destination
image factors on the tourists' overall holiday satisfaction and future intention of
visiting destination, to ensure the tourist retention. Government tourism agencies and
destination marketers may use this study for a favourable positioning of their
destination, in the minds of the consumers. A key component of this positioning
process is the creation and management of a distinctive and appealing image of the
destination through appropriate marketing strategy. This study will also help to
identify the different marketing approaches for people with different images of a
destination.
1.12 Structure of the report
This report is divided into six chapters.
Following figure 1.3 shows the structure of the report

24
Figure 1.3: Chapterisation - the structure of the report
Literature Review and
Conceptual framework
Introduction
Research Methodology
Data Analysis and
Discussion
Discussion of Findings
Conclusion and
Implications

25
Chapter One: This chapter presents an overview of the tourism industry,
tourism infrastructure, tourism marketing and the importance of destination
image in tourism. In addition, the rationale for the study, significance of study,
research questions, the aim and objectives, research methods, research
outcomes, and the structure of this report are presented.
Chapter Two: This chapter reviews the relevant literature of this study based
on six main concepts: tourism infrastructure, destination image, destination
selection decision, tourism marketing, tourist satisfaction and future intention.
This provides the context for the study and the theoretical basis of the
conceptual framework. In addition, this chapter discusses the summary of the
review of relevant concepts of the study, Structural Equation Modeling in
tourism studies and conceptual framework and hypotheses .
Chapter Three: This chapter gives the details of the research methodology
comprising of the research philosophy, research purpose, logic of research,
research process, methods of data collection, Data Analysis Methods used in
the Research, Case study of Dubai and research phases.
Chapter Four: This chapter presents the data analysis and discussion. This
includes selection of appropriate statistical technique, Partial Least Square
(PLS), the analysis of the Respondents' Socio - demographic characteristics,
a preliminary analysis to determine the impact of tourism infrastructure on
destination image in a comparative context of pre and post destination
image. Further this chapter includes the validation of the research model,
Structural Equation Modelling results and Confirmation of Hypotheses.

26
Chapter Five: This chapter presents the discussion of findings comprising of
the Introduction, key findings of the literature review and survey, general
findings and summary.
Chapter Six: This chapter includes the Introduction, the limitations of this
research, contribution to knowledge, and future areas of the research, as
well as it draws the conclusion of the study.

27
Chapter 2
2. Literature Review and Conceptual framework
2.1 Introduction
This chapter reviews the pertinent literature related to the study and discusses
the link between the variables of the proposed model in the study. The first
section of the literature review provides the review of the Tourism Infrastructure
in the context of Attraction Infrastructure, Accommodation Infrastructure,
Accessibility Infrastructure and Amenity Infrastructure. The following sections
highlight the various aspects of Destination Image, Visitor’s Satisfaction and
Tourist’s future intention. Further, this chapter focuses on the different areas of
Tourism Marketing and the role of tourism infrastructure in marketing
destinations. Also, this chapter review the literature related to the Structural
Equation Modeling in Tourism studies, and finally the last section of this chapter
discusses the conceptual framework and hypotheses.
2.2 Tourism Infrastructure
The tourism phenomenon relies heavily on public utilities and infrastructural
support. Tourism planning and development would not be possible without roads,
airports, harbors, electricity, sewage, and potable water. The infrastructural
dimension is thus a necessary element for tourism development and the above
factors are all basic elements for attracting visitors to a destination.

28
Tourism infrastructure is the supply chain of transport, social and environmental
infrastructure collaborating at a regional level to create a destination. The
destination Infrastructure is a critical determinant of tourism destination
competitiveness (Moreira & Iao, 2014).
According to Grzinic and Saftic (2012) there are 7 actions which can ensure
adequate tourist and related infrastructure: 1) ensure accessibility to and within
the destination, 2) improve the communal infrastructure, 3) develop new
accommodation capacities, 4) advance the service quality of the provided
services, 5) develop the necessary infrastructure, 6) upgrade the existing
accommodation capacities, and 7) focus in destination safety and cleanliness.
Ionel (2013) proposes certain essential elements of successful tourism
infrastructure: (i) Accommodation and catering structures to house tourists; (ii)
Elements like landscape, culture and history, which increase the attractiveness of
a location; (iii) Communications infrastructure which includes transport and
telecommunications; (iv) Civic elements like hospitality, civic education and
aesthetics; (v) recreational and leisure facilities such as sports complexes, art
fairs etc.
Smith (1994) was among the first to acknowledge the role of service
infrastructure in creating a product experience. He argued that “service
infrastructure is housed within the larger macro-environment or physical plant of
the destination” (Smith, 1994). He stressed the fact that the level, use, or lack of
infrastructure and technology in a destination is also visible and determining
features that can enhance the visitors' trip experience. Other authors
subsequently supported his views (Crouch and Ritchie 2000).

29
In Figure 2.1 Crouch and Ritchie (2000) interestingly summarised the various
factors that together make a tourist destination experience attractive. They
highlighted the importance the service infrastructure layer, in the tourist
destination experience.
Figure 2.1 The tourist destination experience. Source: Crouch and Ritchie
(2000)
30
2.2.1 Formation of tourism infrastructure
It has become critically important for destinations to ensure that their
infrastructure facilities are of high standard. The travel industry has seen many
examples of destinations losing both business and their long-term reputation
because they have failed to adequately provide high standards of infrastructure
services and facilities.
Infrastructure is a core area of the tourism industry and plays a distinctive role in
the development of this ever-expanding industry. Travel and Tourism stimulates
investments in new infrastructure, most of which improves the living conditions of
local residents as well as tourists. Tourism development projects can include
many areas of Attractions, Accommodation, Accessibility and Amenities.
Technological advances, such as the Internet, have changed the way that the
guest’s perception about the place to be visited as they have very good
knowledge and pre destination image about the destination. People like to do
different things when they travel. They come from different cultures, have
different likes and dislikes, and of course have different budgets. Some like
active holidays; others just want to sit on a hotel balcony enjoying a good view or
reading a book. Some may want to visit famous sites. Yet others want to shop.
There has to be a good mix and balance between the basic 5 A’s that are
essential to a successful destination. These are Accommodation, Accessibility,
Activities, Amenities, and Attractions (IATA 2015). These same components are
the ones that the destinations need to ensure that they are well-suited for the
guest’s needs. Finally, it is just as important, and perhaps even more important,
to ensure that the destination’s infrastructure standards are also adequate as the

31
tourists are well aware of the wonderful travel and tourism products and services
offered around the world.
Destinations can only succeed in attracting visitors if they have a good choice of
ways to get there, places to stay, and things to do. A destination has to cater in
some shape or form to all these needs. Many destinations are seeking to attract
investment in each of these 5 A’ categories, to offer more choices for visitors.
That holds out yet another earnings opportunity for travel agents.
The formulation of the components of the tourism infrastructure involves
examining the components of the tourism product which are vital to develop an
effective destination. This study considers these components as tourism specific
infrastructural attributes. These can be described with the help of the four A’s
concepts - Attractions; Accommodation; Accessibility and Amenities; and these
concepts of the study have been adapted from Cooper et al. (2008), speaking of
different components of a tourist destination which are characterised as the four
A’s (Attractions, Amenities, Access and Ancillary services), Ann Harlt (2002)
discussing of five A’s (Accessibility; Attractions; Accommodation; Amenities;
Ancillary services) as the destination mix, and IATA (2015) states the 5 A’s
(Accommodation, Accessibility, Activities, Amenities, and Attractions) that are
essential to a successful destination.
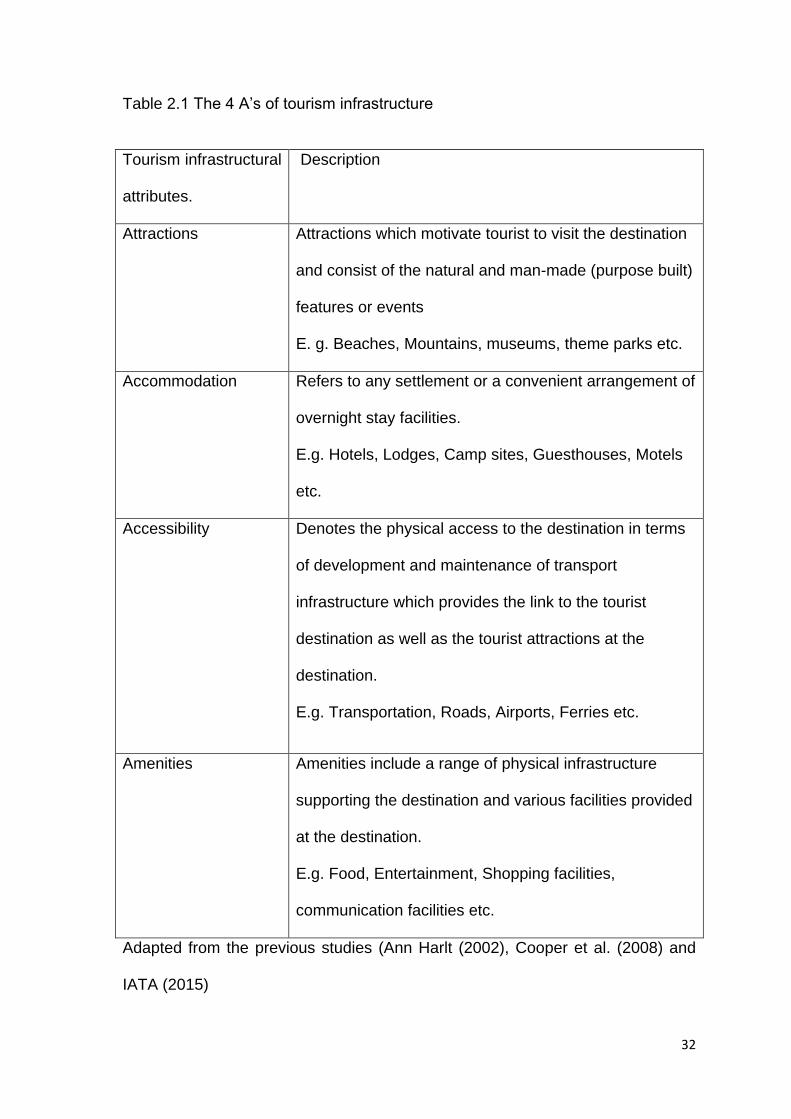
Table 2.1 describes the major aspects of each of the essential 4 A’s of tourism
specific infrastructure.
32
Table 2.1 The 4 A’s of tourism infrastructure
Tourism infrastructural
attributes.
Description
Attractions Attractions which motivate tourist to visit the destination
and consist of the natural and man-made (purpose built)
features or events
E. g. Beaches, Mountains, museums, theme parks etc.
Accommodation Refers to any settlement or a convenient arrangement of
overnight stay facilities.
E.g. Hotels, Lodges, Camp sites, Guesthouses, Motels
etc.
Accessibility Denotes the physical access to the destination in terms
of development and maintenance of transport
infrastructure which provides the link to the tourist
destination as well as the tourist attractions at the
destination.
E.g. Transportation, Roads, Airports, Ferries etc.
Amenities Amenities include a range of physical infrastructure
supporting the destination and various facilities provided
at the destination.
E.g. Food, Entertainment, Shopping facilities,
communication facilities etc.
Adapted from the previous studies (Ann Harlt (2002), Cooper et al. (2008) and
IATA (2015)

33
2.2.2 Attraction Infrastructure
A tourist attraction is a place of interest where tourists visit, typically for its
inherent or exhibited natural or cultural value, historical significance, offering
leisure, recreation, adventure and amusement. On the other hand the term
tourist destination refers to the geographic area that is different from the place of
the permanent residence of a tourist, where tourist activity is implemented and
tourist products are consumed. It is possible to define it as a location of tourist
consumption (Cavlek et al., 2011). Research on tourist attractions has been
undertaken from different approaches and with different definitions of what an
attraction is and how it functions. Attractions are the pivotal element of tourism
development; evidence shows that tourists are more likely to be motivated to visit
destinations that have such resources that can satisfy their needs (Richards,
2006). Wanhill (2008a) used the term imagescape to represent the attraction
product concept. Imagescape condenses history and culture in time and space
into marketable entertainment experiences (Wanhill, 2008b). According to
Pearce (1991) tourist attraction is a named site with a specific human or natural
feature which is the focus of visitor and management attention. Kyle and Chick
(2002) refer attraction to the perceived importance or interest in an activity or a
product, and the pleasure that derives from participation or use. Tourism
attractions determine direction as well as the intensity of tourism development on
the specific tourism receptive area. Swarbrooke (2002), pointed out that the
attraction product is mainly experiential, consisting of both tangible and intangible
elements.

34
An attraction is any object, person, place, or concept that draws people either
geographically or through remote electronic means so that they might have an
experience. The experience can be recreational, spiritual, or otherwise (Milman,
2009; Rivera et al ,2009). In widest context, attraction includes things for the
tourists to see and do, but also services and facilities (Lew 1987; Witt & Moutinho
1994). The growing interest in attraction competitiveness has no doubt brought
about the focus being directed towards the definition and description of the
attraction product, and how visitors consider its different parts (Mehmetoglu and
Abselsen, 2005).
Visitor attractions form the most crucial component of tourism product
(Swarbrooke, 2002; Wanhill, 2003 and Leask, 2003; Richards, 2006; Peypoch
and Solonandrasana, 2007). At the very basic level, they provide the focus for
tourists thereby drawing visitors to a destination; on the other hand, they serve
as agents of change, social enablers and major income generators (Leask,
2003). Basic services, attractions and accessibility affect tourist satisfactions
(Celeste Eusebio et al., 2011).
Many tourism destinations contain natural, cultural and special type of attractions
to attract visitors. According to Page and Connell (2009), the attractions sector
consists of the built environment and the natural environment, in addition to
cultural resources, products, festival and events. Swarbrooke (1995) classifies
attractions into four types: (1) natural, (2) man-made but not originally designed
primarily to attract visitors, (3) man-made and (4) purpose-built to attract visitors
and special events.

35
Many researchers have attempted to evaluate and classify destination
attractions/resources as tourism products (Ferrario, 1976; MacCannell, 1976;
Gunn, 1985; Murphy, 1985; Pearce, 1991; Hu & Ritchie, 1993; Smith, 1994;
Murphy, Pritchard, & Smith, 2000; Yoon, Formica, Uysal, 2001; McKercher et al,
2004; Alan, 2008)
One of the first attempts to characterise a tourist attraction was made by
MacCannell (1976). He divided the attraction into three components: a tourist, a
marker,and a sight. Tourist attraction systems are subsystems within the whole
tourism system. The three elements of the attraction system: the tourist (with
certain needs), the marker (e.g. information) and the nucleus (visited site), are
connected and form the system. According to (Prideaux, 2002) the process by
which a site or event is transformed into a visitor attraction is tourism’s unique
ability to turn natural or man-made resources into products that visitors must
travel to consume. According to Laurent Botti et al, (2008) It is possible for an
attraction the tourist thought of beforehand as a ‘‘secondary’’ attraction to
become a ‘‘primary’’ attraction.
Destination attractions have been considered as tourism supply factors that
represent the driving forces generating tourist demand (Uysal,1998) and also
primary sources or determinants of measuring destination attractiveness (Hu &
Ritchie, 1993; Formaica, 2000).Destination attractions represent a complex
sector of the tourism industry and are the catalytic focus for the development of
tourism infrastructure and services (Alan, 2008).
Gunn (1985) has presented a concentric ring model to analyse tourist attractions.
According to this model tourist attractions are having a nucleus which is the core

36
attraction and successful attraction should have a belt, which provides a context
in which the nucleus or core attraction can be appreciated. Further, Gunn argues
that an outer ring labelled zone of closure is a necessary part of a well-planned
tourist attraction. All visitor service facilities should be in the zone of closure.
According to Adi Weidenfeld (2010) major attractions could have both high and
low levels of iconicity and flagshipness, and these may be lost or gained over
time, depending on factors such as the quality of the tourism product, over-
crowding, quality deterioration, and new competitors.
2.2.3 Accommodation Infrastructure
Accommodation is a fundamental element of the tourism industry (Urtasun &
Gutie´rrez, 2006). It is the largest and most ubiquitous sub-sector within the
tourism economy, accounting for around one-third of total trip expenditure and,
forms an essential ingredient of the tourism experience. The concept of travel
accommodation has transformed itself as Hospitality Industry on account of its
utility in tourism and life away from home. The accommodation service
represents a basic tourist service, an ensemble of benefits offered to tourists
during his stay (Rahovan, 2013).
The hospitality industry in many ways represents the country's growth and
prosperity. The standard of accommodation and the quality and variety of food
available in a destination is a significant component of the impression and image
of that place in the mind of the traveller (Banerjee, 2014).

37
The hotel product is primarily a mix of five characteristics: its location, its mix of
facilities, its image, the services it provides and the price it charges (Holloway
and Taylor, 2006). The accommodation sector can be divided into primary and
supplementary accommodation and commercial and non-commercial
accommodation.
In the primary accommodation like hotels and resorts travellers get
accommodation as well as all other facilities. The facilities include well furnished
rooms, International cuisines, entertainments etc. Supplementary
accommodation offers only accommodation but no other facilities or services of a
hotel.
Non-commercial accommodation is defined as accommodation that is only
concerned with the recovery of costs. Examples include, privately owned
apartments and homes, tents, caravans and motor homes. Conversely, the aim
of the commercial sector is to make a profit and thus, commercial
accommodation covers all forms of accommodation run as a business such as
hotels, bed and breakfast, motels and guest houses. Despite the variety and
diversity of accommodation available to tourists, hotels are usually the most
abundant type of accommodation in urban areas. (Ruth Craggs, 2008)
Apart from the immediate context of the tourism industry, the significance of the
hotel in other social and cultural domains has not been adequately explored.
Global Investments in hospitality Sector have shown increasing trends over the
last few years. Asia is viewed as Top Global Prospect for Hospitality Investment.
Emerging markets in Asia are unseating Europe as the epicenter of new

38
hospitality investment and development, while investors in the United States are
switching their focus from the acquisition of existing hotels to developing new
properties (Ernst & Young 2013)
Tourism is to a great extent dependent on the range and type of accommodation
available at the destination. Accommodation is a core area of the tourist industry
and plays a distinctive role in the development of this ever-expanding industry.
Many countries have recognised the importance of accommodation industry in
relation to tourism and their governments has coordinated their activities with the
industry by providing big incentives and concessions to hoteliers, which have
resulted in the building up of a large number of hotels and other type of
accommodations.
The United Nations Conference on International Travel and Tourism held in
Rome in 1963 considered, in particular, issues relating to means of
accommodation. The conference acknowledged the importance of means of
accommodation, both traditional (hotels, motels) and supplementary (camp,
youth hostels, etc.), as incentives to international tourism (A.K Bhatia, 2007)
It is also crucial to be aware of the tourist attractions within the hotel locality. If
hotels can draw high occupancy throughout the year without relying on seasonal
tourism then diversity can be beneficial.

39
2.2.4 Accessibility Infrastructure
Access is a key infrastructure for tourist destinations. It is particularly important in
regions where tourist attractions are widely dispersed. Accessibility
encompasses roads, railway, airports and various transport facilities.
Easy access to tourism destinations in terms of international transport and
facilities for easy movement within the destinations are generally considered to
be prerequisites for the development of tourism. Kaul (1985) is among the first to
recognize the importance of transport infrastructure as an essential component
of successful development in that it induces the creation of new attractions and
the growth of existing ones.
The importance of infrastructure for tourism has been emphasized by Crouch
and Ritchie, (1999) who analyse the product in the context of comparative and
competitive advantage, they emphasized that, tourism planning and development
would not be possible without roads, airports, harbours, electricity, sewage, and
potable water. The Tourism Task Force (2003) of Australia asserts that
infrastructure is a big part of the tourist equation.
Prideaux (2000) defines the transport system relevant to tourism as ‘‘the
operation of, and interaction between, transport modes, ways and terminals that
support tourists into and out of destinations and also the provision of transport
services within the destination.’’ A good and attractive transportation system
rests to a large extent on quality and availability of transportation infrastructure
comprising air services and airport, land transport systems and routes and water
transport infrastructures as well. In fact the transport system is responsible for

40
connecting tourism origins to tourism destinations and providing transport within
the tourism destination, e.g. to attraction, hotels and shopping. A destination
should be easy to get to and around, particularly if the country is geographically
dispersed.
Visitors are more likely to be reliant on good public links between airports and
city centres and (Law 2002) these are now common in most cities. Studies about
transportation have investigated the linkages and patterns of tourist flows
between origin and destination (Boniface and Cooper, 1994; Pearce, 1995;
Page, 1998; Page, 1999). Considerable focus has also been placed on the
accessibility of destinations for tourists (Hall, 1991; Page and Sinclair, 1992;
Cline, 1998) particularly as a factor of importance in destination choice (Law,
2002). In the case of business and conference tourism accessibility to be the
foremost attribute takes into account when selecting a venue (Bradley, 2002).
Improved transport infrastructure, particularly in the case of road and land
transport, likely leads to reduced cost of transport. Road capacity improvements
such as more lanes, improved reliability, higher quality road surfacing, improved
safety through more and wider lanes and improved signage reduce fuel
consumption, wear and tear, and transit time of traffic. Such hard transport
infrastructure investments do impact on the cost and quality of the tourism
experience (Jameel 2008)

41
2.2.5 Amenity Infrastructure
Tourism amenity infrastructures are structures and facilities that need to be built
to cater for tourists. They are elements which will bring comfort and convenience
to the tourists during their trips. Amenities are tangible or intangible benefits of a
property, especially those that increase its attractiveness or value or that
contributes to its comfort or convenience.
Attractions are in varying forms and types, ranging from natural to man-made but
it is imperative to ensure that the attractions remain constantly updated with the
amenities of the destinations.
Lack of adequate amenities is frequently cited as one of the major obstacles to
tourism development and investment in a destination. All the range of activities in
an attraction will require complementary facilities and the facilities that are
available in a given destination will depend on the type of attraction, location, the
target market and a host of other factors.
Many studies (e.g. Lewis, 1987; Crompton and Love, 1995; O’Neill et al., 1999;
Baker and Crompton, 2000; Nowacki, 2005; Hassan & Iankova, 2012), have
considered amenities as basic or subsidiary factor of a tourist destination and
these factors are necessary for offering a satisfactory tourist experience.
According to Hassan and Iankova (2012), visitors are able to evaluate their prior
perceptions, based on their visit experience of the quality of the existing facilities,
their management and related issues, and this has a strong link with
recommendation and repeat visitations.

42
2.3 Destination Image
One of the important concepts used in understanding tourists' behavior in the
tourism marketing is the destination image tourists have towards destination. The
competitive situation and greater challenges within the tourism industry
worldwide entail a better understanding of destination image (Mahadzirah
Mohamad et al, 2012).For the past three decades; destination image has been a
most established area of tourism research. Research on destination image can
be traced back to the early 1970s with Gunn’s work on how destination image is
formed, and Hunt’s (1975) influential work examining the role of image in tourism
development.
Understanding the images of a destination is essential for a destination wishing
to influence traveler decision-making and choice. The overall destination image
influences not only the destination selection process, but also tourists' behavioral
intentions (Chen and Tsai, 2007; Wang and Hsu, 2010; Qu et al., 2011 ; Zhang
et al. 2014; Wee - Kheng Tan and Cheng-En Wu, 2016 ). Researchers and
marketers tend to be in consensus about the importance of image for a
destination’s viability and success in tourism, because the perception of
destination image relates to decision-making and sales of tourist products and
services (Jenkins, 1999; Tasci & Gartner, 2007).
According to Lee (2009) destination image directly affects satisfaction and
indirectly affects future behaviour. Destination image has been recognized as
one of the influential concepts in tourists’ destination choice process because
image affects the individual’s subjective perception, subsequent behaviour and
destination choice (Jeong & Holland 2012).

43
Destination images have critical dimensions that has a significant influence on
tourist satisfaction (Kandampully & Suharatanto 2003; O’Leary & Deegan 2005;
Loureiro & Gonzalez 2008;) and the future visiting behaviour of tourists
(Kandampully & Suharatanto 2000; Bigné et al. 2001; Lee, Lee et al. 2005;;
Chen & Tsai 2007; Chen & Tsai 2007; Prayag 2009; Campo et. al 2010).
2.3.1 Definition
With regard to the concept of image, there is widespread agreement in the
tourism and marketing literature (Baloglu and Brinberg, 1997; Baloglu and
Mangaloglu, 2001; Chen and Uysal, 2002; Beerli and Martín, 2004a, Pike and
Ryan, 2004 Hosany et al., 2006; Pike, 2009, W.W.Smith et al.,2017 ) in
considering the image as the result of three closely interrelated components: (1)
perceptual/cognitive, which is related to the beliefs of individuals on the attributes
that characterize a destination; (2) emotional/affective, which refers to emotional
response or the feelings that individuals express about the place; and (3) global,
which corresponds to the overall positive or negative impression of the place.
Although many researchers in the tourism field make frequent usage of the term
‘destination image’. A precise definition of it is often avoided (Echtner & Ritchie,
2003). According to Echtner and Ritchie (2003) destination image could be
considered in terms of both an attributed-based component and a holistic
component. In addition, some images of destinations could be based upon
directly observable or measurable characteristics (scenery, attractions,
accommodation facilities, price levels), while others could be based on more

44
abstract, intangible characteristics (friendliness, safety, atmosphere). Kotler
(2002) defines a place/destination’s image as “the sum of beliefs, ideas and
impressions that people have of that place”.
Past definitions of destination image have been various, as demonstrated in
Table 2.2. Several attempts have been undertaken to summarize the definitions.
For example, Gallarza et al. (2002) indicated that “there are almost as many
definitions of image as scholars devoted to its conceptualization” by illustrating
with 12 definitions. Bosque and Martin (2008) also summarized 20 definitions of
destination image. Despite the different definitional constructions, destination
image is generally interpreted as a compilation of beliefs and impressions based
on information processing from various sources over time that result in a mental
representation of the attributes and benefits sought of a destination (e.g.
Crompton, 1979; Gartner, 1993).
Table 2.2 Definitions of destination image
Author/s Definition
Hunt (1971) Impressions that a person or persons
hold about a state in which they do not
reside
Hunt (1975) Perceptions held by potential visitors
about an area
Lawson and Bond-Bovy (1977) An expression of knowledge,
impressions, prejudice, imaginations
and emotional thoughts an individual

45
has of a specific object or place
Crompton (1979) The sum of beliefs, ideas, and
impressions that a person has of a
destination
Phelps (1986) Perceptions or impressions of a place
Tourism Canada (1986-1989) How a country is perceived relative to
others
Gartner & Hunt (1987)
Impressions that a person or persons
hold about a state in which they do not
reside
Richardson &Crompton(1987) Perceptions of vacation attributes
Gartner (1989) A complex combination of various
products and associated attributes
Calantone, et al. (1989) Perceptions of potential tourist
destinations
Embacher and Buttle (1989) Ideas or conceptions held individually
or collectively of the destination under
investigation
Reilly (1990) Not individual traits ... but the total
impression an entity makes" (ref:
Dichter)
Echtner and Ritchie (1991) The perceptions of individual
destination attributes and the holistic
impression made by the destination

46
Gartner (1993) Destination images are developed by
three hierarchically interrelated
components: cognitive, affective, and
conative
Baloglu and McCleary (1999) An individual’s mental representation of
knowledge, feelings, and global
impressions about a destination
Murphy, Pritchard, and Smith (2000) A sum of associations and pieces of
information connected to a destination,
which would include multiple
components of the destination and
personal perception
Bigné et al. (2001) The subjective interpretation of reality
made by the tourist
Kim and Richardson (2003) A totality of impressions, beliefs, ideas,
expectations, and feelings accumulated
toward a place over time
Ahmed et al. (2006)
What tourists think or perceive about a
state as a destination, its tourism
resources, its tourist services, the
hospitality of its host, its social and
cultural norms, and its rules and
regulations which influence their
consumer behaviour.

47
Tasci and Gartner (2007) A destination image is the total sum of
beliefs, convictions and emotional
attachment that individuals have of a
destination that is, the
cognitive/perceptual and affective
images.
Bigné, Sánchez and Sanz, (2009) It consists of all that the destination
evokes in the individual; any idea,
belief, feeling or attitude that tourists
associate with the place.
Adapted from Gallarza et al. (2002) ,Echtner and Ritchie (2003)and Bosque and
Martin (2008).
2.3.2 Infrastructure and Destination image
Infrastructure is highly imperative for tourism development of a tourism resource
rich region, which requires plausible planning and management for the
development of such infrastructure.
Infrastructure provision functions as the nervous system for effective tourism
development and the success of tourism destinations in world markets. It
influences relative competitiveness of destinations or tourist regions (Enright &
Newton, 2004) that focused on destination image or attractiveness (Chon,
Weaver & Kim, 1991;; Hu & Ritchie, 1993; Pritchard & Smith, 2000; Gallarza,
Saura & Garcıa, 2002; Enright et al., 2004; Murphy; Pan, B., & Li, X, 2011)

48
Based on the dimensions and attributes (Beerli & Martın, 2004) of tourism
development, the various types of physical infrastructures that influence tourism
development and create an image of the destination or tourism region are
general/ basic infrastructure, and tourist infrastructure (Decrop, 2010).
Infrastructure services facilitates economic development (Handberg, 2002;
Khadaroo & Seetanah, 2007) in general and so also tourism development.
(Crouch and Ritchie 2000) posited that tourists’ overall impression develops their
image of a destination after their visitation and infrastructure may play an
important role in that respect.
2.3.3 Primary versus secondary image
A differentiation has to be made between primary and secondary image. Primary
image is the information acquired through personal experience or visitation of the
destination. It may differ from the secondary image, which, in contrast, is
basically perceived before experiencing a destination. The secondary image is
formed by organic, induced and autonomous information sources, to which the
consumer is exposed. Obviously, the effect that external information can have
depends considerably on the types and the number of sources. When individuals
actually visit a place, the image they form after visitation is much more realistic
and complex than the one formed through secondary information (Beerli &
Martín, 2014). In this respect, it is suggested that although many people have an
image of destinations they have not yet visited, the most accurate, personal and
comprehensive is formed through going there (Molina, Gómez and Martín-
Consuegra, 2010)

49
2.3.4 Pre-visit versus post-visit image
Another direction towards which different types of destination image research
move is the differentiation between pre- and post-visitors’ image perceptions.
This approach presumes that tourists’ image perceptions vary over time, relating
it somehow to the above examined separation of primary and secondary image.
The pre- & post visit destination images are particularly important and critical to
the success of a destination and, therefore, have been given special attention in
the literature and among market operators (Baloglu and Brinberg, 1997; Baloglu
and Mangaloglu, 2001; Chen and Uysal, 2002; Beerli and Martín, 2004a, Pike
and Ryan, 2004 Hosany et al., 2006; Pike, 2009; W.W.Smith et al.,2017).
When an individual visits somewhere and experiences it first hand, the image
becomes more realistic, complex and differentiated. This experience with the
place is one of the main factors impacting on the image during and after the trip
and is based primarily on the quality of the infrastructure facilities of the
destination. Smith et al. (2015) show that the image is altered throughout a
tourist’s experience, hence, the experience at the destination is what causes a
greater positive change in the image of the destination.
Gallarza, Gil & Calderón (2002) discuss the dynamic nature of the concept,
claiming that image is not static but changes depending on the variables space
and time. According to them, image always corresponds to an interiorisation of
perceptions and not every individual has the same perceptions. They argue that

50
destination image refers to perceptions of tourists at a destination, corresponding
to the perceived contribution of various services to be found there.
Many studies have compared pre-trip and post-trip destination images (Lim,
Chew, Lim & Liu, 2013; Wang & Davidson, 2010; Yilmaz et al., 2009) to find the
variation of destination image. Kim, McKercher and Lee (2009) managed to carry
out a survey over three time periods - before, during and after a trip. The aim of
the study is to keep track of image perceptions of tourists from departure toward
a destination to return to the origin, using the same sample. The investigation
measured Korean tourists’ image change throughout a package tour to Australia.
The results indicate that there is a considerable difference in image change
between cognitive and affective perception.
In line with the above concepts in this study, the pre-visit destination image refers
to the image of a destination held by an arriving tourist and developed thus from
different informational stimulus and the Post-visit destination image is considered
as the consequential image held by the tourists after experiencing the destination
in comparison with the pre-trip image held by the tourist before visiting the
destination.
2.3.5 Destination Image Formation
Gunn (1972) originally suggested a concept of destination image evolution that
accounts for image change from organic image to induced image and has since
become one of the most researched topics in tourism-related research
(Stepchenkova & Mills 2010).

51
MacKay and Fesenmaier (1997) describe destination image formation as “a
composite of individual inputs and marketer inputs”. There are many factors
which influence destination image formation process. According to a model
proposed by Baloglu (1999) image is mainly caused by two major forces:
stimulus factors and personal factors.
Existing literatures (Christina, 2008; Vesna, 2010; Mohammad Reza et.al,2012;
Hongmei Zhang et.al, 2014; Elaine, 2014)show the development of destination
image to be a multi-stage process. Travel consumers’ initial image is formed
though exposure to a variety of information sources, which are beyond the
control of destination marketers. This original image is later on tried to be
manipulated by controlled marketing messages in order to increase the
destination appeal (Hanlan & Kelly, 2005, p. 164).
The formation of destination image is described by Gunn (1988)’s model of
seven phases of travel experience. The relationship between induced and
organic components is demonstrated by Gallarza, Gil & Calderón
(2002,).According to Jenkins (1999) destination images are formed based upon
secondary sources of information, whereas throughout the later phases actual
first-hand experience modifies these images. The study conducted by He´ctor
et.al (2008) found that destination image is a multidimensional concept formed
by cognitive and affective evaluations of a place. The majorities of destination
image studies focused on cognitive component (e.g., Echtner & Ritchie, 1993;
Chen & Uysal 2002) and overlook the affective component.
Tourists’ evaluation of destinations comprised of cognitive, affective and
personality dimensions. Destination marketers, in order to create a favourable

52
image, are required to devise branding strategies that encompasses the three
dimensions (Hosany, S, 2007).
2.3.6 Factors Influencing Image formation
Beerli and Martín (2004) recognise a set of factors which have an influence on
the formation of image. They have categorised the factors into two main
categories; personal factors and information sources which will lead to cognitive,
affective and at the end to overall image of a destination. Numerous researchers
have based their studies on the notion that information is positively related to
image (Frías, Rodríguez & Castañeda, 2008).
Mayo and Jarvis (1981) describe personal interest, needs and motives,
expectations, personality, social position, and standard demographic factors as
influential on the image held by the traveller. The study conducted by Raquel
Camprubi et.al (2013) identifies that tourists have become an agent with an
active role in the process of destination image formation, through their direct and
spontaneous contributions in blogs, forums, social network sites, etc
The following researcher’s studies have found that destination image is
influenced by external stimuli such as advertising, news, and communication
promotions (Chon, 1991; Fakeye & Crompton, 1991; Beerli & Martín, 2004; Kim
& Morrison, 2005; Yüksel & Akgül, 2007; Baker, M.J & Cameron, E. 2008;
Andrew Lepp et.al 2011; Chul Jeong & Stephen Holland 2012).

53
A study by Baloglu, and Mccleary (1999) examined the image formation process
through a most comprehensible path model, and it clearly illustrates the
differentiation and interrelationships between the personal factors and the
stimulus factors. The model as illustrated in Figure 2.2, which presents a general
framework of destination image formation. In this model, image is mainly caused
by two major forces: stimulus factors and personal factors. They linked the
personal factors like age and education variables with stimulus factors like
variety of destination information sources and socio psychological motivations to
the overall image and the affective association developed towards a destination.
Figure 2.2 Framework of Destination Image Formation Agents
Source: Baloglu, 1999
Personal factors
Psychological
• Values
• Motivation
• Personality
Social
• Age
• Education
• Marital status
• Others
Destination Image
• Cognitive
• Affective
• Global
Stimulus factors
Information
sources
• Amount
• Type
Previous
experience
Distribution
54
2.3.7 Destination image and Destination selection decision
A relation exists between what someone has in mind and their preferences in
decision making while selecting a destination. Decision on choosing a
destination to visit is associated with beliefs and cognition. According to Lin et al.,
2007, The views about a destination, which plays an significant part in the
decision making process is a collection of ideas, beliefs and perceptions people
have about the daily happenings in a destination and the attributes they attach
with the destination . This ends up in creating an image in an individual‘s mind
about that destination (Echtner & Ritchie 1993). However studies conducted
showed that stereotypes of images about a destination are reflected in the travel
decisions. Pre purchase impressions, and post purchase views formulate
consumer‘s attributes towards a product. This can be called a stereotype of the
destination‘s image (Lin et al., 2007). Destination selection criteria have focused
on specific destination characteristics and the visitor‘s decision about a
destination to visit is also associated with these specific destination
characteristics.
A destination‘s image have an impact on visitor‘s preferences and final decision
on destination. However not all destination images are built up from cognitive
and affective conceptions do have an influence on visitors destination choices
(Lin et al., 2007). But a lack of knowledge surely about a place would normally
only give room for a more holistic perception (Jang et al., 2007). So it is essential
to create an image of the destination to be visited.
According to Emilio Celottoab. et al, (2015) the decision-making process
concerning tourism destination choices is strictly related to the information

55
gathered through different information sources, especially online. Viral diffusion
of information through social communities influences and promotes the image
and reputation of a tourist destination.
According to Fesenmaier & Jeng (2000) general studies about destination
choices by visitors have been explored through various decision making channel
processes. Coathup (1999) suggests that as people‘s knowledge widen about
new things and areas, their desire for adventure, new opportunities and
experiences also changes. These could be reflected in the choices they make
about destinations to visit.
Gartner, (1993) states destination selection decision is a function of information
available from different sources. According to Murphy et al (2007) in recent
studies, travellers that love risk and want adventure did not seek a lot of
information. But those who feared risk not only gathered information but also
considered particular vacations and lodging facilities. Information search
depends on destination desires and the different stages involved in the travelling
itself. This would probably lead to variations at each stage of the journey that is
the to and fro planning of the journey (Murphy et al, 2007). A destination
marketer has been considered as a very important source of information and has
a special influence on first time visitors.
The differences between first-time and repeat visitors are receiving renewed
interests among tourism researchers (Anwar & Sohail, 2004; Fallon & Schofield,
2004; Hughes & Morrison-Saunders, 2002; Kemperman, Joh, & Timmermans,
2003; Shanka & Taylor, 2004). Understanding the differences of first-time and
repeat visitors has vital importance in developing effective tourism marketing and

56
management strategies as well as in building travel motivation and decision-
making theories (Lau & McKercher, 2004; Oppermann, 1997; Petrick, 2004) as
they have different images of the destination. Specifically, information regarding
tourists’ status as first-time or repeat visitors can be useful in market
segmentation (Formica & Uysal, 1998) and signalling destination familiarity
(Tideswell & Faulkner, 1999). In the case of repeat visitors the post destination
image or the image created by the destination in the mind of the tourists after the
visitation helps the marketers to easily influence the tourist’s destination selection
decision.
Many studies undoubtedly showed that various information collection about
destination visitations are related to visitor‘s actions and choices, but the image
created by the information provided by the marketers about the destination
facilities & services are the main source of destination selection decision.
Therefore the decision to visit a destination is rely on the destination image.
2.4 Tourist satisfaction
Tourist satisfaction is important to successful destination marketing because it
influences the choice of destination, the consumption of products and services,
and the decision to return (Kozak & Rimmington, 2000).
In the consumer behaviour literature, satisfaction is defined as consumer
fulfilment responses to attitudes that include such things as judgments following
a purchase or a series of consumer product interactions (Lovelock & Wirthz
2010). In the tourism literature, destination satisfaction refers to the emotional

57
state reflected in a tourist’s post-exposure assessment of a destination (Baker &
Crompton 2000; Su et al. 2011). Destinations that can identify attributes that
satisfy tourists increase their chances of having loyal tourists (McDowall 2010).
Satisfied tourists are most likely to recommend destinations they have visited to
their friends and relatives or express favourable comments about the destination
(Mohammed Bala Banki et al, 2014). In contrast, dissatisfied tourists may not
return to the same destination and may not recommend it to other tourists (Chen
& Chen 2010). Even worse, dissatisfied tourists may express negative comments
about a destination and damage its market reputation (Reisinger & Turner 2003).
In a study of tourists visiting Mallorca, Spain, Kozak & Remington (2000)
reported that the more satisfied the tourists were with their visits, the more likely
they were to return and recommend the destination to others. Tourist satisfaction
influences destination choices (Cole & Crompton 2003) and future behaviours
(Bigné et al. 2001; Tian Cole et al. 2002; Lee 2007). Satisfaction comprises both
cognitive and emotional facets and relates to previous experiences, expectations
and social networks (Keegan et al, 2002).
According to Heskett et al (1997) increased customer satisfaction results in
retention and positive word-of-mouth, which subsequently lower marketing costs
and increase profit. A large number of studies have been conducted in the area
of visitor satisfaction in the tourism and related areas (Weber, 1997; Reisinger &
Turner, 1997; Bramwell, 1998; Choi and Chu, 2000; Bowen, 2001; Eggert and
Ulaga 2002; Yuksel and Yuksel, 2003; Millan and Esteban, 2004; Bigne et al.,
2005; Bowie and Chang, 2005; Sarngadharan and Retnakumari 2005; Yu and
Goulden, 2006; del Bosque & Martin, 2008 M. Karunanithy and S. Sivesan,

58
2013). These include tourist satisfaction with destination services, service
providers, intermediaries, recreational facilities, tours, hotel services, restaurant
services, host culture and so forth.
Lee et al., 2007 note that satisfaction describes a visitor’s experiences, which are
the end state of a psychological process (Lee et al., 2007).but according to
Eggert and Ulaga (2002) on the one hand, satisfaction evidently derives from a
cognitive process in which performance is compared against some evaluation
standard, and on the other hand, it entails feeling which is essentially an affective
state of mind.
Quality is an important element for satisfaction even though satisfaction is not
exclusively achieved through service quality. A number of studies have been
conducted related to satisfaction and service quality (Baker and Crompton, 2000;
Brady, Cronin and Brand, 2002; Millan and Esteban, 2004; Cole and Illum, 2006;
Lee et al, 2007).
Tourist Satisfactions is measured by expectation met by the general attribute
satisfaction (i.e. attractions, accommodation, accessibility and amenities).
According to Chi, C. G. et al. (2008) the satisfaction attributes include attractions,
accessibility, lodging, dining, shopping, activities and events and environment.
Studies conducted on the satisfaction assessment shows that destinations have
focused on identifying various quality dimensions of the holiday experience and
its impact on the satisfaction with the holiday experience. A study conducted by
Yuksel (2001) on the satisfaction of tourists with turkey identified 16 factors, of
which ten factors were found more influential in effecting tourist satisfaction than

59
other factors. The study revealed the impact of accommodation facilities, food
quality, variety of experience, convenience of access to tourist facilities and
service quality on the tourist satisfaction. All these studies related to satisfaction
and service quality reveals the impact of infrastructural facilities on tourists’
satisfaction, because among the attributes, the top drivers of satisfaction for all
visitors were accommodation services, food services and cuisine and variety of
things to see and do.
Satisfaction studies in tourism and hospitality has indicated that tourists’
satisfaction with individual attributes of the destination leads to the overall
satisfaction with the destination.
It is significant in tourism to identify overall satisfaction from satisfaction with
individual components; because the specific characteristics of tourism have a
notable influence on tourist satisfaction (Seaton & Benett, 1996)
2.4.1 Destination image and tourist satisfaction
Tourist satisfaction has become a considerably important area for both scholars
and practitioners and has been the topic of intense academic debate in the
marketing literature. According to Lee (2009) tourist satisfaction has been
directly affected by destination image. Destination image has been recognized
as one of the influential concepts in tourists’ destination choice process. Such
causal linkage can therefore help tourism professionals and researchers to
understand the importance of tourist satisfaction (Song et al., 2010).
60
Previous researches indicate that destination image can influence tourist
satisfaction and subsequent future behaviors (e.g. Javier and Bign 2001,
Christina & Hailin, 2008, Lee, 2009, Prebensen, Skallerud, & Chen, 2010, Chen
and Lin, 2012 ; Ozdemir et al., 2012 ; Wee - Kheng Tan and Cheng-En Wu,
2016). According to Prayag et al (2011) and Prayag (2012) destination image,
personal involvement, place attachment and overall satisfaction influence
satisfaction of tourists.
Middleton and Clarke (2001) highlighted interdependence-sub-sector interlinkage
of tourism products. Tourists experience a combination of services such as
attractions, hotels, accessibilities, amenities, etc.; and they may evaluate each
service component separately. According to Kozak & Rimmington (2000),
satisfaction with various factors of the destination leads to overall satisfaction.
Pizam & Ellis (1999) states that overall satisfaction with a hospitality experience
is a function of satisfactions with the individual elements/attributes of all the
products/services that make up the experience, such as accommodation,
weather, natural environment, social environment, etc. Satisfaction has a positive
influence on future intention to return to the same destination.
Destination image is an antecedent of satisfaction and tourist satisfaction would
improve if the destination has a positive image. (Christina & Hailin,
2008). Destination image has a positive influence on perceived quality and
satisfaction. A favourable image deriving from a favourable travel experiences
would end in a favourable evaluation of a tourist destination.

61
2.5 Tourist’s future intention
The success of a destination has much to do with having and maintaining the
primary products and services that are designed to meet the needs and satisfy
the travelers’ objective and eventually deliver the added value to the visit (Laws,
1995; Murphy et al., 2000; Holloway, 2006; Weaver and Lawton, 2006). Some
empirical studies have acknowledged that many tourist destinations rely
seriously on repeat visitors (Jayarman et al., 2010). Rayviscic and Melphon
(2012) conducted a study in Kenya explored specific key factors that determine
the choice of a domestic tourist destination include the need for knowledge and
adventure; economic concerns; destination Information and travel arrangement.
This study provides a simple and relatively cost effective application of the
destination choice model.
Post visit evaluation would lead to tourists’ intention to recommend and revisit a
destination (Weber, 1997; Kozak and Rimmington, 2000, Hui, Wan and Ho,
2007). It is common that tourists evaluate their experience at the end of their visit
based on their encounters with the various elements at the destination.
Destination elements and emotion are influential in determining tourist future
intentions. Satisfactory performance of destination features would elicit the right
emotions and ultimately lead to favorable future behavioral intentions (Basri
Rashid, 2013). According to Ahmad Puad et al. (2012) repeat visitors intend to
revisit as well as recommend holiday destination in future. Tourists’ positive
experience of service products and other resources provided by tourism
destination could produce repeat visits as well as positive Word of mouth effects
to friends and/or relatives” (Chi & Qu, 2008).
62
Since the 2000s, a number of studies (Kashyap & Bojanic, 2000; Kozak, 2001;
Petrick, et al., 2001 ; Petrick & Backman, 2002; Um, 2006; Lai, et al., 2010; Fu
et al., 2016; Wee - Kheng Tan and Cheng-En Wu, 2016) have explored tourist’s
revisit intentions to predict and explain tourists’ intentions to engage in diverse
types of tourism or visit different destinations. Intention to revisit is crucial as it
indicates customer loyalty, which is a key indicator of successful destination
development and helps in increasing the competitiveness of tourist destinations
(Yoon and Uysal, 2005; Chen and Phou, 2013 ; Zhang et al., 2014; Wee - Kheng
Tan and Cheng-En Wu, 2016 ).
Mostafavi Shirazi & Mat Som (2010) found repeat visitation as an indicator of
loyalty in tourist destination that is strongly affected by destination attributes. In
their study, diversification of attractions has been found as one of the necessary
conditions for explaining repeat visitations. According to Kotler et al. (2006)
customer expectations must be met or exceeded to create loyalty as an aspect of
behavioural intention.
From consumption process’s perspective, tourists’ behavior is divided into three
stages including: pre-visitation, during visitation, and post visitation (Rayan,
2002; William & Buswell, 2003). Chen & Tsai (2007) stated that tourists’
behaviors include choice of destination to visit, subsequent evaluations, and
future behavioral intentions.
If a tourist is satisfied, they may repeat their visit to the same destination and
also they will give positive word-of mouth recommendations for the destination to
friends, colleagues and family (Anwar, S., & Sohail, M. 2004;Yoon, Y. and Uysal,
M. 2005). If tourists' actual experiences are positive, destination image will also

63
be positive and this plays a significant role in future intention and repurchase
decisions. (Kozak and Rimmington, 2000; Yuksel and Yuksel, 2001).
According to Prayag. G (2009) destination image has a direct and an indirect
influence over future behavior. Satisfaction and overall image play a mediating
role between destination image and future behaviour.
2.5.1 Tourist Satisfaction and future intention
Tourist satisfaction has been measured by summation of tourist evaluation of
destination attributes (Kozak & Rimmington, 2000; Kozak, 2003). This kind of
satisfaction measurement can be regarded as an evaluation of the quality of
destination performance, where tourists are satisfied not only with what they
experience; that is, how they were treated and served at a destination (Um,
Chon, & Ro, 2006), but also how they felt during the service encounter (Baker &
Crompton, 2000).
Many studies related to the tourism and hospitality industry and specific tourism
related businesses has been widely acknowledged the importance of tourist
satisfaction (Baker and Crompton 2000; Song et al. 2012; Sun and Kim 2013)
Tourist satisfaction is considered to be a great predictor for future behavioral
intentions in many natures of tourism destinations (Prayag, 2009). According to
Pryag(2009) Quality attributes have significant positive influence on tourist
satisfaction and a positive relationship also occurs between tourist satisfaction on
future behavioural intentions.

64
According to Milman and Pizam (1995) once visitors are satisfied with their
experience they might like to revisit a destination. A study conducted by Joppe,
Martin, and Waalen (2001) and Bigne´ et al. (2001) found that satisfied visitors
are more likely to recommend the destination to friends, family, and colleagues.
In contrast, dissatisfied tourists may not recommend it to others or may not return
to the same destination (Chen & Chen 2010).
2.6 Tourism Marketing
As tourism industry is usually classified as the part of the service sector of the
economy, the marketing principles applied in tourism will be based on the
general service marketing principles. Destinations across the world heavily
compete with each other, in order to maintain their attractiveness and
competitiveness in the global tourist industry. In order to do so, it is necessary for
destination authorities to do proper destination marketing by identifying different
needs of different market segments, as well as promote their image and manage
destinations in a way that attracts tourists. Wang (2008) stresses the relevance
of collaborative action, suggesting that “destination marketing is a collective effort
that requires various organizations and businesses in a geographically limited
area to harmoniously work together to achieve a common goal.”
Tourism marketing could be complex due to the product being an amalgam of
many different industries such as accommodation and transportation. The
markets also vary widely, and determining the consumers´ preferences could be
difficult.

65
According to Buhalis & Michopoulou, (2011) destinations need to effectively
implement Destination Marketing, the term referring to promoting tourist
destinations as a means of improving their imagery and popularity. At the
destination level, the marketing effort is further complicated by certain aspects
which represent the challenges faced by the destination marketers. This refers to
the various marketing dimensions within which the total tourism industry
operates.
Destination Marketing takes place at two levels (Koutoulas and Zoyganeli, 2007).
At the micro-level, independent tourist operators, such as hotels and
transportation agencies, which promote the products and services they offer in
the industry. At the macro-level, governments and other official authorities
promote their countries and states as tourist destinations
According to Gilmore (2003), service marketing dimensions for the tourism sector
reflect the range and the multidimensional nature of tourism service products,
managing the tourism product, importance of effective and consistent service
delivery and the communication message and region's image. These dimensions
are illustrated in Table 2.3

66
Table 2.3. Service Dimensions for Tourism Marketing; Sourse:Gilmore, 2000
Range and nature
Effective and
Communication
Managing the tourism
product
Effective
consistent service
delivery
Communication
Message and
regions image
Geographical area
Unique sites
Manmade facilities
Destination facilities
Accessibility
Images
Price range
Differentiation and
positioning
destination image
Developing/marketing
tourism brand
Looking for new
markets
Physical
infrastructure
Facilities and
service
People involved in
the service
delivery
Public and press
messages
Branding Image
building
Marketing the tourism product at the destination involves differentiating and
positioning a destination with strong destination image, developing and
marketing a tourism brand and looking for new or niche markets. To achieve this,
companies involved in the tourism sector need to come together to integrate their
market focus and offerings. For this, a strongly integrated tourism service needs
to evolve and strengthen overtime before an appropriate brand can be developed
based on the overall market positioning of the tourism service product.
Marketing activities may convince visitors to decide to visit a destination or to
extent their stay in a destination.

67
2.6.1 An overview of destination marketing
Destination marketing facilitates the success of tourism policy, which should
ideally be in line with the strategic plan for overall regional development (Buhalis,
2000). Marketing has the power to positively influence destination development.
Baker and Cameron (2007) point out that destination marketing involves using
tourism for reasons like improving the overall image of the area in order to attract
industry, increasing infrastructure that can also be used by the local community,
achieving changes in the environment, or giving the locals more pride in their
area.
The balance between what is expected and what is being delivered is essential
in promoting the destination. On an individual basis, destinations do not have
much control over the marketing of the destination product. Destination
marketing offices (DMO) are usually created to take on the great responsibility
for tourism promotion and visitor attraction and should ideally satisfy the needs of
all the stakeholders. Additionally in destination marketing the public sector,
destination marketing offices and national tourist organisations should have
enough resources, proficiency or flexibility to promote the destination. However,
marketing should satisfy all stakeholders involved with the destination. Therefore,
there is an expressed need for collaboration and knowledge-exchange between
the different stakeholders. According to Baker and Cameron (2007), the local
government usually plays an important role in maintaining relationships between
the public and private in destination marketing.
Advancing the view that a destination is one of the most difficult products to
manage and market (Fyall and Leask 2007). As most of the products at the

68
tourist’s destinations are basically intangible in nature the destination should find
suitable marketing solutions that benefit both the whole destination and also its
actors.
A key goal of the marketing activities for any destination marketing organisation
(DMO) is to achieve a competitive market position for the destination. A
destination's market position will change positively only slowly over time (Steven
Pike 2017). A core construct in market positioning is destination image, requiring
an understanding of perceived strengths and weaknesses relative to the
competitive set of rivals for any given travel context.
2.6.2 Determinants of Destination Marketing
The key determinant of Destination Marketing is an issue which has been
broadly discussed in the academic literature. Chaitip et al. (2008) investigates
the factors which determine the success in a tourist destination. For that
purpose, the authors conducted a survey in Greece. The results of this paper
indicated that destination marketing efficiency is influenced by four factors,
namely:
Satisfaction of the travel cost,
The integrated tourism product,
Tourism product attributes and
Tourism product management.

69
These factors are determined by several attributes. To begin with, the tourism
product is formulated by the satisfaction of the tourists from the sea, the sun, the
beaches, the mountains, the hotels, the market places and the restaurants of a
destination. Tourism product management is determined by the attractions, the
amenities, the accesses and the image of a destination. Lastly, the satisfaction of
the travel cost of tourists is determined by the airline cost, the hotel and the
guesthouse cost, and the total cost of the domestic trip in Greece.
Furthermore, Buhalis (2001) distinguishes three strategic directions that can
enhance destination marketing efficiency:
1) Enhance the satisfaction of tourist and delight the visitor,
2) Strengthen the long term competitiveness and profitability of the local
tourism industry and of the local small and medium-sized tourism
enterprises, and
3) Develop the sustainability of the destinations and ensure prosperity of
host population.
Each of these three directions incorporates several strategic objectives. More
particularly for enhancing the satisfaction of the visitors, destinations and tourism
enterprises should improve their services, specialize their tourism product and
offer value - for - money tourism services by focusing on quality.
Moreover, Stankovic et al. (2012) support that destination marketing efficiency is
highly depended in the organization of cultural and sport events. More
specifically, the authors support that events and festivals – sport and cultural –
can help a destination to improve its image and its popularity. It is indicative that

70
the writers state that: A special interest attraction can have a significant effect on
shaping the image of the local community.
2.6.3 Destination image and tourism marketing
In tourism research, images are more important than any tangible resources
because what motivates consumers to act or not to act are perceptions, rather
than reality (Gallarza, Gil & Calderón, 2002). One of the important concepts used
in understanding tourists' behavior in the tourism marketing is the destination
image tourists have towards destination.
Understanding the image development process and the nature of image offers
tourism and destination marketers to position their destination effectively in target
market segments. Tourist perceptions are important to successful destination
marketing because they influence the choice of a destination, and majority of
tourists have experiences with other destinations, and their perceptions are
influenced by comparisons among facilities, attractions, and service standards
(Ahmed, 1991).
Lopes (2011), Echtner and Ritchie (2003), and Stabler (1988) underline the
crucial role of destination image in the destination marketing perspective. More
specifically, Lopes (2011) supports that when tourists choose a tourist
destination are influenced significantly by the image of the destination. In this
context the researcher mentions the factors which determine the image in
tourism destinations, namely: the perceptions of the visitors, the effectiveness of
tourism marketing activities, the educational background of the visitors, the social

71
and economic characteristics of the tourists, the motives of the visitors, the
media (TV, magazines, newspaper, books, etc.), the experiences of the tourists
and the psychological characteristics of the visitors (Stabler, 1988 cited by
Lopes, 2011). Lopes (2011) distinguish two types of destination image: primary
image and secondary image.
The primary image is the image that a visitor has after visiting a destination and
recalls his / hers experience. In contrast, secondary image is the image that a
tourist has before visiting the destination. Destination marketers should consider
both types of images in order to design efficient campaigns.
In addition, some images of destination could be based on observable or
measurable characteristics. Destination image is defined as not only the
perceptions of individual destination attributes but also the holistic impression
made by the destination. Destination image consists of functional characteristics,
concerning the more tangible aspects of the destination, and psychological
characteristics, concerning the more intangible aspects.
According to Echtner and Ritchie (2003) from the tourism industry perspective
important factors which determine the image of a destination are: the scenery
and the natural attractions, pricing strategies, hospitality and friendliness,
climate, tourist activities, nightlife and entertainment, sport facilities, national
parks and museums, local infrastructure and transportation, and accommodation
facilities.
Tasci and Gartner (2007) point out that: First, [from the demand-side] destination
oriented marketing activities are dynamic (controllable) factors that aim to polish

72
and project a positive image for the destination. These marketing activities, or
induced image formation agents, are what try to manipulate uncontrollable or
static destination characteristics and turn them into semi-controllable or semi-
dynamic inputs. Independent sources of determinants (autonomous image
formation agents), which are usually out of a destination marketers’ immediate
control, might work for or against the projected, induced image. Similar to
destination marketing activities, independent determinants might reflect objective
reality.
Destination authorities might adjust and modify their marketing activities
depending on the information reflected by these independent and autonomous
sources (Tasci & Gartner, 2007).
According to Mayo (1975) tourists do not have a lot of knowledge about
destinations which they have not visited, but despite this fact, they are able to
create an image in their minds not only of the ideal destination, but also of
alternative destinations. Tasci, Gartner, and Cavusgil (2007) go further, by
suggesting that the essence of Destination Image is to find how tourism
destinations are seen and felt by the tourists’ eyes. Thus, the tourists’ images are
vital for marketing strategies to be successful.
Many tourism scholars focus their attention on the holistic nature of the image,
defining destination image as the expression of all the knowledge, impressions,
prejudices and emotional thoughts that an individual or group has of a particular
object or place (Alcaniz et al. 2008). Because of this holistic nature, image plays
an integral role in successful destination marketing (Tasci & Gartner 2007), and
thus, destinations with strong positive images are more likely to be considered

73
and selected by consumers (Echtner & Ritchie 2003; Prayag 2009). Therefore,
destination marketers have sought to identify the most effective factors that
influence a destination image. Thus, the image of a destination becomes
significantly effective for the decisions of tourists (Yilmaz et al. 2009).
2.6.4 The interrelationship between destination marketing and destination
image
Destination image is considered as a vital marketing concept in the tourism
industry and it is linked to the success of a tourism destination. Destinations
today have to deal with a variety of new challenges in their effort to gain and
maintain a competitive advantage. Smart destinations, which have emerged out
of the concept of smart cities, particularly highlight the significance of synergies
between stakeholders and of addressing travelers׳ needs before, during and
after their trip (Buhalis & Amaranggana, 2013). Within this context, it is important
to consider the pivotal role of destination marketing to attract potential tourist by
creating a favourable destination image through various marketing strategies.
The research studies on tourism marketing (Moutinho, 1987, Baloglu and
Brinberg, 1997, Baloglu and McCleary, 1999a, Baloglu and McCleary,
1999b, Beerli and Martín, 2004) refer to an image as a concept formed through
the consumer's rational and emotional interpretation, the two of which are closely
intertwined. The indications here always point in the same direction: to improve
the destination image and its position with regard to competing destinations,
such as those with similar characteristics.

74
Numerous researchers have concentrated on image in relation to tourism
marketing functions and aspects. Specifically, some of them relate destination
image importance to its effect on demand-side aspects, such us tourism
consumer behavior, destination choice and decision making, while others
attribute destination image importance to its effect on supply-side aspects,
namely, positioning and promotion.
Tourism destination image, or the overall impression of one place (Crompton,
1979 and Bigne et al., 2001), is one of the most studied areas in tourism
literature (Stepchenkova & Morrison, 2008). The notion of image has been
widely used by marketing and behavioral science scholars to refer to people’s
perception of a product, store, or corporate entity (Spector, 1961, Jain and Etgar,
1976 and Hampton et al., 1987). Tourism researchers applied this idea to
destination studies, and expanded the image definition to “include the
perceptions or impressions a person has of a place” (McClinchey, 1999,).
Although tourism scholars have come up with numerous definitions of tourism
destination image (Li & Vogelsong, 2006), most tend to agree that tourism
destination image is the overall impression of one place (Li, Pan, Zhang & Smith,
2009).
Tourism literature, in general, indicates that what a prospective traveler believes
or thinks about the environment, climate, people, infrastructure, quality of a
place, may shape perceptions or images which will contribute, or not, to the
selection of this place by the traveler (Vitouladiti, 2003).
Generally, marketers’ strong interest in the concept of destination image is based
on the simple fact that it relates to decision-making and consequently to

75
profitable sales of tourist products and services. National tourist offices often
study the images held by potential visitors and use the results for market
segmentation, brand development and subsequent promotion campaigns. In
most cases, the potential visitors have never been at the destination before they
decide to purchase the travel product. Due to this intangibility, the marketing mix,
and especially the pricing component, plays an important role when it comes to
the image of a destination (Buhalis, 2000). Imagery can also be used to increase
past visitors’ remembered satisfaction with the place. In that case, the aim is to
encourage repeat visits and purchases (Jenkins, 1999). Therefore, as Sirakaya,
Sonmez and Choi (2001) propose, it is essential to know at what point images
actually influence the consumer’s selection of a particular destination instead of
another place. In fact, individuals are aware of a multitude of destinations and
hence hold a unique image of each of them. As there is huge number of
destinations available, only successful marketing and branding can differentiate
them from each other. Molina, Gómez and Martín-Consuegra (2010) concentrate
the immense significance of image for marketers in saying that it is one of the
few instruments that can help differentiate a destination from its countless
competitors in today’s increasingly competitive market.
2.6.5 The role of tourism infrastructure in marketing destinations
Infrastructure provision functions as the nervous system for effective tourism
development and the success of tourism destinations in world markets. It
influences relative competitiveness of destinations or tourist regions (Enright &
Newton, 2004). It is imperative to consider the role of tourism infrastructure and

76
how it can be utilized and further enhanced to contribute to the effective
marketing of a destination. In this regard it is also essential to consider how
tourism infrastructure can be incorporated in the marketing and promotion of a
tourist attracting region. Though success of a tourism product is strongly
supported by the positive marketing effects, (Lee et al., 2011; Moutinho et al.,
2011; Sotiriadis and van Zyl, 2013) tourism infrastructure holds much potential to
attract visitors and to enhance sustainability in tourism, whereby the tourism
planner and the entrepreneur should work hand in hand to satisfy the
consumers; contribute to the authenticity of the destination; strengthen the local
economy; and provide for the environmentally-friendly infrastructure.
Infrastructure is a core area of the tourism industry and plays a distinctive role in
the development of this ever-expanding industry. The decision-making process
concerning tourism destination selections is strictly related to the availability of
tourism infrastructure - attractions, accommodation, accessibility and amenities.
Tourism infrastructure act as push and pull market factors of travel industry.
Marketing has the power to positively influence destination selection and it is
very easy to promote a region which is already been developed as a tourist
destination with all means of infrastructural facilities. Tourism marketing could be
very complex if the destinations lack the infrastructural facilities. So infrastructure
is highly imperative to develop an image of the destination for effective
marketing. According to Buhalis & Michopoulou, (2011) destinations need to
effectively implement destination marketing, the term referring to promoting
tourist destinations as a means of improving their imagery and popularity. The
various types of physical infrastructures and services create image of the
destinations and destination image has been recognized as one of the influential

77
concepts in tourists’ destination choice process because image affects the
individual’s subjective perception, subsequent behaviour and destination choice
(Jeong & Holland 2012).
2.6.6 People – the 5th P’ of Marketing Mix
Marketing mix is not a scientific theory, but merely a conceptual framework that
identifies the principal decision making managers make in configuring their
offerings to suit consumers’ needs” (Goi, 2009, p.2)
From the complete understanding of the target customers, a company can move
on to developing a marketing mix designed to fit the company’s goals. The fact,
that a strong competitive advantage can be created and maintained by effectively
balancing the marketing mix. Managing the mix means making decisions on all
the marketing tools, driven from the need to be superior to the competition and
satisfy the customer even better.
Traditionally, marketing practise has been structured around the concept of the 4
P’s, which was developed by Harvard University Professor Neil Borden ( Borden
1964, McCarthy 1975). The original four components are product, place, price,
and promotion and in the service marketing the People, Physical evidence and
Process are added (Gary and Kotler 2014). This has been adapted in tourism
and hospitality marketing as the 7 Ps of Marketing (Shoemaker & Shaw 2008,
Morrison 2010). While destination marketers usually have an active interest in
each of these, Destination Management Organizations(DMOs) actually have
limited influence over the practises of their destination’s service suppliers, and

78
external intermediaries, in relation to all but one of the 4 Ps (Schmallegger,
Taylor & Carson, 2011, Pike & Page 2014). A firm may use one marketing mix
to reach to one target market and a second, somehow different marketing mix to
reach to another target market” (Pride et al, 2009). In order to have an effective
marketing strategy, it is crucial to have all these seven elements organized to a
balanced marketing mix (John & Jobber 2012).
People are the fifth P in marketing mix, and a very important value-adding
element in service marketing. In travel business the product is consumed and
produced at the same time, which makes the matters of personnel highly
relevant.
In the tourism and hospitality organization, people refer to the human resource
and it plays important role in performing, quality control and personal selling
(Kotler, 2007). If the employees do not have the right attitude towards their work
and serving customers, they can be the factor causing failure for delivering good
service (Kumar 2010)
Having a professional and understanding person open to any questions or
problems regarding the product means plenty to a paying customer (Marketing
Teacher Ltd. 2007). Especially in travel marketing, where the distribution is
sometimes spread over foreign boundaries and multiple locations, it is vital to
know the personnel. (Asunta et al 2003). Interpersonal relationships may be the
key to a competitive edge in today's service sectors. There is a consensus
among marketing industry researchers and practitioners (Koekemer and Bird,
2004, Kurtz et al, 2009) that increasing consumer expectations are closely linked
to the intensifying level of competition, and cannot be ignored.

79
A range of researchers (Pickton and Broderick,2005; Moller, 2006; Fill, 2006;
Egan,2007 ;Lamb et al, 2008; Kurtz et al, 2009),have explored the role of
marketing mix in attracting new customers and increasing the level of loyalty of
existing customers i.e. customer satisfaction and positive future intention.
2.7 Summary of the review of relevant concepts of the study
Tourism has been identified as one of the few viable economic opportunities in
large parts of the developed world (Michael Grosspietsch, 2005). Tourism has
been regarded as an important contribution or a major source of revenue not
only in developed countries but also in developing countries.
This study is expected to develop a model to investigate the impact of
Infrastructure on destination image for effective Tourism Marketing. Hence the
review of relevant literature related to the specific area is an essential part of the
study.
Understanding Infrastructure, destination images, and tourism marketing, which
the study focuses, are relatively well developed areas in the tourism literature.
This section aimed to summarise the review of the variables related to these
areas, which are used in this study and also presented the interrelationship of
each variable with another by reviewing the pertinent literature from the previous
studies.
The tourism phenomenon relies heavily on infrastructural support. Tourism
planning and development would not be possible without infrastructural

80
attributes. The infrastructural dimension is thus a necessary element for tourism
development. According to Grzinic and Saftic (2012) developing the necessary
infrastructure is an essential action to ensure the adequate tourist. The first
section of the literature review provided the review of the Tourism Infrastructure.
Based on the available literature the study has formed a new context for the
tourism specific Infrastructural attributes and divided it into 4A’s: Attractions,
Accommodation, Accessibility and Amenities. Further, this study confirmed the
concepts with the expert opinion, survey and case study. This study also
discussed the link of Infrastructure and Destination image as Infrastructure plays
a vital role in creating destination image.
Enhanced Infrastructure influences the destination image formation. One of the
important concepts used in understanding tourists' behavior in the tourism
marketing is the destination image tourists have towards the destination. To
review the various aspects of the destination image is important to identify the
underlying destination image factors and tourists' pre visit & post visit image of
destination on these factors. Satisfactory performance of destination features
would elicit the right emotions and ultimately lead to favorable future behavioral
intentions (Basri Rashid, 2013). The study also focused the various aspects of
Destination Image, Visitors Satisfaction and Tourists future intention. Finally, this
section also reviewed the different areas of Tourism Marketing, destination
image on tourism marketing. The role of people as the 5th P in tourism marketing
also reviewed in this section as heterogeneity is one of the main characteristics
of the tourism industry. Further the conceptual framework and the proposed
hypotheses of this study will be discussed in this chapter.
81
The review shows that tourism Infrastructural attributes plays a distinctive role in
generating the image of a destination and the highest post destination image
indicates the highest standard of Infrastructure & highest level of satisfaction.
Therefore developing the necessary infrastructure is an essential action to
ensure the adequate tourist.
The tourist overall satisfaction is depends on the image created by a destination
before, during and after the visitation. Review of this study also reveals that
tourist satisfaction is considered to be a great predictor for future behavioural
intentions. The review also found that satisfied tourists are most likely to revisit or
recommend the destination to their friends & relatives.
Accordingly, Tourism marketing could be very complex if the destinations lack
the infrastructural facilities. Also, it is necessary for destination authorities do
proper destination marketing by identifying different needs of different market
segments, as well as promote their image and manage destinations to attract
tourists.
This study will provide destination marketers with critical knowledge related to
what drives behavioral intentions (i.e., intention to recommend) of tourists. The
study, in particular, emphasized the pivotal role of Infrastructure to create overall
image exerts on tourists to visit, revisit or recommend a tourist destination to
others. Given the significance of the overall image in influencing future
behavioral intentions, stakeholder-specific marketing strategies must be
developed to improve the tourism infrastructure of the destination.

82
2.8 Structural Equation Modeling in Tourism studies
Tourism studies are much more complex with several variables influencing one
another simultaneously. As such, the need for a more sophisticated and rigorous
statistical technique capable of testing several relationships concurrently
becomes important (Nunkoo, & Ramkissoon, 2011). One multivariate statistical
analysis that has attracted the attention of several researchers and scholars is
structural equation modelling (SEM). ). SEM has become increasingly popular in
social and behavioral sciences including tourism. Structural equation modeling
(SEM) helps researchers to study real life phenomenon and “provides a useful
forum for sense-making and in so doing link philosophy of science to theoretical
and empirical research” (Bagozzi & Yi, 2012). SEM is considered one of the most
widely used statistical techniques by researchers to test complex models
involving a number of dependent and independent variables simultaneously and
it has been an important tool for producing better quality tourism research
(Heene, Hilbert, Draxler, & Ziegler, 2011; MacCallum & Austin, 2000). According
to Bagozzi & Yi (2012), SEM is a statistical procedure, which measures
functional, and predictive hypotheses that approximate world realities. SEM has
also gained popularity in tourism studies where it is used to test various types of
theoretical models (e.g., Nunkoo & Ramkissoon, 2011, 2012a; Nunkoo,
Ramkissoon, & Gursoy, 2012; Vargas-Sanchez, Porras-Bueno, & Plaza-Mejia,
2011). However, researchers are not able to describe the modelling process in
detail in their articles because of word and/or page limitations. Although a
number of conceptual articles on the strategies and steps to conduct a SEM

83
analysis can be found in the literature (e.g. Crowley & Fan, 1997; Fornell &
Larcker, 1981; Golob, 2003), only a handful of conceptual papers discussing
SEM have found their way in tourism journals (e.g. Reisinger & Movondo, 2007;
Reisinger & Turner, 1999).
Baumgartner and Homburg’s (1996) review of SEM-based articles in marketing
and consumer research revealed a number of misapplications related to initial
specifications of theoretical models, data screening, and testing of structural
models. More recently, Hair et al. (2012) assessed the state of SEM- based
research in marketing and concluded that SEM methodological properties are
widely misunderstood, leading to misapplications of the technique. Similar
concerns have also been expressed in other reviews of SEM (e.g., Holbert &
Stephenson, 2002; MacCallum & Austin, 2000; Shah & Goldstein, 2006).
Structural Equation Modeling is a technique to ‘specify, estimate, and evaluate
models of linear relationships among a set of observed variables in terms of a
generally smaller number of unobserved variables’ (Shah & Goldstein, 2006).
The term "structural equation model" most commonly refers to a combination of
two things: a "measurement model" that consists of measurable variables, MVs
(also known as observed variables) and latent variables, LVs (also known as
unobserved variables). LVs are constructs that cannot be directly measured
while MVs serve as indicators of their respective underlying LVs.
SEM is designed to evaluate how well a proposed conceptual model that
contains observed indicators and hypothetical constructs explains or fits the
collected data (Bollen, 1989; Hoyle, 1995). It expresses the linear relationship

84
between LVs which can either be exogenous (independent) or endogenous
(dependent).
Some common SEM methods include confirmatory factor analysis (CFA), path
analysis, and latent growth modeling. In CFA, the researcher has a priori
hypothesis about the LVs in the model and the factors that make up the model
(Musil, Jones, & Warner, 1998). Path analysis, like multiple regression, is based
on correlation analysis (Diekhoff, 1992) and determines the extent to which
correlations between dependent variables and independent variables are
consistent with those predicted in the researcher’s path model (Davis, 1985).
Latent growth modeling is a longitudinal analysis technique to estimate growth
over a period of time. It is widely used in the field of behavioral science,
education and social science. It is also called latent growth curve analysis.
SEM allows for the estimation of a series but independent multiple regression
equations simultaneously and has the ability to incorporate LVs into the analysis
while accounting for measurement errors in the estimation process (Hair,
Anderson, Tatham, & Black, 1998).
Esposito (2009) posits that Structural Equation Modeling (SEM) consists of two
types known as the Variance Based Structural Equation Modeling (VB-SEM) and
the Covariance Based Structural Equation Modeling (CB-SEM). These two
packages have great difference in terms of their statistical approaches namely
the non- parametric testing and the parametric testing, the objective of the study
namely exploratory and confirmatory, and more importantly the algorithm
employed namely Generalized Least Square (GLE) and Maximum Likelihood
Estimator (MLE).

85
In order to apply SEM in estimating relationships among variables, several
computer programs such as CALIS, EQS, AMOS, PLS and LISREL can be used.
The following Table2.4 provides the list of previous studies with Structural
Equation Modeling (SEM) in various aspects of tourism industry.
Table 2.4. List of previous studies with Structural Equation Modeling (SEM) in
tourism
Study context Author(s)
SEM is used to analyses the different
aspects of destination image &
behavioural intentions in tourism studies
Gokce Ozdemir and Omer Faruk
Simsek I (2015)
Norazah Mohd Suki(2014)
M. Reza, Neda Samiei, Behrooz Dini
and Parisa Yaghoubi (2012)
Hailin Qu, Lisa Hyunjung Kim and
Holly Hyunjung Im (2011)
Christina Geng-Qing Chi, Hailin Qu
(2008)
Ching-Fu Chen, DungChun (2007).
J. Enrique Bigne, M. Isabel Sanchez
and Javier Sanchez (2001)
SEM analysis used to predict on-site
visitors’ satisfaction, experiences,
behaviours, and loyalty with respect to a
particular destination or a particular type
Prayag and Ryan (2012)
Lee (2011)
Ballantyne, Packer, and Falk (2011)
Ekinci, and Whyatt (2011)

86
of tourism or a specific tourist attraction Ramkissoon and Uysal (2011)
Han, Lee, and Lee (2011)
Ryu and Han (2011)
Yoon, Lee, and Lee (2010)
Lee (2009)
Connell and Meyer (2004)
SEM is used to analyses the different
aspects of tourism Infrastructure
(Attractions, Accommodation,
Accessibility etc.).
R. Etminani-Ghasrodashti and M.
Ardeshiri (2015).
A. Al-Refaie(2015)
Guineng Chen and João de Abreu e
Silva ( 2014)
Laura Eboli and Gabriella Mazzulla (
2012)
Laura Eboli, Carmen Forciniti and
Gabriella Mazzulla( 2012 )
Kim and Han (2010)
Nyaupane, Graefe, and Burns (2009)
SEM modelling is used to predict
residents’ attitudes and support for
tourism and related development
Nunkoo and Ramkissoon (2011a)
Nunkoo and Ramkissoon (2011b)
Nunkoo and Ramkissoon (2011c)
Nunkoo and Ramkissoon (2010)
Chen and Chen (2010)
Gursoy, Chi, and Dyer (2010)

87
M.J. Gross and G. Brown (2008)
Gursoy and Kendall (2006)
Gursoy and Rutherford (2004)
Ko and Stewart (2002)
Yoon, Gursoy, and Chen (2001)
SEM is used to determine different
aspects of employees’ behaviour in a
hospitality context.
Kong, Cheung, and Song (2012)
Kincaid, Baloglu, and Corsun (2008)
Kim, Leong, and Lee (2005)
SEM analysis is used to model tourism
demand and/or travel expenditure of
travellers from different countries
Corte´s-Jime´nez and Blake (2011)
Assaker (2011)
Assaker, Vinzi and O’Connor, (2010)
Jang, Bai, Hu, and Wu, (2009)
Zakbar, Brencic, and Dmitrovic, (2009)
Lacey, Suh, and Morgan, (2007)
Ryu and Jang, (2006)
Yoon and Uysal, (2005)
Kulendran, N., and Wong K. K. F.
(2005)
Connell and Meyer (2004)
Lehto, O'Leary, and Morisson, (2004)
Gallarza and Saura, (2004)
Kulendran and Witt (2003)
Seiler, Hsieh, Seiler, and Hsieh (2002)

88
SEM modelling is used in an marketing
and e commerce context to determine the
factors influencing success of marketing
decision support system, and
characteristics of websites and their
influence of effectiveness in hospitality
industry
Ching-Cheng Chao, Hsi-Tien Chen
and Tai-Lin Yeh (2015)
H. El-Gohary (2012)
Á. Herrero, H. San Martín (2012)
Turner and Witt (2001)
Fuchs, Hopken, Foger, and Kunz
(2010)
Schmidt, Cantallops, and dos Santos
(2008)
Wober and Gretzel (2000)
Below given are the available models in literature with some of the same
variables of this study.
Figure 2.3 A Model on Destination Image
Hailin Qu et. al (2011)

89
Figure 2.4 A Model on Destination Image, Satisfaction and Future Intention
Prayag and Ryan (2012)
Figure 2.5 A Model on Marketing
H. El-Gohary (2012)
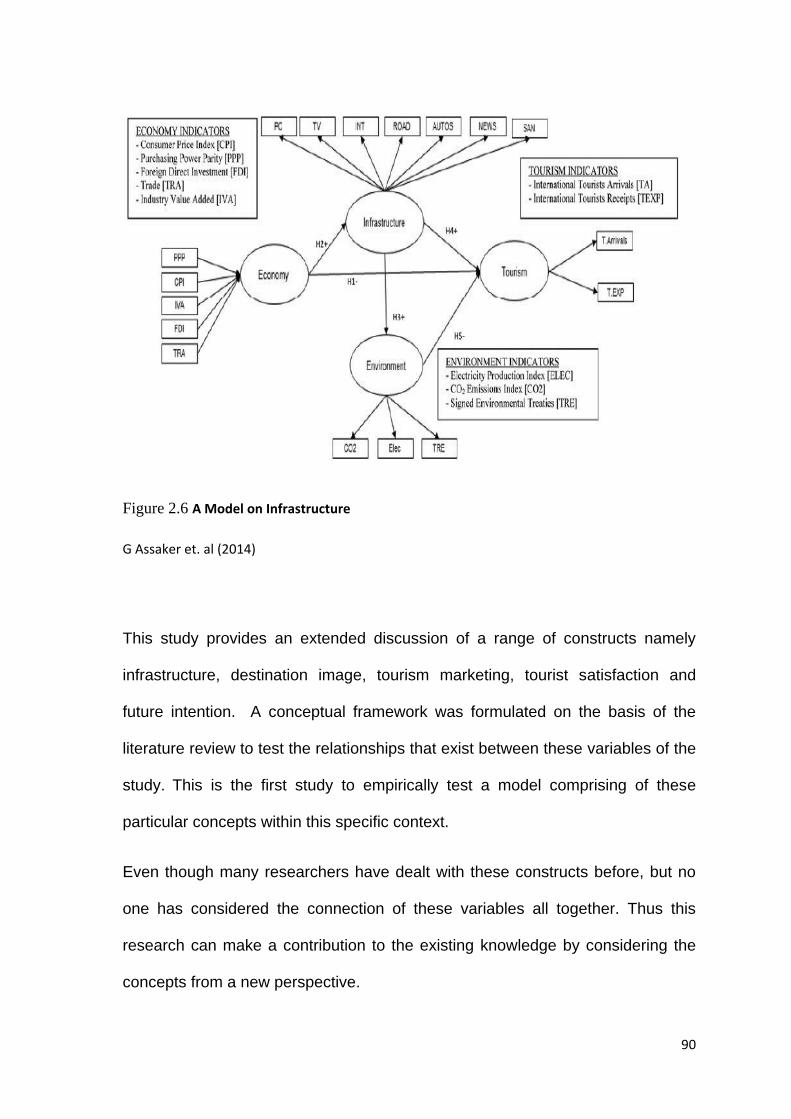
90
Figure 2.6 A Model on Infrastructure
G Assaker et. al (2014)
This study provides an extended discussion of a range of constructs namely
infrastructure, destination image, tourism marketing, tourist satisfaction and
future intention. A conceptual framework was formulated on the basis of the
literature review to test the relationships that exist between these variables of the
study. This is the first study to empirically test a model comprising of these
particular concepts within this specific context.
Even though many researchers have dealt with these constructs before, but no
one has considered the connection of these variables all together. Thus this
research can make a contribution to the existing knowledge by considering the
concepts from a new perspective.

91
2.9 Conceptual framework and hypotheses
A structural model was developed to explore the impact of tourism infrastructure
on destination image for effective tourism marketing. Fourteen hypotheses were
proposed for this study. The conceptual framework which directed the
formulation of this study’s hypotheses, illustrated in Figure 2.7, draws from recent
and relevant findings in the tourism management and marketing literature. The
framework depicts the relationships between variables of the study and shows
the hypotheses and sub hypotheses in the proposed model.
Figure 2.7 The conceptual framework of the study

92
One of the important concepts used in understanding tourists' behavior in the
tourism marketing is the destination image tourists have towards destination. It is
necessary for destination authorities to do proper destination marketing by
identifying different needs of different market segments, as well as promote
destination image and manage destinations to attract tourists.
Understanding the image development process and the nature of image offers
tourism and destination marketers to position their destination effectively in target
market segments. Tourist perceptions are important to successful destination
marketing because they influence the choice of a destination, and majority of
tourists have experiences with other destinations, and their perceptions are
influenced by comparisons among facilities, attractions, and service standards
(Ahmed, 1991).
Lopes (2011), Echtner and Ritchie (2003), and Stabler (1995) underline the
crucial role of destination image in the destination marketing perspective. More
specifically, Lopes (2011) supports that when tourists choose a tourist
destination are influenced significantly by the image of the destination.
Tasci and Gartner (2007) point out that: First, [from the demand-side] destination
oriented marketing activities are dynamic (controllable) factors that aim to polish
and project a positive image for the destination. Destination marketers have
sought to identify the most effective factors that influence a destination image.
Thus, the image of a destination becomes significantly effective for the decisions
of tourists (Yilmaz et al. 2009).

93
The ultimate goal of any destination is to influence possible tourists’ travel-
related decision making and choice through marketing activities. Understanding
the images of a destination is essential for a destination wishing to influence
traveler decision-making and choice. Destination image has been recognized as
one of the influential concepts in tourists’ destination choice process because
image affects the individual’s subjective perception, subsequent behaviour and
destination choice (Jeong & Holland 2012).
As a result of the above discussion, the following hypotheses are presented:
H1: Destination Marketing has a positive and significant influence on Pre -
destination image
H2: Destination Marketing has a positive and significant influence on destination
selection & actual visitation
The competitive situation and greater challenges within the tourism industry
worldwide entail a better understanding of destination image (Mahadzirah
Mohamad et al, 2012).For the past three decades; destination image has been a
most established area of tourism research. Research on destination image can
be traced back to the early 1970s with Gunn’s work on how destination image is
formed, and Hunt’s (1975) influential work examining the role of image in tourism
development.
It is essential to understand the image of a destination for a destination wishing
to influence traveler’s destination choice and destination selection decision.
94
For a destination’s viability and success in tourism industry, researchers and
marketers need to be conscious about the importance of image because tourist
perception of image of a destination influences the destination decision and
tourist products and services sales (Jenkins, 1999; Tasci & Gartner, 2007).
According to Gartner, (1993) destination choice decision is a function of
information available from different sources. The various information collection
about destination visitations are related to visitor‘s actions and choices (Murphy
et al, 2007).
It would therefore be interesting to examine the influence of Pre - destination
image on destination selection & actual visitation hence the third hypothesis is:
H3: Pre - destination image has a positive and significant influence on
destination selection & actual visitation.
Infrastructure is a core area of the tourism industry and plays a distinctive role in
the development of this ever-expanding industry. Studies specifically related to
the relationship between infrastructures are rarely researched in the services
context (Patterson and Spreng, 1997). It is widely presumed that Infrastructure
is a leading factor responsible for Destination Image. According to Grzinic and
Saftic (2012) developing the necessary infrastructure is an essential action to
ensure the adequate tourist. The number of studies that have been carried out
on the subject of tourism Infrastructure is indicative of the importance associated
to the subject. Researchers (Ionel, 2013; Grzinic and Saftic, 2012) have explored
the context of essential elements of successful tourism infrastructure and the

95
actions related to it. A tourism resource rich region requires plausible planning
and management for the development of such infrastructure.
Four aspects (4 A’s) of infrastructure have been investigated in this study:
Attractions; Accommodation; Accessibility and Amenities; and these concepts
have been adapted from Cooper et al. (2008).
As such the following hypothesis and sub – hypotheses are postulated:
H4: Tourism Infrastructure has a positive and significant impact on destination
selection & actual visitation
H4a: Tourism infrastructure is determined by the quality of the attractions of the
destination.
H4b: Tourism infrastructure is determined by the quality of the accessibilities of
the destination.
H4c: Tourism infrastructure is determined by the quality of the accommodations
of the destination.
H4d: Tourism infrastructure is determined by the quality of the amenities of the
destination.
Tourists’ image perceptions vary over time. According to the studies conducted
on the pre- visit and the post- visits images of the destination (Pearce,1982;
Gunn,1988; Fakeye & Crompton, 1991; Garter, 1993; Baloglu & Macheraly,
1999; Kim, McKercher, & Lee, 2009; Wang & Davidson, 2010) , The organic and
the induced images form the pre-visit destination image while the experiential

96
image that is hoarded after arriving at the destination until departure to the home
country form the post-visit destination image.
Destination Image is not static but changes depending on the Infrastructural
attributes of the destination. Therefore the image form after visitation is much
more realistic and complex than the one formed before the visitation, through
secondary information (Beerli & Martín, 2004). In this respect, it is suggested that
although many people have an image of destinations they have not yet visited,
the most accurate, personal and comprehensive is formed through visiting there
(Molina, Gómez and Martín-Consuegra, 2010). Therefore, this study tests the
impact of tourism Infrastructure on post - destination image through the following
hypothesis.
H5: Tourism Infrastructure has a positive and significant impact on Post -
destination image.
Infrastructure is a core area of the tourism industry and plays a distinctive role in
the development of this ever-expanding industry. According to Grzinic and Saftic
(2012) developing the necessary infrastructure is an essential action to ensure
the adequate tourist.
It is imperative to consider the role of tourism infrastructure and how it can be
utilized and further enhanced to contribute to the effective marketing of a
destination. In this regard it is also essential to consider how tourism
infrastructure can be incorporated in the marketing and promotion of a tourist
attracting region. Though success of a tourism product is strongly supported by
the positive marketing effects, (Lee et al., 2011; Moutinho et al., 2011; Sotiriadis

97
and van Zyl, 2013) tourism infrastructure holds much potential to attract visitors
and to enhance sustainability in tourism. To this end, the sixth hypothesis in this
study is:
H6: Tourism Infrastructure has a positive and significant influence on Destination
Marketing
Post-visit destination image is linked with visitor‘s satisfaction. Visitors analyse
their experiences after their visits to a destination; the aftermath is what is
important. It is this effect that makes an impact on choosing a destination for a
second time or recommending this destination as a positive word of mouth to
either a friend or a family member (Fall and Knutson, 2001). The satisfaction of a
tourist has been analyzed from summation of destination attributes evaluation by
tourist (Kozak & Rimmington, 2000; Kozak, 2003).
This kind of measurement of satisfaction evaluate the quality of destination
performance, where tourists satisfaction not only regarded with, how they were
served and treated at a destination, that is, what they experience (Um, Chon, &
Ro, 2006), but also measures how they felt during the service encounter (Baker
&Crompton, 2000).
Satisfaction of a destination also refers to the emotional state shown in a tourist’s
post-exposure evaluation of a destination (Baker & Crompton 2000; Su et al.
2011). According to McDowall (2010) a destination that identifies the attributes
that satisfy tourists needs upsurge the chances of a destination having loyal
tourists.

98
Tourism marketers try to strategically establish, reinforce and, change the image
of their destination to attract more tourists to the destination.
This leads to the, the following hypotheses:
H7: Post - destination image has a positive and significant influence on Tourist
satisfaction
H8: Post - destination image has a positive and significant influence on
Destination Marketing
According to Pryag(2009) tourist satisfaction is considered to be a great predictor
for future behavioural intentions in many natures of tourism destinations and also
a positive relationship occurs between tourist satisfaction on future behavioural
intentions. Once visitors are satisfied with their experience they might like to
revisit a destination (Pizam and Milman, 1995) and are most likely to express
favourable comments about the destination they have visited or recommend the
destinations to their friends and relatives or (Mohammed Bala Banki et al, 2014).
Ultimately the satisfied tourists influence the possible tourists’ travel-related
decision making.
Individuals explore all available possibilities either through word of mouth or
internet about destinations that can meet their needs. Visitors analyse their
experiences after their visits to a destination and it is this effect that makes an
impact on choosing a destination for a second time or recommending this
destination as a positive word of mouth to either a friend or a family member (Fall
and Knutson, 2001).

99
In view of this, the following hypotheses are presented:
H9: Tourist satisfaction has a positive and significant impact on Tourist’s future
intention.
H10: Tourist’s future intention has a positive and significant influence on
Destination Marketing.

100
To sum up the hypotheses, the following paths could be established and below
given Figure 2.8 is the brief overview of the interrelationships of the constructs in
the model.
Destination Marketing => Pre Destination Image
Destination Marketing => Destination Selection &actual visitation
Pre Destination Image => Destination Selection &actual visitation
Tourism Infrastructure => destination selection & actual visitation
Attractions => Tourism Infrastructure
Accessibilities => Tourism Infrastructure
Accommodations => Tourism Infrastructure
Amenities => Tourism Infrastructure
Tourism Infrastructure => Post – Destination Image
Tourism Infrastructure => Destination Marketing
Post Destination Image => Tourist Satisfaction
Post Destination Image => Destination Marketing
Tourist Satisfaction => Tourist future Intention
Tourist future Intention => Destination Marketing
Figure 2.8: The relationships in the hypotheses
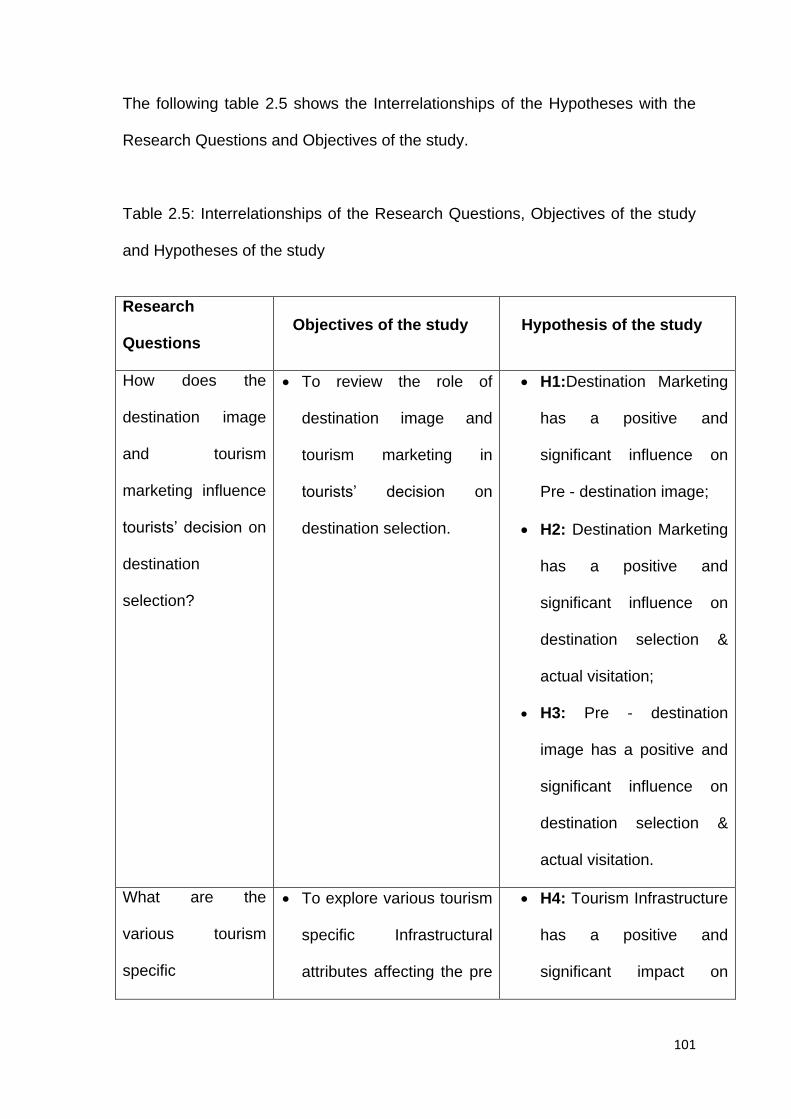
101
The following table 2.5 shows the Interrelationships of the Hypotheses with the
Research Questions and Objectives of the study.
Table 2.5: Interrelationships of the Research Questions, Objectives of the study
and Hypotheses of the study
Research
Questions Objectives of the study Hypothesis of the study
How does the
destination image
and tourism
marketing influence
tourists’ decision on
destination
selection?
To review the role of
destination image and
tourism marketing in
tourists’ decision on
destination selection.
H1:Destination Marketing
has a positive and
significant influence on
Pre - destination image;
H2: Destination Marketing
has a positive and
significant influence on
destination selection &
actual visitation;
H3: Pre - destination
image has a positive and
significant influence on
destination selection &
actual visitation.
What are the
various tourism
specific
To explore various tourism
specific Infrastructural
attributes affecting the pre
H4: Tourism Infrastructure
has a positive and
significant impact on

102
infrastructural
attributes affecting
the pre visit & post
visit destination
image?
visit & post visit destination
image.
destination selection &
actual visitation;
H4a:Tourism
infrastructure is
determined by the quality
of the attractions of the
destination;
H4b: Tourism
infrastructure is
determined by the quality
of the accessibilities of the
destination;
H4c: Tourism
infrastructure is
determined by the quality
of the accommodations of
the destination ;
H4d: Tourism
infrastructure is
determined by the quality
of the amenities of the
destination.
What is the impact
of specific
To assess the impact of
Infrastructure on
H5: Tourism Infrastructure
has a positive and

103
infrastructural
attributes on
destination image,
and how do they
differ in tourists' pre
visit & post visit
image of
destination?
Destination Image. significant impact on Post
- destination image.
What are the effect
of destination image
factors on the
tourists' overall
holiday satisfaction
and future
intention/tourist
impression with
destination?
To identify the relationship
between tourist
satisfaction and future
intention.
H7: Post - destination
image has a positive and
significant influence on
Tourist satisfaction; and
H9: Tourist satisfaction
has a positive and
significant impact on
Tourist’s future intention.
How do tourism
infrastructural
facilities and
destination image
influence tourism
marketing and
To set out and validate a
model to determine the
impact of infrastructural
facilities on destination
image for effective tourism
marketing.
H6: Tourism Infrastructure
has a positive and
significant influence on
Destination Marketing;
H8: Post - destination
image has a positive and

104
tourist’s future
intention?
To draw conclusions and
identify the suggestions for
destination development
and marketing.
significant influence on
Destination Marketing;
H10: Tourist’s future
intention has a positive
and significant influence
on Destination Marketing
2.9.1 Validation of the relationships in the hypotheses
Following the formation of Conceptual framework and hypotheses, in order to
validate the relationships/paths in the hypotheses, expert opinions were collected
from industry professionals and tourism experts. A number of studies have used
an expert opinion as a tool for refining attributes in both general services
management (e.g. Sweeney and Soutar, 2001) and tourism and hospitality (e.g.
Choi and Chu, 1999; Petrick, 2002; Caro and Garcia, 2008). According to
Hardesty and Bearden (2004) the use of expert judgement is to ensure content
and face validity.
Data in the forms of opinion and views of experts about the various aspects
pertaining to hypotheses of this study were collected to validate the acceptance
of the relationships in the hypotheses. This information was required to complete
the conceptual framework of the study. The questions were therefore designed to
accrue data which would complement the literature review, contribute to the
conceptual framework and assist in validating the hypotheses paths. The

105
questions were in the semi-structured format to gain a qualitative understanding
of the underlying reasons. In view of this, effort was concentrated on sampling
individuals with requisite expertise and who were willing to participate; hence a
convenience sampling approach was adopted.
Hardesty and Bearden (2004) has been identified a number of item
deletion/retention rules when researchers employ expert judgement; these
include the deletion of items which were judged by any expert as being poor
indicators of the construct domain or a cut-off point may be established as
number (e.g. 3 out of 4) or a percentage (e.g. 70%) of experts based on either
criterion.
A set of rules were established by Lee and Crompton (1992), adopting a criteria
for the basis of rejection or retention of attributes or dimensions. An item was to
be deleted if 50% of the experts rejected it. Similarly, a dimension was to be
discarded if two or more of the four experts queried its inclusion. Participants
were encouraged to provide their suggestions about the initially developed
structural model and the relationships in the hypotheses. All the four experts
participated were supported the significance of the relationships in the
hypotheses. Thus no revision required to make with the proposed model and
hypotheses. The purpose of this procedure was to determine the significance of
the relationships in the hypotheses.
Once the relationships in the hypotheses and the variables or constructs paths in
the model are validated through the above procedures, the final model would be
confirmed through quantitative analysis with PLS- SEM.
The following table 2. 6 summarize the expert opinion

106
Table 2.6: Validation of the significance of the relationships/paths in the
hypotheses
Question Hypothe
-sis
Support Significance
P1 P2 P3 P4
1 In your view, do you think
the destination marketing
has a positive and
significant influence on pre
- destination image?
H1 Yes Yes Yes Yes Significant
2 Do you think the followings
have significant influence
to find information about
the Infrastructure of this
area?
Word of mouth
Internet
Media
Brochures of travel
agency & tour
operators
Books and
Magazines
Fairs and/or
exhibitions
National or regional
tourism boards
H2 Yes Yes Yes Yes Significant

107
3 In your view, do you think
that the Infrastructure
attributes create pre
destination image in the
minds of the prospective
tourists which persuade
them to select a
destination?
H3 Yes Yes Yes Yes Significant
4 Do you believe that the
following Infrastructure
attributes influence the
tourist’s decision on the
destination selection to
visit this area?
H4
Yes Yes Yes Yes Significant
Attractions - H4a Yes Yes Yes Yes Significant
Accommodation - H4b Yes Yes Yes Yes Significant
Accessibility - H4c Yes Yes Yes Yes Significant
Amenities - H4d Yes Yes Yes Yes Significant
5 Have you observed any
impact of Infrastructure on
tourist’s pre/post visit
destination image?
H5 Yes Yes Yes Yes Significant
6 Do you believe that the
improved tourism related
H6 Yes Yes Yes Yes Significant

108
2.10 Summary
This chapter highlighted the development of important concepts like tourism
infrastructure, destination image, destination selection decision, tourism
marketing, tourist satisfaction and future intention, which are distinct domains of
inquiry in the tourism literature, and forms the conceptual background for this
Infrastructure will enhance
tourism marketing
7 Have you observed any
effect of destination image
factors on the tourists'
overall holiday
satisfaction?
H7 Yes Yes Yes Yes Significant
8 Do you believe that the
better the tourists' overall
holiday satisfaction the
better the future
intention/tourist impression
with destination?
H9 Yes Yes Yes Yes Significant
9 Do you believe that
tourism infrastructural
facilities and destination
image influence tourism
marketing and tourist’s
future intention?
H8, H10 Yes Yes Yes Yes Significant
109
research. Effort of literature search has been expended in investigating these
terms in various areas of tourism and related sectors.
Further this chapter has discussed the Structural Equation Modeling (SEM) in
tourism studies and presented the conceptual framework and hypotheses of the
study.
The review discussed the importance of Infrastructure to develop a successful
destination. The review revealed the existence of a number of constructs related
to the basis for understanding the concepts of tourism Infrastructure in a different
perspective.
Infrastructure holds much potential to attract visitors and to enhance
sustainability in tourism. Thus the review has identified and prioritized tourism
specific infrastructure (Attraction Infrastructure, Accommodation Infrastructure,
Accessibility Infrastructure and Amenity Infrastructure) which will enhance
tourism offering and increase visitor satisfaction of the destination.
Notable from the review destination image is the most important factor which
tourists value highly to determine their destination. Therefore destination
marketers have sought to identify the most effective factors that influence a
destination image. In this context this chapter also reviewed some studies aimed
at revealing the significance of appropriate tourism-specific infrastructures to
create and manage a distinctive and attractive image of the destination.
One of the important objectives of this study involves reviewing the role of
destination image and tourism marketing in tourists’ decision on destination
selection. Towards this end, for gaining better understanding of marketing in the

110
tourism context, this review has discussed the role of tourism infrastructure in
marketing destinations and the relationship between destination marketing and
destination image.
The review noted various studies and related concepts of tourism infrastructure
and destination image on which satisfaction is assessed for specific constructs
within the total holiday experience. Also, studies on future intention with the
destination are reviewed.
In summary, this chapter discusses the literature related to this research and has
provided the basis for understanding the main constructs of this study. It has
delineated the six main concepts: tourism infrastructure, destination image,
destination selection decision, tourism marketing, tourist satisfaction and future
intention.
After the exploration of relevant literature a list of variables (presented in Table 5)
was formed for the study and these variables generated from literature research
formed the constructs for the questionnaire and finally formed the conceptual
framework and hypotheses. The next chapter builds on this groundwork and
provides an explanation of and justification for the research methods employed in
this study.
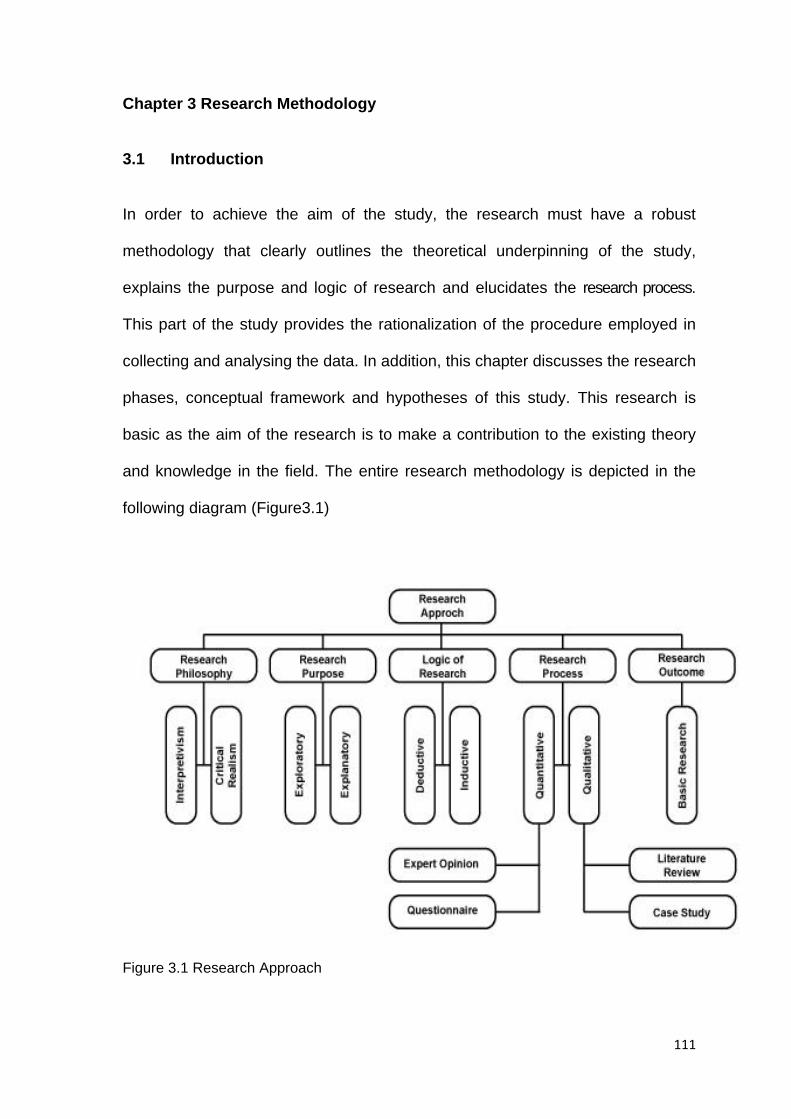
111
Chapter 3 Research Methodology
3.1 Introduction
In order to achieve the aim of the study, the research must have a robust
methodology that clearly outlines the theoretical underpinning of the study,
explains the purpose and logic of research and elucidates the research process.
This part of the study provides the rationalization of the procedure employed in
collecting and analysing the data. In addition, this chapter discusses the research
phases, conceptual framework and hypotheses of this study. This research is
basic as the aim of the research is to make a contribution to the existing theory
and knowledge in the field. The entire research methodology is depicted in the
following diagram (Figure3.1)
Figure 3.1 Research Approach

112
3.2 Research philosophy
Research philosophy of a study can be defined as the development of the
research background, research knowledge and its nature (Saunders et al 2012).
Research philosophy is also defined with the help of research paradigm.
Easter-by-Smith et al, (2012) have discussed about three different components
of research paradigm or three ways to think about research philosophy –
Epistemology, Ontology and Methodology.
It is necessary to understand the philosophical position of the research issues to
understand the different combination of the research methods. There are manly
four philosophical perspectives are the popular paradigms in contemporary
social, organizational, and management research – Positivism, Interpretivism,
Realism and Critical Realism (Fisher 2010)
The main concern of this study is to adopt the most appropriate epistemological
position and research methodology. The epistemological position adopted in this
study is Interpretivism, and critical realism. The philosophical assumptions
underlying in this study mainly come from interpretivism. According to this
Philosophy, there are many truths and meanings of a simple fact and these are
suitable for every research problem (Johnson and Christensen, 2012). However,
this study will also footprints of the critical realism where people can consciously
act to change their social and economic circumstances and their ability to do so
is constrained by various forms of social, cultural and political domination (Myers
and Klein 2011). Adopting a critical realist perspective has both ontological and
epistemological implications. The ontological position adopted is neither fully

113
objective nor subjective. The epistemological position for the critical realist will be
critical (Jenkins A, 2011).
3.3 Research Purpose
The research method is a strategy of enquiry, which moves from the underlying
assumptions to research design, and data collection (Myers, 2013). According to
Saunders et al (2012) there are three types of research project based on the
research purpose: explanatory, descriptive, and exploratory and submit that the
purpose may fall into a solitary category as well as combine two or three
categories.
An explanatory study seeks to establish causal relationships between variables.
The emphasis is on studying a given problem or situation so that an explanation
of any relationships that exist between variables can be presented. Descriptive
research instead seeks to paint an accurate picture of a phenomenon under
investigation. Saunders et al (2012) pointed out that exploratory study can be
conducted employing a search of the literature, interviewing ‘experts’ in the field
and conducting focus group interviews.
This study combines an explanatory and exploratory method to explore the
impact of infrastructure on destination image for effective tourism marketing.

114
3.4 Logic of Research
A significant part regarding the research design is that, whether the research
should employ deductive or inductive approach/reasoning. Deductive approach
emphasis is generally on causality using of general facts to rationally arrive at a
more specific conclusion whilst inductive approach the aim is usually focused on
exploring new phenomena or looking at previously researched phenomena from
a different perspective. One of the advantages of an inductive approach is that it
is more effective with a small sample (Altinay and Paraskevas, 2008). Deductive
and inductive approaches to reasoning, in essence, attempt to provide
explanation of the truth from opposing directions (Walliman, 2011).
In view of the focus of this study- understanding the impact of Infrastructure on
destination image and how it will effect the marketing of the destination, the
deductive approach is deemed useful and appropriate. However, the research
design for this study does not entirely lend itself to a deductive reasoning
approach. An inductive argument only offers support for the conclusion rather
than providing irrefutable grounds for truth (Walliman, 2011).
Therefore this research adopted a mixture of inductive and deductive
approaches to conduct the study.

115
3.5 Research Process
Research process can be thought of as the approach or master plan of a
research that throws light on how the study is to be conducted. The significance
of research design is to direct the way of data collection procedure and examine
the data in order to response for recognized research problem. It is important for
the research to take into account the time necessary to collect the data and the
best time for data collection in order to gather viable information in an optimal
manner. Walliman (2011) posits that it is often appropriate to decide first on the
type of analysis required to investigate the research problem, and then the type
of data to be collected in order to undertake the analysis. Also, it is important to
consider the tools, techniques, resources required and different research
strategies will require different methods of data collection and analysis. There are
two methods of data collection and analyses are identified –quantitative and
qualitative (Creswell, J. W, 2009).
This research used the combination of quantitative and qualitative data collection
methods and has adopted an approach of observation, case study, expert
opinion and survey to meet the objectives. The study followed two-stages,
comprising qualitative and quantitative stage.
Stage 1, the qualitative stage involved analyses of various literature searches,
observations and Case study.
Stage 2, the quantitative study used a survey method with a structured
questionnaire to get the data from the international tourists. . A pilot test (Expert
opinion) was conducted with travel industry professionals and tourism experts in
order to check and fine-tune the item list in the questionnaire. An expert opinion

116
or judgment was taken from the industry experts to validate the relationships in
the hypotheses.
SPSS, SEM & other statistical methods were used to analyse the findings.
Tourists were approached randomly at the departure terminals of international
airports of Dubai to participate in the survey.
3.6 Methods of data collection
According to the online oxford dictionaries (2015) data are the facts and statistics
gathered together for the purpose of reference or analysis. Whereas data relates
to information, evidence implies data in support of questions or propositions
(Thomas, 2011). Data can be sourced from both primary and secondary sources.
Primary sources refer to those that are directly collected at field source while
secondary data are those data collected from literature audio or video documents
such as textbooks, journals, archives, annual reports, government published data
and films (Saunders et al., 2009; Collis and Hussey 2003). Data can also be
classified as either qualitative or quantitative.
There are various methods to collect either qualitative or quantitative data.
Common methods identified from various literature includes; observation,
questionnaire, interview, protocol analysis, diary methods, focus groups and
content analysis of documents to mention a few (Collis and Hussey, 2009:
Dawson, 2009). Qualitative data collection methods are subjective and involve
the collection of data based on the perception of participants to gather in-depth
understanding into the study (Saunders, et al., 2012).

117
Collis and Hussey (2003) further avers that qualitative method of data collection
enables in-depth information to be gathered on the study but may require more
time and cost than those from the questionnaire. However, the choice of a data
collection method may depend upon the purpose of the study, the resources
available and skills of the researcher.
On the other hand, quantitative data collection methods emphasise on objective
measurements and numerical analysis through statistical means - experiments
and questionnaires. Quantitative research is defined as empirical research where
the data are in the shape of numbers (Punch 2005). According to Saunders et al
(2009) questionnaires are the most commonly adopted method of collecting data
in social and management researches because of its numerous advantages.
Therefore, in this research context, the questionnaire and case study are
adopted as methods of data collection.
The entire methods of data collection process is depicted in the following
diagram (Figure 3.2)

118
Figure 3.2: Process of Data Collection
Data Collection
Quantitative
Questionnaire
Expert opinion
Qualitative
Pilot test (Expert
opinion)
Literature Review Case Study
Formation of
variables
Development of
Conceptual framework
and hypotheses
Validation of the
relationships in the
hypotheses- Expert
opinion

119
3.6.1 Questionnaire
One of the principal challenges for researchers in all subject areas, including
tourism, is to identify an accurate, reliable and easy-to-use data collecting
instrument. In tourism studies, questionnaires are mostly employed in gathering
data because of their ability to collect large sample sizes for statistical analysis
(Orams and Page, 2000).
Questionnaire is data collection method in which the respondents are asked to
respond to same set of questions in a predetermined order that will be
interpreted in a same context by all the respondents. Questionnaire survey is a
primary data collection based on communication with a sample of individuals.
The approach can be done either at a fixed point in time (cross sectional) or at
varying points in time (longitudinal study) for comparative purposes. According to
Saunders et al. (2012), in questionnaire the respondents are expected to provide
answers in predetermined order.
Denscombe (2010) further added that questionnaires are employed to reach a
large volume of respondents in many locations. They are a common method of
collecting quantitative data in social research and are apparently best suitable for
use in descriptive or explanatory research. According to Saunders et al., (2009)
and Dawson (2009), adopting a questionnaire is dependent on certain factors
like “the type of research questions, the number of questions to be asked, the
sample size required for analysis, time availability to collect data and
Characteristics of the respondents.

120
A questionnaire could be either closed, open-ended or a combination depending
on the type of data required and may be administered through self, telephone,
post or web- based (Collis and Hussey, 2009). The questionnaire method offers
greater anonymity in terms of data collected, facilitate large volume of
information and could be less time and cost to conduct (Sekaran, 2006).
The advantage of the survey method is that if correctly designed and
administered it can provide a quick, inexpensive, efficient, and accurate means
of assessing information about a population. According to Alreck and Settle
(1985) a large sample of respondents can provide the basis for statistical
analysis and help to determine the degree of association between the dependent
variable and a range of independent variables, and the analysis enable firm
conclusions to be drawn from the survey data, and the finding to be generalized.
A large sample also helps to raise the level of reliability and validity of the
research (Alreck and Settle, 1985).
However, this data collection method has been critiqued to have the
disadvantages of low response rates, lack of detailed responses on a
phenomenon and limited opportunities for spontaneous responses (Saunders et
al., 2009).
3.6.1.1 Formation of variables
The formations of attributes for the questionnaire were generated from literature
research, and pilot study. The literature review included the pertinent research
papers on tourism infrastructure, destination image, destination marketing,

121
tourist’s satisfaction and future intention. A pilot test was conducted with travel
industry professionals and tourism experts in order to check and fine-tune the
items listed in the questionnaire.
3.6.1.1.1 Literature Review
After the exploration of relevant literature a list of variables were formed for the
study. Table 3.1 shows the formation of Variables from the review of literature.
Table 3.1 Formation of Variables from the previous studies
Measurement for this
study
Author Original
Measurement
• This tourist
destination is a
friendly and
popular place.
• Dubai is a
sophisticated city
which combines
cultural heritages,
traditional
urbanism and
modernity
Carla Almeida Santos
(2004)
Modern
Sophisticated
Traditional

122
together
Dubai is a
cosmopolitan city
Dubai is a vibrant
youthful city has
enormous
shopping malls
and great nightlife
Dubai is a modern
city comprises
active
populations,
skyscrapers and
great crowds
Henderson (2000)
Cosmopolitan
Youthful
Vibrant
Modern
Reliable and Comfort
• This tourist
destination is a
friendly and
popular place.
Chia-Wei Lin (2007).
Friendly and
Hospitable place.
• Dubai is rich in
natural attractions
• Dubai is rich in
cultural attractions
• Dubai Is rich in
Swarbrooke (2002)
Weaver and Lawton
(2010)
Swarbrooke, (2002).
Natural environment,
Human-made
buildings, structures
and sites

123
special type of
attractions
Godfrey and Clarke,
(2000)
cultural features
Special events
• Easy access to
Local
Transportation
• Dubai has good
parking Facilities
and clear
signposts and
indicators
Uysal, Hosany and
Ekinci (2007)
Mowacki (2005)
Gonzalez et al (2007)
Accessibility
car park,
parking facility
• Dubai has wide
selection of
accommodation
• Attitude of staff
towards visitors
(Friendliness and
hospitality)
Pikkemaat & Peter
(2004)
Milman (2009)
Accommodation
friendly and courteous
staff,
• Dubai offers good
rest and relax
facilities
• General
cleanliness in
Mowacki (2005)
Milman (2009)
Gonzalez et al (2007)
easy access for the
elderly and disable,
personnel assistance,
quality of food,

124
Dubai
• Dubai offers
facilities for
children, elderly
and physically
challenged people
• Dubai offers a
wide selection of
food Dubai offers
various shopping
experiences
• Dubai ensures
safety and
security
variety of food
safety, cleanliness of
the park or attraction,
quality of rides or
attractions,
• This is my last
visit.
• I will visit Dubai
again
• I will recommend
Dubai to my
friends and
relatives.
Castro, Carmen and et
al. (2007).
Intentions to not return
a destination
Intentions to return to a
destination
Intentions to
recommend a
destination to friends
and relatives.

125
• I will visit Dubai
more often in the
future.
Ulrike bauernfeiend
and Andreas H Zins
(2006).
In the future, I will visit
this website more
often.
3.6.1.1.2 Pilot Study
In order to gain further insight into the features of the research a pilot test will be
conducted with international tourists, travel industry professionals and tourism
experts in order to check and fine-tune the items listed in the questionnaire.
Table 3.2 shows the list of variables before the pilot study
According Ticehurst and Veal (2000) conducting a pilot study is crucial in order to
achieve several aims, for instance, testing questionnaire wording, testing
question sequencing, testing questionnaires layout, gaining familiarity with
respondents, testing fieldwork arrangements (if required), training and testing
fieldworkers (if required), estimating response rate, and estimating interview or
questionnaire completion time.
A pilot test is imperative to any research to check the reliability of the data to be
collected as well as the validity of the questions. This is because the design of a
questionnaire is crucial in obtaining the required information (Saunders, Lewis, &
Thornhill, 2012). In order to ensure that the final formulation is as clear as
possible, it is essential to undertake various type of pilot test, since as Bell (2005)

126
stressed, although the time is short it is recommended to provide the
questionnaire a trial run as much as possible.
Table 3.2: Categorisation of variables before the pilot study
Attractions
Natural (Sightseeing, Climate, Beaches etc)
Cultural ( Historical sites, religious sites, Museums etc)
Special type of attractions (Amusement/Fun/Theme parks, Zoo, Wildlife
centre, Manmade islands, events and festivals)
Nightlife (e.g. bar, café and disco parlor)
Entertainment (fishing, boating computer games, Theatres, galleries and
cinemas)
Adventure activities (rafting, skydiving, horse riding and camel riding)
Accessibility
Easy visa procedure
Accessibility to the destination through different modes of travel
Distance or flying(reaching) time to the destination
Airport and Air transportation
Local transportation
Parking facilities, Signposts & indicators

127
Accommodation
Offers enough accommodation for tourists
Wide selection of accommodation
Accommodation offers good physical environment
Accommodation offers good services
Conference & convention facilities
Attitudes of staff towards visitors (Friendliness and hospitality)
Amenities
Rest and relax facilities
Facilities for children, elderly and physically challenged people
A wide selection of Food (local food, exotic food)
Various shopping facilities (e.g. Main Street, market and shopping mall)
Communication System (Information centers, telecom etc
Safety and Security
Availability of intermediaries (Travel agents, Tour operators, Guides etc.)
Destination marketing
Previous experience (Already visited & it’s the repeat visit)
Internet.
Friends and relatives.
Media (Radio/TV, Newspapers)
Travel agency & Tour operators
Fairs and/or exhibitions

128
Pre & Post visit Destination Image
Most people have a positive opinion about this tourist destination.
This tourist destination is a friendly and popular place.
This tourist destination has a unique image.
Dubai is a cosmopolitan city (e.g. fairly large populations, many multinational
corporations, center for financial and education institution)
Dubai is a vibrant youthful city has enormous shopping malls and great
nightlife
Dubai is a modern city comprises active populations, skyscrapers and great
crowds
Dubai is a sophisticated city which combines cultural heritages and modernity
together
Dubai is a traditional city consists of traditional urbanism and architectures
Many researches have used an expert opinion/judgement survey as a tool for
refining Variables for scale development in both general services management
(e.g. Sweeney and Soutar, 2001) and tourism and hospitality (e.g. Choi and Chu,
1999; Petrick, 2002; Caro and Garcia, 2008). The use of expert judgement is to
ensure content and face validity (Hardesty and Bearden, 2004).
To ensure the content validity, an expert opinion was taken from the top level
managers of tourism & related infrastructure field, in Dubai, to modify the
attributes listed in the questionnaire. The questionnaire was revised accordingly,
incorporating the suggestions obtained through expert opinion.

129
Hardesty and Bearden (2004) has been identified a number of item
deletion/retention rules when researchers employ expert judgement; these
include the deletion of items which were judged by any expert as being poor
indicators of the construct domain or a cut-off point may be established as
number (e.g. 3 out of 4) or a percentage (e.g. 70%) of experts based on either
criterion.
A set of rules were established by Lee and Crompton (1992), adopting a criteria
for the basis of rejection or retention of attributes or dimensions. An item was to
be deleted if 50% of the experts rejected it. Similarly, a dimension was to be
discarded if two or more of the four experts queried its inclusion.
A few revisions made to the questionnaire of this study as some attributes were
not relevant or were repetition of an item or items already on the list. Such
attributes were deleted from the list. The experts were given four dimensions of
tourism infrastructure which include 25 attributes, 6 variables of destination
marketing and also 8 statements of destination image. The expert opinion
resulted in accepting all the four categories of tourism infrastructure but some
attributes were rejected by the experts as it was repetition or irrelevant. From the
attractions category “Entertainment and adventure activities” were rejected by
80% experts as it was already included in the item “Special type of attractions”.
Also the expert opinion has rejected two variables from accessibility and one
each from accommodation, amenities and destination image. The expert opinion
resulted in accepting all the six variables from “Destination Marketing” category.
Table 3.3 shows the list of variables after the pilot study.

130
Table 3.3: Categorisation of variables after the pilot study
Attractions
Natural (Sightseeing, Climate, Beaches etc)
Cultural ( Historical sites, religious sites, Museums etc)
Special type of attractions (Amusement/Fun/Theme parks, Zoo, Wildlife
centre, Manmade islands, events and festivals)
Nightlife (e.g. bar, café and disco parlor)
Accessibility
Easy visa procedure
Distance or flying(reaching) time to the destination
Airport and Air transportation
Parking facilities, Signposts & indicators
Accommodation
Wide selection of accommodation
Accommodation offers good physical environment
Accommodation offers good services
Conference & convention facilities
Attitudes of staff towards visitors (Friendliness and hospitality)
Amenities

131
Facilities for children, elderly and physically challenged people
A wide selection of Food (local food, exotic food)
Various shopping facilities (e.g. Main Street, market and shopping mall)
Communication System (Information centers, telecom etc)
Safety and Security
Availability of intermediaries (Travel agents, Tour operators, Guides etc.)
Destination marketing
Previous experience (Already visited & it’s the repeat visit)
Internet.
Friends and relatives.
Media (Radio/TV, Newspapers)
Travel agency & Tour operators
Fairs and/or exhibitions
Pre & Post visit Destination Image
Most people have a positive opinion about this tourist destination.
This tourist destination is a friendly and popular place.
This tourist destination has a unique image.
Dubai is a cosmopolitan city (e.g. fairly large populations, many multinational
corporations, center for financial and education institution)
Dubai is a vibrant youthful city has enormous shopping malls and great
nightlife
Dubai is a modern city comprises active populations, skyscrapers and great

132
crowds
Dubai is a sophisticated city which combines cultural heritages and modernity
together
3.6.1.2 Questionnaire Design and Measurement of variables
The quantitative stage of the research used a structured questionnaire, which
was made through several iterations. In short, the iteration process involved a
literature search and a number of expert opinions from the travel and tourism
industry soliciting the impact of tourism infrastructure on tourism industry.
Cautious planning and maintaining a focus on the research aims and objectives
are probably the key elements to successful questionnaire design. Indeed, it is
vital that the questions aimed at obtaining the data are designed distinctly and
that the researcher is clear about the data required so that respondents
understand them in the same way the researcher intended. In turn, the answers
provided must be capable of being interpreted by the investigator as intended by
the respondents. According to Saunders et al., (2007) the internal validity and
reliability of any given data and the response rate achieved depend largely on
the design of questions, the structure of the questionnaire and the quality of pilot
testing. According to Walliman(2011) the questions must be kept simple to
enhance response rate.
The below given Figure 3.3 illustrates of how the designing process of the
questionnaire were carried out in this research.

133
Figure 3.3: Questionnaire Design process
The questionnaire consisted of five major sections with the questions that
measured the following constructs. Apart from section A, all the items listed in
section B, section C, section D and section E (destination selection, destination
Formation of variables
from literature research
Classification of the
variables by the
researcher
Pilot test - Expert
opinion
Questionnaire design
and scale formation
Questionnaire
modification – Generate
final questionnaire

134
marketing, pre & post destination Image, tourism Infrastructure, tourist
satisfaction and tourist future intention) were rated on five-point Likert type scale.
Section A was designed for collecting the respondents’ Socio - demographics
information which could be used to disaggregate the data. These variables refer
to purpose of the visit, Nationality, gender, marital status, age, level of education,
gross income, duration of the visit and frequency of visit
Section B, further divided into 2 parts, destination selection decision and
destination marketing and they were measured by using a five-point rating scale
(1 Not at all influenced to 5 extremely influenced). Destination selection decision
part indicates the influences of each of the Infrastructure attributes on the
tourist’s decision on the destination selection to visit the area and destination
marketing part finds the sources of information about the Infrastructure of the
destination.
Section C comprised of 19 statements related to the various aspects of tourism
Infrastructure in terms of attractions, accommodation, accessibility, and
amenities. The quality of the selected variables was rated on a 5-point Likert
scale ranging from 1 strongly disagree to 5 strongly agree.
Section D was structured to measure pre and post visit destination image. The
measurement for destination image is adopted from the literature review of the
study. Each measurement for the destination image was justified and modified
from previous researchers (Carla Almeida Santos,2004; Henderson, 2000; Chia-
Wei Lin,2007). There were 7 statements on destination image. Tourists were
asked to evaluate each of the statements twice to indicate to what extent they
agree with it before and after their visitation. The selected destination images

135
variables were rated on a 5-point Likert scale ranging from 1 strongly disagree to
5 strongly agree.
Section E was designed to measure the tourists’ level of satisfaction from the
infrastructure attributes of the destination and tourists’ future intention in
destination choice. They were measured by multiple – item on a five point rating
scale (1 Not at all satisfied to 5 extremely satisfied).
The tourist’s satisfaction included the satisfaction from the four aspects of
tourism Infrastructure - attractions, accommodation, accessibility, and amenities.
3.6.1.3 Sample design and data collection
The study has adopted an approach of convenience sampling method with the
combination of qualitative and quantitative data collection techniques.
A structured questionnaire was designed as the survey instrument including all
constructs of the proposed model to investigate the hypotheses of the study.
The questions in the questionnaire are based on a review of the literature and
specific destination characteristics. The survey instrument was revised and
finalized based on feedback from tourism industry experts.
The sample design and size are essential in order to provide a representative
sample (Cavana, Delahaye, & Sekaran, 2001; Zikmund 2003). Therefore, it is
imperative for the researcher to guarantee that the chosen sample design and
size are correct in order to ensure that this chosen sample represents the

136
population (Creswell 2009). Most social science studies have stated that using a
very large number of participants in a survey can be costly and time consuming.
Due to the large number of visitors to the selected destination, a complete
enumeration of the population will not be feasible so a carefully planned
convenience sample survey will produce useful and reliable result.
The concept of sampling simply means taking part of the population to represent
the whole population (Neuman, 2000). The sample size as defined by Teddlie
and Tashakkori, (2009) is to select units of analysis (e.g. people, groups) in a
way that will represent the population and enable the researcher to answer the
research questions. The main reason for sampling is economy in cost, time and
personnel.
There are various ways to determine the sample size. Roscoe (1975) suggests
that the most suitable size for social research is to select a sample size larger
than 30 and less than 500. The most widely used minimum sample size
estimation method in PLS-SEM, is the ‘10-times rule’ method (Hair et al., 2013;
Peng & Lai, 2012). Among the variations of this method, the most commonly
seen is based on the rule that the sample size should be greater than 10 times
the maximum number of inner or outer model links pointing at any latent variable
in the model (Goodhue et al., 2012).
Harris and Schaubroeck (1990) recommend a minimum sample size of 200 to
guarantee robust structural equation modeling. Neuman (2000) suggests that for
populations over 10,000, researchers should sample a minimum of 10% of the
population, whilst for populations over 100,000; researchers should sample 1%

137
of the population. According to Saunders et al’s (2007) the minimum sample size
of 384 is considered to be representative and sufficient at a 95 confidence level
for population range from 1,000,000 to 10,000,000.
Accordingly, in this research it was decided to collect a sample of around 450
international tourists. The decisions regarding the sample size and the
convenience sampling method adopted reflects the similar choices made in other
published studies of similar nature carried out at various international tourism
destinations.
The empirical study was carried out in Dubai, UAE. The target population for the
study was international tourists visiting Dubai. To participate in the survey,
tourists were approached randomly at the departure terminals of the international
airport of Dubai. The survey was conducted over a 2 month period. 425 tourists
participated in the survey. Sample control measures include restricting the
number of tourist surveyed to 10 -15 per day, and selecting the respondents at
different times of the day i.e. about 4 or 5 per flight. If tourists come with the
family, only one questionnaire was given. Not more than 4 or 5 questionnaires
were given to tourists who came in a group. Out of the 425 questionnaires
collected, 11 were discarded as not sufficiently complete for analysis and finally
resulting in a sample of 414 valid respondents.
3.6.2 Case study
Velde (2004) suggests that a case study strategy is an appropriate one to adopt
if the aim of the research is to conduct an intensive study of a phenomenon

138
within its total surroundings. It is particularly useful when the focus is on
understanding a process (Saunders, 2009). Thornhill (2003) argue that the case
study method is a very worthwhile method of exploring existing theory, and in
addition, case study method can enable you to challenge an existing theory and
also provide a source of new hypotheses.
Case studies are units of analysis and when well-constructed are holistic and
context sensitive, two of the primary strategic themes of qualitative inquiry, with
data organised by specific cases for in-depth study and comparison (Patton,
2002). A case study is an empirical inquiry that investigates a contemporary
phenomenon within its real-life context, especially when the boundaries between
phenomenon and context are not clearly evident (Yin, 2003) and the method is
most often connected primarily with qualitative data (Darke and Shanks, 2002)
using multiple sources of evidence.
Case studies can be undertaken of a variety of subjects ranging from individuals,
groups, neighbourhoods, programs, organisations, cultures, regions, or nation-
states, indeed anything that can be defined as a ―specific, unique, bounded
system‖ (Stake, 2000). The purpose is to gather comprehensive, systematic and
in-depth information about each case of interest and the analysis process results
in a product: a case study, which can refer to either the process of analysis or the
product of analysis, or both. ―Though a scholarly or evaluation project may
consist of several cases and include cross-case comparisons, the analyst‘s first
and foremost responsibility consists of doing justice to each individual case and
all else depends on that, (Patton, 2002). Case data consists of all the information
the researcher has about each case: interview data, observations, the

139
documentary data (e.g. program records or files, newspaper clippings),
impressions and statements of others about the case and contextual information
– in effect all the information one has accumulated about each particular case
goes into that case study. These diverse sources make up the raw data for case
analysis and can amount to a large accumulation of material (Patton, 2002).
Yin (2003) recommends the case study as a useful option when the study is of
current rather than historic events, and when the researcher is unable to control
them. Referring back to the nature of the research questions posed in the current
study (how, why, and what), and taking into account the fact that the focus is on
contemporary events, and that the researcher has no control over behaviour, the
case study strategy would appear to presents itself as a suitable vehicle with
which to undertake the research.
Yin (2009) noted that a major practical difficulty of analysis of case study
evidence is dealing with the amount and variety of data collected and that a
general data analysis strategy is an important part of case study design.
Therefore, the nature of this research makes the case study approach the most
appropriate. Multiple sources of data collection are employed. This provided
extra input for the direction of the overall research. Consequently, the researcher
has chosen the case study strategy as this will help to identify the context of the
study (Dubai tourism Infrastructure) in a wide perspective and also will explore
the impact of Dubai’s tourism infrastructure on destination image in order to
facilitate effective tourism marketing.

140
3.7 Case study: An overview of Dubai Tourism
The Dubai is one of the world's fastest-growing destinations for business and
tourism. This is hardly surprising because geographically, economically and
culturally, it has a unique strategic position between East and West.
Dubai has quickly become the capital for luxury, shopping and extreme
decadence. People from all over the world are drawn to this little country for its
incredible architecture, huge shopping malls, a man-made island and the tallest
building on earth, the Burj-Khalifa. Dubai is also considered a Shoppers’ Mecca,
with fashionistas and luxury-lovers gathering here January for the magnificent
shopping festival.
Never-ending heat, unlimited white sand and turquoise seas have helped to
attract many tourists over the past two decades, but it is the Dubai's unbeatable
shopping, amazing resorts, excellent restaurants, breath taking events, an
intriguing traditional culture, and a safe and secure environment that brings back
visitors back time and time again. Getting to Dubai has never become easier as it
is now a major travel hub. Today, the country is rapidly expanding its national
airlines, which is a major success story among themselves, transport millions of
visitors through its world-class airports, and where visas are available on arrival
for over 30 nationalities. The tourism in Dubai plays a major role in Dubai
government’s strategy to maintain the flow of foreign cash into the Emirate.
Dubai is known as the Shopping destination among the tourist.

141
3.7.1 Infrastructure of Dubai
Dubai’s thoughtful policy to invest heavily in creating tourist attractions,
accommodation, transportation, telecommunications, amenities and other
facilities has permitted it to have one of the greatest infrastructure services in the
world; not only this but it also donated significantly both to its ongoing wealth and
attractiveness to international business. The government features a network of
seven to eight industrial areas, they are: one business park , three highly
successful free zones of international division, two world class seaports, and a
major international airport and cargo village, metro rail, a modern highway
network, state-of-the-art telecommunications and reliable power and utilities all of
which deliver efficiency, flexibility, reliability, reasonable cost size.
Supplementing its high class infrastructure with a classy service sector that sorts
leading regional and international freight forwarders such as advertising
agencies, top international exhibition, lawyers, accounting firms, consultants,
shipping companies, insurers plus major international hotels, banks and financial
service firms, and conference facilities, high quality office and residential
accommodation, first class hospitals, schools, shopping centers, recreational
facilities and Free Zones; Dubai Airport Free Zone Jebel Ali Free Zone Dubai
Media City Dubai Internet City.
When exploring the infrastructure of a destination as vibrant as Dubai, it’s
important to allow time to unwind, with beautiful beaches; magnificent deserts,
refreshing spas, man-made islands, luxury shopping malls, ultramodern
architecture, award winning sports facilities, facilities for children, elderly and
physically challenged people, a wide selection of restaurants, and a lively
nightlife scene, there are endless options for visitors and residents alike.

142
3.7.1.1 Dubai: Attraction infrastructure
Over the years, Dubai tourism has become one of the major segments of Dubai’s
economy. With Dubai is becoming the center of tourist attraction, it has drawn
visitors from the different corners of the earth. Dubai's lure for tourists is based
mainly on shopping, but also on its possession of other ancient and modern
attractions. Dubai is also known for luxury shopping, ultramodern architecture
and a lively nightlife scene. Burj Khalifa, an 830m-tall tower, dominates the
skyscraper-filled skyline. At its foot lies Dubai Fountain, with jets and lights
choreographed to music. On man-made islands just offshore is Atlantis, the
Palm, a resort with water and marine-animal parks.
Dubai has a rich attractive centre of its 64 kilometres long coast line. This
magnificent coastline boasts of several high ranking tourist resort centers
boasting of such important tourist activities as sailing, skiing, surfing, fishing, bird
watching and golfing. Dubai is a fantastic fishing and sailing destination with
abundant sunshine and a wealth of marine life.
The desert provides tourists with magnificent excursions for camel riding, sand
skiing, dune driving, exploration of wadis and visits to selected oases and forts.
Dubai city also has an extensive network of shopping malls where world varieties
are readily stocked. The industrial development of the city has in the recent past
attracted large hordes of investors who also double as tourists. Elegant
skyscrapers are a common view in Dubai, which has greatly added to the scenic
beauty of the city.

143
Dubai is also famous for the shopping malls, gold souks and top couture fashion
boutiques; Dubai has established itself as a shopping destination. This was
further reinforced by Dubai’s famous shopping festival known as the Dubai
Shopping Festival (DSF) in which more than 3,000 retail outlets and 40 shopping
malls offering huge discounts to attract more customers not just locally but
internationally (Mydsf, 2015) . The shopping festivals joined with mega-projects
such as the Palm, the Burj Al Arab, Dubai is now situating itself on the global
map, not just for business but as a major tourist destination. According to Anwar
and Sohail (2004) UAE is perceived to be a shopping haven and it attracts the
largest number of tourists.
3.7.1.2 Dubai: Accommodation infrastructure
Tourism visitation is dependent on the combined factors of supply and demand.
The essential infrastructures required by tourists are chiefly the accommodation.
However the extent and type of accommodation that is provided by a destination
does not always correlate with the level and type of demand. The growth in
visitation is considered to be limited by the supply of accommodation, rather than
the level of demand.
Dubai is an astonishing hotel paradise which offers vivid views, rich cultural
experiences, and incredible hotels that will give memories that last a lifetime.
There are plentiful hotels in Dubai to pick from for people with all different
budgets, interests, and tastes.
In Dubai the development of the hotel industry is a top government agenda.
Hotel rooms have more than doubled in the past decade and the number is fast

144
increasing. Currently there are 555 hotels of various types in Dubai of which 62
belong to five star categories. (DTCM, 2016)
The Jumeirah group in Dubai was established in 1997 to progress and operate
five-star luxury hotels in Dubai .By constructing land-mark hotels such as the
legendary Burj Al Arab and Madinat Jumeirah which are considered as a
traditional Arab town full of bazaars, canals, and luxury spas. Moreover in 2004,
the Bab Al Shams resort was constructed in the desert as a luxury desert oasis
and spa.
Development of hospitality is largely due to the relaxation of land leasing rules
and several five-star properties are expected very soon. Among these is a hydro
polis hotel constructed up to twenty meters under water.
3.7.1.3 Dubai: Accessibility infrastructure
The level of access is one of the most important factors determining the rate of
general growth, and tourism development. The lack of easy access to the
destinations severely restricts their development progress.
Tourism development in Dubai is closely linked to its advances in the transport
sector and its accessibility to the outside world. The development of airline
services, multi-lane highways and metro rails significantly improved and
enhanced all aspects of tourism expansion.
Dubai has clear ambitions of being a major focus in the air transport in the whole
region and to this effect the Dubai authorities are putting in place the necessary
infrastructural facilities. Dubai's civil aviation has progressed quite well and its
airport is among the top twenty busiest in the world as measured by the

145
passenger volume. Between 1990 and 2004, about 20 million passengers were
carried by 100 airlines serving operating between 145 different destinations.
The Dubai airport is expected to handle about one forty million passengers in the
next few years. In addition the Dubai government is preparing for a new airport
so as to carter for increased freights. The Emirates airline is internationally
reputed to offer the most excellent services in the region. Some of her planes are
the most technologically sophisticated in the world and has won awards and
recognition for good customer services. Dubai boasts of the world's longest fully
automated railway system stretching a distance of 43 miles and serving 47
stations. This project is made up of twelve elevated stations, nine kilometers of
an underground truck, and an over ground truck stretching fifteen kilometres. An
upcoming project is on the way to construct a 1500 railway line. This proposed
line will connect Dubai to Oman, Saudi Arabia Qatar and the other emirates.
Again Dubai is one of the emirates that provide a hub for large cruise ships.
Well-designed road networks with underground tunnels as well as over ground
networks have gone a long way in eradicating traffic jams which is a common
menace in several countries thereby ensuring smooth flow of traffic. Tourists no
longer have to spend too much time in the city waiting for traffic jams to recede
as was the case a few years ago.
3.7.1.4 Dubai: Amenity infrastructure
A combination of outstanding facilities, indulgent amenities and services makes a
place the premier destination for travellers. Dubai is essentially a desert city with
superb infrastructure, liberal policies (by regional standards), that became

146
popular for its excellent tourist amenities. The destination, Dubai is featured with
luxurious amenities such as retail stores, playgrounds for children, facilities for
elderly and physically challenged people, safety and security facilities, spa,
parks, nurseries, swimming pools, tennis and basketball courts, supermarkets,
efficient water supply, international gourmet cuisines, recreational centers,
communication systems, maintenance services, community centers, schools,
gym, and many others. The emirate is the home to numerous medical and
healthcare facilities.
Just 5 h from Europe and 3 h from most parts of the Middle East, the Near East,
and the subcontinent of India, Dubai makes a great short break for shopping,
partying, sunbathing, fine dining and sporting events. It is a city of superlatives:
for the fastest, biggest, tallest, largest and highest, Dubai is the destination.
Dubai is a fantastic fishing and sailing facilities with abundant sunshine and a
wealth of marine life.
3.7.2 Infrastructure and destination image of Dubai
Under the late Sheikh Zayed, the first President of UAE, the UAE has developed
into one of the richest countries in the world with a per capita GDP in excess of
US$ 17,000 per annum.
In the 1980s and early 1990s, Dubai took a strategic decision to emerge as a
major international-quality tourism destination. Investments in tourism
infrastructure have paid off handsomely over the years.
Dubai is now a city that boasts unmatchable hotels, remarkable architecture and
world-class entertainment and sporting events. The beautiful Burj Al Arab hotel

147
presiding over the coastline of Jumeira beach is the world's only hotel with a
seven star rating. The Emirates Towers are one of the many structures that
remind us of the commercial confidence in a city that expands at a remarkable
rate. Standing 350 meters high, the office tower is the tallest building in the
Middle East and Europe.
Dubai provides beautiful parks and beaches with all the required facilities for
leisure and recreation.
From the timeless tranquillity of the desert to the lively bustle of the souk, Dubai
offers a kaleidoscope of attractions for visitors. Although Dubai is seen as a
relatively young destination, it has a fascinating history and a vibrant heritage
that offers visitors an intriguing glimpse into Arabian culture. A good place to start
exploring the history and heritage of Dubai is the Dubai Museum: it is located
inside Al Fahidi Fort, one of Dubai’s oldest buildings dating back to 1787. There
are other museums in Dubai and in surrounding emirates that also offer
important insights into the history and growth of the city and of the United Arab
Emirates.
It's hard to believe that, thirty years ago, Dubai was mostly deserted. Today, it's a
sci-fi metropolis that boasts the world's largest mall, tallest tower, biggest
dancing fountain and highest-rated hotel. Courtesy and hospitality are among the
most highly prized of virtues in the Arab world, and visitors will be charmed by
the warmth and friendliness of the people. Dubai’s culture is rooted in Islam,
providing a strength and inspiration that touches all aspects of everyday life.
Virtually every neighbourhood has its own mosque, where the faithful congregate
for prayer five times every day. One of the largest and most beautiful mosques is
Jumeirah Mosque- a spectacular example of modern Islamic architecture

148
The emirate embraces a wide variety of scenery in a very small area. In a single
day, the tourist can experience everything from rugged mountains and awe-
inspiring sand dunes to sandy beaches and lush green parks, from dusty villages
to luxurious residential districts and from ancient houses with wind towers to
ultra-modern shopping malls.
The emirate is both a dynamic international business centre and a laid-back
tourist escape; a city where the sophistication of the 21st century walks hand in
hand with the simplicity of a bygone era. But these contrasts give Dubai its
unique flavour and personality; a cosmopolitan society with an international
lifestyle, yet with a culture deeply rooted in the Islamic traditions of Arabia.
Dubai also hosts major international sporting events. The Dubai Desert Classic is
a major stop on the Professional Golf Association tour. The Dubai Open, an ATP
tennis tournament, and the Dubai World Cup, the world's richest horse race,
draw thousands every year.
One’s mind jumps to a world of magic and fantasy when it comes to Dubai, the
city which has changed over a short period of time from vast areas of sand into a
vibrant city and a destination visited by a constantly increasing number of
tourists. The tourism infrastructure development in Dubai, increased visitors
arrival and repeat visitation clearly shows that the way Dubai projects its positive
imagery as a tourist destination.
3.7.3The role of tourism infrastructure in Dubai’s destination marketing
Dubai is seen as a comparatively liberal and cosmopolitan society with 80%
expatriate population. Dubai can count on as being one of the safest cities in the

149
world. Geographically Dubai is well positioned as a tourist destination with its
tourism infrastructure facilitated by an excellent flight network from around the
world.
Tourism is a central pillar of Dubai’s economic growth and diversification. The
Tourism Vision for 2020 will further leverage the sector by broadening Dubai’s
offering across events, attractions, infrastructure, services, and packages. Part of
this strategy involves adapting a marketing approach to showcase Dubai to a
wider audience and increasing awareness and conversion of flight and hotel
bookings. Government has a key role in initiating and sustaining tourism. With
respect to tourism policy of the government, tourism was positioned at the centre
of the diversification programme alongside construction (DTCM, 2016).
In the context of promotion, Dubai’s attractions and amenities are facets of the
destination brand communicated in a number of marketing exercises. The region
has indeed benefitted from active tourism promotion around the world. Dubai’s
attractions centre on its 64 km coastline and resort hotels. Also Dubai is a city
with abundance of tourist attractions where even events are presented and
packaged as attractions.
With respect to accessibility, the growth of tourism is closely tied to the advances
in transport and easy access by air, which is a prerequisite for any country to
emerge as a leading international destination. Dubai has focused on developing
the region as the strategic air transport hub in the Middle East and Far East.
Dubai also markets itself as a cruising hub and destination on the lines of the
Singapore model offering tough competition to the crowded Caribbean and
Mediterranean region. Dubai has positioned itself in Western markets as an
exotic but safe beach tourism location with diversions of shopping and assorted

150
culture and natural heritage attractions. More focus ought to be on developing
the cultural, leisure experience in the context of natural and cultural heritage
attractions.
The revitalization in tourism, which has significantly contributed to Dubai’s eco-
nomic recovery, can be attributed to the initiatives taken jointly by Department of
Tourism and Commerce Marketing, Emirates Airlines and the Tourism industry.
One of the major reasons for a boom in tourism could be attributed to the positive
image created through a massive tourism campaign in the overseas media
particularly through world television channels. Dubai’s road shows and various
marketing programs focussing the tourist infrastructural facilities have generated
more demand for the market.
The significant tourist inflow has become a significant part of the local economy.
The region has emerged as a regional tourism hub and it can be stated that
leisure has surpassed business as a primary motive for visitors. Dubai has also
emerged as an international sporting venue. Dubai ranked among the Top 25
Cities to Visit in the World, published by Voice of America, the broadcast
institution of the United States federal government.
Travel and tourism contributes 8.7 per cent of UAE’s GDP, and supports over
half a million jobs. It contributes over Dh27 billion investment and Dh95 billion
products exchange (DTCM, 2016). The researches anticipate that over the next
decade the sector in the UAE will grow by about 5.4 per cent every year until it
reaches 11.2 per cent of GDP by around 2026. By this time around 850,00 jobs
will be sustained in the sector in the UAE.

151
3.7.4 An overall evaluation of Dubai’s tourism infrastructure
Dubai has become an important destination for regional and global tourism,
rising to prominence as a top location for shopping, leisure, sporting events,
international conferences and media events. In addition to excellent services,
Dubai has built state-of-the-art facilities and infrastructure.
Dubai has emerged as an important tourist destination on the global tourism
map. The region has become an epicentre of attraction for business people,
tourists and shoppers. The statistics reveal the growing relevance of the region.
About 14.3 million tourists had visited the region in 2015 (DTCM, 2016). Dubai is
the fourth most visited city in the world after London, Paris & Bangkok (UNWTO,
2016). Dubai has the world’s highest visitor per resident ratio from 4.9 visitors per
resident in 2009 to 5.7 in 2015 (UNWTO, 2016). Overall the success of Dubai
becomes a classic case of providing insights on how a state with an imperfect
supply of conventional, natural and cultural attractions emerged as one of the
best international tourist destinations. The following tables (Table 3.4, Table 3.5,
and Table 3.6 & Table 3. 7) provide the progress of Dubai’s tourism infrastructure
and tourist arrival statistics.

152
Table 3.4: Progress of Dubai’s tourism infrastructure – Hotels
Establishments 2000 2005 2010 2015
Hotels 243 300 382 414
Hotel Apartments 74 107 191 211
Hotel Rooms 24993 29834 51115 64878
Source: Department of Tourism and Commerce Marketing (DTCM)

153
Table 3.5: Progress of Dubai’s tourism infrastructure - Activities
Activities 1990s 2000s 2010s 2020s
1 Desert Safari Desert Safari Desert Safari Desert Safari
2 Sand Board Sand Board Sand Board Sand Board
3 Scuba Diving Scuba Diving Scuba Diving Scuba Diving
4 Hot Air Balloon Hot Air Balloon Hot Air Balloon
5 Ski Dubai Ski Dubai Ski Dubai
6
Deep Sea
Fishing
Deep Sea
Fishing
Deep Sea
Fishing
7 Ifly Ifly
8 Sky Dive Sky Dive
9 Fly Board Fly Board
10 Lego Land Lego Land
11 Shark Safari Shark Safari
Source: Department of Tourism and Commerce Marketing (DTCM)

154
Table 3.6: Progress of Dubai’s tourism infrastructure - Attractions
Attractions 1990s 2000s 2010s 2020s
1 Burj Al Arab Burj Al Arab Burj Al Arab Burj Al Arab
2 Global Village Global Village Global Village Global Village
3 Dubai Creek Dubai Creek Dubai Creek Dubai Creek
4 Palm Jumeirah Palm Jumeirah Palm Jumeirah
5 Atlantis Atlantis Atlantis
6 Dubai Mall Dubai Mall Dubai Mall
7 Burj Khalifa Burj Khalifa
8 Dubai Frame Dubai Frame
9
Butterfly
Garden
Butterfly
Garden
10 IMG world IMG world
11
Blue Waters
Islands
12
Jumeirah
Garden City
Source: Department of Tourism and Commerce Marketing (DTCM)

155
Table 3.7: Tourist arrival statistics of Dubai
Year Estimated number of tourists (In
millions)
1995 2.3
2000 3.0
2005 7.1
2010 8.4
2011 9.3
2012 10.0
2013 11.0
2014 13.2
2015 14.3
Source: Department of Tourism and Commerce Marketing (DTCM)

156
The following pictures show the development of Dubai.
Image 3.1 Development of Dubai – Then & Now

157
Image 3.2 Development of Dubai – Then & Now
Image 3.3 Development of Dubai – Then & Now

158
Image 3.4 Development of Dubai – Then & Now
Source of images: DTCM
3. 8 Data Analysis Methods used in the Research
On completion of the survey, out of the 425 questionnaires collected, 11 were
discarded as not sufficiently complete for analysis and finally resulting in a
sample of 414 valid respondents. Following statistical methods are used for the
analysis of the data collected from the above mentioned survey.
Microsoft Excel: Data collected through survey was tabulated using Microsoft
Excel spread sheet software.
Statistical Package for the Social Sciences (SPSS): Used for finding the
descriptive statistics and paired Sample T test.

159
The tabulated data from the Excel spread sheet exported to the SPSS and
analysed the Socio - Demographic characteristics of the study (descriptive
statistics). Also a paired Sample T test were performed as a preliminary analysis
with the data collected from the survey to determine the impact of tourism
infrastructure on destination image in a comparative context of pre and post
destination image.
Structural Equation Modeling (SEM): SEM is considered as one of the most
widely used statistical techniques by researchers to test complex models
involving a number of dependent and independent variables. This study used the
Partial Least Squares (PLS) method in order to analyse and validate the
Conceptual framework and hypotheses of the study.
3.9 Research Phases
The Activities in this research have been divided into three interdependent
Research Phases. These phases are - Research Planning Phase, Research
Development Phase, and Research Validation Phases
3.9.1 Research Planning Phase
Research Planning Phase include Desk studies consisting of Review of
Literature, design Data Collection (Questionnaire).
160
3.9.2 Research Development Phase
Research Development Phase activities include data collection through Pilot
Study (Expert opinion), refine questions on the basis of pilot study data analysis,
data collection through Questionnaire survey, preliminary data analysis and
generating the conceptual model.
3.9.3 Research Validation Phases
Research Validation Phases is the final phase and its objective is to validate the
relationships in the hypotheses and discuss the research findings. This phase
consists of case study analysis, validation of the relationships/paths in the
hypotheses, development of final model, final findings and analysis. The final
findings will be critically assessed to draw the conclusion and future
recommendations.
The pictorial depiction of Research Phases is shown in Figure 3.4

161
Figure 3.4 Research Phases
Research Phases
Research Planning Phase - 1
Literature Review
Research Validation
Phases - 3
Research Development
Phase - 2
Design Data Collection
(Questionnaire)
Research Planning Phase - 1
Conceptual Model
Development
Data Analysis (Preliminary) Data Collection through
Questionnaire Survey
Refine questions on the basis
of pilot study data analysis
Data Collection through Pilot
Study (Expert opinion) Research Development
Phase - 2
Final Findings & Analysis
Case study Analysis
Final Model Development
Validation of the relationships
in the hypotheses Research Validation
Phases - 3
Conclusion &
Recommendations

162
3.10 Summary
This section has given an overview of the methodological process adopted for
this research by discussing the research philosophy, research purpose, the logic
of the research and the research process. The methods of data collection, as
well as the Data Analysis Methods used in the research were also explained and
finally the research phases of the study have also been discussed in this chapter.
The following chapter presents the data analysis and discussion of the research.

163
Chapter 4 Data Analysis and Discussion
4.1 Introduction
The previous three chapters presented the context of the study, reviewed
relevant literature in tourism infrastructure, destination image and tourism
marketing, and discussed and justified the choice of research methods in data
collection and data analysis methods utilised in carrying out this study. The third
chapter also discussed the research phases, conceptual framework and the
formulation of the study hypotheses.
This section presents the data analysis and discussion of the research. The aim
of the study is to develop an assessment model that evaluates the impact of
infrastructure on destination image for effective tourism marketing. In order to
achieve this aim and the stated objectives in chapter one, this section analyses
the data collected from the questionnaire survey and presents the findings.
The chapter begins with the section, selection of appropriate statistical
techniques used in this research (Partial Least Squares (PLS)). This chapter also
discusses the various data analysis methods used in this research. The chosen
methods of analysis include the use of descriptive statistics to examine the
demographic characteristics of the respondents and a preliminary analysis to
determine the impact of tourism infrastructure on destination image in a
comparative context of pre and post destination image. Further this chapter
presents the result of the structural equation modelling (PLS –SEM) followed by
the confirmation of hypotheses.

164
4.2 Selection of appropriate statistical technique
A basic data analysis decision facing any researcher in any field of research
including tourism is the choice of statistical tools and techniques. The important
consideration in selecting an appropriate technique is the research objectives
and the characteristics of the data in question. To this end, reflection on the
research objectives and a preliminary examination of the data set is necessary to
shape the choice of techniques appropriate for testing the research hypotheses.
There are various methods to collect data. Common methods identified from
various literatures include basically two broad categories of data: qualitative and
quantitative data. Qualitative data collection methods are subjective and involve
the collection of data based on the perception of participants to gather in-depth
understanding into the study (Saunders, et al., 2012) and are normally expressed
by means of description. On the other hand qualitative data collection methods
are subjective and involve the collection of data based on the perception of
participants to gather in-depth understanding into the study (Saunders, et al.,
2012) and are articulated in numeric analysis through statistical means -
experiments and questionnaires. According to Saunders et al (2009)
questionnaires are the most commonly adopted method of collecting data in
social and management researches because of its numerous advantages.
There are four types of data in social research: nominal, ordinal, interval and
ratio (Dancey and Reidy, 2004, Kinnear and Gray, 2004). According to Howitt
and Cramer (2000) the more traditional approach is a broader distinction
between nominal and numerical data. Pallant (2001) on the other hand,

165
differentiates between categorical variables (nominal and ordinal) and continuous
variables (interval and ratio).
Nominal data assumes no natural order; categories observed do not follow any
particular ranking order. On the other hand, ordinal scales elicit in a rank order.
The nominal scale comprises the classification of observations where categories
cannot be ranked in any order, for example, gender (male or female). The ordinal
scale involves the ranking of one category against another. According to Pallant,
(2005) ordinal measures classify response sets into groups and then the groups
are ordered from the lowest to the highest, for example, age or income. The
interval scale has equal quantified separations between categories i.e.; a generic
quantitative measure where the distance between categories is equal and
measurable (de Vaus, 1996). It is argued that responses to psychometric data
can be included in this category (Ryan and Garland, 1999; Kinnear and Gray,
2004) ) and scale measuring attitude employing Likert and Likert-like models are
also argued to be in this category (Gray and Kinnear, 2011). However, the issue
over whether data produced by Likert scales should be treated as interval-level
data remains controversial, although this data is widely accepted as interval level
data in the social sciences. Finally, the ratio scale, like interval level scale, also
has measurable equidistance between categories and in addition to this the ratio
scale is the highest level of measurement; it is similar to the interval measure but
differs in that it has an absolute zero value.
Nominal data (often described as categorical data) can be analysed using
descriptive statistics and is (Pallant, 2005). By comparison, ordinal, interval and
ratio data can be analysed using inferential statistics (Shaw and Wheeler, 1994).
166
The first approach describes a data set in numerical terms and is the simplest
way of summarising data, for example, the use of basic graphs and frequency
tables.
The second approach infers relationships between two or more variables and
can be used to test hypotheses about the nature of the phenomenon under
study. Shaw and Wheeler (1994) state that inferential statistics allow researchers
to make probabilistic statements about hypothesis testing (whether a particular
supposition is true or false), the relationships between two or more variables and
the characteristics of the population from which the sample is drawn.
Additionally, where there are observations of only one variable, the data is
classified as a univariate data set, if there are two variables, it is a bivariate
dataset and if there are three or more variables, it is a multivariate data set.
In essence, variables adopt different scales or levels. The level of measurement
is a primary consideration in choosing statistical techniques; however other
criteria must also be taken into consideration.
In the analysis of the results of this study, a mixture of data types with a variety of
levels were obtained. To this end, consideration was given to the appropriate
type of statistical tests and procedures. As stated by Field (2009) categorical
(nominal) data are best analysed measuring the frequencies of the categories;
employing graphs, charts, simple frequency table and cross tabulation of
categories.
According to Shaw and Wheeler (1994) inferential statistics can be used for the
analysis of ordinal, interval and ratio data in order to understand the relationships

167
between two or more variables and test hypotheses about the nature of the
subject under examination. On this basis, inferential statistics were employed in
examining the relationships between Destination Marketing, Pre & post
Destination Image, Destination Selection &actual visitation, Tourism
Infrastructure, Destination Marketing, Tourist Satisfaction and Tourist future
Intention, and in testing the hypotheses proposed in this study. In relation to the
consideration of inferential statistics, a choice between the use of parametric and
non-parametric tests had to be made.
Parametric tests are noted to be the more powerful of the two (Howell, 2009;
Field, 2009 and Pallant, 2010) as they take advantage of interval level data to
measure accurate numerical proportions of total variability (Greene and
D'Oliveira, 1999). Alternatively, nonparametric tests calculate probabilities on the
basis of rank order scores. Thus, a significant amount of the data is lost.
However, despite its advantages, parametric tests do make assumptions about
the data whereas non-parametric statistical tests do not. Therefore, it is vital that
these assumptions are considered before a decision is made to analyse a data
set using parametric statistical tests.
Multi-group analysis allows a single analysis for parameter estimation and
hypothesis testing (Arbuckle, 2011). The multi- group analysis allows to test if
pre-defined data groups have significant differences in their group-specific
parameter estimates (e.g., outer weights, outer loadings and path
coefficients). The primary reason for conducting multi-group analysis is to
ascertain the extent of differences that might exist among groups. Multi-group
analysis provides two advantages over separate analyses for each group. First, it

168
estimates a test of significance of any discrepancy between groups
simultaneously. Second, if no significant differences are observed among the
analysed groups, the simultaneous estimation is more accurate than the
separate analysis for each group.
The theoretical model of this study was designed to empirically test the structural
relationships among the variables of the study. Since this study has a conceptual
model, Structural Equation Modeling (SEM) was utilized for testing the
hypotheses in this study
SEM techniques are prevalent in the social sciences (MacCallum & Austin,
2000). SEM is often employed to perform multivariate analysis in order to test
theories (Bagozzi, 1980). SEM allows the handling of simultaneous dependent
and independent variables along with testing of the relationships between
observed and unobserved variables holistically. SEM, which is easily extended to
produce publishable path diagrams, and hence provides an accessible model
representation (Arbuckle, 2011).
There are many statistical packages being developed to analyze SEM. Among
them are Lisrell, AMOS, Smart- PLS, M-plus, EQS, and SAS, just to mention a
few. Esposito (2009) posits that Structural Equation Modeling (SEM) consists of
two types known as the Variance Based Structural Equation Modeling (VB-SEM)
and the Covariance Based Structural Equation Modeling (CB-SEM). These two
packages have great difference in terms of their statistical approaches namely
the non-parametric testing and the parametric testing, the objective of the study
namely exploratory and confirmatory, and more importantly the algorithm

169
employed namely Generalized Least Square (GLE) and Maximum Likelihood
Estimator (MLE).
Unlike the non-parametric procedure in VB-SEM, the parametric procedures in
CB-SEM rely on the assumptions such as adequate sample size, and normally
distributed data. According to Ringle et al. (2010), the non-parametric procedure
of SEM can execute the analysis using small sample size, and does not require
normal distribution. There are great differences between the types of analysis
from the statisticians’ point of view.
According to (Hair et al., 2014), the algorithm employed in VB-SEM or popularly
known as PLS-SEM (Smart-Pls and Warp-Pls) is Generalized Least Squares
(GLS) while the algorithm employed in CB-SEM (Amos, etc.) is the Maximum
Likelihood Estimator (MLE). These two types of algorithm differ greatly in term of
efficiency of their statistical estimates for path coefficients. In reality, the VB-SEM
(GLS algorithm) completely relies on the bootstrapping procedure or known as
resampling with replacement in obtaining the estimates for path coefficients and
their respective standard errors.
In the meantime, the CB-SEM (MLE algorithm) does not require bootstrapping.
However one can execute its bootstrapping procedure in the situation where the
normality assumption is not met or for the analysis of non-normal data (Sharma
& Kim, 2013). In this case, (Sharma & Kim, 2013) also state that MLE
bootstrapping (parametric bootstrapping) is appropriate for large data-set.
However, if the researcher fails at all to meet the assumption for parametric test
in term of sample size requirement, then the VB-SEM should be employed as an
alternative and the results is deemed to be exploratory.
170
Unlike covariance-based SEM, PLS-SEM does not have stringent minimum
sample size requirement or distributional assumptions (Hair et al., 2011).PLS-
SEM becomes a good alternative to CB-SEM when the following situations are
encountered (Bacon, 1999; Hwang et al., 2010; Wong, 2010):
1. Applications have little available theory.
2. Predictive accuracy is paramount.
3. Correct model specification cannot be ensured.
In particular, the Variance Based Structural Equation Modeling (VB-SEM) can be
divided into two categories namely Partial Least Square Structural Equation
Modeling (PLS-SEM) and Generalized Structured Component Analysis (GSCA)
but PLS-SEM is more prominent than GSCA. Historically, the analysis procedure
in PLS-SEM was first initiated by (Wold & Martens, 1983) but has been modified
by (Chin, 1998) to advance the potential of PLS-SEM in statistical inference.
Therefore, PLS-SEM has also gain acceptance as CB-SEM in statistical analysis
and has been extensively employed in business and social science researches
to model complex relationships.
To this end, the model in this study is tested by using the Partial Least Square
Structural Equation Modeling (Smart PLS-SEM).
4.2.1 Partial Least Squares (PLS)
Among the different methods of multivariate analysis Structural Equation Models-
SEM largely satisfies this requirement. The SEM are tools elaborated at the

171
beginning of 1970’s, and they obtained, in that decade, a lot of appreciation, and
more and more spread use of them.
The LISREL (Jöreskog, 1970; Jöreskog & Sorbom, 1989; Byrne, Barbara, 2001)
or Covariance Structural Analysis (CSA) is at the bottom of such models. Today,
different estimation techniques can be used for the estimation of the SEM. In
1975 Wold developed a soft modelling approach, making it different from the
hard modelling approach of Lisrel, in order to analyze the relationships among
different blocks observed variables on the same statistics units. The method,
known as PLS for SEM (SEM-PLS) or as PLS-Path Modeling (PLS-PM), is
distribution free, and it was developed as a flexible technique aimed at the casual
predictive analysis when the high complexity and the low theoretical information
are present.
Wold (1975) originally developed PLS-SEM under the name NIPALS (nonlinear
iterative partial least squares), and Lohmöller (1989) extended it. PLS-SEM was
developed as an alternative to CB-SEM that would emphasize prediction while
simultaneously relaxing the demands on data and specification of relationships
(e.g., Dijkstra 2010; Jöreskog and Wold 1982). The methodological concepts
underlying both approaches have been compared in several publications,
including those by Jöreskog and Wold (1982), and Lohmöller (1989), Barclay et
al. (1995), Chin and Newsted (1999), Fornell and Bookstein (1982), Gefen et al.
(2011), Hair et al. (2011).
PLS-SEM is an alternative analytical technique to CB-SEM, which as a
complementary approach generates reliable results when the conventional SEM

172
assumptions cannot be met (Song et al. 2012). According to Wold (1985) PLS-
SEM provide results in research contexts with rich data and weak theory.
The PLS Path Modeling is a statistical method which has been developed for the
analysis Structural Models with latent variables. The aim of the PLS is to obtain
the scores of the latent variables for predicted purposes without using the model
to explain the covariation of all the indicators.
An important characteristic of PLS-SEM is that it estimates latent variable scores
as exact linear combinations of their associated manifest variables (Fornell and
Bookstein 1982) and treats them as perfect substitutes for the manifest variables.
The scores thus capture the variance that is useful for explaining the
endogenous latent variable(s). Estimating models via a series of OLS
regressions implies that PLSSEM relaxes the assumption of multivariate
normality needed for maximum likelihood–based SEM estimations (Fornell and
Bookstein 1982; Hwang et al. 2010; Lohmöller 1989; Wold 1982; for a
discussion, see Dijkstra 2010). In this context, Lohmöller (1989, p. 64) notes that
“it is not the concepts nor the models nor the estimation techniques which are
‘soft,’ only the distributional assumptions.” Furthermore, since PLS-SEM is based
on a series of OLS regressions, it has minimum demands regarding sample size
and generally achieves high levels of statistical power (Reinartz et al. 2009).
According to Chin (1988), the estimation of the parameters are obtained by
basing on the ability of minimizing the residual variances of all dependent
variables (both latent and observed). PLS –Path Modeling aims to estimate the
relationships among variables, which are expression of unobservable constructs.
Specifically, PLS- Path Modeling estimates the network of relations among the

173
manifest variables and their own latent variables, and the latent variables inside
the model through a system of interdependent equations based on simple and
multiple regressions.
PLS-SEM can almost unrestrictedly handle both reflective and formative
measures (e.g., Chin 1998). Furthermore, PLS-SEM is not constrained by
identification concerns, even if models become complex, a situation that typically
restricts CB-SEM usage (Hair et al. 2011). Some researchers prefer doing CFA
in PLS-SEM due to the complicated of fitness index provided in CB-SEM and
subsequent used PLS-SEM as a solution. In fact, Hair et al. (2011) also states
that PLS-SEM is meant for exploratory research while CB-SEM is meant for
confirmatory research.
According to (Hair et al., 2014), the algorithm employed in VB-SEM or popularly
known as PLS-SEM (Smart-Pls and Warp-Pls) is Generalized Least Squares
(GLS) while the algorithm employed in CB-SEM (Amos,etc.) is the Maximum
Likelihood Estimator (MLE). These two types of algorithm differ greatly in term of
efficiency of their statistical estimates for path coefficients. PLS-SEM’s distinctive
methodological features make it a possible alternative to the more popular CB-
SEM approaches (Henseler et al. 2009).
In particular, the Variance Based Structural Equation Modeling (VB-SEM) can be
divided into two categories namely Partial Least Square Structural Equation
Modeling (PLS-SEM) and Generalized Structured Component Analysis (GSCA)
but PLS-SEM is more prominent than GSCA. Historically, the analysis procedure
in PLS-SEM was first initiated by (Wold & Martens, 1983) but has been modified
by (Chin, 1998) to advance the potential of PLS-SEM in statistical inference.

174
Therefore, PLS-SEM has also gain acceptance as CB-SEM in statistical analysis
and has been extensively employed in business and social science researches
to model complex relationships.
The multi group analysis allows to test if pre-defined data groups have significant
differences in their group-specific parameter estimates (e.g., outer weights, outer
loadings and path coefficients). Smart PLS provides outcomes of four different
approaches that are based on bootstrapping results from every group. Sarstedt
et al. (2011) describe the multigroup analysis methods in detail.
1. Confidence Intervals (Bias Corrected)
This method computes the bias-corrected confidence intervals for the
group specific estimations of parameters in the PLS path model. The
group-specific results of a path coefficient are significantly different if the
bias-corrected confidence intervals do not overlap.
2. Partial Least Squares Multigroup Analysis (PLS-MGA)
This method is a non-parametric significance test for the difference of
group-specific results that builds on PLS-SEM bootstrapping results. A
result is significant at the 5% probability of error level, if the p-value is
smaller than 0.05 or larger than 0.95 for a certain difference of group-
specific path coefficients. Please note: The PLS-MGA method (see
Henseler et al., 2009), as implemented in SmartPLS, is an extension of
the original nonparametric Henseler's MGA method (as described, for
example, by Sarstedt et al., 2011).

175
3. Parametric Test
This method is a parametric significance test for the difference of group-
specific PLS-SEM results that assumes equal variances across groups.
4. Welch-Satterthwait Test This method is a parametric significance test for
the difference of group-specific PLS-SEM results that assumes unequal
variances across groups.
Multigroup analysis settings in Smart PLS select each group for the analysis. The
selected groups will be assessed for significant differences in the parameter
estimates (e.g., outer weights, outer loadings and path coefficients). All data
groups selected under Group A will be compared against all data groups
selected under Group B.
When applying PLS-SEM, researchers need to follow a multi-stage process
which involves the specification of the inner and outer models, data collection
and examination, the actual model estimation, and the evaluation of results. In
the following, this review centers on the three most salient steps: (1) model
specification; (2) outer model evaluation; and (3) inner model evaluation. Hair et
al. (2014) provide an in-depth introduction into each of the stages of PLS-SEM
use.
1. Model specification :
The model specification stage deals with the set-up of the inner and outer
models. The inner model, or structural model, displays the relationships
between the constructs being evaluated. The outer models, also known as
the measurement models, are used to evaluate the relationships between
the indicator variables and their corresponding construct.

176
The first step in using PLS-SEM involves creating a path model that
connects variables and constructs based on theory and logic (Hair et al.,
2014). In creating the path model it is important to distinguish the location
of the constructs as well as the relationships between them. Constructs
are considered either exogenous or endogenous. Whereas exogenous
constructs act as independent variables and do not have an arrow pointing
at them, endogenous constructs are explained by other constructs. While
often considered as the dependent variable within the relationship,
endogenous constructs can also act as independent variables when they
are placed between two constructs. When setting up the model,
researchers need to be aware that in its basic form, the PLS-SEM
algorithm can only handle models that have no circular relationship
between the constructs. This requirement would be violated if we reversed
the relationship.
After the inner model is designed, the researcher must specify the outer
models. This step requires the researcher to make several decisions such
as whether to use a multi-item or single-item scale (Diamantopoulos et al.,
2012; Sarstedt and Wilczynski, 2009) or whether to specify the outer
model in a reflective or formative manner (Diamantopoulos and
Winklhofer, 2001; Gudergan et al., 2008). The sound specification of the
outer models is crucial because the relationships hypothesized in the inner
model are only as valid and reliable as the outer models. Independent
variablesare measured formatively, while all other constructs have a
reflective measurement specification. When formative measures are
involved in a model the number of items per construct can be much

177
higher, especially, as these – by definition – need to capture the entire
domain of the construct (Diamantopoulos and Winklhofer, 2001;
Diamantopoulos et al., 2008).
2. Outer model evaluation:
Once the inner and outer models have been specified, the next step is
running the PLS-SEM algorithm (for a description, see Henseler et al.,
2012) and, based on the results, evaluating the reliability and validity of
the construct measures in the outer models. By starting with the
assessment of the outer models, the researcher can trust that the
constructs, which form the basis for the assessment of the inner model
relationships, are accurately measured and represented. When evaluating
the outer models, the researcher must distinguish between reflectively and
formatively measured constructs (Ringle et al., 2011; Sarstedt and
Schloderer, 2010). The two approaches to measurement are based on
different concepts and therefore require consideration of different
evaluative measures.
3. Inner model evaluation.
Once the reliability and validity of the outer models is established, several
steps need to be taken to evaluate the hypothesized relationships within
the inner model. This aspect of PLS-SEM is different from CB-SEM in that
the model uses the sample data to obtain parameters that best predict the
endogenous constructs, as opposed to estimating parameters that
minimize the difference between the observed sample covariance matrix
and the covariance matrix estimated by the model. The assessment of the

178
model’s quality is based on its ability to predict the endogenous
constructs. The researcher needs to test the inner model for potential
collinearity issues. As the inner model estimates result from sets of
regression analyzes, their values and significances can be subject to
biases if constructs are highly correlated (for a discussion and
demonstration, see Hair et al., 2014). Therefore, collinearity assessment
in the inner model is of pivotal importance when the model includes
formatively measured constructs.
Consequently, Chin (1998) has established a catalog to assess the partial model
structures that involve two processes namely the assessment of the outer and
inner model. To assess the fitness of measurement model it depends on the
criteria such as Cronbach Alpha (Nunally, 1978), Composite Reliability (Werts,
Lim & Joreskog, 1974), indicator reliability (Churchill, 1979), Average Variance
Extracted (Fornell & Larcker, 1981), and cross loadings (Chin, 1998; Gotz et al.,
2010). Table 4.1 present the description of each criterion.

179
Table 4.1: Criterion to assess the fitness of measurement model
Criterion Description
Cronbach Alpha
Provide an estimate for the reliability based on the
interrelationship of the measuring items.
Composite Reliability Takes into account that indicators have different loadings
Indicator Reliability
Postulates that a latent variables should explain a
substantial part of each indicators variance
Average Variance
Extracted To capture the variance of its indicator
Cross Loadings To check for the discriminant validity
Source: Henseler et al (2009)
As PLS-SEM has become a more widely used method in different areas of
research, several points should be considered when applying PLS-SEM, some of
which, if not handled properly, can seriously compromise the analysis’s
interpretation and value. The PLS-SEM’s methodological foundations and
complementary analysis techniques should be considered more strongly so that
the method’s value in research and practice can be clarified.
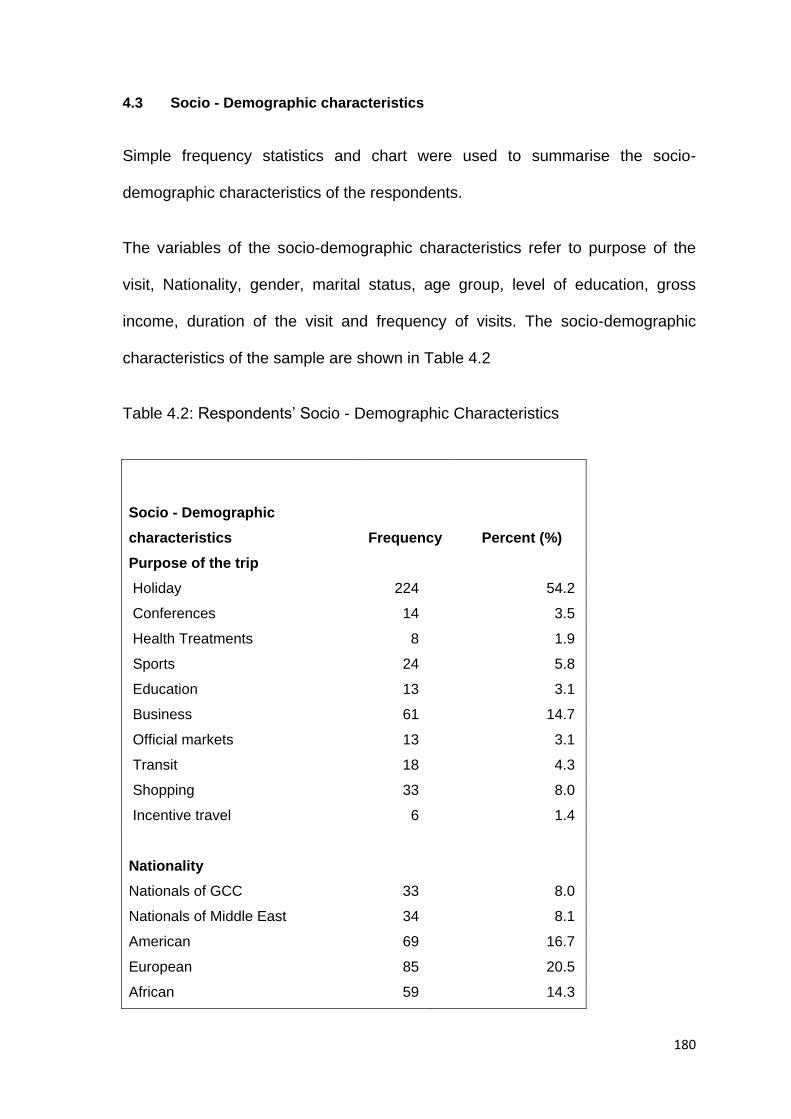
180
4.3 Socio - Demographic characteristics
Simple frequency statistics and chart were used to summarise the socio-
demographic characteristics of the respondents.
The variables of the socio-demographic characteristics refer to purpose of the
visit, Nationality, gender, marital status, age group, level of education, gross
income, duration of the visit and frequency of visits. The socio-demographic
characteristics of the sample are shown in Table 4.2
Table 4.2: Respondents’ Socio - Demographic Characteristics
Socio - Demographic
characteristics Frequency Percent (%)
Purpose of the trip
Holiday 224 54.2
Conferences 14 3.5
Health Treatments 8 1.9
Sports 24 5.8
Education 13 3.1
Business 61 14.7
Official markets 13 3.1
Transit 18 4.3
Shopping 33 8.0
Incentive travel 6 1.4
Nationality
Nationals of GCC 33 8.0
Nationals of Middle East 34 8.1
American 69 16.7
European 85 20.5
African 59 14.3

181
Asian 100 24.2
Australian 34 8.2
Gender
Male 254 61.4
Female 160 38.6
Marital Status
single 183 44.2
Married 231 55.8
Age Group
15-19 26 9.6
20-24 55 20.4
25-34 83 30.7
35-44 53 19.6
45-54 39 14.4
55 and above 14 5.3
Level of Education
Primary 3 0.7
High School 50 12.1
Diploma 63 15.2
Bachelor’s Degree 189 45.7
Post Graduate 77 18.6
Post Graduate and Above 32 7.7
Gross Income
USD 0 -1,000 43 10.4
USD 1,000-3,000 25 6.1
USD 3,000-5,000 54 13.0
USD 5,000-7,000 30 7.2
USD 7,000-9,000 52 12.6
USD 9,000-11,000 70 16.9
USD 11,000-13,000 65 15.7
USD 13,000 and above 75 18.1

182
Duration Of Stay
Days 153 37.0
Weeks 146 35.2
Months 115 27.8
Visit to Dubai (Frequency)
First time 172 41.5
Repeat Visit 242 58.5
For the ‘Purpose of the visit’ item, more than half of the respondents (54.2%) visit
Dubai for holiday, which formed the largest group. The rest of respondents
visited Dubai with the purpose of visit as business (14.7%), shopping (8.0%),
sports (5.8%), transit (4.3%), conference (3.5%) education (3.1%), Official
markets (3.1%), health Treatments (1.9%) and incentive travel (1.4%). It clearly
shows that, although the main purpose of traveling is holiday, Dubai provides
people opportunists for business, shopping and sports.
Nationality wise, majority of the sample is in the Asian category, which forms
24.2 percent of the total sample and followed by Europeans (20.5%). 16.7
percent of respondents were Americans, Africans represented 14.3 % of the
sample and the lowest recorded were Australians (8.2%), Nationals of Middle
East (8.1%)and Nationals of GCC (8.0%).
About 61.4 percent male and 38.6 percent female tourists were participated in
this survey. 44.2 percent of respondents were single and 55.8 percent of them
were married.

183
Respondents aged between 25 to 34 years old formed the largest group (30.7%),
followed by those aged between 20 to 24 years old (20.4%), 19.6 percent of
respondents were in age group 35 to 44, age group 45 to 54 forms 14.4 percent
of respondents, age groups 15 to 19 and 55 and above were 9.6% and 5.3%
respectively .
One of the important socio-demographic variables used in this study is
educational level of the tourists, which can also have some effect on various
travel related variables. The educational profile of the sample, as shown in the
Table 9, indicates that the sample is highly represented by those with Bachelor’s
Degree qualification (45.7%), followed by those with postgraduate degree
(18.6%). Tourists with Diploma and high school levels were 15.2% and 12.1%
respectively. Respondents with Post Graduate and above represented at 7.7 %
in the sample and the lowest recorded education level of respondents were
Primary education (0.7%). This pattern may also indicate that the overall
educational profile of international tourists visiting Dubai is one with above
average education level.
In terms of gross income, the data shows 18.1% of respondents’ annual income
was above USD 13,000. 16.9% respondents’ income level was USD 9,000 to
11,000. 15.7% of respondents’ annual income was from USD 11, 000 to 13,000.
13 % respondents indicated their annual income as USD 3,000 to 5000. The
income level USD 0 to 1000 form 10.4 % of respondents. Tourists with USD
5,000 to 7000 and USD 1,000 to 3000 were the lowest recorded gross income
groups and were 7.2% and 6.1% respectively.
184
Duration of the stay is another variable used in the study as one of the socio-
demographic characteristics. For the sample, the average trip duration in Dubai
measured as days, weeks and months. 37.0 percent of the sample spent some
average number of days in Dubai which consists of less than one week and 35.2
percent of the respondents spent some weeks in Dubai which consists of less
than one month and the duration of the stay of 27.8 percent of tourists were a
month or more. This result presented tourists in Dubai tended to spend short
time than long vacation due to various reasons.
The last question in demographic profile is the frequency of the visit to Dubai,
58.5 percent of the sample is with a repeat visit to Dubai and 41.5 percent were
first time visitors. This result shows the majority of the tourists repeat their visit to
Dubai.
4.4 Preliminary analysis to determine the impact of tourism
infrastructure on destination image in a comparative context of pre
and post destination image
The importance of destination image in tourism is undeniable. Both aspects of
destination image, secondary and primary, are very important in shaping the
overall image. A comparison between them would bridge the tourists’
expectations with experience by revealing the exact deviations from the original
perception. According to the scientific literature there are limited researches that
compare, directly, these two dimensions of the image, using a representative

185
sample from departure tourists. Such a comparison would enrich the limited
empirical research on this specific issue.
The importance of tourism destination image make it one of the most researched
topics in the tourism literature (Pike, 2002; Kim, Mckercher, & Lee, 2009; Lin &
Huang, 2009; Mazanec & Wober, 2010). Tourism literature has demonstrated
that destination image is a crucial factor in the selection of tourism destinations
and therefore in the flows of tourists (Hunt, 1975; Goodrich, 1978; May & Jarris,
1981, Fakeye & Crompton, 1991; Chon, 1991; Echtner & Ritchie, 1991; Pike,
2002). Reid and Bojanic (2009) defined destination image as ‘the impression a
person holds about a destination in which he does not reside’.
Destination images have been distinguished in the literature in many ways (Gunn
1972; Gartner, 1993). Gunn (1972) view image as both organic and induced.
According to Gunn (1972) the organic (mental) image is the image that is
accumulated from the non-commercial sources such as news, and the word of
mouth (WOM) gained from friends and relatives while the induced (initial) image
is shaped from the information attained from commercial sources such as
advertising and tour operators and travel agencies. However, the literature
demonstrated that the formation of destination image is influenced not only by
the source of information in the destination itself but also by other factors
including: tourism motivation; socio-economic; and demographic characteristics
of the tourists (Mayo& Jarvis, 1981; Beerli & Martin, 2004; Kim, McKercher, &
Lee, 2009).
Fakeye and Crompton (1991) divided the tourist destination image into three
types -organic image, induced image and complex image. Original image refers
186
to the information that is casual and obtained through non-active search, the
source of which is not dominated by tourism professionals, rather, comes from
newspaper reports, magazine articles, news coverage, videos, geography or
history books. Induced image refers to the information dominated by tourism
professionals, e.g. advertisements on sightseeing, tourist information
publications and cyberspace set up by tourism professionals, which are mainly
marketing and promotion practices carried out by tourism professionals for
publicity. Complex image refers to tourists’ actual travel experience after
reaching the tourist destinations, which will later affect their willingness to revisit
the place after reassessment.
Fakeye and Crompton suggest that the tourist destination image can be divided
into three types - organic image, induced image and complex image. However,
the researcher believes that before their arrival, it is difficult for tourists to identify
whether a variety of information they have received is dominated by tourism
professionals or not. Thus, in this research, tourist destination image can only be
divided into two types - organic image and complex image. Tourist destination
image is complex and multi-faceted, involving tourists’ subjectivity and various
travel behaviors. The tourist destination image before tourists’ arrival is the
important factor in tourists’ choice of future tourist destinations (Gunn, 1972).
Some studies identified that the tourist destination image is composed of
cognitive imagery and emotional imagery. Cognitive imagery refers to travelers’
consciousness towards tangible characteristics of the environment, which
focuses on the real properties of the tourist destination; emotional imagery refers
to travelers’ emotions to the tourist destination, which centers on the abstract

187
properties (Baloglu Brinberg, 1997; Baloglu & McCleary, 1999a). The formation
of the tourist destination image is influenced by personal factors and stimulus
factors. Personal factors include cognitive, emotional and demographic attributes
in the psychological level such as travel motivation. Stimulus factors include
tangible things, past experiences, sources of information, etc. (Baloglu &
McCleary, 1999b; Beerli & Martin, 2004).
Other studies have researched the pre- and the post- visits perceived images of
the destination (Pearce,1982; Gunn, 1988; Fakeye & Crompton, 1991; Garter,
1993; Baloglu & Macheraly, 1999; Grosspietsh, 2004; Kim, McKercher, & Lee,
2009; Wang & Davidson, 2010) which is this study has adapted. The pre-visit
image may involve both the organic and the induced images while the post-visit
image may refer to the experiential image that is accumulated from the first
moments of arriving at the host destination until returning back to the home
country.
Post-experience images or modified images of a destination, unlike pre-visit
images held by potential tourists; reflect tourists’ actual experiences in the
destination. This research focused on both pre- and post-visit images and tried to
ascertain any differences between them in the context of Dubai tourism.
Section D of the questionnaire was structured to measure pre and post visit
destination image. There were 7 statements on destination image. Tourists were
asked to evaluate each of the statements twice to indicate to what extent they
agree with it before their visit and after their visit and were rated on five-point
Likert type scale ranging from 1 strongly disagree to 5 strongly agree. To

188
participate in the survey, tourists were approached randomly at the departure
terminals of the international airports of Dubai.
The statements regarding the destination image of Dubai are listed in the
following table 4.3
Table 4.3: Pre and post visit destination image statements
1. Most people have a positive opinion about this tourist destination.
2. This tourist destination is a friendly and popular place.
3. This tourist destination has a unique image.
4.
Dubai is a vibrant youthful city has enormous shopping malls and great
Nightlife
5. Dubai is a cosmopolitan city (e.g. fairly large populations, many
multinational corporations, center for financial and education institution)
6. Dubai is a modern city comprises active populations, skyscrapers and
great crowds
7. Dubai is a sophisticated city which combines cultural heritages,
traditional urbanism and modernity together
A tabulation of the results of the survey conducted on the pre and post
destination images is presented in table 4.4, table 4.5, table 4.6, and table 4.7. It
shows the differences between the two images in the 7 statements about the
destination. The results were calculated using the paired Sample T test.
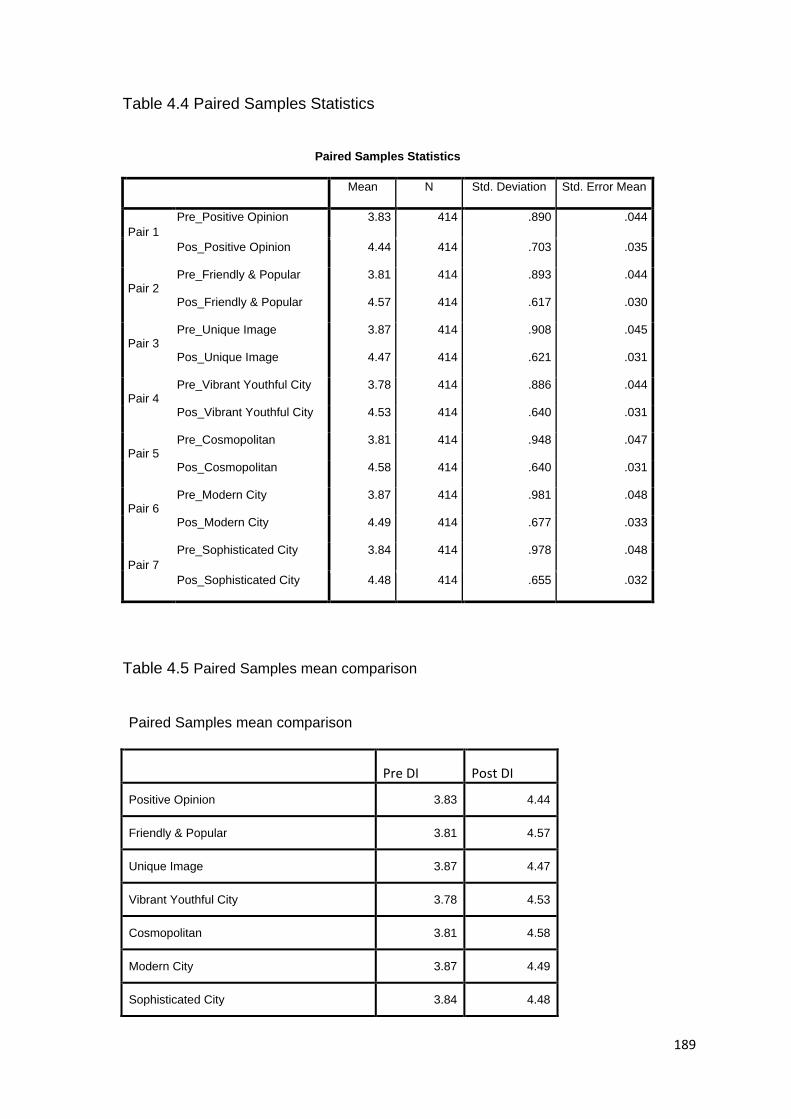
189
Table 4.4 Paired Samples Statistics
Paired Samples Statistics
Mean N Std. Deviation Std. Error Mean
Pair 1
Pre_Positive Opinion 3.83 414 .890 .044
Pos_Positive Opinion 4.44 414 .703 .035
Pair 2 Pre_Friendly & Popular 3.81 414 .893 .044
Pos_Friendly & Popular 4.57 414 .617 .030
Pair 3 Pre_Unique Image 3.87 414 .908 .045
Pos_Unique Image 4.47 414 .621 .031
Pair 4 Pre_Vibrant Youthful City 3.78 414 .886 .044
Pos_Vibrant Youthful City 4.53 414 .640 .031
Pair 5 Pre_Cosmopolitan 3.81 414 .948 .047
Pos_Cosmopolitan 4.58 414 .640 .031
Pair 6 Pre_Modern City 3.87 414 .981 .048
Pos_Modern City 4.49 414 .677 .033
Pair 7
Pre_Sophisticated City 3.84 414 .978 .048
Pos_Sophisticated City 4.48 414 .655 .032
Table 4.5 Paired Samples mean comparison
Paired Samples mean comparison
Pre DI Post DI
Positive Opinion 3.83 4.44
Friendly & Popular 3.81 4.57
Unique Image 3.87 4.47
Vibrant Youthful City 3.78 4.53
Cosmopolitan 3.81 4.58
Modern City 3.87 4.49
Sophisticated City 3.84 4.48

190
Table 4.6 Paired Samples Correlations
Paired Samples Correlations
N Correlation Sig.
Pair 1 Pre_Positive Opinion &
Pos_Positive Opinion 414 .393 .000
Pair 2 Pre_Friendly & Popular &
Pos_Friendly & Popular 414 .437 .000
Pair 3 Pre_Unique Image &
Pos_Unique Image 414 .266 .000
Pair 4 Pre_Vibrant Youthful City &
Pos_Vibrant Youthful City 414 .364 .000
Pair 5 Pre_Cosmopolitan &
Pos_Cosmopolitan 414 .347 .000
Pair 6 Pre_Modern City &
Pos_Modern City 414 .282 .000
Pair 7 Pre_Sophisticated City &
Pos_Sophisticated City 414 .376 .000

191
Table 4.7 Paired Samples Test - Differences
Paired Samples Test
Paired Differences t df Sig. (2-
tailed) Mean Std.
Deviation
Std. Error
Mean
95%
Confidence
Interval of the
Difference
Lower Upper
Pair 1 Pre_Positive Opinion -
Pos_Positive Opinion .611 .892 .044 -.697 -.525 -13.944 413 .000
Pair 2 Pre_Friendly & Popular -
Pos_Friendly & Popular .758 .835 .041 -.839 -.678 -18.485 413 .000
Pair 3 Pre_Unique Image -
Pos_Unique Image .599 .953 .047 -.691 -.507 -12.784 413 .000
Pair 4 Pre_Vibrant Youthful City -
Pos_Vibrant Youthful City .744 .884 .043 -.829 -.659 -17.121 413 .000
Pair 5 Pre_Cosmopolitan -
Pos_Cosmopolitan .766 .942 .046 -.857 -.675 -16.544 413 .000
Pair 6 Pre_Modern City -
Pos_Modern City .614 1.023 .050 -.712 -.515 -12.203 413 .000
Pair 7 Pre_Sophisticated City -
Pos_Sophisticated City .643 .950 .047 -.734 -.551 -13.755 413 .000
The general observation that can be noticed is that the respondents experienced
the infrastructure of Dubai as higher than what they expected. In other words, the
actual experience was higher than the expectations. The results demonstrated
that the post- destination image was evaluated as higher than the pre-
destination image with respects to all of the given statements. The highest post

192
destination image indicates the highest standard of Infrastructure & highest level
of satisfaction.
When found out the differences between the means of the pre- and post-
destination images of each statements of Dubai, the highest difference was for
the fifth statement “Dubai is a cosmopolitan city (e.g. fairly large populations,
many multinational corporations, center for financial and education institution)”
and the third statement regarding the destination image (This tourist destination
has a unique image) was assessed as the lowest among all.
The results indicate the presence of better infrastructure of Dubai. By giving the
realistic image of the destination through variety of marketing activities could
attract more tourists. The marketers can capitalize on the positive word of mouth
spread by those who have travelled to the country, either by using those words
verbatim in their communication or by developing tourist relationship
management through ongoing communication with tourists.
The research revealed the pragmatic dimensions, indicated the priorities for
marketing and management actions and suggested through this comparison a
new kind of image.
4.5 Validation of the research model
The structural model can be considered satisfactory with the confirmation of
acceptable reliability, convergent validity, discriminant validity and tested for
hypothesis and research model validation.
193
The first part in evaluating a model is to present the outer model results to
examine the reliability and validity of the measures used to represent each
construct (Chin, 2010).
The internal consistency for reliability of the measurement models was tested
using Cronbach’s alpha and Fornell’s composite reliability (Fornell &Larcker,
1981). Construct validity was examined by convergent and discriminant validity
(Chin, Gopal, &Salisbury, 1997). Convergent validity is the measure of constructs
that theoretically should be related to each other, and discriminant validity is the
measure of constructs that, theoretically, should not be related to each other
(Kim, 2012). Both measures work together as subtypes of construct validity, and
neither measure alone is sufficient for establishing construct validity (Chin, 1998).
Convergent validity was assessed by examining the item loadings and their
associated t-values. The AVE can be used for evaluating discriminant validity
and eventually the structural model was evaluated using standardized path
coefficients and their significance level (t-statistic) to confirm the hypotheses of
the study.
4.5.1 Measurement Model
The measurement model and the structural model (Hoyle 1995; and Kline 2005)
are the two components of any Structural Equation Model (SEM). The first, the
measurement model, is used to validate the indicators that are used to measure
the latent variables using a confirmatory factor analysis (Chin, 2010). The second
is used to describe the casual relationships between different variables in the
research model (Hoyle 1995). This Section focuses on the measurement model,

194
whereas Section 4.5.2 describes the structural model result. In order to specify a
valid measurement model, it is imperative to establish satisfactory convergent
and discriminant validities for the research model. The measurement model used
in the PLS analysis is shown in Figure 4.1
Figure 4.1: Measurement Model

195
4.5.1.1 Validity and Reliability
Validity and reliability of the latent variables are essential to complete the
analysis of the structural model. Before testing the hypotheses, reliability and
construct validity scores were examined to ensure the appropriateness of the
research instrument. In order to assess the Validity and reliability of the
constructs the PLS-SEM analyses Composite Reliabilities (CR) and the Average
Variance Extracted (AVE)
The item loadings from the outer measurement model were examined in order to
assess the item reliabilities. The correlation coefficients between the indicator
and the latent variable represent the item loadings. The composite reliability of all
constructs values shows larger than 0.7 demonstrate high level of internal
consistency reliability (Hair et al., 2006).
To check convergent validity, each latent variable’s AVE (Average Variance
Extracted) is evaluated. To confirm the discriminant validity the study followed
Fornell and Laker (1981) method. Fornell and Larcker (1981) suggest that the
square root of AVE in each latent variable can be used to establish discriminant
validity, if this value is larger than other correlation values among the latent
variables.
4.5.1.2 Convergent Validity
Reliabilities of items in relation to their constructs (Cronbach's Alpha), Composite
Reliabilities (CR) of constructs, and the Average Variance Extracted (AVE) are
used in order to assess the convergent validity (Fornell & Larcker, 1981).
Convergent validity is assured if the minimum acceptable Cronbach’s alpha is
0.70 or above (Nunnally and Bernstein1994). According to Hair et al. (2006) the

196
composite reliability of all constructs should be 0.70 or more, which is the
suggested standard for acceptable construct reliability. The recommended
threshold for the Average Variance Extracted (AVE) of all constructs is 0.50 or
more (Fornell & Larcker, 1981). Table 4.8 below shows Convergent Validity of
Constructs.
Table4.8: Convergent Validity of Constructs
Constructs
No. Items
Cronbach's
Alpha
Composite
Reliability
Average Variance
Extracted (AVE)
Accessibility 4 0.832 0.888 0.664
Accommodation 5 0.857 0.898 0.638
Amenities 6 0.806 0.860 0.506
Attractions 4 0.704 0.821 0.543
D.S. Decisions 4 0.871 0.912 0.722
Destination Marketing 6 0.818 0.867 0.521
Future Intention 6 0.845 0.865 0.519
Post Destination Image 7 0.915 0.932 0.661
Pre Destination Image 7 0.940 0.951 0.733
Tourism Infrastructure 1 1.000 1.000 1.000
Tourist Satisfaction 4 0.862 0.906 0.707
The item loadings from the outer measurement model were examined in order to
assess the item reliabilities. The correlation coefficients between the indicator
and the latent variable represent the item loadings. The composite reliability of all
constructs exceeds the 0.70 threshold, which is the suggested benchmark for
acceptable construct reliability (Hair et al. 2006). The Average Variance
Extracted (AVE) of all constructs and the communality results in the model

197
exceed 0.50 which is the recommended threshold (Fornell & Larcker, 1981).
Table 17 shows that the research model in this study meets the minimum
requirements for convergent validity.
4.5.1.3 Discriminant Validity
Discriminant validity is guaranteed when the following two conditions are met: 1)
the value of the AVE is above the threshold value of 0.50 (Fornell & Larcker,
1981), and 2) the square root of Average Variance Extracted (AVE) for each
construct is higher than its correlations with other constructs. From Table 17 it is
found that all of the AVE values are greater than the acceptable threshold of 0.5,
so discriminant validity is confirmed. Thus, the model was considered
satisfactory with the confirmation of acceptable reliability, convergent validity,
discriminant validity and tested for hypothesis and research model validation.
Table 4.9 shows the discriminant validity.
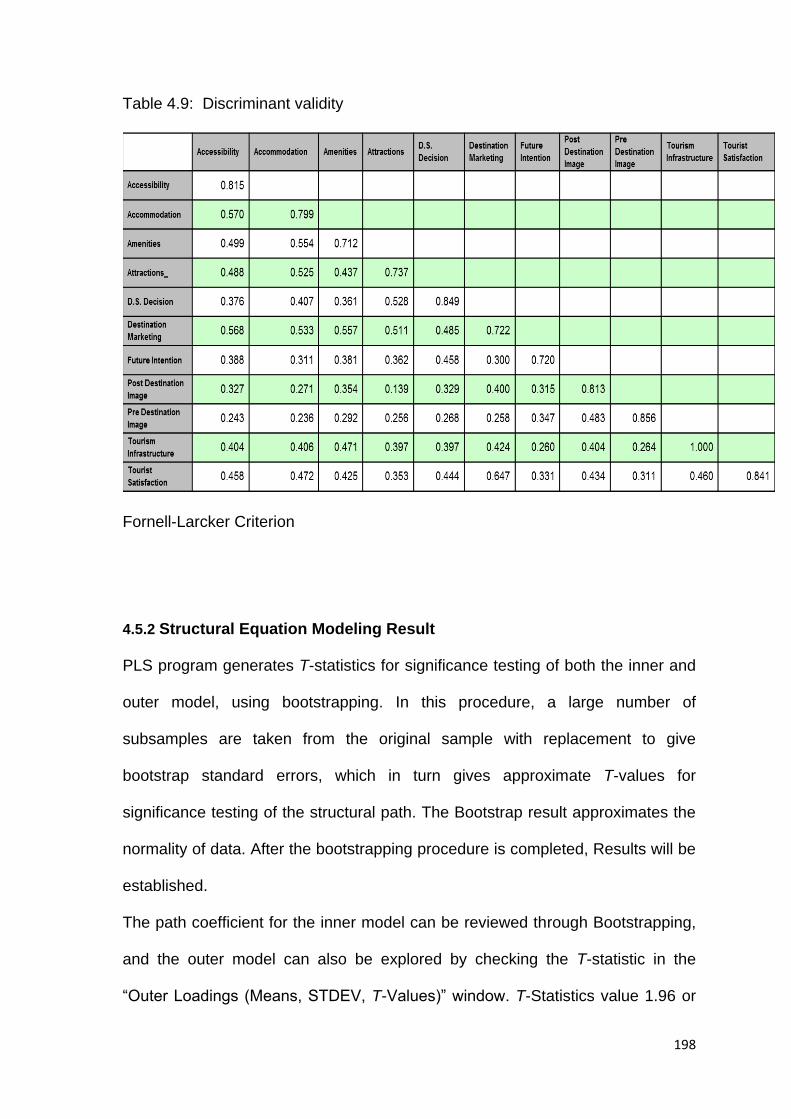
198
Table 4.9: Discriminant validity
Fornell-Larcker Criterion
4.5.2 Structural Equation Modeling Result
PLS program generates T-statistics for significance testing of both the inner and
outer model, using bootstrapping. In this procedure, a large number of
subsamples are taken from the original sample with replacement to give
bootstrap standard errors, which in turn gives approximate T-values for
significance testing of the structural path. The Bootstrap result approximates the
normality of data. After the bootstrapping procedure is completed, Results will be
established.
The path coefficient for the inner model can be reviewed through Bootstrapping,
and the outer model can also be explored by checking the T-statistic in the
“Outer Loadings (Means, STDEV, T-Values)” window. T-Statistics value 1.96 or

199
above shows that the outer model loadings are highly significant. Thus the
hypothesis can be adopted.
4.5.2.1 Confirmation of Hypotheses
In order to confirm the hypotheses of the study the calculation of the significance
/ insignificance and the strength of every path in the structural model were tested
using Structural Equation Modeling (SEM) through Partial Least Squares (PLS).
To get the strength of each path PLS finds a beta value (β). In addition, the
statistical significance / insignificance of every path or hypothesis can be tested
through PLS bootstrapping analysis (Figure 4.2).

200
Figure 4.2: The bootstrapping results
As mentioned earlier, the distribution of latent variables shows a general positive
attitude and the PLS analysis shows significant paths of all variables and their
relationships. The following Table 4.10 shows the hypotheses confirmation results:

201
Table 4.10: Hypotheses confirmation results
*significant at p < 0.01 **significant at p < 0.05

202
The results of PLS analysis shows all structural paths are significant.
As shown in Figure 17 , Destination marketing has a significant impact on pre
destination image (T= 5.582> 1.96, β = 0.258, P < 0.01) leading support H1.
Destination Marketing has a significantly positive effect on destination selection &
actual visitation (T= 8.067> 1.96, β = 0.366, P < 0.01) thus supporting H2
In addition, Pre - destination image has a positive and significant influence on
destination selection & actual visitation (T = 2.621 > 1.96, β = 0.117, P < 0.01) in
support of H3.
Furthermore, the PLS analysis results show that the Tourism Infrastructure has a
positive and significant impact on destination selection & actual visitation, (T=
4.600> 1.96, β = 0.211, P < 0.01) in support of H4.
Tourism infrastructure is determined by the quality of the attractions of the
destination. H4a (T = 2.928 > 1.96, β = 0.161, P < 0.01)
Tourism infrastructure is determined by the quality of the accessibilities of the
destination. H4b (T = 1.998 > 1.96, β = 0.088, P < 0.05)
Tourism infrastructure is determined by the quality of the accommodations of the
destination. H4c (T = 2.438 > 1.96, β = 0.132, P < 0.05)
Tourism infrastructure is determined by the quality of the amenities of the
destination.H4d (T = 5.007 > 1.96, β = 0.285, P < 0.01)
Tourism Infrastructure has a positive and significant impact on Post - destination
image.H5 (T = 7.919 > 1.96, β = 0.404, P < 0.01)

203
Tourism Infrastructure has a positive and significant influence on Destination
Marketing H6 (T = 5.855 > 1.96, β = 0.289, P < 0.01)
Post - destination image has a positive and significant influence on Tourist
satisfaction H7 (T = 10.578 > 1.96, β = 0.434, P < 0.01)
Post - destination image has a positive and significant influence on Destination
Marketing H8 (T = 4.334 > 1.96, β = 0.235, P < 0.01)
Tourist satisfaction has a positive and significant impact on Tourist’s future
intention. H9 (T = 8.752 > 1.96, β = 0.331, P < 0.01)
Finally, Tourist’s future intention has a positive and significant influence on
Destination Marketing.H10 (T = 3.341 > 1.96, β = 0.151, P < 0.01)
Further a case study of Dubai has been taken in order to validate the results from
the structural research model presented in this study. This was done in order to
obtain additional explanations of confirmed hypotheses and to acquire some in-
depth explanations of the relationships/paths in the research model.
4.6 Summary
This chapter has presented the selection of appropriate statistical techniques
used in this research (Partial Least Squares (PLS)). The chapter also presented
the analysis of the respondents' socio - demographic characteristics.
Subsequently, this chapter has provided a preliminary analysis to determine the
impact of tourism infrastructure on destination image in a comparative context of
pre and post destination image. The findings of the preliminary analysis observed

204
the highest post destination image which indicates the highest standard of
Infrastructure & highest level of satisfaction.
Further this chapter interpreted the validation of the research model including
validity, reliability, convergent validity and discriminant validity. This chapter also
discussed the result of the structural equation modelling and the overall results of
PLS-SEM analysis showed that all structural paths are significant. Finally the
chapter presented the confirmation of hypotheses. The next chapter presents
Discussion of Findings from the study.

205
Chapter 5 Discussion of Findings
5.1 Introduction
A refined structural model was developed to explore the impact of tourism
infrastructure on destination image for effective tourism marketing. This section
discusses the findings of both the quantitative and qualitative studies. The first
part of this section discusses about the key findings of the literature review and
survey, and second part presents the general findings of the study.
5.2 Key findings of the Literature Review and Survey
The attributes for the questionnaire were formed from literature research, and
pilot study. Literature Reviews was one of the founding activities of the
undertaken doctoral research. It was crucial as a part of thesis as it helped to
invariably focus on the topics that related to the objectives of the study and the
research questions. It has helped in the interpretation and highlighting of the
influential, conceptual or empirical studies that have been conducted in the field
of research. Literature Review synthesis has been continuously employed in the
research throughout its process. Literature Review was used extensively to
explore the fields of the research and helped the researcher to gain a thorough
understanding of perspectives in the area.
The literature review of this study included the pertinent research papers on
tourism infrastructure, destination image, destination marketing, tourists’
satisfaction and future intention. A pilot test was conducted with travel industry

206
professionals and tourism experts in order to check and fine-tune the items listed
in the questionnaire.
The conceptual framework which directed the formulation of this study’s
hypotheses has drawn from recent and relevant findings in the literature. The
framework depicts the relationships between variables of the study. This study
used the Partial Least Squares (PLS) method in order to analyse and validate
the structural model and hypotheses of the study.
The results from the Partial Least Squares (PLS) analysis of the questionnaire
data reveal the significance of interrelationships of the constructs in the model.
One of the important concepts used in understanding tourists' behavior in
tourism marketing is the destination image tourists have of the destination. It is
necessary for destination authorities to do proper destination marketing by
identifying different needs of different market segments, as well as promote their
image and manage destinations to attract tourists.
Lopes (2011) supports that when tourists choose a tourist destination they are
influenced significantly by the image of the destination. Tasci and Gartner (2007)
point out that: First, [from the demand-side] destination oriented marketing
activities are dynamic (controllable) factors that aim to polish and project a
positive image for the destination. Destination marketers have sought to identify
the most effective factors that influence a destination image. Thus, the image of
a destination becomes significantly effective for the decisions of tourists (Yilmaz
et al. 2009).
The ultimate goal of any destination is to influence possible tourists’ travel-
related decision making and choice through marketing activities. Understanding

207
the images of a destination is essential for a destination wishing to influence
traveler decision-making and choice. Destination image has been recognized as
one of the influential concepts in tourists’ destination choice process because
image affects the individual’s subjective perception, subsequent behaviour and
destination choice (Jeong & Holland 2012).
As a result of the above discussion, the following hypotheses were presented:
H1: Destination Marketing has a positive and significant influence on Pre -
destination image
H2: Destination Marketing has a positive and significant influence on destination
selection & actual visitation
Based on the results received from the PLS quantitative analysis, Destination
Marketing has high impact on Pre - destination image (H1, T= 5.582> 1.96, P <
0.01) and destination selection & actual visitation (H2, T= 8.067> 1.96, P < 0.01)
which supports the hypotheses 1 and 2 of this research. Therefore, destination
Marketing has a positive and significant influence on Pre - destination image and
destination selection and actual visitation. Hence it is essential to understand the
image of a destination for a destination wishing to influence traveler’s destination
choice and destination selection decision.
For a destination’s viability and success in tourism industry, researchers and
marketers need to be conscious about the importance of image because tourist
perception of image of a destination influences the destination decision and
tourist products and services sales (Jenkins, 1999; Tasci and Gartner, 2007).
A survey conducted by Kim, McKercher and Lee (2009) over three time periods -
before, during and after a trip measured tourists’ destination image change

208
throughout a tour. The results show that there is a significant difference in
destination image change between cognitive and affective perception.
The Partial Least Squares (PLS) analysis examined the influence of Pre -
destination image on destination selection and actual visitation, the third
hypothesis (H3). The result (H3, T = 2.621 > 1.96, P < 0.01) shows pre -
destination image has a positive and significant influence on destination selection
and actual visitation. Thus it is important for destinations to create an appealing
pre destination image to increase the visitation
A core area of the tourism industry is Infrastructure and plays a distinctive role in
the development of this ever-expanding industry. It is widely presumed that
Infrastructure is a leading factor responsible for Destination Image. According to
Grzinic and Saftic (2012) developing the necessary infrastructure is an essential
action to ensure the adequate tourist. The study has investigated the four
aspects (4 A’s) of infrastructure: Attractions, Accommodation, Accessibility and
Amenities; and subsequently formed the hypothesis 4 “Tourism Infrastructure
has a positive and significant impact on destination selection & actual visitation”
and sub – hypotheses.
The PLS analysis result (H4, T= 4.600> 1.96, P < 0.01) in support of H4
indicated the strong impact of Tourism Infrastructure on destination selection &
actual visitation.
A tourism resource rich region requires plausible planning and management for
the development of such infrastructure. In view of this, the following sub
hypotheses were formed and tested with the Partial Least Squares (PLS)
analysis.

209
H4a: Tourism infrastructure is determined by the quality of the attractions of the
destination (T = 2.928 > 1.96, P < 0.01).
H4b: Tourism infrastructure is determined by the quality of the accessibilities of
the destination (T = 1.998 > 1.96, P < 0.05).
H4c: Tourism infrastructure is determined by the quality of the accommodations
of the destination (T = 2.438 > 1.96, P < 0.05).
H4d: Tourism infrastructure is determined by the quality of the amenities of the
destination (T = 5.007 > 1.96, P < 0.01).
All the four sub hypotheses results confirmed the high positive statistical
significance of how the quality of the attractions, accessibilities, accommodation
and amenities determine the tourism infrastructure of the destination. Therefore
tourists’ destinations required proper planning and management for the
development of infrastructure. The results of these hypotheses also reveal that
the quality attributes such as Attractions, Accommodation, Amenities, and
Accessibility are the most important factor for destination selection, which hold
much potential to attract visitors and to enhance sustainability in tourism.
Further this study tested the impact of tourism Infrastructure on post - destination
image through the following hypothesis
H5: Tourism Infrastructure has a positive and significant impact on Post -
destination image (T = 7.919 > 1.96, P < 0.01)
Result shows high T value which indicates that tourism Infrastructure has a
significant impact on destination image after the visitation. It confirms the fact
that Tourists’ image perceptions vary over time. The organic and the induced

210
images form the pre-visit destination image while the experiential image that is
hoarded after arriving at the destination until departure to the home country form
the post-visit destination image. As per the findings destination image changes
depending on the Infrastructural attributes of the destination. Therefore the
image form after visitation is much more realistic and complex than the one
formed before the visitation, through secondary information (Beerli and Martín,
2014). In this respect, it is suggested that although many people have an image
of destinations they have not yet visited, the most accurate, personal and
comprehensive is formed through visiting there (Molina, Gómez and Martín-
Consuegra, 2010). Therefore developing the necessary infrastructure is an
essential action to ensure adequate tourists (Grzinic and Saftic, 2012).
Success of a tourism product is strongly supported by the positive marketing
effects (Lee et al., 2011; Moutinho et al., 2011; Sotiriadis and van Zyl, 2013).
Tourism infrastructure holds much potential to attract visitors and to enhance
sustainability in tourism. The result of the sixth hypothesis (H6: Tourism
Infrastructure has a positive and significant influence on Destination Marketing (T
= 5.855 > 1.96, P < 0.01)) in this study reveals the significance of tourism
Infrastructure for marketing a destination. The positive values of the PLS SEM
analysis shows that it is indispensable to consider the role of tourism
infrastructure and how it can be utilized and further enhanced to contribute to the
effective marketing of a destination.
Post-visit destination image is also linked with visitor‘s satisfaction. Visitors
analyse their experiences after their visits to a destination and experience the
satisfaction. Satisfaction from visiting a destination also refers to the emotional
state shown in a tourist’s post-exposure evaluation of a destination (Baker and

211
Crompton 2000; Su et al. 2011). So the satisfaction of a tourist and the influence
of post - destination image on satisfaction has been analysed with the
Hypothesis H7: “Post - destination image has a positive and significant influence
on Tourist satisfaction”. The results (T = 10.578 > 1.96, P < 0.01) received from
the PLS SEM analysis show the highest T value when compared to all the
structural paths of this study Model. With this result the study points that the
tourist overall satisfaction is depends on the image created by a destination after
the visitation. This kind of measurement of satisfaction evaluates the quality of
destination performance, where tourist satisfaction is not only regarded with, how
they were served and treated at a destination, that is, what they experience (Um,
Chon, & Ro, 2006), but also measured how they felt during the service encounter
(Baker &Crompton, 2000). Thus a destination with the positive infrastructural
attributes creates positive image that satisfies tourists’ needs and also increases
the chances of a destination having loyal tourists.
Tourism marketers try to strategically establish, reinforce and, change the image
of their destination to attract more tourists to the destination. This leads to, the
following hypotheses:
H8: Post - destination image has a positive and significant influence on
Destination Marketing
The result of the PLS analysis of the H8 (T = 4.334 > 1.96, P < 0.01) gives
positive values which indicates the influence of post destination image on
Destination Marketing. According to Sonmez and Sirakaya (2002), a good image
of a destination is an asset to a country or region that is involved in the tourism
industry. A country or regions with positive destination images have a high
probability of succeeding than those with negative images. The authors

212
emphasize that a positive image of a destination influences the potential visitors
for their travel decision making process to a destination. In this aspect this
study’s findings say that the post destination image of a destination helps tourism
marketers to attract the potential market. Understanding the image development
process and the nature of image helps tourism and destination marketers to
position their destination effectively in target market segments.
The PLS analysis result supported the ninth hypothesis “H9: Tourist satisfaction
has a positive and significant impact on Tourist’s future intention (T = 8.752 >
1.96, P < 0.01)” and the tenth hypothesis “H10: Tourist’s future intention has a
positive and significant influence on Destination Marketing (T = 3.341 > 1.96, P <
0.01)”. The former hypotheses were based on Pryag’s (2009) findings that tourist
satisfaction is considered to be a great predictor for future behavioural intentions
in many natures of tourism destinations and also a positive relationship occurs
between tourist satisfactions on future behavioural intentions. Visitors analyse
their experiences after their visits to a destination; the aftermath is what is
important. It is this effect that makes an impact on choosing a destination for a
second time or recommending this destination by a positive word of mouth to
either a friend or a family member (Fall and Knutson, 2001).
Once visitors are satisfied with their experience they might like to revisit a
destination (Pizam and Milman, 1995) and satisfied tourists are most likely to
express favourable comments about the destination they have visited or
recommend the destinations to their friends and relatives or (Mohammed Bala
Banki et al, 2014). In contrast, dissatisfied tourists may not recommend it to
others or may not return to the same destination (Chen & Chen 2010). Ultimately

213
the satisfied tourists influence the possible tourists’ travel-related decision
making.
Tourist infrastructure is important to successful destination marketing because
they influence the choice of a destination, and majority of tourists have
experiences with other destinations, and their perceptions are influenced by
comparisons among infrastructure and service standards. The quality of the
attractions, accessibilities, accommodation and amenities determine the tourism
infrastructure of the destination. Tourism Infrastructure has a significant impact
on destination image after the visitation. The findings of this study reveal
destination image changes depending on the Infrastructural attributes of the
destination. Also the tourists’ overall satisfaction depends on the image created
by a destination after the visitation; In addition, the tourist’s future intention to
recommend or revisit a destination depends on the ultimate tourist satisfaction of
the destination’s infrastructure. Marketing activities & tourist infrastructure of a
destination generate a positive destination image for the destination in the minds
of the prospective tourists, which also influence possible tourists’ travel-related
decision making and choice.
Hence it is essential to consider the importance of tourism infrastructure and how
it can be utilized and further enhanced to contribute to the effective marketing of
a destination.
5.3 General Findings
In addition to reporting on the hypotheses of the research, a broader discussion
was conducted which considered research questions and objectives of the study.

214
This study contains five research questions and six research objectives. Detailed
discussions of findings addressed by the research questions are as follows.
The first objective “To review the role of destination image and tourism marketing
in tourists’ decision on destination selection” was to find the solution to the first
research question “How does the Destination Image and Tourism Marketing
influence tourists’ decision on destination selection?” This research question was
divided into three hypotheses: H1: Destination Marketing has a positive and
significant influence on Pre - destination image; H2: Destination Marketing has a
positive and significant influence on destination selection & actual visitation; and
H3: Pre - destination image has a positive and significant influence on
destination selection & actual visitation.
The findings of the structural analysis supported hypotheses 1, 2 and 3 that
identified the role of destination image and tourism marketing in tourists’ decision
on destination selection. Results show that destination Marketing has a positive
and significant influence on Pre - destination image and destination selection &
actual visitation. Marketers need to be conscious about the importance of
destination image because tourist pre-destination image of a destination
influences the decision on destination selection and actual visitation. Therefore it
is important for the destination wishing to influence traveler’s destination choice
to create a positive image in the minds of the tourists through extensive
marketing activities.
The second objective “To explore tourism specific Infrastructural attributes
affecting the pre visit & post visit Destination Image” was to find an explanation to
the second research question “What are the various tourism specific

215
infrastructural attributes affecting the pre visit & post visit destination image?”
This research question was further divided into one hypothesis and four sub
hypotheses: H4: Tourism Infrastructure has a positive and significant impact on
destination selection & actual visitation; H4a: Tourism infrastructure is
determined by the quality of the attractions of the destination; H4b: Tourism
infrastructure is determined by the quality of the accessibilities of the destination;
H4c: Tourism infrastructure is determined by the quality of the accommodations
of the destination ; and H4d: Tourism infrastructure is determined by the quality
of the amenities of the destination.
As another finding that should be acknowledged in this study is the exploration of
tourism specific Infrastructural attributes affecting the pre visit & post visit
destination image. This study has explored a new context for the tourism specific
Infrastructural attributes Attractions; Accommodation; Accessibility and Amenities
through review of literature, expert opinion, survey and case study. The PLS
analysis result indicated the strong impact of Tourism Infrastructure on
destination selection & actual visitation. The case study of Dubai also supports
the result from the structural analysis. The improved quality of infrastructure of
Dubai increased more tourists visit to the region. Hence a tourism resource rich
region requires plausible planning and management for the development of such
infrastructure to attract more tourists to the destination.
The third objective “To assess the impact of Infrastructure on Destination Image”
has found answers to the third research question “What is the impact of specific
infrastructural attributes on destination image, and how do they differ in tourists'
pre visit & post visit image of destination?” This research question was

216
addressed by hypothesis 5: Tourism Infrastructure has a positive and significant
impact on Post - destination image.
The literature review of this study shows that tourism Infrastructural attributes
play a distinctive role in generating the image of a destination and the PLS
analysis result supported the hypothesis 5. This study has conducted a
preliminary analysis to determine the impact of tourism infrastructure on
destination image in a comparative context of pre and post visit destination
image. The general observation noticed is that the respondents experienced the
infrastructure of Dubai as higher than what they expected. In other words, the
actual experience was higher than the expectations. The results demonstrated
that the post- destination image was evaluated as higher than the pre-
destination image. The highest post destination image indicates the highest
standard of Infrastructure & highest level of satisfaction. Therefore developing
the necessary infrastructure is an essential action to ensure the adequate tourist
( Grzinic and Saftic, 2012).
The fourth objective “To identify the relationship between tourist satisfaction and
future intention” was to find explanation to the fourth research question “What are
the effects of destination image factors on the tourists' overall holiday satisfaction
and future intention/tourist impression with the destination? This research
question was divided into two hypotheses: H7: Post - destination image has a
positive and significant influence on Tourist satisfaction; and H9: Tourist
satisfaction has a positive and significant impact on Tourist’s future intention.
As per the findings the image of a destination changes depending on the
Infrastructural attributes of the destination. Many people have an image of

217
destinations they have not yet visited; the most accurate, personal and
comprehensive is formed through visiting there. Visitors analyse their
experiences after their visits to a destination and forms the satisfaction. The
tourist overall satisfaction is depends on the image created by a destination
before, during and after the visitation. A destination with the positive
infrastructural attributes creates positive image. The findings of this study reveal
that tourist satisfaction is considered to be a great predictor for future behavioural
intentions. PLS analysis confirms that the tourist satisfaction has a positive and
significant impact on tourist’s future intention.
The increased tourist visit and enhanced infrastructure of Dubai indicates that
once visitors are satisfied with the destination they might like to revisit a
destination and / or recommend the destinations to their friends and relatives.
Also satisfied tourists are most likely to express favourable comments about the
destination they have visited. Hence this study points that a positive relationship
occurs between tourist satisfactions on future behavioural intentions.
The fifth and the sixth objectives “To set out and validate a model to determine
the impact of infrastructural facilities on Destination Image for effective tourism
marketing” and “To draw conclusions and identify suggestions for destination
development and marketing” led answer to the fifth research question “How do
tourism infrastructural facilities and destination image influence tourism
marketing and tourist’s future intention?” This research question was divided into
three hypotheses: H6: Tourism Infrastructure has a positive and significant
influence on Destination Marketing; H8: Post - destination image has a positive
and significant influence on Destination Marketing; and H10: Tourist’s future
intention has a positive and significant influence on Destination Marketing

218
The structural model developed through this study evaluated the impact of
infrastructure on destination image in order to facilitate effective tourism
marketing. Finally, the study’s results acknowledge that tourism infrastructure
holds much potential to attract visitors to a destination by creating a positive
image in tourist generating countries. Positive destination images generated
through marketing activities persuade the potential customers to a particular
destination.
The marketers can also capitalize on the positive word of mouth spread by those
who have travelled to the country, either by using those words verbatim in their
communication or by developing tourist relationship management through
ongoing communication with tourists. Ultimately, the tourist’s future intention to
recommend or revisit a destination depends on destination image and tourist
satisfaction of the destination’s infrastructure. Hence, understanding the image of
a destination helps the marketers to position their destination effectively in target
market segments.
A tabulated summary of the general findings related to the research questions
and objectives of the study are displayed in Table 5.1

219
Table 5.1: Summary of general findings related to the research questions and
objectives of the study
Research Questions Objectives of the study Findings of the study
How does the
Destination Image and
Tourism Marketing
influence tourists’
decision on destination
selection?
To review the role of
destination image and
tourism marketing in
tourists’ decision on
destination
selection.(H1,H2 and H3)
Destination Marketing has a
positive and significant
influence on destination image
and tourist’s image of a
destination before actual
visitation influences the
decision on destination
selection. Hence it is important
for the destination wishing to
influence traveller’s destination
choice to create a positive
image in the minds of the
tourists through extensive
marketing activities.
What are the various
tourism specific
infrastructural attributes
affecting the pre visit &
post visit destination
To explore various tourism
specific Infrastructural
attributes affecting the pre
visit & post visit
Destination Image.(H4,
This study has explored a new
context for the tourism specific
Infrastructural attributes; 4 A’s:
Attractions; Accommodation;
Accessibility and Amenities.

220
image. H4a, H4b, H4c and H4d) The PLS analysis result
indicated the strong impact of
these tourism infrastructural
attributes on destination image
and destination selection
What is the impact of
specific infrastructural
attributes on destination
image, and how do they
differ in tourists' pre visit
& post visit image of
destination?
To assess the impact of
Infrastructure on
Destination Image. (H5)
This study found that the
respondents experienced the
infrastructure of Dubai as
higher than what they
expected. The results of the
study evaluated that the post-
destination image is higher
than the pre- destination
image. The highest post
destination image indicates
the highest standard of
Infrastructure & highest level
of satisfaction. Thus,
developing the necessary
infrastructure is an essential
action to ensure the adequate
tourist.
What are the effects of To identify the relationship Tourist’s overall satisfaction

221
destination image
factors on the tourists'
overall holiday
satisfaction and future
intention/tourist
impression with the
destination?
between tourist
satisfaction and future
intention. (H7 and H9)
depends on the destination
image. Tourist satisfaction is
considered to be a great
predictor of tourist’s future
behavioural intentions. PLS
analysis of the study
confirmed that the tourist
satisfaction has a positive and
significant impact on tourist’s
future intention.
How do tourism
infrastructural facilities
and destination image
influence tourism
marketing and tourist’s
future intention?
To set out and validate a
model to determine the
impact of infrastructural
facilities on Destination
Image for effective tourism
marketing.
To draw conclusions and
identify suggestions for
destination development
and marketing. (H6, H8
and H10)
The tourist’s future intention to
recommend or revisit a
destination depends on
destination image and tourist
satisfaction of the destination’s
infrastructure.
Positive destination images
generated through word of
mouth publicity gives a non-
paid form of promotion to the
destination. Thus,
understanding the image of a
destination helps the

222
marketers to position their
destination effectively in target
market segments.
5.4 Summary
This chapter has presented discussion of findings from the study. The first part of
this section discussed about the key findings of the literature review and survey.
The purpose of this study was to develop an assessment model that evaluates
the impact of infrastructure on destination image in order to facilitate effective
tourism marketing. The key findings of the literature review and survey have
discussed the hypotheses that attempted to identify the structural relationships
between/among the constructs in the model of this study. The findings of the PLS
structural analysis supported all the hypotheses of the study.
The second part highlighted the general findings of the study. In this part a
broader discussion was conducted which considered research questions and
objectives of the study. The findings of this study revealed that the image of a
destination changes depending on the Infrastructural attributes of the destination
and a destination with the positive infrastructural attributes creates positive
image.
The study’s results acknowledge that tourism infrastructure holds much potential
to attract visitors to a destination by creating a positive image in tourist

223
generating countries. Positive destination images generated through marketing
activities persuade the potential customers to a particular destination.
Findings of the study also revealed that tourist satisfaction with the quality of the
infrastructural attributes is considered to be a great predictor for future
behavioural intentions.
A tabulated summary of the general findings related to the research questions
and objectives of the study are also displayed in this chapter.
The following Chapter provides some concluding remarks and the implications
for research from the findings of the study. This chapter starts with Introduction,
followed by the Conclusions, Contribution to knowledge, Limitations and Future
areas of the research.
224
Chapter 6 Conclusion and Implications
6.1 Introduction
This chapter provides some concluding remarks and the implications for
research from the findings of the study. This chapter starts with Introduction,
followed by the Conclusions, Contribution to knowledge, Limitations and Future
Areas of the research.
This thesis started with an aim of developing an assessment model that
evaluates the impact of infrastructure on destination image in order to facilitate
effective tourism marketing. In order to satisfy this aim, the following objectives
were envisaged.
1. To review the role of destination image and tourism marketing in tourists’
decision on destination selection.
2. To explore tourism specific Infrastructural attributes affecting the pre visit &
post visit Destination Image.
3. To assess the impact of Infrastructure on Destination Image.
4. To identify the relationship between tourist satisfaction and future intention.
5. To set out and validate a model to determine the impact of infrastructural
facilities on destination image for effective tourism marketing.
6. To draw conclusions and identify suggestions for destination development
and marketing.
The first objective was to review the role of destination image and tourism
marketing in tourists’ decision on destination selection and it was satisfied
225
through an extensive review of the literature and provided a basis for
contextualisation.
The second objective was intended to be satisfied using the literature review.
However, not much exists in terms of refereed literature for Tourism
Infrastructural attributes in a specific context. Hence, there was a need to
establish the context through some primary data. In order to accomplish that an
expert opinion was taken from the top level managers of tourism & related
infrastructure field, in Dubai. This led to the development of the context and the
satisfaction of the second objective. And also the case study of Dubai helped to
identify the context of the study, tourism Infrastructure, in a wide perspective.
The third objective was to assess the impact of Infrastructure on destination
image. This was accomplished through review of the literature. This helped
develop the understanding and data collection instruments that had to be used
for further analysis.
The fourth objective of identifying the relationship between tourist satisfaction
and future intention was met through literature review and a series of primary
data collection tasks, followed by analysis. A survey conducted among the
inbound tourists helped in identifying the relationship between tourist satisfaction
and future intention.
The fifth objective was to set out and validate a model to determine the impact of
infrastructural facilities on destination image for effective tourism marketing. This
was accomplished through a semi-structured questionnaire survey and used the
Structural Equation Modeling (PLS-SEM) method in order to analyse and
validate the conceptual framework and hypotheses of the study. An extensive

226
review of literature helped to develop the interrelationships of the constructs in
the model. The hypotheses paths were confirmed with the expert opinion.
The last objective of conclusions and suggestions is presented in this chapter.
6.2 Conclusion
Through this work all the initial objectives that this thesis had conceived have
been confirmed. Primarily, this study has explored the literature related to
Tourism Infrastructure, Destination Image and Tourism Marketing.
This study has provided the basis for understanding the concepts of tourism
Infrastructure (Attraction Infrastructure, Accommodation Infrastructure,
Accessibility Infrastructure and Amenity Infrastructure) in a different perspective.
Efforts have been expended in investigating these concepts in various areas of
tourism and related sectors.
The study points that the tourist’s overall satisfaction depends on the image
created by a destination after the visitation. The findings have demonstrated that
a destination with positive infrastructural attributes creates a positive image that
satisfies tourists’ needs and also increases the chances of a destination having
loyal tourists. In this aspect, this study’s findings say that the post destination
image of a destination helps tourism marketers to attract the potential market.
Understanding the image development process and the nature of image helps
tourism and destination marketers to position their destination effectively in target
market segments.
Marketing activities attract and motivate all the potential customers to a particular
destination. At primary level, the national or regional tourist organization should

227
adopt a marketing campaign to persuade the potential tourist to visit the country
or region for which it is responsible. It will create a positive image of its country’s
tourist attractions in tourist generating countries so that the potential visitors are
attracted. Subsequently, the various individual firms providing tourist services
can market their own components of the total tourist product after the national
tourist organizations have launched marketing campaigns to persuade the
potential tourist to visit the country or region for which it is responsible. Marketing
strategies should be effective and efficient and this implies doing things right.
The findings of this study indicate the presence of better infrastructure of Dubai.
As one of the preferred destinations of both domestic and international visitors,
Dubai gains a lot from tourism and has implemented good practices to attract
tourists. One of the major reasons for a boom in tourism could be attributed to
the positive image created through a massive tourism campaign in the overseas
media particularly through world television channels. Dubai’s road shows and
various marketing programs focussing on the tourists’ infrastructural facilities
have generated more demand for the market.
Dubai has emerged as a tourism hub. In the context of promotion, Dubai’s
attractions and amenities are facets of the destination brand communicated in a
number of marketing exercises. The increasing tourist arrival statistics of Dubai
shows that Dubai has positioned and created a positive image for itself in
markets as an exotic but safe tourist location. Hence, giving the realistic image of
the destination through variety of marketing activities attracts more tourists to the
destination. From the practical standpoint, by offering the most suitable
combination of infrastructural facilities and services that support the positive
image, the success of destination marketing can be ensured.

228
The conclusions from this work are as follows:
Pre destination image and tourism marketing influence tourists’ decision
on destination selection. The study shows that tourist’s image of Dubai
before actual visitation influenced the decision on destination selection.
Hence it is important for the destination wishing to influence the traveller’s
destination choice to create a positive image in the minds of the tourists
through extensive marketing activities.
This study has explored a new context for Dubai’s tourism specific
Infrastructural attributes; 4 A’s: Attractions, Accommodation, Accessibility
and Amenities
The PLS analysis result indicated the strong impact of these tourism
infrastructural attributes in Dubai’s destination selection as it creates pre
destination image in the minds of the prospective tourists.
This study also found that the tourists experienced the infrastructure of
Dubai as higher than what they expected in other words the study
evaluated that the post- destination image is higher than the pre-
destination image. The highest post destination image indicates the
highest standard of Infrastructure. Tourist evaluation of pre and post
destination image leads to the level of satisfaction.
The model further explored that tourists are highly satisfied with the
infrastructure of Dubai, which generate positive post destination image.
Thus, it confirms that developing the necessary infrastructure is an
essential action to ensure the adequate inbound tourist to the destination.
Tourist satisfaction is considered to be a great predictor of tourist’s future
behavioural intentions. PLS analysis of the study confirmed that the tourist

229
satisfaction has a positive and significant impact on tourist’s future
intention.
The tourist’s future intention to recommend or revisit a destination
depends on destination image and tourist satisfaction of the destination’s
infrastructure. The structural model result confirmed that the tourists
visiting Dubai prefer to revisit or recommend the destination to their
friends and relatives. Hence it indicates the better quality of infrastructure
and the highest level of satisfaction with the destination.
Positive destination images generated through word of mouth publicity
gives a non-paid form of promotion to Dubai. Thus, understanding the
image of a destination helps the marketers of Dubai to position their
destination effectively in target market segments.
Further the study revealed that the destination image has a positive and
significant influence on destination marketing. Hence it is clear that Dubai
has been successful in creating a positive image by providing high quality
tourism infrastructure. These infrastructures not only create a destination
image, but also influence the traveller’s destination choice. The Positive
post destination image will act as a catalyst for marketing activities in
other words, positive post destination image created by the tourism
infrastructure facilitate marketing activities of the destination.
6.3 Contribution to knowledge
The purpose of this study was to develop a model to investigate the impact of
Infrastructure on destination image for effective Tourism Marketing.

230
The ultimate goal of any destination is to influence possible tourists’ travel-
related decision making and choice through marketing activities. Destination
image has been recognized as one of the influential concepts in tourists’
destination choice process because image affects the individual’s subjective
perception, subsequent behaviour and destination choice (Jeong & Holland
2012).
Destination Image is not static, but changes depending on the Infrastructural
attributes of the destination. Therefore the image form after visitation is much
more realistic and complex than the one formed before the visitation, through
secondary information (Beerli & Martín, 2014).
Tourism marketers try to strategically establish, reinforce and, change the image
of their destination. Hence consideration of the development of Tourism
Infrastructure is important for an effective tourism marketing of the destination.
Even though many researchers have dealt with these topics before, but no one
has considered the connection of these variables all together. Thus research can
make a contribution to the existing knowledge by considering the concepts from
a new perspective.
The study provides an extended discussion of a range of constructs namely
infrastructure, destination image, tourism marketing, tourist satisfaction and
future intention. Moreover, the findings will make several significant contributions.
These include the following:
1. The study has explored various infrastructural attributes related to tourists'
holiday experience and identified the effects of Infrastructure in tourism
Marketing.

231
2. The study draws attention to the importance of developing the tourism
infrastructure of a destination to create a better image. Extensive
enhancement in the area of tourism infrastructure creates positive image and
satisfies tourist’s needs and also increases the chances of a destination
having loyal tourists.
3. A further contribution to knowledge will be the study’s investigation of the
impact of Infrastructure on two phases of the destination image: before actual
visitation & after actual visitation to assess how the tourist satisfaction and
tourists future intentions influence Destination Marketing.
4. This research has also given recommendations in relation to positive
destination image formation for the development of an enriched tourist
destination and better economy of the destination.
5. This study has provided a model to determine the impact of infrastructural
facilities on destination image for effective tourism marketing. Future
research may collect and validate data from other competitive cities and
countries to see if similar findings and results could be addressed.
6. This is the first study to empirically test a model comprising of these
particular concepts within this specific context.
7. The research conducted on this topic will definitely be an important
contribution to destination pursuers, destination marketers, tour operators,
government agencies and other stakeholders.
8. The research findings, as a reference, will assist destination marketers and
other entities. The research will add on to existing knowledge on impact of
Infrastructure on destination image and tourism marketing.

232
9. It makes suggestions for future research relevant to tourism infrastructure
and destination marketing.
6.4 Limitations of This Research
There are some limitations that are associated with this study.
1. The analysis of the previous literature was valuable for identifying attributes
for the study. Studies specifically related to the impact of Infrastructure on
destination image have received very little or no specific research attention.
Therefore, the availability of the previous research on the specific topics of
the study was very limited.
2. This study has been somewhat limited in its selection of observed variables,
and constructs. Even if those observed variables, and constructs were
selected based on the literature review and researcher’s observations, other
critical variables and constructs may exist to achieve further insights of
destination competitiveness.
3. The present research has limitations in relation to the data used to achieve
the objectives. The surveyed data were only collected in Dubai. This
geographically limited survey may produce different results and conclusions
in terms of the magnitude and directions of relationships among the
constructs studied in this research. Tourism stakeholders in other states and
countries may have different perceptions, attitudes, and behaviours
concerning tourism development and destination competitive strategies.
Other geographic boundaries and research scopes should be explored to
see if similar findings and results could be addressed. And also, future

233
research may collect data from other competitive cities and countries so that
comparative studies can be conducted.
6.5 Future Areas of the research
There are several areas of future research that researchers can pursue taking
this thesis as the initial point. There are a number of opportunities to extend this
study and investigate similar complex models. In the first instance, the study
supports the literature that state value is a complex multidimensional construct
and having been examined from this perspective, this study suggests that there
is a need to further investigate the effectiveness of the model by collecting data
from other competitive cities and countries as the data of this study is limited to
Dubai.
This study has been conducted with selected variables. Even if those observed
variables were selected based on the literature review and researcher’s
observations, other critical variables and constructs may exist to achieve further
insights of destination competitiveness.
Previous studies specifically related to the impact of Infrastructure on destination
image are limited. This study has provided the basis for understanding the
concepts of tourism Infrastructure (Attraction Infrastructure, Accommodation
Infrastructure, Accessibility Infrastructure and Amenity Infrastructure) in a
different perspective. Efforts can be expended in investigating these concepts in
various areas of tourism and related sectors.
Further, this study evaluates the impact of tourism Infrastructure on two phases
of the destination image: before actual visitation & after actual visitation to

234
assess how the tourist satisfaction and tourists’ future intentions will influence
destination marketing. The outcome of this study can be presented to destination
pursuers, destination marketers, tour operators, government agencies and other
stakeholders for future research.
Subsequent research in this area would need a larger sample to confirm the
findings of this study. The expert opinion was conducted with a very small
sample of experts. Although, the experience these experts have is significant
there is a possibility that given the breadth of tourism infrastructural facilities in
Dubai, some parameters might have been overlooked. Therefore, a future study
that includes experts from each of the tourism departments would enhance the
output or will lead to wider acceptance of results presented in this thesis.

235
References
A. Al-Refaie(2015), Effects of human resource management on hotel
performance using structural equation modeling. Computers in Human Behavior,
43, 293–303
Adi Weidenfeld .(2010). Iconicity and ‘flagshipness’ of tourist attractions.Annals
of Tourism Research.Volume 37,Issue 3, pp 851-854
A. Herrero, H. San Martín (2012) .Developing and testing a global model to
explain the adoption of websites by users in rural tourism accommodations.
International Journal of Hospitality Management 31, 1178–1186
Ahmad, Puad MatSom, Azizan Marzuki, Maryam Yousefi & Ala`a Nimer Abu
Khalifeh. (2012). Factors Influencing Visitors’ Revisit Behavioral Intentions: A
Case Study of Sabah, Malaysia. International Journal of Marketing Studies; Vol.
4, No. 4
Ahmed, Z. U. (1991) The Influence of the Components of a State's Tourist Image
on Product Positioning Strategy. Tourism Management, 12,331-40.
AHMED, Z., SOHAIL, M., MYERS, C. & SAN, C (2006). “Marketing of
Australia to Malaysian Consumers.Services Marketing Quarterly”, 28 (2), 54-78.
Akarna, J. S. and Kicti, D. M. (2003) Measuring tourist satisfaction with Kenya's
wildlife safari: a case study of Tsavo West National Park-, Tourism Management,
Vol. 24, No. ], pp. 73-8 1.
Alcaniz, E. B., Garcia, I. S., & Blas, S. S. (2008), “The Functional-Psychological
Continuum in the Cognitive Image of a Destination: A Confirmatory Analysis”,
Tourism Management, 30(1), 1–9.
Altinay, L. and Paraskevas, A. (2008) Planning Research in Hospitality and
Tourism, Amsterdam; London: Butterworth-Heinemann.

236
Amelung, B., Beers, P.J., Rotmans, J., Asselt, I. M. and Hogervorst, J (1999).
“Global Specification, Evaluation, and Interpretation of Structural”
Andrew Lepp, Heather Gibson, Charles Lane.(2011) “Image and perceived risk:
A study of Uganda and its official tourism website” Tourism Management,
Volume 32, Issue 3, June, pp 675–684
Anwar, S., &Sohail, M. (2004), Festival tourism in the United Arab Emirates:
First-time versus repeat visitor perceptions, Journal of Vacation Marketing, Vol.
10, no. 2, pp. 161 – 170
Arbuckle, J. L. (2011). IBM SPSS Amos 20 user’s guide. – Amos Development
Corporation, SPSS Inc.
Arnett, J. J. (2002). The psychology of globalization. American Psychologist, 57,
774–783.
Assaker, G (2011): Insights into tourism demand and tourism behavior: Four
papers using multiple perspectives and structural equation modelling. European
Journal of Tourism Research 4.2 237-241.
Assaker G, Vinzi & O’Connor(2010), Structural Equation Modeling in Tourism
Demand Forecasting: A Critical Review, Journal of Travel and Tourism
Research, Spring/Fall
Asunta, T.; Brännare-Sorsa, R.; Kairamo, H. &Matero, S. 2003. Majoitus-
jaMatkailupalvelu. Third edition. Porvoo: WSOY.
Bagozzi, Richard P. (1980), Causal Models in Marketing, New York: Wiley.
Bagozzi, R. P. & Yi, Y (2012). “Equation Models”. Journal of the Academy of
Marketing Science, 40(1): 8‐34.
237
Bagozzi, R. P., and Y. Yi (2012). “Specifications, Evaluation, and Interpretation
of Structural Equation Models.”, Journal of the Academy of Marketing Science,
40: 8-34.
Baker, D. A. and Crompton, J. L. (2000) Quality, satisfaction and behavioural
intentions, Annals of Tourism Research, 27(3) pp.785-804.
Baker, M.J., Cameron, E. (2008). Critical success factors in destination
marketing. Tourism and Hospitality Research, 8 (2), 79-97.
BakerM.J.& Cameron E (2007). “Critical success factors in destination
marketing”.
Ballantyne, R., Packer, J. & Falk, J.H. (2011). Visitors’ learning for
environmental sustainability: testing short- and long-term impacts of wildlife
tourism experiences using structural equation modelling. Tourism Management,
32, 6, 1243-1252.
Baloglu, S and Mccleary, K, W. (1999) A model of destination image formation.
Annals of Tourism Research, 26,868-897.
Baloglu, S. &Brinberg, D (1997). “Affective images of tourism destination”,
Journal of Travel Research, 35 (4), 11-15.
Baloglu, S. &McCleary, K.W (1999). “A model of destination image formation,
Annals of Tourism Research”, 35 (4), 11-15.
Baloglu, S. &McCleary, K.W (1999). “US international pleasure travellers’’,
images of four Mediterranean destinations: a comparison of visitors and
nonvisitors, Journal of Travel Research, 38 (2), 114-129.

238
Barclay, D., Thompson, R., and Higgins, C. (1995). “The Partial Least Squares
(PLS) Approach to Causal Modeling: Personal Computer Adoption and Use an
Illustration,” Technology Studies (2:2), pp. 285-309.
Basri Rashid (2013). Post Visit Assessment: The Influence of Consumption
Emotion on Tourist Future Intention. IOSR Journal of Business and Management.
Volume 9, Issue 3, PP 39-45
Baumgartner, H., Homburg, C., (1996), Applications of structural equation
modeling in marketing and consumer research: a review. International Journal of
Research in Marketing 13 (2), 139–161
B. Cherifi, A. Smith, R. Maitland, N. Stevenson (2014). Destination images of
non-visitors. Annals of Tourism Research, 49, pp. 190–202
Beerli, A. and Martin, J. D. (2004), “Factors influencing destination image”,
Annals of Tourism Research, Vol. 31(3), pp. 657–681.
Beerli, A. and Martin, J.D. (2004), “Tourists’ characteristics and the perceived
image of tourist destinations: a quantitative analysis—a case study of Lanzarote,
Spain”, Tourism Management, Vol. 25, pp. 623–636.
Beerli, A., Martín, J.D (2004). “A model of destination image formation”, Annals
of Tourism Research, 31 (3), 657-681.
Beerli, A., Martín, J.D. (2004). “A model of destination image formation”. Annals
of Tourism Research, 31 (3), 657-681.
BIGNÉ, E., SÁNCHEZ, I., & SANZ, S (2009).” The Functional-psychological
Continuum in the Cognitive Image of a Destination”, A Confirmatory Analysis.
Tourism Management, 30 (5), 1-9.

239
Bigné, E., Sánchez, M. I., & Sánchez, J. (2001), “Tourism Image, Evaluation
Variables and After Purchase Behaviour: Inter-Relationship”, Tourism
Management, 22(6), 607–616.
Bigneet al., (2005) The theme park experience: an analysis of pleasure, arousal
and satisfaction, Tourism Management, 26(6) pp.833-844
Bollen, K. A. (1989). “Structural Equations with Latent Variables” New York:
John Wiley
Boniface, B.G. and Cooper, C. (1994) The Geography of Travel and Tourism
(2nd
edition), Oxford: Butterworth-Heinemann
Bootwala, S, Lawrence, MD, Mali, SJ, 2009, Principles of Marketing, Nirali
Borden, N. (1964). The concept of the marketing mix. Journal of Advertising
Research. 4: 27
Bosque, I.R. and Martin, H.S. (2008) Tourist satisfaction a cognitive-affective
model, Annals of Tourism Research, 35(2) pp.551-573.
Bowen, J.T., & Chen, S.L. (2001). The relationship between customer loyalty and
customer satisfaction. International Journal of Contemporary Hospitality
Management, Vol. 13, No.5, pp.213-217
Bowie, D. and Chang, J. C. (2005) Tourist satisfaction: A view from a mixed
international guided package tour, Journal of Vacation Marketing, 11(4) pp.303-
322.
Bradley, A., Hall, T. and Harrison, M. (2002) Selling cities: promoting new
images for meetings tourism, Cities, 19(1): 61-70.
240
Brady, M. K. Cronin, J. J. and Brand, R. R. (2002) Performance-only
measurement of service quality: application and extension, Journal of Business
Research, 55, pp. 17-31.
Bramwell, B. (1998), User satisfaction and product development in urban
tourism, Tourism Management, 19(1), 35 – 47.
Buhalis, D. (2000) “ Marketing the competitive destination of the future”.
Buhalis, D. and Laws, E. (2001). Tourism Distribution Channels, Continuum,
London.
Buhalis, D., &Amaranggana, A. (2013). “Smart tourism
destinations.Information and communication technologies in tourism”,
Springer International Publishing
Buhalis,D&Michopoulou E(2011), “Information-enabled tourism destination
marketing: addressing the accessibility market, Current Issues in Tourism”,
14 (2), , pp. 145–168.
Byrne, Barbara M. (2001)Structural Equation Modeling With AMOS: Basic
Concepts, Applications, and Programming.
Byrne, B. M. (2010). Structural equation modeling with AMOS, (2nd ed.). New
York: Routledge.
Calantone, R.J., di Benetto, C.A., Hakam, A. &Bojanic, D.C. (1989), “Multiple
multinational tourism positioning using correspondence analysis. Journal of
Travel Research”, 28(2) (Fall), 25-32.
Campo-Martínez, S., Garau-Vadell, J. &Martínez-Ruiz, M. (2010). Factors
influencing repeat visits to a destination: The influence of group composition.
Tourism Management, 31, 862-870.

241
Carla Almeida Santos (2004) “FRAMING PORTUGAL Representational
Dynamics”,Annals of Tourism Research Volume 31, Issue 1, pg122-138.
Caro, L. M. and Garcia, J. A. M. (2008) “Developing a multidimensional and
hierarchical service quality model for the travel agency industry, Tourism
Management”, 29, pp.706-720.
Castro, C. B., Armario, E. M., & Ruiz, D. M. (2007). The influence of market
heterogeneity on the relationship between a destination’s image and tourists’
future behavior. Tourism Management, 28, 175–187
Castro, Carmen Barroso, Enrique Martín Armario, and David Martín
Ruiz (2007),"The Influence of Market Heterogeneity on the Relationship between
a Destination's Image and Tourists' Future Behaviour." Tourism
Management, 28 (1): 175-87.
Cavana, R., Delahaye, B., Sekaran, U. (2001), “ Applied Business Research:
Qualitative and Quantitative Methods, John Wiley and Sons Australia, Qld”.
Čavlek, N., Bartoluci, M., Prebežac, D., Kesar, O., i sur. (2011). Turizam:
Ekonomskeosnoveiorganizacijskisustav. Zagreb: Školskaknjiga
C. Chen, S. Phou (2013). A closer look at destination: Image, personality,
relationship and Loyalty. Tourism Management, 36 (1), pp. 269–278
Celeste Eusébio and Armando Luis Vieira 2011 “Destination Attributes’
Evaluation, Satisfaction and Behavioural Intentions: A Structural Modelling
Approach”. International Journal of Tourism Research. doi:10.1002/jtr.
Chaitip, P., Chaiboonsri, H. &Mukhjang, R. (2008) Time Series Models for
Forecasting International Visitor Arrivals to Thailand, International Conference
on Applied Economics – ICOAE 2008.

242
Chen, C-F & Chen, F-S (2010). Experience quality, perceived value, satisfaction
and behavioral intentions for heritage tourists. Tourism Management, 31, 9-35.
Chen, C.-F., & Tsai, D. (2007). “How destination image and evaluative factors
affect behavioural intentions”, Tourism Management, 28, 1115–1122
Chen, J. &Uysal, M. (2002). Market positioning analysis: A hybrid approach.
Annals of Tourism Research, 29 (4), 987-1003.
Chen, C.F. and F.S. Chen (2010). “Experience Quality, Perceived Value, Sati
sfaction and Behavioral Intentions for Heritage Tourists, Tourism Managem
ent”,Vol. 31, 29‐35.
Chi, C. G., & Qu, H. (2008). Examining the structural relationships of destination
image, tourist satisfaction and destination loyalty: An integrated approach.
Tourist Management, 29(4), 624-636.
Chi, Christina Geng-Qing; and Qu, Hailin, (2008). “Examining the structural
relationship of destination image, tourist satisfaction and destination loyalty:
An integrated approach. Journal Tourism Management”, 29: 624-636.
Chia-Wei Lin (2006),“Transformation of Tourist Destination Image from
Organic, Induced, to Complex Stage: An Exploratory Study of Wang Kong”,
Tourism Providence University
Chin W., Newsted, P (1999). “Structural Equation Modeling Analysis with Small
Samples Using Partial Least Squares”, in Rick Hoyle (Ed.), Statistical Strategies
for Small Sample Research, Sage Publications, pp. 307-341
Chin, W. W. (1998). Commentary: Issues and opinion on structural equation
modeling.

243
Chin, W.W., (1998a). The partial least squares approach to structural equation
modeling, In: Marcoulides, G.A. (Ed.), Modern Methods for Business Research.
Erlbaum, Mahwah, pp. 295-358.
Chin, W. W. (2010). How to write up and report PLS analyses. In V. E. Vinzi, W.
W. Chin, J. Henseler, & H. Wang (Eds.), Handbook of partial least squares:
Concepts, methods and applications in marketing and related fields (pp. 655-
690), Berlin: Springer.
Ching-Cheng Chao, Hsi-Tien Chen and Tai-Lin Yeh (2015). A comprehensive
relationship marketing model between airlines and travel agencies: The case of
Taiwan / Journal of Air Transport Management 47, 20-31
Ching-Fu Chen, DungChun (2007). How destination image and valuative factors
affect behavioral intentions? Tourism Management 28, Pages 1115–1122
Choi, T. Y. and Chu, R (2000) Levels of satisfaction among Asian
andWesterntravelers. International Journal of Quality and
ReliabilityManagement, 17, 116-131.
Choi, T. Y. and Chu, R. K. S. (1999) “Consumer perception of the quality of
services in three hotel categories in Hong Kong”, Journal of Vacation
Marketing, 5(2); pp.176-189.
Chon, K.-S. (1991). Tourism destination image modification process: Marketing
implication. Tourism Management, 12(1), 68–72.
Chon, S., Weaver, A., & Kim, Y. (1991). Marketing your community: Image
Analysis in Norfolk. The Cornell Hotel and Restaurant Administration Quarterly,
31(4), 24–27.
Christina Geng-Qing Chi,Hailin Qu, “Examining the structural relationships of
destination image, tourist satisfaction and destination loyalty: An integrated

244
approach” Tourism Management, volume 29, 2008, pp.624–636 Campo-
Martínez, S., Garau-Vadell,
Chul Jeong& Stephen Holland (2012) Destination Image Saturation, Journal of
Travel & Tourism Marketing, 29:6, 501-519
Churchill, G.A., 1979. A paradigm for developing better measures of marketing
constructs. Journal of Marketing Research 16 (February), 64-73.
Cline, R., Ruhl, T., Gosling, G. and Gillen, D. (1998) Air transportation demand
forecasts in emerging market economies: a case study of the Kyrgyz Republic in
the former Soviet Union, Journal of Air Transport Management, 4(1): 11-23.
Coathup, D. C. (1999). “Dominant actors in international tourism”, International
Journal of Contemporary Hospitality Management, Vol. 11(2/3), pp. 69–72.
Cole, S. T. and Illum, S. F. (2006) Examining the mediating role of festival
visitors’ satisfaction in the relationship between service quality and behavioural
intentions, Journal of Vacation Marketing, 12(2) pp.160-173
Cole, S.T. & Crompton, J.L. (2003). A Conceptualization of the Relationships
Between Service Quality and Visitor Satisfaction, and their Links to Destination
Selection. Leisure Studies, 22, 65-80.
Connell N.A.D. Klein J.H. Meyer E. (2004). Narrative approaches to the transfer
of organisational knowledge. Knowledge Management Research and Practice
Cooper, C., J. Fletcher, A. Fyall, D. Gilbert and S. Wanhill (2008). “Tourism:
Principles and Practice. Essex: Pearson Education Limited. Fourth Edition”
Corte´s-Jime´nez, I., & Blake, A. (2011). Tourism demand modeling by purpose
of visit and nationality. Journal of Travel Research, 50, 408 –416.
Creswell, J. W. (2009). “Research design: qualitative, quantitative and mixed
methods approaches, 3rd Ed., Thousand Oaks, California: Sage Publications”.

245
Creswell, J. W. (2009). Research design: qualitative, quantitative and mixed
methods approaches, 3rd Ed., Thousand Oaks, California: Sage Publications
Crompton and Love, (1995). “ The predictive validity of alternative approaches to
evaluating quality of a festival”, Journal of Travel Research, 34 (1) pp. 11-24.
Crompton JL (1979). “Motivations for Pleasure Vacations”. Ann. Tour. Res,
6(4): 408-424.
Crompton, J. 1979 “An Assessment of the Image of Mexico as a Vacation
Destination and the influence of Geographical Location upon that Image”.
Journal of Travel Research, 17(4): 18-43.
Crouch G.I. &Ritchie, J.R.B. (2000). The competitive destination: a sustainability
perspective. Tourism Management: 21
Crouch, G. I., &Ritchie, J. R. B. (1999) Tourism competitiveness and societal
prosperity. Journal of Business Research. 44(3): 137-152.
Crowley, S.L., & Fan, X. (1997). Structural equation modeling: basic concepts
and applications in personality assessment research. Journal of Personality
Assessment, 68(3): 508-531.
Dancey C., Reidy J. (2004). Statistics Without Maths for Psychology: Using
SPSS for Windows. London: Prentice Hall
Davis MD (1985).The logic of causal order. In: Sullivan JL, Niemi RG,
editors. Sage university paper series on quantitative applications in the social
sciences. Sage Publications; Beverly Hills, CA.
D. Buhalis, E. Michopoulou, Information-enabled tourism destination marketing:
addressing the accessibility market, Current Issues in Tourism 14 (2), 2011, pp.
145–168

246
Darke, P. and Shanks, G. (2002). “Case Study Research”, in Williamson, K.,
Research methods for students, academics and professionals, Center of
Information Studies Charles Sturt University, WaggaWagga New South Wales
Australia”, pp 111-123.
Decrop, A. (2010). Destination Choice Sets an Inductive Longitudinal Approach.
Annals of Tourism Research, 37(1), 93–115.
Diamantopoulos, A., Winklhofer, H.M., 2001. Index construction with formative
indicators: an alternative to scale development, Journal of Marketing Research 38
(2), 269e277.
Diamantopoulos, A., Sarstedt, M., Fuchs, C., Kaiser, S., and Wilczynski, P. 2012.
“Guidelines for Choosing Between Multi-Item and SingleItem Scales for
Construct Measurement: A Predictive Validity Perspective,” Journal of the
Academy of Marketing Science, forthcoming
Diekhoff, George. (1992). Statistics for the Social and Behavioral Sciences:
Univariate, Bivariate and Multivariate. Wm. C. Brown Publishers
Dijkstra, T. K. 2010. “Latent Variables and Indices: Herman Wold’s Basic
Design and Partial Least Squares,” in Handbook of Partial Least Squares, V. E.
Vinzi, W. W. Chin, J. Henseler, and H. Wang (eds.), Berlin, Germany: Springer-
Verlag, pp. 23-46.
Dr.Debaprasad Banerjee. (2014). Hospitality And Its Importance To The
Tourism Industry: A Case Study On Selected Hotels In Kolkata . Ijfms. Volume
1, Issue 1.
Department of Tourism and Commerce Marketing (DTCM), Dubai. Press release.
Easterbay-Smith, M., Thorpe, R. and Jackson, P.R. (2012) Management
Research, 4th
Eds Thousand Oaks, CA:Sage.

247
Echtner CM, Ritchie JRB (1993). The Measurement of Destination Image: An
Empirical Assessment. J. Travel Res. 31(4): 3-13.
Echtner, C. M., & Ritchie, J. R. B. (1991). “The meaning and measurement of
destination image”. The Journal of Tourism Studies, 2(2), 2-12.
Echtner, Charlotte M. and Ritchie, J.R.Brent (2003), “The Meaning and
Measurement of Destination Image”, The Journal of Tourism Studies, 14 (1): 37-
48.
Egan, J, 2007, “ Marketing Communications, Thomson Learning”
Egan, J, 2007, Marketing Communications, Thomson Learning
Eggert, A. and Ulaga, W. (2002) Customer perceived value: a substitute for
satisfaction in business markets? Journal of Business and Industrial Marketing,
17(2/3), pp. 107-118.
Ekinci Y., Zeglat, D. and Whyatt, G. (2011) “Service Quality, Brand Loyalty and
Profit Growth in the UK Budget Hotels”, Tourism Analysis, 16(3), 259-270.
Elaine Yin Teng Chew, SitiAqilahJahari“Destination image as a mediator
between perceived risks and revisit intention: A case of post-disaster
Japan”Tourism Management,volume40, 2014, pp.382-393
Embacher, J., &Buttle, F. (1989). “A repertory grid analysis of Austria’s image as
a summer vacation destination”.Journal of Travel Research. Winter, 3-7.
Emilio Celotto, Andrea Ellero, &Paola Ferretti (2015) “Conveying tourist ratings
into an overall destination evaluation.Procedia - Social and Behavioral
Sciences”, 188, 35 – 41.
Emilio Celottoab, Andrea Elleroa*, Paola Ferrettic, Conveying tourist ratings into
an overall destination evaluation, Procedia - Social and Behavioral Sciences 188 (
2015 ) 35 – 41

248
Enright, M., & Newton, J. (2004). Tourism Destination Competitiveness: A
Quantitative Approach. Tourism Management, 25, 777–788.
Enright, Michael, and James Newton (2004). “Tourism destination
competitiveness: a quantitative approach.” Tourism Management, 25: 777-
788
Esposito Vinzi, V. (2009). PLS path modeling and PLS regression: a joint partial
least squares component-based approach to structural equation modeling. In:
International Federation of Classification Societies, University of Technology,
Dresden, Germany.
E.Y. Chew, S.A. Jahari (2014). Destination image as a mediator between
perceived risks and revisit intention: A case of post-disaster Japan. Tourism
Management, 40, pp. 382–393
Fakeye, P. C., & Crompton, J. L. (1991). Image difference between prospective,
first-time and repeat visitors to the Lower Rio Grande Valley. Journal of Travel
Research, 30(2), 10–16.
Fall, L.T. & Knutson, B.J. (2001). “Personal values and media usefulness of
mature travelers”. Journal of Hospitality and Leisure Marketing, 8, 97–111.
Fallon, P., & Schofield, P. (2004). “First-time and repeat visitors to Orlando,
Florida: A comparative analysis of destination satisfaction”.
Fesenmaier& MacKay, K. J. (1997). Pictorial Element of Destination Promotion
in Image Formation, Annals of Tourism Research, 24(3), pp. 537 - 565.
Fesenmaier, D. R., &Jeng, J. (2000). “Assessing structure in the pleasure trip
planning process”. Tourism Analysis, 5, 13-17.

249
Field, A. (2009) Discovering statistics using SPSS, 3rd ed., London: SAGE
publications Ltd.
Fill, C, (2006). “Marketing Communications”, 4th ed., Financial Times/ Prentice
Hall.
Fill, C, 2006,”Marketing Communications”, 4th ed., Financial Times/ Prentice
Hall.
Fisher, C. (2010) Researching and Writing a Dissertation, an Essential Guide for
Business Students, Pearson Education Limited, Essex.
Fornell, C., and Bookstein, F. L. (1982). Two structural equation models:
LISREL and PLS appliead to consumer exit-voice theory. Journal of Marketing
Research, 19, 440–452.
Fornell, C., Larcker, D.F., 1981. Evaluating structural equation models with
unobservable variables and measurement error. Journal of Marketing Research 18
(1), 39-50
Formica, S. (2000). Destination attractiveness as a function of supply and
demandinteraction. Unpublished doctoral dissertation, Virginia Polytechnic
Institute and StateUniversity, Blacksburg.
Formica, S., &Uysal, M. (1998). “Market segmentation of an international
culturalhistorical event in Italy”. Journal of Travel Research, 36(4), 16-24.
Frías, D. M., Rodríguez, M. A., &Castañeda, A. (2008). Internet vs. travel
agencies on pre-visit destination image formation: An information processing
view. Tourism Management, 29(1), 163–179.
Fuchs, M., Höpken, W., Föger, A., & Kunz, M. (2010). E-business readiness,
intensity, and impact – An Austrian DMO study. Journal of Travel Research,
49(2), 165–178.
250
Fyall, A., & Leask, A. (2007). “Destination marketing: future issues – strategic
challenges. Tourism and Hospitality Research”, 7(1), 50–63
Fyall, A.; Garrod, B.; Leask, A. and Wanhill, S. (eds.) (2008) Managing visitor
attractions: New direction, 2nd edition, Oxford: Butterworth Heinemann
G. I. Crouch, R. R. Perdue, H. J. P. Timmermans, & M. Uysal (Eds.), Consumer
psychology of tourism, hospitality and leisure (pp.203-214.). Wallingford, UK:
CABI Publishing.
Gallarza, M. G., Saura, I. G., & Garcia, H. C. (2002). Destination image: Towards
a conceptual framework. Annals of Tourism Research, 29(1), 56–78.
Gallarza, M. G., and Saura, I. G. (2006). Value dimensions, perceived value,
satisfaction and loyalty: an investigation of university students’ travel behaviour.
Tourism Management, 27, 437-452.
Gartner, E (1993). “Image Formation Process”, Journal of Travel and Tourism,
(2) 1, pp.191-216
Gartner, W.C. & Hunt, J.D. (1987). “An analysis of state image change over a
twelve-year period”(1971-1983). Journal of Travel Research, 16( 2 ) (Fall), 15-
19.
Gartner, W.C. (1989). “Tourism image: Attribute measurement of state tourism
products using Multidimensional scaling techniques”. Journal of Travel
Research, 28(2) (Fall), 16-20.
Gary A and Kotler, P. (2014) Marketing: an Introduction (12th ed.), international
edition, New Jersey, London: Prentice Hall
Gefen, D., Rigdon, E. E., and Straub, D. W. 2011. “Editor’s Comment: An
Update and Extension to SEM Guidelines for Administrative and Social Science
Research,” MIS Quarterly (35:2), pp. iii-xiv

251
Gilmore, A. (2003) Service marketing and management. New Delhi: Response
books, Sage.
Goi, CL, 2009, A Review of Marketing Mix: 4Ps or More? International Journal
of Marketing Studies, Vol. 1, No.1
Gökçe Özdemir and Ömer Faruk Şimşek I (2015). The Antecedents of Complex
Destination Image. Procedia - Social and Behavioral Sciences 175 ( 2015 ) 503 –
510
Golob T.F. (2003), Structural equation modeling for travel behavior research,
Transportation Research Part B 37 (2003) 1–25
Goodhue, D.L., Lewis, W. & Thompson, R. (2012) Does PLS have advantages
for small sample size or nonnormal data? MIS Quarterly, 36(3), 981–1001
Gotz, O., Liehr-Gobbers, K., Krafft, M., 2010. Evaluation of structural equation
models using the partial least squares (PLS) approach, In: Esposito Vinzi, V.
(Ed.), Handbook of Partial Least Squares: Concepts, Methods and Applications
(Springer Handbooks of Computational Statistics Series, vol. II). Springer,
Heidelberg, Dordrecht, London, New York, pp. 691e711.
Gray, C.D. & Kinnear, P.R. (2011) IBM SPSS 19 Statistics made Simple, New
York: Psychology Press
Greene, J. and D’Oliveira, M. (1999) Learning to use statistical tests in
psychology, 2nd ed., Buckingham: Open University Press.
Grönroos, C. (2000). Service Management and Marketing. A Customer
Relationship Management Approach. Chichester: Wiley & Sons
Gross, M. J. and Brown, G. (2008). An empirical structure model of tourists and
places: Progressing involvement and place attachment into tourism. Tourism
Management, 29(6), 1141-1151

252
Grosspietsch, M. (2005), Can tourism provoke terrorism? Sustainable
Development Through Tourism, University of Munster, Alemania
Gržinić, J., Saftić, D. (2012). “Approach to the development of destination
management in Croatian tourism. Management”. Journal of Contemporary
Management Issues, vol.17, no. 1., pp. 59-74. Tourism and Hospitality Research,
8 (2), pp. 79–97
Gržinić, J., Saftić, D. (2012). Approach to the development of destination
management in Croatian tourism. Management: Journal of Contemporary
Management Issues, vol.17, no. 1., pp. 59-74.
Gudergan, S.P., Ringle, C.M., Wende, S., Will, A., 2008. Confirmatory tetrad
analysis in PLS path modeling, Journal of Business Research 61 (12), 1238e1249
Guineng Chen and João de Abreu e Silva ( 2014 ). Estimating the provincial
economic impacts of high-speed rail in Spain: An application of structural
equation modeling, Procedia - Social and Behavioral Sciences 111, 157 – 165
Gunn, C. (1972). Vacationscape. Austin: University of Texas, Bureau of Business
Research.
GUNN, C.A, EDS. 1988 tourism planning (second edition). New York: Taylor &
Francis.
Gunn, C. (1988). Vacationscapes: designing tourist regions. New York:
VanNostrand Reinhold.
Gursoy, D., Jurowski, C., & Uysal, M. (2002). Resident attitudes: A structural
modeling approach. Annals of Tourism Research, 29(1), 79-105.
Gursoy, D., & Rutherford, D.G. (2004). Host attitudes toward tourism: An
improved structural model. Annals of Tourism Research, 31(3), 495-516.

253
Gursoy, D., & Kendall, K. W. (2006). Hosting mega events e modeling locals
support. Annals of Tourism Research, 33(3), 603e623.
Hailin Qu, Lisa Hyunjung Kim and Holly Hyunjung Im (2011). “A model of
destination branding: Integrating the concepts of the branding and destination
image”, Tourism Management 32 , Pages 465-476
Hair, J. E., Anderson, R. E., Tatham, R. L., & Black W. C. (1998). Multivariate
data analysis. (5th ed.). Upper Saddle River, NJ: Prentice-Hall.
Hair, J. F., Ringle, C. M., & Sarstedt, M. (2011). PLS-SEM: Indeed a silver
bullet. The Journal of Marketing Theory and Practice, 19(2), 139-152.
Hair, J. F., M. Sarstedt, C. M. Ringle, and J. A. Mena, (2012). “An Assessment of
the Use of Partial Least Squares Structural Equation Modeling in Marketing
Research.” Journal of the Academy of Marketing Science, 40: 414-33.
Hair, J. F., Hult, G. T. M., Ringle, C. & Sarstedt, M. (2013). A Primer on Partial
Least Squares Structural Equation Modeling (PLS-SE). Sage Publications, Inc.
Hair, J. F., Hult, G. T. M., Ringle, C. M., and Sarstedt, M. (2014). A Primer on
Partial Least Squares Structural Equation Modeling (PLS-SEM), Sage: Thousand
Oaks.
Hall, C.M (2000). Tourism Planning: Policies, Processes and Relationships.
Harlow: Prentice Hall.
Hall, C.M. (1991) Introduction to Tourism in Australia: Impacts, Planning and
Development, Melbourne: Longman Cheshire.
H. Fu, B. Ye, J. Xiang (2016), Reality TV, audience travel intentions, and
destination image. Tourism Management, 55, pp. 37–48
254
Hampton, R.D., Guy, B.S. & Sinkula, J.M, (1987). “Consumer images of
financial institutions: A comparative study of banks versus savings and
loans”. Journal of Professional Services Marketing, 2( S p r i n g ), 8 3 - 1 00.
Handberg, R. (2002). Creating Transportation Infrastructure through State
Spaceport Initiatives: Florida and Other Examples. Technology in Society, 24,
225–241.
Hanlan, J., & Kelly, S. (2005). Image formation, information sources and an
iconicAustralian tourist destination. Journal of Vacation Marketing, 11, 163-177.
Harlt . A (2002). Developing Marketing Strategies for Tourism Destinations in
Peripheral Areas of Europe: The Case of Bornholm : a Thesis Submitted in Partial
Fulfillment of the Requirements of Bournemouth University for the Degree of
Doctor of Philosophy.
Harris, M.M., &Schaubroeck, J, (1990). “Confirmatory modeling in OB/HRM:
Technical issues and applications”. Journal of Management, 16, 337-360.
Hassan A and IankovaK,(2012). “Strategies and Challenges of Tourist Facilities
Management in the World Heritage Site: Case of the Maritime Greenwich”,
London Tourism Analysis, Volume 17, Number 6, pp. 775-789(15).
Hassan A and MizanRahman , (2015) "World Heritage site as a label in branding
a place", Journal of Cultural Heritage Management and Sustainable
Development, Vol. 5 Iss: 3, pp.210 – 223.
He´ctor San Martı´n, Ignacio A. Rodrı´guez del Bosque “ Exploring the
cognitive–affective nature of destination image and the role of psychological
factors in its formation”Tourism Management, volume 29, 2008, pp. 263 – 277
Heene, M., Hilbert, S., Draxler, C., Ziegler, M., &Bühner, M, (2011). “Masking
misfit in confirmatory factor analysis by increasing unique variances: A

255
cautionary note on the usefulness of cutoff values of fit indices”. Psychological
Methods, 16, 319–336.
H. El-Gohary (2012). “Factors affecting E-Marketing adoption and
implementation in tourism firms: An empirical investigation of Egyptian small
tourism organisations”. Tourism Management 33 , 1256-1269
Henderson Joan C, (2000) “Selling Places: The New Asia-Singapore Brand”,
The New Asia-Singapore Brand”, The Journal of Tourism Studies Vol. 11, No.1,
May ‘00
Henseler, J., Ringle, C. M., and Sinkovics, R. R. 2009. The Use of Partial Least
Squares Path Modeling in International Marketing. Advances in International
Marketing, 20: 277-320.
Holbert, R. L., and M. T. Stephenson,(2002). “Structural Equation Modeling in
the Communication Sciences, 1995-2000.” Human Communication Research, 28
(4): 531-51.
Holloway, C. (2006). The Business of Tourism. 7th ed. Harlow: Prentice-Hall.
Hongmei Zhang, Xiaoxiao Fu, Liping A. Cai, Lin Lu, “Destination image and
tourist loyalty: A meta-analysis” Tourism Management, volume 40, 2014,
pp.213-223
Hosany, S., Ekinci, Y. and Uysal, M. (2007) “Destination Image and Destination
Personality” International Journal of Culture, Tourism and Hospitality Research,
1 (1), 62-81
Howell, D. C. (2009) Statistical methods for psychology, 7th ed., Belmont, CA:
Wadsworth Cengage Learning

256
Hoyle, R. H, (1995). “The Structural Equation Modeling Approach: Basic
Concepts and Fundamental Issues.” In Structural Equation Modeling: Concepts,
Issues, and Application, edited by R. H. Hoyle. Thousand Oaks, CA: Sage, pp. 1-
15.
Hu, Y., & Ritchie, J. R. B. (1993). Measuring destination attractiveness:
Acontextual approach. Journal of Travel Research, 32(2), 25-34.
Hu, Z., and Ritchie, B. (1993). Measuring Destination Attractiveness: A
contextual approach. Journal of Travel Research, 32(2), 25–35
Hughes, M., & Morrison-Saunders, A, (2002). “Repeat and first time visitation in
an experience specific context: The Valley of the Giants Tree Top Walk”.
Journal of Tourism Studies. 13(1), 20-25.
Hui, T. K., Wan, D., &Ho, A. (2007), “Tourists’ Satisfaction, Recommendation
and Revisiting Singapore”, Tourism Management, 28(4), 965–975.
Hunt, J. D, (1971). :Image: A factor in tourism”. Unpublished Ph.D. dissertation,
Fort Collins: Colorado State University.
Hunt, J., D, (1975). “Image as a Factor in Tourism Development”, Journal of
Travel Research, 13, 1-9.
Hunt, J.D. 1975 Image as a factor in tourism development, Journal of Travel
Research, 13, 1-7.
H. Zhang, X. Fu, L. Cai, L. Lu (2014). Destination image and tourist loyalty: A
meta-analysis. Tourism Management, 40, pp. 213–223.
International Air Transport Association (2015). IATA Foundation in Travel and
Tourism. International Travel and Tourism Training Program. Ed.5.14.
Ionel, B, (2013,). “The Factors Appearance and Development of Rural Tourism”.
Annals Of The University Of Oradea, Economic Science Series, 750-758.

257
Jain, A.K. &Etgar, M, (1976).”Measuring store image through multidimensional
scaling of free response data”. Journal of Retailing, 52 (winter), 61-70.
JameelKhadaroo, BoopenSeetanah, The role of transport infrastructure in
international tourism development: A gravity model approach, Tourism
Management 29 (2008) 831–840
Jang, S., Bai, B., Hu, C., and Wu, C.M. (2009). “Affect, Travel Motivation, and
Travel Intention: a Senior Market”. Journal of Hospitality & Tourism Research,
33(1), 51- 73.
Jang, S., & Feng, R, (2007). “Temporal destination revisit intention: The effects
of novelty seeking and satisfaction”. Tourism management, 28(2), 580-590.
Javier, S., &Bign, J. E, 2001 “Tourism image, evaluation variables and after
purchase behaviour: inter-relationship”. Journal of Tourism Management, 22:
607- 616.
Jayarman, K., Lin, S. K., Guat, C. L., & Ong, W. L. (2010). Does Malaysian
Tourism Attract Singaporeans to Revisit Malaysia? Journal of Business and
Policy Research, 5(2), 159-179.
J. Enrique Bignea, M. Isabel Sanchezb, Javier Sanchez.(2001) Tourism image,
evaluation variables and after purchase behaviour: inter-relationship. Tourism
Management 22 , 607–616
Jenkins A. 2011. Research philosophy in Management Research: a Critical Realist
perspective.
Jenkins, O. H. (1999). Understanding and measuring tourist destination images.
TheInternational Journal of Tourism Research, 1, 1-15.
Jeong C & Holland S,(2012): “Destination Image Saturation”, Journal of Travel
& Tourism Marketing, 29:6, 501-519.

258
Jeong, M.; Oh, H and Gregoire, M, (2003).“Conceptualizing website quality and
its consequences in the lodging industry”, International Journal of Hospitality
Management, 22(2), pp.161–3175.
John Fahy& David Jobber (2012) Foundations of Marketing, 4th edition, London:
McGrawHill
Johnson, B., & Christensen, L. (2012). Educational research: Quantitative,
qualitative,
Joppe, M., Martin, D. W., &Waalen, J, (2001).” Toronto’s image as a destination:
A comparative importance-satisfaction analysis by origin of visitors”. Journal of
Travel Research, 39, 252–260
Jöreskog, K.G. (1970). A general method for the analysis of covariance
structures. Biometrika, 57, 239-251.
Jöreskog, K. G., and Wold, H. 1982. “The ML and PLS Techniques for Modeling
with Latent Variables: Historical and Comparative Aspects,” in Systems Under
Indirect Observation, Part I, H. Wold and K. G. Jöreskog (eds.), Amsterdam:
North-Holland, pp. 263-270
Jöreskog, K. G., & Sörbom, D. (1989). LISREL7, a Guide to the Program and
Applications. SPSS Publications.
Jöreskog, K. G., & Sörbom, D. (1993). LISREL 8: Structural equation modeling
with the SIMPLIS command language. Scientific Software International.
Josefa D. Martín-Santana, Asunción Beerli-Palacio , Patrizio A. Nazzareno
(2017). “Antecedents and consequences of destination image gap”. Annals of
Tourism Research, 62, 13–25
Kamenidou, I., Mamalis, S. &Priporas, C.V, (2009). “Measuring Destination
Image and Consumer Choice Criteria: the case of Mykonos island”. Tourismos:

259
An International Multidisciplinary Journal of Tourism, Vol. 4, No.3 (Spring),
pp.67-79
Kandampully, J., &Suharatanto, D. (2000), “Customer Loyalty in the Hotel
Industry: The Role of Customer Satisfaction and Image”, International Journal of
Contemporary Hospitality Management, 12(2), 346– 351.
Kandampully, J., &Suhartanto, D. (2003), “The Role of Customer Satisfaction
and Image in Gaining Customer Loyalty in the Hotel Industry”, Journal of
Hospitality and Leisure Marketing, 10(1-2), 3-25.
Kashyap, R., &Bojanic, D. C. (2000). A structural analysis of value, quality, and
price perceptions of business and leisure travelers. Journal of Travel Research,
39(1), 45- 51.
Kastenholz, E, (2010), "Cultural proximity” as a determinant of destination
image. Journal of Vacation Marketing, 16(4), 313-322.
Kaul, R. N, Eds. 1985 Dynamics of tourism: a trilogy (vol. 111) Transportation
and Marketing. New Delhi
Keegan, O., & McGee, H. (2002). A Guide to Hospital Outpatient Satisfaction
Surveys. Practical Recommendations and the Satisfaction with Outpatient
Services (SWOPS) Questionnaire. Dublin: Royal College of Surgeons in Ireland.
Kemperman, A. D. A. M., Joh, C., & Timmermans, H. J. P, (2003).”Comparing
first-time and repeat visitors' activity patterns”. Tourism Analysis, 8(2), 159-164.
Khadaroo, J. &Seetanah, B. (2007). Transport Infrastructure and Tourism
Development. Annals of Tourism Research, 34(4), 1021–1032.
Kim, H., & Richardson, S. L, 2003. “Motion picture impacts on destination
images”. Annals of Tourism Research, 30(1): 216-237.

260
Kim, S. S., Mckercher, B., & Lee, H, (2009).”Tracking tourism destination image
perception”. Annals of Tourism Research, 36(4), 715-718.
Kim, S. S., Mckercher, B., & Lee, H. (2009). Tracking tourism destination image
perception. Annals of Tourism Research, 36(4), 715-718.
Kim, S.-S., & Morrison, A. M. (2005). Change of images of South Korea among
foreign tourists after the 2002 FIFA World Cup. Tourism Management, 26, 233–
247.
Kinnear, P.R. and Gray, C.D. (2004) SPSS 12 Made Simple. Hove: Psychology
Press.
Kitchen, PJ, 2010, A Reader in Marketing Communications, Taylor & Francis
Kline, R. (2005). Principles and practices of structural equation modeling (2n
ed.). New York: Guilford Press.
Ko, D. W., & Stewart, W. P. (2002). A structural equation model of residents’
attitudes for tourism development. Tourism Management, 23(5), 521- 530.
Koekemoer, L & Bird, S, 2004, “Marketing Communications, Juta Publications”.
Koekemoer, L & Bird, S, 2004, Marketing Communications, Juta Publications
KostićStanković, M., MakajićNikolić, D., Slijepčević M., (2012) Planning of
Social Corporate Responsibility Campaign with Multiple Special Event,
Management, No59 ISSN 1820-0222
Kotler, P, (2000), “Marketing Management”, the Millennium Edition, Prentice-
Hall. International, London-UK
Kotler, P. (2002). Marketing Asian places. Singapore: JohnWiley& Son (Asia)
Pte Ltd.

261
Kotler, P., Armstrong, G., Saunders, J., & Wong, V, (2002).”Priciples of
Marketing (3rd European ed.)”. London: Prentice-Hall.
Kotler, P., Bowen, J. T. &Makens, J. C. (2006), “Marketing for Hospitality and
Tourism”, (4th ed.). Upper Saddle River, NJ: Pearson Prentice Hall.
Kotler, P., Keller, K. L. and Bliemel, F. (2007) Marketing Management, 12th
Edition. Prentice Hall: Upper Saddle River, NJ.
Koutoulas, D., &Zouganeli, S. (2007). Analysing the Destination Marketing Task
at the Regional Level: the Case of Prefecture Tourism Promotion Committees in
Greece. In Proceedings of the 1st Biannual International Conference in Services
Marketing, September, Chios-Greece.
Kozak, M, (2003).”Measuring tourist satisfaction with multiple destinations
attributes”.
Kozak, M. (2001). Repeaters' behavior at two distinct destinations. Annals of
Tourism Research, 28(3), 784-807.
Kozak, M. and Rimmington, M. (2000) Tourist Satisfaction withMallorca, Spain,
as an off-season holiday destination. Journal of Travel research, 38,260-269.
Kulendran, N., and Witt, S. F. (2003). Forecasting the demand for international
business tourism. Journal of Travel Research, 41, 265-271
Kulendran, N., and Wong K. K. F. (2005). Modeling Seasonality in Tourism
Forecasting. Journal of Travel Research, 44, 163-170.
Kumar, B, 2010, Marketing of Hospitality and Tourism Services, Tat McGraw-
Hill Education
Kurtz, DL, MacKenzie, HF & Snow, K, (2009), “Contemporary Marketing,
Cengage Learning”.

262
Kurtz, DL, MacKenzie, HF & Snow, K, 2009, Contemporary Marketing,
Cengage Learning
Lacey, R., Suh, J., and Morgan, R. (2007). “Differential Effects of Preferential
Treatment Levels on Relational Outcomes”. Journal of Service Research, 9(3),
241-256.
Lai, C. N., Yu, T. K., &Kuo, J. K. (2010). How to say sorry: Increasing revisit
intention through effective service recovery in theme parks. Social Behavior and
Personality: An International Journal, 38(4), 509-514.
Lamb, CW, Hair, JF & McDaniel, C, (2008), “Marketing, Cengage Learning”.
Lamb, CW, Hair, JF & McDaniel, C, 2008, Marketing, Cengage Learning
Lau, A. L. S., &McKercher, B, (2004).” Exploration versus acquisition: A
comparison of first-time and repeat visitors”. Journal of Travel Research, 42(3),
279-285.
Laura Eboli and Gabriella Mazzulla ( 2012 ). Structural Equation Modelling for
Analysing Passengers’ Perceptions about Railway Services. Procedia - Social and
Behavioral Sciences 54, 96 – 106
Laura Eboli, Carmen Forciniti and Gabriella Mazzulla( 2012 ). Exploring Land
Use and Transport Interaction through Structural Equation Modelling. Procedia -
Social and Behavioral Sciences 54, 107 – 116
Laura Eboli, Carmen Forciniti and Gabriella Mazzulla( 2012 ). Exploring Land
Use and Transport Interaction through Structural Equation Modelling. Procedia -
Social and Behavioral Sciences 54, 107 – 116
Laurent Bottia,b, NicolasPeypocha, BernardinSolonandrasanaa.(2008).Time and
tourism attraction Tourism Management, 29 594–596

263
Law, C.M. (2002) Urban Tourism: The Visitor Economy and the Growth of Large
Cities, London: Continuum
Laws, E. (1995). Tourism Destination Management: Issues, Analysis and
Policies. London: Routledge.
Lawson, F., & Baud-Bovy, M, (1977). “ Tourism and recreational development”.
London: Architectural Press
Leask, A. (2003) The nature and purpose of visitor attractions in Fyall, A.;
Garrod, B. and Leask, A. (eds.) Managing visitor attractions: new directions,
Oxford: Butterworth-Heinemann
Lee, C K; Yoon, Y. S. and Lee, S. K. (2007) Investigating the relationship among
perceived value, satisfaction, and recommendation: the case of the Korean DMZ
Tourism Management, 28(1) pp. 204-214.
Lee, C., Lee, Y., & Lee, B. (2005), “Korea’s Destination Image Formed By the
2002 World Cup”, Annals of Tourism Research, 32(4), 839–858.
Lee, H. A., Law, R. & Murphy, J. (2011) Helpful reviewers in Tripadvisor, an
online travel community, Journal of Travel & Tourism Marketing, 28(7), 675–
688.
Lee, H. H., & Chang, E, (2011). “Consumer attitudes toward online mass
customization: An application of extended technology acceptance model”.
Journal of Computer‐Mediated Communication, 16(2), 171-200.
Lee, S. Y., Petrick, J. F., & Crompton, J. (2007), “The Roles of Quality and
Intermediary Constructs in Determining Festival Attendees’ Behavioural
Intention”, Journal of Travel Research, 45(4), 402–412.

264
Lee, T. H. (2009), “A Structural Model for Examining How Destination Image
and Interpretation Services Affect Future Visitation Behaviour: A Case Study of
Taiwan’s Taomi Eco-Village”, Journal of Sustainable Tourism, 17(6), 727–745.
Lee, T. H. And Crompton, J, (1992). “Measuring novelty seeking in tourism”,
Annals of Tourism Research, 19, pp.732-751.
Lee, T.H, (2009). “A structural model for examining how destination image and
interpretation services affect future visitation behavior: a case study of Taiwan’s
Taomi eco-village”. Journal of Sustainable Tourism, 17(6): 727-745.
Lee, T. H. (2011). How recreational involvement, place attachment and
conservation commitment effect environmentally responsible behaviour. Journal
of Sustainable Tourism, 19(7), 895-915.
Lehto, X., O’Leary, J., and, Morrison, A. (2004). The Effect of Prior Experience
on Vacation Behavior. Annals of Tourism Research, 31(4), 801-818.
Leisen, B. (2001). Image segmentation: The case of a tourism destination.
Journal of Services Marketing, 15(1),
Lewis, R.C, (1987),” The measurement of gaps in the quality of hotel services”,
International Journal of Hospitality Management, 6(2), pp. 83-8.
Li, X., B. Pan, L.G. Zhang, and W.W. Smith,( 2009). “The Effect of Online
Information Search on Image Development”. Journal of Travel Research 48:45-
57.
Lin, C-H., Duarte, B., Kerstetter, D.L. &Hou, J-S,( 2007).” Examining the Role
of Cognitive and Affective Image in Predicting Choice Across Natural,
Developed, and Theme-Park Destinations”. Journal of Travel Research, 46, 183-
194.

265
Lohm¨oller JB (1989). Latent Variable Path Modeling with Partial Least Squares.
Physica, Heidelberg.
Lopes, SDF 2011, ‘Destination image: Origins, developments, and implications’,
PASOS, vol. 9, no. 2, pp.305-315
Loureiro, S. M. C., & Gonzalez, F. J. M. (2008), “The Importance of Quality,
Satisfaction, Trust, and Image in Relation to Rural Tourist Loyalty”, Journal of
Travel and Tourism Marketing, 25(2), 117–136.
Lovelock, C., &Wirthz, J. (2010), “Services Marketing: People, Technology,
Strategy”, (6th ed.). New Jersey, NY: Prentice Hall.
M. Karunanithy and S. Sivesan. The Impact of Heritage Attributes on the
Satisfaction of Tourism in Sri Lanka European Journal of Business and
Management ,Vol.5, No.27, 2013
MacCallum, R. C., and J. T. Austin, (2000). “Application of Structural Equation
Modeling in Psychological Research.” Annual Review of Psychology, 51: 201-26.
Madden, M. & Shipley, R. (2012),An analysis of the literature at the nexus of
heritage, tourism, and local economic development, Journal of Heritage Tourism,
7 (2), 103–112.
Mahadzirah Mohamad, Ahmad Rusdi Abdullah &SafiekMokhlis. Tourists’
Evaluations of Destination Image and Future Behavioural Intention: The Case of
Malaysia Journal of Management and Sustainability Vol. 2, No. 1; 2012
Marketing Teacher Ltd., 2007, ‘Introduction To Marketing Research’
http://marketingteacher.com/Lessons/lesson_marketing_research.htm
Mathieson, A. and Wall, G, (1982). Tourism: Economic, Physical and
Socialimpacts. Harlow: Longman.

266
McCarthy, E.J. (1975). Basic Marketing: a Managerial Approach. Homewood,
IL: Irwin.
McClinchey, K.A,( 1999). “Rural images, tourism and sustainability:
Perceptions of rural accommodation operators and their visitors in
Waterloo-Wellington Region”, Ontario Wilfrid Laurier University.
McDonald & Wilson, (2011). Marketing Plans: How to Prepare Them, How to
Use Them (7th Ed) - Business & Economics
McDowall Siriporn (2010). International Tourist Satisfaction and Destination
Loyalty: Bangkok, Thailand. Asia Pacific Journal of Tourism Research, 15:1, 21-
42.
McKercher, B., Ho, P.S.Y., du Cros, H. (2004). Attributes of popular cultural
attractions in Hong Kong, Annals of Tourism Research, 31(2), pp. 393–407.
Mehmetoglu, M., &Abelsen, B. (2005). Examining the visitor attraction product.
Tourism Analysis, 4, 269–284.
Middleton, V., & Clarke, J, (2001).”Marketing in Travel and Tourism”. Oxford:
Elsevier Butterworth Heinemann
Millan and Esteban, (2004) Development of a multiple-item scale for measuring
customer satisfaction in travel agencies services, Tourism Management, 25, pp.
533-546.
Millar, S. (1999) An overview of the sector in Leask, A. And Yeoman, I (eds.)
Heritage visitor attractions: an operations management perspective, London:
Thomson Learning.Page, S. and Connell, J. (2009) Tourism: A modern synthesis,
3rd edition, Hampshire: Cengage Learning EMEA.

267
Milman, A. (2009) Key attributes for evaluating the guest experience at theme
parks, International Journal of Tourism Research, 11, pp. 373-387.
Milman, A., and A. Pizam,( 1995). “The role of awareness and familiarity with a
destination: The Central Florida Case”. Journal of Travel Research 33 (3): 21–7
M.J. Gross, G. Brown (2008) . An empirical structural model of tourists and
places: Progressing involvement and place attachment into tourism Tourism
Management 29, 1141–1151
Mohammad Reza Jalil v and, NedaSamiei, Behrooz Dini,
ParisaYaghoubiManzari, “Examining the structural relationships of electronic
word of mouth, destination image, tourist attitude toward destination and travel
intention: An integrated approach”Journal of Destination Marketing &
Management, volume 1, 2012, pp. 134–143
Mohammed BalaBanki, HairulNizam Ismail, MusaDalil and AliyuKawu.
Moderating Role of Affective Destination Image on the Relationship between
Tourists Satisfaction and Behavioural Intention: Evidence from Obudu Mountain
Resort Journal of Environment and Earth Science. Vol.4, No.4, 2014
Mohammad Reza Jalilvand , Neda Samiei, Behrooz Dini, Parisa Yaghoubi
Manzari (2012) . “Examining the structural relationships of electronic word of
mouth, destination image, tourist attitude toward destination and travel intention:
An integrated approach”, Journal of Destination Marketing & Management 1
134–143
Molina, A., Gómez, M. & Martín-Consuegra, D. (2010). Tourism marketing
information and destination image management. African Journal of Business
Management, 4 (5), 722-728.

268
Moller, K, (2006). “The Marketing Mix Revisited: Towards the 21st Century
Marketing by E.Constantinides”, Journal of Marketing Management, 22(3).
Moller, K, 2006, The Marketing Mix Revisited: Towards the 21st Century
Marketing by E.Constantinides, Journal of Marketing Management, 22(3)
Morakabati, J. Beavis, J. Fletcher. (2014 ).Planning for a Qatar without oil:
tourism and economic diversification, a battle of perceptions Tourism Planning &
Development, 11 (4), 415–434
Morrison, A.M. (2010). Hospitality and Travel Marketing. (4th Ed). Clifton Park,
NY: Delmar
MostafaviShirazi, S. F., & Mat Som, A. P. (2010). Relationship Marketing and
Community Involvement: Two Significant Factors for Tourism Strategies. In
C.A. Brebbia& F.D. Pineda (Eds.), Sustainable Tourism IV (pp. 47-53)
Moutinho, L, (1987).”Consumer behaviour in tourism”, European Journal of
Marketing, 21 (10), 5-44.
Moutinho, L., Ballantyne, R. & Rate, S. (2011) Futurecast applied to tourism, in
L. Moutinho (Ed.), Strategic management in tourism (2nd ed.pp. 20–32).
Oxfordshire: CAB International.
M. Reza Jalilvand, Neda Samiei, Behrooz Dini and Parisa Yaghoubi Manzari
(2012). Examining the Structural Relationships of Electronic Word of Mouth,
Destination Image, Tourist Attitude toward Destination and Travel Intention: An
Integrated Approach. Journal of Destination Marketing & Management 1 134–
143
M. Sun, C. Ryan, S. Pan (2015), Using Chinese travel blogs to examine perceived
destination image: The case of New Zealand. Journal of Travel Research, 54 (4),
pp. 543–555

269
Murphy, L., Mascardo, G., Benckendorff, P, (2007). “Exploring word-of-mouth
influences on travel decisions: friends and relatives vs. other travelers”.
International Journal of Consumer Studies ISSN 1470-6423
Murphy, P., Pritchard, M. and Smith, B. (2000). The destination Product and Its
Impacts on Traveller Perceptions. Tourism Management, 21: 43-52.
Musil, C., Jones, S., & Warner, C. (1998). Structural equation modeling and its
relationship to multiple regression and factor analysis. Research in Nursing and
Health, 21, 271– 281.
Mydsf, 2015. Dubai Shopping Festival – Carrying Dubai to the World and
Bringing the World to Dubai for 20 Years.
Myers, M. D., Klein, H. K., 2011. A Set of Principles for Conducting Critical
Research in Information Systems. MIS Quarterly, 35 (1), 17-36.
Myers, M.D. Qualitative Research in Business & Management. Sage
Publications, London, 2013. Second edition
Neuman, W.L, (2000). “Social research methods: Qualitative and quantitative
approaches”. 4th edition, Boston: Allyn& Bacon.
Norazah Mohd Suki(2014). “Passenger satisfaction with airline service quality in
Malaysia: A structural equation modeling approach”. Research in Transportation
Business & Management 10 pages 26–32
Nowacki, M. M, (2005). “Evaluating a museum as a tourist product using the
SERVQUAL method”, Musuem Management and Curatorship, 20, pp.235-250
Nunkoo, R., and H. Ramkissoon, (2012a). “Power, Trust, Social Exchange and
Community Support.” Annals of Tourism Research, 39 (2): 997-1023.

270
Nunkoo, R., and H. Ramkissoon, (2012b). “Structural Equation Modelling and
Regression Analysis in Tourism Research.” Current Issues in Tourism, 18 (2):
777-802.
Nunkoo, R., H. Ramkissoon, and D. Gursoy,n (2012). “Public Trust in Tourism
Institutions.” Annals of Tourism Research, 39 (3): 1538-64.
Nunkoo, R., & Ramkissoon, H. (2010). Community perceptions of tourism in
small island states: A conceptual framework. Journal of Policy Research in
Tourism, Leisure and Events, 2(1), 51-65.
Nunkoo, R., & Ramkissoon, H. (2011a). Developing a community support model
for tourism. Annals of Tourism Research, 38(3), 964-988.
Nunkoo, R., & Ramkissoon, H. (2011b). Residents’ satisfaction with community
attributes and support for tourism. Journal of Hospitality and Tourism Research,
35, 171-190.
Nunnally, J. C. (1978). Psychometric theory (2nd ed.). New York, NY: McGraw-
Hill.
Nunnally, J. C., and I. H. Bernstein, (1994). “Psychometric Theory.3rd edition”.
New York: McGraw-Hill
O’Leary, S., & Deegan, J. (2005), “Ireland’s Image as a Tourism Destination in
France: Attribute Importance and Performance”, Journal of Travel Research,
43(3), 247–260.
Oppermann, M, (1997). “First-time and repeat visitors to New Zealand”. Tourism
Management, 18(3), 177-181
Page, S. (1998) Transport for recreation and tourism, in B. Hoyle and R. Knowles
(eds.), Modern Transport Geography (2nd
edition), Chichester: Wiley.
Page, S. (1999) Transport and Tourism, Harlow: Addison Wesley Longman.
271
Page, S. and Sinclair, M.T. (1992) The channel tunnel: an opportunity for
London’s tourism industry, Tourism Recreation Research, 17(2): 27-70.
Pallant, J. (2001). The SPSS survival manual: A step-by-step guide to data
analysis using SPSS for Windows (version 10). St Leonards, NSW: Allen &
Unwin.
Pallant, J. (2005). SPSS survival manual: A step by step guide to data analysis
using SPSS for Windows (Version 12). Maidenhead: Open University Press
Pallant, J. (2010). SPSS survival manual: A step by step guide to data analysis
using SPSS (4th ed.). Maidenhead: Open University Press/McGraw-Hill.
Pan, B., & Li, X (Robert). (2011). the Long Tail of Destination Image and Online
Marketing. Annals of Tourism Research, 38(1), 132–152.
Park, D-B., & Yoon, Y-S. (2009). Segmentation by motivation in rural tourism: A
Korean case study. Tourism Management, 30(1), 99–108.
Patterson, P. G., and Spreng, R. A. (1997). “Modelling the Relationship between
Perceived Value, Satisfaction and Repurchase Intentions in a Business-to-
Business”, Services Context: An Empirical Examination. International Journal of
Service Industry Management, 8(5), 414–434.
Patton, M, Q. (2002). “Social sciences; Evaluation research (Social action
programs); Methodology, (3rd edition).Thousand Oaks, Calif”.
Pearce, D.G. (1995) Tourism Today: A Geographical Analysis (3rd
edition),
London: Longman.
Pearce, P.L. (1991) Introduction to the Tourism Psychology, Australian
Psychologist, 26(3) pp.145-146.
272
Peng, D.X. & Lai, F. (2012). Using partial least squares in operations
management research: a practical guideline and summary of past research.
Journal of Operations Management, 30(6), 467–480
Petrick, J. F. (2004). “First timers' and repeaters' perceived value”, Journal of
Travel Research, 43(1), 29-38.
Petrick, J. F., &Backman, S. J. (2002). An examination of the construct of
perceived value for the prediction of golf travelers’ intentions to revisit. Journal
of Travel Research, 41(1), 38-45.
Petrick, J. F., and S. J. Backman (2002). “An examination of the construct of
perceived value for the prediction of golf travellers’ intentions to revisit”, Journal
of Travel Research, 41 (1), pp. 38–45.
Petrick, J. F., Morais, D. D., & Norman, W. C. (2001). An examination of the
determinants of entertainment vacationers’ intentions to revisit. Journal of Travel
Research, 40(1), 41-48.
Peypoch, N., &Solonandrasana, B. (2007). On E-attraction tourism destination:
Extension and application. In A. Matias, P. Neto, &P.Nijkamp (Eds.), Advances
in modern tourism research: Economic perspectives. Berlin: Springer,
forthcoming.
Phelps, A. (1986). “Holiday destination image - The problem of assessment: An
example developed in Menorca”, Tourism Management, September, 168-180.
Pickton, D, & Broderick, A, (2005), “Integrated Marketing Communications”,
Pearson Education Limited, Harlow.
Pickton, D, & Broderick, A, 2005, “Integrated Marketing Communications”,
Pearson Education Limited, Harlow.

273
pike (2002)Pike, S. (2002). “Destination image analysis: A review of 142 papers
from 1973-2000”, Tourism Management. 23(5): 541-549.
Pike S, Page S. J “Destination Marketing Organizations and destination
marketing: A narrative analysis of the literature ”Tourism Management volume
41, 2014, pp. 202–227
Pizam, A., & Ellis, T. (1999). “Customer satisfaction and its measurement in
hospitality enterprises”, International Journal of Contemporary Hospitality
Management, 11(7), 326-339.
Prayag, G 2009. “Tourists’ Evaluations of Destination Image, Satisfaction, and
Future Behavioral Intentions – the Case of Mauritius”. Journal of Travel &
Tourism Marketing, 26(8): 836- -853.
Prayag, G. (2012). “Paradise for Who? Segmenting Visitors’ Satisfaction with
Cognitive Image and Predicting Behavioural Loyalty”, International Journal of
Tourism Research. 15(February 2011): 1-15.
Prayag, G., & Ryan, C. (2012). “Antecedents of Tourists’ Loyalty to Mauritius:
The Role and Influence of Destination Image, Place Attachment, Personal
Involvement, and Satisfaction”, Journal of Travel Research, 51(3): 342-356.
Prebensen, Nina, Skallerud, Kåre, & Chen, Joseph S. (2010). “Tourist motivation
with sun and sand destinations: Satisfaction and the Wom-Effect”, Journal of
Travel & Tourism Marketing, 27(8), 858-873.
Pride, WM, Hughes, RJ & Kapoor, JR, 2009, Business, Cengage Learning
Prideaux, B. (2000). The role of the transport system in destination development.
Tourism Management, 21, 53–63.

274
Prideaux, B. (2002) Building visitor attraction in peripheral areas – can
uniqueness overcome isolation to produce viability? International Journal of
Tourism Research, 4, pp.379-389, Publications Inc.
RahovanArmela-Linda, Hotels And Their Impact On The Tourism Of
Transylvania,2013
Ramkissoon, H., & Uysal, M. (2011). The effects of perceived authenticity,
information search behavior, motivation and destination imagery on cultural
behavioral intentions of tourists. Current Issues in Tourism, 14(6), 537-562.
Raquel Camprubi, JaumeGuia & Jordi Comas “The new role of tourists in
destination image formation” Current Issues in Tourism, 2013 Volume 16, Issue
2, pp. 203-209
Rayan, C. (2002). From motivation to assessment. In C. Rayan (Ed.), the tourist
experience (pp. 58-77). London: Continuum.
Ryan, C. and Garland, R. (1999) The use of a specific non-response option on
Likert type scales, Tourism Management 20 (1), 107–14.
RayviscicMutinda, MelphonMayaka, “Application of destination choice model:
Factors influencing domestic tourists destination choice among residents of
Nairobi, Kenya” Tourism Management volume33, 2012, pp. 1593 – 1597
R. Etminani-Ghasrodashti and M. Ardeshiri (2015). Modeling travel behavior by
the structural relationships between lifestyle, built environment and non-working
trips. Transportation Research Part A 78 ,506–518
Reilly, M. D. (1990). “Free elicitation of descriptive adjectives for tourism image
assessment”,Journal of Travel Research, 28 (Spring), 21-26.

275
Reinartz, W., Haenlein, M., Henseler, J., 2009. An empirical comparison of the
efficacy of covariance-based and variance-based SEM, International Journal of
Research in Marketing 26 (4), 332 - 44.
Reisinger, Y., and F. Mavondo.(2007). “Structural Equation Modeling”, Journal
of Travel and Tourism Marketing, 21 (4): 41-71.
Reisinger, Y., and L. Turner. (1999). “Structural Equation Modeling with
LISREL: Application in Tourism”, Tourism Management, 20: 71-88.
Reisinger, Y., and Turner, L. (1997) Cross-cultural differences in tourism:
Indonesia tourists in Australia. Tourism Management, 18, 139147.
Richards, G. and Wilson, J. (2006) Developing creativity in tourist experiences: a
solusion to the serial reproduction of culture? Tourism Management, 27, pp.1209-
1223.
Richardson, S.L. & Crompton, J.L. (1988). “Cultural variations in perceptions of
vacation attributes”, Tourism Management, June, 128- 136.
Rivera, M. A., Shani A and Severt, D. (2009) Perceptions of service attributes in
a religious theme site: an importance–satisfaction analysis, Journal of Heritage
Tourism 4(3), pp. 227–243.
Roscoe, J.T. (1975). “Fundamentals Research Statistics for Behavioural
Sciences.(2nd.). in Hill, R. (1998). What Sample Size is ‘Enough’ in Internet
Survey Research? Interpersonal Computing and Technology”, An electronic
Journal for the 21st Century.
Ruth Craggs, (2008). Tourism And Urban Regeneration: An Analysis Of Visitor
Perception, Behaviour And Experience At The Quays In Salford.

276
Ryu, K., and Jang, S. (2004). “Modified Theory of Reasoned Action: Intention to
Experience Local Cuisine in a Travel Destination”, Journal of Hospitality and
Tourism Research 30.
Samiee, S. (2010). Advancing the country image construct — A commentary
essay. Journal of Business Research, 63, 442–445
S. Pike, C. Ryan (2004). “Destination positioning analysis through a comparison
of cognitive, affective and conative perceptions”, Journal of Travel Research, 42
(4) pp. 333–342. Sage Publications, Inc, Thousand Oaks.
Sarngadharan, M. and Retnakumari, N. (2005) Hospitality and Tourism: A case
study of Kerala, In: Sarnaghadaran, M. and Raju, G. (eds) Tourism and
Sustainable Economic Development Indian and Global Perspectives. New Delhi:
New Century Publications
Sarstedt, M., Henseler, J., and Ringle, C. M. 2011. Multi-Group Analysis in
Partial Least Squares (PLS) Path Modeling: Alternative Methods and Empirical
Results.Advances in International Marketing, 22: 195-218.
Sarstedt, M., and Wilczynski, P. 2009. “More for Less? A Comparison of Single-
Item and Multi-Item Measures,” Die Betriebswirtschaft (69:2), pp. 211-227.
Saunders, M., Lewis, P., and Thornhill, A. (2007). “Research methods for
business students.4th edition, Harlow: Pearson Education”.
Saunders, M.; Lewis, P. and Thornhill, A. (2009). “ Research Methods for
Business Students”(5th edition).British Library.
Saunders, M.N.K., Lewis, P. and Thornhill, A. (2012) Research Methods for
Business Students, 6th edition, Pearson, Harlow.

277
Saunders, M; Lewis, P. and Thornhill, A. (2003). “Research Methods for
Business Students”.(3rd edition).British Library.
Schmallegger, Doris, Taylor, Andrew, and Carson, Dean (2011) Rejuvenating
outback tourism through market diversification: the case of the Flinders Ranges
in South Australia. International Journal of Tourism Research, 13 (4). pp. 384-
399.
Schmidt, Serje, Cantallops, Antoni Serra, & dos Santos, Cristiane Pizzutti.
(2008). The characteristics of hotel websites and their implications for website
effectiveness. International Journal of Hospitality Management, 27(4), 504-516.
Seiler, V. L., Hsieh, S., Seiler, M. J., & Hsieh, C. (2002). Modeling travel
expenditures for Taiwanese tourism. Journal of Travel and Tourism Marketing,
13(4), 47-60.
Shah, R., and S. M. Goldstein. (2006). “Use of Structural Equation Modeling in
Operations Management Research: Looking Back and Forward.” Journal of
Operations Management, 24: 148-69.
Shanka, T., & Taylor, R. (2004). “Discriminating factors of first-time and repeat
visitors to wine festivals”. Current Issues in Tourism, 7(2), 134-145.
Sharma, P. N., & Kim, K. H. (2013). A comparison of PLS and ML bootstrapping
techniques in SEM: A Monte Carlo study. In New perspectives in partial least
squares and related methods, pp. 201-208. Springer New York.
Shoemaker, S., & Shaw, M. (2008). Marketing Essentials in Hospitality and
Tourism: Foundations and Practises. Upper Saddle River, NJ: Pearson
Schumacker, R. Lomax, R. (2004). A Beginner's Guide to Structural Equation
Modeling 2nd Ed. Mahwah, NJ: Lawrence Erlbaum

278
Shaw, G., and D. Wheeler. 1994. Statistical techniques in geographical analysis.
Second edition. David Dulton Pulishers Limited. London. 359 pp.
Smith (2010). “Brand Philadephia: the power of spotlight eventsN. Morgan, R.
Pritchard, Pride (Eds.), Destination branding”, Creating the unique destination
proposition (rev 2nd ed.), Elsevier Limited, Oxford (2010), pp. 261–278.
Smith, S. L. J. 1994. The tourism product. Annals of tourism Research. 21(3):
582-595.
Song, H., Lee, Ch., Kang, S. And Boo, S. (2012). “The effect of environmentally
friendly perceptions on festival visitors decision-making process using an
extended model of goal-directed behavior”. Tourism Management, 33 (6), 1417-
1428.
Song, H., Li, G., Veen, R., & Chen, J. L. (2010). “Assessing Mainland Chinese
Tourist Satisfaction with Hong Kong Using Tourist Satisfaction
Index”. International Journal of Tourism Research, 13 ,82-96.
Sonmez, S. & Sirakaya, E. (2002).” A Distorted Destination Image. The Case of
Turkey.”Journal of Travel Research”, 41, 185-195.
Sotiriadis, M. D., & van Zyl, C. (2013). “Electronic word-of-mouth and online
reviews in tourism services: the use of twitter by tourists”. Electronic
Commerce Research, 13(1), 103-124.
Sotiriadis, M.D. & van Zyl, C. (2013) Electronic word-of-mouth and online
reviews in tourism services: the use of twitter by tourists, Electronic Commerce
Research, 13, 103–124.
Spector, A.J. (1961).” Basic dimensions of the corporate image”. Journal of
Marketing, 25 (October), 47-51.

279
Stabler, W.J. (1995).” The image of destination regions: theoretical and empirical
aspects, Marketing in the Tourism Industry: the Promotion of Destination
Regions, Goodall, B. & Ashworth”, G., 133-161, Croom Helm, London.
Stake, R. E. (2000). “Case studies. In N. K. Denzin & Y. S. Lincoln (Eds.),
Handbook of qualitative research”,(pp. 435-454). Thousand Oaks, CA: Sage.
Stanford, Davina. (2017) Destination Marketing Essentials, S. Pike. Routledge,
Abingdon (2016), 344 pp, Tourism Management, Volume 61, 41–42.
Stankovic, M., Filipovic, V., Mulitinovic, V. (2012), Destination Marketing:
Analyzes of Event Management Effects on the Reputation, Electronic
International Interdisciplinary Conference, September, pp.161-169
Stepchenkova, S. & Mills, E. J. (2010), “Destination Image: A Meta-Analysis of
2000–2007 Research”, Journal of Hospitality Marketing & Management, 19(6),
575-609
Stepchenkova, S., & Morrison, A. M. (2008). “Russia’s destination image
among American pleasure travelers: Revisiting Echtner& Ritchie”. Tourism
Management, 29(3), 548-560.
S. Stepchenkova, X. Li (2013). Chinese outbound tourists' destination image of
America: Part II. Journal of Travel Research, 51 (6), pp. 687–703
Steven Pike (2017). Destination positioning and temporality: Tracking relative
strengths and weaknesses overtime. Journal of Hospitality and Tourism
Management. Volume 31, pp.126–133
Su, H. J., Cheng, K. F., & Huang, H. H. (2011), “Empirical Study of Destination
Loyalty and Its Antecedent: The Perspective of Place Attachment”, The Service
Industries Journal, 31(16), 2721-2739

280
Sun,A Kyung & Kim, D Young (2013). “Does customer satisfaction increase
firm performance? An application of American Customer Satisfaction Index.
International Journal of Hospitality Management” .
Swarbrooke, J. (1995) the development and management of visitor attractions,
Oxford: Butterworth Heinemann.
Swarbrooke, J. (2002) the development and management of visitor attractions,
2nd edition Oxford: Butterworth Heinemann.
Swarbrooke, J. and Homer, S. (2001) Researching tourist satisfaction, Tourism
Intelligence Papers, May, pp. A 16 1 -A 169.
Sweeney, Jillian C. and Geoffrey N. Soutar (2001). “ConsumerPerceived
Value: The Development of a Multiple Item Scale,” Journal of Retailing, 77(2),
203-220.
Tasci, A. D. A., Gartner, W. C., &Cavusgil, S. T. (2007). Conceptualization and
operationalization of destination image. Journal of Hospitality & Tourism
Research, 31(2), 194-223.
Teddlie, C. & A. Tashakkori (2009). “Foundations of Mixed Methods Research.
Thousand Oaks, CA: Sage Publications”.
Tian-Cole, S. T., Crompton, J. K., &Willson, V. L. (2002).An empirical
investigation of the relationships between service quality, satisfaction and
behavioral intentions among visitors to a wildlife refuge. Journal of Leisure
Research, 34, 1–24.
Ticehurst, G. W. and Veal, A. J. (2000). “Business Research Methods: a
managerial approach, Longman, Pearson Education Pty Limited”.

281
Tideswell, C., & Faulkner, B. (1999). “ Multidestination travel patterns of
international visitors to Queensland”. Journal of Travel Research, 37(4), 364-374.
Tourism Analysis 7 (3-4), 229-240
Tourism Canada (1987). “Pleasure travel markets to North America: United
Kingdom. Market Facts of Canada: Toronto”.
Tourism Task Force (TTF). 2003 down the track; Better Ways To deliver
tourism’s land transport infrastructure: Available on www.ttf.org.au
Turner, L. W., & Witt, S. F. (2001). Factors influencing demand for international
tourism: Tourism demand analysis using structural equation modelling, Revisited.
Tourism Economics, 7.
Ulrike bauernfeiend and Andreas H Zins.(2006).”The Perception of Exploratory
Browsing and Trust with Recommender Websites”, Iinformation Technology &
Tourism, vol.8 pp. 121- 136.
Um, S., Chon, K., & Ro, Y. (2006). Antecedents of revisit intention. Annals of
Tourism Research, 33(4), 1141–1158.
UNWTO (1998). Tourism 2020 Vision Executive summary, WTO, Madrid.
UNWTO (2002). “Tourism Market Trends: World overview and Tourism topics.
Madrid”.
UNWTO (2010). Annual Report (2010). “A year of recovery. Madrid”.
UNWTO (2011).” Tourism towards 2030 Global overview, UNWTO General
Assembly 19th
Session, Republic of Korea”.
UNWTO (2015). “Tourism Highlights, WTO, Madrid”.
Urtasun, A., &Gutie´Rrez, I. (2006). Hotel Location in Tourism Cities Madrid
1936– 1998. Annals of Tourism Research, 33(2), 382–402.

282
Uysal, M. (1998). The determinants of tourism demand: A theoretical
perspective. In Ioannides, D. and Debbage, K. G. (ed.), the economic geography
of the tourist industry. pp. 79-98. London: Routledge
Velde, M. v. d., Jansen, P. and Anderson, N. (2004).”Guide to Management
Research Methods, Malden, Blackwell Publishing Ltd”.
VesnaZabkar, Maja MakovecBrencic, TanjaDmitrovic, “Modelling perceived
quality, visitor satisfaction and behavioural intentionsat the destination level”
Tourism Management, volume 31, 2010, pp. 537–546
Victor Teye , Ercan Sirakaya and Sevil F. Sönmez (2002). Residents' attitudes
toward tourism development. Annals of Tourism Research, Vol.29 (3), pp.668-
688
Vitouladiti, Ou. (2003). Sustainable tourism development and destination
Marketing. In Proceedings of the International Scientific Conference: Sustainable
Tourism Development and Environment. Chios Island
Walliman, N. S. &Walliman N. (2011) “Research methods: the basics” Taylor
and Francis.
Walmsley, D., and J. Jenkins (1993) “Appraisive Images of Tourist Areas:
Application of Personal Construct”. Australian Geographer 24(2): 1-13.
WANG, Y. (2008), “Collaborative Destination Marketing: Understanding the
Dynamic Process”, Journal of Travel Research, 47 (2), 151-166.
Wang, Y., & Davidson, M. (2010).” Pre-and post-trip perceptions: an insight into
Chinese package holiday Market to Australia”,Journal of Vacation Marketing,
16(2), 111-123.

283
Wanhill, S. (2008a) interpreting the development of the visitor attraction product,
in Fyall, A.; Garrod, B.; Leask, A. and Wanhill, S. (eds.) Managing visitor
attractions: New direction, 2nd edition, Oxford: Butterworth Heinemann
Wanhill, S. (2008b) Economic aspect of developing theme parks, in Fyall, A.;
Garrod, B.; Leask, A. and Wanhill, S. (eds.) managing visitor attractions: New
direction, Oxford: Butterworth Heinemann.
Wanhill, S. R. C. (2003) Charging for congestion at tourist attractions,
International Journal of Tourism Management, 1, pp. 168-174.
Wanhill, S. R. C. (2003) Interpreting the development of the visitor attraction
product, in Fyall, A., Garrod, B. and Leask, A. (eds.) Managing visitor
attractions, Oxford: Butterworth-Heinemann
Weaver, D. and Lawton, L. (2006). Tourism Management. 3rd ed. Milton: John
Weber, K. (1997) The Assessment of tourist satisfaction using the expectancy
disconfirmation theory: a study of the German travel market in Australia. Pacific
Tourism Review, 2, 35-45.
Wee - Kheng Tan and Cheng-En Wu (2016). An investigation of the relationships
among destination familiarity, destination image and future visit intention.
Journal of Destination Marketing & Management, 5(3), pp.214–226
Wertz, C., Linn, R., and J¨oreskog, K. (1974). Intraclass reliability estimates:
Testing structural assumptions. Educational and Psychological Measurement,
34(1), 25–33
Williams, C., &Buswell, J. (2003). Service quality in leisure and tourism. CABI.
Wober, K., & Gretzel, U. (2000). Tourism manager’s adoption of marketing
decision support systems. Journal of Travel Research, 39(2), 172–181.

284
Wold, H. (1975). PLS path models with latent variables: the nipals approach. In
H. M. Blalock, A. Aganbegian, F. M. Borodkin, R. Boudon, and V. Cappecchi
(Eds.), Quantitative sociology: international perspectives on mathematical and
statistical modeling. New York: Academic Press.
Wold, S., Martens, H., & Wold, H. (1983). The multivariate calibration problem
in chemistry solved by the PLS method. In Matrix pencils (pp. 286-293). Springer
Berlin Heidelberg.
Wold H (1985). “Partial Least Squares.” In S Kotz, NL Johnson (eds.),
Encyclopedia of Statistical Sciences, volume 6, pp. 581–591. John Wiley & Sons,
New York.
World Travel and Tourism Council (WTTC) (2012). “Global Summit, Japan”.
W.W. Smith, X. Li, B. Pan, M. Witte, S.T. Doherty (2015). “ Tracking
destination image across the trip experience with smartphone technology”.
Tourism Management, 48 (June) (2015), pp. 113–122
Yilmaz Y, Yilmaz Y, Đçigen ET, Ekin Y, Utku BD (2009). Destination Image: A
Comparative Study on Pre and Post Trip Image Variations. J. Hosp. Mark.
Manage. 18(5): 461-479.
Yin, R. K. (2003)."Case Study research Design and Methods". (3rd Edition),
Yin, R. K. (2003)."Case Study research Design and Methods". (3rd Edition),
Yin, R. K. (2009).“Case Study Research: Design and Methods”. London. Sage
Yoon, Y. and Uysal, M. (2005) An examination of the effects of motivation and
satisfaction on destination loyalty: a structural model, Tourism Management, Vol.
26, pp. 45-56.

285
Yooshik Yoon, Dogan Gursoy, Joseph S. Chen (2001). “Validating a tourism
development theory with structural equation modelling”, Tourism Management
22, 363 – 372
Yu, L. and Goulden, G. (2006) A comparative analysis of international tourists’
satisfaction in Mongolia, Tourism Management, 27(6) pp.1331-1342.
Yuksel, A. (2001) Managing customer satisfaction and retention: A case of tourist
destinations, Turkey. Journal of Vacation Marketing, 7, 153-168.
Yuksel, A. and Yuksel, F. (2003) Measurement of tourist satisfaction with
restaurant services: A segment-based approach, Journal of Vacation Marketing,
9(1) pp. 52-68.
Y. Wang, A. Pizam (2011). Destination marketing and management: scope,
definition and structure. Destination marketing and Management: Theories and
applications, CABI, Oxfordshire, UK , 1–20
Yüksel, A., &Akgül, O. (2007). Postcards as affective image makers: An idle
agent in destination marketing. Tourism Management, 28, 714–725.
Zabkar, V., Makovec M., and Dmitrovic, T. (2009). “Modelling perceived
quality, visitor satisfaction and behavioural intentions at the destination level”,
Tourism Management, 2009, 1-10.
Zeugner-Roth, K. P., & Diamantopoulos, A. (2010). Advancing the country
image construct: Reply to Samiee's (2009) commentary. Journal of Business
Research, 63, 446–449.
Zikmund, W.G., (2003). “Business Research Methods”, 7th edn, Thomson/South-
Western, Cincinnati, OH.

286
Appendices
Appendix 1
QUESTIONNAIRE
PART A: RESPONDENT INFORMATION
1. What is your main purpose of this trip?
Holiday
Conferences
Health Treatment
Sports
Education
Business
Official market
Transit
Shopping
Incentive Travel
2. Which of the following groups would you place yourself in?
National of GCC countries
National of Middle East countries
American,
European,
African,
Asian,
Australians
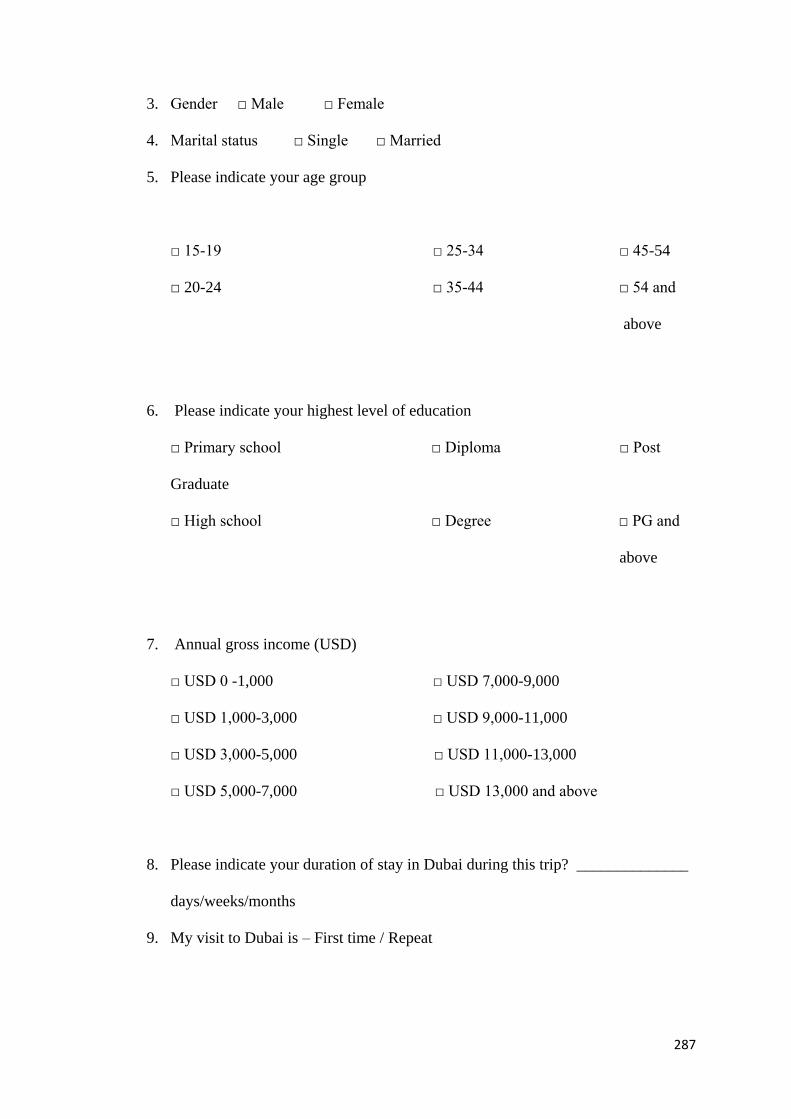
287
3. Gender □ Male □ Female
4. Marital status □ Single □ Married
5. Please indicate your age group
□ 15-19 □ 25-34 □ 45-54
□ 20-24 □ 35-44 □ 54 and
above
6. Please indicate your highest level of education
□ Primary school □ Diploma □ Post
Graduate
□ High school □ Degree □ PG and
above
7. Annual gross income (USD)
□ USD 0 -1,000 □ USD 7,000-9,000
□ USD 1,000-3,000 □ USD 9,000-11,000
□ USD 3,000-5,000 □ USD 11,000-13,000
□ USD 5,000-7,000 □ USD 13,000 and above
8. Please indicate your duration of stay in Dubai during this trip? ______________
days/weeks/months
9. My visit to Dubai is – First time / Repeat

288
PART B: DESTINATION SELECTION DECISION & DESTINATION
MARKETING
I. Destination Selection Decision
Please indicate the influences of each of the following Infrastructure attributes on your
decision on the destination selection to visit this area
Infrastructure Not at all
influenced
Slightly
influenced
Somewhat
influenced
Very much
influenced
Extremely
influenced
Attractions 1 2 3 4 5
Accommodation 1 2 3 4 5
Accessibility 1 2 3 4 5
Amenities 1 2 3 4 5
II. Destination marketing
How much is the influences of each of the following were to find information about the
Infrastructure of this area?
Not at all
influenced
Slightly
influenced
Somewhat
influenced
Very much
influenced
Extremely
influenced
Previous experience (Already
visited & it’s the repeat visit)
1 2 3 4 5
Internet. 1 2 3 4 5
Friends and relatives. 1 2 3 4 5
Media (Radio/TV, Newspapers) 1 2 3 4 5
Travel agency & Tour operators 1 2 3 4 5
Fairs and/or exhibitions 1 2 3 4 5
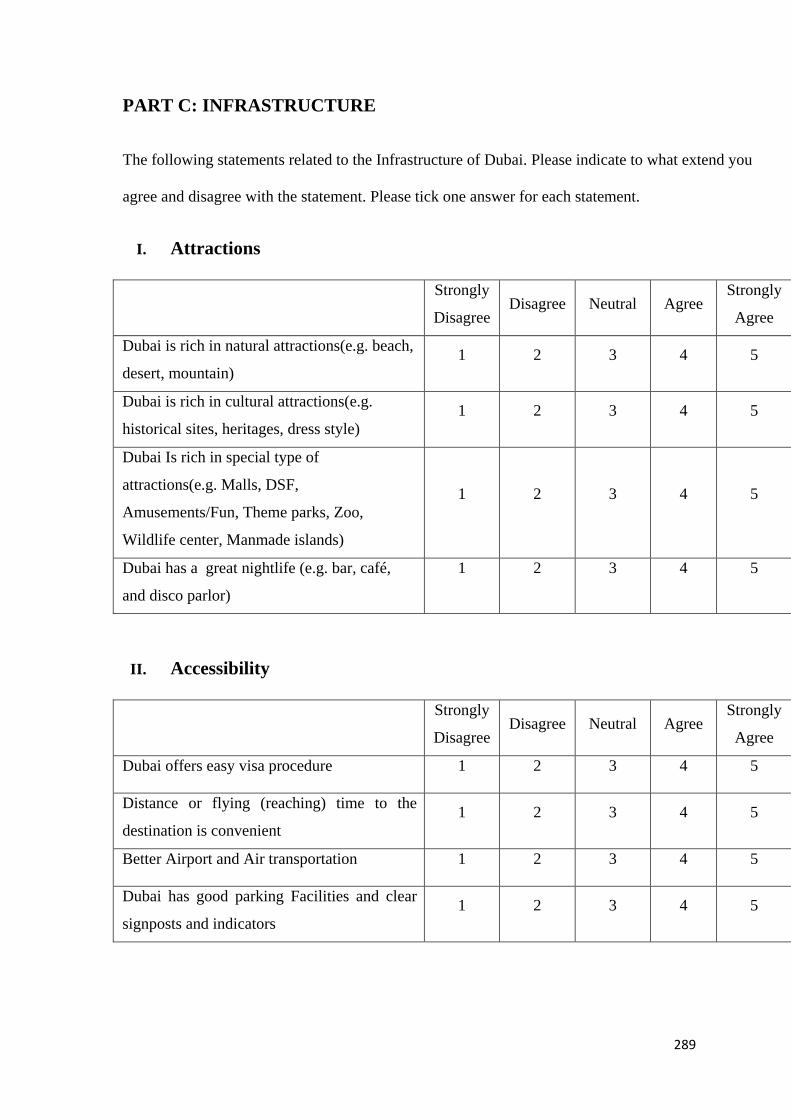
289
PART C: INFRASTRUCTURE
The following statements related to the Infrastructure of Dubai. Please indicate to what extend you
agree and disagree with the statement. Please tick one answer for each statement.
I. Attractions
Strongly
Disagree Disagree Neutral Agree
Strongly
Agree
Dubai is rich in natural attractions(e.g. beach,
desert, mountain)
1 2 3 4 5
Dubai is rich in cultural attractions(e.g.
historical sites, heritages, dress style)
1 2 3 4 5
Dubai Is rich in special type of
attractions(e.g. Malls, DSF,
Amusements/Fun, Theme parks, Zoo,
Wildlife center, Manmade islands)
1 2 3 4 5
Dubai has a great nightlife (e.g. bar, café,
and disco parlor)
1 2 3 4 5
II. Accessibility
Strongly
Disagree Disagree Neutral Agree
Strongly
Agree
Dubai offers easy visa procedure 1 2 3 4 5
Distance or flying (reaching) time to the
destination is convenient
1 2 3 4 5
Better Airport and Air transportation 1 2 3 4 5
Dubai has good parking Facilities and clear
signposts and indicators
1 2 3 4 5

290
III. Accommodation
Strongly
Disagree Disagree Neutral Agree
Strongly
Agree
Dubai has wide selection of accommodation 1 2 3 4 5
Accommodation in Dubai offers good
physical environment 1 2 3 4 5
Accommodation in Dubai offers good
services 1 2 3 4 5
Good conference and convention facilities 1 2 3 4 5
Attitude of staff towards visitors
(Friendliness and hospitality)
1 2 3 4 5
IV. Amenities
Strongly
Disagree Disagree Neutral Agree
Strongly
Agree
Dubai offers facilities for children, elderly
and physically challenged people 1 2 3 4 5
Dubai offers a wide selection of food (local
food, exotic food) 1 2 3 4 5
Dubai offers various shopping facilities (e.g.
main street, market and shopping mall) 1 2 3 4 5
Dubai has good communication systems (
e.g. Information centers, telecom) 1 2 3 4 5
Dubai ensures safety and security 1 2 3 4 5
Availability of intermediaries in Dubai
(Travel agents, Tour operators, Guides
etc.)
1 2 3 4 5

291
V. Quality of infrastructure
PART D: PRE AND POST VISIT DESTINATION IMAGE
I. Below are listed some statements which refer to the general image of
this tourist destination. Please evaluate each of the statements twice to
indicate to what extent you agree with it before your visit and after
your visit in the box (below the statements).
i) Most people have a positive opinion about this tourist destination.
ii) This tourist destination is a friendly and popular place.
iii) This tourist destination has a unique image.
iv) Dubai is a cosmopolitan city (e.g. fairly large populations, many
multinational corporations, center for financial and education
institution)
v) Dubai is a vibrant youthful city has enormous shopping malls and
great nightlife
vi) Dubai is a modern city comprises active populations, skyscrapers and
great crowds
vii) Dubai is a sophisticated city which combines cultural heritages,
traditional urbanism and modernity together
How would you rate the overall
quality of Infrastructure (Attractions,
Accommodation, Accessibility &
Amenities) of this destination?
Poor Fair Good Very
Good Excellent
1 2 3 4 5
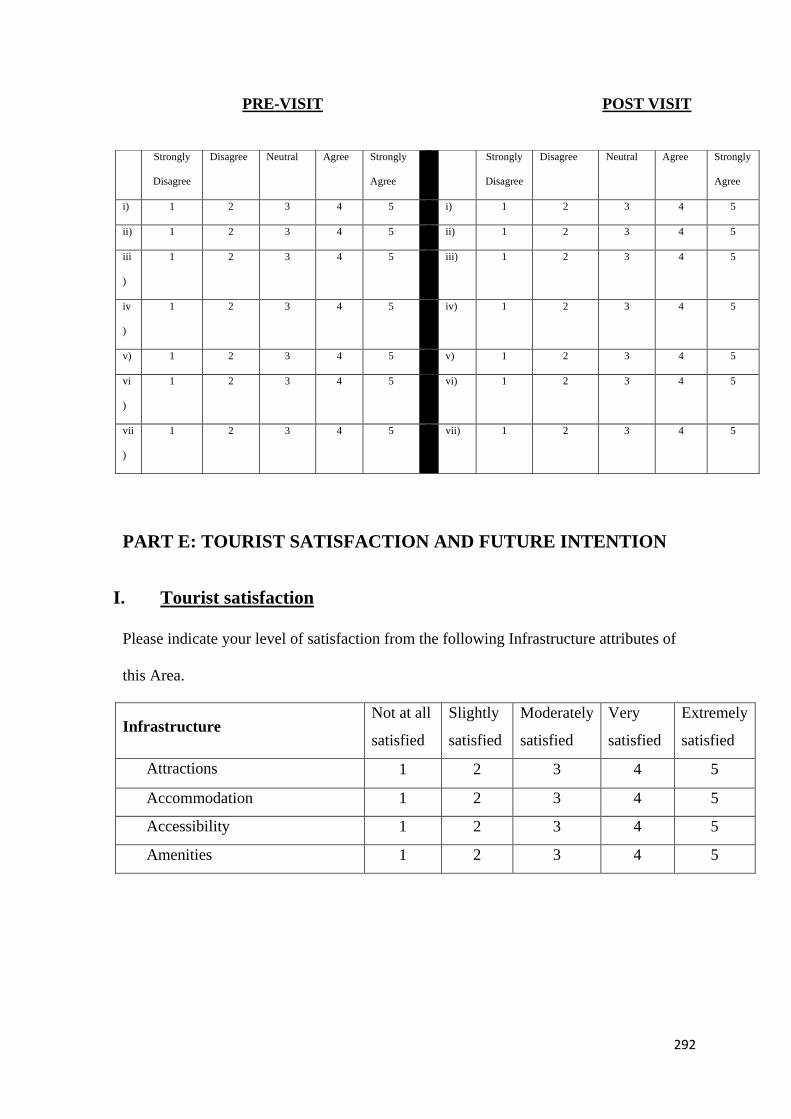
292
PRE-VISIT POST VISIT
PART E: TOURIST SATISFACTION AND FUTURE INTENTION
I. Tourist satisfaction
Please indicate your level of satisfaction from the following Infrastructure attributes of
this Area.
Infrastructure Not at all
satisfied
Slightly
satisfied
Moderately
satisfied
Very
satisfied
Extremely
satisfied
Attractions 1 2 3 4 5
Accommodation 1 2 3 4 5
Accessibility 1 2 3 4 5
Amenities 1 2 3 4 5
Strongly
Disagree
Disagree Neutral Agree Strongly
Agree
Strongly
Disagree
Disagree Neutral Agree Strongly
Agree
i) 1 2 3 4 5 i) 1 2 3 4 5
ii) 1 2 3 4 5 ii) 1 2 3 4 5
iii
)
1 2 3 4 5 iii) 1 2 3 4 5
iv
)
1 2 3 4 5 iv) 1 2 3 4 5
v) 1 2 3 4 5 v) 1 2 3 4 5
vi
)
1 2 3 4 5 vi) 1 2 3 4 5
vii
)
1 2 3 4 5 vii) 1 2 3 4 5

293
II. Future intention
The following statements related to the tourist future intention.
Please indicate to what extend you agree and disagree with the statement. Please tick one
answer for each statement.
After I visited Dubai, my future intention will be:
Future intention Strongly
Disagree Disagree Neutral Agree
Strongly
Agree
If I get a chance again I would choose this
tourist destination again. 1 2 3 4 5
I will visit Dubai again 1 2 3 4 5
I will visit Dubai more often in the future. 1 2 3 4 5
I will recommend Dubai to my friends and
relatives. 1 2 3 4 5
I feel at home in this tourist destination. 1 2 3 4 5
I will try to move to Dubai. 1 2 3 4 5

294
Appendix 2
Respondents’ Socio - Demographic Characteristics

295

296

297
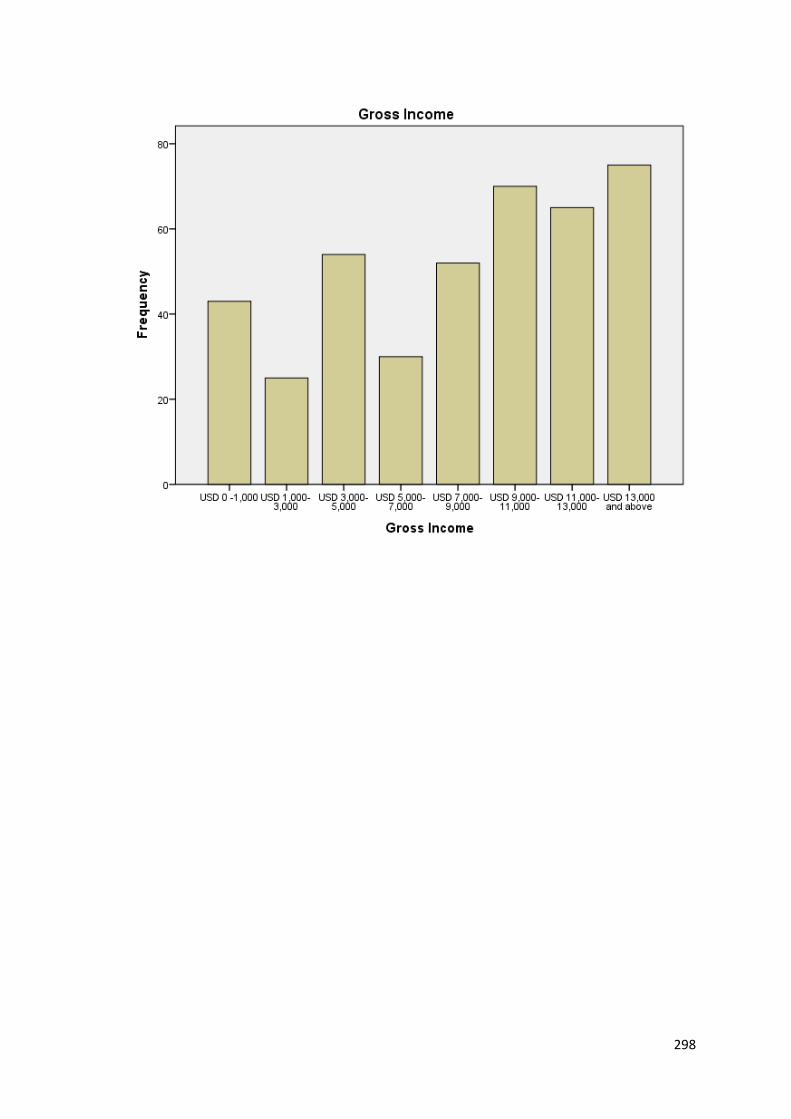
298

299
Appendix 3
Date Analysis for Questionnaire - Graphs

300

301

302
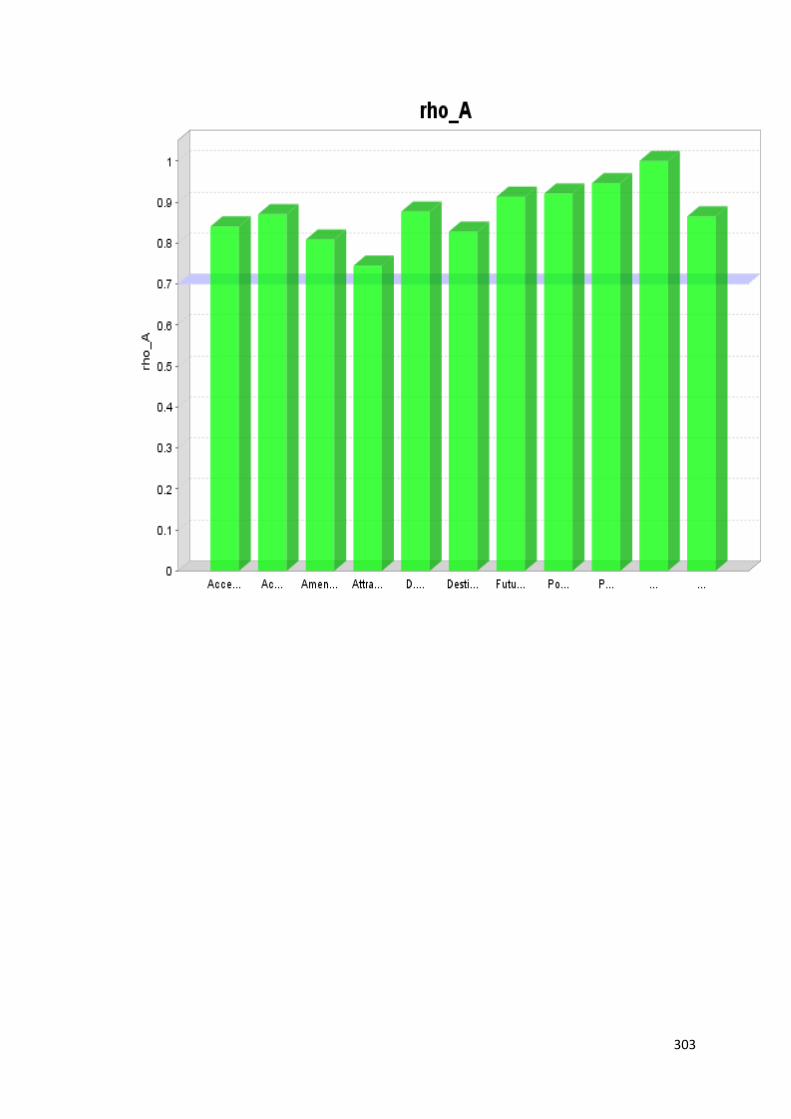
303
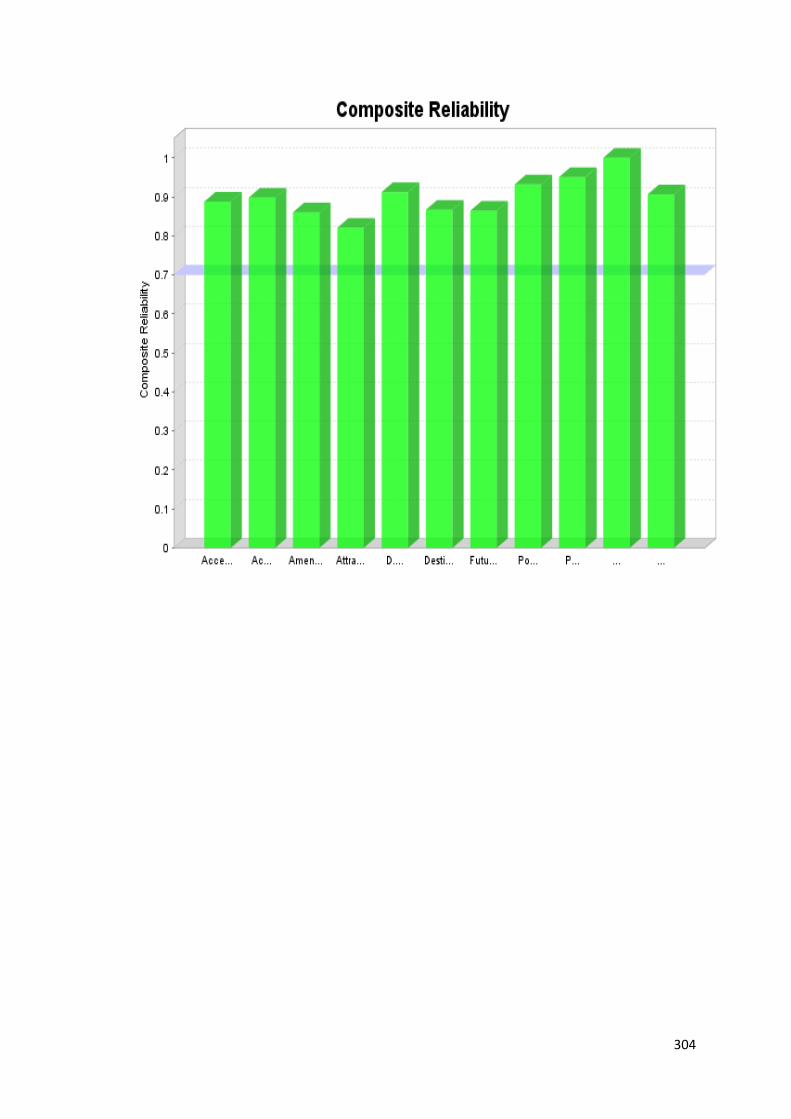
304

305

306

307
Appendix 4
Variables Frequency Tables and graphs
Overall Quality of Infrastructure
Frequency Percent Valid Percent Cumulative
Percent
Valid
2 12 2.9 2.9 2.9
3 48 11.6 11.6 14.5
4 189 45.7 45.7 60.1
5 165 39.9 39.9 100.0
Total 414 100.0 100.0
T.Satisfaction Attractions
Frequency Percent Valid Percent Cumulative
Percent
Valid
2 4 1.0 1.0 1.0
3 25 6.0 6.0 7.0
4 183 44.2 44.2 51.2
5 202 48.8 48.8 100.0
Total 414 100.0 100.0
T.Satisfaction Accommodations
Frequency Percent Valid Percent Cumulative
Percent
Valid
1 2 .5 .5 .5
2 3 .7 .7 1.2
3 54 13.0 13.0 14.3
4 139 33.6 33.6 47.8
5 216 52.2 52.2 100.0
Total 414 100.0 100.0

308
T.Satisfaction Accessiblity
Frequency Percent Valid Percent Cumulative
Percent
Valid
2 1 .2 .2 .2
3 56 13.5 13.5 13.8
4 153 37.0 37.0 50.7
5 204 49.3 49.3 100.0
Total 414 100.0 100.0
T.Satisfaction Amenities
Frequency Percent Valid Percent Cumulative
Percent
Valid
2 10 2.4 2.4 2.4
3 31 7.5 7.5 9.9
4 160 38.6 38.6 48.6
5 213 51.4 51.4 100.0
Total 414 100.0 100.0
Future Intention - Descriptive Statistics
N Minimum Maximum Mean Std.
Deviation
FI_GetaChanceofVisitingAgain 414 1 5 3.47 1.254
FI_VisitDxbAgain 414 1 5 3.62 1.136
FI_VisitDubaiMoreinFuture 414 1 5 3.64 1.248
FI_RecommendDxbtoFriendsRelatives 414 1 5 3.56 1.237
FI_FeelathomeinTouristDestination 414 1 5 3.47 1.373
FI_TrytoMovetoDxb 414 1 5 3.48 1.424
Valid N (listwise) 414
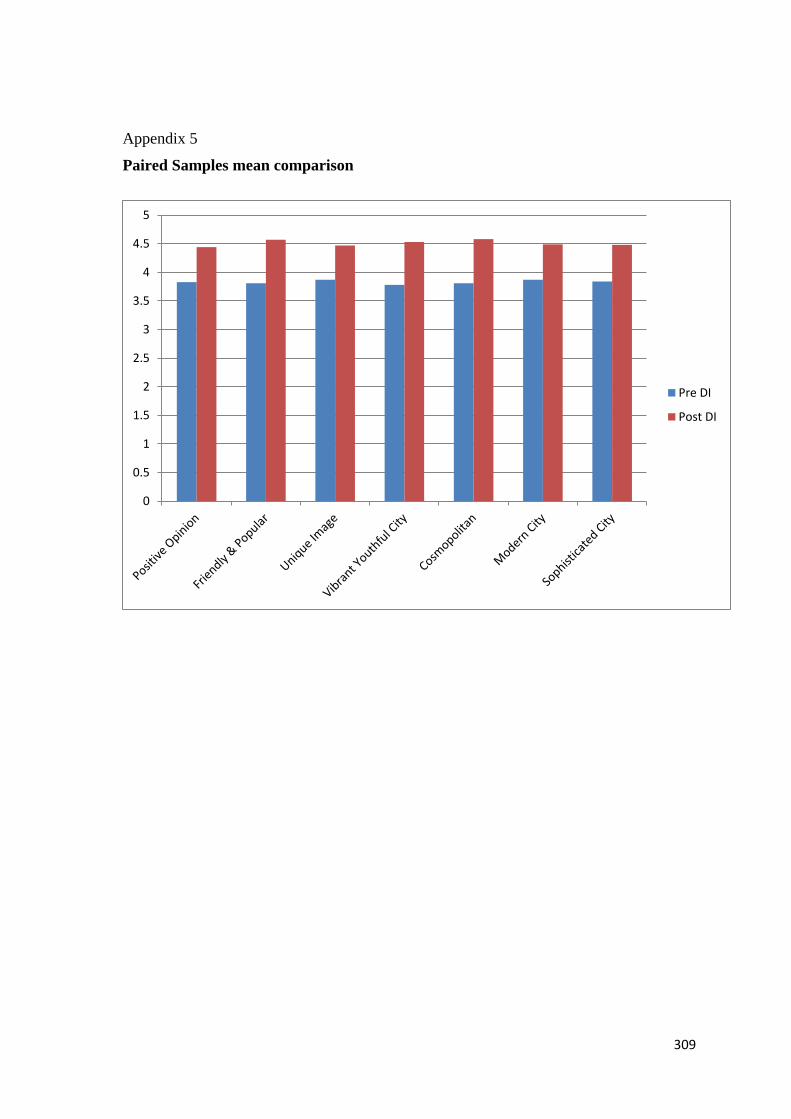
309
Appendix 5
Paired Samples mean comparison
0
0.5
1
1.5
2
2.5
3
3.5
4
4.5
5
Pre DI
Post DI

310
Appendix 6

311
Appendix 7

312

313

314
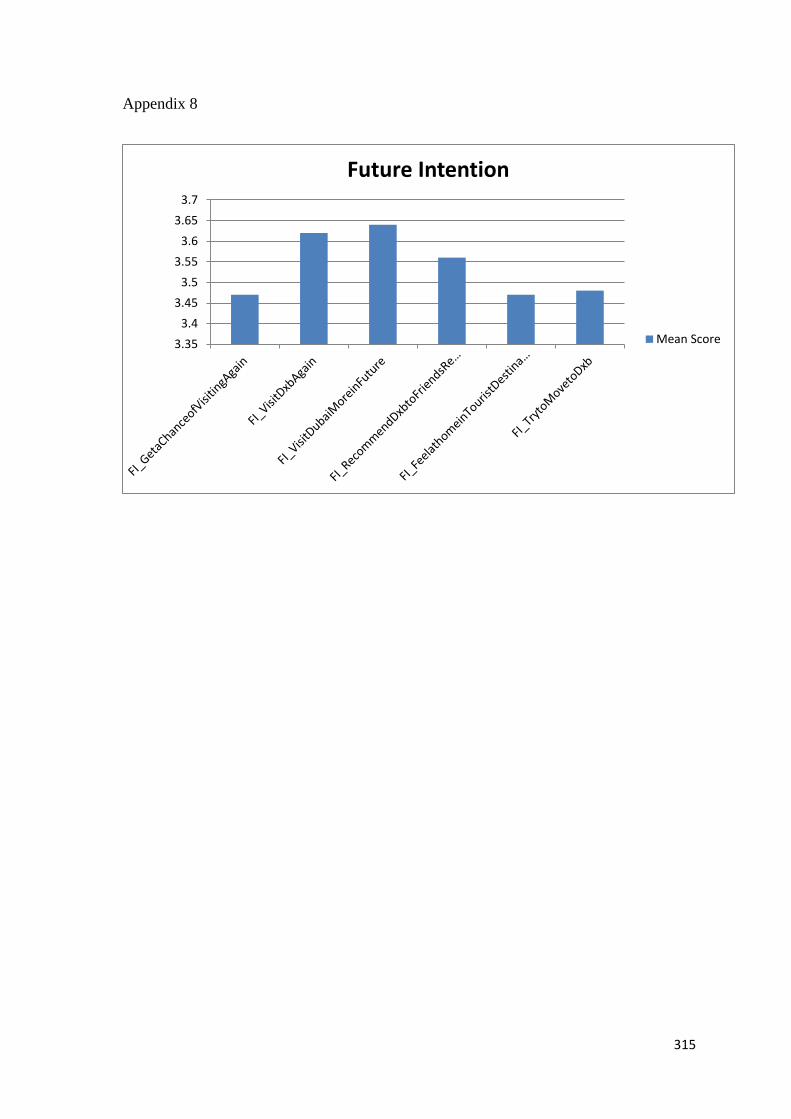
315
Appendix 8
3.35
3.4
3.45
3.5
3.55
3.6
3.65
3.7
Future Intention
Mean Score

316
Appendix 9
Gantt chart
Year 1 – 3 (April 2013 – March 2016)
List of tasks
Months Year 1 Year 2 Year 3
1 - 3 4-6 7-9 10-12 13-15 16-18 19-21 22-24 25-27 28-30 31-33 34-36 1. Research Planning Phase Learning Agreement Literature Review Interim Report Writing & submission Design Data Collection (Questionnaire) 2. Research Development Phase Ethical approval application and
approval
Data Collection through Pilot Study
(Expert opinion)
Refine Questions on the basis of Pilot
study Data Analysis
Questionnaire Survey Data Analysis (Preliminary) Conceptual Model Development Internal Evaluation Report Writing &
submission
3. Research Validation Phase Validation of the relationships in the
hypotheses
Case Study Final Model Development Final Findings & Analysis Conclusion & Recommendations Writing Final Report writing & Submission


![:: · Title: Karbala Ki Kahaani - Shaykh Muhammad Ataa-Ullaah Haneef Bhojiyaani Author: [Admin] Subject: Rudood Keywords: karbala; iraq; iraaq; ali](https://img.pdfslide.us/doc/110x75/5e1c121ea9bf7548fc74868a/-title-karbala-ki-kahaani-shaykh-muhammad-ataa-ullaah-haneef-bhojiyaani-author.jpg)