Embed Size (px)
Citation preview
Sun Corridor Projections 1
Sun Corridor Projections
Base and Alternative Scenarios
Prepared for
Central Arizona Association of GovernmentsJanuary 8, 2009

Sun Corridor Projections 2
Study Outline• Joint effort
– ASU’s WP Carey School of Business– UA’s Eller College of Management
• Review economic & demographic research• Development of Sun Corridor (3-county) model• Base forecast highlights
– Population and demographic outlook– Employment outlook– Earnings, income and sales outlook
• High & low scenario results

Sun Corridor Projections 3
Economic & Demographic Research

Sun Corridor Projections 4
Introduction
• The Economic and Demographic Research portion examines/identifies long-term economic and demographic forces that could affect economic development in 3-county “megapolitan” area (Pinal, Maricopa and Pima counties combined)

Sun Corridor Projections 5
Economic & Demographic Topics
• Population, demographics and net migration analysis
• Industry mix and basic industries in the region
• Target industry recommendations• Interviews with “experts”• Case study: Riverside vs. Pinal County

Sun Corridor Projections 6
Population, Demographics and
Net Migration Analysis• Historical population growth
– Natural increase– Domestic migration– Immigration
• Comparison of long-term forecasts• Expert interview summary

Sun Corridor Projections 7
Population, Demographics and
Net Migration Analysis• Use Census Bureau estimates of population
– By age, sex, ethnicity
• Domestic migration to AZ is much larger than immigration– Undocumented immigration surged in mid-90s,
peaked in 2000, and has declined since
• Largest migration flows from Los Angeles– And other So. California metros (55% of total)– Chicago (during the 1980s, 6% in 2006)

Sun Corridor Projections 8
Industry Mix and Basic Industries, 2004
• Manufacturing is a key driver of the megapolitan economy (33,000 excess jobs)– Electronic components (11,000)– Instruments (4,300)– Aerospace (17,700)– 2 Wholesale trade industries tied to high tech mfg. (6,000)
• Tourism (30,000 excess jobs) – low wage • Administrative support and finance (16,000 excess
jobs)• Copper mining and smelting (2,000 excess jobs)
Sun Corridor Projections 9
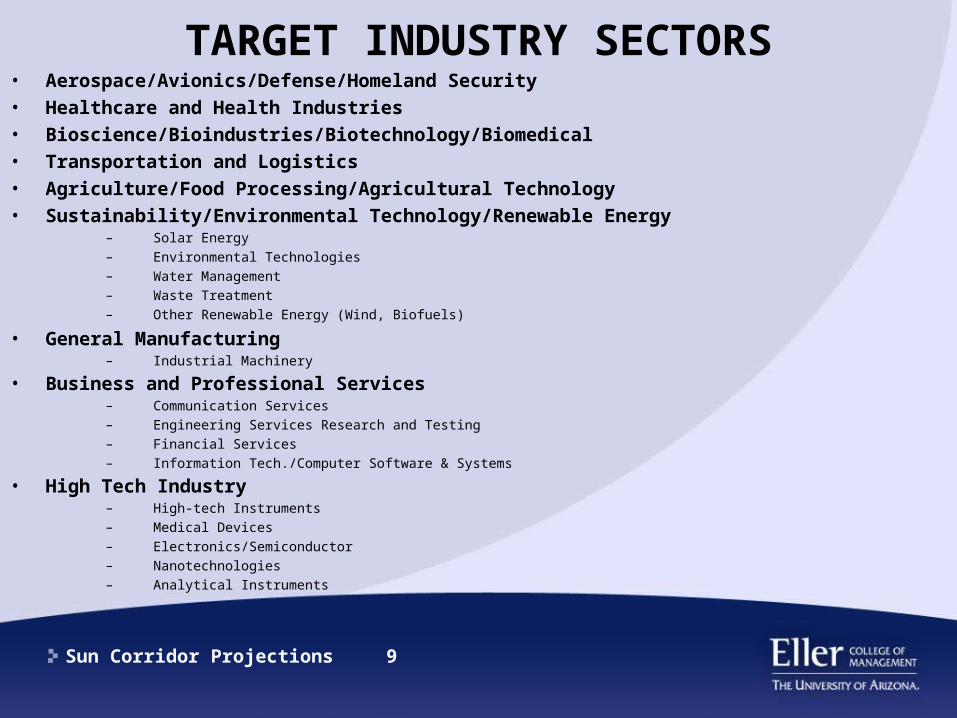
TARGET INDUSTRY SECTORS• Aerospace/Avionics/Defense/Homeland Security• Healthcare and Health Industries• Bioscience/Bioindustries/Biotechnology/Biomedical• Transportation and Logistics• Agriculture/Food Processing/Agricultural Technology • Sustainability/Environmental Technology/Renewable Energy
– Solar Energy – Environmental Technologies – Water Management – Waste Treatment – Other Renewable Energy (Wind, Biofuels)
• General Manufacturing – Industrial Machinery
• Business and Professional Services
– Communication Services – Engineering Services Research and Testing – Financial Services – Information Tech./Computer Software & Systems
• High Tech Industry
– High-tech Instruments – Medical Devices – Electronics/Semiconductor– Nanotechnologies – Analytical Instruments

Sun Corridor Projections 10
Economic Interview Summary• Global competitiveness Issues
– Workforce and education– Infrastructure– Labor costs– Geographic location
• Constraints to economic development– K-12 education quality– Transportation system– Water and waste water systems– Availability of high skilled workforce– Access to local employment opportunities– Funding is the key to avoiding constraints
• Water issues– With proper management there will be enough water in Arizona in the long-run– AZ will have to develop incremental water supplies to extend life of resources– There could be temporary localized water shortages– Water will become more expensive
Sun Corridor Projections 11
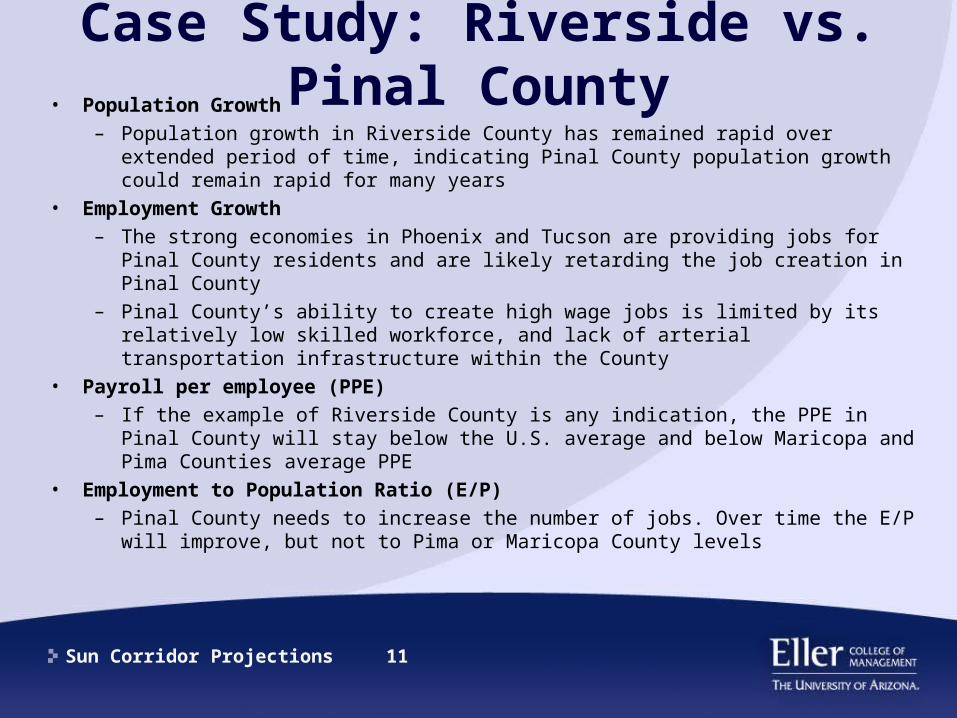
Case Study: Riverside vs. Pinal County• Population Growth
– Population growth in Riverside County has remained rapid over extended period of time, indicating Pinal County population growth could remain rapid for many years
• Employment Growth– The strong economies in Phoenix and Tucson are providing jobs for Pinal
County residents and are likely retarding the job creation in Pinal County– Pinal County’s ability to create high wage jobs is limited by its relatively
low skilled workforce, and lack of arterial transportation infrastructure within the County
• Payroll per employee (PPE)– If the example of Riverside County is any indication, the PPE in Pinal
County will stay below the U.S. average and below Maricopa and Pima Counties average PPE
• Employment to Population Ratio (E/P)– Pinal County needs to increase the number of jobs. Over time the E/P will
improve, but not to Pima or Maricopa County levels
Sun Corridor Projections 12
Sun Corridor Model
Sun Corridor Projections 13
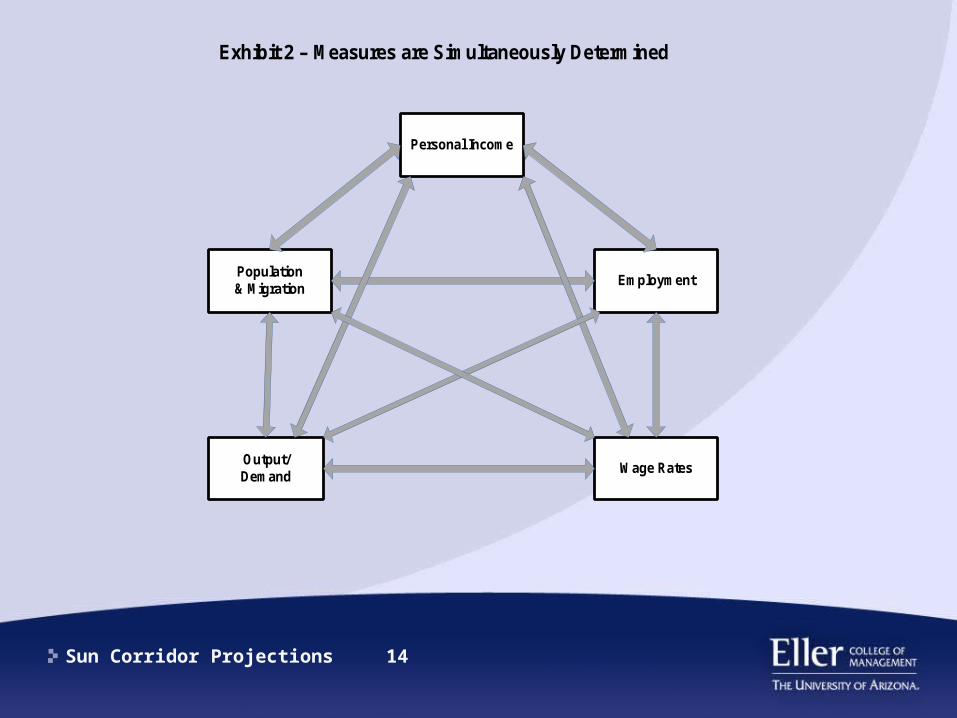
The Sun Corridor Model
• The Sun Corridor model was developed using data for the 3-county megapolitan area that includes Pinal, Maricopa and Pima Counties
• The model consists of an econometric general equilibrium structural model with an embedded cohort survival model
Sun Corridor Projections 14
Personal Income
Population& Migration
Employment
Output/Demand
Wage Rates
Exhibit 2 – Measures are Simultaneously Determined
Sun Corridor Projections 15
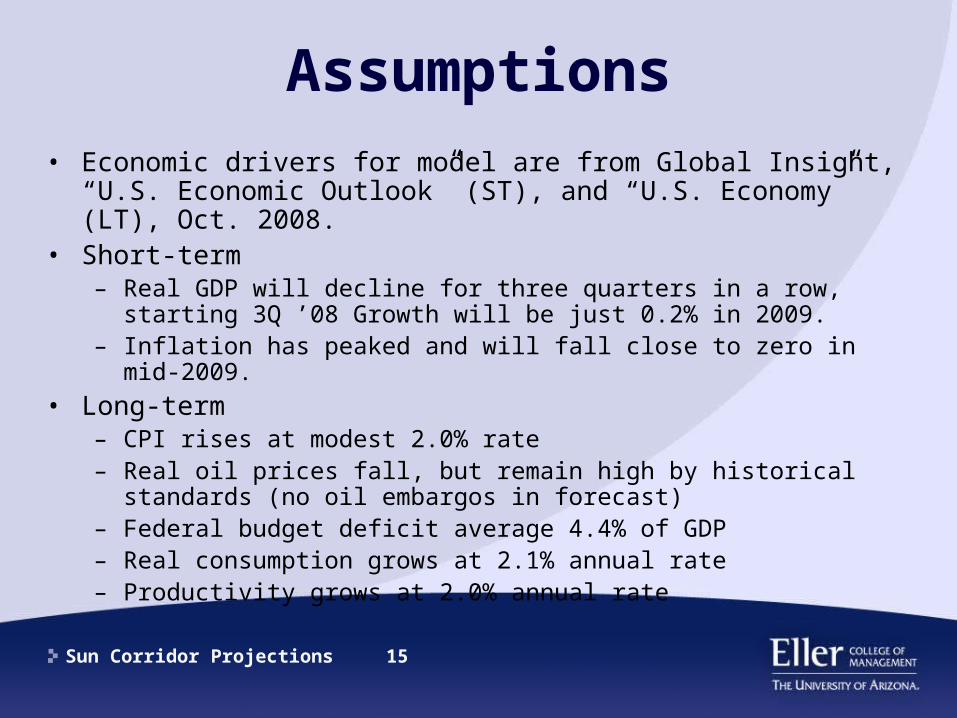
Assumptions• Economic drivers for model are from Global Insight, “U.S.
Economic Outlook” (ST), and “U.S. Economy” (LT), Oct. 2008.• Short-term
– Real GDP will decline for three quarters in a row, starting 3Q ’08 Growth will be just 0.2% in 2009.
– Inflation has peaked and will fall close to zero in mid-2009.• Long-term
– CPI rises at modest 2.0% rate– Real oil prices fall, but remain high by historical standards (no oil
embargos in forecast)– Federal budget deficit average 4.4% of GDP– Real consumption grows at 2.1% annual rate– Productivity grows at 2.0% annual rate
Sun Corridor Projections 16
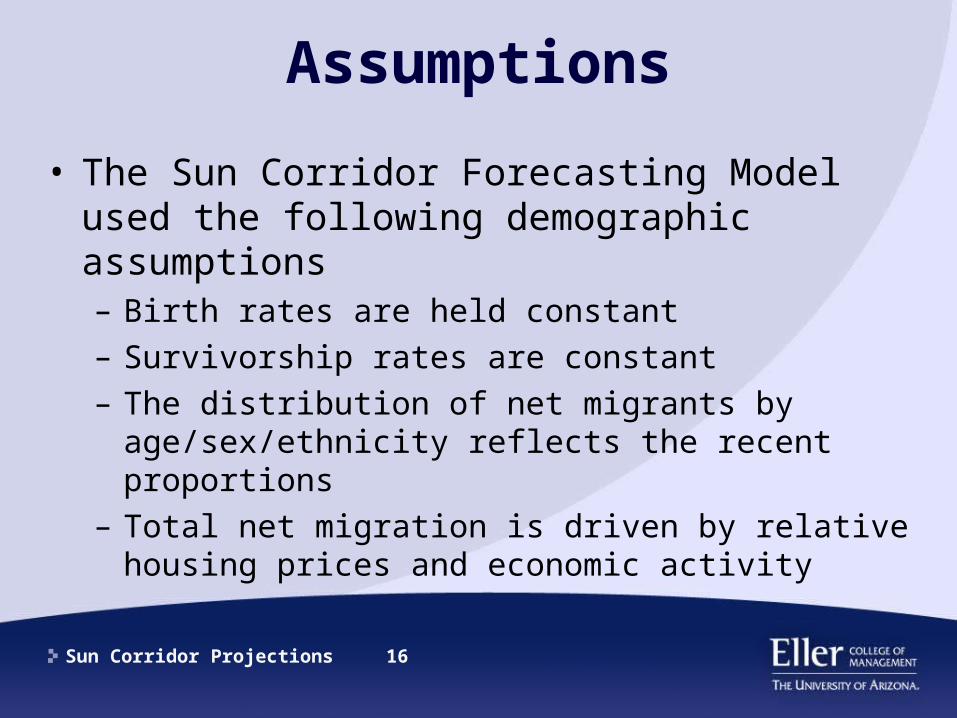
Assumptions
• The Sun Corridor Forecasting Model used the following demographic assumptions– Birth rates are held constant– Survivorship rates are constant– The distribution of net migrants by
age/sex/ethnicity reflects the recent proportions– Total net migration is driven by relative housing
prices and economic activity

Sun Corridor Projections 17
Assumptions
• Gasoline prices in the Phoenix area remain high and drift upward from current levels to near $4.00 per gallon in 2015
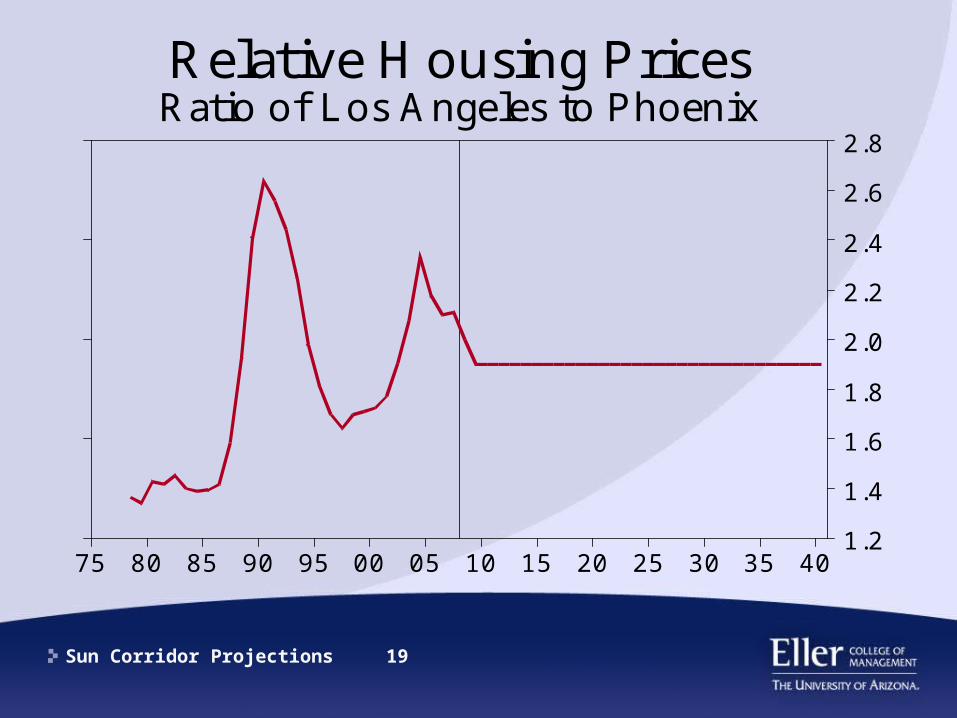
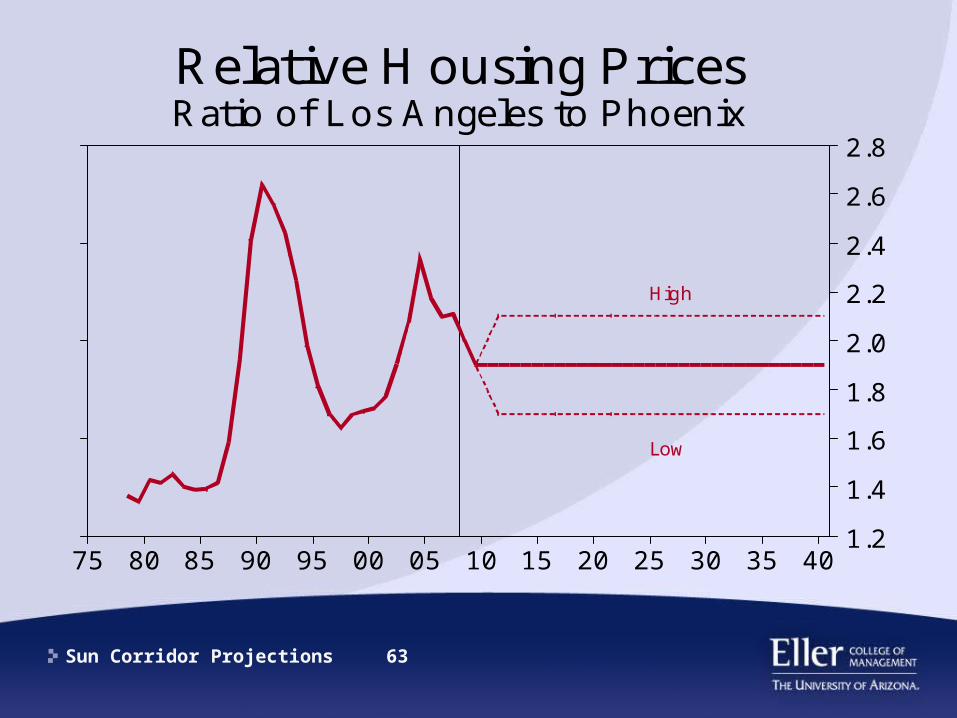
• Housing prices in the Sun Corridor have fallen significantly– Relative to prices in Los Angeles, the Sun
Corridor remains “cheap”– Prices in LA will remain nearly twice those in the
Sun Corridor

Sun Corridor Projections 18
403530252015100500959085807570
5.00
4.00
3.00
2.00
1.00
0.00
dollars per gallonGasoline Prices, Valley
inflationadjusted2007 dollars
Sun Corridor Projections 19
4035302520151005009590858075
2.8
2.6
2.4
2.2
2.0
1.8
1.6
1.4
1.2
Relative Housing PricesRatio of Los Angeles to Phoenix
Sun Corridor Projections 20
Determinants of Growth
• In the long term, supply factors matter– Labor force– Capital stock (infrastructure AND human)– Technological progress
• For the 3-county area, population growth is the most important– Migration flows– Natural increase

Sun Corridor Projections 21
Base Scenario Results

Sun Corridor Projections 22
Highlights: Year 2040
• 10.1 million people will live in the Sun Corridor
• The Sun Corridor will grow into one of the nation’s 10 “megapolitan” areas
• Growth rates for both population and jobs moderate to near 2% annually

Sun Corridor Projections 23
Forecasts to 2040, Sun Corridor2000 2010 2020 2030 2040
Population (000s) 4,122 5,323 6,740 8,370 10,100
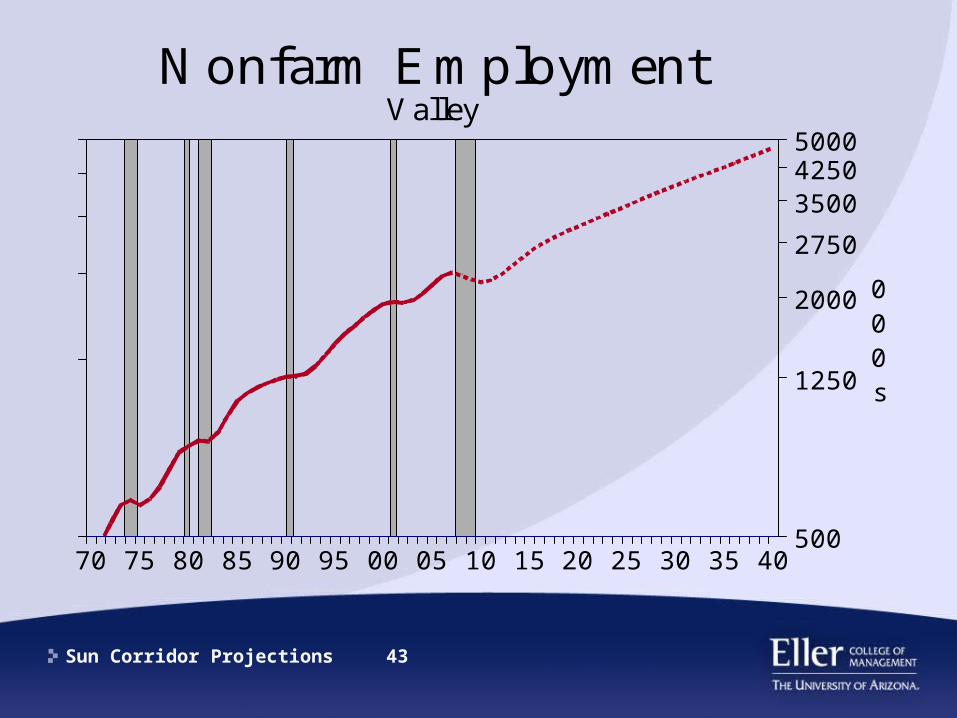
Nonfarm Jobs (000s) 1,925 2,180 3,020 3,830 4,760
Personal Income ($bil)
113 188 380 670 1,150
Retail Sales ($ bil) 46 67 129 215 353

Sun Corridor Projections 24
403530252015100500959085807570
12
10
8
6
4
2
0
-2
-4
% chg
Annual Growth Rates, Valley
nonfarm jobspopulation

Sun Corridor Projections 25
403530252015100500959085807570
13000
10000
7500
5000
2500
1250
000s
Population, Valley
2040 population: 10.1 mil

Sun Corridor Projections 26
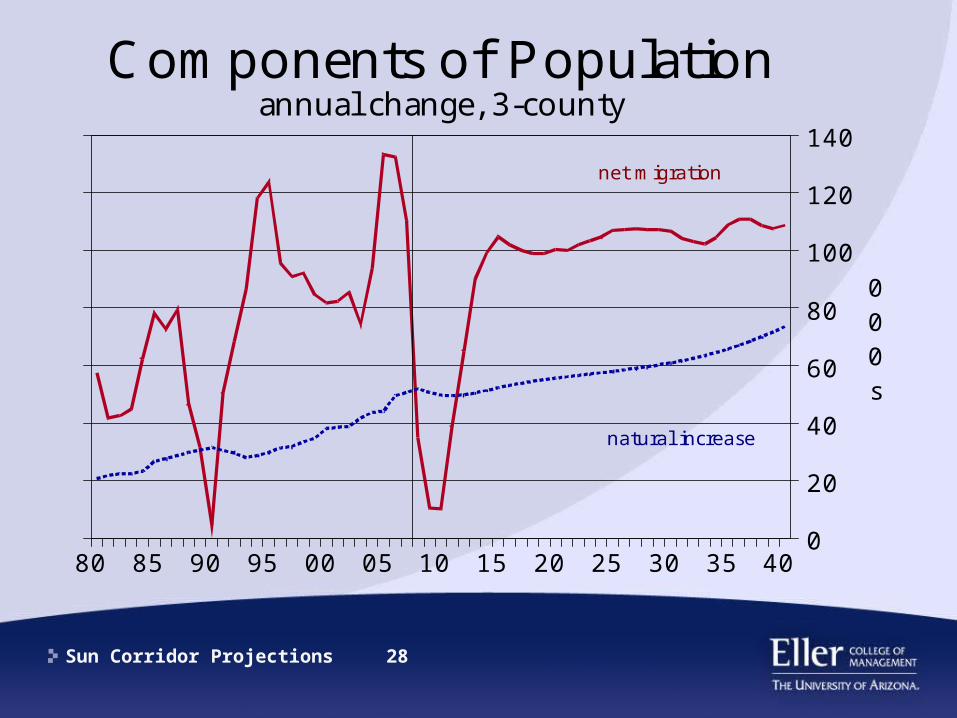
Population Dynamics
• Natural increase (births – deaths)– Birth rates remain relatively constant– Death rates trend upward as population ages– Calculated relative to total population
• Migration (net)– On average, provides twice the number of
natural increase– As a percent of population, continues on
downward trend

Sun Corridor Projections 27
40353025201510050095908580
20
15
10
5
0
Birth and Death Ratesper 1000 Persons, 3-county
Births
Deaths
Sun Corridor Projections 28
40353025201510050095908580
140
120
100
80
60
40
20
0
000s
Components of Populationannual change, 3-county
net migration
natural increase

Sun Corridor Projections 29
40353025201510050095908580757065
140
120
100
80
60
40
20
0
-20
5
4
3
2
1
0
-1
000s
%
Annual Net Migration3-county
as a % of population(right)
number (left)

Sun Corridor Projections 30
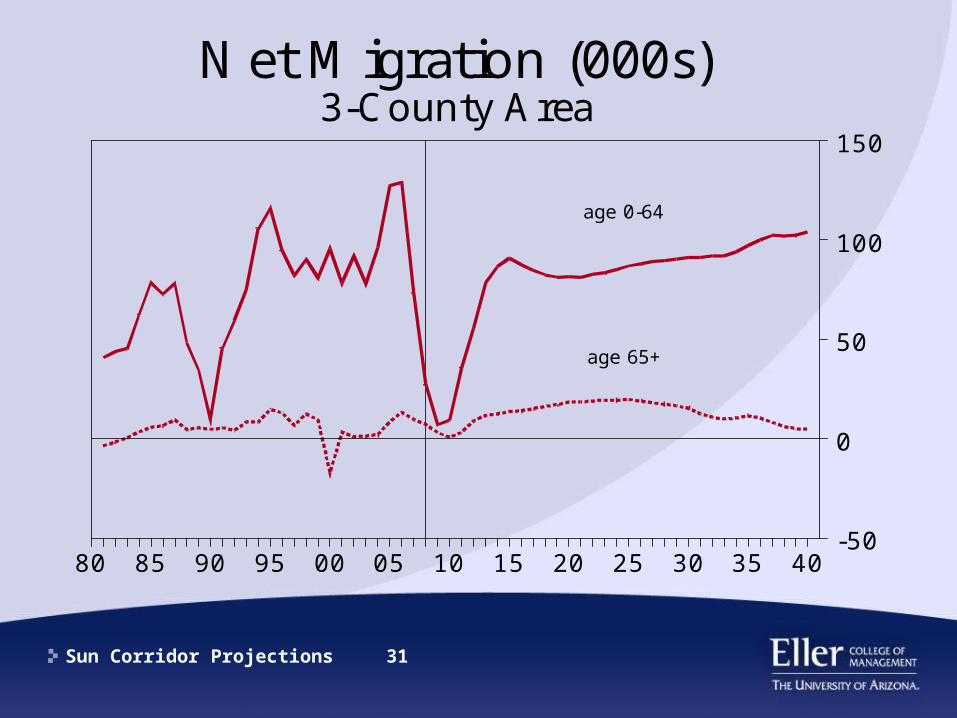
Population Dynamics
• Retirement-related migration will double as boomers retire– but the numbers are small compared 0-64 age
group
• Work-related migration returns to “average” (90-100 thousand per year) by 2015
Sun Corridor Projections 31
40353025201510050095908580
150
100
50
0
-50
Net Migration (000s)3-County Area
age 0-64
age 65+
Sun Corridor Projections 32
Population Dynamics
• Once the economy recovers from current downturn, annual population growth returns to roughly 160,000 per year in 2015– Then drifts slowly upward

Sun Corridor Projections 33
40353025201510050095908580757065
200
150
100
50
0
000s
Annual Changes in Population3-county

Sun Corridor Projections 34
Highlights: Year 2040
• The proportion of the population age 65+ – will increase significantly, but remain less than
nationwide – AZ will remain one of the youngest states
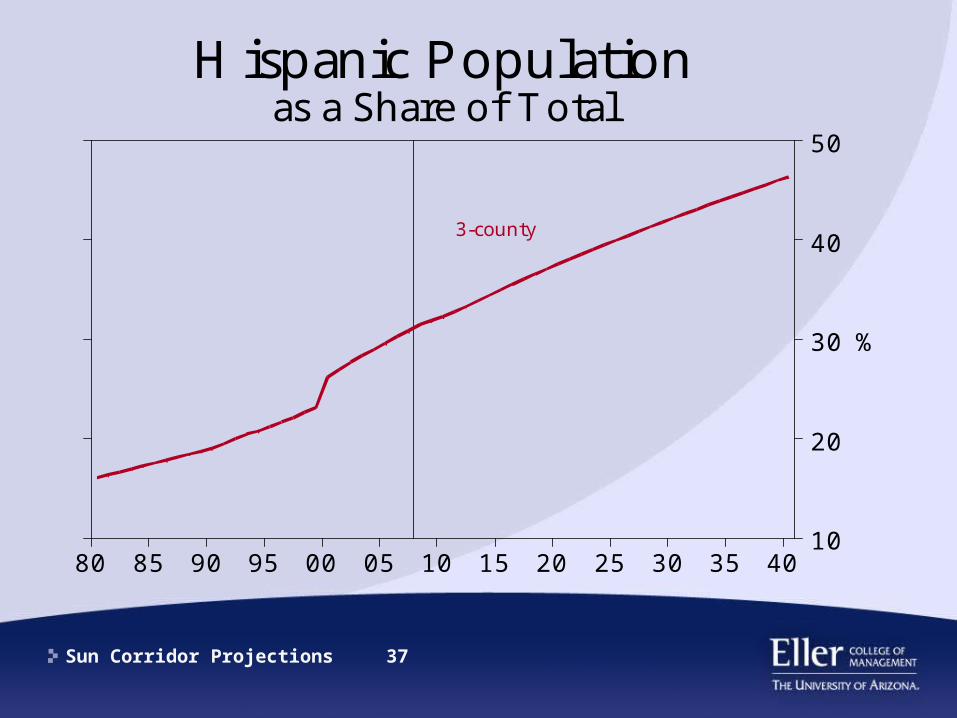
• School age population remains flat at 21%• Hispanics share of the total population rises
from 33% to 48%– Hispanic share of school age population
increases from 42% to 58%

Sun Corridor Projections 35
4035302520151005009590858075706560
22
20
18
16
14
12
10
8
%
Shares of Total PopulationAge 65 and over
3-county
US

Sun Corridor Projections 36
40353025201510050095908580
25
24
23
22
21
20
%
School-Age Population (5-19)as a Share of Total
3-county
Sun Corridor Projections 37
40353025201510050095908580
50
40
30
20
10
%
Hispanic Populationas a Share of Total
3-county

Sun Corridor Projections 38
40353025201510050095908580
60
50
40
30
20
%
Hispanic Share of School-AgePopulation (5-19)
3-county
Sun Corridor Projections 39
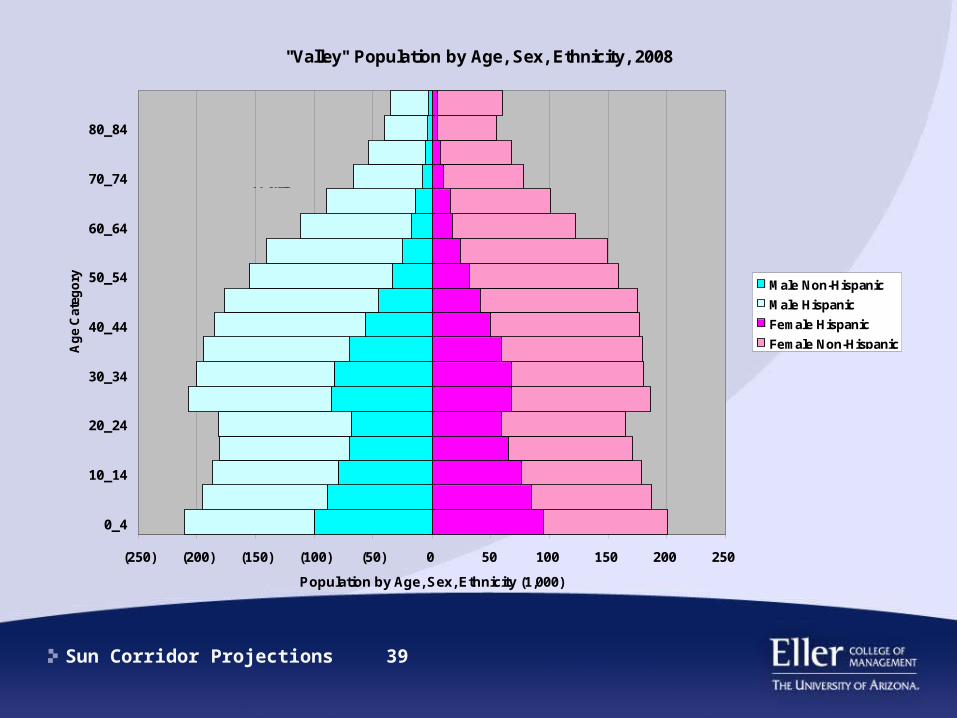
"Valley" Population by Age, Sex, Ethnicity, 2008
(250) (200) (150) (100) (50) 0 50 100 150 200 250
0_4
10_14
20_24
30_34
40_44
50_54
60_64
70_74
80_84
Ag
e C
ateg
ory
Population by Age, Sex, Ethnicity (1,000)
Male Non-Hispanic
Male Hispanic
Female Hispanic
Female Non-Hispanic
Male Female

Sun Corridor Projections 40
"Valley" Population by Age, Sex, Ethnicity, 2040
(500) (400) (300) (200) (100) 0 100 200 300 400 500
0_4
10_14
20_24
30_34
40_44
50_54
60_64
70_74
80_84
Ag
e C
ate
go
ry
Population by Age, Sex, Ethnicity (1,000)
Male Hispanic
Male Non-Hispanic
Female Hispanic
Female Non-Hispanic
Male Female
Sun Corridor Projections 41
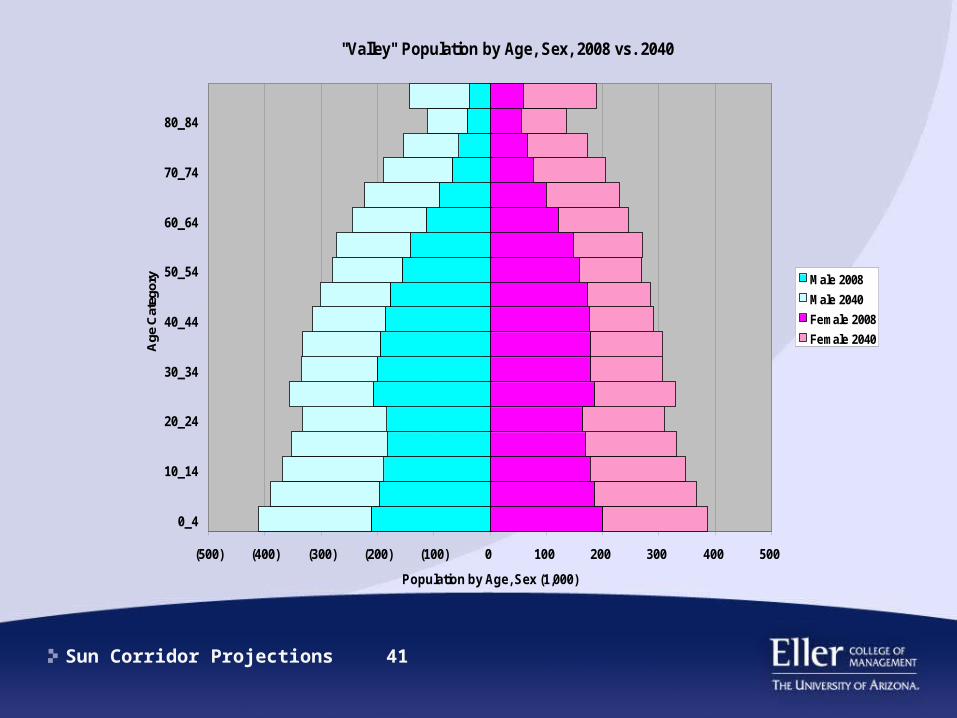
"Valley" Population by Age, Sex, 2008 vs. 2040
(500) (400) (300) (200) (100) 0 100 200 300 400 500
0_4
10_14
20_24
30_34
40_44
50_54
60_64
70_74
80_84
Age
Cat
egor
y
Population by Age, Sex (1,000)
Male 2008
Male 2040
Female 2008
Female 2040
Male Female

Sun Corridor Projections 42
Highlights: Year 2040
• 2.25 mil new nonfarm jobs will be created during the next 32 years– 4.75 mil total– Most will be in services sectors
Sun Corridor Projections 43
403530252015100500959085807570
5000425035002750
2000
1250
500
000s
Nonfarm EmploymentValley
Sun Corridor Projections 44
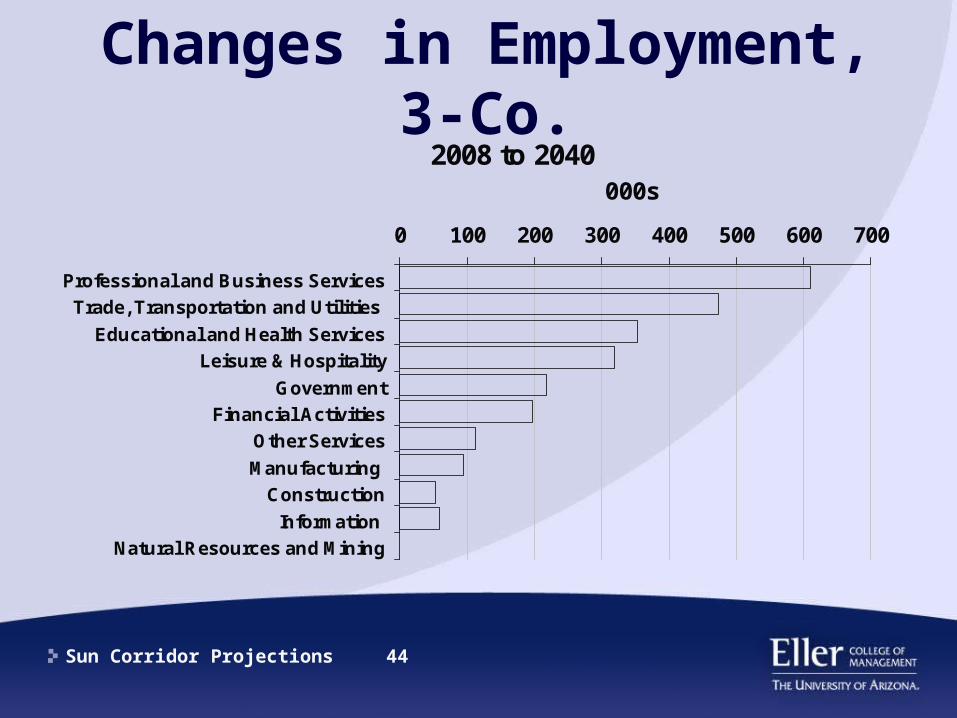
Changes in Employment, 3-Co.
2008 to 2040
0 100 200 300 400 500 600 700
Professional and Business Services
Trade, Transportation and Utilities
Educational and Health Services
Leisure &Hospitality
Government
Financial Activities
Other Services
Manufacturing
Construction
Information
Natural Resources and Mining
000s

Sun Corridor Projections 45
Employment Sector Growth
Growth Leaders• Professional & Business
Services• Leisure & Hospitality• Financial Activities• Information• Other services • Health Care & Social
Assistance
Growth Laggards• Government• Construction• Manufacturing• Mining

Sun Corridor Projections 46
40353025201510050095908580757065
22
20
18
16
14
12
10
%
Government Employmentas a Percent of Total Nonfarm
3-county

Sun Corridor Projections 47
40353025201510050095908580757065
20
18
16
14
12
10
8
6
4
%
Manufacturing Jobsas a Percent of Total Nonfarm
3-county

Sun Corridor Projections 48
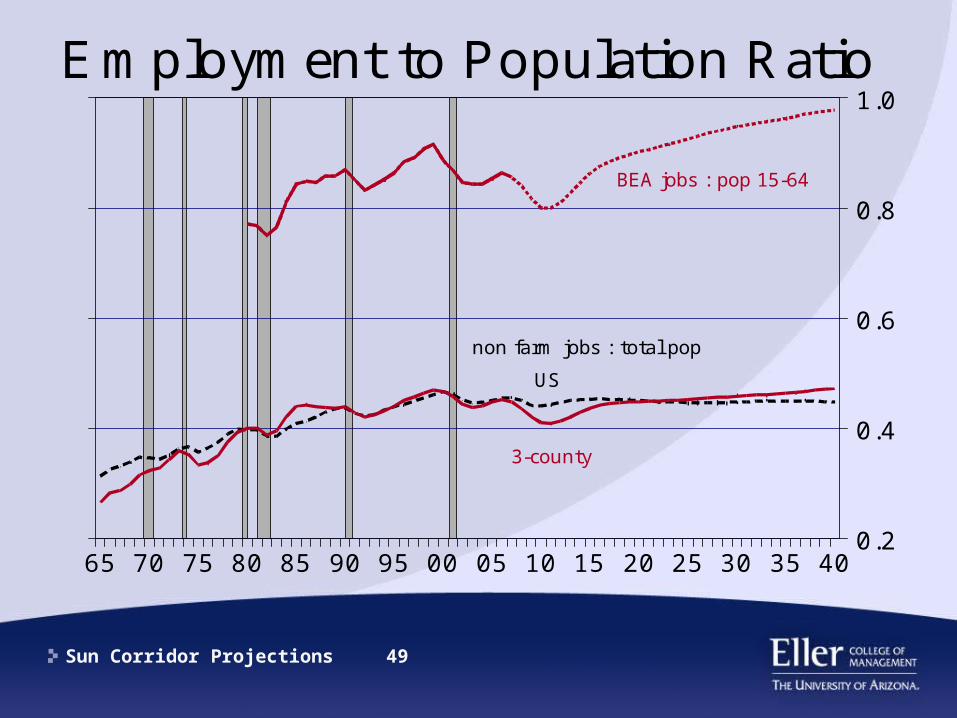
Highlights: Year 2040
• Employment to population ratio recovers after the recession and drifts slowly upward– Nationwide, the ratio remains flat at 0.46
• An alternative measure using BEA employment relative to working-age population (15-64) is significantly higher and moves upward more quickly over the forecast period
Sun Corridor Projections 49
40353025201510050095908580757065
1.0
0.8
0.6
0.4
0.2
Employment to Population Ratio
US
3-county
BEA jobs : pop 15-64
non farm jobs : total pop
Sun Corridor Projections 50
Highlights: Year 2040
• PCPI relative to US stabilizes at 88% after ratcheting down during the current recession

Sun Corridor Projections 51
403530252015100500959085807570
105
100
95
90
85
80
%
Per Capita Personal Incomeas a percent of US
3-county
Sun Corridor Projections 52
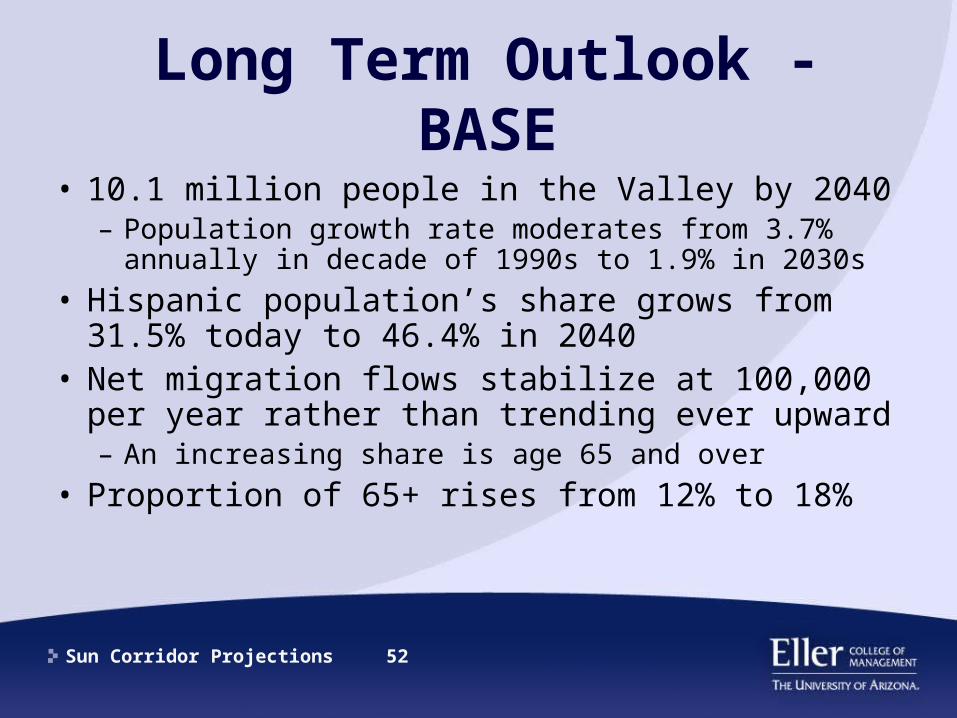
Long Term Outlook - BASE
• 10.1 million people in the Valley by 2040– Population growth rate moderates from 3.7%
annually in decade of 1990s to 1.9% in 2030s
• Hispanic population’s share grows from 31.5% today to 46.4% in 2040
• Net migration flows stabilize at 100,000 per year rather than trending ever upward– An increasing share is age 65 and over
• Proportion of 65+ rises from 12% to 18%
Sun Corridor Projections 53
Long Term Outlook
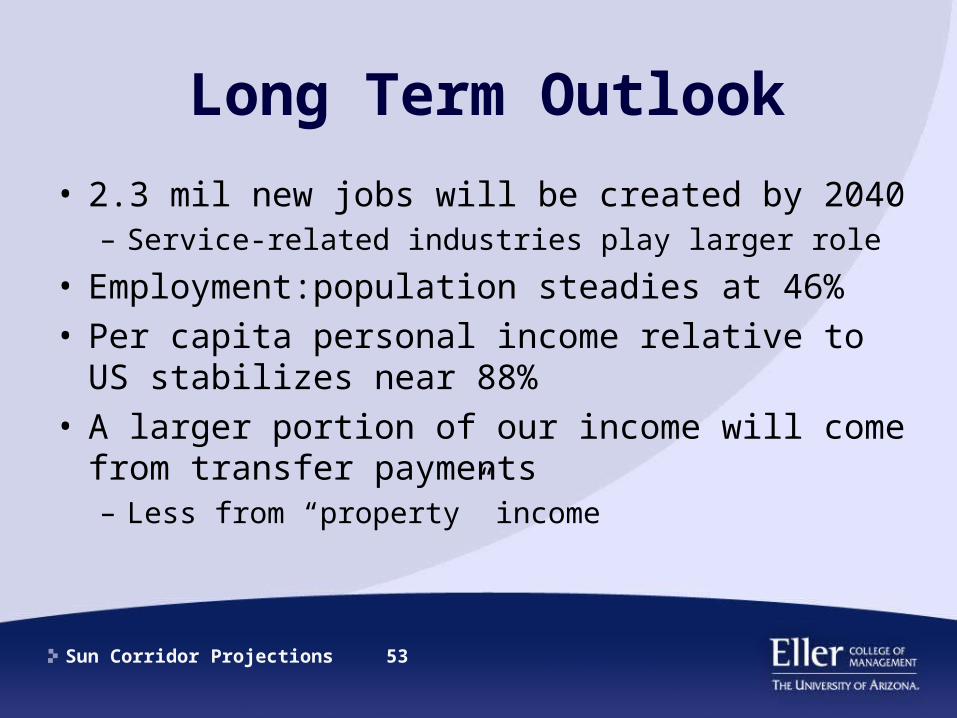
• 2.3 mil new jobs will be created by 2040– Service-related industries play larger role
• Employment:population steadies at 46%• Per capita personal income relative to US
stabilizes near 88%• A larger portion of our income will come
from transfer payments– Less from “property” income

Sun Corridor Projections 54
Alternative Scenarios

Sun Corridor Projections 55
Scenario Forecast Development
• Forecast scenarios were developed on the basis of the work done on the Demographic & Economic White Papers, and expert interviews
• National economic forecasts from Global Insight (GI) were used to incorporate alternative economic assumptions of business conditions
• Future investments in education, workforce development and infrastructure are necessary for Arizona to attract high tech industry, raise income levels, and improve the overall quality of life
• The level of investment in education and infrastructure, along with national economic conditions were key factors in developing the three forecast scenarios

Sun Corridor Projections 56
Base Scenario• Assumes that the national economy will grow according to
the GI base (trend) economic forecast • Investment in education and infrastructure remains on a
business-as-usual basis
Sun Corridor Projections 57
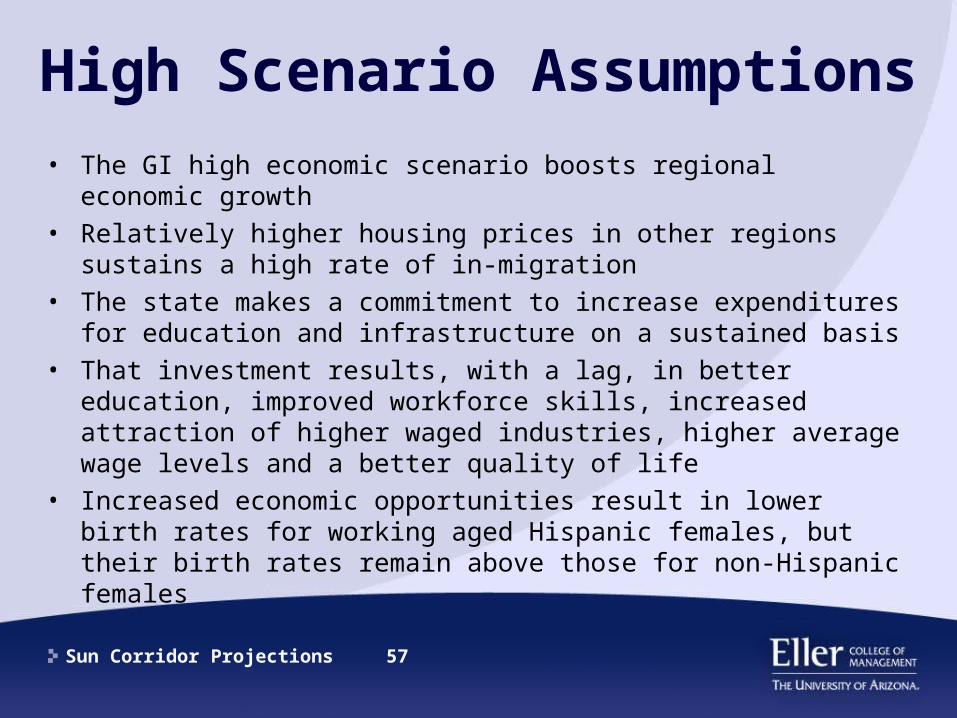
High Scenario Assumptions• The GI high economic scenario boosts regional economic
growth• Relatively higher housing prices in other regions sustains a
high rate of in-migration • The state makes a commitment to increase expenditures for
education and infrastructure on a sustained basis• That investment results, with a lag, in better education,
improved workforce skills, increased attraction of higher waged industries, higher average wage levels and a better quality of life
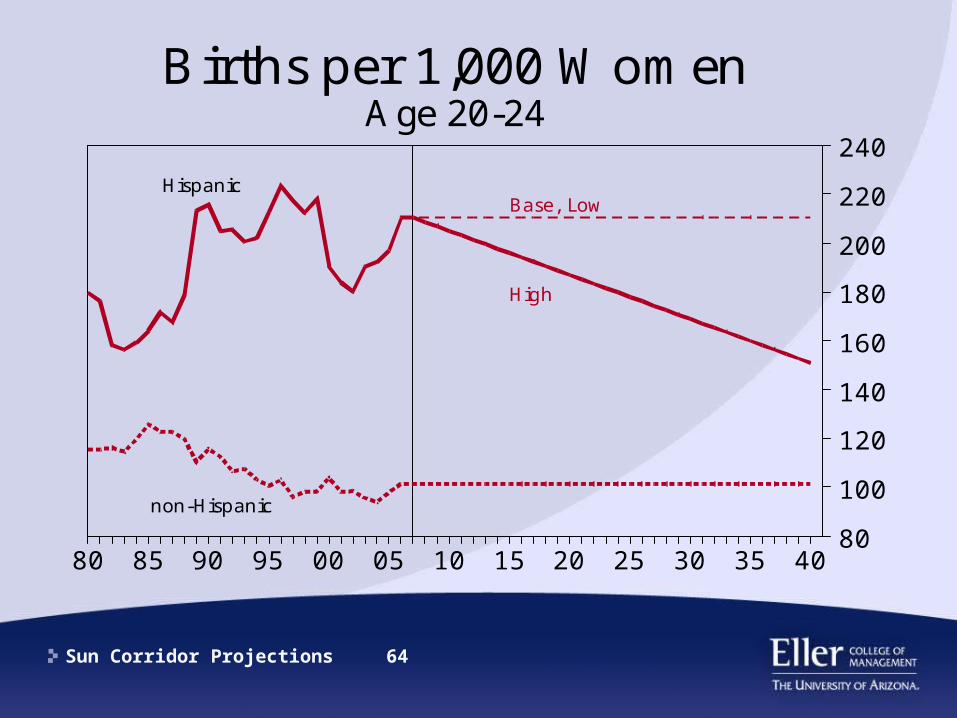
• Increased economic opportunities result in lower birth rates for working aged Hispanic females, but their birth rates remain above those for non-Hispanic females

Sun Corridor Projections 58
High Scenario (Cont.)• Increased spending for education and infrastructure raise
wages for educators, improves the quality of the workforce and results in greater success attracting, retaining and expanding higher wage industries, including high tech industries
• Construction employment benefits from increased expenditures for infrastructure development
• Employment increases in utilities as solar power generation capacity is added
• Employment also rises in other manufacturing industries due to increased activity in high tech industries such as biotechnology, pharmaceuticals, etc
• Healthcare industry employment expands due to increased research and development activity and higher incomes
• Transportation and warehousing employment expand to take advantage of better rail, highway and airport infrastructure

Sun Corridor Projections 59
Low Scenario Assumptions• The national economy grows at the GI low scenario • Homes in other parts of the country become relatively less
expensive than those in the megapolitan region, resulting in slower in-migration rates
• Expenditures for education and infrastructure are inadequate to support population growth, resulting in deteriorating workforce quality, slower income growth, and a lower overall quality of life in the region
• The poor quality workforce and weaker infrastructure cause employment to suffer in manufacturing, information technology industries, and those with higher wages and higher workforce skill requirements
• Transportation and warehousing employment drops due to poorer transportation infrastructure
• Finally, the diminished quality of life in the region discourages employment in the leisure and hospitality industry as tourism activity declines
Sun Corridor Projections 60
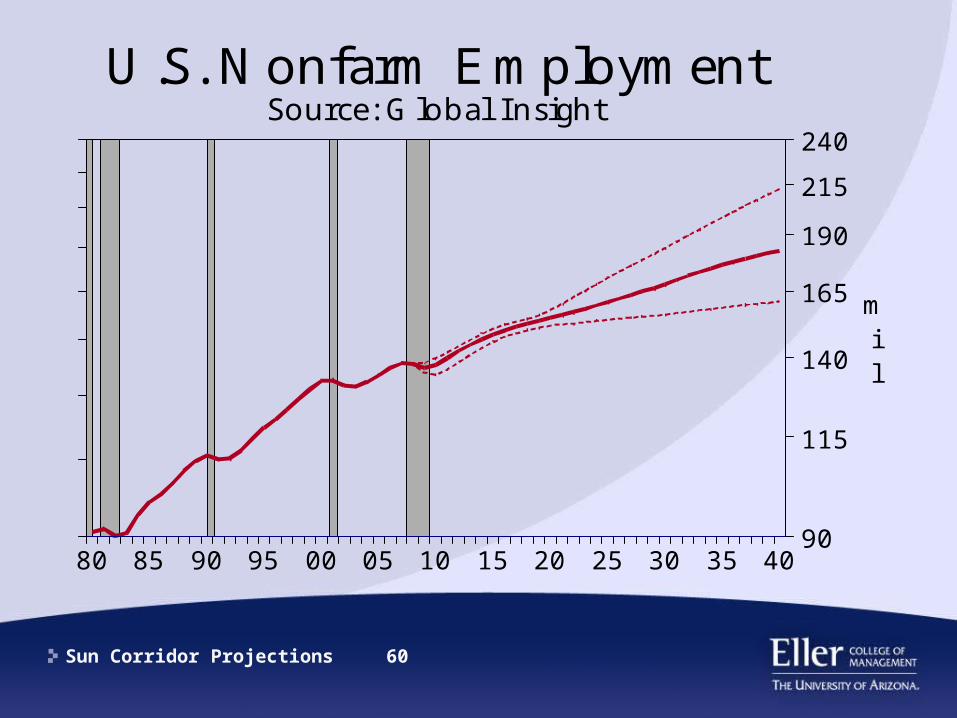
40353025201510050095908580
240
215
190
165
140
115
90
mil
U.S. Nonfarm EmploymentSource: Global Insight
Sun Corridor Projections 61
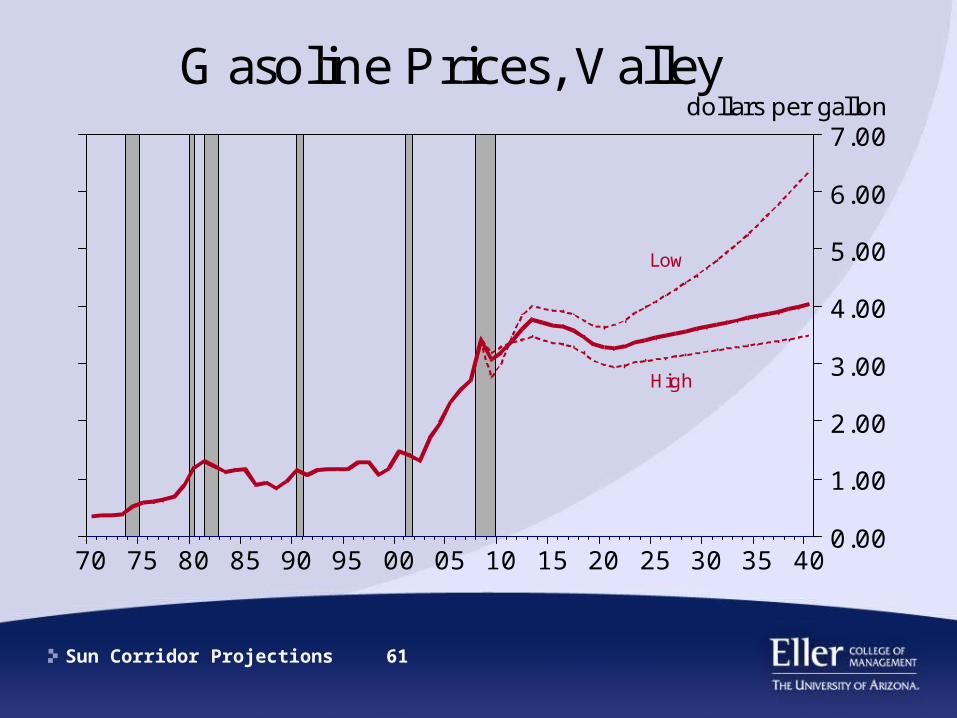
403530252015100500959085807570
7.00
6.00
5.00
4.00
3.00
2.00
1.00
0.00
dollars per gallonGasoline Prices, Valley
Low
High

Sun Corridor Projections 62
40353025201510050095908580
6.0
5.0
4.0
3.0
2.0
1.0
0.0
1982-84=1.00
U.S. Consumer Price IndexSource: Global Insight
High
Low
Sun Corridor Projections 63
4035302520151005009590858075
2.8
2.6
2.4
2.2
2.0
1.8
1.6
1.4
1.2
Relative Housing PricesRatio of Los Angeles to Phoenix
High
Low
Sun Corridor Projections 64
40353025201510050095908580
240
220
200
180
160
140
120
100
80
Births per 1,000 WomenAge 20-24
Hispanic
non-Hispanic
Base, Low
High

Sun Corridor Projections 65
403530252015100500959085807570
13000
10000
7500
5000
2500
1250
000s
Population, Valley
2040 population:11.5 mil
10.1 8.9
highlowbaseactual

Sun Corridor Projections 66
40353025201510050095908580757065
250
200
150
100
50
0
000s
Annual Changes in Population3-county
High
Low
Sun Corridor Projections 67
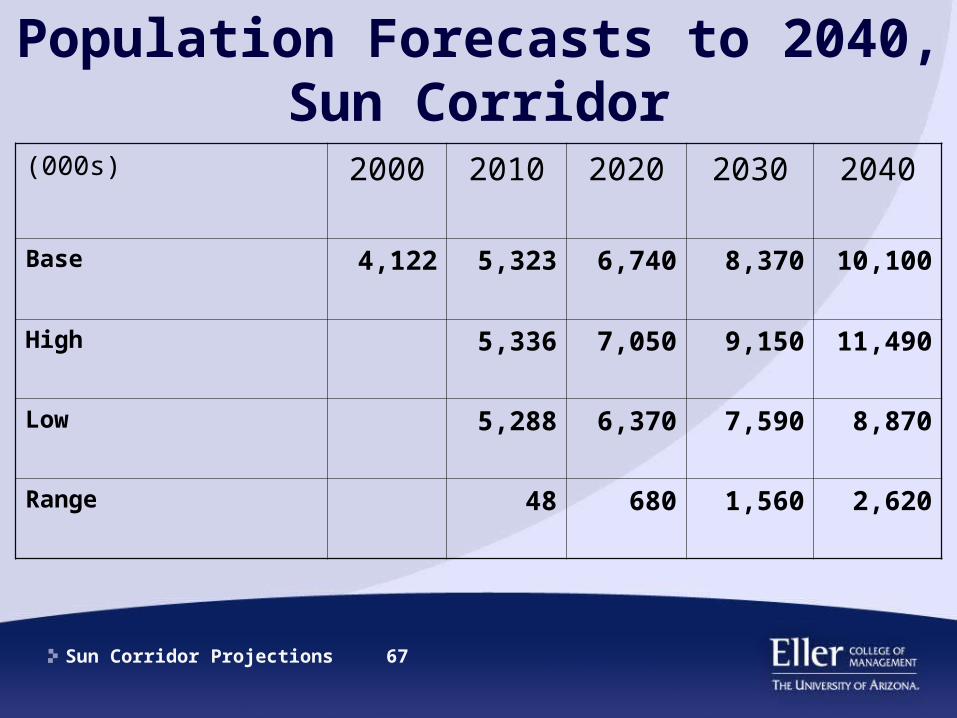
Population Forecasts to 2040, Sun Corridor
(000s) 2000 2010 2020 2030 2040
Base 4,122 5,323 6,740 8,370 10,100
High 5,336 7,050 9,150 11,490
Low 5,288 6,370 7,590 8,870
Range 48 680 1,560 2,620
Sun Corridor Projections 68
Report Available At:
http://appliedeconomics.net/caag/ThreeCountyProjections.html