Embed Size (px)
Citation preview
26 September 2019
SUMO GROUP PLC
(“Sumo Group”, the “Group” or the “Company”) AIM: SUMO
UNAUDITED HALF YEAR RESULTS 2019
Sumo Group, the provider of award-winning creative and development services to the video games and entertainment industries, announces its unaudited half year results for the six months ended 30 June 2019 (“H1 19” or the “Period”), which are in line with management expectations. During the Period, Sumo Group continued to deliver on its stated strategic objectives: to expand; to win new clients; to develop complementary new revenue streams; and to develop its own IP - both self-funded and co-funded. The Group has strong revenue visibility for the year ending 31 December 2019 (“FY 19”) and beyond and these results reflect the significant H2 performance weighting expected in this year’s financial results. The Group remains on track to meet consensus market forecasts for FY19. Operational highlights
• Headcount increased by 15% from 592 at 31 December 2018 to 679 at 30 June 2019 • Red Kite Games acquired in January 2019, adding 27 people and new talent pool • New studio opened in Leamington Spa to focus on the mobile games market • Board and senior management team expanded and strengthened • Expanded client base: Apple and Focus Home Interactive • New partnership announced with publisher 2K
Financial key points
• H1 19 results in line with management expectations - considerable H2 weighting in FY 19 • Adjusted gross profit rose by 13.7% to £9.8m (H1 18: £8.6m) • Adjusted gross margin excluding royalties increased to 46.3% (H1 18: 43.6%) • Reported revenue £20.8m (H1 18: £19.3m), reported gross profit £9.3m (H1 18: £8.3m) and
reported profit before taxation £1.3m (H1 18: loss before taxation £2.1m) Current trading and outlook
• Strong cash and working capital performance post Period end: net cash of £8.9m at 31 August 2019 (30 June 2019: £4.3m)
• Further increase in headcount to 711 at 31 August 2019 • Two own-IP games announced: “Pass The Punch” and the acclaimed “Dear Esther” expanding to iOS • Strong acquisition pipeline • On track to meet consensus market forecasts for FY 19 and outlook remains positive • Strong visibility on FY 20 revenue with more than 41% of forecast development fee revenue already
contracted or near-contracted
2
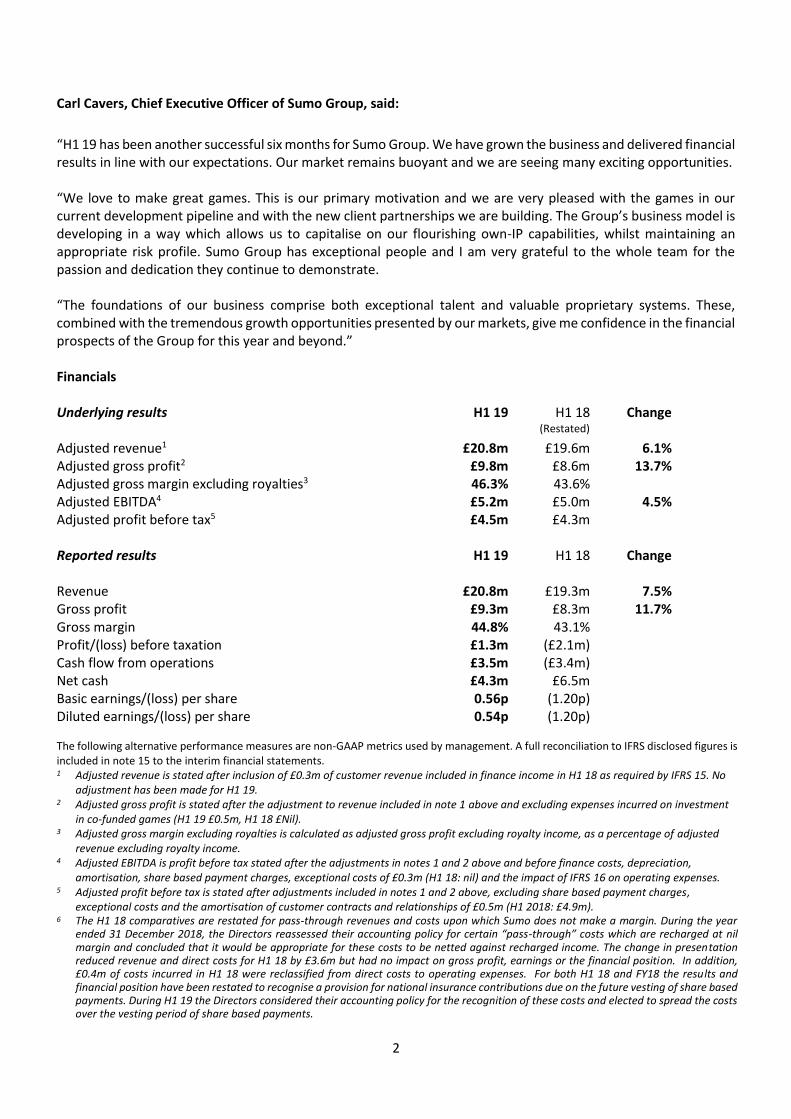
Carl Cavers, Chief Executive Officer of Sumo Group, said:
“H1 19 has been another successful six months for Sumo Group. We have grown the business and delivered financial results in line with our expectations. Our market remains buoyant and we are seeing many exciting opportunities. “We love to make great games. This is our primary motivation and we are very pleased with the games in our current development pipeline and with the new client partnerships we are building. The Group’s business model is developing in a way which allows us to capitalise on our flourishing own-IP capabilities, whilst maintaining an appropriate risk profile. Sumo Group has exceptional people and I am very grateful to the whole team for the passion and dedication they continue to demonstrate. “The foundations of our business comprise both exceptional talent and valuable proprietary systems. These, combined with the tremendous growth opportunities presented by our markets, give me confidence in the financial prospects of the Group for this year and beyond.” Financials Underlying results H1 19 H1 18 Change (Restated) Adjusted revenue1 £20.8m £19.6m 6.1% Adjusted gross profit2 £9.8m £8.6m 13.7% Adjusted gross margin excluding royalties3 46.3% 43.6% Adjusted EBITDA4 £5.2m £5.0m 4.5% Adjusted profit before tax5 £4.5m £4.3m Reported results H1 19 H1 18 Change Revenue £20.8m £19.3m 7.5% Gross profit £9.3m £8.3m 11.7% Gross margin 44.8% 43.1% Profit/(loss) before taxation £1.3m (£2.1m) Cash flow from operations £3.5m (£3.4m) Net cash £4.3m £6.5m Basic earnings/(loss) per share 0.56p (1.20p) Diluted earnings/(loss) per share 0.54p (1.20p) The following alternative performance measures are non-GAAP metrics used by management. A full reconciliation to IFRS disclosed figures is included in note 15 to the interim financial statements.
1 Adjusted revenue is stated after inclusion of £0.3m of customer revenue included in finance income in H1 18 as required by IFRS 15. No adjustment has been made for H1 19.
2 Adjusted gross profit is stated after the adjustment to revenue included in note 1 above and excluding expenses incurred on investment in co-funded games (H1 19 £0.5m, H1 18 £Nil).
3 Adjusted gross margin excluding royalties is calculated as adjusted gross profit excluding royalty income, as a percentage of adjusted revenue excluding royalty income.
4 Adjusted EBITDA is profit before tax stated after the adjustments in notes 1 and 2 above and before finance costs, depreciation, amortisation, share based payment charges, exceptional costs of £0.3m (H1 18: nil) and the impact of IFRS 16 on operating expenses.
5 Adjusted profit before tax is stated after adjustments included in notes 1 and 2 above, excluding share based payment charges, exceptional costs and the amortisation of customer contracts and relationships of £0.5m (H1 2018: £4.9m).
6 The H1 18 comparatives are restated for pass-through revenues and costs upon which Sumo does not make a margin. During the year ended 31 December 2018, the Directors reassessed their accounting policy for certain “pass-through” costs which are recharged at nil margin and concluded that it would be appropriate for these costs to be netted against recharged income. The change in presentation reduced revenue and direct costs for H1 18 by £3.6m but had no impact on gross profit, earnings or the financial position. In addition, £0.4m of costs incurred in H1 18 were reclassified from direct costs to operating expenses. For both H1 18 and FY18 the results and financial position have been restated to recognise a provision for national insurance contributions due on the future vesting of share based payments. During H1 19 the Directors considered their accounting policy for the recognition of these costs and elected to spread the costs over the vesting period of share based payments.
3
Enquiries:
Sumo Group plc Tel: +44 (0) 114 242 6766
Carl Cavers, Chief Executive Officer
David Wilton, Chief Financial Officer
Zeus Capital Limited (Nominated Adviser & Broker)
Nick Cowles / Richard Darlington / Andrew Jones Tel: +44 (0) 161 831 1512
Ben Robertson / John Goold Tel: +44 (0) 203 829 5000
Belvedere Communications Limited
Cat Valentine ([email protected]) Tel: +44 (0) 7715 769 078
Keeley Clarke ([email protected]) Tel: +44 (0) 7967 816 525
Llew Angus ([email protected]) Tel: +44 (0) 7407 023 147
About Sumo Group – www.sumogroupplc.com Sumo Group’s businesses provide acclaimed development and design services to the video games and entertainment industries from studios in the UK, India, and Canada. Sumo Digital, as the group’s primary business, is one of the UK’s largest independent developers of AAA-rated video games, having studios in Sheffield, Newcastle, Nottingham, Leeds, Leamington Spa and Pune, India. The business has acquired two studios since IPO, which operate under their own names, BAFTA award-winning The Chinese Room and Red Kite Games. Sumo Digital provides turnkey and co-development solutions to a global blue-chip client base. Atomhawk is a multi-award-winning visual design company, with studios in Newcastle and in Vancouver (Canada), servicing the games, film and visual effects industries. Together, the Group delivers full-spectrum visual and development solutions, which include initial visual concepts, conceiving new products and game development involving all aspects of pre-production, production & development, as well as supporting games as a service.
4
CHIEF EXECUTIVE’S REPORT The Board is pleased to report the unaudited half year results for the six months ended 30 June 2019 (“H1 19”), which are in line with management expectations and reflect the significant H2 performance weighting expected in this year’s financial results. The Group has strong revenue visibility for the year ending 31 December 2019 (“FY 19) and beyond and is on track to meet consensus market forecasts for FY19. Since the beginning of 2019, the Group has continued to make progress on all its strategic objectives:
• To deliver and expand by developing subsequent franchise titles and downloadable content, through the management of online communities (collectively referred to as Games As A Service) and by generating royalties, where our interests are clearly aligned with our clients;
• To win new clients through the expansion of our publisher portfolio, collaborating with other publishers and extending our co-development relationships, and through selective acquisitions;
• To develop complementary revenue streams by moving into new premium services, possibly through acquisition; and
• To continue to develop our own-IP, following the highly successful release of Snake Pass in 2017.
In January, we acquired Red Kite Games, a work-for-hire studio focusing on engineering and code support services, adding 27 talented colleagues to the business, increasing our technical/engineering capacity and providing access to a new talent pool in West Yorkshire. A new studio, dedicated to the mobile game development market, was established in Leamington Spa in March. This studio is performing well and now employs 13 people, led by a highly regarded studio director. By the Period end Sumo Group employed 679 people (30 June 2018: 592), in nine studios (30 June 2018: six) situated in three countries. The Group has been successful in winning work from new clients, including Apple and 2K, a video games publisher managing some of the most creative and respected brands in the market today. In August, we announced the planned launch of Pass the Punch, a self-funded own-IP “beat ’em up” title, on PC, Nintendo Switch, Xbox One and PlayStation 4 and of the much acclaimed own-IP game, developed by The Chinese Room, Dear Esther on iOS. Our market The video games market is strong and growing. The Association for UK Interactive Entertainment (“UKIE”) reports that the UK market for games was valued at a record of £5.7bn in 2018, representing +10.0% growth on the previous year. Newzoo expects the global games market to grow from $152.1bn in 2019 to $196bn by 2022. In a recent article published by Yahoo, Purpose Investments, a Canadian investment company, estimated the combined video game and exports revenue to be $149bn this year with the potential to grow to $300bn in five years. Six of the largest businesses in the world, Apple, Microsoft, Google, Amazon, Facebook and Tencent are actively driving growth in our industry, so the demand for content has never been higher. This leaves us full of optimism for the future of our business and we are pleased to report that the Group’s business development pipeline has never been so strong. Business model Sumo Group’s business model is relatively low risk. The Group is generally not directly exposed to the commercial success of a game but can benefit from upside where royalties are in place. We are generating new opportunities to accelerate the Group’s growth and increase margins, through the development of own-IP games, either self-funded, co-funded or fully-funded, and through acquisition. The Group benefits commercially and financially from being able to use proprietary technologies developed over many years and from its significant presence in India, which provides valuable talent on a lower cost base.
5
In our Final Results 2018, we reported that we had begun work on a new type of co-development contract, under which external funding is provided by a publisher for all, or the majority of, the development costs for a game, conceptualised by Sumo Group. This new approach is enabling us to generate returns which best reflect the value of a Sumo Group concept, whilst keeping our principal risk relatively low. Contracts covering three games were signed in the latter stages of 2018, for projects on which the publishers will pay for the majority of the development costs, in exchange for the right to access or use the IP created, and Sumo Group will fund a smaller proportion of the costs. The revenue and profit from these games are recognised on the development fees payable by the publisher during the term of the contract but the costs incurred by Sumo Group are expensed. During H1 19, the costs incurred on these three projects amounted to £0.5m in aggregate. Financial review Revenue The underlying trading of the Group was in line with management’s expectations and reflects the timing of royalty receipts, as well as the heavy weighting of costs in H1 and revenue in H2 relating to own-IP. Reported revenue was £20.8m. Our revenue figures are now stated excluding pass-through revenues, upon which Sumo does not make a margin, and the H1 18 comparative figure has been restated accordingly as £19.3m. Atomhawk generated revenue of £1.5m (H1 18: £1.3m). The Chinese Room and Red Kite Games, acquired in August 2018 and January 2019 respectively, generated revenue in the Period of £1.1m. On a like for like basis excluding The Chinese Room and Red Kite Games, the Group’s revenue increased by 2.0%. We entered the Period having agreed terms or signed contracts on four new major projects in the final weeks of 2018, including developing two new games for Apple’s subscription gaming service, Apple Arcade. As we reported in our Final Results 2018 announced on 9 April 2019, the Group had contracted or near contracted visibility on 88.7% of forecast development fees for Sumo Digital for 2019. This level of forward cover was unprecedented for the business and a considerable achievement. The Board is delighted to report that, at this relatively early stage, the Group already has strong visibility for the year ending 31 December 2020 of more than 41%. Development fees in the Period were £20.4m, an increase of 7.6% on the comparable figure of £19.0m in 2018. The Group generated own intellectual property (“own-IP”) title revenue of £0.1m (H1 18: £0.3m). Royalty income was £0.3m (H1 18: £0.1m). Both these revenue figures are in line with management expectations. Own-IP revenue is generated from the ongoing sales of Snake Pass, launched in March 2017, and Dear Esther, which was acquired with The Chinese Room. Royalty income includes an amount of £0.1m in recognition of variable consideration under IFRS 15, which is future royalty income expected to be received. Gross profit and margin Statutory gross profit for the Period was £9.3m, an increase of 11.7% on the £8.3m in the prior half year. Statutory gross margin for the half year was 44.8% (H1 18: 43.1%). This includes royalty income of £0.3m (H1 18: £0.1m) in the half year, which flowed directly through to gross profit. The gross margin adjusted for the investment in co-funded games expensed and excluding royalties was 46.3% (H1 18: 43.6%). Operating expenses Operating expenses were £7.6m (H1 18: £10.5m). Included within operating expenses were amortisation and depreciation of £0.6m and £1.0m respectively (H1 18: £5.0m and £0.5m respectively). The Group spent £0.6m (FY 18: £0.7m) on research and development, all of which has been expensed.
6
Non-cash charges The non-cash charges included in the H1 19 results relate to the amortisation of intangibles and to share based payments. There was a non-cash charge of £2.0m in the Period (H1 18: £1.3m) to reflect the cost of the Sumo Group plc Long Term Incentive Plan and the Sumo Group plc Share Incentive Plan, which were launched in March 2018 and July 2018 respectively. IFRS 16 In these financial statements the Group has, with effect from 1 January 2019, adopted IFRS 16. Under the new standard, the distinction between operating and finance leases is removed and most leases will be brought onto the statement of financial position, as both a right-of-use asset and a largely offsetting lease liability. The right-of-use asset will be depreciated and the liability will be increased for the accumulation of interest and reduced by lease payments. There is no impact on cashflow. The Company opted not to early adopt IFRS 16 and prior year financial information will not be restated, resulting in no impact on retained earnings as at 1 January 2019 on transition. During the Period, there was a £0.5m addition to right-of-use assets, which represents primarily property leases for the Group’s studio premises, under IFRS 16. Adjusted EBITDA and margin Adjusted EBITDA was in line with management expectations at £5.2m (H1 2018: £5.0m). In our Final Results 2018, announced on 9 April 2019, we flagged that we expected the financial performance for 2019 to be weighted towards the second half, due to the timing of royalty receipts, the costs and revenue from own-IP and the increasing headcount through the year. In arriving at adjusted EBITDA adjustments have been made for depreciation, amortisation, share based payments, in H1 18 for the financing of the one contract under IFRS 15, for H1 19 for the costs expensed on the development of the games referred to above and the impact of IFRS 16 and, in H1 19, transaction costs. The underlying adjusted profit before tax, share based payment charge, adjustment for customer revenue included within finance income in H1 18, investment in co-funded games expensed, exceptional items and amortisation for the half year was £4.5m (H1 18: £4.3m) and reported profit before tax was £1.3m (H1 18: loss of £2.1m). Adjusted EBITDA margin was 25.1% (H1 2018: 25.5%). Cashflow The net cash generated from operating activities for the Period was £3.5m (H1 18: outflow of £3.4m), which was in line with management expectations set at the beginning of the year. Cash balances at 30 June 2019 were £4.3m (30 June 2018: £6.5m and 31 December 2018 £3.7m). In the first ten working days of July 2019, the Group received in excess of £10m of cash receipts, including £3.2m of VGTR receipts. At 31 August 2019, Sumo Group had cash balances of £8.9m. The Board expects the business to continue to generate significant cash in the second half of 2019. Capital expenditure in the Period was £1.6m (H1 18: £1.5m), most of which related to computer hardware. The cash cost, excluding transaction costs, of the acquisition of Red Kite Games was £0.5m and it had cash balances of £0.5m at the date of acquisition.
7
The net finance charge for the half year was £0.2m (H1 18: net finance income £0.1m). The Group had no
borrowings during the Period and the net finance charge consists of the accounting charge for the foreign currency
hedging, the IFRS 16 interest charge and the bank commitment fee payable, partially offset by the IFRS 15 financing
income and a very small amount of interest income.
Taxation The Corporation Tax charge for the half year was £0.5m (H1 18: credit £0.5m). Balance sheet Goodwill and other intangibles were £23.4m. This is an increase of £1.1m from 31 December 2018 and reflects the increase in goodwill and other intangibles arising from the acquisition of Red Kite Games in the Period partially offset by the amortisation charge of £0.6m. Current assets were £33.6m (30 June 2018: £24.7m). Trade and other receivables were £29.3m an increase of £4.1m from the figure of £25.2m at 31 December 2018 and trade and other payables were £15.6m (30 June 2018: £11.0m). Included within the revenue in excess of billings at 30 June 2019 was an amount of £2.3m on one contract for which the equivalent figure at 31 December 2018 was £7.8m. A further amount of £3.5m was included in debtors for which the cash was received on 9 July 2019. As at 30 June 2019 the net working capital position (excluding the IFRS 16 current lease liability of £1.0m) was £14.7m up from £13.7m at 31 December 2018. The net working capital had reduced to £9.0m at 31 August 2019. As at 30 June 2019 the consolidated balance sheet included an asset of £0.3m in respect of a game being developed from a Sumo concept in conjunction with a publisher for which the approval process has been delayed and Sumo has used the opportunity to demonstrate this game to other publishers. Interest in the game has been strong and we expect to agree attractive commercial terms for the development of this game by the end of this financial year. The asset increased to £0.5m at the end of August. The consolidated balance sheet at 30 June 2019 includes own shares of £4.9m within equity, which relates to shares issued under the terms of the Sumo Group plc Long Term Incentive Plan. Alternative performance measures The Board believes that it is helpful to include alternative performance measures which exclude certain non-cash charges and are adjusted for the matters referred to above to present the underlying results of the Group. These measures are reconciled to the income statement in note 15.
Client concentration
During the Period, four major clients individually accounted for at least 10% of total revenues (FY 2018: four clients). In aggregate, these four clients accounted for 75% of total revenue and the top three accounted for 65%. Sumo Group’s business model is to provide turnkey and co-development services and solutions to the video games industry. Most of the games are AAA or AA rated and projects tend to be large in size and long-term in duration. The Group typically works on between ten and 15 major projects at one time, with varying sizes of teams on each project. This provides an inherent tendency to client concentration, particularly as there may be more than one project for a client. During the period Sumo Digital worked on eight projects for the top three clients. This concentration has been mitigated as the business has grown, although this is somewhat counteracted by the increase in the magnitude of the games over time. The Board does not consider client concentration to be a major risk. It has reduced over time and should continue to do so in the longer term but Sumo Digital is likely to continue
8
to work on a relatively small number of large projects. It is worth noting that several contracts secured in the final weeks of 2018 are with significant clients with whom the Group has not worked before, including Apple.
Video Games Tax Relief (“VGTR”) Sumo Digital continues to claim and receive significant amounts under VGTR. We include VGTR within our direct costs and accordingly, for both half years, our gross profit and gross margin reflect these amounts. We believe this is the appropriate treatment of these credits, as gross margin is best considered after taking account of the effect of VGTR. The amounts included for H1 2018 and H1 2019 are £3.0m and £3.7m respectively. The latest report from UK Interactive Entertainment (“UKIE”) underlines that VGTR is a key catalyst in enabling job creation and investment in the UK and continues to have broad political support.
Foreign currency During the Period, the Group generated US dollar denominated revenue of $7m. It is Sumo Group’s policy to hedge such revenues to protect the Group from fluctuations in exchange rates and these revenues have been hedged accordingly. Share issues and options During the half year 7,399 shares in aggregate were issued under the Sumo Group plc Share Incentive Plan. A further 500,000 shares were issued following the exercise of options. As at 30 June 2019, options were granted or remain outstanding under the LTIP over an aggregate of 8,839,215 shares. Operational review Sumo Digital – representing 93% of Group revenue Sumo Digital provides a full-service development solution, including initial concept and pre-production, production and development and post-release support (end to end full development lifecycle for games). It uses leading edge technology, much of which is proprietary, to provide high value-added services to leading publishers with whom we have an ingrained and intertwined relationship. Our proprietary technology includes an in-house game engine, an editing tool, project management software and the profiling and telemetry tool, which, as previously mentioned, give the Group a competitive edge and create financial benefits. Sheffield continues to be our largest studio, as well as the Group’s central support location. The team in Sheffield is currently working on several exciting projects, including “Spyder” for Apple Arcade and we have taken on the lease of a further adjacent unit on this site. Our Nottingham, Newcastle and Brighton studios all continued to expand in the period. Red Kite Games, acquired in January, comprises a talented and highly experienced development team, working with some of the industry’s best-known publishers and developers. Whilst the business retains its identity and branding, the integration with Sumo Digital has gone smoothly and to plan. Red Kite Games has recently relocated from Huddersfield to larger premises, in the centre of Leeds. This move into a talent hot spot further supports our growth strategy and is expected to facilitate further expansion. A new studio was opened in Leamington Spa in March 2019, led by a highly regarded studio director, to focus on mobile game development. This studio now has a strong leadership team in place, which is focused on building its talented development team. The Sumo Digital management team is actively exploring other opportunities to open new UK studios in key talent hot spots to support its growth plans.
9
The utilisation rate across the UK studios in the period was 97.0%. The long-established India studio in Pune, which has been working on Pass the Punch, continues to perform strongly. The utilisation rate at this studio was 85.0% in the period and the utilisation for Sumo Digital overall was 94.8%. Operating from multiple locations gives us the capacity to deliver our headcount growth targets and we are constantly reviewing opportunities to accelerate growth by opening studios in other strategic locations. We are actively considering new locations both in the UK and abroad, as well as looking at potential acquisition opportunities. Over the past few years, Sumo Digital has worked with Sony, Microsoft (including Turn 10 Studios), Sega, IO Interactive and CCP Games. Apple was added to this illustrious client list late in 2018 and, in July 2019, we also announced a partnership with 2K. The business is currently working on 18 live projects, including Spyder, Pass the Punch and Little Orpheus. During the period, the shift towards more royalty arrangements as part of our contracts continued. We remain keen to align our interests with those of our clients and see the opportunity for financial out-performance on new iterations of proven games. Atomhawk – representing 7% of Group revenue Operating from Newcastle and Vancouver, Atomhawk provides visual development concept art and marketing art, as well as motion graphics and user interface design. Its expertise is in helping customers define a visual look for their products, from inception through development and, at the final point of sale, through marketing imagery, videos and box packaging design. It primarily serves the creative industries, working with video games studios, as well as film and television. Atomhawk has international clients across the entertainment sector. The business delivered a strong performance in the Period and the team was strengthened further with a number of key hires, including a Client Service Director, Lead Artists, Art Director and a Creative Development Director. New games on which Atomhawk has worked have been well received, including Mortal Kombat 11 for WB Games/NetherRealm Studio and Minecraft: Earth for Microsoft. Atomhawk has ongoing project work with major international clients including 2K, WB Games, Microsoft, EA and Zynga. We are delighted to report that Atomhawk won the 2019 Prolific North Animation/Graphics Company of the Year Award and was shortlisted for the Best Small Company in the North East Best Places to Work Awards. The team ran a successful Kickstarter campaign to fund Atomhawk’s latest book, The Art of Atomhawk: Volume 3, in the Period and launched the “Solarpunk” art competition with Artstation. People Sumo Group is a people business and its continuing success is entirely dependent on recruiting and retaining talented people. I am pleased to report that, at the end of August 2019, headcount had increased to 711, an increase of 20% from 592 at the end of December 2018. The Group continues to meet challenging recruitment targets, as it has done successfully over many years. Paul Porter, one of the co-founders of Sumo Digital, was appointed Chief Operating Officer of Sumo Group on 1 April 2019 and he joined the Board on 9 April. Gary Dunn has taken on Paul’s previous role as Managing Director of Sumo Digital. We have also, today, announced the appointment of Ian Livingstone, as the Group’s new Chairman. Ian is a pioneer of the global video game industry and was made a Commander of the British Empire (CBE) for his services to the
10
computer gaming industry in 2013. He has been a valued member of the Board for many years and we are looking forward to an exciting future with Ian as our Chair. On behalf of all the team at Sumo Group, I thank Ken Beaty, who stepped down from the role of Chairman today, for his considerable contribution to the growth of the business over the last five years and our successful IPO. We are committed to maintaining Sumo Group’s creative culture as we grow. Exceptional talent drives opportunity and, on behalf of the Board, I would like to thank everyone at Sumo Group for their passion, commitment and desire to create outstanding games and imagery. Acquisitions We have a strong pipeline of acquisition opportunities ranging in activities, sizes and locations and are actively pursuing these opportunities. We remain keen to acquire owner-managed businesses, where the vendors remain with the business post acquisition and where we can use our listed shares to provide suitable ongoing incentive arrangements. Outlook The key driver for revenue growth is increasing headcount; our markets are growing and our business development pipeline is strong, supporting our continued investment in talented people. We continue to recruit and will see the benefits of this expansion in the current year, through into 2020 and beyond. We have excellent visibility on development fees for H2 19 and the Board is pleased to report that the Group is on track to deliver full year results in line with consensus market forecasts. Furthermore, visibility on our FY 20 order book is already at more than 41% of forecast development fees and this strong trading position is underpinned by the Group’s current cash position. The Board is actively exploring opportunities to expand the business both organically and through acquisition and remains confident about the prospects of the Group. Carl Cavers Chief Executive Officer 26 September 2019
11
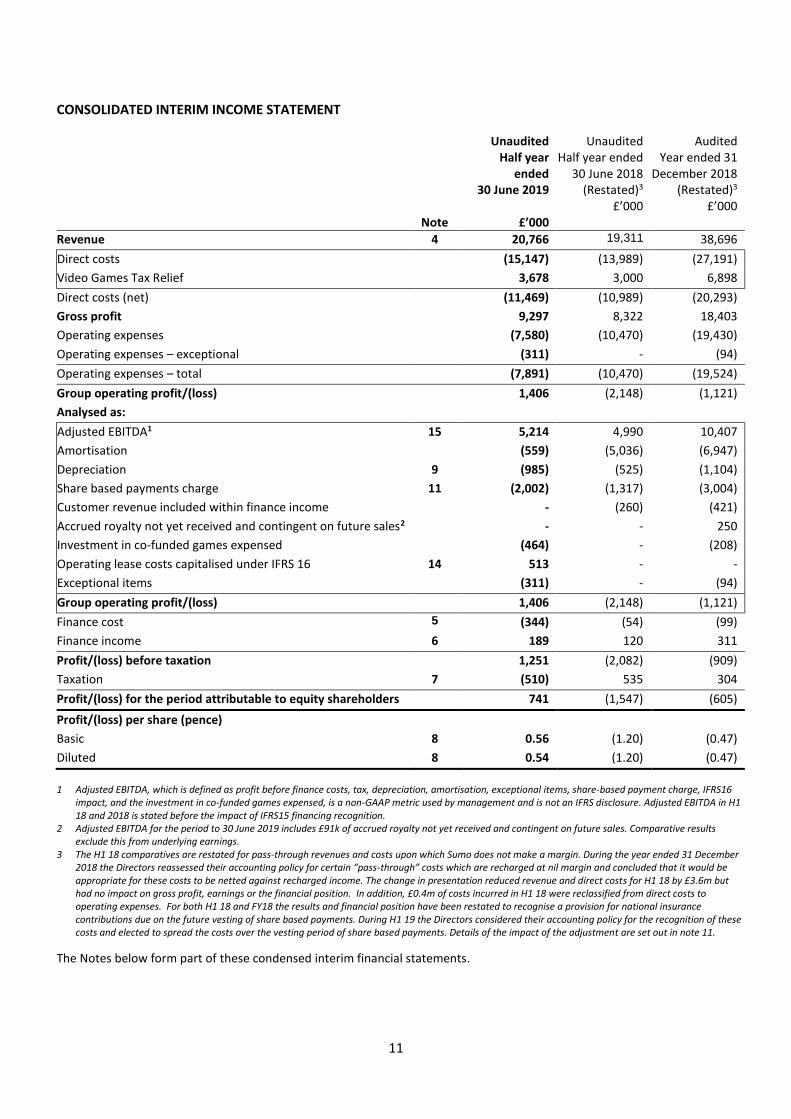
CONSOLIDATED INTERIM INCOME STATEMENT
Note
Unaudited Half year
ended 30 June 2019
£’000
Unaudited Half year ended
30 June 2018 (Restated)3
£’000
Audited Year ended 31
December 2018 (Restated)3
£’000
Revenue 4 20,766 19,311 38,696
Direct costs (15,147) (13,989) (27,191)
Video Games Tax Relief 3,678 3,000 6,898
Direct costs (net) (11,469) (10,989) (20,293)
Gross profit 9,297 8,322 18,403
Operating expenses (7,580) (10,470) (19,430)
Operating expenses – exceptional (311) - (94)
Operating expenses – total (7,891) (10,470) (19,524)
Group operating profit/(loss) 1,406 (2,148) (1,121)
Analysed as:
Adjusted EBITDA1 15 5,214 4,990 10,407
Amortisation (559) (5,036) (6,947)
Depreciation 9 (985) (525) (1,104)
Share based payments charge 11 (2,002) (1,317) (3,004)
Customer revenue included within finance income - (260) (421)
Accrued royalty not yet received and contingent on future sales2 - - 250
Investment in co-funded games expensed (464) - (208)
Operating lease costs capitalised under IFRS 16 14 513 - -
Exceptional items (311) - (94)
Group operating profit/(loss) 1,406 (2,148) (1,121)
Finance cost 5 (344) (54) (99)
Finance income 6 189 120 311
Profit/(loss) before taxation 1,251 (2,082) (909)
Taxation 7 (510) 535 304
Profit/(loss) for the period attributable to equity shareholders 741 (1,547) (605)
Profit/(loss) per share (pence)
Basic 8 0.56 (1.20) (0.47)
Diluted 8 0.54 (1.20) (0.47)
1 Adjusted EBITDA, which is defined as profit before finance costs, tax, depreciation, amortisation, exceptional items, share-based payment charge, IFRS16
impact, and the investment in co-funded games expensed, is a non-GAAP metric used by management and is not an IFRS disclosure. Adjusted EBITDA in H1 18 and 2018 is stated before the impact of IFRS15 financing recognition.
2 Adjusted EBITDA for the period to 30 June 2019 includes £91k of accrued royalty not yet received and contingent on future sales. Comparative results exclude this from underlying earnings.
3 The H1 18 comparatives are restated for pass-through revenues and costs upon which Sumo does not make a margin. During the year ended 31 December 2018 the Directors reassessed their accounting policy for certain “pass-through” costs which are recharged at nil margin and concluded that it would be appropriate for these costs to be netted against recharged income. The change in presentation reduced revenue and direct costs for H1 18 by £3.6m but had no impact on gross profit, earnings or the financial position. In addition, £0.4m of costs incurred in H1 18 were reclassified from direct costs to operating expenses. For both H1 18 and FY18 the results and financial position have been restated to recognise a provision for national insurance contributions due on the future vesting of share based payments. During H1 19 the Directors considered their accounting policy for the recognition of these costs and elected to spread the costs over the vesting period of share based payments. Details of the impact of the adjustment are set out in note 11.
The Notes below form part of these condensed interim financial statements.
12
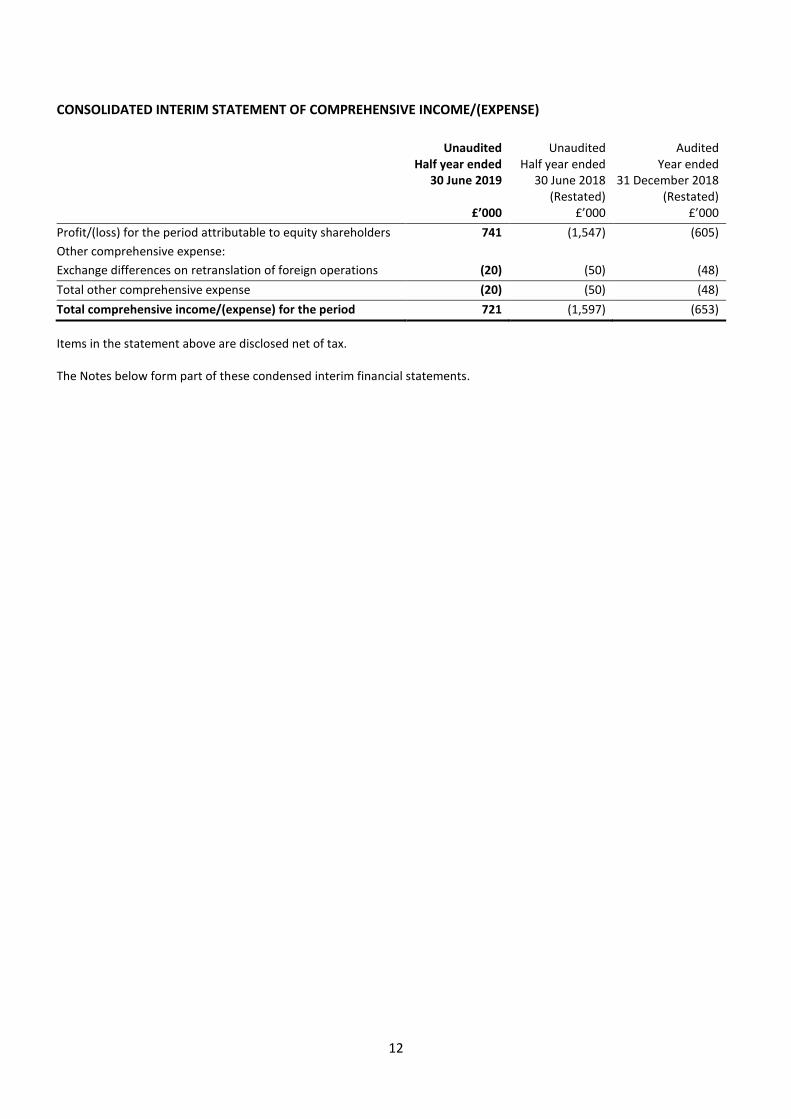
CONSOLIDATED INTERIM STATEMENT OF COMPREHENSIVE INCOME/(EXPENSE)
Unaudited Half year ended
30 June 2019
£’000
Unaudited Half year ended
30 June 2018 (Restated)
£’000
Audited Year ended
31 December 2018 (Restated)
£’000
Profit/(loss) for the period attributable to equity shareholders 741 (1,547) (605)
Other comprehensive expense:
Exchange differences on retranslation of foreign operations (20) (50) (48)
Total other comprehensive expense (20) (50) (48)
Total comprehensive income/(expense) for the period 721 (1,597) (653)
Items in the statement above are disclosed net of tax. The Notes below form part of these condensed interim financial statements.
13
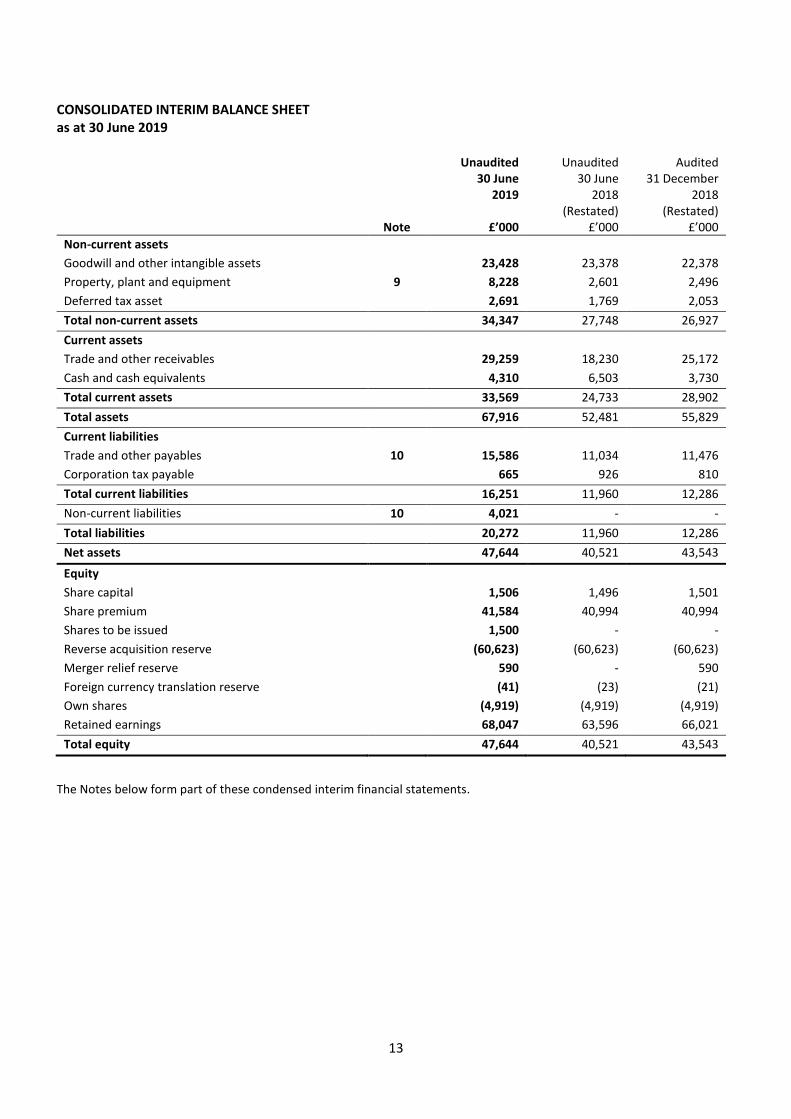
CONSOLIDATED INTERIM BALANCE SHEET as at 30 June 2019
Note
Unaudited 30 June
2019
£’000
Unaudited 30 June
2018 (Restated)
£’000
Audited 31 December
2018 (Restated)
£’000
Non-current assets
Goodwill and other intangible assets 23,428 23,378 22,378
Property, plant and equipment 9 8,228 2,601 2,496
Deferred tax asset 2,691 1,769 2,053
Total non-current assets 34,347 27,748 26,927
Current assets
Trade and other receivables 29,259 18,230 25,172
Cash and cash equivalents 4,310 6,503 3,730
Total current assets 33,569 24,733 28,902
Total assets 67,916 52,481 55,829
Current liabilities
Trade and other payables 10 15,586 11,034 11,476
Corporation tax payable 665 926 810
Total current liabilities 16,251 11,960 12,286
Non-current liabilities 10 4,021 - -
Total liabilities 20,272 11,960 12,286
Net assets 47,644 40,521 43,543
Equity
Share capital 1,506 1,496 1,501
Share premium 41,584 40,994 40,994
Shares to be issued 1,500 - -
Reverse acquisition reserve (60,623) (60,623) (60,623)
Merger relief reserve 590 - 590
Foreign currency translation reserve (41) (23) (21)
Own shares (4,919) (4,919) (4,919)
Retained earnings 68,047 63,596 66,021
Total equity 47,644 40,521 43,543
The Notes below form part of these condensed interim financial statements.
14
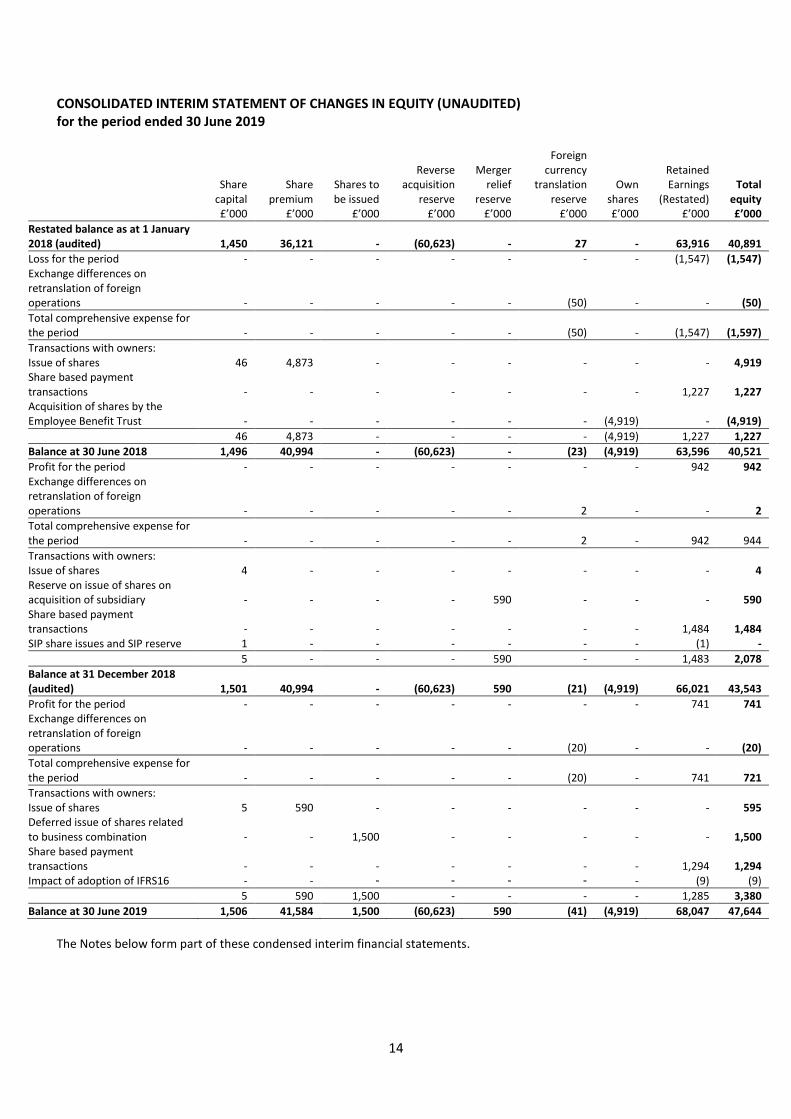
CONSOLIDATED INTERIM STATEMENT OF CHANGES IN EQUITY (UNAUDITED) for the period ended 30 June 2019
Share capital £’000
Share premium
£’000
Shares to be issued
£’000
Reverse acquisition
reserve £’000
Merger relief
reserve £’000
Foreign currency
translation reserve
£’000
Own shares £’000
Retained Earnings
(Restated) £’000
Total equity £’000
Restated balance as at 1 January 2018 (audited)
1,450
36,121
-
(60,623)
-
27
-
63,916
40,891
Loss for the period - - - - - - - (1,547) (1,547) Exchange differences on retranslation of foreign operations
-
-
-
-
-
(50)
-
-
(50)
Total comprehensive expense for the period
-
-
-
-
-
(50)
-
(1,547)
(1,597)
Transactions with owners: Issue of shares 46 4,873 - - - - - - 4,919 Share based payment transactions
-
-
-
-
-
-
-
1,227
1,227
Acquisition of shares by the Employee Benefit Trust
-
-
-
-
-
-
(4,919)
-
(4,919)
46 4,873 - - - - (4,919) 1,227 1,227
Balance at 30 June 2018 1,496 40,994 - (60,623) - (23) (4,919) 63,596 40,521
Profit for the period - - - - - - - 942 942 Exchange differences on retranslation of foreign operations
-
-
-
-
-
2
-
-
2
Total comprehensive expense for the period
-
-
-
-
-
2
-
942
944
Transactions with owners: Issue of shares 4 - - - - - - - 4 Reserve on issue of shares on acquisition of subsidiary
-
-
-
-
590
-
-
-
590
Share based payment transactions
-
-
-
-
-
-
-
1,484
1,484
SIP share issues and SIP reserve 1 - - - - - - (1) -
5 - - - 590 - - 1,483 2,078
Balance at 31 December 2018 (audited)
1,501
40,994
-
(60,623)
590
(21)
(4,919)
66,021
43,543
Profit for the period - - - - - - - 741 741 Exchange differences on retranslation of foreign operations
-
-
-
-
-
(20)
-
-
(20)
Total comprehensive expense for the period
-
-
-
-
-
(20)
-
741
721
Transactions with owners: Issue of shares 5 590 - - - - - - 595 Deferred issue of shares related to business combination
-
-
1,500
-
-
-
-
-
1,500
Share based payment transactions
-
-
-
-
-
-
-
1,294
1,294
Impact of adoption of IFRS16 - - - - - - - (9) (9)
5 590 1,500 - - - - 1,285 3,380
Balance at 30 June 2019 1,506 41,584 1,500 (60,623) 590 (41) (4,919) 68,047 47,644
The Notes below form part of these condensed interim financial statements.
15
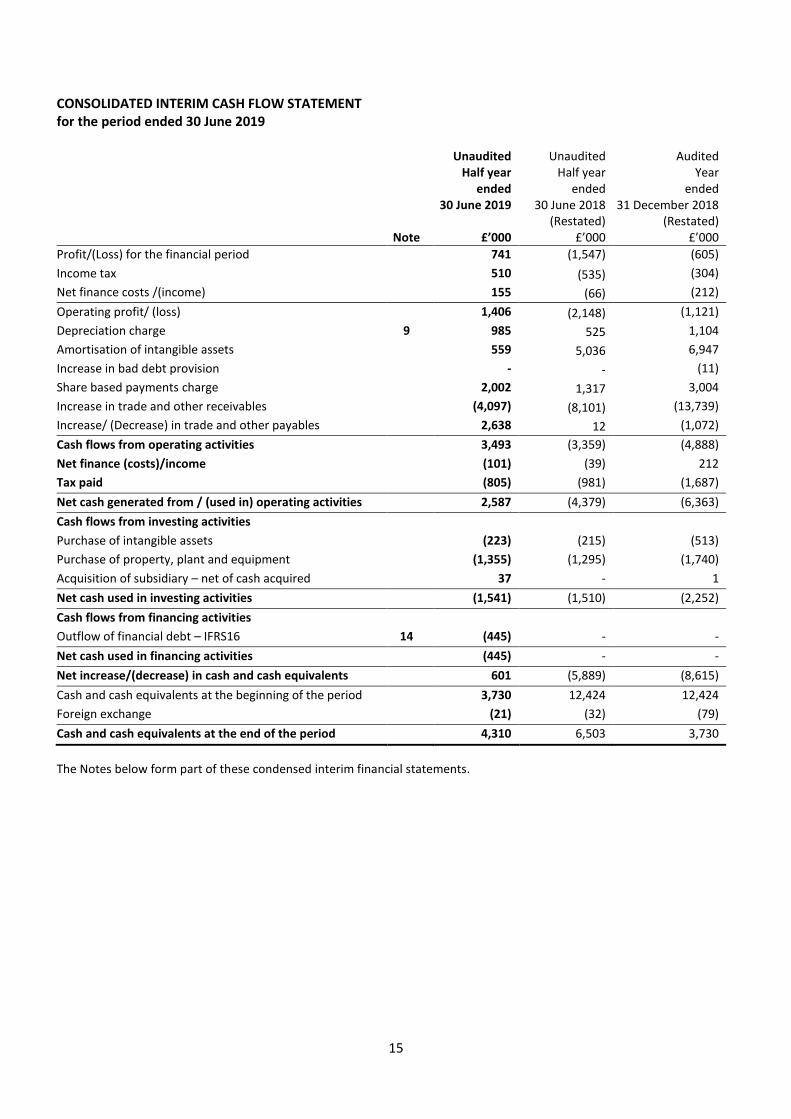
CONSOLIDATED INTERIM CASH FLOW STATEMENT for the period ended 30 June 2019
Note
Unaudited Half year
ended 30 June 2019
£’000
Unaudited Half year
ended 30 June 2018
(Restated) £’000
Audited Year
ended 31 December 2018
(Restated)
£’000
Profit/(Loss) for the financial period 741 (1,547) (605)
Income tax 510 (535) (304)
Net finance costs /(income) 155 (66) (212)
Operating profit/ (loss) 1,406 (2,148) (1,121)
Depreciation charge 9 985 525 1,104
Amortisation of intangible assets 559 5,036 6,947
Increase in bad debt provision - - (11)
Share based payments charge 2,002 1,317 3,004
Increase in trade and other receivables (4,097) (8,101) (13,739)
Increase/ (Decrease) in trade and other payables 2,638 12 (1,072)
Cash flows from operating activities 3,493 (3,359) (4,888)
Net finance (costs)/income (101) (39) 212
Tax paid (805) (981) (1,687)
Net cash generated from / (used in) operating activities 2,587 (4,379) (6,363)
Cash flows from investing activities
Purchase of intangible assets (223) (215) (513)
Purchase of property, plant and equipment (1,355) (1,295) (1,740)
Acquisition of subsidiary – net of cash acquired 37 - 1
Net cash used in investing activities (1,541) (1,510) (2,252)
Cash flows from financing activities
Outflow of financial debt – IFRS16 14 (445) - -
Net cash used in financing activities (445) - -
Net increase/(decrease) in cash and cash equivalents 601 (5,889) (8,615)
Cash and cash equivalents at the beginning of the period 3,730 12,424 12,424
Foreign exchange (21) (32) (79)
Cash and cash equivalents at the end of the period 4,310 6,503 3,730
The Notes below form part of these condensed interim financial statements.
16
NOTES TO THE CONDENSED INTERIM FINANCIAL STATEMENTS
for the period ended 30 June 2019 1. GENERAL INFORMATION Sumo Group plc (“the Company”) is a public limited company incorporated in England with the registered number 11071913. The address of its registered office is 32 Jessops Riverside, Brightside Lane, Sheffield S9 2RX. The Company’s shares are quoted on the Alternative Investment Market. The principal activity of the Company and its subsidiaries (together “the Group”) is that of video games development. The condensed consolidated interim financial information was approved and authorised for issue by a duly appointed and authorised committee of the Board of Directors on 25 September 2019. This condensed interim financial information has not been audited or reviewed by the Company’s auditors. Forward looking statements Certain statements in this results announcement are forward looking. The terms “expect”, “anticipate”, “should be”, “will be” and similar expressions identify forward-looking statements. Although the Board of Directors believe that the expectations reflected in these forward-looking statements are reasonable, such statements are subject to a number of risks and uncertainties, and events could differ materially from these expressed or implied by these forward-looking statements. 2. BASIS OF PREPARATION This condensed consolidated interim financial information for the six months ended 30 June 2019 has been prepared in accordance with International Accounting Standard 34 “Interim Financial Reporting”. The condensed consolidated interim financial information should be read in conjunction with the annual financial statements for the year ended 31 December 2018, which have been prepared in accordance with International Financial Reporting Standards as endorsed by the European Union (‘IFRS’), International Financial Reporting Standards Interpretation Committee (‘IFRS IC’) interpretations and those provis ions of the Companies Act 2006 applicable to companies reporting under IFRS. The condensed consolidated interim financial statements have been prepared on the going concern basis and on the historical cost convention modified for the revaluation of certain financial instruments. This condensed consolidated interim financial information does not constitute the Group’s statutory accounts within the meaning of section 434 of the Companies Act 2006. The comparatives for the full year ended 31 December 2018 are not the Company’s full statutory accounts for that year. A copy of the statutory accounts for that year has been delivered to the Registrar of Companies. The auditors, Grant Thornton UK LLP, have reported on these accounts, their report is unqualified, does not include a reference to any matters to which the auditors drew attention by way of emphasis without qualifying their report, and does not constitute a statement under either Section 498(2) or (3) of the Companies Act 2006. 3. ACCOUNTING POLICIES In these unaudited half year results the Group has, with effect from 1 January 2019, adopted IFRS 16. IFRS 16 ‘Leases’ replaced IAS 17 ‘Leases’ and IFRIC4 ‘determining whether an arrangement contains a lease’ and sets out the principles for the recognition, measurement, presentation and disclosure of leases and has been applied from 1 January 2019 using the modified retrospective approach. Under IFRS 16 the main difference for the Group is that certain leases where the Group is a lessee are recognised on the balance sheet, as both a right-of-use asset and a lease liability. Low value (defined as leases with an individual asset value of less than £5,000 at the date of initial recognition) and short term leases (those with a term of 12 months or less) were excluded from these calculations under the practical expedients allowed in the standard. The right-of-use asset is depreciated in accordance with IAS 16 ‘Property, Plant and Equipment’ and the liability is increased for the accumulation of interest and reduced by cash lease payments. There is no impact on cashflow.
17
On the income statement the Group recognises a depreciation charge and an interest charge instead of a straight-line operating cost. This changes the timing of cost recognition on the lease, resulting in extra cost in early years of the lease, and reduced cost towards the end of the lease. The Group elected to exclude all short-term leases and all leases for which the underlying asset is of low value (as above). The adoption of IFRS 16 resulted in the recognition of a right of use asset with a depreciated cost of £5,151,000 together with a corresponding financial liability of £5,413,000 as at 1 January 2019. The difference of £262,000 was debited to retained earnings as at 1 January 2019. Offset against this, £253,000 of lease liability accruals under the previous standard IAS17 were also credited to retained earnings at that date. Otherwise there are no new standards that have become effective in the period that have had a material effect on the Group's financial statements. The accounting policies applied by the Group in these unaudited half year results are consistent with those applied in the annual financial statements for the year ended 31 December 2018 as described in the Group's Annual Report and full financial statements for that year and as available on the Company's website www.sumogroupplc.com except for the introduction of IFRS 16 which is set out in the policy below. Taxes on income in the interim periods are accrued using the tax rate that would be applicable to expected total annual earnings. Leases The Group has applied IFRS 16 from 1 January 2019. At inception of a contract, the Group assesses whether a contract is, or contains, a lease. A contract is, or contains, a lease if the contract conveys the right to control the use of an identified asset for a period of time in exchange for consideration. The Group recognises a right-of-use asset and a lease liability at the lease commencement date. The right-of-use asset is initially measured at cost, which comprises the initial amount of the lease liability adjusted for any lease payments made at or before the commencement date, plus any initial direct costs incurred and an estimate of costs to restore the underlying asset, less any lease incentives received. The right-of-use asset is subsequently depreciated using the straight-line method from the commencement date to the earlier of the end of the useful life of the right-of-use asset or the end of the lease term. In addition, the right-of-use asset is periodically reduced by impairment losses, if any, and adjusted for certain remeasurements of the lease liabilities. The lease liability is initially measured at the present value of lease payments that were not paid at the commencement date, discounted using the Group’s incremental borrowing rate. The lease liability is measured at amortised cost using the effective interest method. If there is a remeasurement of the lease liability, a corresponding adjustment is made to the carrying amount of the right-of-use asset or is recorded directly in profit or loss if the carrying amount of the right of use asset is zero. The Group presents right-of-use assets within property, plant and equipment. The Group has elected not to recognise right-of-use assets and lease liabilities for short-term leases that have a lease term of 12 months or less or leases of low value assets. These lease payments are expensed on a straight-line basis over the lease term. 4. SEGMENTAL REPORTING – UNAUDITED The trading operations of the Group are only in video games development and are all continuing. This includes the activities of Sumo Digital Limited, Mistral Entertainment Limited, Sumo Video Games Private Limited, Cirrus Development Limited, Sumo Digital (Genus) Limited, Sumo Digital (Atlantis) Limited, Atomhawk Design Limited, Atomhawk Canada Limited, Red Kite Games Limited and Red Kite Software Development Limited. The central activities, comprising services and assets provided to Group companies, are considered incidental to the activities of the Group and have therefore not been shown as a separate operating segment but have been subsumed within video games development. All assets of the Group reside in the UK, with the exception
18
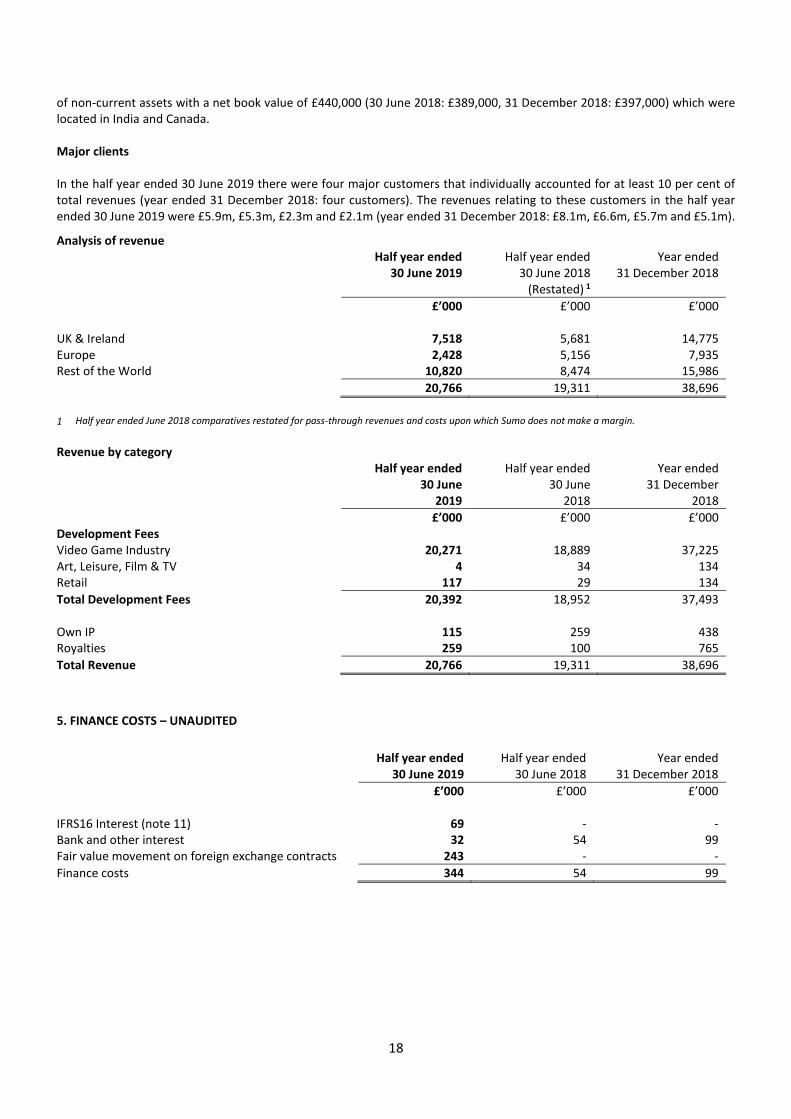
of non-current assets with a net book value of £440,000 (30 June 2018: £389,000, 31 December 2018: £397,000) which were located in India and Canada. Major clients In the half year ended 30 June 2019 there were four major customers that individually accounted for at least 10 per cent of total revenues (year ended 31 December 2018: four customers). The revenues relating to these customers in the half year ended 30 June 2019 were £5.9m, £5.3m, £2.3m and £2.1m (year ended 31 December 2018: £8.1m, £6.6m, £5.7m and £5.1m).
Analysis of revenue Half year ended
30 June 2019 Half year ended
30 June 2018 (Restated) 1
Year ended 31 December 2018
£’000 £’000 £’000 UK & Ireland 7,518 5,681 14,775 Europe 2,428 5,156 7,935 Rest of the World 10,820 8,474 15,986
20,766 19,311 38,696
1 Half year ended June 2018 comparatives restated for pass-through revenues and costs upon which Sumo does not make a margin.
Revenue by category Half year ended
30 June 2019
Half year ended 30 June
2018
Year ended 31 December
2018
£’000 £’000 £’000 Development Fees Video Game Industry 20,271 18,889 37,225 Art, Leisure, Film & TV 4 34 134 Retail 117 29 134
Total Development Fees 20,392 18,952 37,493 Own IP 115 259 438 Royalties 259 100 765
Total Revenue 20,766 19,311 38,696
5. FINANCE COSTS – UNAUDITED
Half year ended 30 June 2019
Half year ended 30 June 2018
Year ended 31 December 2018
£’000 £’000 £’000 IFRS16 Interest (note 11) 69 - - Bank and other interest 32 54 99 Fair value movement on foreign exchange contracts 243 - -
Finance costs 344 54 99
19
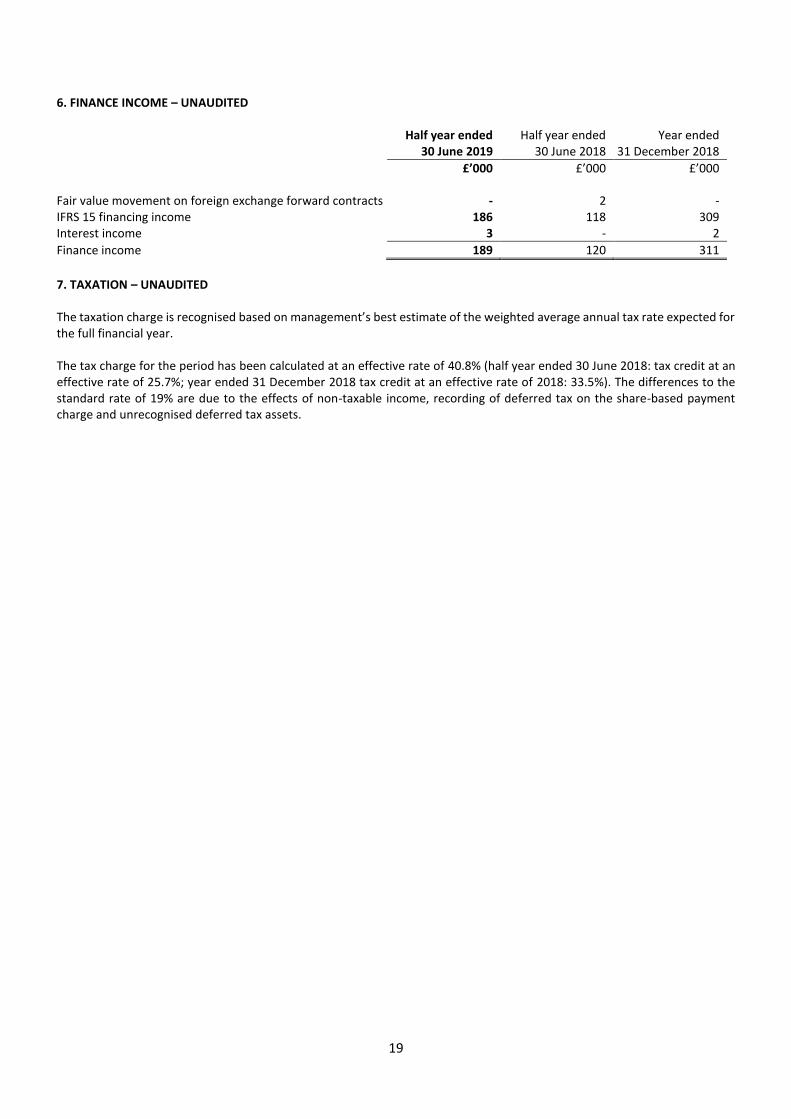
6. FINANCE INCOME – UNAUDITED Half year ended
30 June 2019 Half year ended
30 June 2018 Year ended
31 December 2018
£’000 £’000 £’000 Fair value movement on foreign exchange forward contracts - 2 - IFRS 15 financing income 186 118 309 Interest income 3 - 2
Finance income 189 120 311
7. TAXATION – UNAUDITED The taxation charge is recognised based on management’s best estimate of the weighted average annual tax rate expected for the full financial year. The tax charge for the period has been calculated at an effective rate of 40.8% (half year ended 30 June 2018: tax credit at an effective rate of 25.7%; year ended 31 December 2018 tax credit at an effective rate of 2018: 33.5%). The differences to the standard rate of 19% are due to the effects of non-taxable income, recording of deferred tax on the share-based payment charge and unrecognised deferred tax assets.
20
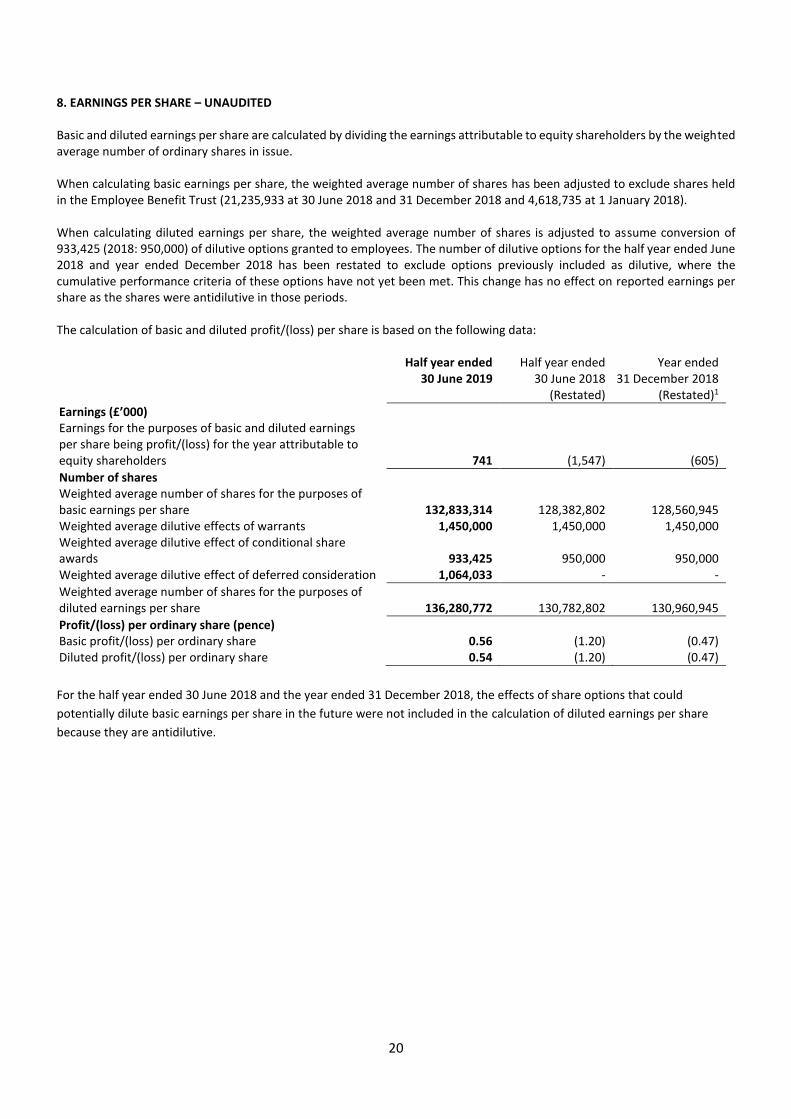
8. EARNINGS PER SHARE – UNAUDITED Basic and diluted earnings per share are calculated by dividing the earnings attributable to equity shareholders by the weighted average number of ordinary shares in issue. When calculating basic earnings per share, the weighted average number of shares has been adjusted to exclude shares held in the Employee Benefit Trust (21,235,933 at 30 June 2018 and 31 December 2018 and 4,618,735 at 1 January 2018). When calculating diluted earnings per share, the weighted average number of shares is adjusted to assume conversion of 933,425 (2018: 950,000) of dilutive options granted to employees. The number of dilutive options for the half year ended June 2018 and year ended December 2018 has been restated to exclude options previously included as dilutive, where the cumulative performance criteria of these options have not yet been met. This change has no effect on reported earnings per share as the shares were antidilutive in those periods. The calculation of basic and diluted profit/(loss) per share is based on the following data: Half year ended
30 June 2019 Half year ended
30 June 2018 (Restated)
Year ended 31 December 2018
(Restated)1
Earnings (£’000) Earnings for the purposes of basic and diluted earnings per share being profit/(loss) for the year attributable to equity shareholders
741
(1,547)
(605)
Number of shares Weighted average number of shares for the purposes of basic earnings per share
132,833,314
128,382,802
128,560,945
Weighted average dilutive effects of warrants 1,450,000 1,450,000 1,450,000 Weighted average dilutive effect of conditional share awards
933,425
950,000
950,000
Weighted average dilutive effect of deferred consideration 1,064,033 - -
Weighted average number of shares for the purposes of diluted earnings per share
136,280,772
130,782,802
130,960,945
Profit/(loss) per ordinary share (pence) Basic profit/(loss) per ordinary share 0.56 (1.20) (0.47) Diluted profit/(loss) per ordinary share 0.54 (1.20) (0.47)
For the half year ended 30 June 2018 and the year ended 31 December 2018, the effects of share options that could
potentially dilute basic earnings per share in the future were not included in the calculation of diluted earnings per share
because they are antidilutive.
21
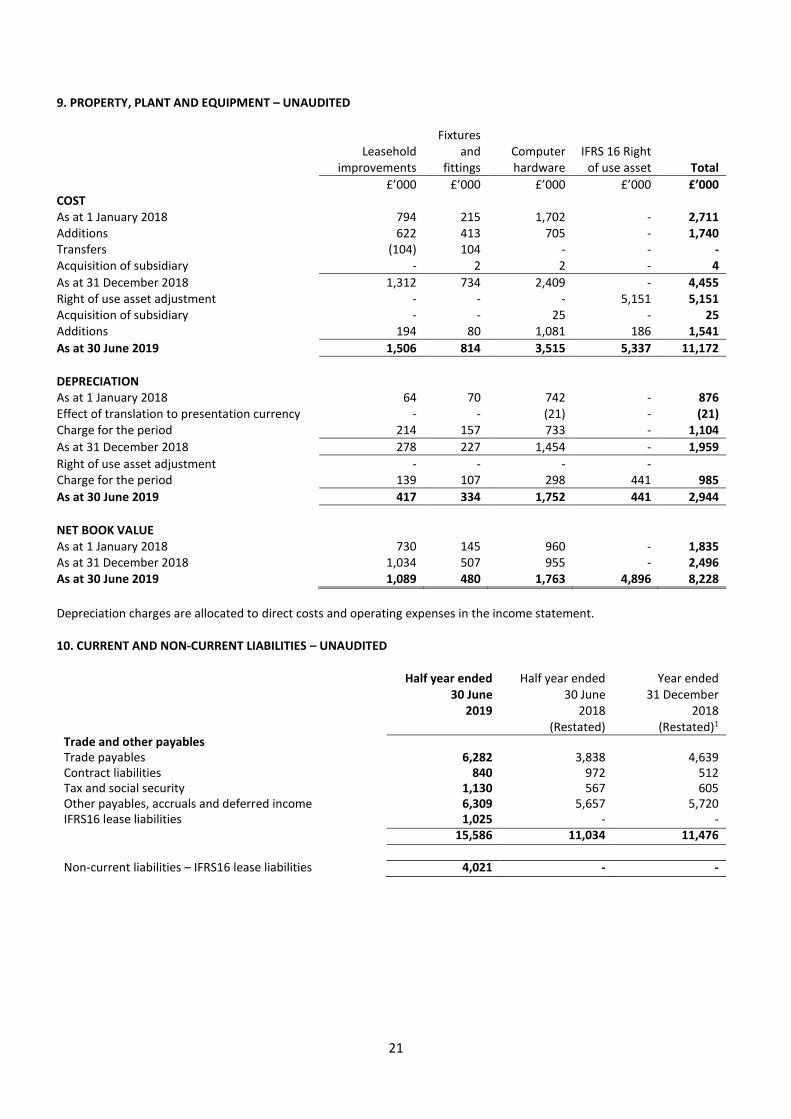
9. PROPERTY, PLANT AND EQUIPMENT – UNAUDITED
Leasehold improvements
Fixtures and
fittings Computer hardware
IFRS 16 Right of use asset Total
£’000 £’000 £’000 £’000 £’000 COST As at 1 January 2018 794 215 1,702 - 2,711 Additions 622 413 705 - 1,740 Transfers (104) 104 - - - Acquisition of subsidiary - 2 2 - 4
As at 31 December 2018 1,312 734 2,409 - 4,455 Right of use asset adjustment - - - 5,151 5,151 Acquisition of subsidiary - - 25 - 25 Additions 194 80 1,081 186 1,541
As at 30 June 2019 1,506 814 3,515 5,337 11,172
DEPRECIATION As at 1 January 2018 64 70 742 - 876 Effect of translation to presentation currency - - (21) - (21) Charge for the period 214 157 733 - 1,104
As at 31 December 2018 278 227 1,454 - 1,959
Right of use asset adjustment - - - - Charge for the period 139 107 298 441 985
As at 30 June 2019 417 334 1,752 441 2,944
NET BOOK VALUE As at 1 January 2018 730 145 960 - 1,835 As at 31 December 2018 1,034 507 955 - 2,496 As at 30 June 2019 1,089 480 1,763 4,896 8,228
Depreciation charges are allocated to direct costs and operating expenses in the income statement. 10. CURRENT AND NON-CURRENT LIABILITIES – UNAUDITED
Half year ended 30 June
2019
Half year ended 30 June
2018 (Restated)
Year ended 31 December
2018 (Restated)1
Trade and other payables Trade payables 6,282 3,838 4,639 Contract liabilities 840 972 512 Tax and social security 1,130 567 605 Other payables, accruals and deferred income 6,309 5,657 5,720 IFRS16 lease liabilities 1,025 - - 15,586 11,034 11,476 Non-current liabilities – IFRS16 lease liabilities 4,021 - -
22
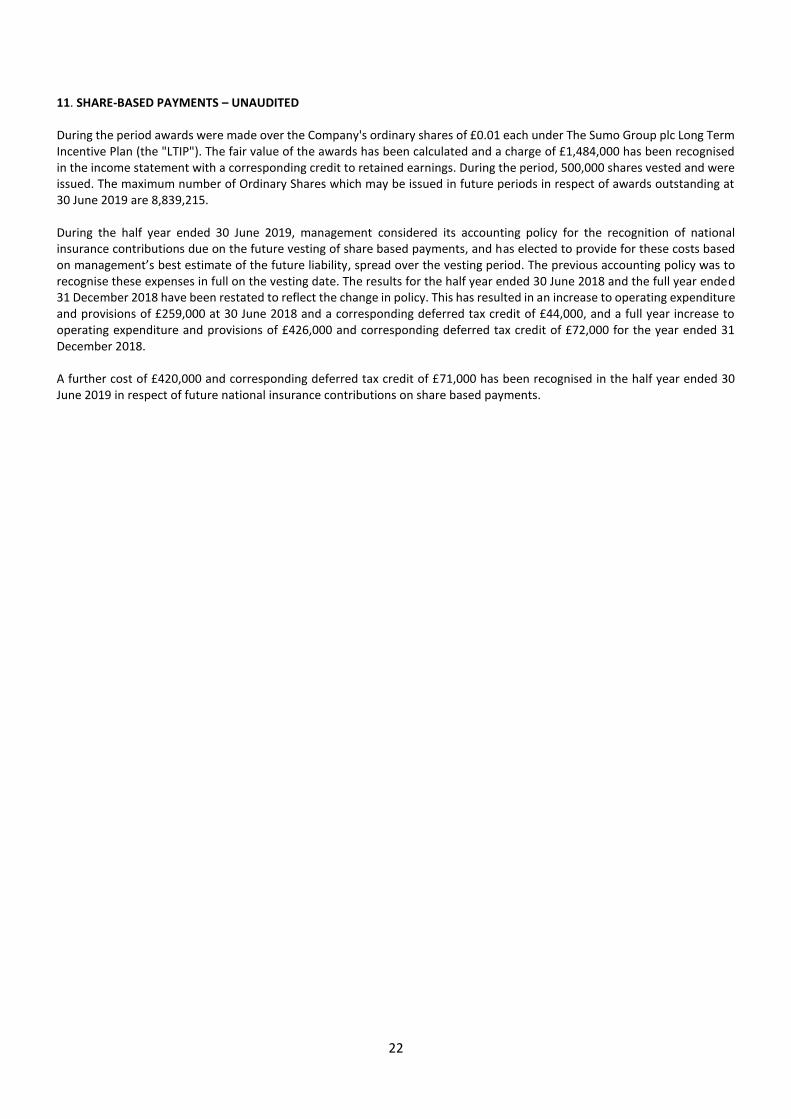
11. SHARE-BASED PAYMENTS – UNAUDITED During the period awards were made over the Company's ordinary shares of £0.01 each under The Sumo Group plc Long Term Incentive Plan (the "LTIP"). The fair value of the awards has been calculated and a charge of £1,484,000 has been recognised in the income statement with a corresponding credit to retained earnings. During the period, 500,000 shares vested and were issued. The maximum number of Ordinary Shares which may be issued in future periods in respect of awards outstanding at 30 June 2019 are 8,839,215. During the half year ended 30 June 2019, management considered its accounting policy for the recognition of national insurance contributions due on the future vesting of share based payments, and has elected to provide for these costs based on management’s best estimate of the future liability, spread over the vesting period. The previous accounting policy was to recognise these expenses in full on the vesting date. The results for the half year ended 30 June 2018 and the full year ended 31 December 2018 have been restated to reflect the change in policy. This has resulted in an increase to operating expenditure and provisions of £259,000 at 30 June 2018 and a corresponding deferred tax credit of £44,000, and a full year increase to operating expenditure and provisions of £426,000 and corresponding deferred tax credit of £72,000 for the year ended 31 December 2018. A further cost of £420,000 and corresponding deferred tax credit of £71,000 has been recognised in the half year ended 30 June 2019 in respect of future national insurance contributions on share based payments.
23
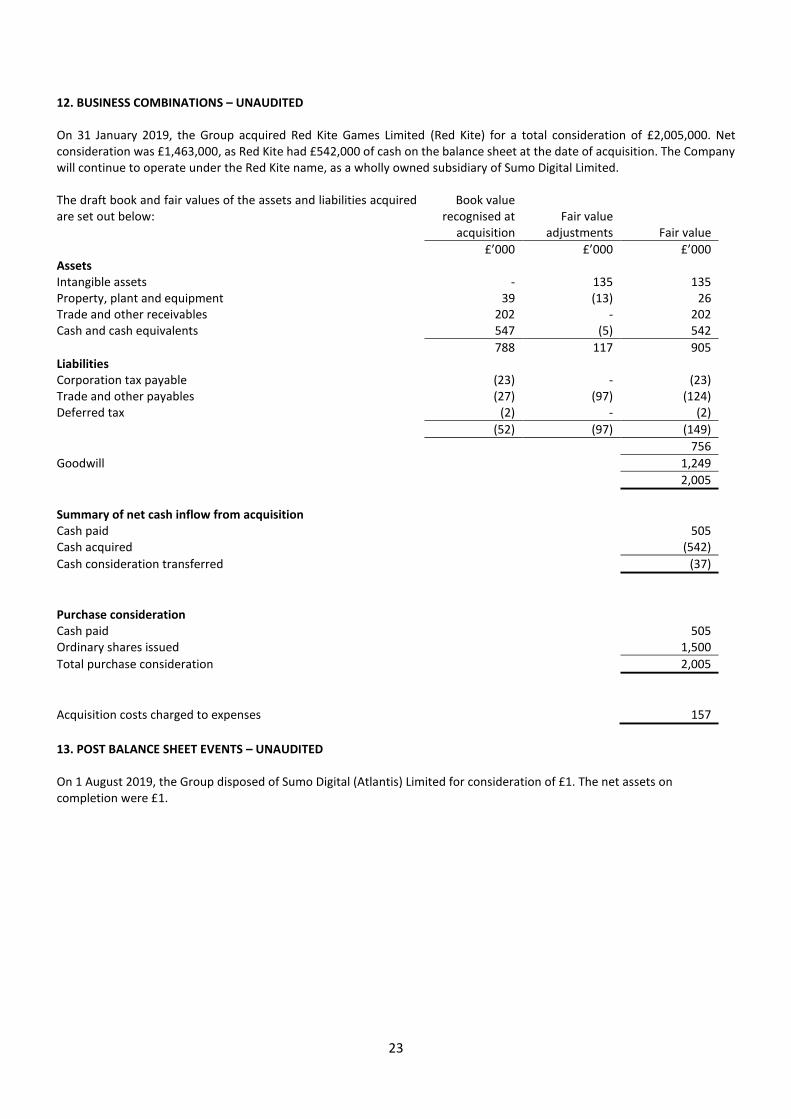
12. BUSINESS COMBINATIONS – UNAUDITED On 31 January 2019, the Group acquired Red Kite Games Limited (Red Kite) for a total consideration of £2,005,000. Net consideration was £1,463,000, as Red Kite had £542,000 of cash on the balance sheet at the date of acquisition. The Company will continue to operate under the Red Kite name, as a wholly owned subsidiary of Sumo Digital Limited. The draft book and fair values of the assets and liabilities acquired are set out below:
Book value recognised at
acquisition
Fair value
adjustments
Fair value
£’000 £’000 £’000 Assets Intangible assets - 135 135 Property, plant and equipment 39 (13) 26 Trade and other receivables 202 - 202 Cash and cash equivalents 547 (5) 542
788 117 905 Liabilities Corporation tax payable (23) - (23) Trade and other payables (27) (97) (124) Deferred tax (2) - (2)
(52) (97) (149)
756
Goodwill 1,249
2,005
Summary of net cash inflow from acquisition Cash paid 505 Cash acquired (542)
Cash consideration transferred (37)
Purchase consideration Cash paid 505 Ordinary shares issued 1,500
Total purchase consideration 2,005
Acquisition costs charged to expenses 157
13. POST BALANCE SHEET EVENTS – UNAUDITED On 1 August 2019, the Group disposed of Sumo Digital (Atlantis) Limited for consideration of £1. The net assets on completion were £1.
24
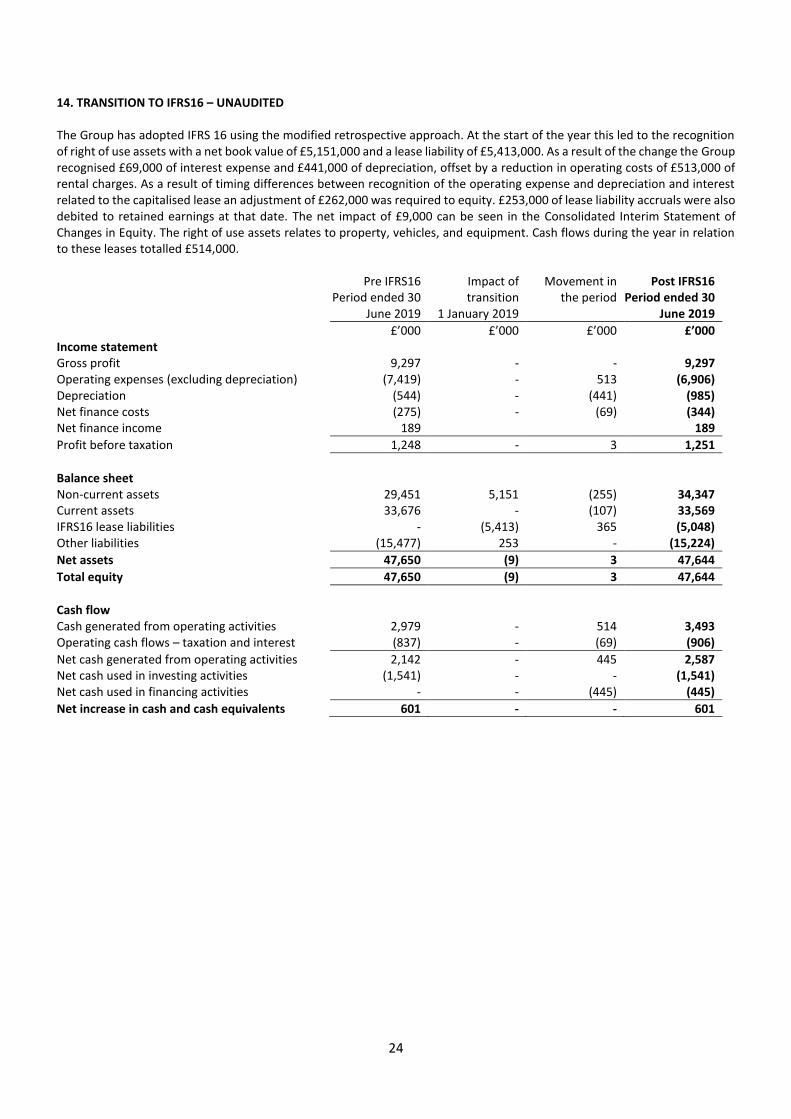
14. TRANSITION TO IFRS16 – UNAUDITED The Group has adopted IFRS 16 using the modified retrospective approach. At the start of the year this led to the recognition of right of use assets with a net book value of £5,151,000 and a lease liability of £5,413,000. As a result of the change the Group recognised £69,000 of interest expense and £441,000 of depreciation, offset by a reduction in operating costs of £513,000 of rental charges. As a result of timing differences between recognition of the operating expense and depreciation and interest related to the capitalised lease an adjustment of £262,000 was required to equity. £253,000 of lease liability accruals were also debited to retained earnings at that date. The net impact of £9,000 can be seen in the Consolidated Interim Statement of Changes in Equity. The right of use assets relates to property, vehicles, and equipment. Cash flows during the year in relation to these leases totalled £514,000. Pre IFRS16
Period ended 30 June 2019
Impact of transition
1 January 2019
Movement in the period
Post IFRS16 Period ended 30
June 2019
£’000 £’000 £’000 £’000 Income statement Gross profit 9,297 - - 9,297 Operating expenses (excluding depreciation) (7,419) - 513 (6,906) Depreciation (544) - (441) (985) Net finance costs (275) - (69) (344) Net finance income 189 189
Profit before taxation 1,248 - 3 1,251
Balance sheet Non-current assets 29,451 5,151 (255) 34,347 Current assets 33,676 - (107) 33,569 IFRS16 lease liabilities - (5,413) 365 (5,048) Other liabilities (15,477) 253 - (15,224)
Net assets 47,650 (9) 3 47,644
Total equity 47,650 (9) 3 47,644
Cash flow Cash generated from operating activities 2,979 - 514 3,493 Operating cash flows – taxation and interest (837) - (69) (906)
Net cash generated from operating activities 2,142 - 445 2,587 Net cash used in investing activities (1,541) - - (1,541) Net cash used in financing activities - - (445) (445)
Net increase in cash and cash equivalents 601 - - 601
25
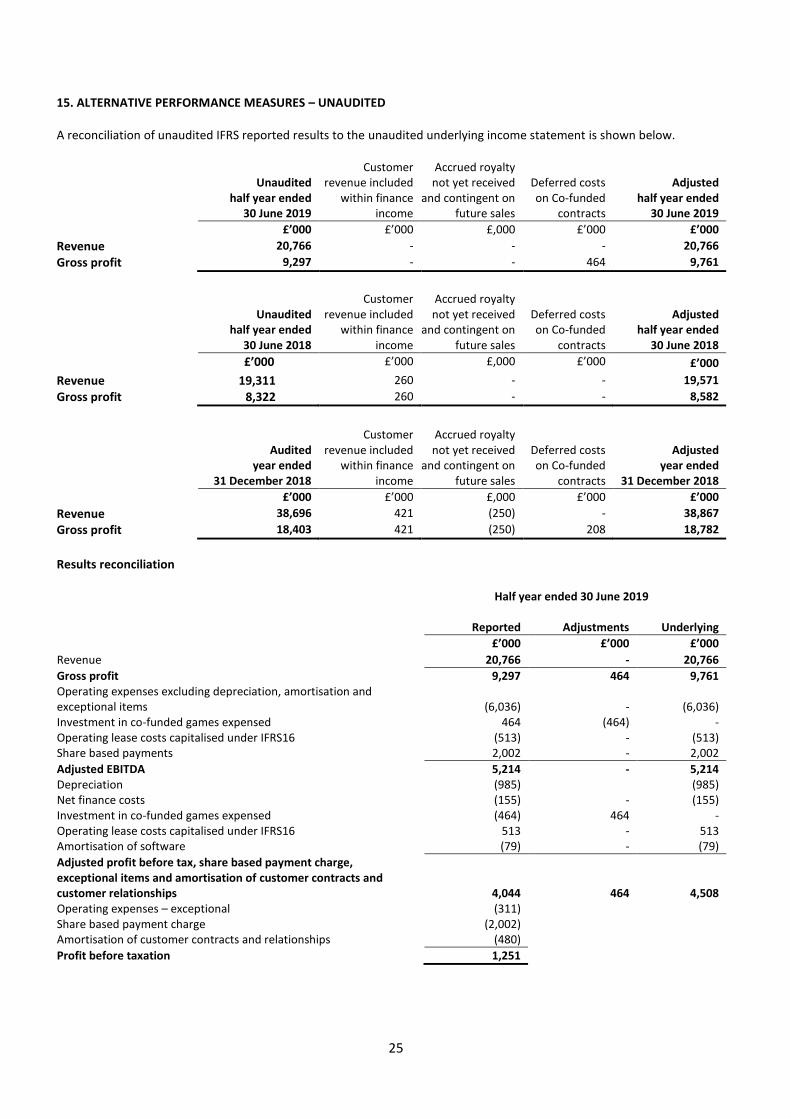
15. ALTERNATIVE PERFORMANCE MEASURES – UNAUDITED A reconciliation of unaudited IFRS reported results to the unaudited underlying income statement is shown below.
Unaudited half year ended
30 June 2019
Customer revenue included
within finance income
Accrued royalty not yet received
and contingent on future sales
Deferred costs on Co-funded
contracts
Adjusted half year ended
30 June 2019
£’000 £’000 £,000 £’000 £’000
Revenue 20,766 - - - 20,766
Gross profit 9,297 - - 464 9,761
Unaudited
half year ended 30 June 2018
Customer revenue included
within finance income
Accrued royalty not yet received
and contingent on future sales
Deferred costs
on Co-funded contracts
Adjusted half year ended
30 June 2018
£’000 £’000 £,000 £’000 £’000
Revenue 19,311 260 - - 19,571
Gross profit 8,322 260 - - 8,582
Audited year ended
31 December 2018
Customer revenue included
within finance income
Accrued royalty not yet received
and contingent on future sales
Deferred costs on Co-funded
contracts
Adjusted year ended
31 December 2018
£’000 £’000 £,000 £’000 £’000
Revenue 38,696 421 (250) - 38,867
Gross profit 18,403 421 (250) 208 18,782
Results reconciliation
Half year ended 30 June 2019 Reported Adjustments Underlying
£’000 £’000 £’000
Revenue 20,766 - 20,766
Gross profit 9,297 464 9,761 Operating expenses excluding depreciation, amortisation and exceptional items
(6,036)
-
(6,036)
Investment in co-funded games expensed 464 (464) - Operating lease costs capitalised under IFRS16 (513) - (513) Share based payments 2,002 - 2,002
Adjusted EBITDA 5,214 - 5,214 Depreciation (985) (985) Net finance costs (155) - (155) Investment in co-funded games expensed (464) 464 - Operating lease costs capitalised under IFRS16 513 - 513 Amortisation of software (79) - (79)
Adjusted profit before tax, share based payment charge, exceptional items and amortisation of customer contracts and customer relationships
4,044
464
4,508 Operating expenses – exceptional (311) Share based payment charge (2,002) Amortisation of customer contracts and relationships (480)
Profit before taxation 1,251
26
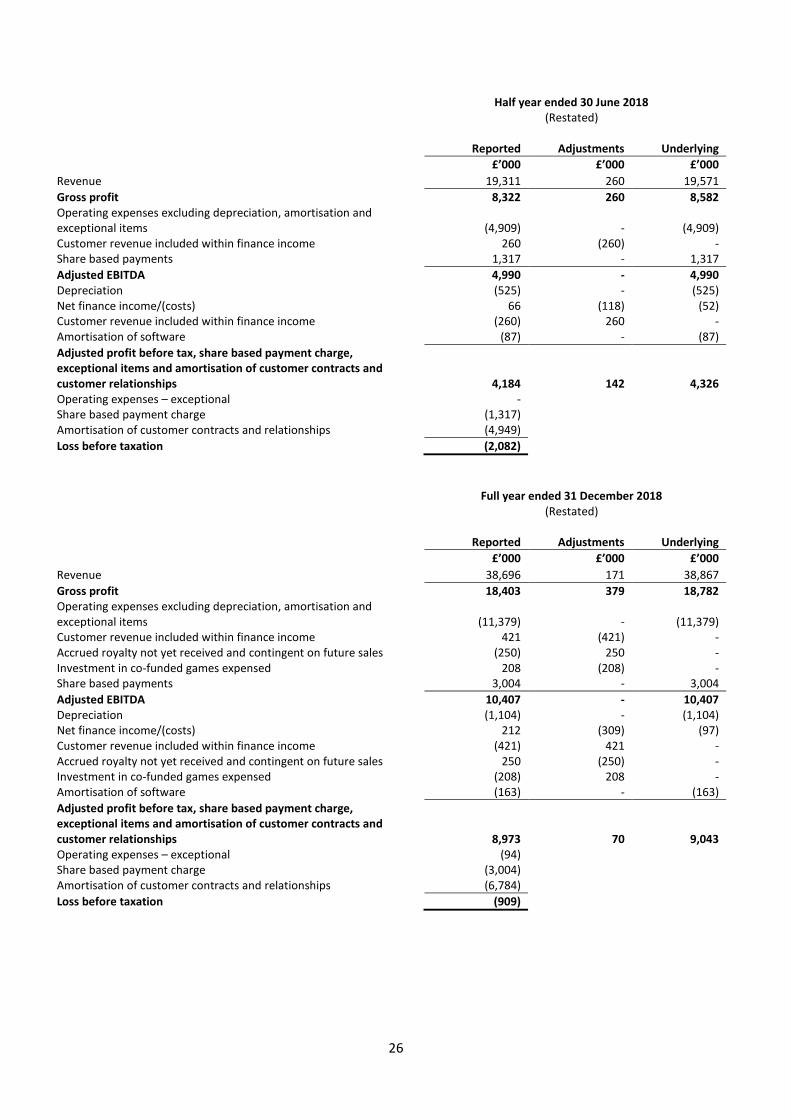
Half year ended 30 June 2018
(Restated) Reported Adjustments Underlying
£’000 £’000 £’000
Revenue 19,311 260 19,571
Gross profit 8,322 260 8,582 Operating expenses excluding depreciation, amortisation and exceptional items
(4,909)
-
(4,909)
Customer revenue included within finance income 260 (260) - Share based payments 1,317 - 1,317
Adjusted EBITDA 4,990 - 4,990 Depreciation (525) - (525) Net finance income/(costs) 66 (118) (52) Customer revenue included within finance income (260) 260 - Amortisation of software (87) - (87)
Adjusted profit before tax, share based payment charge, exceptional items and amortisation of customer contracts and customer relationships
4,184
142
4,326 Operating expenses – exceptional - Share based payment charge (1,317) Amortisation of customer contracts and relationships (4,949)
Loss before taxation (2,082)
Full year ended 31 December 2018
(Restated) Reported Adjustments Underlying
£’000 £’000 £’000
Revenue 38,696 171 38,867
Gross profit 18,403 379 18,782 Operating expenses excluding depreciation, amortisation and exceptional items (11,379)
-
(11,379)
Customer revenue included within finance income 421 (421) - Accrued royalty not yet received and contingent on future sales (250) 250 - Investment in co-funded games expensed 208 (208) - Share based payments 3,004 - 3,004
Adjusted EBITDA 10,407 - 10,407 Depreciation (1,104) - (1,104) Net finance income/(costs) 212 (309) (97) Customer revenue included within finance income (421) 421 - Accrued royalty not yet received and contingent on future sales 250 (250) - Investment in co-funded games expensed (208) 208 - Amortisation of software (163) - (163)
Adjusted profit before tax, share based payment charge, exceptional items and amortisation of customer contracts and customer relationships 8,973 70 9,043 Operating expenses – exceptional (94) Share based payment charge (3,004) Amortisation of customer contracts and relationships (6,784)
Loss before taxation (909)

27
FINANCIAL CALENDAR
Preliminary announcement of half-year results 26 September 2019
Financial year end 31 December 2019
Preliminary announcement of full-year results April 2020
Publication of Annual Report and Accounts May 2020
Annual General Meeting June 2020