Embed Size (px)
Citation preview
Summer University
Implementing city and citizen friendly electric vehicles
14 -16 May 2014
Palma (Mallorca)
Dr. Liana Cipcigan
Cardiff University, School of Engineering
2
My Background
• Member of CIREGS –Centre for Integrating Renewable Energy Generation and Supply
• Member of Electric Vehicle Centre of Excellence, Leader of the Energy Management Theme
• Invited Expert of Working Group Smart Charging under CEN/CENELEC M468 and M490
• Member of WG p.2030.1, Guide for Transportation Electrification, IEEE Standards Association
• Member of the Low Carbon Vehicles Steering Group, Welsh Government
• PI of the projects
– EPSRC - Smart Management of Electric Vehicles
– EPSRC - Electric Vehicle Value Chain, Bridging the gaps
– TSB - Agent-based controllers for electric vehicles and microgenerators
– TSB - Ebbs and Flows of Energy Systems
• Member of the projects
– EPSRC – Grid Economics, Planning and Business Models for Smart Electric Mobility
– ICT-Smart Energy Grids - MAS2TERING - Multi-Agent Systems and Secured coupling of Telecom and Energy gRIds for
Next Generation smart grid services
– IEE - eBRIDGE: empowering e-fleets for business and private purposes in cities
– IEE - I CVUE : Incentives for Clean Vehicles in Urban Europe
– COST ARTS Autonomic Road Transport Systems
– FP7 - MERGE Mobile Energy Resources in Grids of Electricity
– INTERREG - ENEVATE European network on electric vehicles and transferring expertise
– UKERC - Scenarios for the development of smart grids in the UK
– EADS - Innovation Works - SCADA Cyber Security Lifecycle
3
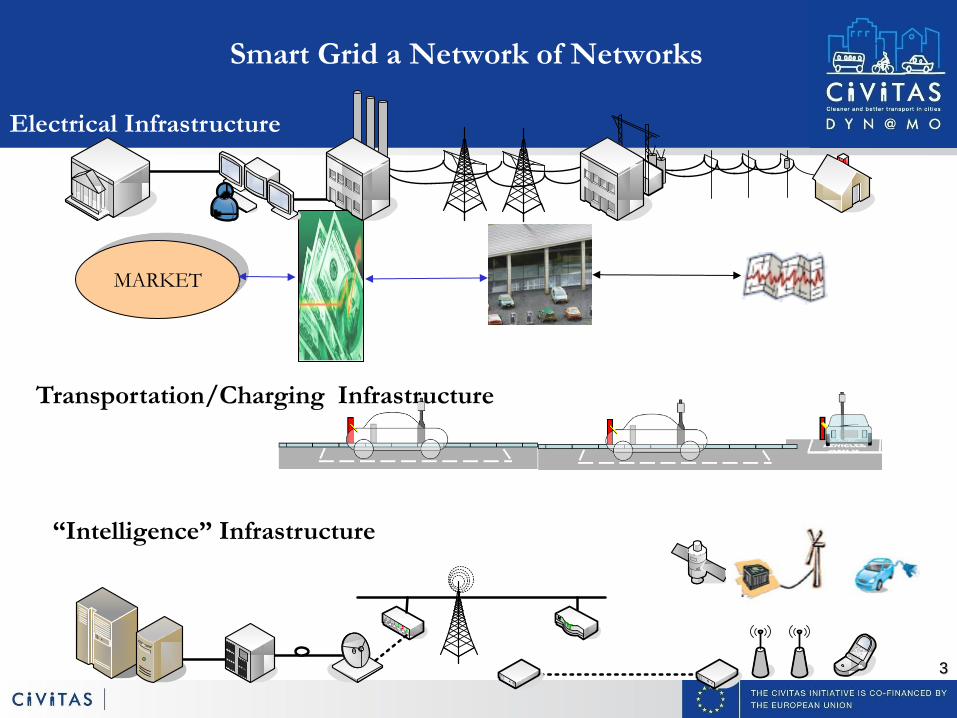
MARKET
Electrical Infrastructure
“Intelligence” Infrastructure
Transportation/Charging Infrastructure
Smart Grid a Network of Networks
4
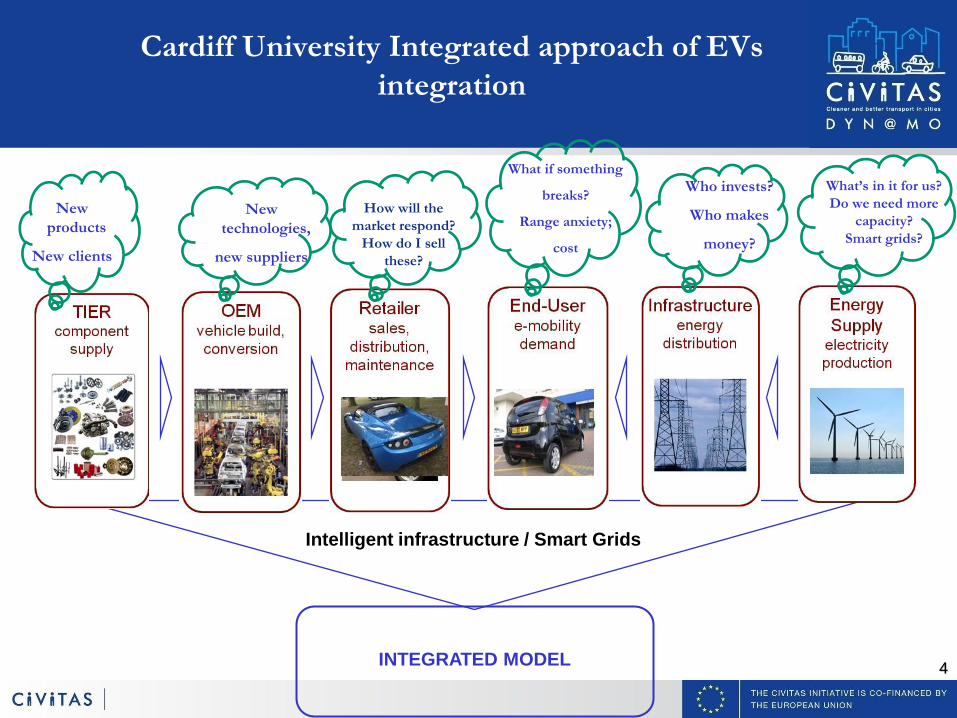
Cardiff University Integrated approach of EVs
integration
Intelligent infrastructure / Smart Grids
INTEGRATED MODEL
New
products
New clients
New
technologies,
new suppliers
How will the
market respond?
How do I sell
these?
What if something
breaks?
Range anxiety;
cost
Who invests?
Who makes
money?
What’s in it for us?
Do we need more
capacity?
Smart grids?
5
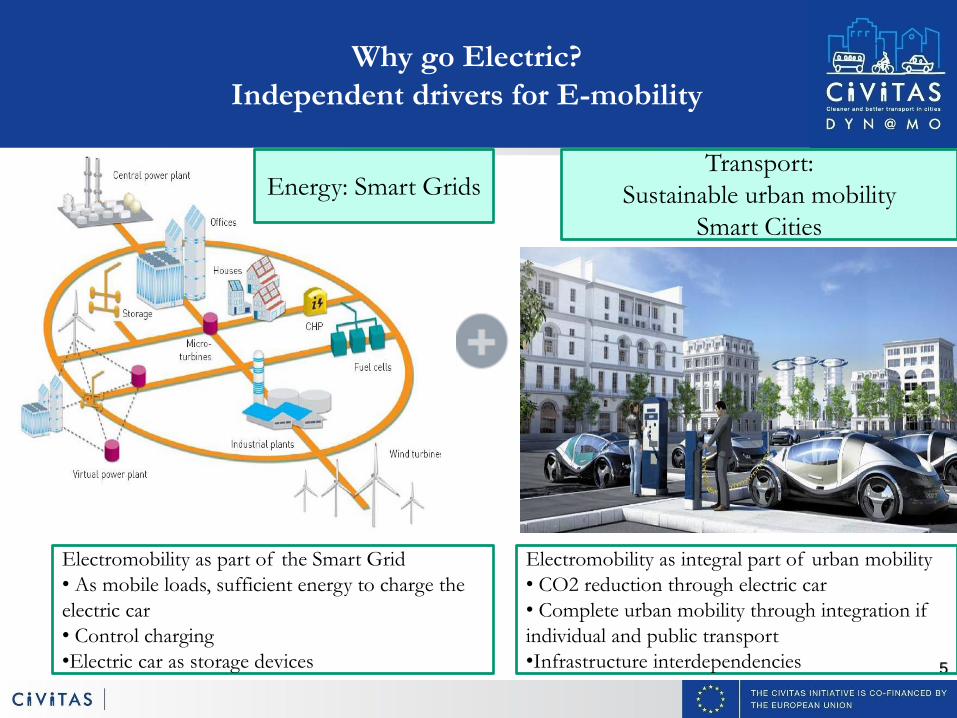
Why go Electric?
Independent drivers for E-mobility
Energy: Smart Grids Transport:
Sustainable urban mobility
Smart Cities
Electromobility as part of the Smart Grid
• As mobile loads, sufficient energy to charge the
electric car
• Control charging
•Electric car as storage devices
Electromobility as integral part of urban mobility
• CO2 reduction through electric car
• Complete urban mobility through integration if
individual and public transport
•Infrastructure interdependencies
6
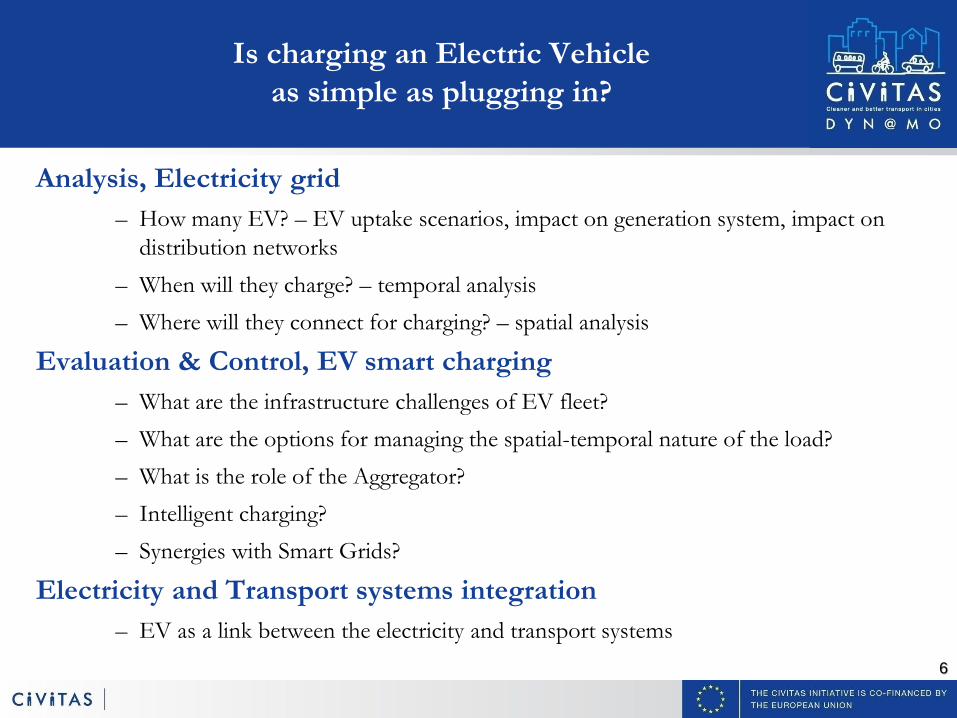
Is charging an Electric Vehicle
as simple as plugging in?
Analysis, Electricity grid
– How many EV? – EV uptake scenarios, impact on generation system, impact on
distribution networks
– When will they charge? – temporal analysis
– Where will they connect for charging? – spatial analysis
Evaluation & Control, EV smart charging
– What are the infrastructure challenges of EV fleet?
– What are the options for managing the spatial-temporal nature of the load?
– What is the role of the Aggregator?
– Intelligent charging?
– Synergies with Smart Grids?
Electricity and Transport systems integration
– EV as a link between the electricity and transport systems
7
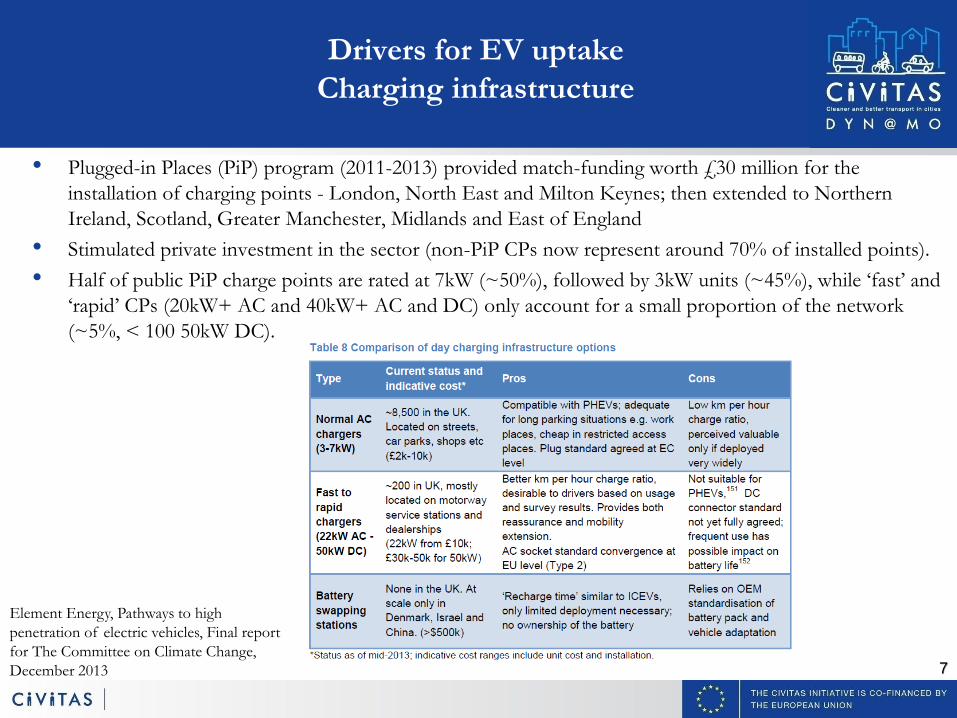
• Plugged-in Places (PiP) program (2011-2013) provided match-funding worth £30 million for the
installation of charging points - London, North East and Milton Keynes; then extended to Northern
Ireland, Scotland, Greater Manchester, Midlands and East of England
• Stimulated private investment in the sector (non-PiP CPs now represent around 70% of installed points).
• Half of public PiP charge points are rated at 7kW (~50%), followed by 3kW units (~45%), while ‘fast’ and
‘rapid’ CPs (20kW+ AC and 40kW+ AC and DC) only account for a small proportion of the network
(~5%, < 100 50kW DC).
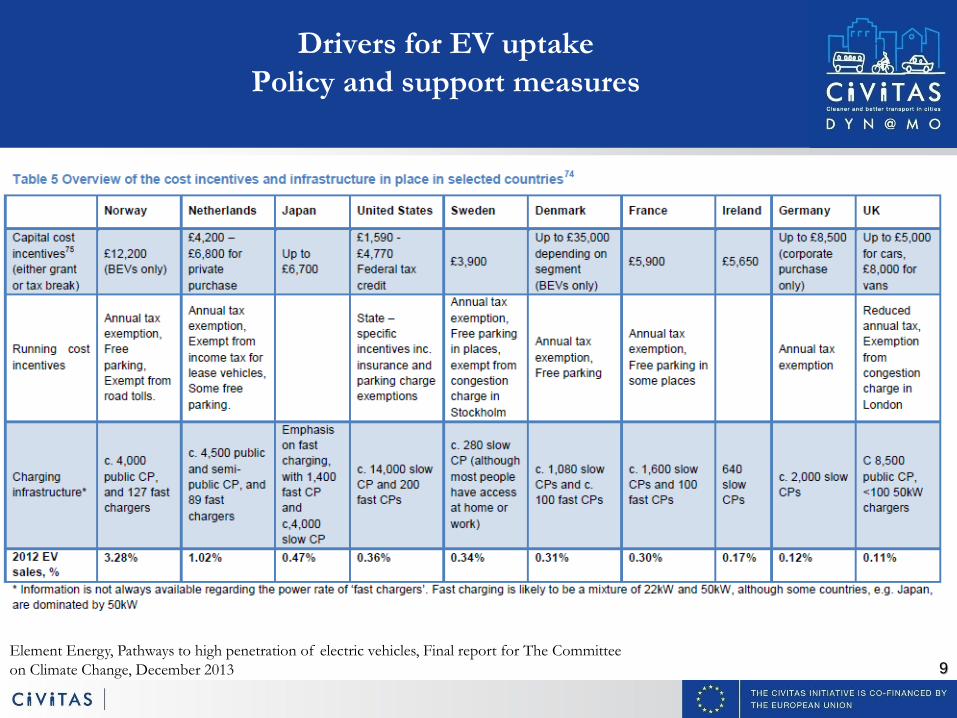
Drivers for EV uptake
Charging infrastructure
Element Energy, Pathways to high
penetration of electric vehicles, Final report
for The Committee on Climate Change,
December 2013
8
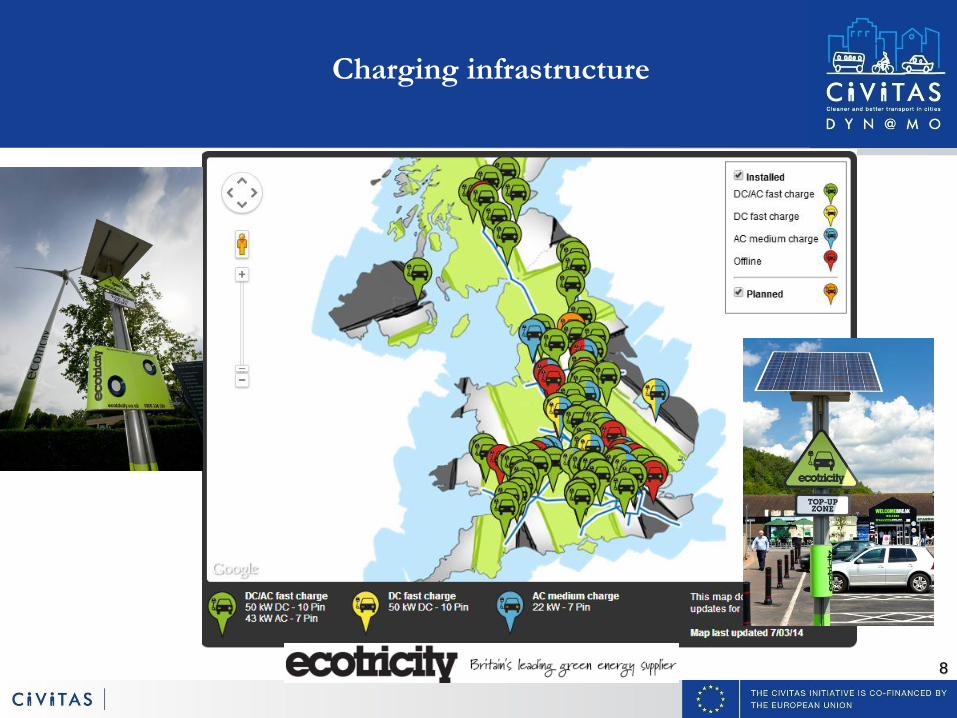
Charging infrastructure
9
Drivers for EV uptake
Policy and support measures
Element Energy, Pathways to high penetration of electric vehicles, Final report for The Committee
on Climate Change, December 2013
10
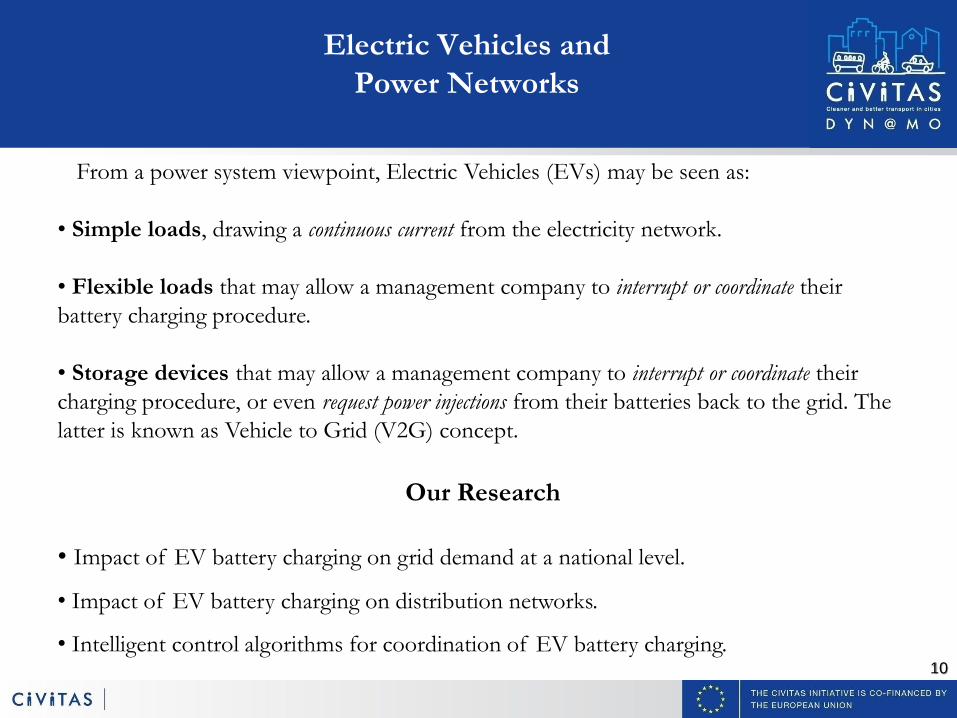
From a power system viewpoint, Electric Vehicles (EVs) may be seen as:
• Simple loads, drawing a continuous current from the electricity network.
• Flexible loads that may allow a management company to interrupt or coordinate their
battery charging procedure.
• Storage devices that may allow a management company to interrupt or coordinate their
charging procedure, or even request power injections from their batteries back to the grid. The
latter is known as Vehicle to Grid (V2G) concept.
Our Research
• Impact of EV battery charging on grid demand at a national level.
• Impact of EV battery charging on distribution networks.
• Intelligent control algorithms for coordination of EV battery charging.
Electric Vehicles and
Power Networks
11
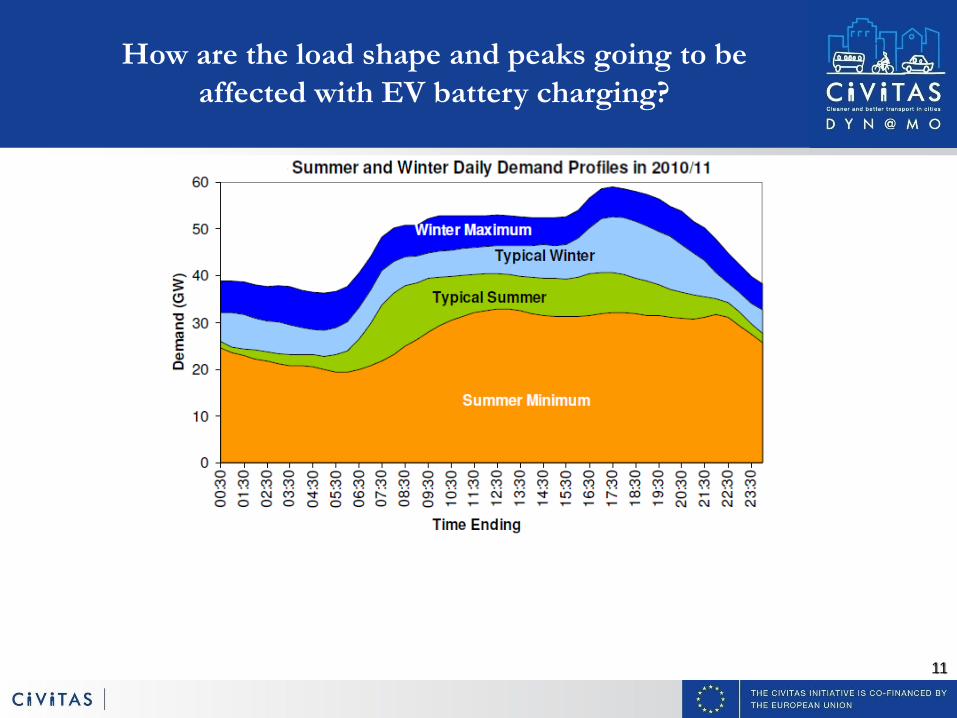
How are the load shape and peaks going to be
affected with EV battery charging?
12
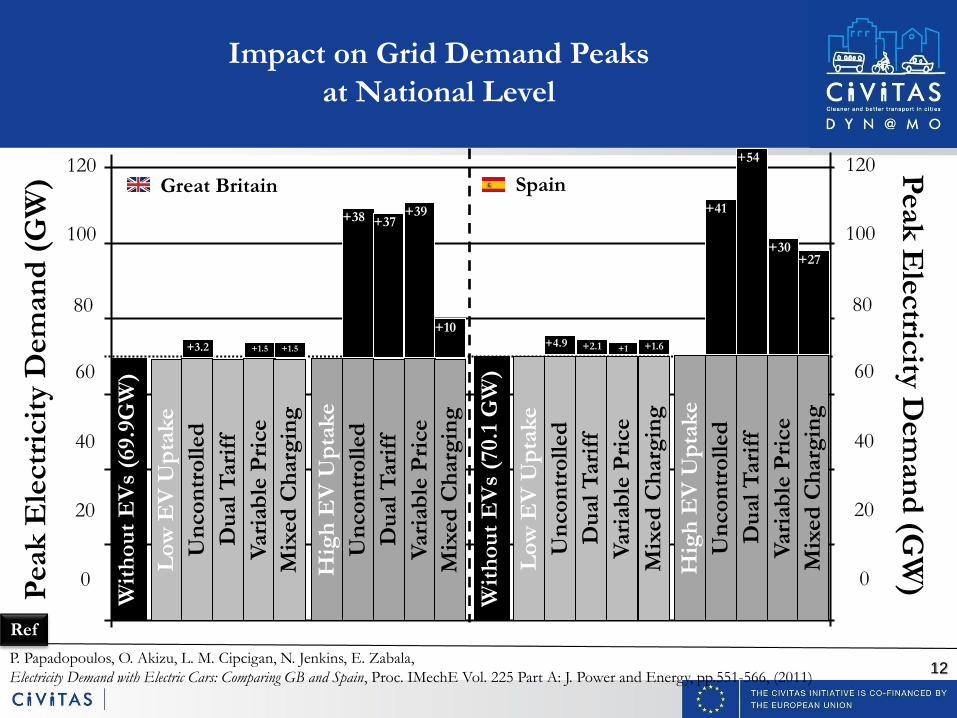
Impact on Grid Demand Peaks
at National Level
Spain Great Britain
Wit
ho
ut
EV
s (6
9.9
GW
)
Lo
w E
V U
pta
ke
Un
co
ntr
oll
ed
Du
al
Tari
ff
Vari
ab
le P
rice
Mix
ed
Ch
arg
ing
Wit
ho
ut
EV
s (7
0.1
GW
)
Lo
w E
V U
pta
ke
Un
co
ntr
oll
ed
Du
al
Tari
ff
Vari
ab
le P
rice
Mix
ed
Ch
arg
ing
+3.2 +1.5 +4.9
+1 +1.6 +1.5 +2.1
120
100
80
60
40
20
0 Peak
Ele
ctr
icit
y D
em
an
d (
GW
)
120
100
80
60
40
20
0
Peak
Ele
ctric
ity D
em
an
d (G
W)
Un
co
ntr
oll
ed
Du
al
Tari
ff
Vari
ab
le P
rice
Mix
ed
Ch
arg
ing
Hig
h E
V U
pta
ke
Un
co
ntr
oll
ed
Du
al
Tari
ff
Vari
ab
le P
rice
Mix
ed
Ch
arg
ing
+38 +37 +39
+10
+41
+30 +27
+54
Hig
h E
V U
pta
ke
P. Papadopoulos, O. Akizu, L. M. Cipcigan, N. Jenkins, E. Zabala,
Electricity Demand with Electric Cars: Comparing GB and Spain, Proc. IMechE Vol. 225 Part A: J. Power and Energy, pp.551-566, (2011)
Ref
13
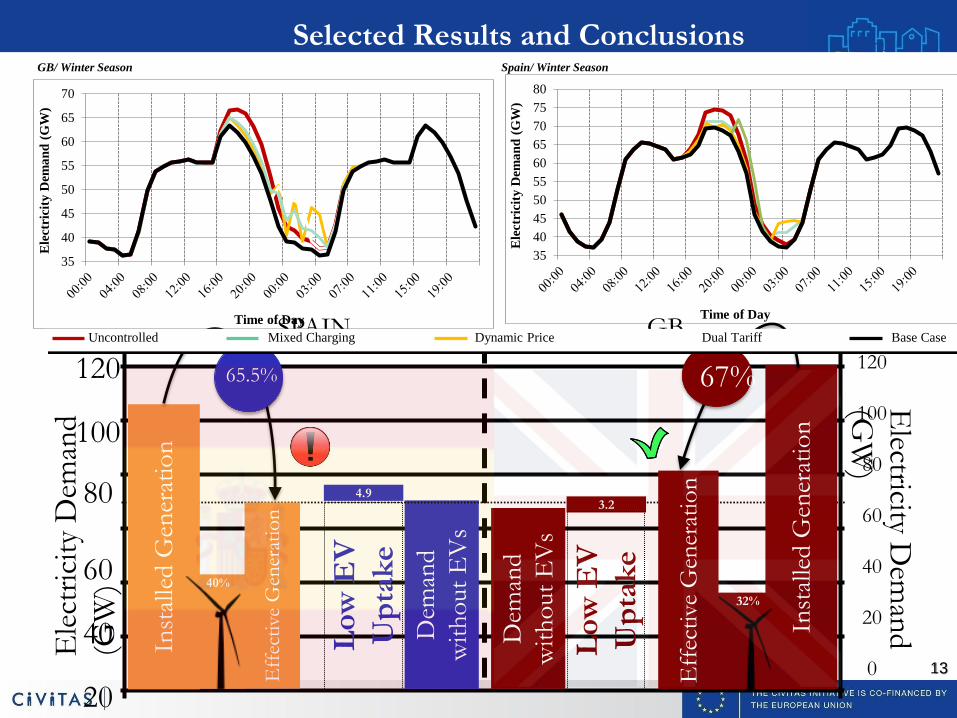
Selected Results and Conclusions
120
100
80
60
40
20
0
Ele
ctri
city
Dem
and
(GW
)
Dem
and
wit
ho
ut
EV
s
Dem
and
wit
ho
ut
EV
s
3.2
Lo
w E
V
Up
tak
e
4.9
Lo
w E
V
Up
tak
e
Inst
alle
d G
ener
atio
n
Inst
alle
d G
ener
atio
n
40%
120
100
80
60
40
20
0
Electricity D
eman
d
(GW
)
32%
Eff
ecti
ve G
ener
atio
n
Eff
ecti
ve G
ener
atio
n
GB SPAIN
67%
35
40
45
50
55
60
65
70
Ele
ctri
city
Dem
an
d (
GW
)
Time of Day
GB/ Winter Season
Uncontrolled Mixed Charging Dynamic Price Dual Tariff Base Case
35
40
45
50
55
60
65
70
75
80
Ele
ctri
city
Dem
an
d (
GW
)
Time of Day
Spain/ Winter Season
14
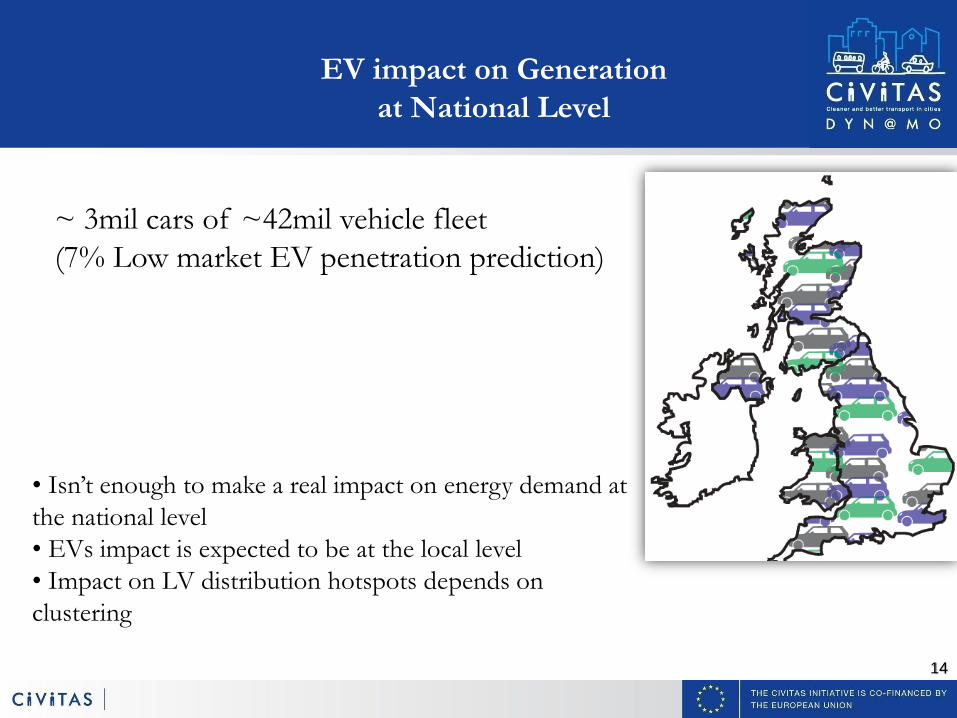
~ 3mil cars of ~42mil vehicle fleet
(7% Low market EV penetration prediction)
• Isn’t enough to make a real impact on energy demand at
the national level
• EVs impact is expected to be at the local level
• Impact on LV distribution hotspots depends on
clustering
EV impact on Generation
at National Level
15
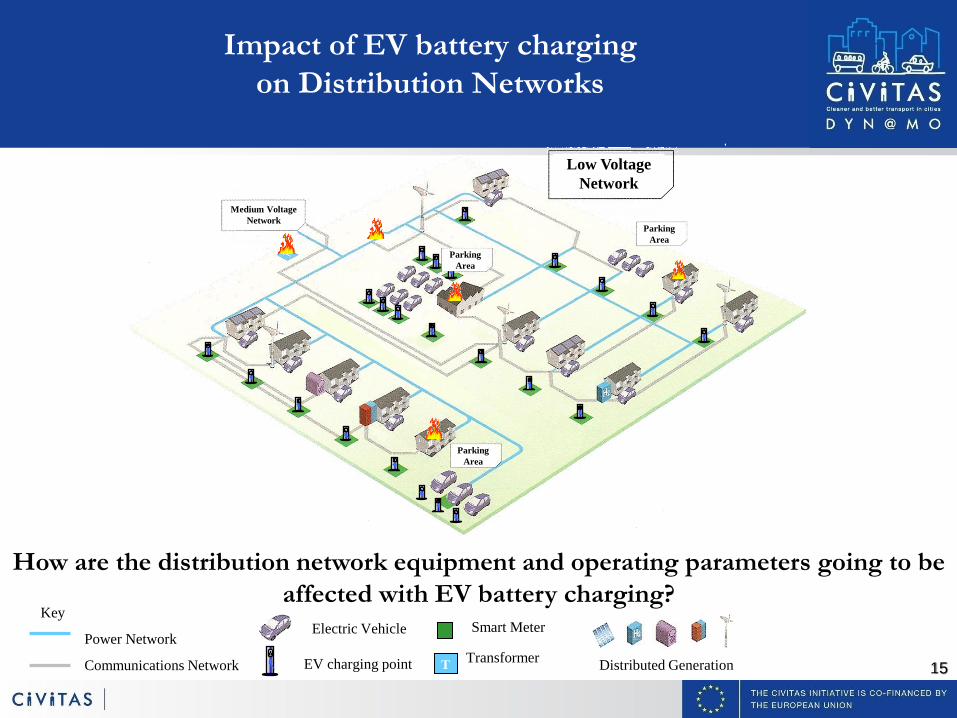
Medium Voltage
Network
Low Voltage
Network
Parking
Area
Parking
Area
Parking
Area
How are the distribution network equipment and operating parameters going to be
affected with EV battery charging?
Transformer
Key
Power Network
Communications Network
EV charging point
Electric Vehicle Smart Meter
T Distributed Generation
Impact of EV battery charging
on Distribution Networks
16
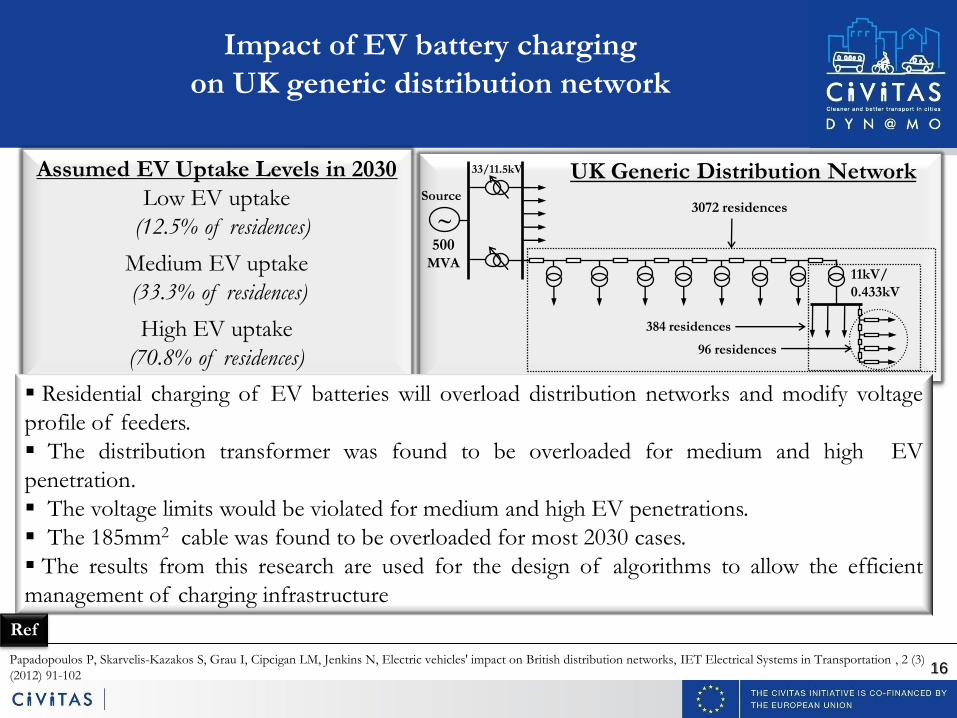
Assumed EV Uptake Levels in 2030
Low EV uptake
(12.5% of residences)
Medium EV uptake
(33.3% of residences)
High EV uptake
(70.8% of residences)
11kV/
0.433kV
Source
500 MVA
33/11.5kV
~
96 residences
384 residences
3072 residences
UK Generic Distribution Network
Residential charging of EV batteries will overload distribution networks and modify voltage
profile of feeders.
The distribution transformer was found to be overloaded for medium and high EV
penetration.
The voltage limits would be violated for medium and high EV penetrations.
The 185mm2 cable was found to be overloaded for most 2030 cases.
The results from this research are used for the design of algorithms to allow the efficient
management of charging infrastructure
Papadopoulos P, Skarvelis-Kazakos S, Grau I, Cipcigan LM, Jenkins N, Electric vehicles' impact on British distribution networks, IET Electrical Systems in Transportation , 2 (3)
(2012) 91-102
Ref
Impact of EV battery charging
on UK generic distribution network
17
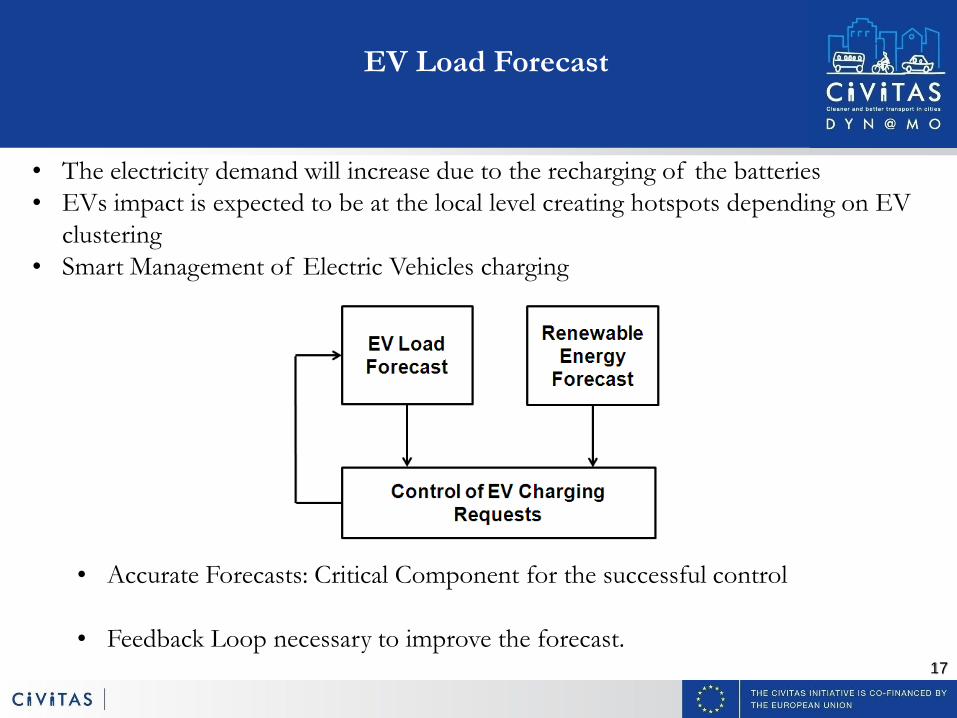
EV Load Forecast
• Accurate Forecasts: Critical Component for the successful control
• Feedback Loop necessary to improve the forecast.
• The electricity demand will increase due to the recharging of the batteries
• EVs impact is expected to be at the local level creating hotspots depending on EV
clustering
• Smart Management of Electric Vehicles charging
18
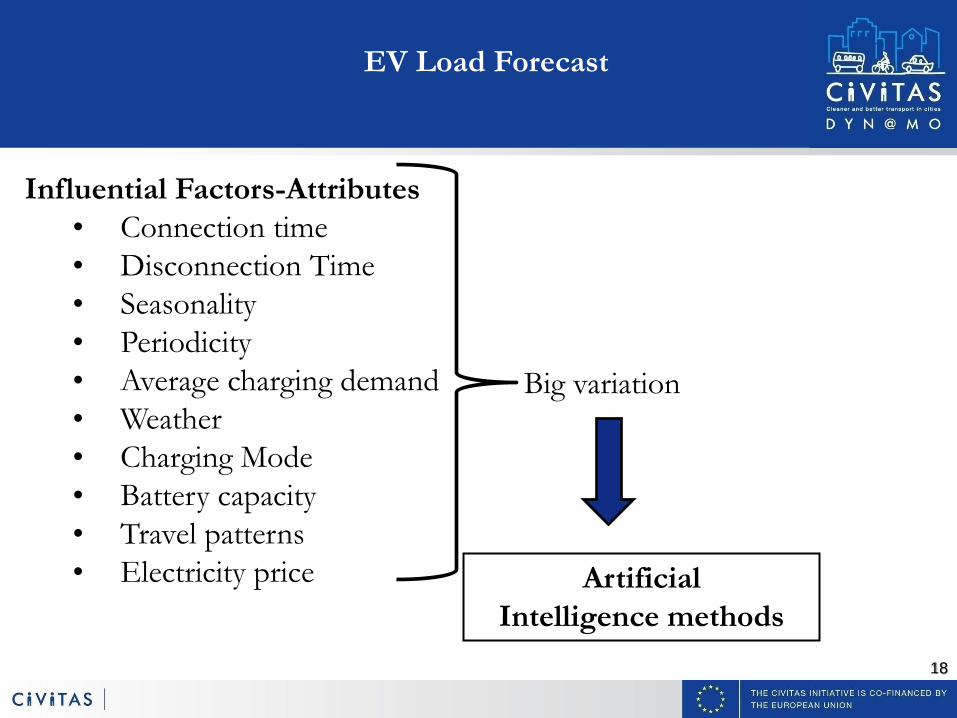
Influential Factors-Attributes
• Connection time
• Disconnection Time
• Seasonality
• Periodicity
• Average charging demand
• Weather
• Charging Mode
• Battery capacity
• Travel patterns
• Electricity price
Big variation
Artificial
Intelligence methods
EV Load Forecast
19
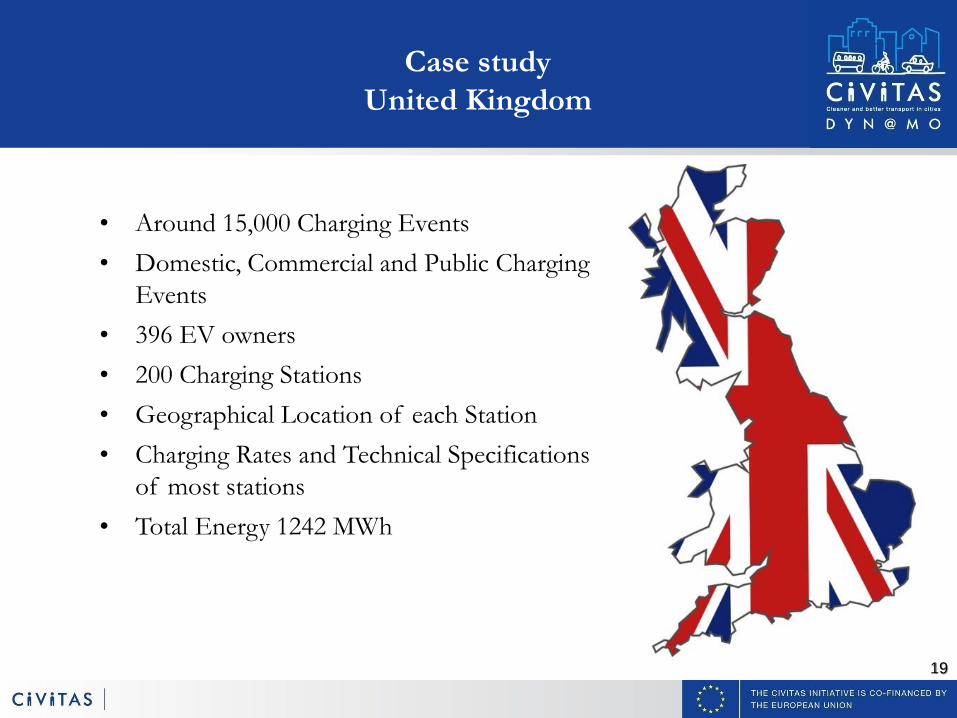
Case study
United Kingdom
• Around 15,000 Charging Events
• Domestic, Commercial and Public Charging
Events
• 396 EV owners
• 200 Charging Stations
• Geographical Location of each Station
• Charging Rates and Technical Specifications
of most stations
• Total Energy 1242 MWh
20
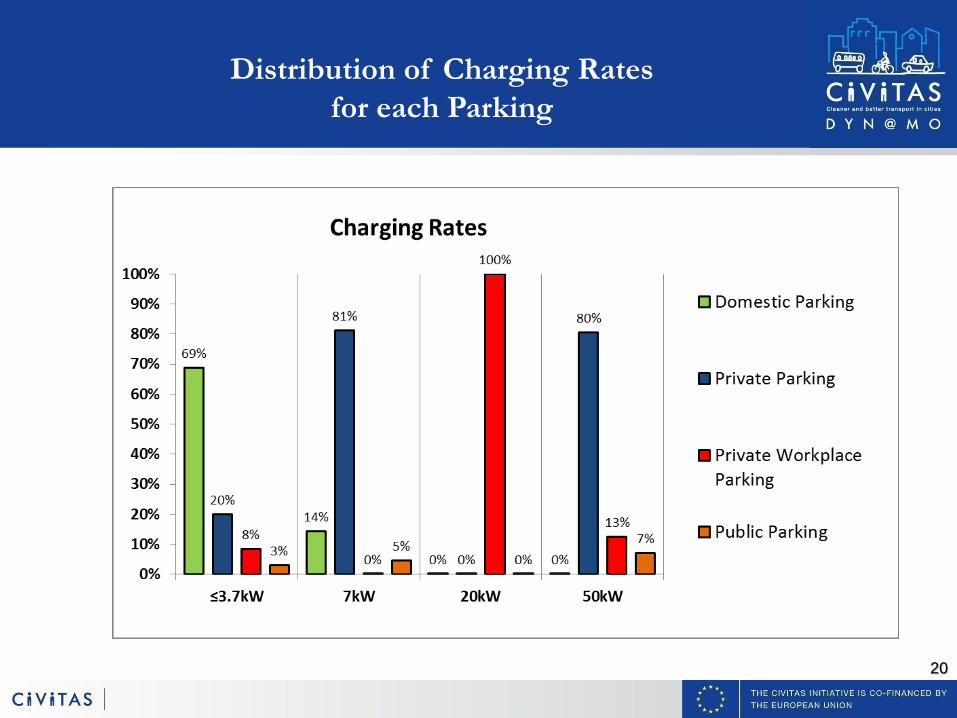
Distribution of Charging Rates
for each Parking
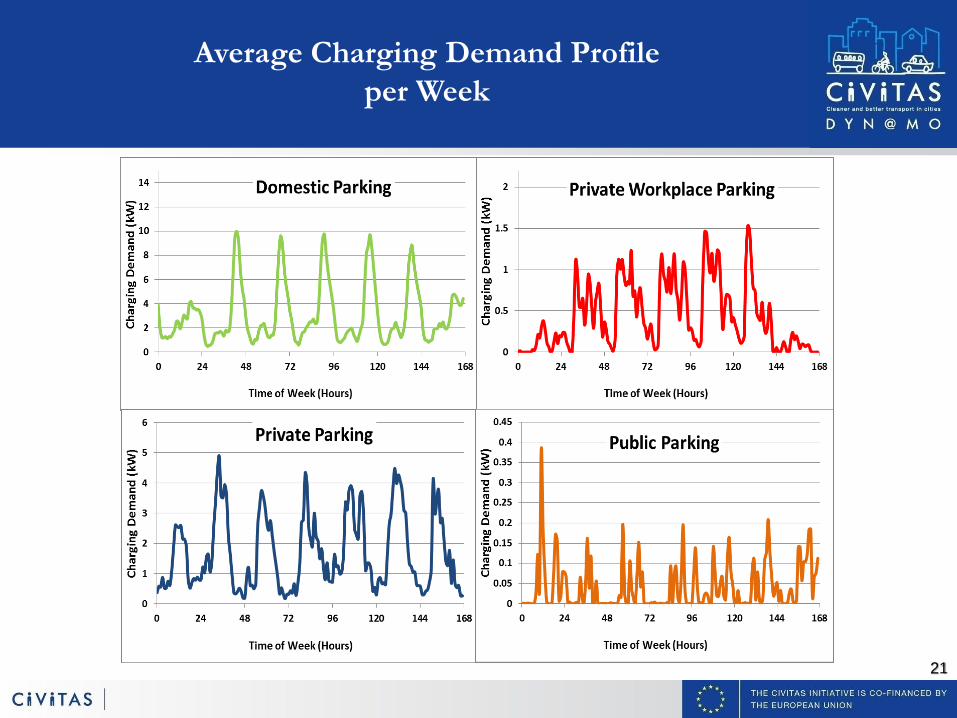
21
Average Charging Demand Profile
per Week
22
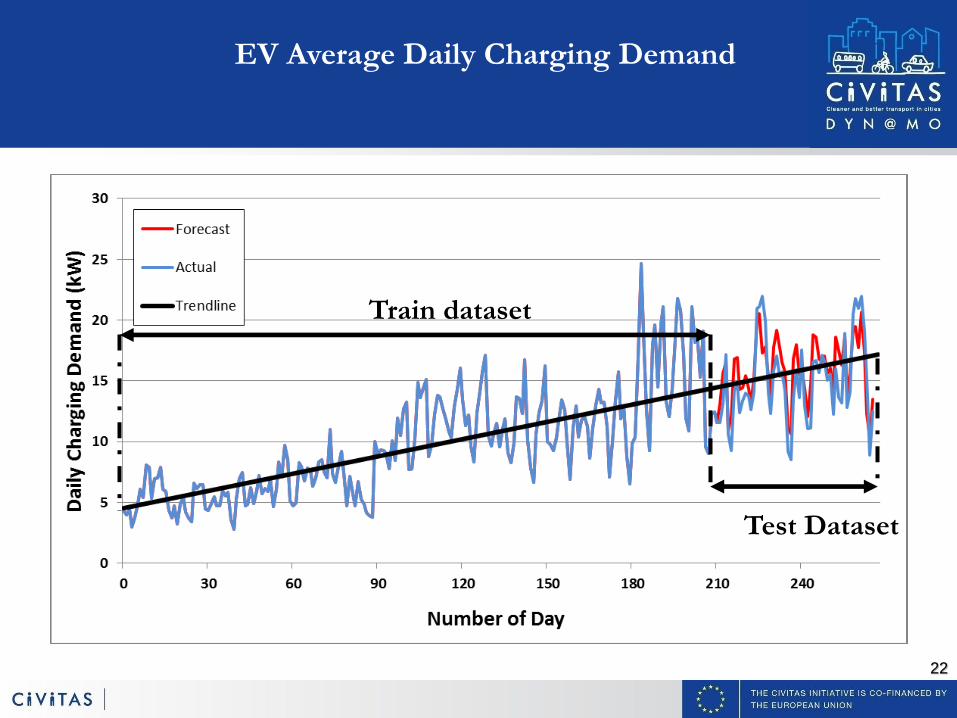
EV Average Daily Charging Demand
Train dataset
Test Dataset
23
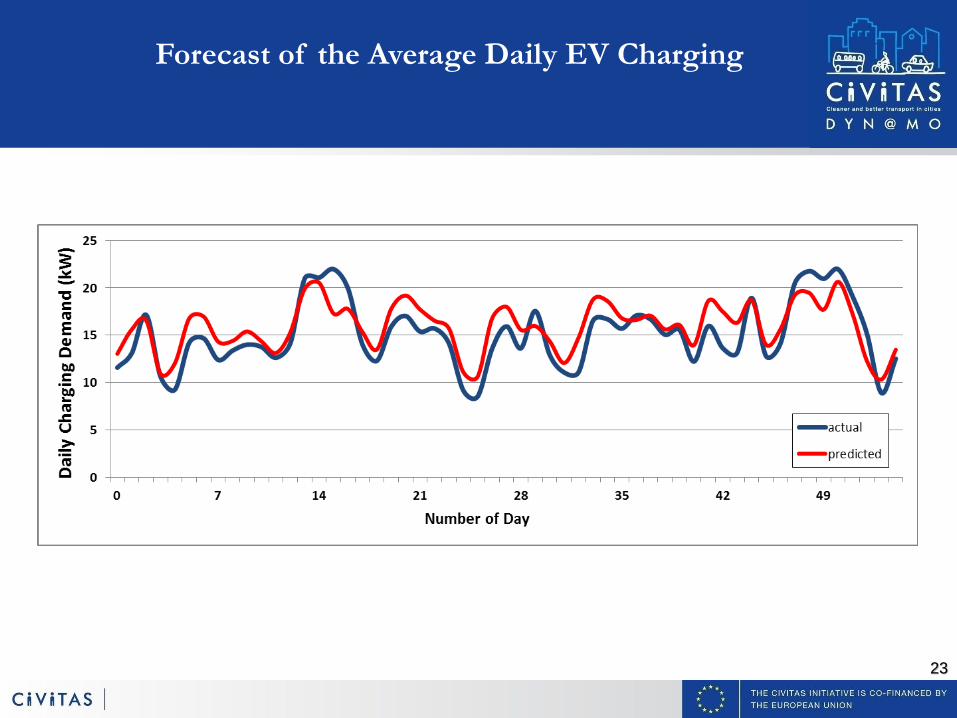
Forecast of the Average Daily EV Charging
24
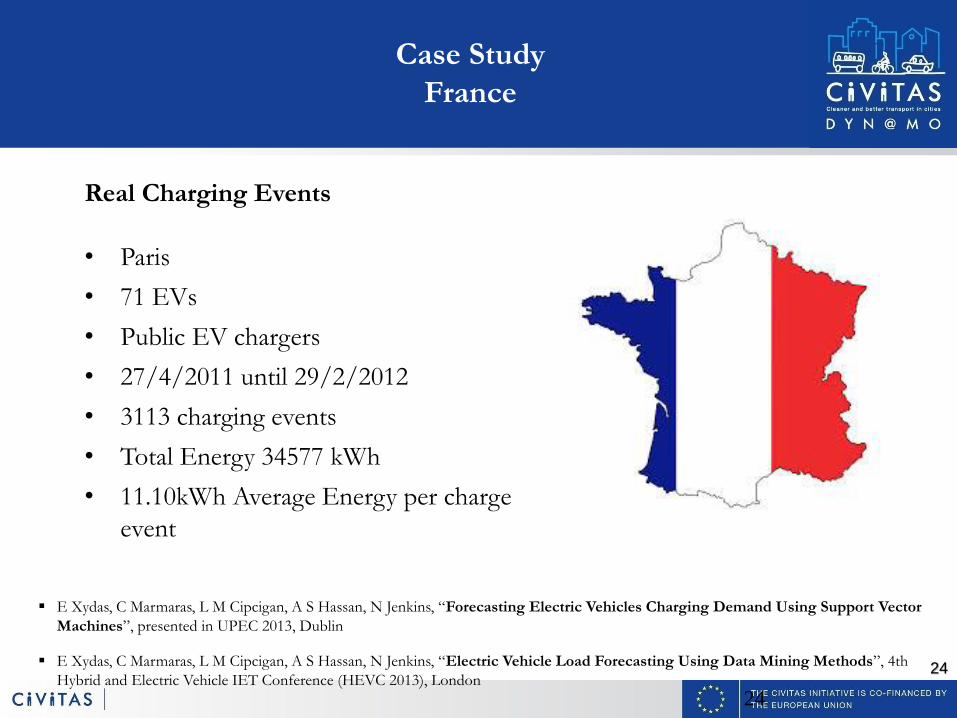
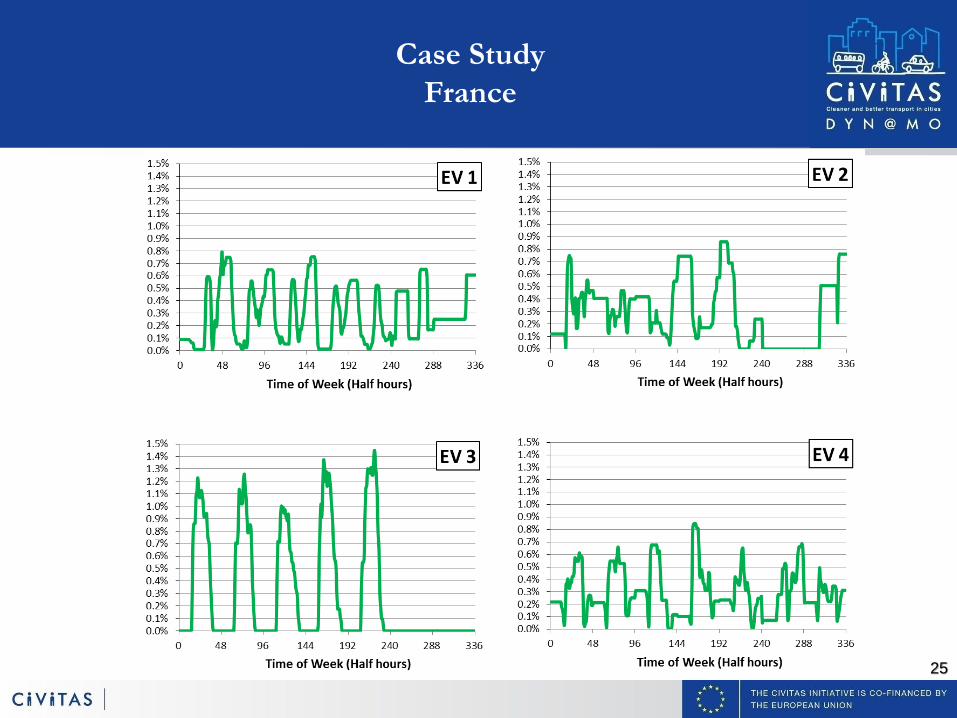
Case Study
France
24
Real Charging Events
• Paris
• 71 EVs
• Public EV chargers
• 27/4/2011 until 29/2/2012
• 3113 charging events
• Total Energy 34577 kWh
• 11.10kWh Average Energy per charge
event
E Xydas, C Marmaras, L M Cipcigan, A S Hassan, N Jenkins, “Forecasting Electric Vehicles Charging Demand Using Support Vector
Machines”, presented in UPEC 2013, Dublin
E Xydas, C Marmaras, L M Cipcigan, A S Hassan, N Jenkins, “Electric Vehicle Load Forecasting Using Data Mining Methods”, 4th
Hybrid and Electric Vehicle IET Conference (HEVC 2013), London
25
Case Study
France
26
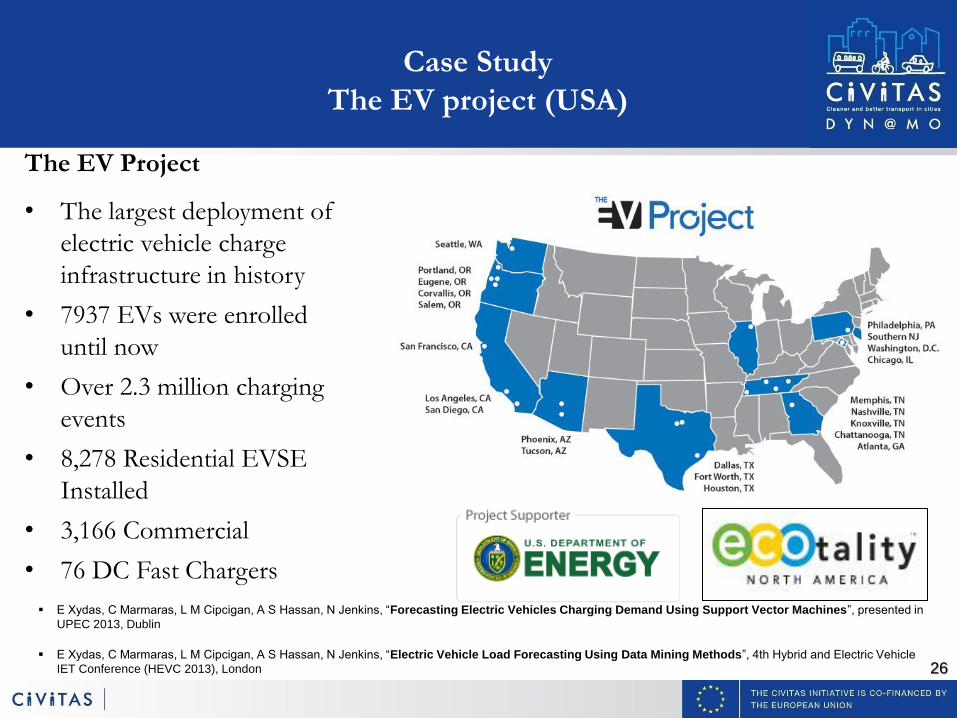
Case Study
The EV project (USA)
The EV Project
• The largest deployment of
electric vehicle charge
infrastructure in history
• 7937 EVs were enrolled
until now
• Over 2.3 million charging
events
• 8,278 Residential EVSE
Installed
• 3,166 Commercial
• 76 DC Fast Chargers
E Xydas, C Marmaras, L M Cipcigan, A S Hassan, N Jenkins, “Forecasting Electric Vehicles Charging Demand Using Support Vector Machines”, presented in
UPEC 2013, Dublin
E Xydas, C Marmaras, L M Cipcigan, A S Hassan, N Jenkins, “Electric Vehicle Load Forecasting Using Data Mining Methods”, 4th Hybrid and Electric Vehicle
IET Conference (HEVC 2013), London
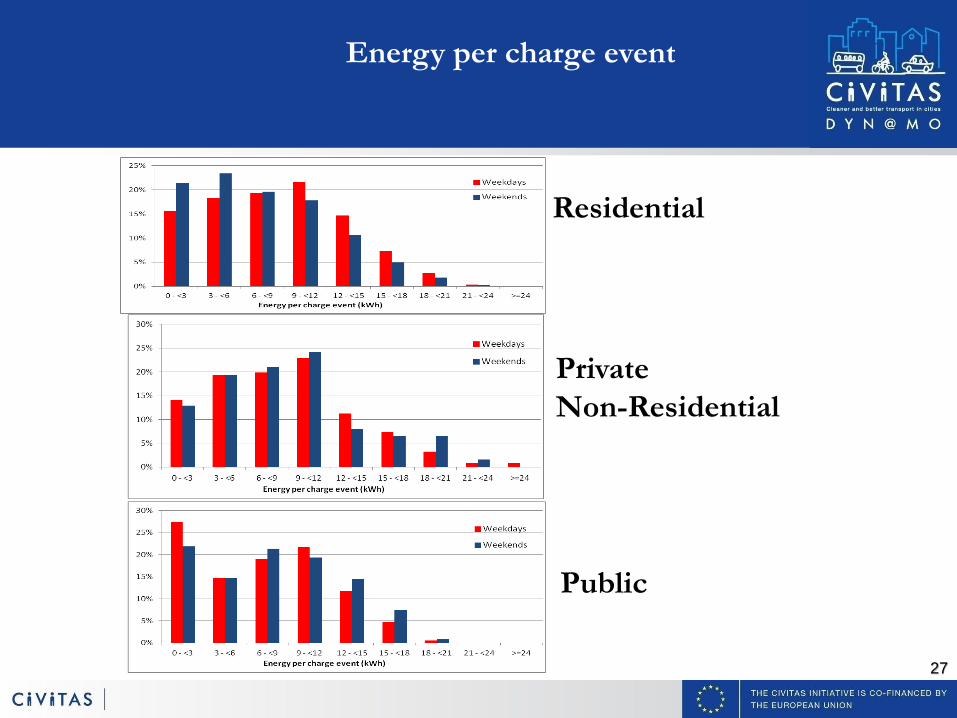
27
Energy per charge event
Residential
Private
Non-Residential
Public
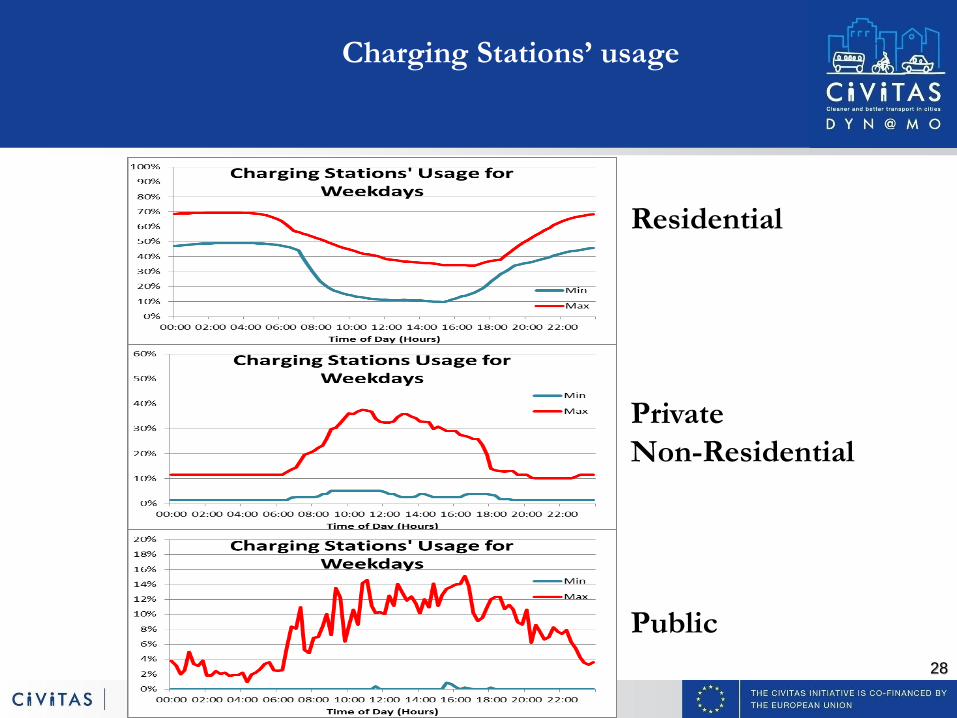
28
Charging Stations’ usage
Residential
Private
Non-Residential
Public
29
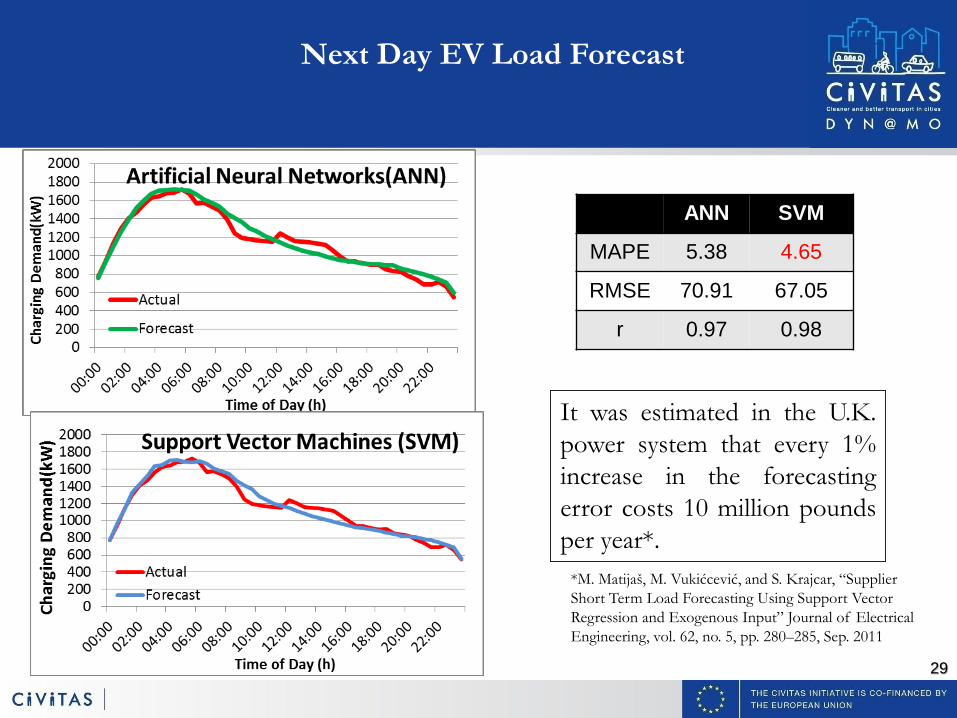
Next Day EV Load Forecast
ANN SVM
MAPE 5.38 4.65
RMSE 70.91 67.05
r 0.97 0.98
It was estimated in the U.K.
power system that every 1%
increase in the forecasting
error costs 10 million pounds
per year*.
*M. Matijaš, M. Vukićcević, and S. Krajcar, “Supplier
Short Term Load Forecasting Using Support Vector
Regression and Exogenous Input” Journal of Electrical
Engineering, vol. 62, no. 5, pp. 280–285, Sep. 2011
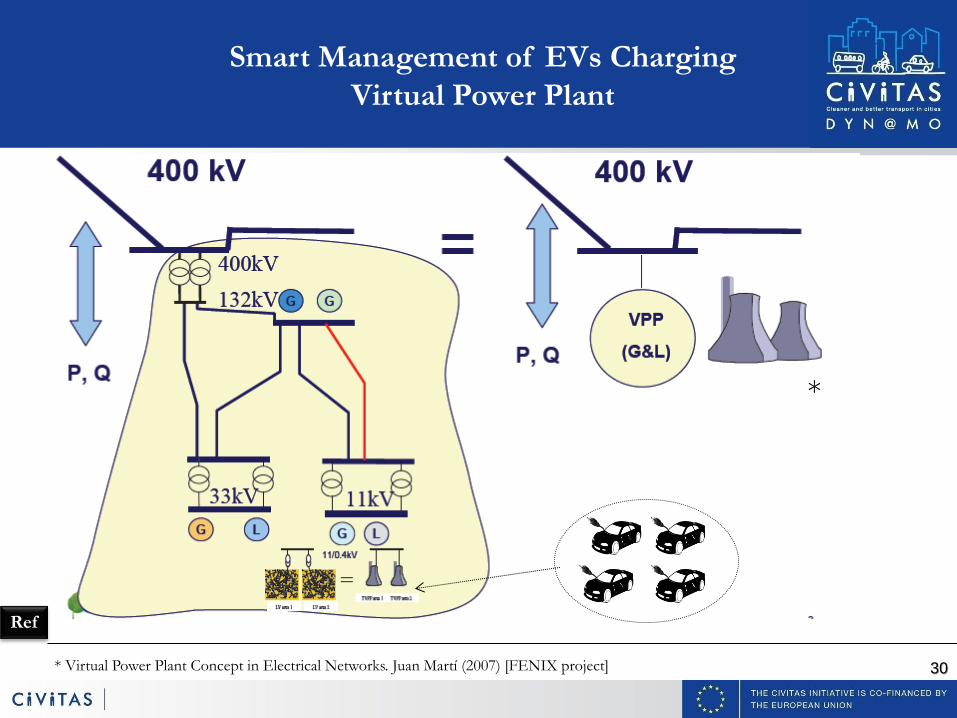
30 * Virtual Power Plant Concept in Electrical Networks. Juan Martí (2007) [FENIX project]
Smart Management of EVs Charging
Virtual Power Plant
• EVs ???
*
Ref
31
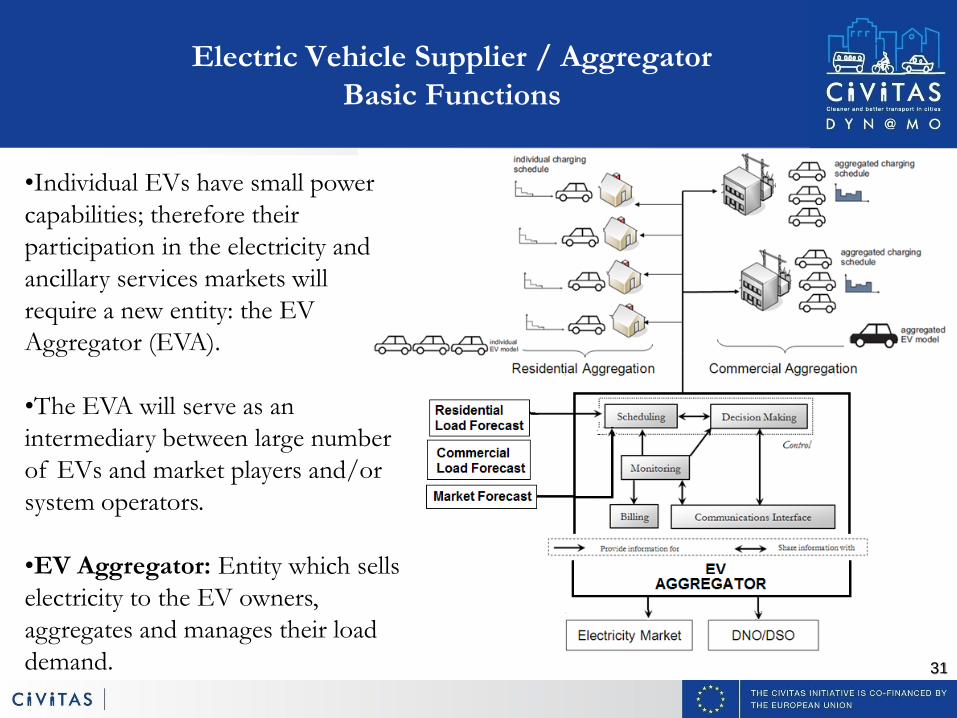
Electric Vehicle Supplier / Aggregator
Basic Functions
•Individual EVs have small power
capabilities; therefore their
participation in the electricity and
ancillary services markets will
require a new entity: the EV
Aggregator (EVA).
•The EVA will serve as an
intermediary between large number
of EVs and market players and/or
system operators.
•EV Aggregator: Entity which sells
electricity to the EV owners,
aggregates and manages their load
demand.
32
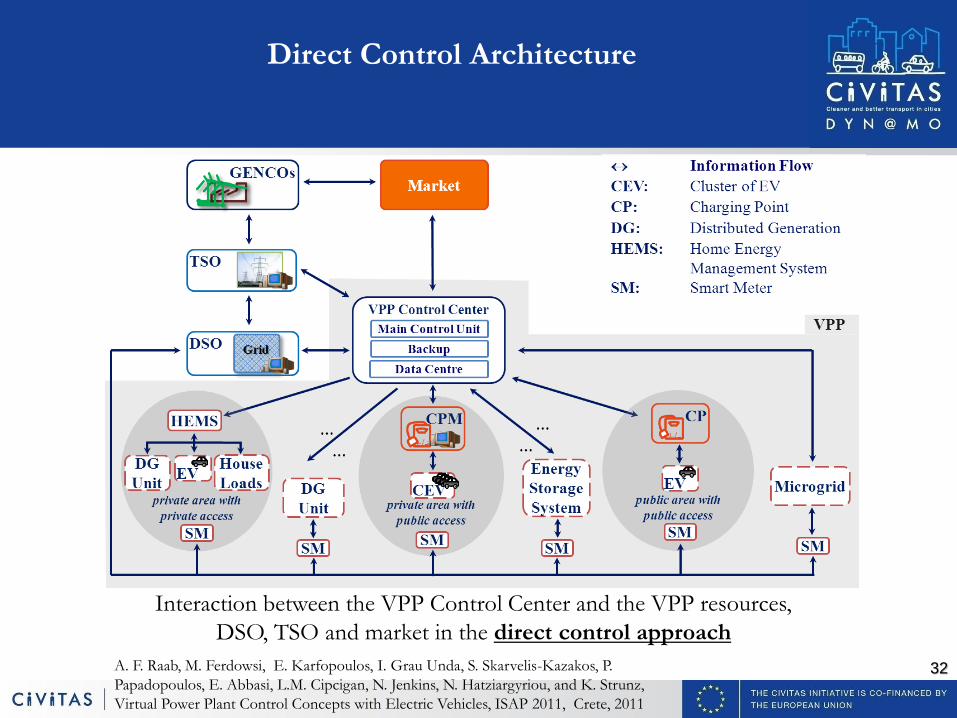
Interaction between the VPP Control Center and the VPP resources,
DSO, TSO and market in the direct control approach
Direct Control Architecture
A. F. Raab, M. Ferdowsi, E. Karfopoulos, I. Grau Unda, S. Skarvelis-Kazakos, P.
Papadopoulos, E. Abbasi, L.M. Cipcigan, N. Jenkins, N. Hatziargyriou, and K. Strunz,
Virtual Power Plant Control Concepts with Electric Vehicles, ISAP 2011, Crete, 2011
33
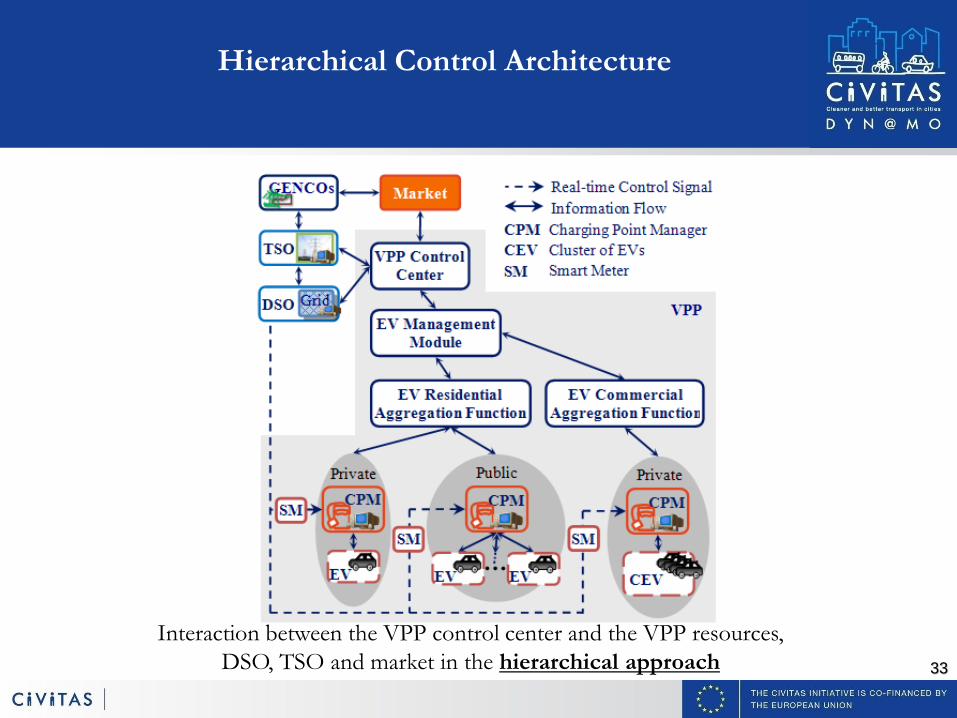
Hierarchical Control Architecture
Interaction between the VPP control center and the VPP resources,
DSO, TSO and market in the hierarchical approach
34
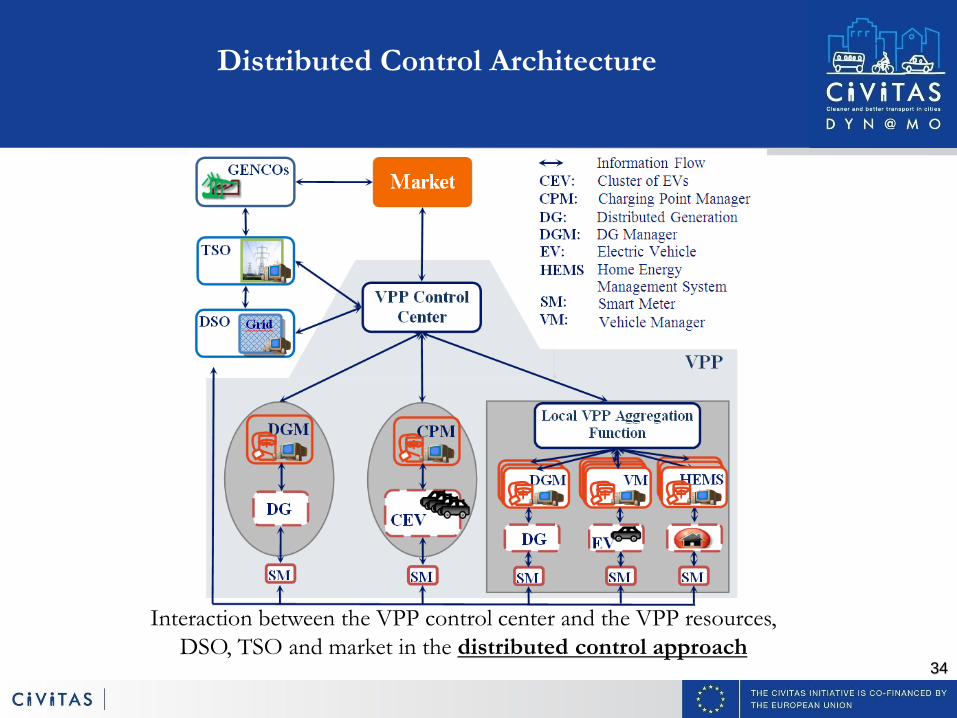
Distributed Control Architecture
Interaction between the VPP control center and the VPP resources,
DSO, TSO and market in the distributed control approach
35
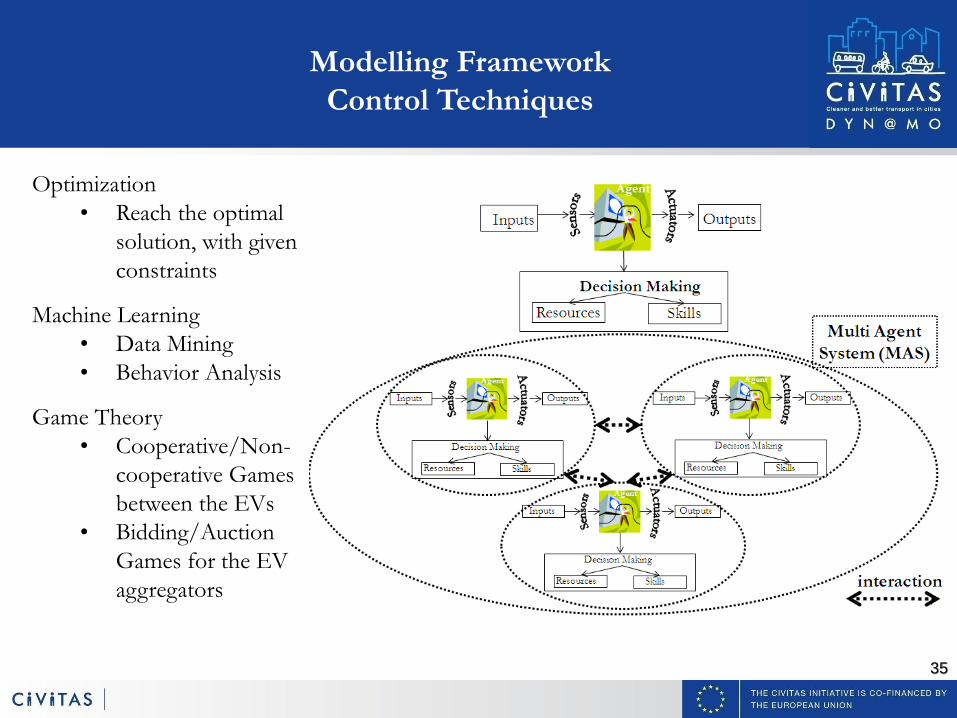
Modelling Framework
Control Techniques
Optimization
• Reach the optimal
solution, with given
constraints
Machine Learning
• Data Mining
• Behavior Analysis
Game Theory
• Cooperative/Non-
cooperative Games
between the EVs
• Bidding/Auction
Games for the EV
aggregators
36
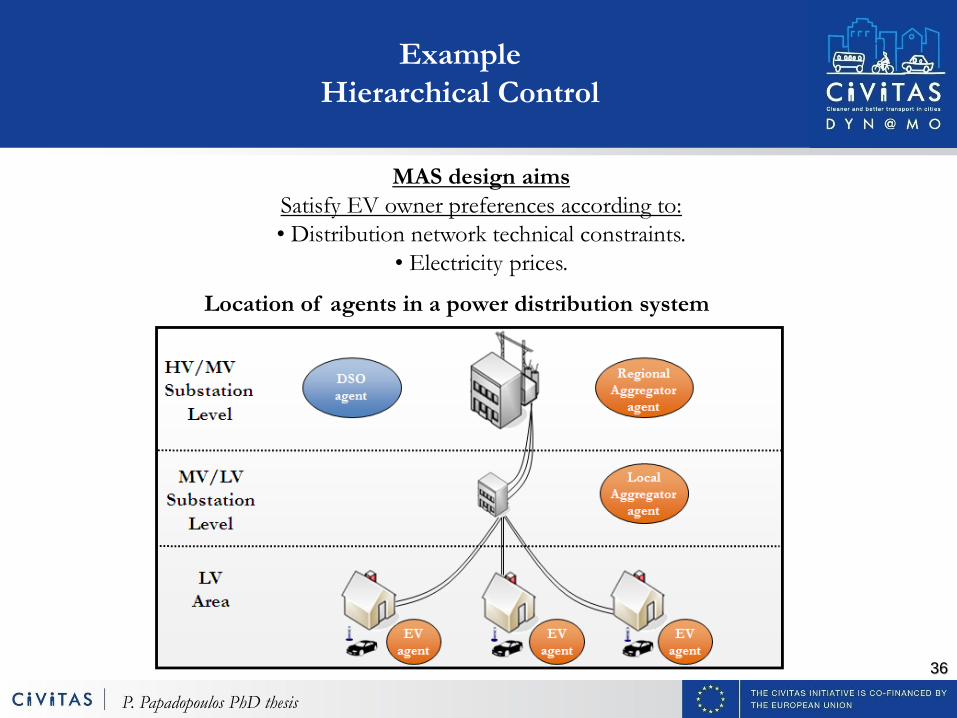
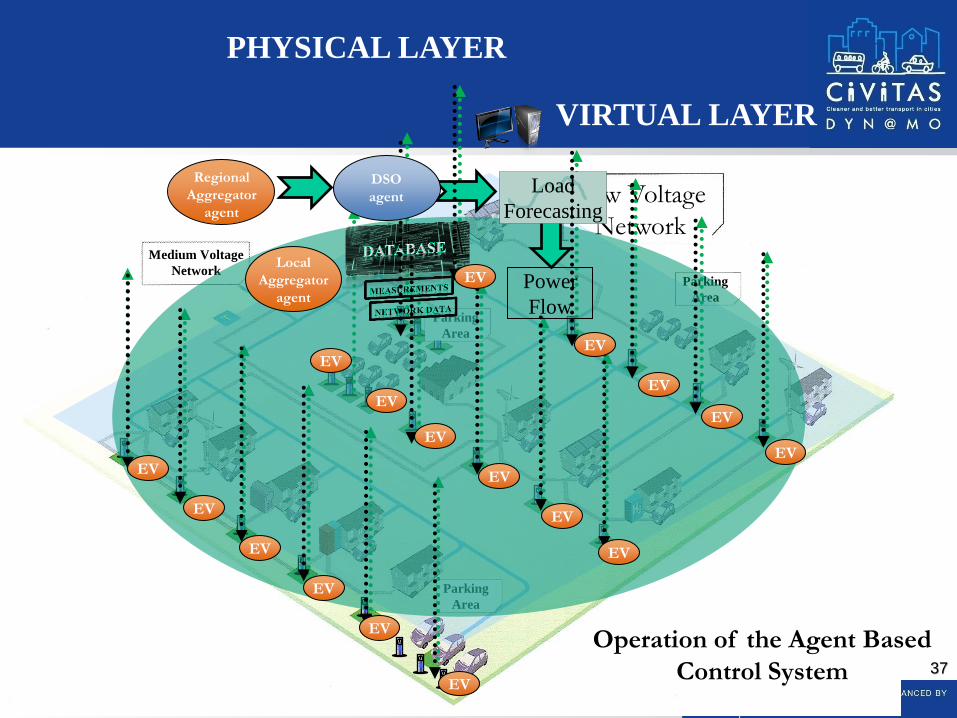
Location of agents in a power distribution system
MAS design aims
Satisfy EV owner preferences according to:
• Distribution network technical constraints.
• Electricity prices.
P. Papadopoulos PhD thesis
Example
Hierarchical Control
37
Medium Voltage
Network
Low Voltage
Network
Parking
Area
Parking
Area
Parking
Area
PHYSICAL LAYER
VIRTUAL LAYER
p
a
n
pan
Power
Flow
Load
Forecasting
EV
EV
EV
EV
EV
EV
EV
EV
EV
EV
EV
EV
EV
EV
EV
EV
EV
Local
Aggregator
agent
Regional
Aggregator
agent
DSO
agent
Operation of the Agent Based
Control System
38
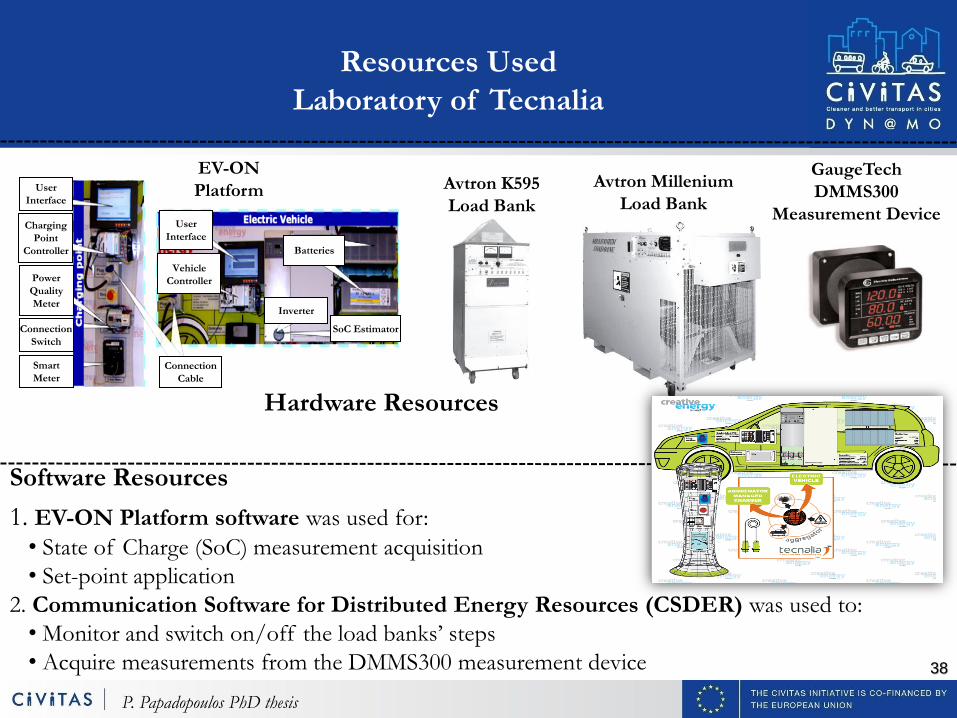
Resources Used
Laboratory of Tecnalia
User
Interface
Vehicle
Controller
Connection
Cable
Inverter
SoC Estimator
Batteries
User
Interface
Charging
Point
Controller
Power
Quality
Meter
Connection
Switch
Smart
Meter
Avtron K595
Load Bank
Avtron Millenium
Load Bank
GaugeTech
DMMS300
Measurement Device
EV-ON
Platform
Hardware Resources
Software Resources
1. EV-ON Platform software was used for:
• State of Charge (SoC) measurement acquisition
• Set-point application
2. Communication Software for Distributed Energy Resources (CSDER) was used to:
• Monitor and switch on/off the load banks’ steps
• Acquire measurements from the DMMS300 measurement device
P. Papadopoulos PhD thesis
39
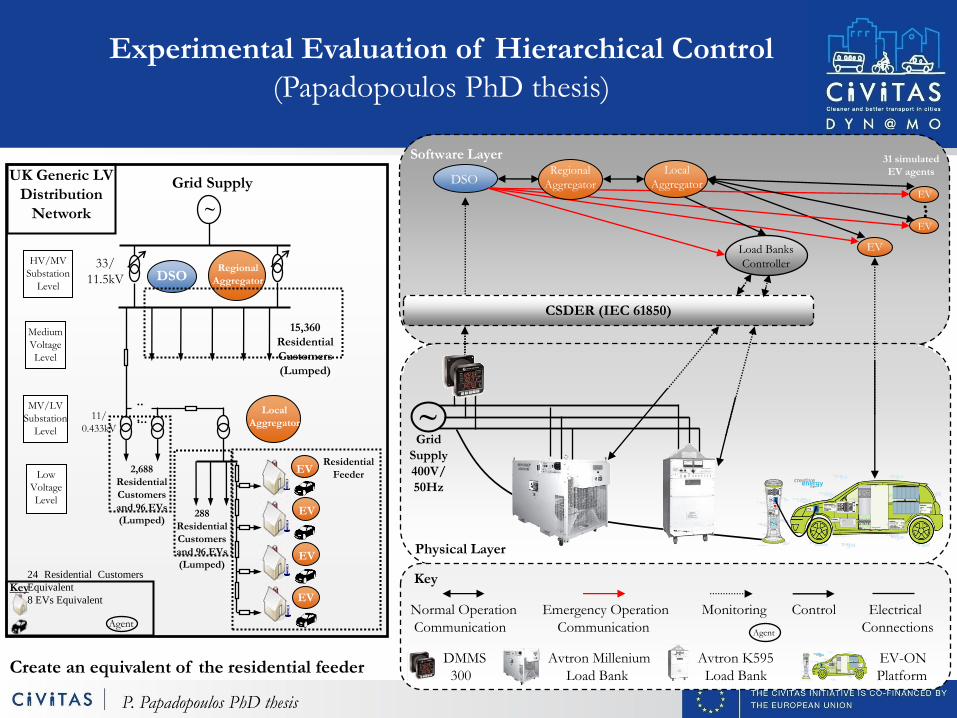
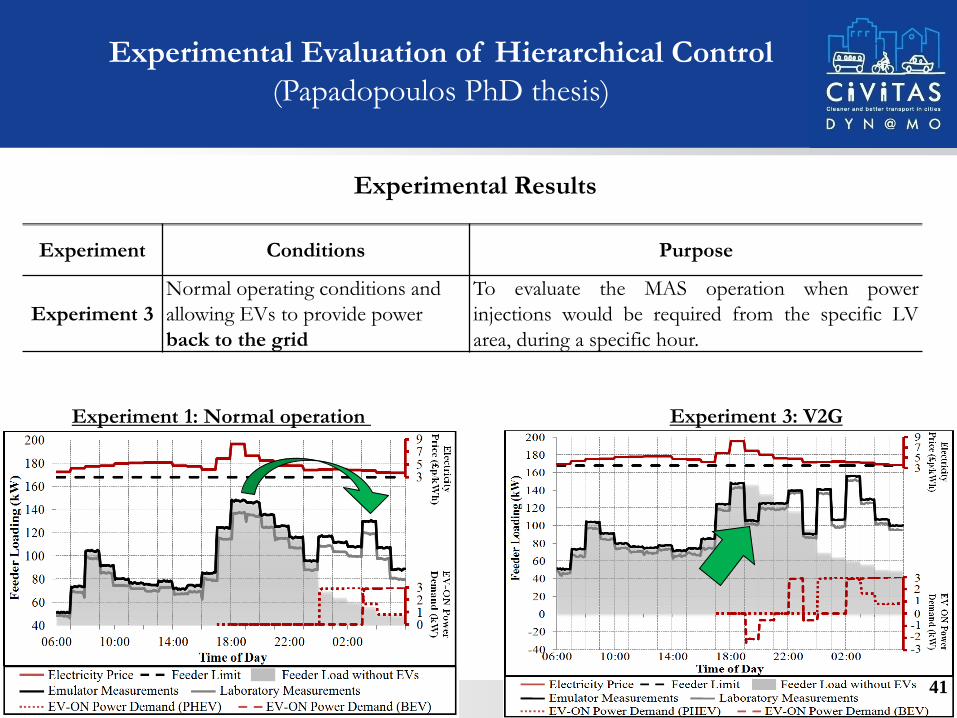
Experimental Evaluation of Hierarchical Control
(Papadopoulos PhD thesis)
~
Residential
Feeder
Grid Supply
33/
11.5kV
..
. ...
HV/MV
Substation
Level
Medium
Voltage
Level
Low
Voltage
Level
11/
0.433kV
MV/LV
Substation
Level
Key
Agent
15,360
Residential
Customers
(Lumped)
288
Residential
Customers
and 96 EVs
(Lumped)
EV
EV
EV
EV
Local
Aggregator
Regional
Aggregator
DSO
2,688
Residential
Customers
and 96 EVs
(Lumped)
UK Generic LV
Distribution
Network
Software Layer
Physical Layer
Key
Normal Operation Emergency Operation Monitoring Control Electrical
Communication Communication Connections
DMMS Avtron Millenium Avtron K595 EV-ON
300 Load Bank Load Bank Platform
~ Grid
Supply
400V/
50Hz
Agent
EV
DSO
Load Banks
Controller
EV
31 simulated
EV agents
CSDER (IEC 61850)
EV
Local
Aggregator
. . .
Regional
Aggregator
Create an equivalent of the residential feeder
24 Residential Customers
Equivalent
8 EVs Equivalent
P. Papadopoulos PhD thesis
40
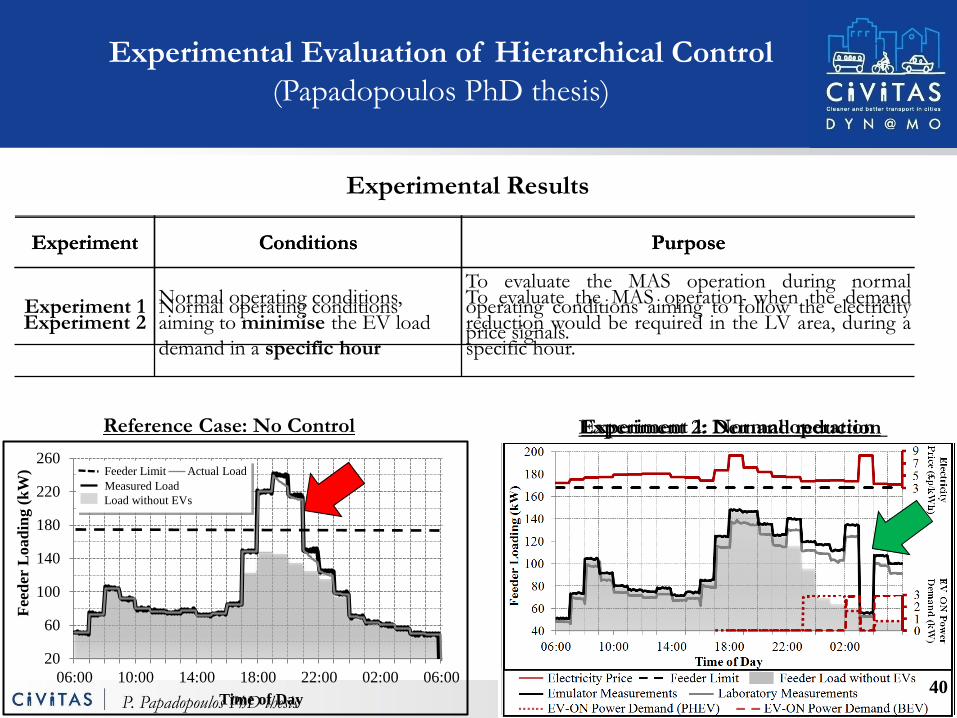
Experiment Conditions Purpose
Experiment 1 Normal operating conditions
To evaluate the MAS operation during normal
operating conditions aiming to follow the electricity
price signals.
Experimental Evaluation of Hierarchical Control
(Papadopoulos PhD thesis)
Experimental Results
20
60
100
140
180
220
260
06:00 10:00 14:00 18:00 22:00 02:00 06:00
Fee
der
Lo
ad
ing (
kW
)
Time of Day
Feeder Limit Actual Load
Measured Load
Load without EVs
Reference Case: No Control Experiment 1: Normal operation
Experiment Conditions Purpose
Experiment 2
Normal operating conditions,
aiming to minimise the EV load
demand in a specific hour
To evaluate the MAS operation when the demand
reduction would be required in the LV area, during a
specific hour.
Experiment 2: Demand reduction
40 P. Papadopoulos PhD thesis
41
Experiment Conditions Purpose
Experiment 3
Normal operating conditions and
allowing EVs to provide power
back to the grid
To evaluate the MAS operation when power
injections would be required from the specific LV
area, during a specific hour.
Experimental Results
Experiment 1: Normal operation Experiment 3: V2G
41
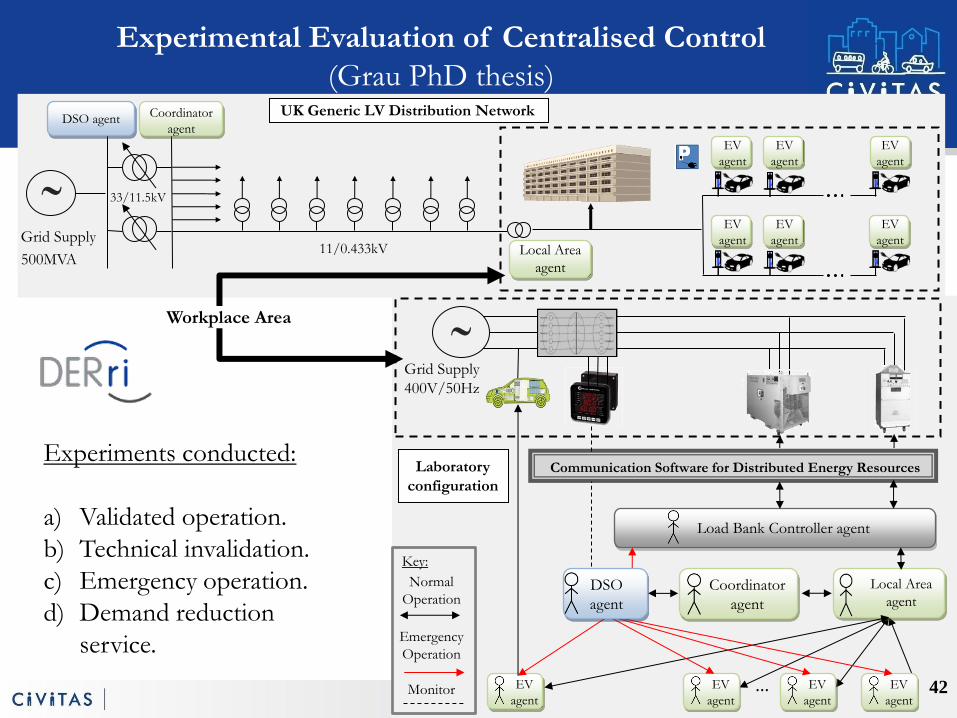
Experimental Evaluation of Hierarchical Control
(Papadopoulos PhD thesis)
42
Workplace Area
Experiments conducted:
a) Validated operation.
b) Technical invalidation.
c) Emergency operation.
d) Demand reduction
service.
EV
agent
EV
agent
EV
agent
EV
agent
EV
agent
EV
agent
Local Area
agent
Coordinator
agent
11/0.433kV
DSO agent
33/11.5kV
Grid Supply
500MVA
UK Generic LV Distribution Network
...
Coordinator
agent
Local Area
agent
Communication Software for Distributed Energy Resources
Grid Supply
400V/50Hz
EV
agent
EV
agent
EV
agent
EV
agent
Laboratory
configuration
Load Bank Controller agent
Normal
Operation
Emergency
Operation
Monitor
Key:
DSO
agent
42
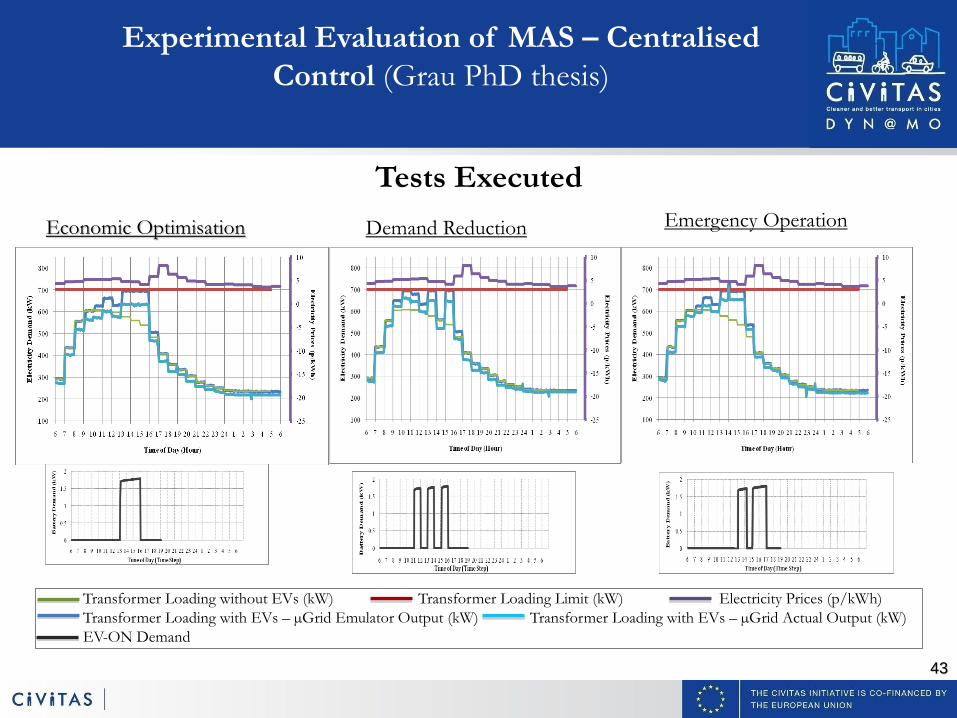
Experimental Evaluation of Centralised Control
(Grau PhD thesis)
43
Economic Optimisation Demand Reduction
Transformer Loading without EVs (kW) Transformer Loading Limit (kW) Electricity Prices (p/kWh)
Transformer Loading with EVs – µGrid Emulator Output (kW) Transformer Loading with EVs – µGrid Actual Output (kW)
EV-ON Demand
Tests Executed
Emergency Operation
Experimental Evaluation of MAS – Centralised
Control (Grau PhD thesis)
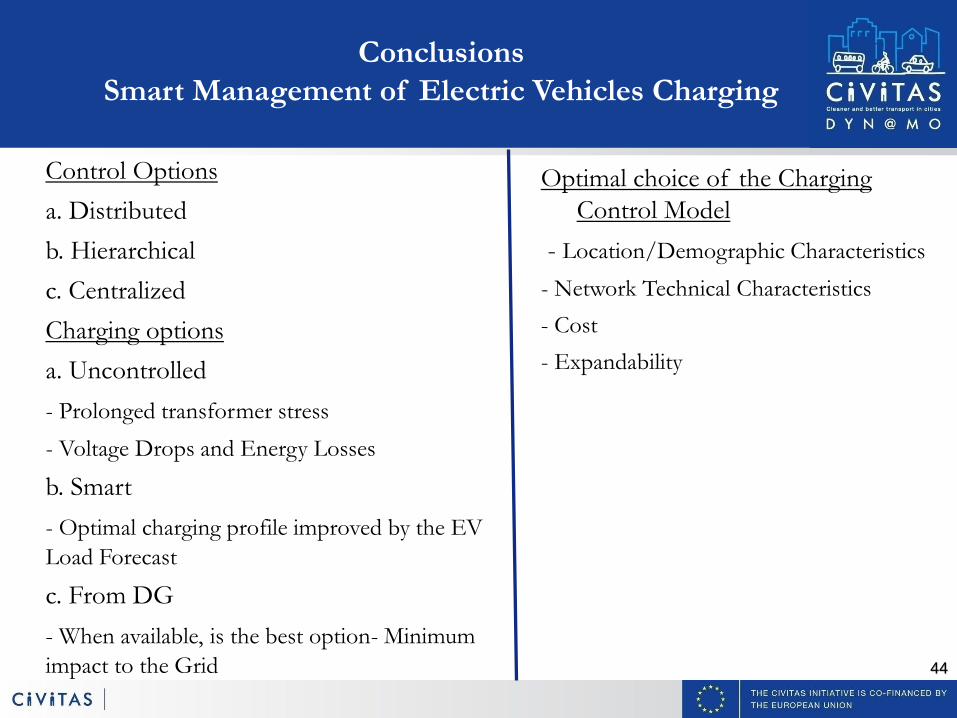
44
Optimal choice of the Charging
Control Model
- Location/Demographic Characteristics
- Network Technical Characteristics
- Cost
- Expandability
Conclusions
Smart Management of Electric Vehicles Charging
Control Options
a. Distributed
b. Hierarchical
c. Centralized
Charging options
a. Uncontrolled
- Prolonged transformer stress
- Voltage Drops and Energy Losses
b. Smart
- Optimal charging profile improved by the EV
Load Forecast
c. From DG
- When available, is the best option- Minimum
impact to the Grid
45
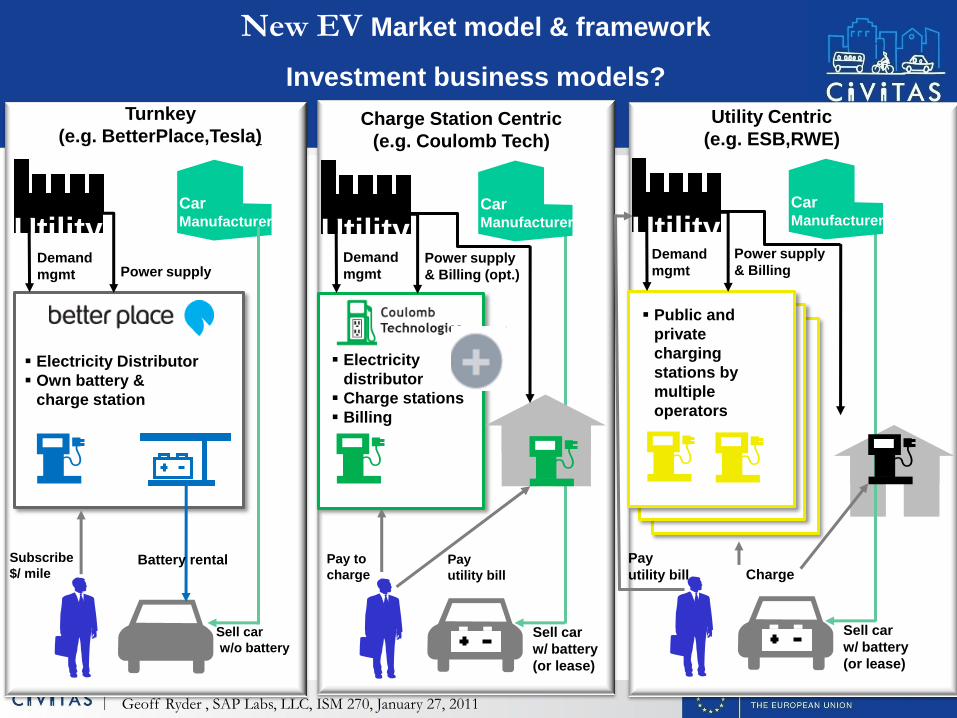
New EV Market model & framework
Investment business models? Utility Centric
(e.g. ESB,RWE)
Public and
private
charging
stations by
multiple
operators
Utility Car Manufacturer
Sell car
w/ battery
(or lease)
Pay
utility bill
Charge Station Centric
(e.g. Coulomb Tech)
Electricity
distributor
Charge stations
Billing
Pay to
charge
Utility Car Manufacturer
Demand
mgmt Power supply
& Billing (opt.)
Sell car
w/ battery
(or lease)
Pay
utility bill Charge
Demand
mgmt
Power supply
& Billing
Turnkey
(e.g. BetterPlace,Tesla)
Utility
Electricity Distributor
Own battery &
charge station
Car Manufacturer
Sell car
w/o battery
Subscribe
$/ mile Battery rental
Demand
mgmt Power supply
Geoff Ryder , SAP Labs, LLC, ISM 270, January 27, 2011
46
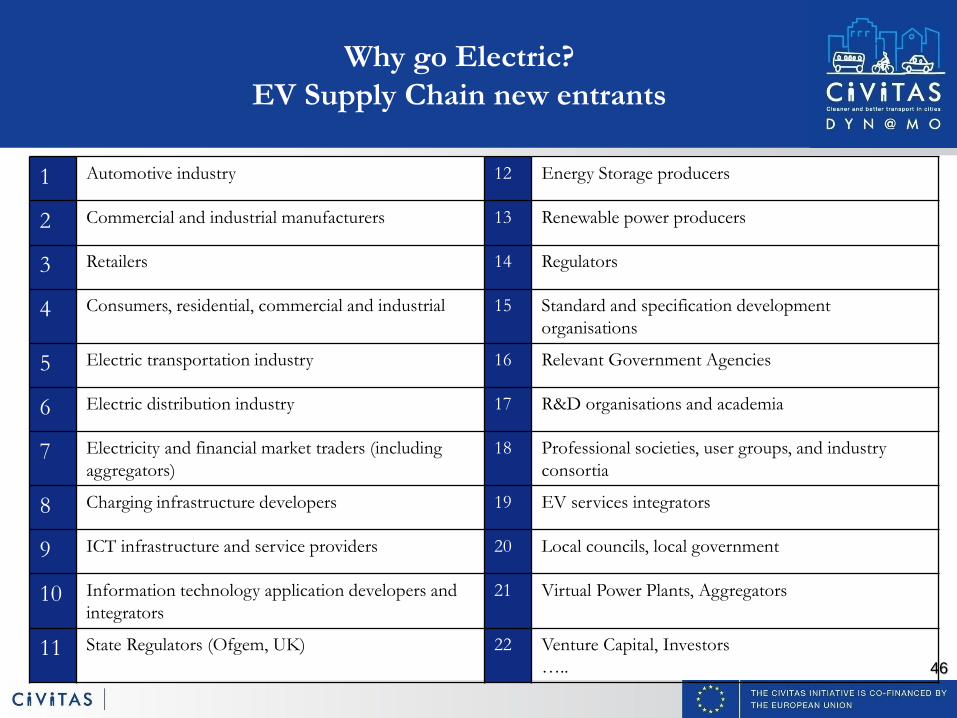
Why go Electric?
EV Supply Chain new entrants
1 Automotive industry 12 Energy Storage producers
2 Commercial and industrial manufacturers 13 Renewable power producers
3 Retailers 14 Regulators
4 Consumers, residential, commercial and industrial 15 Standard and specification development
organisations
5 Electric transportation industry 16 Relevant Government Agencies
6 Electric distribution industry 17 R&D organisations and academia
7 Electricity and financial market traders (including
aggregators)
18 Professional societies, user groups, and industry
consortia
8 Charging infrastructure developers 19 EV services integrators
9 ICT infrastructure and service providers 20 Local councils, local government
10 Information technology application developers and
integrators
21 Virtual Power Plants, Aggregators
11 State Regulators (Ofgem, UK) 22 Venture Capital, Investors
…..
47
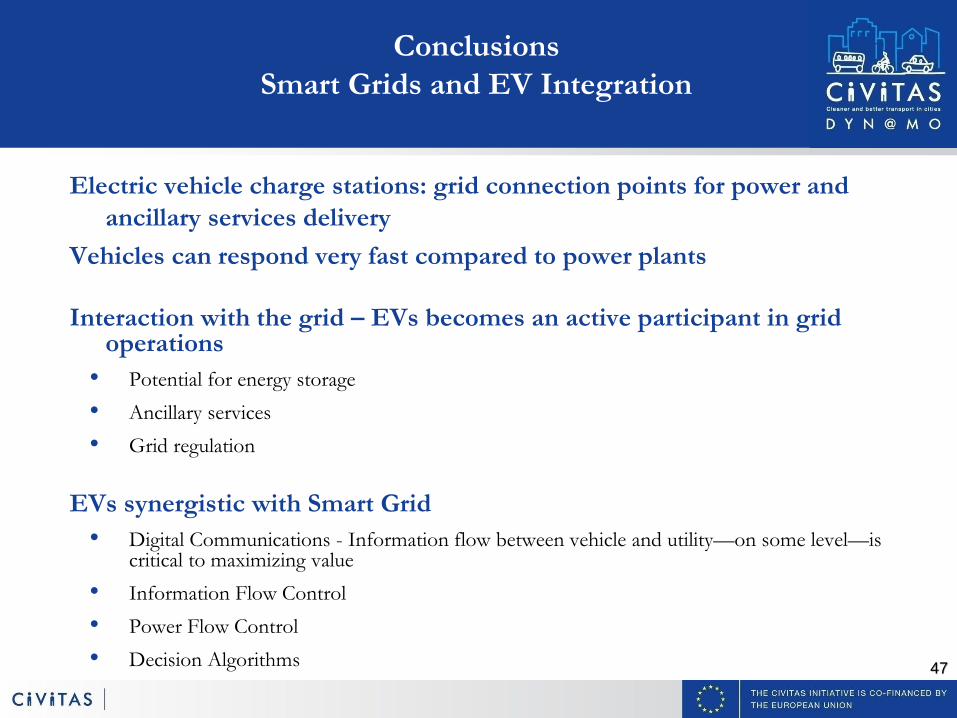
Electric vehicle charge stations: grid connection points for power and
ancillary services delivery
Vehicles can respond very fast compared to power plants
Interaction with the grid – EVs becomes an active participant in grid operations
• Potential for energy storage
• Ancillary services
• Grid regulation
EVs synergistic with Smart Grid
• Digital Communications - Information flow between vehicle and utility—on some level—is critical to maximizing value
• Information Flow Control
• Power Flow Control
• Decision Algorithms
Conclusions
Smart Grids and EV Integration
48
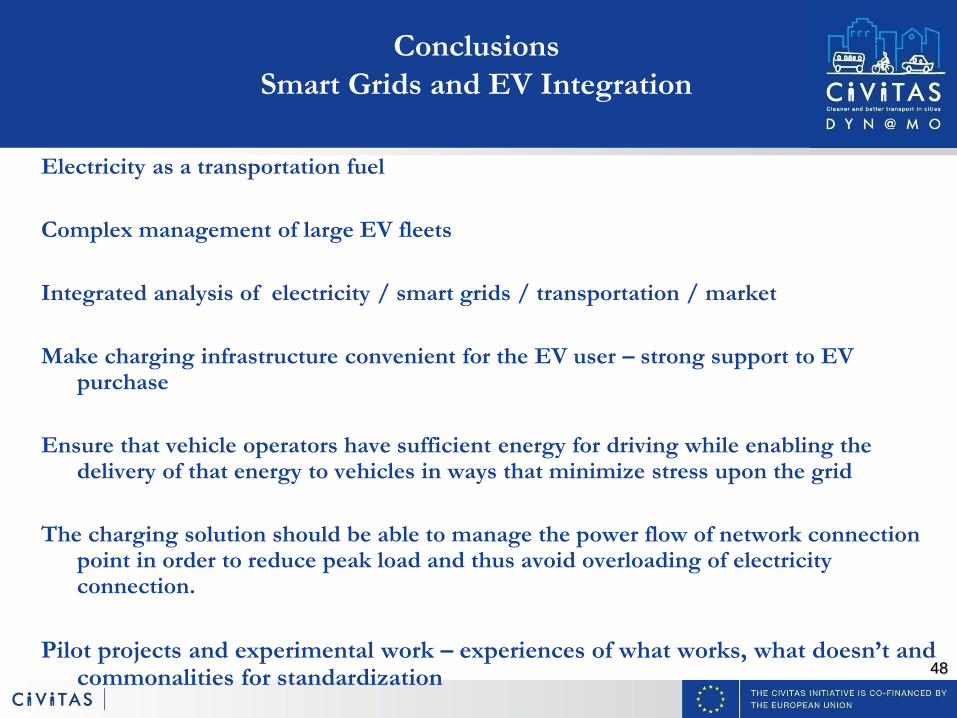
Electricity as a transportation fuel
Complex management of large EV fleets
Integrated analysis of electricity / smart grids / transportation / market
Make charging infrastructure convenient for the EV user – strong support to EV purchase
Ensure that vehicle operators have sufficient energy for driving while enabling the delivery of that energy to vehicles in ways that minimize stress upon the grid
The charging solution should be able to manage the power flow of network connection point in order to reduce peak load and thus avoid overloading of electricity connection.
Pilot projects and experimental work – experiences of what works, what doesn’t and commonalities for standardization
Conclusions
Smart Grids and EV Integration
49
Conclusions
Smart Grids and EV Integration
Not a revolution but evolution – will evolve over many years
Created through the incremental deployment and integration of system intelligence and
increasing grid observability capabilities
Intelligent systems deployed to meet specific customer, utility business and technical
regulatory drivers and measurable benefits
Each utility has different:
• Drivers and benefits
• Starting points
• Paths
• Deployment speed

Thank you!
Dr. Liana Cipcigan
Contact Details
Cardiff University
School of Engineering
Queen's Buildings
The Parade, Cardiff CF24 3AA
Research Team:
Babis Marmaras (RA), Kroton Xydas (PhD student),
Dr. Panos Papadopoulos (graduated working at EDF,
Dr. Inaki Gradu-Unda graduated)
http://www.civitas.eu