Embed Size (px)
Citation preview

Summer 2020Research Analysis and Statistics Presentation
with:
Christopher P. Morley PhDChair, Department of
Public Health & Preventive Medicine
July 30, 2020 1PM Webinar

A QUICK INTRODUCTION TO BASIC STATISTICAL TESTS
Christopher P. Morley PhDChair, Department of
Public Health & Preventive Medicine
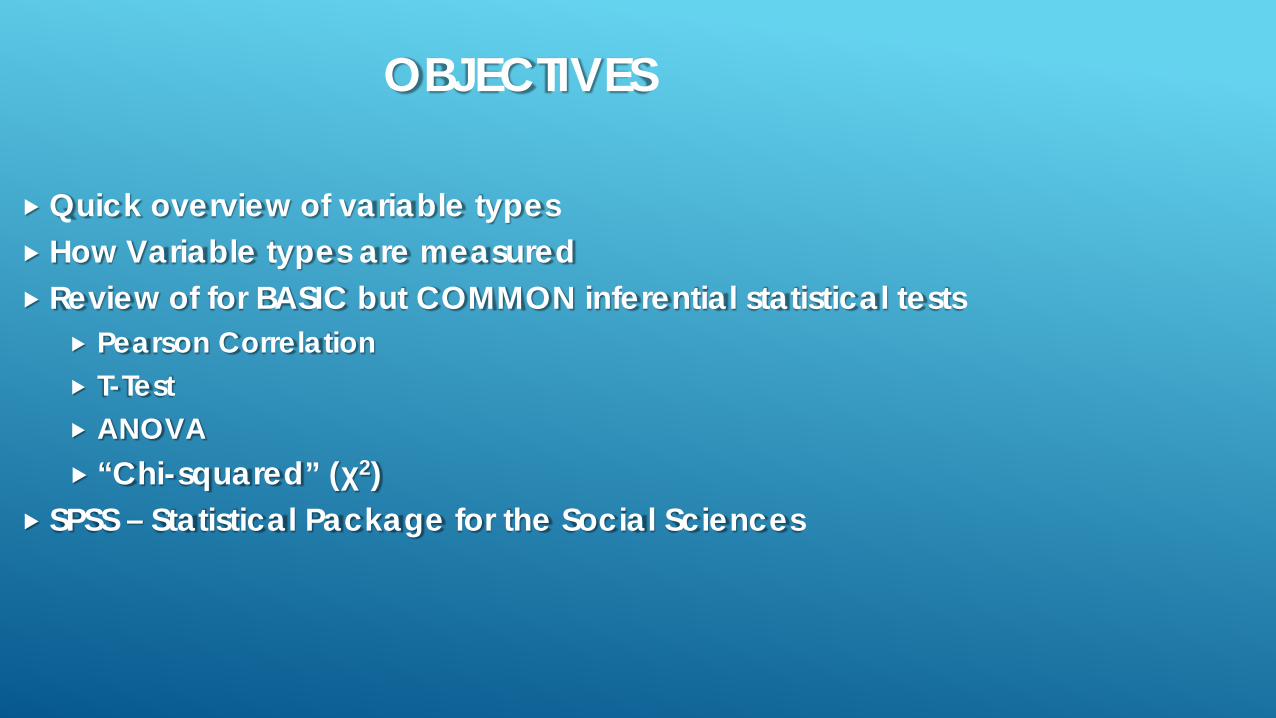
OBJECTIVES
Quick overview of variable types How Variable types are measured Review of for BASIC but COMMON inferential statistical tests
Pearson Correlation T-Test ANOVA “Chi-squared” (χ2)
SPSS – Statistical Package for the Social Sciences

VARIABLE DEFINITIONYour research question(s) should inherently imply your analytic approach, variables etc.
See: https://cirt.gcu.edu/research/developmentresources/tutorials/question

VARIABLE TYPES
• Continuous -• Interval – measurable in a continuum• Ratio – like an interval, but interval contains 0, and 0 implies “none”
• Categorical – numbers describe categories• Nominal – no implied order (e.g. AA/Asian/White/AIAN etc.)• Dichotomous – a type of nominal that implies only two states (e.g. Female/Male)
• A “Dummy Variable” is dichotomized into 1 and 0, with presence or absence of a state implied
• Ordinal – there is an implied ranking in the order, but the relationship between ranks is not a ratio (e.g. Likert Scale)

VARIABLE TYPES, CONTINUED
• Nominal by Nominal (e.g. Treatment yes/no by Cure yes/no)• “Chi-squared” χ2
• Fisher’s Exact Test (when sample or categories are very small)
• Continuous by Nominal• T-Test - Comparing mean of two groups• Analysis of Variance – comparing means across more that two groups• Ordinal – can be treated like a continuous variable in many cases (and we often do! Think of Likert Scales on surveys)
• Continuous by Continuous• Correlation – Tests the extent to which one variable changes with another• Pearson – best for linear relationships• Spearman – better for ordinal or non-linear relationships
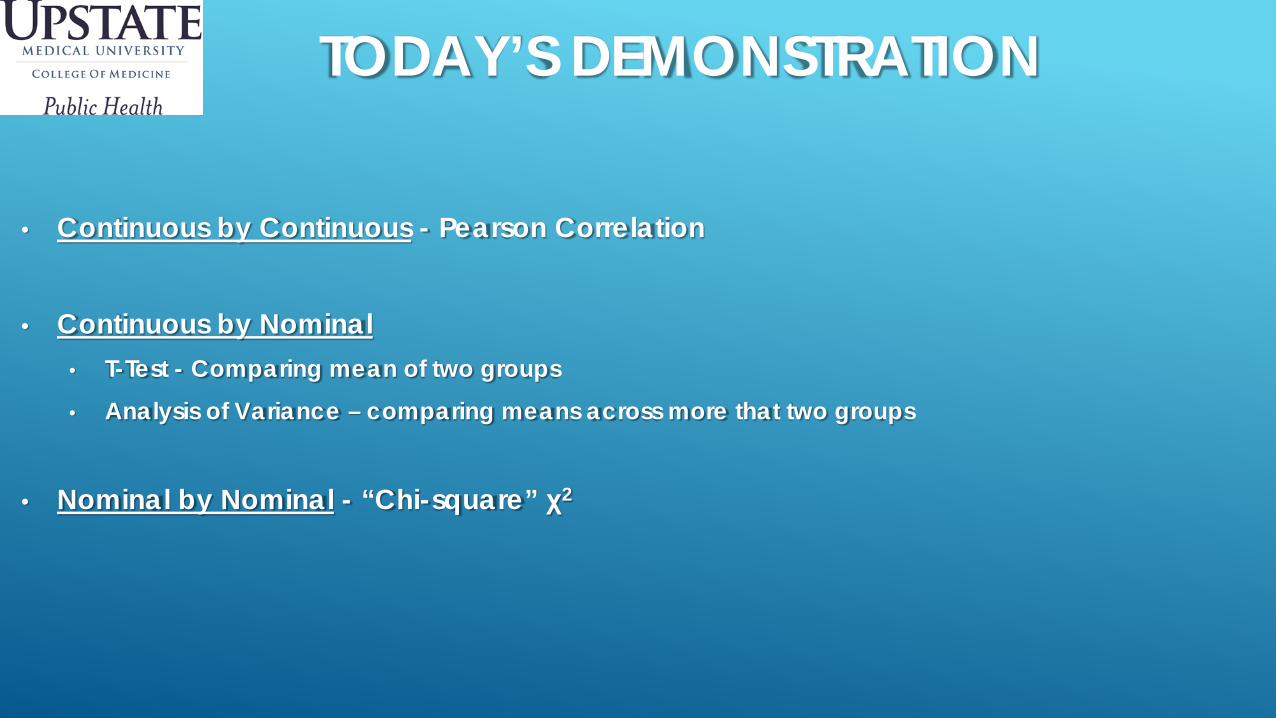
TODAY’S DEMONSTRATION
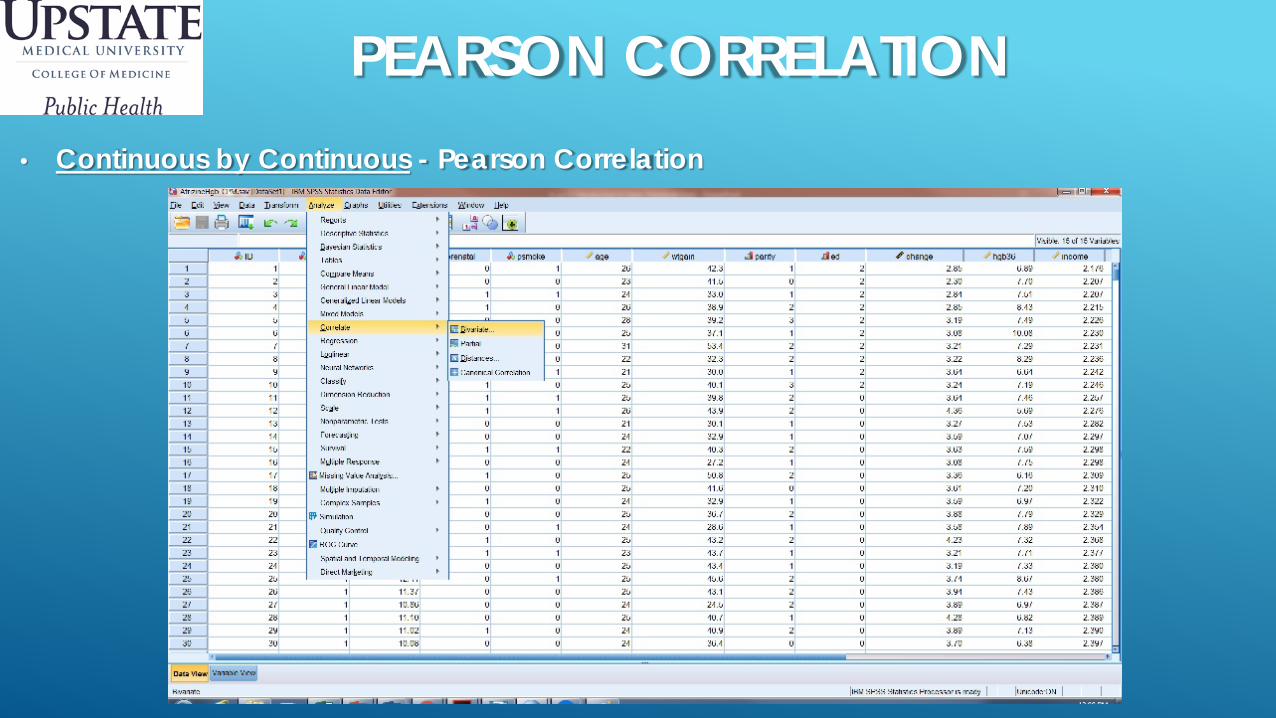
• Continuous by Continuous - Pearson Correlation
• Continuous by Nominal• T-Test - Comparing mean of two groups• Analysis of Variance – comparing means across more that two groups
• Nominal by Nominal - “Chi-square” χ2

FIRST – THE DATASPSS
We will be using SPSS – available on all (most?) Upstate computers. There are also student annual licenses available. GUI-driven, but can also run on code. https://www.ibm.com/us-en/marketplace/spss-statistics-gradpack/details#product-header-top
Data Set From Biostatistics: An Applied Introduction for the Public Health Practitioner | 1st Edition |Heather
M. Bush https://www.cengage.com/c/biostatistics-an-applied-introduction-for-the-public-health-
practitioner-1e-bush/9781111035143/ 995 pregnant women from a large farming community See write-up and data set

TODAY’S DEMONSTRATION• Continuous by Continuous - Pearson Correlation
A Pearson correlation is a number between -1 and 1 that indicates the extent to which two variables are linearly related. The Pearson correlation is also known as the “product moment correlation coefficient” (PMCC) or simply “correlation”.
Pearson correlations are suitable only for metric variables (which include dichotomous variables).•For ordinal variables, use the Spearman correlation or Kendall’s tau and•for nominal variables, use Cramér’s V.
From: https://www.spss-tutorials.com/pearson-correlation-coefficient/
PEARSON CORRELATION• Continuous by Continuous - Pearson Correlation

PEARSON CORRELATION• Continuous by Continuous - Pearson Correlation
Week 9 Hemglobin(g/dL)
Week 36 Hemoglobin (g/dL)
Age at Initial Visit (Yrs)
Annual Household Income (USD, Thousands)
Number of previous births
Educational Attainment
Week 9 Hemglobin(g/dL)
Pearson Correlation 1 .766** .076* .012 .015 .083**
Sig. (2-tailed) .000 .017 .708 .641 .010N 979 979 979 975 979 979
Week 36 Hemoglobin (g/dL)
Pearson Correlation .766** 1 .351** .078* -.143** .340**
Sig. (2-tailed) .000 .000 .015 .000 .000N 979 979 979 975 979 979
Age at Initial Visit (Yrs) Pearson Correlation .076* .351** 1 .083** -.052 .162**
Sig. (2-tailed) .017 .000 .010 .105 .000N 979 979 979 975 979 979
Annual Household Income (USD, Thousands)
Pearson Correlation .012 .078* .083** 1 -.043 .273**
Sig. (2-tailed) .708 .015 .010 .179 .000N 975 975 975 975 975 975
Number of previous births
Pearson Correlation .015 -.143** -.052 -.043 1 -.038Sig. (2-tailed) .641 .000 .105 .179 .241N 979 979 979 975 979 979
Educational Attainment
Pearson Correlation .083** .340** .162** .273** -.038 1Sig. (2-tailed) .010 .000 .000 .000 .241N 979 979 979 975 979 979
**. Correlation is significant at the 0.01 level (2-tailed).*. Correlation is significant at the 0.05 level (2-tailed).

PEARSON CORRELATION• Continuous by Continuous - Pearson Correlation (What does this LOOK like, graphically?)
r =.766, p<.001r =.078, p<.015r =.012, p=.708

COMPARISON OF MEANS – T-TEST• Continuous by Nominal
• T-Test - Comparing Hemoglobin at week 36 across pre-pregnancy smoking status• So your two groups have different means. Are they REALLY different, or simply different by chance?

COMPARISON OF MEANS – T-TEST• Continuous by Nominal
• T-Test - Comparing Hemoglobin at week 36 across pre-pregnancy smoking status• So your two groups have different means. Are they REALLY different, or simply different by chance?
Group StatisticsPre-Pregnancy Smoker N Mean
Std. Deviation
Std. Error Mean
Week 36 Hemoglobin (g/dL)
No 741 8.3524 1.16342 .04274Yes 238 7.8314 1.09255 .07082
Independent Samples Test
Levene's Test for Equality
of Variances t-test for Equality of Means
F Sig. t dfSig.
(2-tailed)Mean
DifferenceStd. Error
Difference95% Confidence IntervalLower Upper
Week 36 Hemoglobin (g/dL)
Equal variances
assumed
.751 .386 6.098 977 .000 .52095 .08543 .35330 .68860
Equal variances not
assumed
6.298 423.097 .000 .52095 .08272 .35836 .68353

COMPARISON OF MEANS - ANOVA• Continuous by Nominal - Analysis of Variance – comparing means across more that two groups

COMPARISON OF MEANS - ANOVA• Continuous by Nominal - Analysis of Variance – comparing means across more that two groups
Descriptives
Week 36 Hemoglobin (g/dL)
N MeanStd.
DeviationStd. Error
95% Confidence Interval for Mean
Min MaxLower Bound
Upper Bound
Tap Water Only 270 7.2596 .85532 .05205 7.1571 7.3620 5.31 10.08Bottled/Filtered Water Only
315 9.3904 .75322 .04244 9.3069 9.4739 7.09 11.69
Combination of Tab and Bottled/Filtered
394 7.9566 .79853 .04023 7.8776 8.0357 5.13 9.86
Total 979 8.2257 1.16765 .03732 8.1525 8.2990 5.13 11.69
ANOVAWeek 36 Hemoglobin (g/dL)
Sum of Squares df
Mean Square F Sig.
Between Groups
707.887 2 353.943 552.247 .000
Within Groups
625.533 976 .641
Total 1333.420 978
Post Hoc Tests - Multiple Comparisons - Tukey HSD
Dependent Variable: Week 36 Hemoglobin (g/dL)
(I) Water Consumption Group (J) Water Consumption Group Mean Difference (I-J) Std. Error Sig.
95% Confidence Interval
Lower Bound Upper Bound
Tap Water Only Bottled/Filtered Water Only -2.13089* .06640 .000 -2.2867 -1.9750
Combination of Tab and
Bottled/Filtered
-.69709* .06325 .000 -.8456 -.5486
Bottled/Filtered Water Only Tap Water Only 2.13089* .06640 .000 1.9750 2.2867
Combination of Tab and
Bottled/Filtered
1.43379* .06051 .000 1.2918 1.5758
Combination of Tab and
Bottled/Filtered
Tap Water Only .69709* .06325 .000 .5486 .8456
Bottled/Filtered Water Only -1.43379* .06051 .000 -1.5758 -1.2918
*. The mean difference is significant at the 0.05 level.

TODAY’S DEMONSTRATION
• Nominal by Nominal - “Chi-square” χ2

TODAY’S DEMONSTRATION
• Nominal by Nominal - “Chi-square” χ2
• Comparison of proportions across categories• Best used in 2 x 2, as that is easiest to interpret
Crosstab
Pre-Pregnancy Smoker
TotalNo Yes
Tap Water Only .00 Count 558 151 709
% within Tap Water Only 78.7% 21.3% 100.0%
1.00 Count 183 87 270
% within Tap Water Only 67.8% 32.2% 100.0%
Total Count 741 238 979
% within Tap Water Only 75.7% 24.3% 100.0%
Chi-Square Tests
Value df
Asymptotic
Significance
(2-sided)
Exact Sig.
(2-sided)
Exact Sig.
(1-sided)
Pearson Chi-Square 12.683a 1 .000
Continuity Correctionb 12.096 1 .001
Likelihood Ratio 12.219 1 .000
Fisher's Exact Test .000 .000
Linear-by-Linear Association 12.670 1 .000
N of Valid Cases 979
a. 0 cells (0.0%) have expected count less than 5. The minimum expected count is 65.64.
b. Computed only for a 2x2 table

FOR DEEPER STUDY
"SPSS Tutorials" site here: https://www.spss-tutorials.com/ I can't really vouch for what it is or who runs it (some ads are blocked by McAfee). As an intro
to SPSS, it's a place to start. I would recommend people can open the lessons (anywhere it says "Read"), but be careful about opening any links. I would ONLY click on the links that lead to the lessons - NOTHING that looks like an advertisement or a link off the site. A few pointers: -- Types of variables
-- How to set up a raw data table for analysis
-- A hypothesis (significance) test
-- Correlations (mostly Pearson)
-- T-test (learn the z-test if you must, but the t-test is far more widely used)
-- Analysis of Variance (ANOVA) - basically an extension of the t-test
-- Chi square - for analyzing categorical by categorical variables
Those feeling adventurous can start looking at regression, but most learners can get to poster stage if they can run, interpret, and explain the variables above

FOR DEEPER STUDY
Khan Academy: https://www.khanacademy.org/math/statistics-probability A free online statistics course
Statistical Solutions Inc: https://www.statisticssolutions.com/directory-of-statistical-analyses/ Designed to offer dissertation consultation, but lots of free and VERY straightforward directions
Social Research Methods: http://socialresearchmethods. Not statistics, but a great guide for study design, foundations of research methods, etc.

FINAL TIPS
Partner with people who complement your skills If funding available: consult with the Center for Research &
Evaluation (CRE)http://www.upstate.edu/publichealth/research/cre/index.phpPlease be aware there are charges ($110/hr after consultation)
– speak w/ faculty about funding


![Summer Seminar: Philosophy of Statistics · Summer Seminar: Philosophy of Statistics Lecture Notes 5: From Probability Theory to Statistical Inference Aris Spanos [Summer 2019] 1](https://img.pdfslide.us/doc/110x75/60087517f706a6413d2d3125/summer-seminar-philosophy-of-statistics-summer-seminar-philosophy-of-statistics.jpg)


![Summer Seminar: Philosophy of Statistics · 2019-08-02 · Summer Seminar: Philosophy of Statistics Lecture Notes 4: A Simple Statistical Model Aris Spanos [Summer 2019] 1 Introduction](https://img.pdfslide.us/doc/110x75/5f76ffc8167e664cd666c794/summer-seminar-philosophy-of-statistics-2019-08-02-summer-seminar-philosophy.jpg)