Embed Size (px)
DESCRIPTION
Â
Citation preview
Downtown Denver Summer 2012 Pedestrian Count Report
Funded by the Downtown Denver Business Improvement District
Research Department • 511 16th Street, Suite 200, Denver, CO 80202 • 303-534-6161 • www.DowntownDenver.com
Downtown DenverPartnership, Inc.
Research Department
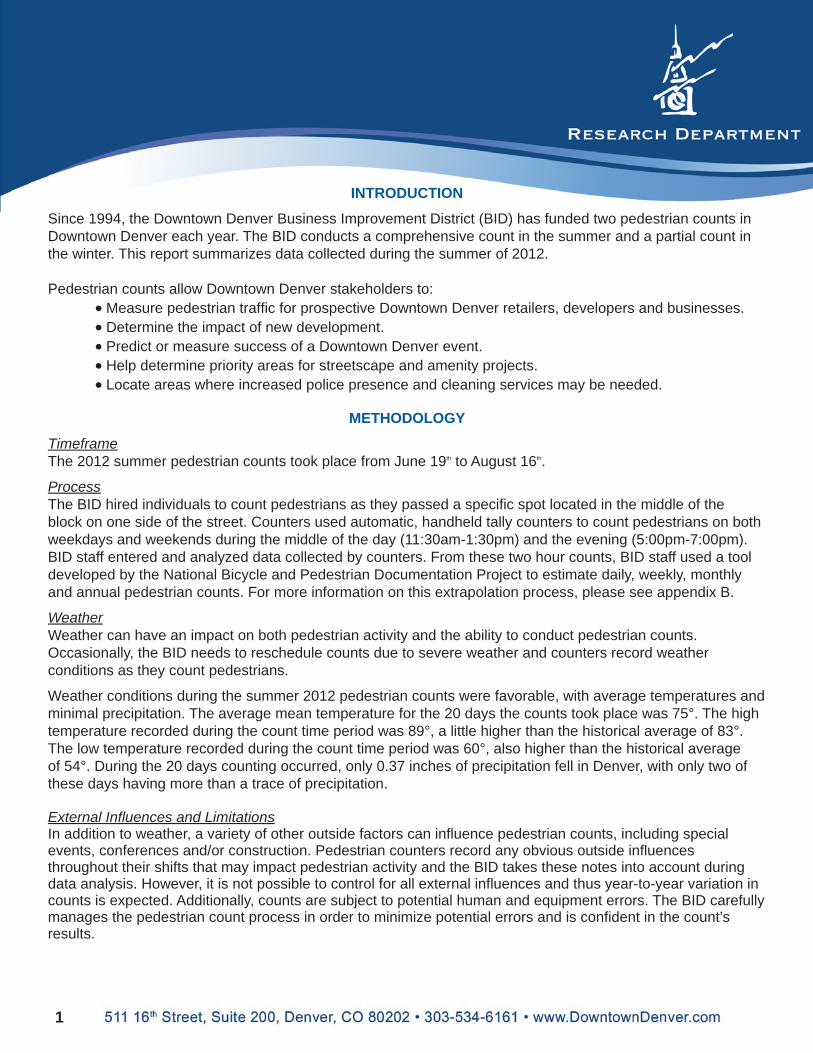
INTRODUCTION
Since 1994, the Downtown Denver Business Improvement District (BID) has funded two pedestrian counts in Downtown Denver each year. The BID conducts a comprehensive count in the summer and a partial count in the winter. This report summarizes data collected during the summer of 2012.
Pedestrian counts allow Downtown Denver stakeholders to: Measure pedestrian traffi c for prospective Downtown Denver retailers, developers and businesses. Determine the impact of new development. Predict or measure success of a Downtown Denver event. Help determine priority areas for streetscape and amenity projects. Locate areas where increased police presence and cleaning services may be needed.
METHODOLOGY
TimeframeThe 2012 summer pedestrian counts took place from June 19th to August 16th.
ProcessThe BID hired individuals to count pedestrians as they passed a specifi c spot located in the middle of the block on one side of the street. Counters used automatic, handheld tally counters to count pedestrians on both weekdays and weekends during the middle of the day (11:30am-1:30pm) and the evening (5:00pm-7:00pm). BID staff entered and analyzed data collected by counters. From these two hour counts, BID staff used a tool developed by the National Bicycle and Pedestrian Documentation Project to estimate daily, weekly, monthly and annual pedestrian counts. For more information on this extrapolation process, please see appendix B.
WeatherWeather can have an impact on both pedestrian activity and the ability to conduct pedestrian counts. Occasionally, the BID needs to reschedule counts due to severe weather and counters record weather conditions as they count pedestrians.
Weather conditions during the summer 2012 pedestrian counts were favorable, with average temperatures and minimal precipitation. The average mean temperature for the 20 days the counts took place was 75°. The high temperature recorded during the count time period was 89°, a little higher than the historical average of 83°. The low temperature recorded during the count time period was 60°, also higher than the historical average of 54°. During the 20 days counting occurred, only 0.37 inches of precipitation fell in Denver, with only two of these days having more than a trace of precipitation.
External Infl uences and LimitationsIn addition to weather, a variety of other outside factors can infl uence pedestrian counts, including special events, conferences and/or construction. Pedestrian counters record any obvious outside infl uences throughout their shifts that may impact pedestrian activity and the BID takes these notes into account during data analysis. However, it is not possible to control for all external infl uences and thus year-to-year variation in counts is expected. Additionally, counts are subject to potential human and equipment errors. The BID carefully manages the pedestrian count process in order to minimize potential errors and is confi dent in the count’s results.
1
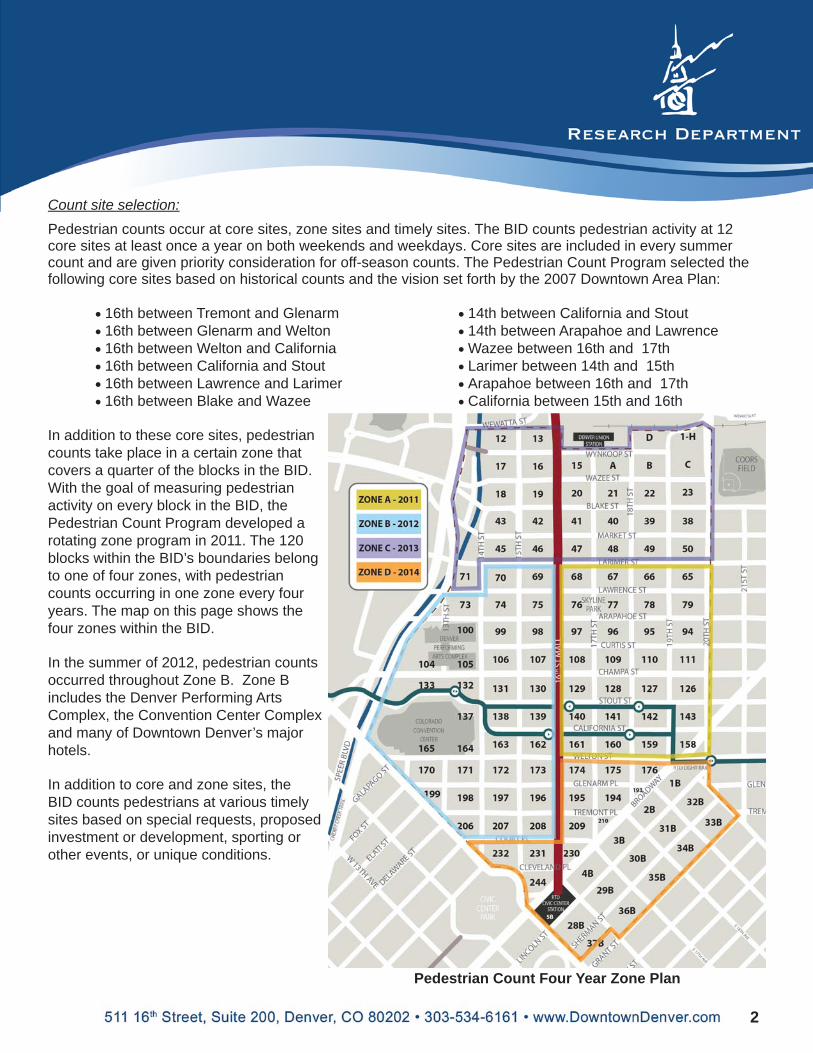
Count site selection:
Pedestrian counts occur at core sites, zone sites and timely sites. The BID counts pedestrian activity at 12 core sites at least once a year on both weekends and weekdays. Core sites are included in every summer count and are given priority consideration for off-season counts. The Pedestrian Count Program selected the following core sites based on historical counts and the vision set forth by the 2007 Downtown Area Plan:
16th between Tremont and Glenarm 16th between Glenarm and Welton 16th between Welton and California 16th between California and Stout 16th between Lawrence and Larimer 16th between Blake and Wazee
14th between California and Stout 14th between Arapahoe and Lawrence Wazee between 16th and 17th Larimer between 14th and 15th Arapahoe between 16th and 17th California between 15th and 16th
In addition to these core sites, pedestrian counts take place in a certain zone that covers a quarter of the blocks in the BID. With the goal of measuring pedestrian activity on every block in the BID, the Pedestrian Count Program developed a rotating zone program in 2011. The 120 blocks within the BID’s boundaries belong to one of four zones, with pedestrian counts occurring in one zone every four years. The map on this page shows the four zones within the BID.
In the summer of 2012, pedestrian counts occurred throughout Zone B. Zone B includes the Denver Performing Arts Complex, the Convention Center Complex and many of Downtown Denver’s major hotels.
In addition to core and zone sites, the BID counts pedestrians at various timely sites based on special requests, proposed investment or development, sporting or other events, or unique conditions.
Pedestrian Count Four Year Zone Plan
2
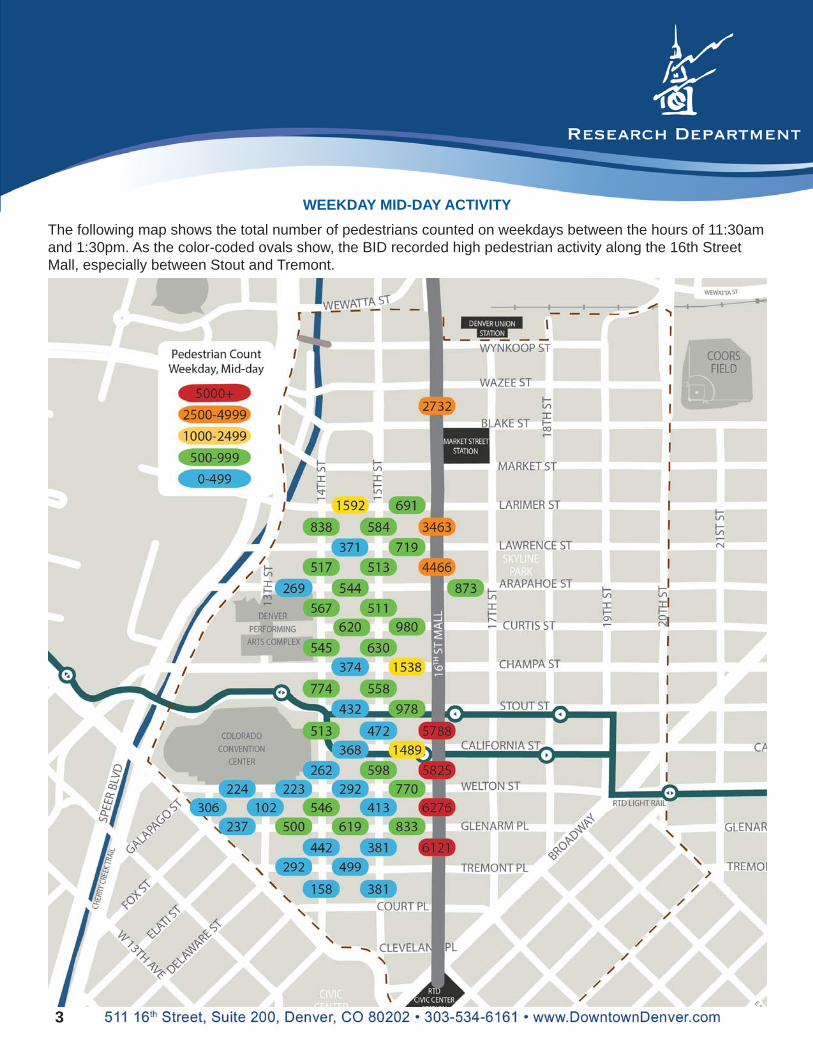
WEEKDAY MID-DAY ACTIVITYThe following map shows the total number of pedestrians counted on weekdays between the hours of 11:30am and 1:30pm. As the color-coded ovals show, the BID recorded high pedestrian activity along the 16th Street Mall, especially between Stout and Tremont.
3
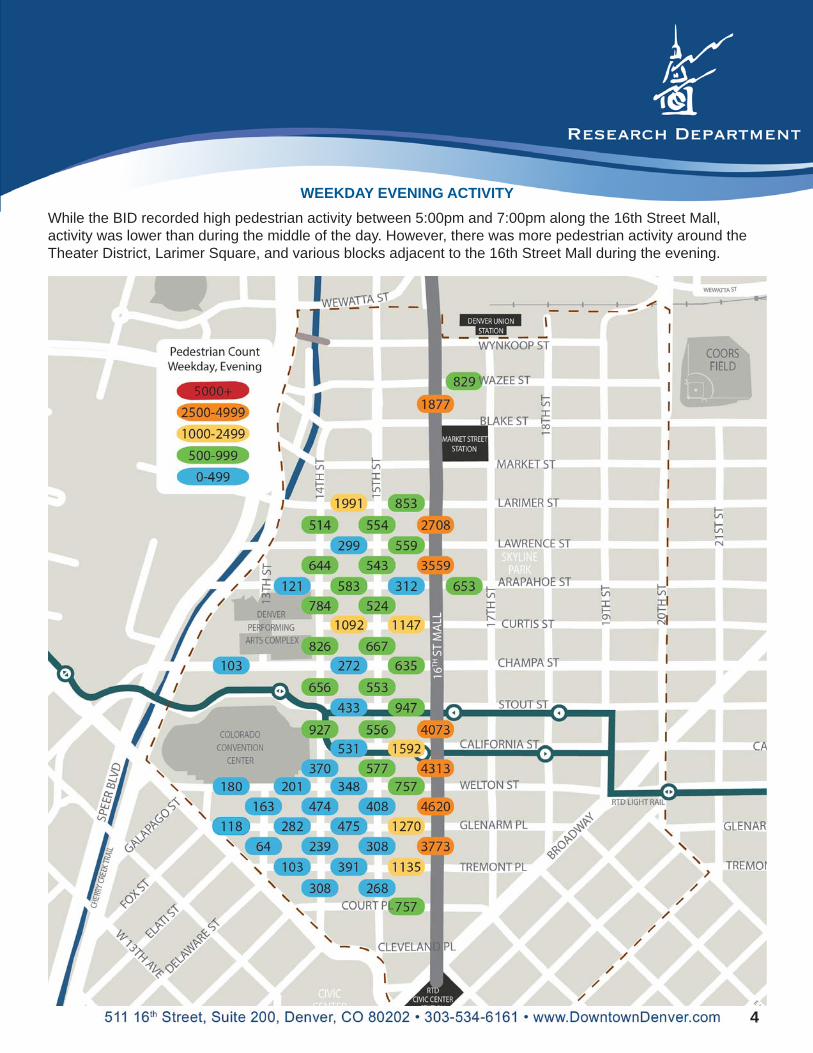
WEEKDAY EVENING ACTIVITYWhile the BID recorded high pedestrian activity between 5:00pm and 7:00pm along the 16th Street Mall, activity was lower than during the middle of the day. However, there was more pedestrian activity around the Theater District, Larimer Square, and various blocks adjacent to the 16th Street Mall during the evening.
4
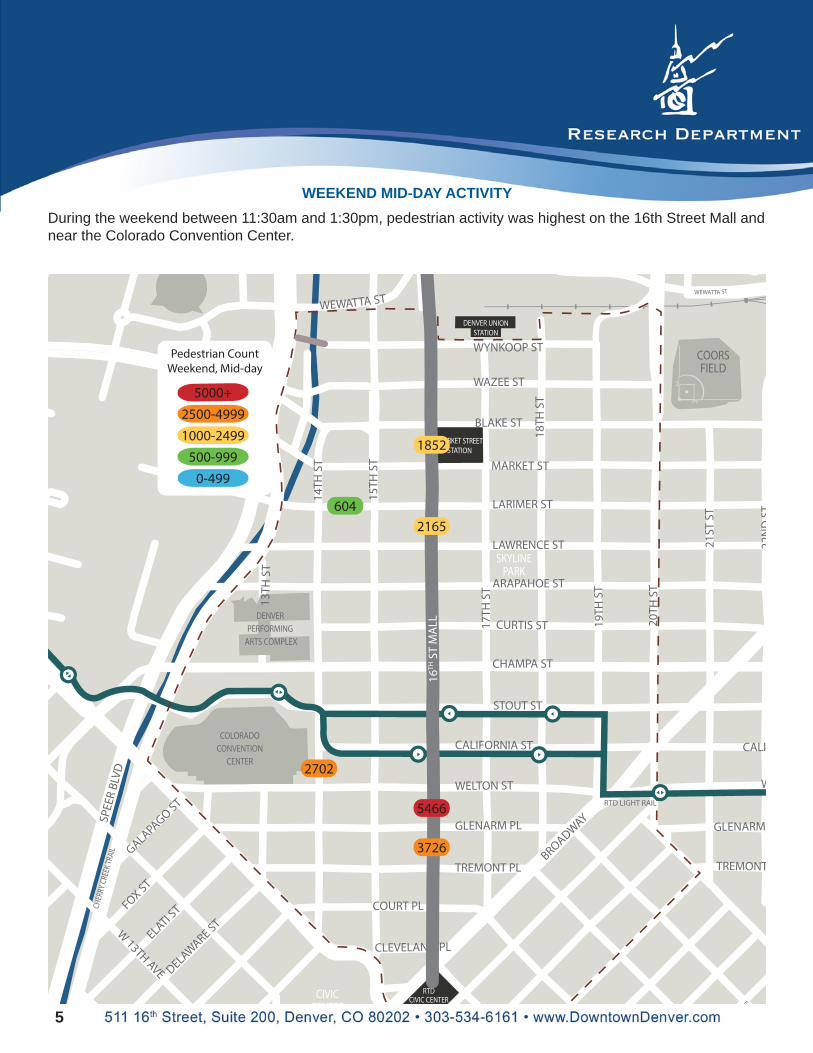
WEEKEND MID-DAY ACTIVITYDuring the weekend between 11:30am and 1:30pm, pedestrian activity was highest on the 16th Street Mall and near the Colorado Convention Center.
CHER
RY C
REEK
TRAI
L
RTD LIGHT RAIL
CIVICCENTER
SKYLINEPARK
COLORADOCONVENTION
CENTER
COORSFIELD
RTDCIVIC CENTER
DENVER PERFORMING
ARTS COMPLEX
MARKET STREETSTATION
DENVER UNIONSTATION
13TH
ST
WEWATTA ST
WEWATTA ST
FOX ST
COURT PL
CLEVELAND PLELATI S
T
TREMONT
DELAWARE ST
GLENARM GLENARM PL
WAZEE ST
WELTON ST
MARKET ST
21ST
ST
17TH
ST
GALAPAGO ST
W
16TH
ST
MA
LL
CALIFORNIA ST CALI
CURTIS ST
W 13TH AVE
BLAKE ST
ARAPAHOE ST
TREMONT PL
18TH
ST
LARIMER ST
LAWRENCE ST
WYNKOOP ST
E
14TH
ST
22N
DST
15TH
ST
19TH
ST
20TH
ST
CHAMPA ST
STOUT ST
BROADWAYSPEE
R BL
VD 2702
604
1852
2165
5466
3726
Pedestrian CountWeekend, Mid-day
5000+2500-49991000-2499
500-9990-499
16TH
ST
MA
LL
5
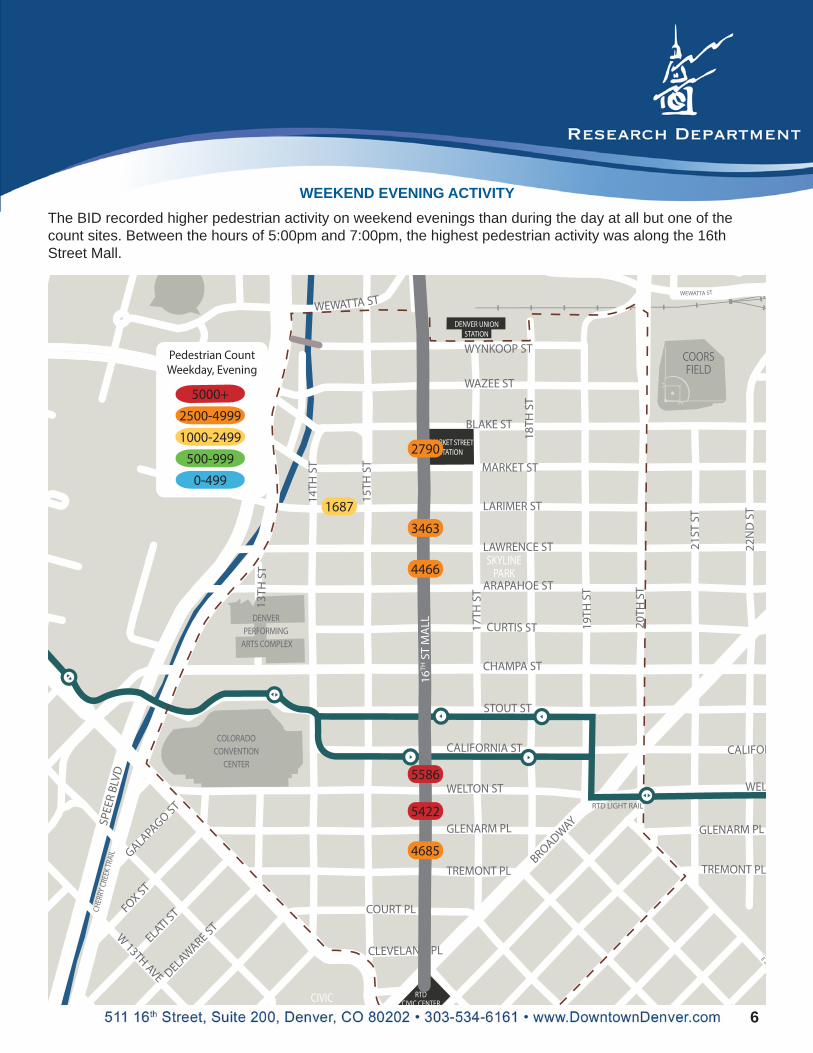
WEEKEND EVENING ACTIVITYThe BID recorded higher pedestrian activity on weekend evenings than during the day at all but one of the count sites. Between the hours of 5:00pm and 7:00pm, the highest pedestrian activity was along the 16th Street Mall.
CHER
RY C
REEK
TRAI
L
RTD LIGHT RAIL
CIVIC
SKYLINEPARK
COLORADOCONVENTION
CENTER
COORSFIELD
RTDCIVIC CENTER
DENVER PERFORMING
ARTS COMPLEX
MARKET STREETSTATION
DENVER UNIONSTATION
13TH
ST
WEWATTA ST
WEWATTA ST
FOX ST
COURT PL
CLEVELAND PLELATI S
T
TREMONT PL
DELAWARE ST
GLENARM PLGLENARM PL
WAZEE ST
WELTON ST
MARKET ST
21ST
ST
17TH
ST
GALAPAGO ST
WELT
16TH
ST
MA
LL
CALIFORNIA ST CALIFOR
CURTIS ST
W 13TH AVE
BLAKE ST
ARAPAHOE ST
TREMONT PL
18TH
ST
LARIMER ST
LAWRENCE ST
WYNKOOP ST
E 20
E
14TH
ST
22N
D S
T
15TH
ST
19TH
ST
20TH
ST
CHAMPA ST
STOUT ST
BROADWAYSPEE
R BL
VD
1687
2790
3463
4466
5586
5422
4685
Pedestrian CountWeekday, Evening
5000+2500-49991000-2499
500-9990-499
16TH
ST
MA
LL
6
ADDITIONAL ANALYSIS
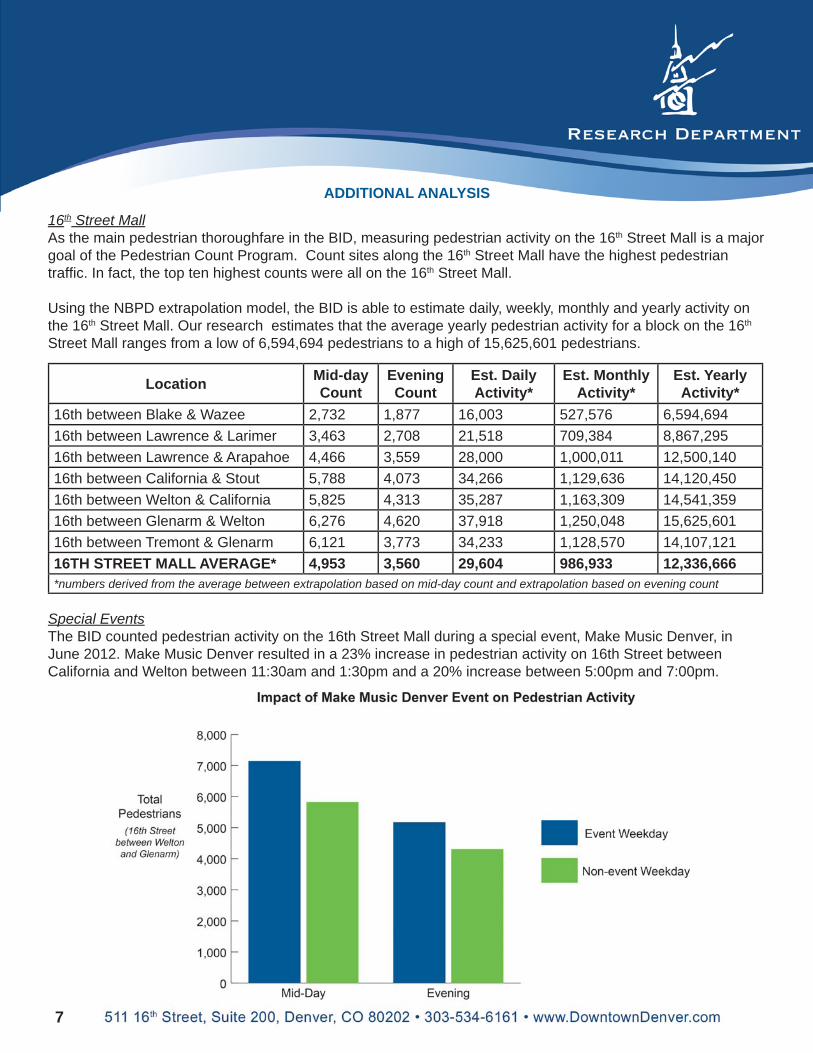
16th Street MallAs the main pedestrian thoroughfare in the BID, measuring pedestrian activity on the 16th Street Mall is a major goal of the Pedestrian Count Program. Count sites along the 16th Street Mall have the highest pedestrian traffi c. In fact, the top ten highest counts were all on the 16th Street Mall.
Using the NBPD extrapolation model, the BID is able to estimate daily, weekly, monthly and yearly activity on the 16th Street Mall. Our research estimates that the average yearly pedestrian activity for a block on the 16th Street Mall ranges from a low of 6,594,694 pedestrians to a high of 15,625,601 pedestrians.
Location Mid-day Count
Evening Count
Est. Daily Activity*
Est. Monthly Activity*
Est. Yearly Activity*
16th between Blake & Wazee 2,732 1,877 16,003 527,576 6,594,69416th between Lawrence & Larimer 3,463 2,708 21,518 709,384 8,867,29516th between Lawrence & Arapahoe 4,466 3,559 28,000 1,000,011 12,500,14016th between California & Stout 5,788 4,073 34,266 1,129,636 14,120,45016th between Welton & California 5,825 4,313 35,287 1,163,309 14,541,35916th between Glenarm & Welton 6,276 4,620 37,918 1,250,048 15,625,60116th between Tremont & Glenarm 6,121 3,773 34,233 1,128,570 14,107,12116TH STREET MALL AVERAGE* 4,953 3,560 29,604 986,933 12,336,666*numbers derived from the average between extrapolation based on mid-day count and extrapolation based on evening count
Special EventsThe BID counted pedestrian activity on the 16th Street Mall during a special event, Make Music Denver, in June 2012. Make Music Denver resulted in a 23% increase in pedestrian activity on 16th Street between California and Welton between 11:30am and 1:30pm and a 20% increase between 5:00pm and 7:00pm.
7
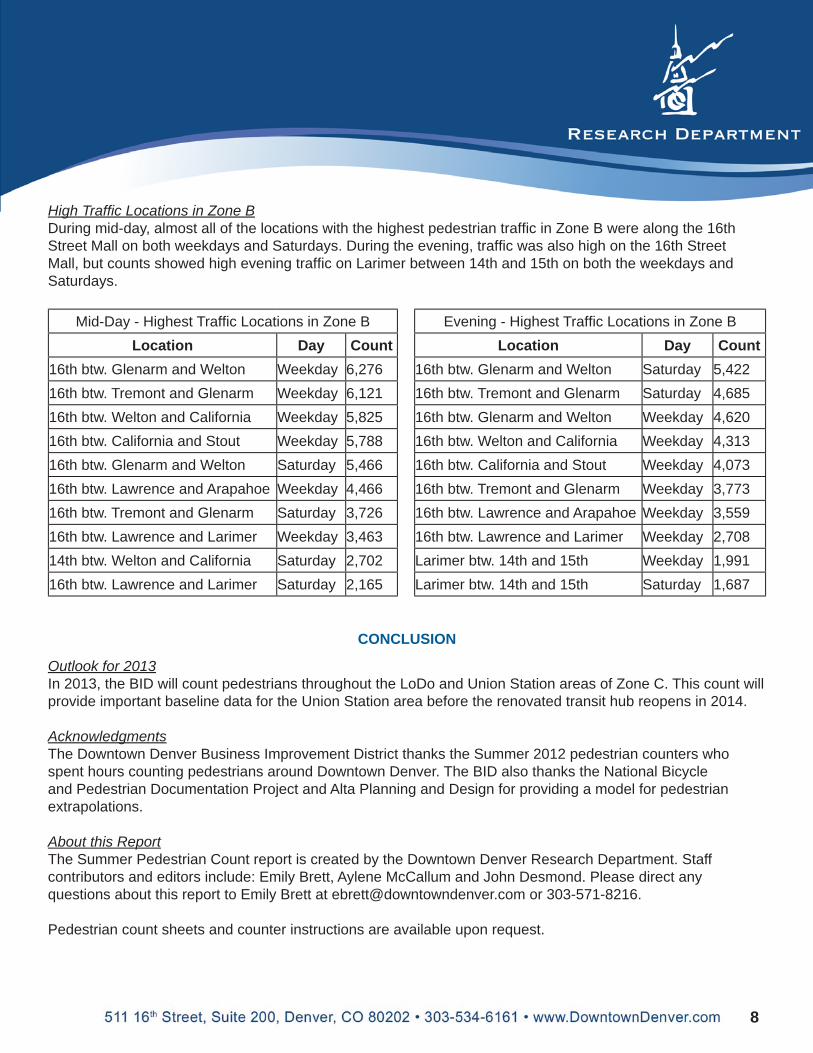
High Traffi c Locations in Zone BDuring mid-day, almost all of the locations with the highest pedestrian traffi c in Zone B were along the 16th Street Mall on both weekdays and Saturdays. During the evening, traffi c was also high on the 16th Street Mall, but counts showed high evening traffi c on Larimer between 14th and 15th on both the weekdays and Saturdays.
Mid-Day - Highest Traffi c Locations in Zone B Evening - Highest Traffi c Locations in Zone BLocation Day Count Location Day Count
16th btw. Glenarm and Welton Weekday 6,276 16th btw. Glenarm and Welton Saturday 5,42216th btw. Tremont and Glenarm Weekday 6,121 16th btw. Tremont and Glenarm Saturday 4,68516th btw. Welton and California Weekday 5,825 16th btw. Glenarm and Welton Weekday 4,620 16th btw. California and Stout Weekday 5,788 16th btw. Welton and California Weekday 4,313 16th btw. Glenarm and Welton Saturday 5,466 16th btw. California and Stout Weekday 4,073 16th btw. Lawrence and Arapahoe Weekday 4,466 16th btw. Tremont and Glenarm Weekday 3,773 16th btw. Tremont and Glenarm Saturday 3,726 16th btw. Lawrence and Arapahoe Weekday 3,55916th btw. Lawrence and Larimer Weekday 3,463 16th btw. Lawrence and Larimer Weekday 2,708 14th btw. Welton and California Saturday 2,702 Larimer btw. 14th and 15th Weekday 1,991 16th btw. Lawrence and Larimer Saturday 2,165 Larimer btw. 14th and 15th Saturday 1,687
CONCLUSION
Outlook for 2013In 2013, the BID will count pedestrians throughout the LoDo and Union Station areas of Zone C. This count will provide important baseline data for the Union Station area before the renovated transit hub reopens in 2014.
AcknowledgmentsThe Downtown Denver Business Improvement District thanks the Summer 2012 pedestrian counters who spent hours counting pedestrians around Downtown Denver. The BID also thanks the National Bicycle and Pedestrian Documentation Project and Alta Planning and Design for providing a model for pedestrian extrapolations.
About this ReportThe Summer Pedestrian Count report is created by the Downtown Denver Research Department. Staff contributors and editors include: Emily Brett, Aylene McCallum and John Desmond. Please direct any questions about this report to Emily Brett at [email protected] or 303-571-8216.
Pedestrian count sheets and counter instructions are available upon request.
8
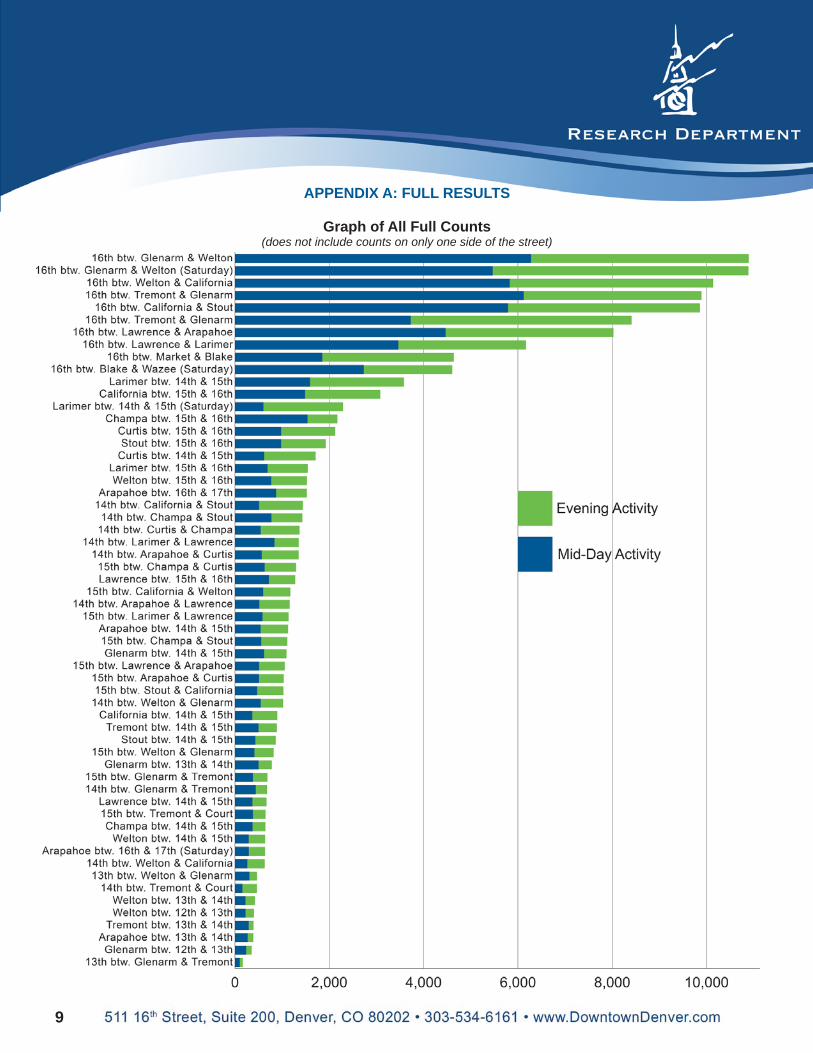
APPENDIX A: FULL RESULTS
Graph of All Full Counts (does not include counts on only one side of the street)
9
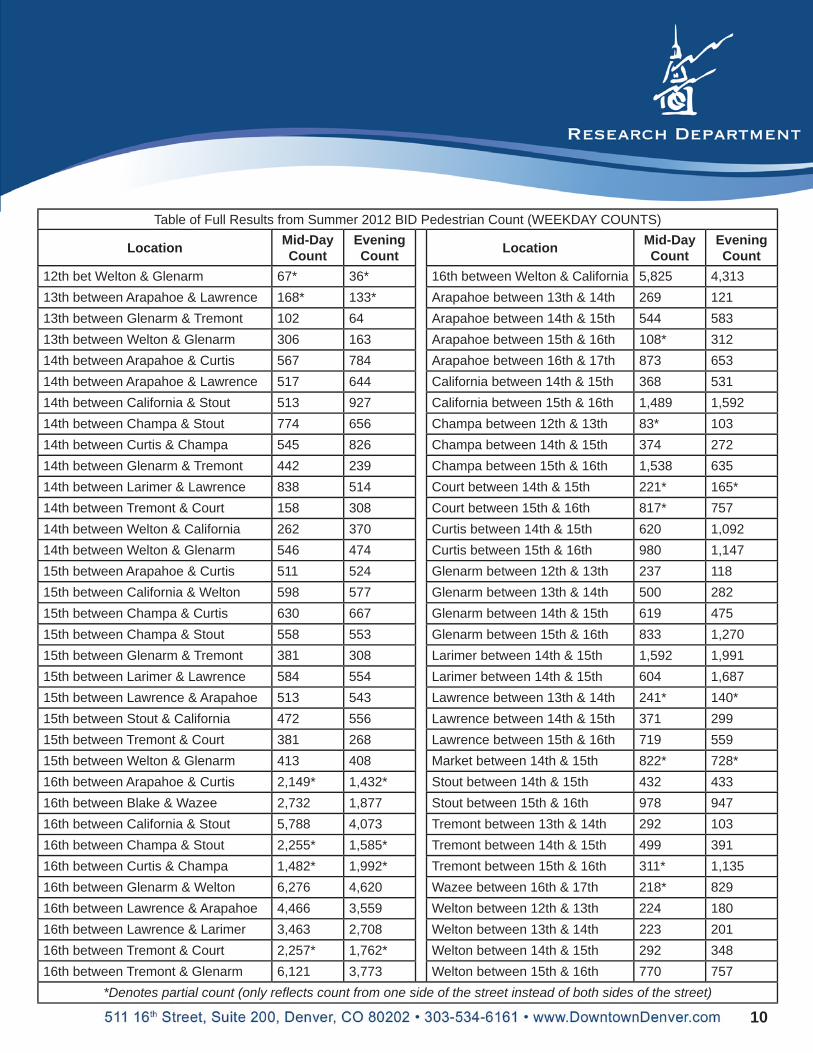
Table of Full Results from Summer 2012 BID Pedestrian Count (WEEKDAY COUNTS)
Location Mid-DayCount
EveningCount Location Mid-Day
CountEveningCount
12th bet Welton & Glenarm 67* 36* 16th between Welton & California 5,825 4,313 13th between Arapahoe & Lawrence 168* 133* Arapahoe between 13th & 14th 269 121 13th between Glenarm & Tremont 102 64 Arapahoe between 14th & 15th 544 583 13th between Welton & Glenarm 306 163 Arapahoe between 15th & 16th 108* 312 14th between Arapahoe & Curtis 567 784 Arapahoe between 16th & 17th 873 653 14th between Arapahoe & Lawrence 517 644 California between 14th & 15th 368 531 14th between California & Stout 513 927 California between 15th & 16th 1,489 1,592 14th between Champa & Stout 774 656 Champa between 12th & 13th 83* 103 14th between Curtis & Champa 545 826 Champa between 14th & 15th 374 272 14th between Glenarm & Tremont 442 239 Champa between 15th & 16th 1,538 635 14th between Larimer & Lawrence 838 514 Court between 14th & 15th 221* 165* 14th between Tremont & Court 158 308 Court between 15th & 16th 817* 757 14th between Welton & California 262 370 Curtis between 14th & 15th 620 1,092 14th between Welton & Glenarm 546 474 Curtis between 15th & 16th 980 1,147 15th between Arapahoe & Curtis 511 524 Glenarm between 12th & 13th 237 118 15th between California & Welton 598 577 Glenarm between 13th & 14th 500 282 15th between Champa & Curtis 630 667 Glenarm between 14th & 15th 619 475 15th between Champa & Stout 558 553 Glenarm between 15th & 16th 833 1,270 15th between Glenarm & Tremont 381 308 Larimer between 14th & 15th 1,592 1,991 15th between Larimer & Lawrence 584 554 Larimer between 14th & 15th 604 1,687 15th between Lawrence & Arapahoe 513 543 Lawrence between 13th & 14th 241* 140* 15th between Stout & California 472 556 Lawrence between 14th & 15th 371 299 15th between Tremont & Court 381 268 Lawrence between 15th & 16th 719 559 15th between Welton & Glenarm 413 408 Market between 14th & 15th 822* 728* 16th between Arapahoe & Curtis 2,149* 1,432* Stout between 14th & 15th 432 433 16th between Blake & Wazee 2,732 1,877 Stout between 15th & 16th 978 947 16th between California & Stout 5,788 4,073 Tremont between 13th & 14th 292 103 16th between Champa & Stout 2,255* 1,585* Tremont between 14th & 15th 499 391 16th between Curtis & Champa 1,482* 1,992* Tremont between 15th & 16th 311* 1,135 16th between Glenarm & Welton 6,276 4,620 Wazee between 16th & 17th 218* 829 16th between Lawrence & Arapahoe 4,466 3,559 Welton between 12th & 13th 224 180 16th between Lawrence & Larimer 3,463 2,708 Welton between 13th & 14th 223 201 16th between Tremont & Court 2,257* 1,762* Welton between 14th & 15th 292 348 16th between Tremont & Glenarm 6,121 3,773 Welton between 15th & 16th 770 757
*Denotes partial count (only refl ects count from one side of the street instead of both sides of the street)
10
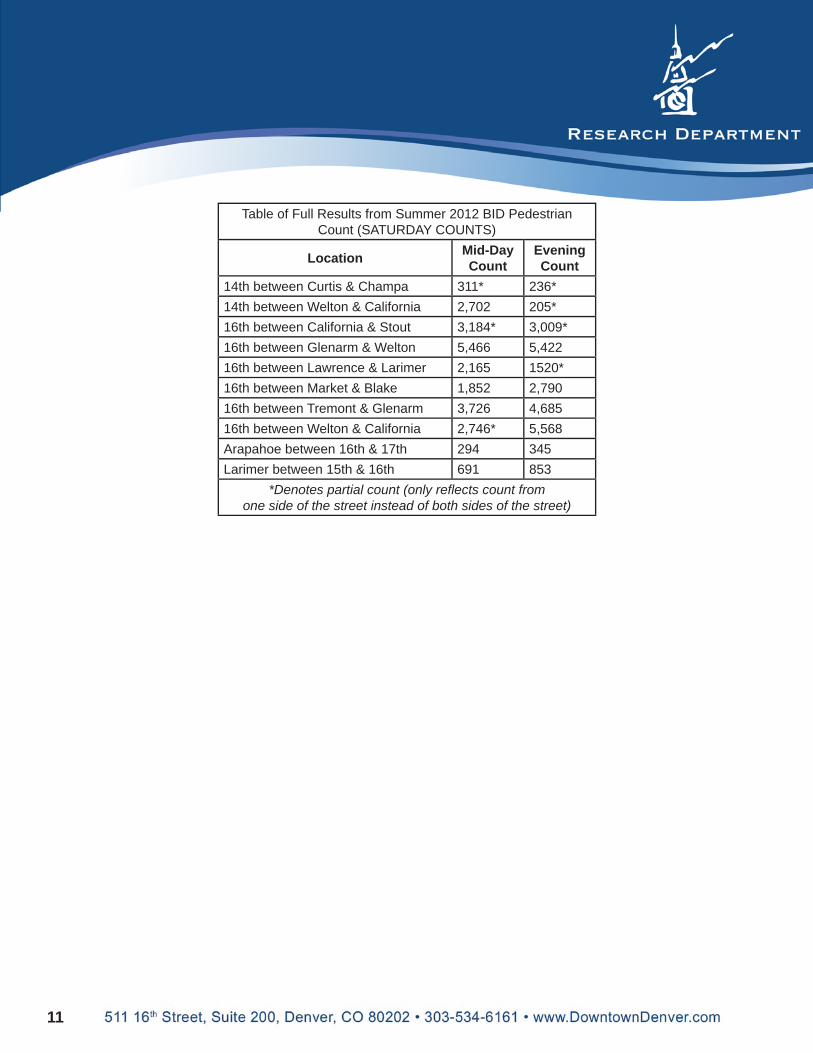
Table of Full Results from Summer 2012 BID Pedestrian Count (SATURDAY COUNTS)
Location Mid-Day Count
Evening Count
14th between Curtis & Champa 311* 236* 14th between Welton & California 2,702 205* 16th between California & Stout 3,184* 3,009* 16th between Glenarm & Welton 5,466 5,422 16th between Lawrence & Larimer 2,165 1520* 16th between Market & Blake 1,852 2,790 16th between Tremont & Glenarm 3,726 4,685 16th between Welton & California 2,746* 5,568 Arapahoe between 16th & 17th 294 345 Larimer between 15th & 16th 691 853
*Denotes partial count (only refl ects count from one side of the street instead of both sides of the street)
11
APPENDIX B: EXPLANATION OF NBPD EXTRAPOLATION PROCESS
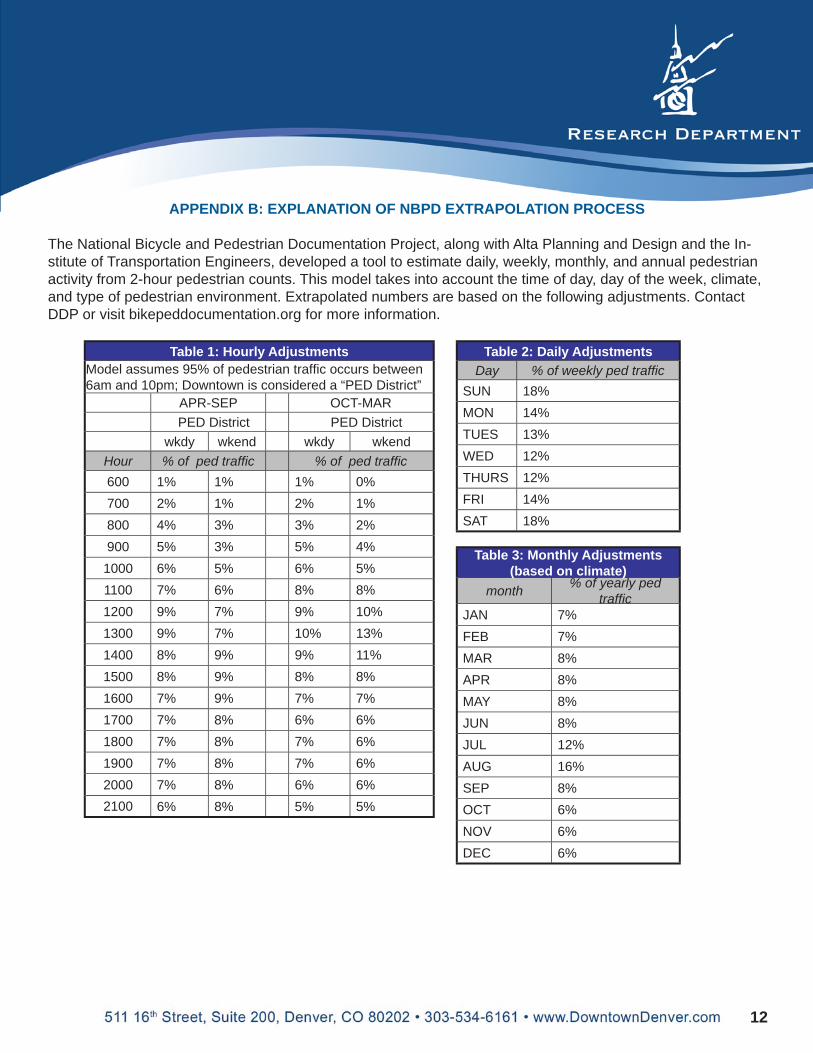
The National Bicycle and Pedestrian Documentation Project, along with Alta Planning and Design and the In-stitute of Transportation Engineers, developed a tool to estimate daily, weekly, monthly, and annual pedestrian activity from 2-hour pedestrian counts. This model takes into account the time of day, day of the week, climate, and type of pedestrian environment. Extrapolated numbers are based on the following adjustments. Contact DDP or visit bikepeddocumentation.org for more information.
Table 1: Hourly AdjustmentsModel assumes 95% of pedestrian traffi c occurs between 6am and 10pm; Downtown is considered a “PED District”
APR-SEP OCT-MAR PED District PED Districtwkdy wkend wkdy wkend
Hour % of ped traffi c % of ped traffi c600 1% 1% 1% 0%700 2% 1% 2% 1%800 4% 3% 3% 2%900 5% 3% 5% 4%
1000 6% 5% 6% 5%1100 7% 6% 8% 8%1200 9% 7% 9% 10%1300 9% 7% 10% 13%1400 8% 9% 9% 11%1500 8% 9% 8% 8%1600 7% 9% 7% 7%1700 7% 8% 6% 6%1800 7% 8% 7% 6%1900 7% 8% 7% 6%2000 7% 8% 6% 6%2100 6% 8% 5% 5%
Table 2: Daily AdjustmentsDay % of weekly ped traffi c
SUN 18%MON 14%TUES 13%WED 12%THURS 12%FRI 14%SAT 18%
Table 3: Monthly Adjustments (based on climate)
month % of yearly ped traffi c
JAN 7%FEB 7%MAR 8%APR 8%MAY 8%JUN 8%JUL 12%AUG 16%SEP 8%OCT 6%NOV 6%DEC 6%
12