Embed Size (px)
Citation preview
Deborah L. Linebarger, Ph.D.
Katie McMenamin, B.A.
Deborah K. Wainwright, M.A.
Children’s Media Lab
Annenberg School for Communication
University of Pennsylvania
SUMMATIVE EVALUATION OF
SUPER WHY!
OUTCOMES, DOSE, AND APPEAL
Deborah L. Linebarger, Ph.D.
Katie McMenamin, B.A.
Deborah K. Wainwright, M.A.
Children’s Media Lab
Annenberg School for Communication
University of Pennsylvania
2 | P a g e
We would like to thank the talented and dedicated efforts of the staff and students who helped with this project. A special thank you goes to Carrie Whitworth for her hard work and dedication to all data collection efforts. In addition, we would like to thank the children and families who we were fortunate enough to work. Without their time, energy, and enthusiasm, this project would not have been completed. For additional information, please contact: Dr. Deborah L. Linebarger Director, Children’s Media Lab Annenberg School for Communication University of Pennsylvania 3620 Walnut Street Philadelphia, PA 19104 215.898.7855 (lab) 215.898.2024 (fax) Email: [email protected] Website: www.asc.upenn.edu/childrenmedia
3 | P a g e
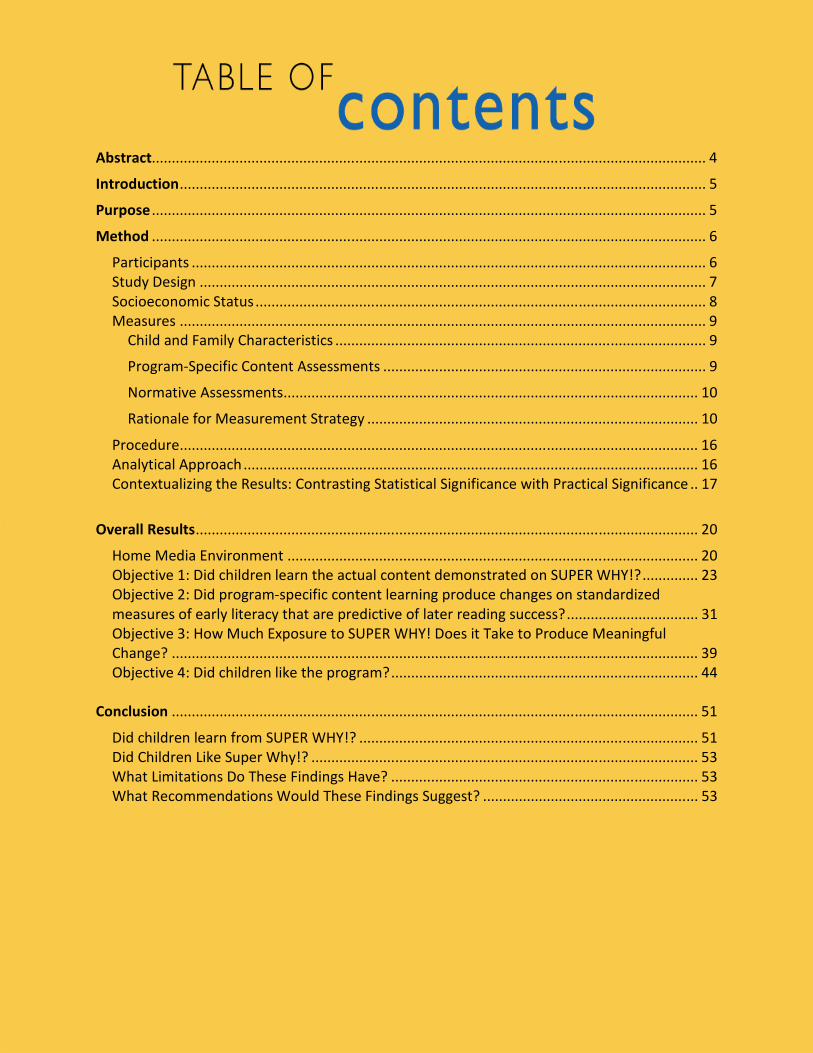
Abstract........................................................................................................................................... 4
Introduction .................................................................................................................................... 5
Purpose ........................................................................................................................................... 5
Method ........................................................................................................................................... 6
Participants ................................................................................................................................. 6
Study Design ............................................................................................................................... 7
Socioeconomic Status ................................................................................................................. 8
Measures .................................................................................................................................... 9
Child and Family Characteristics ............................................................................................. 9
Program-Specific Content Assessments ................................................................................. 9
Normative Assessments ........................................................................................................ 10
Rationale for Measurement Strategy ................................................................................... 10
Procedure .................................................................................................................................. 16
Analytical Approach .................................................................................................................. 16
Contextualizing the Results: Contrasting Statistical Significance with Practical Significance .. 17
Overall Results .............................................................................................................................. 20
Home Media Environment ....................................................................................................... 20
Objective 1: Did children learn the actual content demonstrated on SUPER WHY!? .............. 23
Objective 2: Did program-specific content learning produce changes on standardized
measures of early literacy that are predictive of later reading success? ................................. 31
Objective 3: How Much Exposure to SUPER WHY! Does it Take to Produce Meaningful
Change? .................................................................................................................................... 39
Objective 4: Did children like the program? ............................................................................. 44
Conclusion .................................................................................................................................... 51
Did children learn from SUPER WHY!? ..................................................................................... 51
Did Children Like Super Why!? ................................................................................................. 53
What Limitations Do These Findings Have? ............................................................................. 53
What Recommendations Would These Findings Suggest? ...................................................... 53
4 | P a g e
Abstract
Decades of research support our understanding that, created with the intent to teach, educational
television can go far toward supporting a child’s academic and prosocial development (Fisch & Truglio,
2001; Singer & Singer, 2001). The newest addition to the educational television landscape is SUPER
WHY!, a program that uses a narrative framework, participatory requests, and pseudo-contingent
feedback to solve problems through storybook reading, modeling of key early literacy skills, and fun,
interactive games. In total, 171 preschool children were randomly assigned to a SUPER WHY! viewing
group or a Control viewing group. Parents were asked to have their children view 20 episodes of their
assigned program twice and were asked to keep detailed logs reflecting who was viewing, which
episodes were viewed, and how many times each episode was viewed. Children’s early literacy skills as
measured using both program-specific content learning and normative performance were evaluated
prior to viewing, after viewing all episodes at least one time, and after viewing all episodes a second
time. Children who viewed SUPER WHY! over an 8-week period (i.e., at least 20 hours of viewing)
outperformed their Control group peers on nearly all indices of program-specific learning as well as the
majority of normative outcomes. Learning was most pronounced for letter knowledge and phonological
and phonemic awareness skills, key early precursors to conventional reading success. To produce
meaningful change on the outcomes of interest, children typically needed to view fewer than 10
episodes and generally closer to 3 or 4 episodes. Not only did children’s early literacy skills demonstrate
significant and sustained growth associated with watching SUPER WHY!, they also loved the program
and its characters. This high level of appeal suggests that SUPER WHY! has been successful in supporting
learning in a highly engaging environment that is likely to maintain children’s interest.
5 | P a g e
Introduction
Decades of research support our understanding that, created with the intent to teach, educational
television can go far toward supporting a child’s academic and prosocial development (Fisch & Truglio,
2001; Singer & Singer, 2001). Since the creation of the foundational program Sesame Street in the late
1960s, television shows continue to be developed, tested, revised and improved in order to extend the
role of broadcast television as an in-home instructor. This formative and summative evaluation process
has provided program developers with an understanding of the way in which educational material must
be presented in order for a program to capture a child’s attention, engage him cognitively and ultimately
to foster his learning (Anderson, Bryant, Wilder, Santomero, Williams & Crawley 2000; Rice, Huston &
Wright, 1982). The most recent addition to television’s educational landscape is a program called SUPER
WHY! (SW). This series is aimed at viewers 3 to 6 years of age and focuses on the development of
critical early literacy skills including alphabet and word family knowledge, spelling, comprehension,
vocabulary and story structure. What makes SW unique is its incorporation of interactive features
similar to those found to be successful in engaging viewers in the program Blue’s Clues (Anderson,
2000). The on-screen “teachers” in SW speak to and ask questions of at-home viewers in order to
connect with them and direct their learning. By using relatable characters, familiar stories, interactive
games, humor, and a sense of adventure in each story, SW encourages kids to approach the literacy
curriculum in an engaging way. Each episode of SW exposes viewers to the elements of literacy that are
fundamental to later, successful reading: stories, characters, language development, vocabulary, letter
identification, letter sounds, rhyming, word families, comprehension, and text.1 The foundation of the
curriculum is that, through interactivity and practice, preschoolers will both learn to read and love to
read.
Purpose
This study was undertaken with the dual purposes of determining the ability of the children’s
educational television program SUPER WHY! to effectively help children acquire key early literacy skills
(i.e., language development, letter knowledge, phonological and phonemic awareness, and print
conventions) as well as evaluating the appeal of SUPER WHY! (SW) for preschool children. Specifically,
did the program produce positive changes in the acquisition of these early literacy skills; how much
SUPER WHY! did it take to produce meaningful changes; and did children like the program? An
experimental research design was used to answer these questions. Children were randomly assigned to
one of two groups: a SUPER WHY! viewing group and a control group (i.e., viewed an alternate
program). This approach allowed us to answer basic questions about the program’s ability to produce
growth in early literacy skills over time. Specific program objectives evaluated included:
� Objective 1: Did children learn the actual content demonstrated on SUPER WHY!?
� Objective 2: Did program-specific content learning produce changes on standardized
measures of early literacy that are predictive of conventional reading success?
� Objective 3: How much exposure to SUPER WHY! does it take to produce meaningful
change?
� Objective 4: Did children like SUPER WHY!?
1 Information about the program’s educational philosophy was obtained from the Super Why! website.
6 | P a g e
Method
Participants
A total of 171 children and families (Mean age = 58.79 months, SD = 7.62; 56.1% boys) participated in
this research project. Children and families were recruited from preschools located in a large Pacific
Northwestern city. After receiving approval from the Institutional Review Board at the University of
Pennsylvania, children with parental consent participated in the assessments and viewing sessions in
their homes (n = 133) or schools (n = 38)2. Table 1 describes the participants in more detail. The children
and families in this study ranged from lower socioeconomic status (SES) to higher SES.
Table 1. Child and Family Demographic Characteristics Overall and By Group
All SUPER WHY Control
Sample Size 171 106 65
Child Characteristics
Gender 56.1% boys 58.5% boys 52.3% boys
Age 58.79 months 60.20 months 56.59 months
Birth Order 1.60 1.60 1.61
Family Characteristics
Parental Education 15.69 years
(SD = 4.52)
15.80 years 15.53 years
Mother’s Education 15.49 years
(SD = 1.96)
15.58 years
(SD = 1.88)
15.35 years
(SD = 2.09)
Father’s Education 15.89 years
(SD = 2.21)
16.02 years
(SD = 2.10)
15.70 years
(SD = 2.37)
Family Income (Real) $15K - $400K $15K - $400K $19K - $300K
Family Income (Adjusted) $8K - $223K $8K - $223K $10K - $167K
Income-to-Needs 0.60 to 12.70 0.60 – 7.94 0.62 – 6.06
Family Size 4.08
(SD = 0.98)
4.11
(SD = 0.99)
4.03
(SD = 0.97)
Parental Age 38.93
(SD = 4.52)
39.00
(SD = 4.23)
38.84
(SD = 4.99)
2 There were no systematic differences associated with where children’s testing occurred.
7 | P a g e
Study Design
A four-tiered approach to gauge the impact of SUPER WHY! was used. First, program-specific content
learning was assessed through a variety of tasks that measured children’s learning of actual and similar
program content. Although learning program-specific content is a necessary pre-condition, a more
critical evaluation of the strength of a program is whether children demonstrate more generalized gains
on standardized assessments of early literacy skills (Fisch, Kirkorian, & Anderson, 2005). Third, after
establishing that Super Why helps children acquire early literacy skills, it was important to determine
just how much exposure was needed to produce meaningful change on the outcomes of interest.
Fourth, when children participate in an experimental study, the researchers are able to manipulate the
content that children view. When gauging the overall impact of a program, it is essential to not only
demonstrate learning but also demonstrate appeal (Fisch, 2004). If children like a program, they will be
more likely to continue to view that program outside of the experimental setting, learn that program’s
specific content, and transfer program-specific learning to more generalized gains. The fourth tier of
assessment involved an evaluation of how much children like a program and its characters including
how likely they are to continue watching that program on their own.
• First, did children learn the actual content demonstrated on the show?
We answered this question in two ways. Four different program-specific tasks were created to
measure language development (i.e., symbol and word identification); letter knowledge (i.e., upper
and lower case letter identification); and phonological and phonemic awareness (i.e., aural/print
referent matching and blending). It was also important to determine whether program-specific
content was generalizable to program-similar content. For instance, children were asked to identify
picture symbols (i.e., rebus) used in episodes of SUPER WHY! Then, children were asked to identify
similar picture symbols not used in SUPER WHY! episodes. In this way, we were able to determine
whether children learned actual content and whether they could use this knowledge to complete
identical tasks with similar content.
• Second, did program-specific content learning produce changes on
standardized measures of early literacy that are predictive of later reading
success?
Program-specific content learning is essential. Without this learning, the likelihood of obtaining
more generalized gains is low. Transfer of learning, or generalization of skills learned from program-
specific content, is the ultimate goal in education and often challenging to obtain (Fisch et al, 2005).
Learning transfer was evaluated using 11 indices of early literacy skills that corresponded to the
skills featured in SUPER WHY! Ten of these indices measured early literacy skills individually:
alphabet knowledge (2 tests); phonological awareness (1 test); phonemic awareness (3 tests); oral
language knowledge (1 test); and print conventions (3 tests) while one test measured these skills
collectively.
• Third, how much exposure to Super Why does it take to produce meaningful
change?
8 | P a g e
Once the efficacy of viewing SUPER WHY! was established, the next set of questions related to the
amount of exposure or the dose of SUPER WHY! needed to produce meaningful change on the
outcomes of interest. Performing a dose analysis provides media creators with a sense of the skills
that develop quickly as a result of exposure to SUPER WHY! as well as the skills that may need more
exposure or changes to content in order for meaningful change to occur.
• Fourth, did children like the program?
Creating programs that teach young children various content or skills is a fairly straightforward
process. There are many examples of learning tools or curricula (i.e., televised programs, games,
books, computer software, internet sites, or toys) that effectively teach children new skills. The
larger challenge when creating these learning tools is to create them in such a way that children like
them, want to continue to use them, and subsequently evidence transfer of learning. Preschoolers
participated in an extensive assessment of the appeal of SUPER WHY!
Taken together, this four-tiered evaluation model provides information about the depth of impact (from
specific content to general reading ability), the amount of viewing necessary for impact, and whether
and what children liked about SUPER WHY!.
Socioeconomic Status
While educational television has been found to be a particularly powerful intervention for all children
(see Fisch, 2004), some of the largest effects have been noted for children from economically
disadvantaged backgrounds (e.g., Linebarger, Kosanic, Greenwood, & Doku, 2004). Socioeconomic
status (SES) provides an index of the financial, human, and social capital or resources that a family has.
In past research, SES has been measured in a variety of ways that typically encompass, either
individually or as a composite, family income, parental education level, parental occupation, and family
size. Children from families with more financial, human, and social capital often have access to more and
varied print materials, are read to more often, have more cognitively stimulating toys and materials
available, visit libraries and bookstores more frequently, and have more and higher-quality positive
interactions with their parents and other caregivers (e.g., Hart & Risley, 1995). In contrast, children
whose families have less capital or fewer resources often live in neighborhoods with little access to high-
quality print (e.g., fewer and lower quality books in school and public libraries or for purchase, signs with
graffiti that makes them illegible; Neuman & Celano, 2001), attend schools that are predominantly low-
achieving, and have parents who may lack time, energy, education, and resources to provide their
children with adequate early childhood experiences key to fostering their children’s early language and
literacy skills (Smith, Brooks-Gunn, & Klebanov, 1997).
In this study, SES categories were formed using a metric derived from combined family income and
family size. This metric, called an income-to-needs ratio, was created by dividing family income by the
US poverty threshold for a particular family’s size (e.g., the 2008 poverty threshold for a family of 4 was
$21,200). Families were recruited from an urban location in the Pacific Northwest. The cost-of-living in
this region was higher than the United States national average. As a result, actual incomes were inflated,
suggesting that families had more financial, human, or social capital than they really did. Cost-of-living
adjustments were made to equate each family’s annual income to the United States’ average cost-of-
living, defined as 1.0. Then, using the US Bureau of Labor Statistics’ guidelines, families with income-to-
needs ratios below 2.0 were classified as low-income because they were living in or near poverty (i.e.
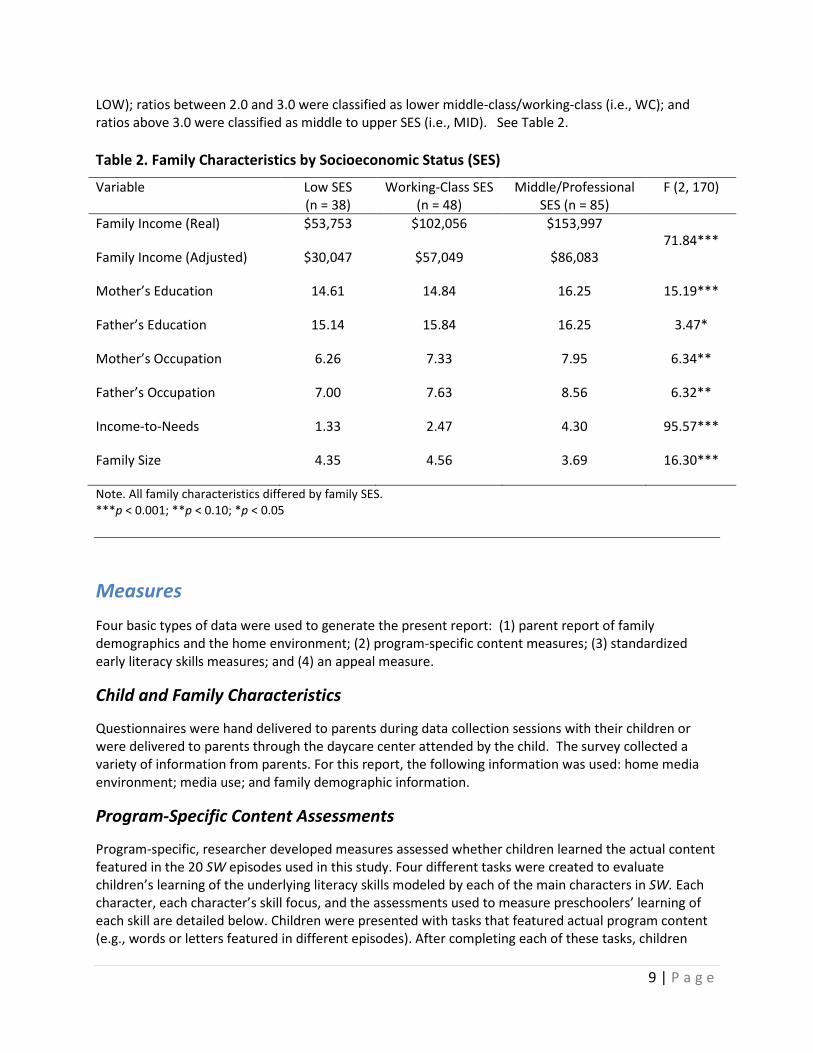
9 | P a g e
LOW); ratios between 2.0 and 3.0 were classified as lower middle-class/working-class (i.e., WC); and
ratios above 3.0 were classified as middle to upper SES (i.e., MID). See Table 2.
Table 2. Family Characteristics by Socioeconomic Status (SES)
Variable Low SES
(n = 38)
Working-Class SES
(n = 48)
Middle/Professional
SES (n = 85)
F (2, 170)
Family Income (Real) $53,753 $102,056 $153,997
71.84***
Family Income (Adjusted) $30,047 $57,049 $86,083
Mother’s Education 14.61 14.84 16.25 15.19***
Father’s Education 15.14 15.84 16.25 3.47*
Mother’s Occupation 6.26 7.33 7.95 6.34**
Father’s Occupation 7.00 7.63 8.56 6.32**
Income-to-Needs 1.33 2.47 4.30 95.57***
Family Size 4.35 4.56 3.69 16.30***
Note. All family characteristics differed by family SES.
***p < 0.001; **p < 0.10; *p < 0.05
Measures
Four basic types of data were used to generate the present report: (1) parent report of family
demographics and the home environment; (2) program-specific content measures; (3) standardized
early literacy skills measures; and (4) an appeal measure.
Child and Family Characteristics
Questionnaires were hand delivered to parents during data collection sessions with their children or
were delivered to parents through the daycare center attended by the child. The survey collected a
variety of information from parents. For this report, the following information was used: home media
environment; media use; and family demographic information.
Program-Specific Content Assessments
Program-specific, researcher developed measures assessed whether children learned the actual content
featured in the 20 SW episodes used in this study. Four different tasks were created to evaluate
children’s learning of the underlying literacy skills modeled by each of the main characters in SW. Each
character, each character’s skill focus, and the assessments used to measure preschoolers’ learning of
each skill are detailed below. Children were presented with tasks that featured actual program content
(e.g., words or letters featured in different episodes). After completing each of these tasks, children
10 | P a g e
completed the same type of task with content that was not found in any of the programs. For instance,
children were asked to identify a rebus found in the Humpty Dumpty episode (i.e., horses). This rebus
symbol was taken directly from the Humpty Dumpty episode. After answering all program-specific rebus
items, children were asked to identify other rebus symbols not found in any SW episodes (e.g., fruit).
While the skills and the task were the same, the content in the latter items was not found in any of the
SW episodes. In this way, we were able to examine whether children were able to complete program-
similar assessments using knowledge or skills gained while watching SW.
Normative Assessments
Normative or standardized assessments were selected to evaluate whether viewing SW could help
preschoolers generalize any specific program content learning to standardized assessments of early
literacy skills. As with the program-specific assessments,
the normative tasks were selected to evaluate the
literacy skills uniquely supported by each of the 4 main
characters.
Rationale for Measurement Strategy
Measures were selected or developed to assess targeted skills demonstrated throughout SW and to
reflect the key early literacy skills as described by Neuman and Roskos (2005). These skills were
language development, letter knowledge, phonological and phonemic awareness, and print
conventions. Both program-specific and normative measures tapped into each of these domains using
multiple indices.
Indicators of Language Development
Program-Specific: Rebus Reading Tasks
A rebus may be a pictorial, geometric, or completely abstract symbol that represents words or parts of
words. Research has shown that rebuses reduce the learning or cognitive load for a child just beginning
to read (Woodcock, 1968). This particular assessment was modeled after SW segments that displayed
sentences with pictures above some words in the sentence (i.e., when Super Why reads the featured
story). In this task, children were shown a picture with a sentence below it. The data collector read the
sentence aloud and, when the word with a rebus appeared, the data collector requested that the child
“read” the rebus word. Children were scored based on the accuracy of the responses provided. A child
received 2 points for providing the exact word; 1 point for providing a word that was similar in meaning
or in spelling; and 0 points for providing an incorrect answer. Five scenes depicted words, rebuses, and
sentences from randomly selected SW episodes while an additional 5 scenes depicted words, rebuses,
and sentences taken from early literacy workbooks. Because the total number of rebuses at each
measurement occasion (i.e., pre-test, mid-test, post-test) varied, any analyses done with these tasks
used scores that had been converted to standard scores (e.g., children could receive a maximum score
of 42 points at pre-test, 38 points at mid-test, and 34 points at post-test).
Program-Specific: Word Knowledge Tasks
These tasks were modeled after the segments in SW where the Super Readers and the story characters
encounter a problem and Super Why comes to the rescue by changing a word or short phrase. Super
Normative Assessments
Program-Specific Assessments
11 | P a g e
Why “saves the day!’. In this task, the child was read a short story and was then provided with a picture
that had a sentence below it (e.g. “Tom Thumb is very small. He is stuck in a haystack and cannot get
out! What should he do to get out? With the power to read, we can change the story and save the day.
Let’s change the word “small” in this sentence so we can get Tom Thumb out of the haystack. Which
word will help Tom out of the haystack? Quiet or Tall”). In order to “save the day,” the data collector
pointed to and repeated the highlighted word in the story that needed to be changed. A visual word
bank was presented and read aloud to the child and s/he was asked to identify which word should be
used to change the story (similar to the SW segment). The data collector then showed the child a new
picture depending on what word the child had chosen meant. When necessary, the child was given a
prompt to choose a different word. This measure contained 4 items at each testing point. Using
episode screenshots, two of the items featured content from a randomly selected episode (i.e. program-
specific assessment). Two additional items were created using picture books that mimicked the literacy
goal of the SW segment (i.e. program-similar assessment). Children were scored based on the answers
provided. If the child provided a correct answer right away, s/he was given two points for that item. If
the child required a prompt before providing the correct answer (i.e. s/he provided an incorrect answer
first, but then provided the appropriate word after being prompted by the data collector), s/he was
given 1 point for that item. Items that were not answered correctly were scored zero. Children could
receive a maximum of 4 points for the program-specific items and 4 points for the program-similar
items.
Normative: IGDI Picture Naming Task
Generalized vocabulary knowledge was evaluated using the Picture Naming Task, a tool that measured
children’s expressive language knowledge (PNT, Missall & McConnell, 2004). The PNT is an Individual
Growth and Development Indicator (IGDI) used to track preschoolers’ vocabulary acquisition on a
regular basis over time. Children were presented with images of objects familiar to preschoolers one at
a time and asked to name the pictures as fast as possible for one minute. Categories of objects used
included animals, food, people, household objects, games and sports materials, vehicles, tools, and
clothing. Psychometric properties for this measure were adequate. Specifically, alternate forms
reliability ranged between .44 and .78 while test-retest reliability over a two-week period was .69.
Concurrent validity estimates with the Peabody Picture Vocabulary Test – 3rd Edition (Dunn & Dunn,
1997) and with the Preschool Language Scale – 3 (Zimmerman, Steiner, & Pond, 1992) were adequate,
.53 to .79. The PNT was also sensitive to developmental status and growth over time. Children identified
21.4 pictures at the pretest (SD = 6.7). Benchmarking norms were provided by the authors: scores at 59
months averaged 16.97 for typically developing children; 16.51 for children from low income
backgrounds; and 14.13 for children with identified disabilities (Missall & McConnell, 2004).
Indicators of Letter Knowledge
Program-Specific and Normative: PALS-PreK - Alphabet Knowledge
The PALS PreK Alphabet Knowledge Task (Invernizzi, Sullivan, & Meier, 2004) was used to evaluate both
program-specific and normative alphabet letter knowledge. Although this task is a standardized one, the
component parts of the task could be used simultaneously to evaluate both program-specific learning of
alphabet letters as well as any transfer of specific alphabet letter knowledge to more sophisticated
measures of alphabet knowledge (e.g., fluency). While each episode of SUPER WHY! has at least one
segment specifically focused on letter identification, the letters identified ranged from several per
episode to a recitation of all 26 letters. Because the quality of data generated when working with young
12 | P a g e
children can be impacted by a variety of situational factors, the best course of action was to use
measures that could potentially provide multiple indices of each domain assessed. As such, using this
particular assessment reduced the data collection time and provided a continuum of letter knowledge
from identification of upper case letters to rapid letter naming fluency.
The developers of the PALS included three different tasks that tapped into various components of letter
knowledge: 1) identification of the 26 Upper Case letters; 2) identification of the 26 Lower Case letters;
and 3) identification of the sounds associated with 23 letters and 3 digraphs. Children are first presented
all 26 Upper Case letters in a random order. To be eligible to proceed to the second task, identification
of all 26 Lower Case letters, the child must correctly identify 16 Upper Case letters. To be eligible to
proceed from Lower Case letters to Letter Sounds, the child must correctly identify 9 Lower Case letters.
Psychometrics are adequate with reported reliabilities ranging from .74 to .94.
With this task, we derived three types of scores: 1) the number of letters or sounds a child could
correctly identify; 2) the number of children in each viewing group who were able to identify any Lower
Case letters or Letter Sounds (i.e., only children who reached a certain cut-off were able to proceed to
Lower Case letters and Letter Sounds); and 3) fluency scores (i.e., the number of seconds it took to
identify one letter or sound). Program-specific indicators of letter knowledge included the number of
Upper Case and the number of Lower Case letters correctly identified as well as the percentage of
children in each viewing group who were able to identify any lower case letters. Normative indicators of
letter knowledge included the number of seconds it took to identify one Upper or Lower Case letter
used as an index of letter naming fluency. Finally, the Letter Sounds task was used as an indicator of
phonological and phonemic awareness (see below).
1. Number of Letters or Sounds Correctly Identified. The average child named 20.1 Upper Case
letters at the pretest (SD = 7.4). If children correctly identified 16 or more Upper Case letters,
they were eligible to take the Lower Case letter task. The average child (including those
receiving a score of zero) identified 15.4 Lower Case letters at the pretest (SD = 5.4) while the
average child who was eligible for the task identified 21.0 Lower Case letters (SD = 4.7).If a child
was able to accurately identify at least 9 Lower Case letters, the child was eligible to take the
Letter Sounds task. The number of sounds correctly identified by the average child (including
those who were given a (0) score) was 10.1 letter sounds (SD = 5.8) while the average child who
was eligible for the Letter Sounds task identified 14.2 letter sounds (SD = 7.5) at the pretest. The
PALS PreK manual reports a Spring Developmental Range (similar to a benchmark) between 12
and 21 Upper Case letters and between 9 and 17 Lower Case letters for PreKindergarten (or
approximately 4-year-olds) children.
2. Identification of Any Lower Case Names or Letter Sounds. Children were presented with these
tasks if they were able to 1) identify 16 or more Upper Case letters and 2) 9 or more Lower Case
letters. Using these criteria, 75.0% of children were eligible to try the Lower Case task and 70.7%
of children were eligible to try the Letter Sounds task.
3. Fluency Scores. Children’s performance on each of the 3 subscales (i.e., Upper Case, Lower Case,
Letter Sounds) was timed. Then, the number of letters or sounds accurately identified was
divided by the number of seconds it took the child to complete each task. This produced a letter
or sound identification per second rate. All children were administered the Upper Case task;
therefore, all children had a fluency score associated with Upper Case Letter Knowledge. Only
those children eligible to complete the Lower Case Letter Knowledge and the Letter Sounds
tasks were included in those analyses. The average child took 2.3 seconds to identify one Upper
13 | P a g e
Case letter; 3.2 seconds to identify 1 Lower Case letter; and 7.7 seconds to identify one Letter
Sound at the pre-test.
Indicators of Phonological and Phonemic Awareness
Program-Specific: Blending Tasks
The blending task was created to evaluate children’s understanding that the sounds of spoken language
can be blended together to form words. Items were randomly ordered and included syllable blending
(i.e., ability to blend syllables together to form a word when the syllables are presented individually) and
phoneme blending (i.e., ability to blend individually presented sounds together to form words). While
pointing to each picture, the data collector labeled each of 4 pictures on the picture card and asked the
child to point to the picture that depicted the onset and rime presented by the evaluator (i.e. the target
word). The words/pictures selected for this measure were based on the word families used in the
Wonder Red segments. For each item, three additional non-target words/pictures were given as options
– two words belonged to the same word family as the target word and one word had the same onset as
the target word. At least one non-target word was selected from the database of words appearing
onscreen in the program. Program-similar content used the same set of criteria to select words;
however, none of the words were found in any SW episodes. Children were given a score of a (1) for
every correct answer provided and a (0) for every incorrect answer provided, with a maximum score of 8
on each task at each testing point.
Program-Specific: Speech to Print Matching Tasks
This task evaluated children’s understanding of the one-to-one correspondence between printed words
and spoken words. Children acquire this skill as they are exposed to words during read alouds or when
adults point to words in other contexts (e.g., at the grocery store). Over time, this exposure leads
children to understand that words are composed of letters and that sentences are composed of words.
Children were shown 20 cards with 3 words printed on each card and asked to point to the word that
the examiner said. Cards contained words that were featured in SW episodes and words that were not
found in any episodes. Word selection was based on the following criteria, with the level of difficulty
increasing from beginning to end: (1) Different initial/final single consonants, different middle vowels;
(2) Different initial/final single consonants, different middle vowels (add in a 4-letter word); (3) Same
initial single consonants, different middle vowels, different final single consonants; (4) Same initial single
consonants, two vowels (with target vowel) the same, one vowel different, different final single
consonants; (5) Same initial and final consonants (can introduce two initial blends with the target word
having one of these blends), two vowels (with target vowel) the same, one vowel different; (6) Same
initial blend for two of the words, one initial blend different (blends: ch, cl, tr, etc.), same final
consonant, different middle vowels; (7) Same initial and final single consonants, different middle vowels;
(8) Same initial and final single consonants, different middle vowels; (9) Same initial consonants,
different middle vowels,[can introduce silent ‘e’ into two of the words or introduce ‘oo’ vs. ‘ou’]; and
(10) Same initial consonant, add in one blend , same final phoneme/sound, same middle vowel. There
were 10 words based on SW content and an additional 10 words not found in SW. Children were given a
score of a (1) for every correct answer provided and a (0) for every incorrect answer provided, with a
maximum score of 20 at each testing point.
14 | P a g e
Normative: PALS-PreK - Rhyme Awareness
Rhyme awareness is one aspect of beginning phonological awareness, or an ability to attend to and
manipulate sound units within spoken words (Invernizzi et al., 2004). Children were asked to identify a
picture name that rhymed with a target word. Acceptable responses could be verbal or nonverbal (e.g.,
pointing to the correct picture). This PALS PreK subtest is designed to provide an appropriate level of
difficulty for preschool children (neither too difficult nor too easy) and has demonstrated a strong
predictive relationship with later reading achievement. Children were given a score of (1) for every
correct answer provided and a (0) for every incorrect answer provided, with a maximum score of 10 at
each testing point. Children correctly identified 7.5 rhymes at the pretest (SD = 2.2). The PALS PreK
manual reports a Spring Developmental Range (similar to a benchmark) between 5 and 7 rhymes.
Normative: PALS-PreK – Alphabet Knowledge
A description of this task was detailed above. Only the indices that were derived from this measure to
represent Phonological and Phonemic Awareness are discussed below.
1. Identification of Any Letter Sounds. The percentage of children in each viewing group who were
eligible to take the Letter Sounds task was recorded. On the whole, 70.7% of children at the
pretest were eligible to try the Letter Sounds task.
2. Number of Sounds Correctly Identified. The number of letter sounds a child was able to identify
correctly was recorded. The average child including those who were given a (0) score identified
10.1 letter sounds (SD = 5.8) while the average child who was eligible for the task identified 14.2
letter sounds (SD = 7.5) at the pretest. The PALS PreK manual reports a Spring Developmental
Range (similar to a benchmark) between 4 and 8 letter sounds.
3. Letter Sounds Fluency. Children’s performance on the Letter Sounds subscale was timed. Then,
the number of items accurately identified was divided by the number of seconds it took the
child to complete each task. This produced a sound identification per second rate. Only those
children eligible to attempt the Letter Sounds task were included in those analyses. The average
child took 7.7 seconds at the pre-test to identify one letter sound.
Indicators of Print Conventions
Normative: Print and Story Concepts Tasks
This assessment was adapted from the Head Start FACES Survey (information available online:
http://www.acf.hhs.gov/programs/opre/hs/faces/instruments/child_instru02/language_story.html) to
examine children’s understanding of basic story concepts including book knowledge, print knowledge,
and reading comprehension. Although Print Conventions were modeled onscreen, we measured these
skills using only normative tasks.3 Book knowledge examined children’s familiarity with storybooks and
3 Typically, print conventions are evaluated using story books. The data collector and the child read a book
together. During the book-reading, the data collector asks a series of questions to evaluate children’s
understanding of book knowledge (i.e., title, author, first page, orientation of the book); print knowledge (i.e.,
mechanics of reading including from left to right, top to bottom, and word by word); and story comprehension
(i.e., identification of actual story events and inferences from these events to content not presented in a story).
The normative task averaged 15 minutes per child. Because we had concerns about child fatigue and disinterest
15 | P a g e
print conventions such as where the front of the book is, where to begin reading, and differentiating
print from pictures. Print knowledge examined children’s knowledge of the mechanics of reading
including reading from left to right, top to bottom, and word-by-word pointing. Reading comprehension
measured children’s knowledge of a story plot and required them to answer questions based on
presented story content (e.g., what is said goodnight to in Goodnight Moon) and well as to generate
inferences (e.g., how does a character feel) and to make predictions (e.g., what do you think happens
next in this story?). Different books were used at each testing point: Goodnight Moon by Margaret Wise
Brown was used at Pre-Test, Where’s My Teddy? by Jez Alborough was used at Mid-Test, and Big Red
Barn by Margaret Wise Brown was used at Post-Test. While most questions were based on a scoring
system of (0) incorrect and (1) correct, some of the comprehension questions were worth up to 3 points.
Each print and story construct was summed to form three scores for analysis: book knowledge, print
knowledge, and reading comprehension. At the pretest, Book Knowledge scores averaged 4.02 of 6.00
(SD = 1.54); Print Knowledge scores averaged 2.39 of 4.00 (SD = 1.53); and Reading Comprehension
socres averaged 6.82 of 9.00 (SD = 2.58).
Combined Early Literacy Skills
Normative: Get Ready to Read! Screener
This screener, consisting of 20 items, assessed print knowledge (i.e., knowledge of the letters of the
alphabet); book knowledge (recognition of how books work including the difference between words and
images); phonological awareness (i.e., understanding that spoken words are composed of individual
sounds); phonics (i.e., recognition of the sounds letters make); and writing (i.e., understanding how text
should look: letters grouped together into words). Each item required the child to select a response
from a group of four pictures (or four letters, words, etc.). Example: “These are pictures of a book. Find
the one that shows the back of the book.” Example: “Find the letter that makes a tuh sound.” Example:
“Some children wrote their name. Find the one that is written the best.” Children were given a score of
a (1) for every correct answer provided and a (0) for every incorrect answer provided, with a maximum
score of 20 points. The average pretest score was 15.90 (SD = 3.50). Scores greater than 11 are
predictive of reading success by 2nd grade.
resulting from the use of two different books (i..e, one using SW content and the other not doing so), we only used
the normative index.
16 | P a g e
Procedure
Children were randomly assigned to either a SW-viewing group or a Control-viewing group. The control
stimulus was a science-based preschool program with no specific focus on literacy (i.e., Zoboomafoo).
Prior to viewing any television episodes, all children were pre-tested on all program-specific and
normative indices. For the first round of viewing, children were instructed to watch 20 episodes of their
assigned program over the course of 4 weeks (equivalent to the first season of SUPER WHY!). Parents
were given viewing logs to complete at each round. The viewing logs asked parents to (1) record who
their child watched an episode with (alone, with a friend or sibling, or with a parent) and (2) how many
additional times the child viewed that episode. After four weeks of viewing, data collectors
administered mid-test assessments to all children. The second round of viewing began after the mid-
test point and DVDs were redistributed to the participants4. After another 4 weeks of viewing, children
were administered post-test assessments along with a program appeal assessment.
Analytical Approach
Simple descriptive statistics (i.e., mean, standard deviation, percentages) are reported to describe the
children and their families. Further analyses using cross-tabs, t-tests, and chi-squares were used to test
for differences by Group (i.e., SW viewers vs. Control viewers); Gender (i.e., boys vs. girls); and SES level
(i.e., low SES vs. working-class SES vs. middle to upper SES).
Four covariates were constructed to extract relevant variance associated with both viewing and
outcomes as well as to remove possible effects associated with pre-existing child and family
characteristics. A child composite was formed by z-score transforming and summing child’s birth order,
age, and gender. A family composite was formed by z-score transforming and then summing parental
age, parental years of education, number of persons living in the home, and yearly income5. Finally, two
composites representing the child’s initial ability were constructed. First, a normative composite was
formed by z-score transforming and summing all normative assessment scores minus the measure
evaluated in a particular analysis (e.g., for the PALS Upper Case measure, the normative composite
consisted of PALS Lower Case, PALS Letter Sounds, PALS Rhyme Awareness, Print and Story Concepts,
IGDI Picture Naming, and Get Ready to Read). Second, a researcher-developed composite was formed
by z-score transforming and summing all researcher-developed scores minus the measure evaluated in a
particular analysis.
Repeated-measures Analysis of Covariance (ANCOVA) is a procedure that can be used to statistically
control for initial group differences (as measured by the child composite, the family composite, and the
child’s pre-test literacy ability) when evaluating control/viewing effects on outcome measures. Two
different models were used to evaluate each outcome. The first set of analyses involved testing the
effects of viewing group only. That is, did children who watched SW outperform children who watched
an alternate program on both program-specific and normative assessments of early literacy? Next, the
role of family socioeconomic status (SES) was examined. In these models, both Viewing Group and
Family SES were included as factors. Family SES included 3 levels (i.e., low, working-class, middle SES).
When multiple tests were conducted for each set of outcomes, Bonferroni adjustments of the alpha
level were made to reduce Type 1 error rates (i.e., finding a significant difference when one does not
4 The episode presentation was randomized. Participants received a set of randomly ordered episodes to view
prior to midtesting. After midtesting, participants received a new set of randomly ordered episodes. 5 For analyses involving Family SES, yearly income was deleted from this family composite.
17 | P a g e
exist). For these analyses, only significant effects associated with Group are reported in the text (i.e.,
Group; Wave by Group). Along with the statistical significance tests, effect sizes were also reported.
Finally, when the sphericity assumption was violated, we used a Huynh-Feldt correction to adjust the
degrees of freedom for the within-subjects contrasts.
Contextualizing the Results: Contrasting Statistical Significance with
Practical Significance
The significance of a research study and its findings can be evaluated in two ways: statistical and
practical. Statistical significance indicates the likelihood or probability that a finding is due to chance and
is examined using p-values. For instance, a p-value of 0.05 indicates that a particular effect would occur
by chance in 5 of 100 cases or, alternatively, that if a researcher conducted the exact same study under
the same conditions 100 times, 5 of those times the observed group differences would not be
significant. Practical significance provides an indication of the effectiveness of the intervention by
quantifying the magnitude of the differences between groups.
A major goal of any experimental study is to evaluate the statistical significance of various comparisons
between groups. In this study, we were interested in evaluating whether the differences between SW
viewers and Control viewers were significantly different and we used traditional statistical tests (e.g., F-
tests, t-tests, Chi-Square) to do so.
Statistical Significance
When researchers communicate the findings of their studies, there is often a focus on whether or not
some intervention had the intended effect and less attention to how much of an effect the intervention
had. Evaluating whether the intervention had an effect is accomplished using statistical significance
testing (SST). SST reflects the odds or the probability that findings were not the result of chance or,
alternatively, that these findings are likely to be found again and again if the study were repeated. For
instance, when examining group differences, a p-value of 0.05 tells the researcher that the obtained
results are expected to occur by chance just 5 times out of 100. Group differences resulting in a p-value
of 0.001 would be expected to occur by chance one time out of 1000, increasing our confidence that the
differences between groups is real rather than random (i.e., by chance). At times, researchers
mistakenly suggest that p-values are representative of the magnitude of an effect (i.e., how big a
particular effect is) and that very small p-values (e.g., 0.001) are somehow more meaningful or of
greater consequence than effects where a p-value is just 0.05. SST confounds sample size with the
magnitude of an effect particularly with large samples. That is, an effect may achieve statistical
significance simply because the sample was quite large; however, statistical significance is not
equivalent to practical significance. Therefore, statistical significance tests should not be used as a sole
measure of how much an intervention “matters.”
Practical Significance
Unlike SST, practical significance reflects the magnitude, or size, of group differences and is referred to
as an effect size (Hedges, 2008). This type of information can help researchers determine whether a
particular difference is big and meaningful or whether the difference is actually an artifact of a large
sample size. Effect sizes provide objective, standardized, and metric-free values that reflect the
magnitude of the differences between two groups and are calculated to reflect one of two types of
18 | P a g e
information: a simple effect size or a standardized effect size. A simple effect size is the raw difference
between the means of two groups. Investigators may use this type of effect size when the metric
associated with a particular finding is easily interpretable. Standardized effect sizes, on the other hand,
measures the difference between groups relative to a pooled standard deviation; that is, the differences
between groups are presented as the number of standard deviation units that separate each group. A
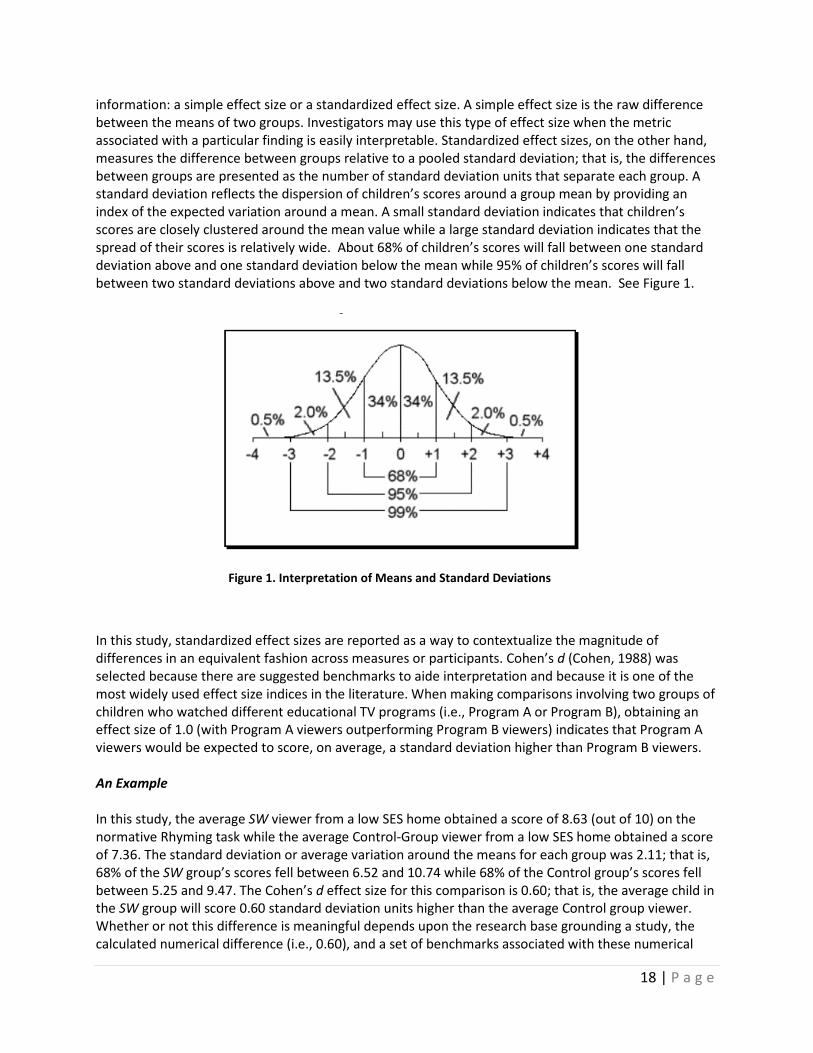
standard deviation reflects the dispersion of children’s scores around a group mean by providing an
index of the expected variation around a mean. A small standard deviation indicates that children’s
scores are closely clustered around the mean value while a large standard deviation indicates that the
spread of their scores is relatively wide. About 68% of children’s scores will fall between one standard
deviation above and one standard deviation below the mean while 95% of children’s scores will fall
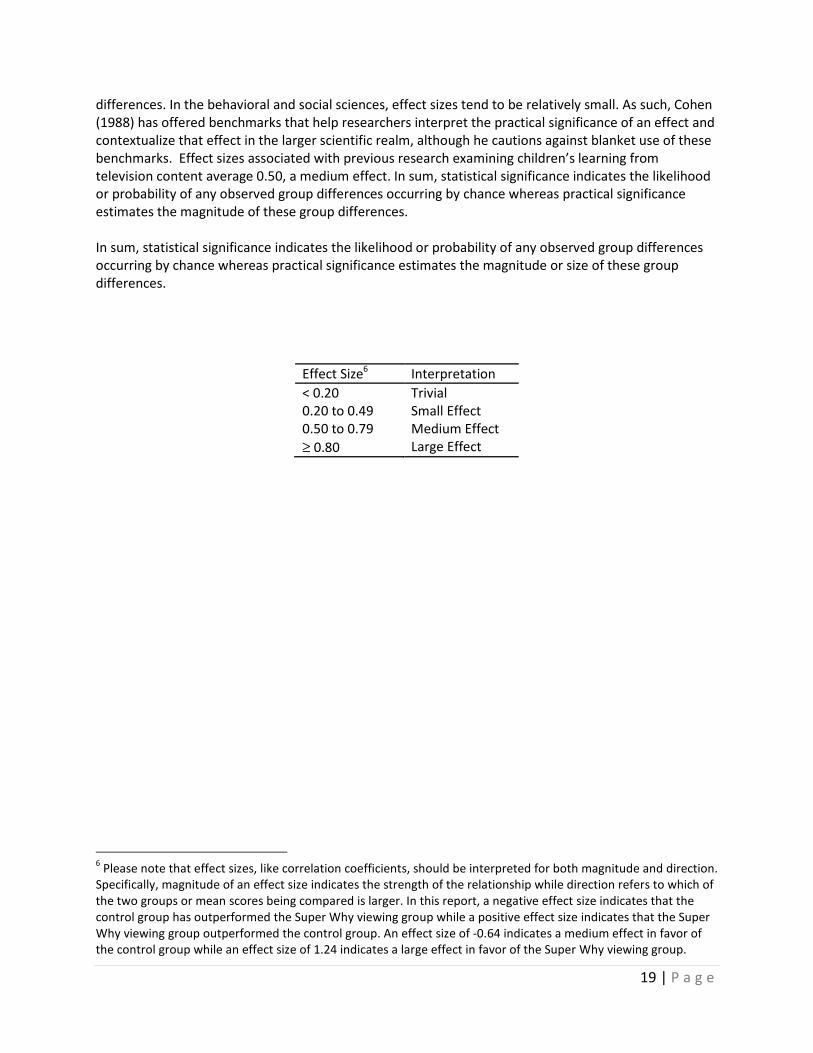
between two standard deviations above and two standard deviations below the mean. See Figure 1.
In this study, standardized effect sizes are reported as a way to contextualize the magnitude of
differences in an equivalent fashion across measures or participants. Cohen’s d (Cohen, 1988) was
selected because there are suggested benchmarks to aide interpretation and because it is one of the
most widely used effect size indices in the literature. When making comparisons involving two groups of
children who watched different educational TV programs (i.e., Program A or Program B), obtaining an
effect size of 1.0 (with Program A viewers outperforming Program B viewers) indicates that Program A
viewers would be expected to score, on average, a standard deviation higher than Program B viewers.
An Example
In this study, the average SW viewer from a low SES home obtained a score of 8.63 (out of 10) on the
normative Rhyming task while the average Control-Group viewer from a low SES home obtained a score
of 7.36. The standard deviation or average variation around the means for each group was 2.11; that is,
68% of the SW group’s scores fell between 6.52 and 10.74 while 68% of the Control group’s scores fell
between 5.25 and 9.47. The Cohen’s d effect size for this comparison is 0.60; that is, the average child in
the SW group will score 0.60 standard deviation units higher than the average Control group viewer.
Whether or not this difference is meaningful depends upon the research base grounding a study, the
calculated numerical difference (i.e., 0.60), and a set of benchmarks associated with these numerical
Figure 1. Interpretation of Means and Standard Deviations
19 | P a g e
differences. In the behavioral and social sciences, effect sizes tend to be relatively small. As such, Cohen
(1988) has offered benchmarks that help researchers interpret the practical significance of an effect and
contextualize that effect in the larger scientific realm, although he cautions against blanket use of these
benchmarks. Effect sizes associated with previous research examining children’s learning from
television content average 0.50, a medium effect. In sum, statistical significance indicates the likelihood
or probability of any observed group differences occurring by chance whereas practical significance
estimates the magnitude of these group differences.
In sum, statistical significance indicates the likelihood or probability of any observed group differences
occurring by chance whereas practical significance estimates the magnitude or size of these group
differences.
Effect Size6 Interpretation
< 0.20 Trivial
0.20 to 0.49 Small Effect
0.50 to 0.79 Medium Effect
≥ 0.80 Large Effect
6 Please note that effect sizes, like correlation coefficients, should be interpreted for both magnitude and direction.
Specifically, magnitude of an effect size indicates the strength of the relationship while direction refers to which of
the two groups or mean scores being compared is larger. In this report, a negative effect size indicates that the
control group has outperformed the Super Why viewing group while a positive effect size indicates that the Super
Why viewing group outperformed the control group. An effect size of -0.64 indicates a medium effect in favor of
the control group while an effect size of 1.24 indicates a large effect in favor of the Super Why viewing group.
Overall Results
Home Media Environment
All analyses documenting the home media environment were checked for Gender and Family SES
differences. Only when significant differences by one of these 2 factors were found are they
below; otherwise, results were aggregated across all participants.
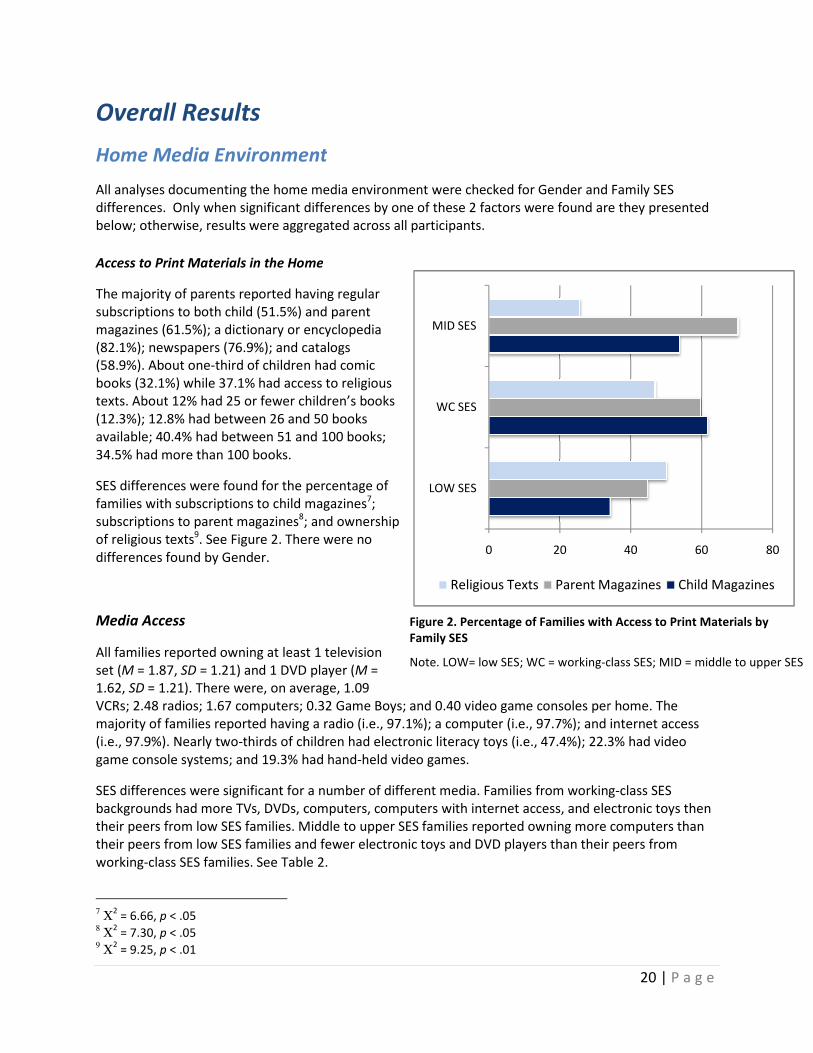
Access to Print Materials in the Home
The majority of parents reported having regular
subscriptions to both child (51.5%) and parent
magazines (61.5%); a dictionary or encyclop
(82.1%); newspapers (76.9%); and catalogs
(58.9%). About one-third of children had comic
books (32.1%) while 37.1% had access to religious
texts. About 12% had 25 or fewer children’s books
(12.3%); 12.8% had between 26 and 50 books
available; 40.4% had between 51 and 100 books;
34.5% had more than 100 books.
SES differences were found for the percentage of
families with subscriptions to child magazines
subscriptions to parent magazines8; and ownership
of religious texts9. See Figure 2. There were no
differences found by Gender.
Media Access
All families reported owning at leas
set (M = 1.87, SD = 1.21) and 1 DVD player (
1.62, SD = 1.21). There were, on average, 1.09
VCRs; 2.48 radios; 1.67 computers; 0.32 Game Boys; and 0.40 video game consoles per home. The
majority of families reported having a radio (i.e.,
(i.e., 97.9%). Nearly two-thirds of children had electronic literacy toys (i.e., 47.4%); 22.3% had video
game console systems; and 19.3% had hand
SES differences were significant for
backgrounds had more TVs, DVDs, computers, computers with internet access, and electronic toys then
their peers from low SES families. Middle to upper SES families reported owning more computers
their peers from low SES families and fewer electronic toys and DVD players than their peers from
working-class SES families. See Table
7 Χ
2 = 6.66, p < .05
8 Χ
2 = 7.30, p < .05
9 Χ
2 = 9.25, p < .01
Figure 2. Percentage of Families with Access to Print Materials by
Family SES
Note. LOW= low SES; WC = working-class SES; MID = middle to upper SES
Home Media Environment
All analyses documenting the home media environment were checked for Gender and Family SES
differences. Only when significant differences by one of these 2 factors were found are they
below; otherwise, results were aggregated across all participants.
Access to Print Materials in the Home
The majority of parents reported having regular
subscriptions to both child (51.5%) and parent
magazines (61.5%); a dictionary or encyclopedia
(82.1%); newspapers (76.9%); and catalogs
third of children had comic
books (32.1%) while 37.1% had access to religious
texts. About 12% had 25 or fewer children’s books
(12.3%); 12.8% had between 26 and 50 books
d between 51 and 100 books;
SES differences were found for the percentage of
families with subscriptions to child magazines7;
; and ownership
. There were no
All families reported owning at least 1 television
= 1.21) and 1 DVD player (M =
= 1.21). There were, on average, 1.09
VCRs; 2.48 radios; 1.67 computers; 0.32 Game Boys; and 0.40 video game consoles per home. The
majority of families reported having a radio (i.e., 97.1%); a computer (i.e., 97.7%); and internet access
thirds of children had electronic literacy toys (i.e., 47.4%); 22.3% had video
game console systems; and 19.3% had hand-held video games.
SES differences were significant for a number of different media. Families from working
backgrounds had more TVs, DVDs, computers, computers with internet access, and electronic toys then
their peers from low SES families. Middle to upper SES families reported owning more computers
their peers from low SES families and fewer electronic toys and DVD players than their peers from
class SES families. See Table 2.
0 20
LOW SES
WC SES
MID SES
Religious Texts Parent Magazines
20 | P a g e
. Percentage of Families with Access to Print Materials by
class SES; MID = middle to upper SES
All analyses documenting the home media environment were checked for Gender and Family SES
differences. Only when significant differences by one of these 2 factors were found are they presented
VCRs; 2.48 radios; 1.67 computers; 0.32 Game Boys; and 0.40 video game consoles per home. The
97.1%); a computer (i.e., 97.7%); and internet access
thirds of children had electronic literacy toys (i.e., 47.4%); 22.3% had video
a number of different media. Families from working-class SES
backgrounds had more TVs, DVDs, computers, computers with internet access, and electronic toys then
their peers from low SES families. Middle to upper SES families reported owning more computers than
their peers from low SES families and fewer electronic toys and DVD players than their peers from
40 60 80
Parent Magazines Child Magazines
21 | P a g e
Bedroom Media
Over half of the children had no media in their bedrooms (i.e., 60.8%) while 28.7% had just one medium
in their rooms (usually a radio) and 10.5% had 2 or more media in their rooms. There was a maximum of
6 types of media in a child’s bedroom. Specifically, 7.6% of the children had bedroom TVs; 4.1% had
VCRs; 5.8% had DVD players; 32.2% had radios; 1.8% had video game console systems; 2.9% had
computers; and 1.8% had internet access.
No boys and 4.6% of girls had internet access in their rooms10. There were no other significant
differences in the presence of bedroom media by gender or family SES.
Children’s Media Use
Children watched 5.61 hours of on-air television and 2.90 hours of DVD/videos per week. Book reading
took up 3.00 hours per week while children spent 25.5 minutes per week playing with electronic literacy
toys. Children spent 47.87 minutes per week playing on the computer and an additional 31.43 minutes
on the internet. Console video game use averaged 23.65 minutes per week while hand held video game
use averaged 15.14 minutes per week. Children spent 11.25 hours per week playing inside with toys and
5.94 hours per week playing outside with toys.
Boys spent marginally more time watching television (i.e., 6.13 hours per week) and playing video games
(i.e., 32.08 minutes per day) 11 compared with girls who watched TV for 4.89 hours per week and played
video games about 14.76 minutes per week12. Boys also played hand held video games for about 28
minutes per day while girls played just 1.2 minutes13. Children from low SES families watched more
DVDs and videos (i.e., 3.78 hours) when compared with children from working-class SES (i.e., 3.21
hours) and middle SES families (i.e., 2.37 hours). Boys living in low and middle SES homes spent more
time playing outside than their working-class SES peers while girls living in working-class SES homes
spent more time playing outside than their peers from low or middle SES families. See Table 2. There
were no group differences in children’s media use.
10
Χ2 = 4.10, p < .05
11 F (1, 170) = 3.41, p < .10
12 F (1, 170) = 3.47, p < .10
13 F(1, 170) = 4.73, p < 0.05
22 | P a g e
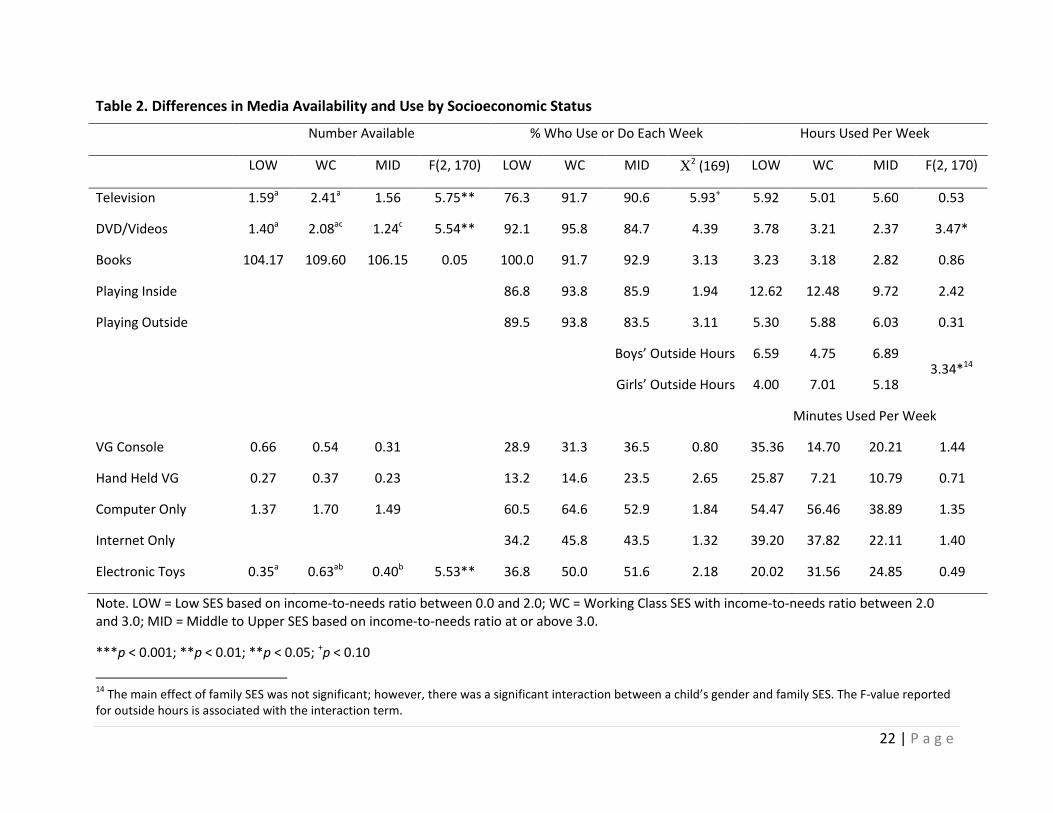
Table 2. Differences in Media Availability and Use by Socioeconomic Status
Number Available % Who Use or Do Each Week Hours Used Per Week
LOW WC MID F(2, 170) LOW WC MID Χ2 (169) LOW WC MID F(2, 170)
Television 1.59a 2.41a 1.56 5.75** 76.3 91.7 90.6 5.93+ 5.92 5.01 5.60 0.53
DVD/Videos 1.40a 2.08ac 1.24c 5.54** 92.1 95.8 84.7 4.39 3.78 3.21 2.37 3.47*
Books 104.17 109.60 106.15 0.05 100.0 91.7 92.9 3.13 3.23 3.18 2.82 0.86
Playing Inside 86.8 93.8 85.9 1.94 12.62 12.48 9.72 2.42
Playing Outside 89.5 93.8 83.5 3.11 5.30 5.88 6.03 0.31
Boys’ Outside Hours 6.59 4.75 6.89 3.34*14
Girls’ Outside Hours 4.00 7.01 5.18
Minutes Used Per Week
VG Console 0.66 0.54 0.31 28.9 31.3 36.5 0.80 35.36 14.70 20.21 1.44
Hand Held VG 0.27 0.37 0.23 13.2 14.6 23.5 2.65 25.87 7.21 10.79 0.71
Computer Only 1.37 1.70 1.49 60.5 64.6 52.9 1.84 54.47 56.46 38.89 1.35
Internet Only 34.2 45.8 43.5 1.32 39.20 37.82 22.11 1.40
Electronic Toys 0.35a 0.63ab 0.40b 5.53** 36.8 50.0 51.6 2.18 20.02 31.56 24.85 0.49
Note. LOW = Low SES based on income-to-needs ratio between 0.0 and 2.0; WC = Working Class SES with income-to-needs ratio between 2.0
and 3.0; MID = Middle to Upper SES based on income-to-needs ratio at or above 3.0.
***p < 0.001; **p < 0.01; **p < 0.05; +p < 0.10
14
The main effect of family SES was not significant; however, there was a significant interaction between a child’s gender and family SES. The F-value reported
for outside hours is associated with the interaction term.
23 | P a g e
Objective 1: Did children learn the actual content
demonstrated on SUPER WHY!?
The analytical approach for Objective 1 involved two steps: 1) ANCOVAS that tested group differences
and 2) ANCOVAs that tested the moderating role of Family SES. All tests evaluating group differences
are reported below regardless of statistical significance. Tests evaluating whether a family’s SES
moderated group differences (i.e., are group differences the same or different by each level of family
SES) are reported below only when these tests were statistically significant. A moderated effect is
present if one or both of the following interactions are significant: the 3-way interaction among Group,
SES, and Wave or the 2-way interaction between Group and SES. A moderator is a variable that affects
the strength of the relationship between the treatment and outcome. In this regard, children from low
SES families may be more powerfully affected by the intervention when compared with children from
higher SES families.
Indicators of Language Development
Symbolic Representation Using Rebus Symbols
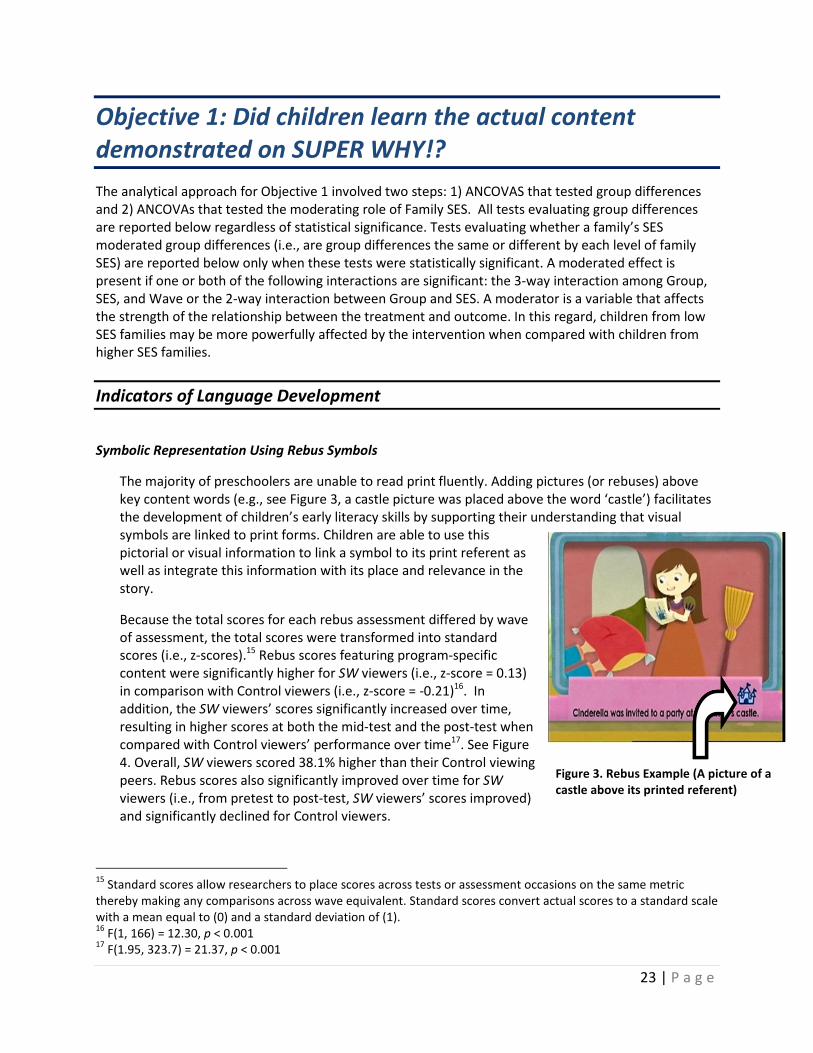
The majority of preschoolers are unable to read print fluently. Adding pictures (or rebuses) above
key content words (e.g., see Figure 3, a castle picture was placed above the word ‘castle’) facilitates
the development of children’s early literacy skills by supporting their understanding that visual
symbols are linked to print forms. Children are able to use this
pictorial or visual information to link a symbol to its print referent as
well as integrate this information with its place and relevance in the
story.
Because the total scores for each rebus assessment differed by wave
of assessment, the total scores were transformed into standard
scores (i.e., z-scores).15 Rebus scores featuring program-specific
content were significantly higher for SW viewers (i.e., z-score = 0.13)
in comparison with Control viewers (i.e., z-score = -0.21)16. In
addition, the SW viewers’ scores significantly increased over time,
resulting in higher scores at both the mid-test and the post-test when
compared with Control viewers’ performance over time17. See Figure
4. Overall, SW viewers scored 38.1% higher than their Control viewing
peers. Rebus scores also significantly improved over time for SW
viewers (i.e., from pretest to post-test, SW viewers’ scores improved)
and significantly declined for Control viewers.
15
Standard scores allow researchers to place scores across tests or assessment occasions on the same metric
thereby making any comparisons across wave equivalent. Standard scores convert actual scores to a standard scale
with a mean equal to (0) and a standard deviation of (1). 16
F(1, 166) = 12.30, p < 0.001 17
F(1.95, 323.7) = 21.37, p < 0.001
Figure 3. Rebus Example (A picture of a
castle above its printed referent)
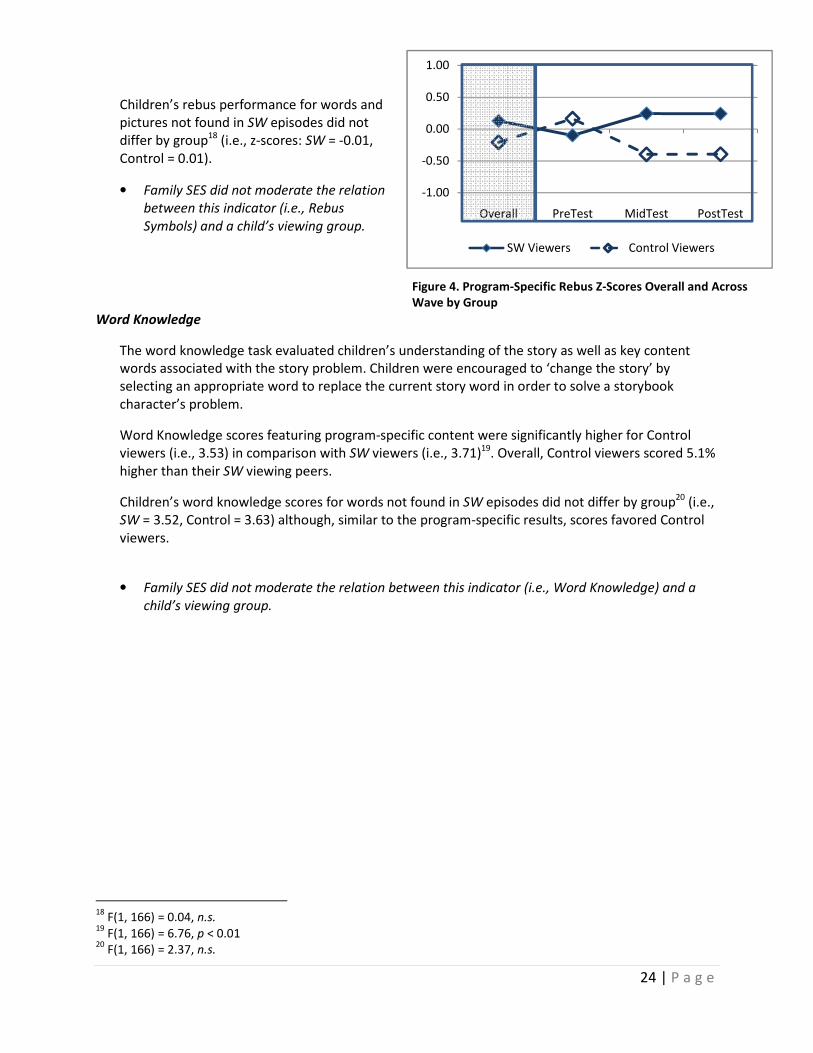
Children’s rebus performance for words and
pictures not found in SW episodes did not
differ by group18 (i.e., z-scores:
Control = 0.01).
• Family SES did not moderate the relation
between this indicator (i.e., Rebus
Symbols) and a child’s viewing group.
Word Knowledge
The word knowledge task evaluated children’s understanding of the story as well as key content
words associated with the story problem. Children were encouraged to ‘change the story’ by
selecting an appropriate word to replace the current story word
character’s problem.
Word Knowledge scores featuring program
viewers (i.e., 3.53) in comparison with
higher than their SW viewing peers.
Children’s word knowledge scores for words not found in
SW = 3.52, Control = 3.63) although, similar to the program
viewers.
• Family SES did not moderate the relation between this indicator (i.e., Word Knowledge) and a
child’s viewing group.
18
F(1, 166) = 0.04, n.s. 19
F(1, 166) = 6.76, p < 0.01 20
F(1, 166) = 2.37, n.s.
Figure 4. Program-Specific Rebus Z-Scores Overall and Across
Wave by Group
-1.00
-0.50
0.00
0.50
1.00
Overall PreTest
SW Viewers
Children’s rebus performance for words and
episodes did not
scores: SW = -0.01,
Family SES did not moderate the relation
or (i.e., Rebus
Symbols) and a child’s viewing group.
The word knowledge task evaluated children’s understanding of the story as well as key content
words associated with the story problem. Children were encouraged to ‘change the story’ by
selecting an appropriate word to replace the current story word in order to solve a storybook
Word Knowledge scores featuring program-specific content were significantly higher for Control
viewers (i.e., 3.53) in comparison with SW viewers (i.e., 3.71)19. Overall, Control viewers scored 5.1%
viewing peers.
Children’s word knowledge scores for words not found in SW episodes did not differ by group
although, similar to the program-specific results, scores favored Control
Family SES did not moderate the relation between this indicator (i.e., Word Knowledge) and a
24 | P a g e
Scores Overall and Across
MidTest PostTest
Control Viewers
The word knowledge task evaluated children’s understanding of the story as well as key content
words associated with the story problem. Children were encouraged to ‘change the story’ by
solve a storybook
specific content were significantly higher for Control
. Overall, Control viewers scored 5.1%
episodes did not differ by group20 (i.e.,
ores favored Control
Family SES did not moderate the relation between this indicator (i.e., Word Knowledge) and a
Indicators of Phonological and Phonemic Awareness
Speech-to-Print Matching
The speech-to-print matching tasks evaluate
to their print equivalents. Children are presented with three words and asked to point to the word
they think the examiner said. As the test unfolds, the discriminations to be made across th
words become substantially more subtle. Figure 5
program-similar content.
Speech-to-Print Matching scores featuring
program-specific content were significantly
higher for SW viewers (i.e., 5.46) in
comparison with Control group viewers (i.e.,
4.56)21, a difference of 19.7%. There was also
a significant 2-way interaction between
Group and Wave22. SW viewers outperformed
Control group viewers at the pretest and mid
test while there were no differences at the
post-test. Given these initial differences and
the lack of differences at the post
results should be interpreted with caution.
Children’s speech-to-print matching scores for words not found in
significantly by group23. SW viewers outperformed their Control viewing peers by 14.0% (i.e.,
5.14; Control = 4.51). There were no significant pretest differences between groups.
• Family SES did not moderate the relation between this indicator (i.e., Speech
Matching) and a child’s viewing group.
Blending
The blending tasks evaluated how well children
were able to recombine syllables or phonemes
when presented in isolation (e.g., high [pause]
chair) by selecting the corresponding picture fro
a set of 4. As the test unfolded, the words shift
from onset/rime splits (e.g., show me /b/ [pause]
/air/) to phoneme splits (e.g., /b/ [pause] /a/
[pause] /g/). Figure 6 displays scores for program
specific content.
21
F(1, 166) = 16.70, p < 0.001 22
F(1, 166) = 3.51, p < 0.05 23
F(1, 166) = 8.09, p < 0.005.
Figure 6. Program-Specific Blending Scores Overall and Across
Wave by Group
1.00
2.00
3.00
4.00
Overall PreTest
SW Viewers
Figure 5. Speech-to-Print Matching Scores for Both SW and Not SW
Content by Group Alone and SW Co
Wave
Indicators of Phonological and Phonemic Awareness
tasks evaluated how well children were able to match spoken words
to their print equivalents. Children are presented with three words and asked to point to the word
they think the examiner said. As the test unfolds, the discriminations to be made across th
stantially more subtle. Figure 5 displays scores for program-specific content and
Print Matching scores featuring
specific content were significantly
viewers (i.e., 5.46) in
comparison with Control group viewers (i.e.,
, a difference of 19.7%. There was also
way interaction between
viewers outperformed
Control group viewers at the pretest and mid-
test while there were no differences at the
test. Given these initial differences and
the lack of differences at the post-test, these
results should be interpreted with caution.
print matching scores for words not found in SW episodes also differed
viewers outperformed their Control viewing peers by 14.0% (i.e.,
There were no significant pretest differences between groups.
Family SES did not moderate the relation between this indicator (i.e., Speech
Matching) and a child’s viewing group.
The blending tasks evaluated how well children
able to recombine syllables or phonemes
when presented in isolation (e.g., high [pause]
the corresponding picture from
, the words shifted
from onset/rime splits (e.g., show me /b/ [pause]
, /b/ [pause] /a/
displays scores for program-
25 | P a g e
Specific Blending Scores Overall and Across
PreTest MidTest PostTest
Control Viewers
Print Matching Scores for Both SW and Not SW
Content by Group Alone and SW Content Scores by Group Across
how well children were able to match spoken words
to their print equivalents. Children are presented with three words and asked to point to the word
they think the examiner said. As the test unfolds, the discriminations to be made across the three
specific content and
episodes also differed
viewers outperformed their Control viewing peers by 14.0% (i.e., SW =
There were no significant pretest differences between groups.
Family SES did not moderate the relation between this indicator (i.e., Speech-to-Print
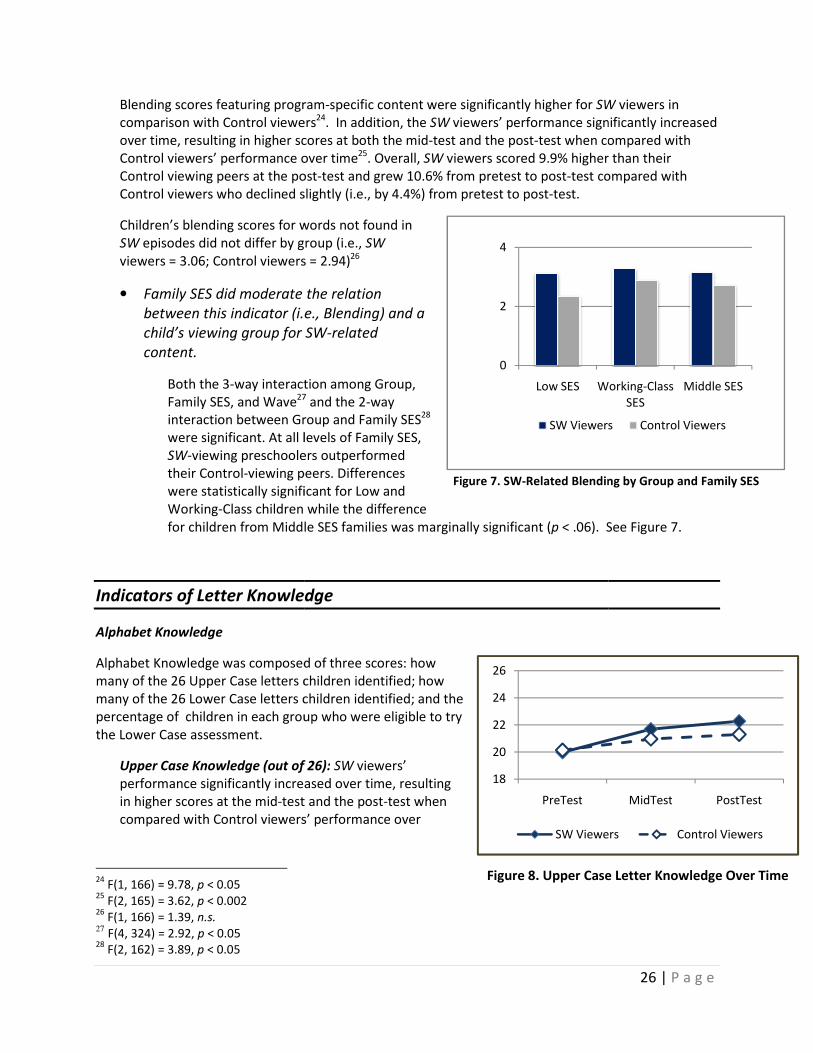
Blending scores featuring program
comparison with Control viewers
over time, resulting in higher scores at both the mid
Control viewers’ performance over time
Control viewing peers at the post
Control viewers who declined slightl
Children’s blending scores for words not found in
SW episodes did not differ by group (i.e.,
viewers = 3.06; Control viewers = 2.94)
• Family SES did moderate the relation
between this indicator (i.e., Blendin
child’s viewing group for
content.
Both the 3-way interaction among Group,
Family SES, and Wave27
interaction between Group
were significant. At all levels of Family SES,
SW-viewing preschoolers outperformed
their Control-viewing peers. Differences
were statistically significant for Low and
Working-Class children while the difference
for children from Middle SES families was m
Indicators of Letter Knowledge
Alphabet Knowledge
Alphabet Knowledge was composed of three scores: how
many of the 26 Upper Case letters children identified; how
many of the 26 Lower Case letters children identified; and
percentage of children in each group who were eligible to try
the Lower Case assessment.
Upper Case Knowledge (out of 26):
performance significantly increased over time, resulting
in higher scores at the mid-test and the post
compared with Control viewers’ performance over
24
F(1, 166) = 9.78, p < 0.05 25
F(2, 165) = 3.62, p < 0.002 26
F(1, 166) = 1.39, n.s. 27
F(4, 324) = 2.92, p < 0.05 28
F(2, 162) = 3.89, p < 0.05
Figure 8. Upper Case Letter Knowledge Over Time
by Group
18
20
22
24
26
PreTest
SW Viewers
Figure 7. SW-Related Blending by Group and Family SES
Blending scores featuring program-specific content were significantly higher for SW
comparison with Control viewers24. In addition, the SW viewers’ performance significantly increased
over time, resulting in higher scores at both the mid-test and the post-test when compared with
Control viewers’ performance over time25. Overall, SW viewers scored 9.9% higher than their
at the post-test and grew 10.6% from pretest to post-test compared with
Control viewers who declined slightly (i.e., by 4.4%) from pretest to post-test.
Children’s blending scores for words not found in
episodes did not differ by group (i.e., SW
viewers = 3.06; Control viewers = 2.94)26
Family SES did moderate the relation
between this indicator (i.e., Blending) and a
child’s viewing group for SW-related
way interaction among Group, 27 and the 2-way
interaction between Group and Family SES28
were significant. At all levels of Family SES,
viewing preschoolers outperformed
viewing peers. Differences
were statistically significant for Low and
Class children while the difference
for children from Middle SES families was marginally significant (p < .06). See Figure 7
Indicators of Letter Knowledge
Alphabet Knowledge was composed of three scores: how
many of the 26 Upper Case letters children identified; how
many of the 26 Lower Case letters children identified; and the
children in each group who were eligible to try
Upper Case Knowledge (out of 26): SW viewers’
performance significantly increased over time, resulting
test and the post-test when
compared with Control viewers’ performance over
0
2
4
Low SES Working
SW Viewers
26 | P a g e
. Upper Case Letter Knowledge Over Time
MidTest PostTest
SW Viewers Control Viewers
Blending by Group and Family SES
SW viewers in
viewers’ performance significantly increased
test when compared with
viewers scored 9.9% higher than their
test compared with
< .06). See Figure 7.
Working-Class
SES
Middle SES
SW Viewers Control Viewers
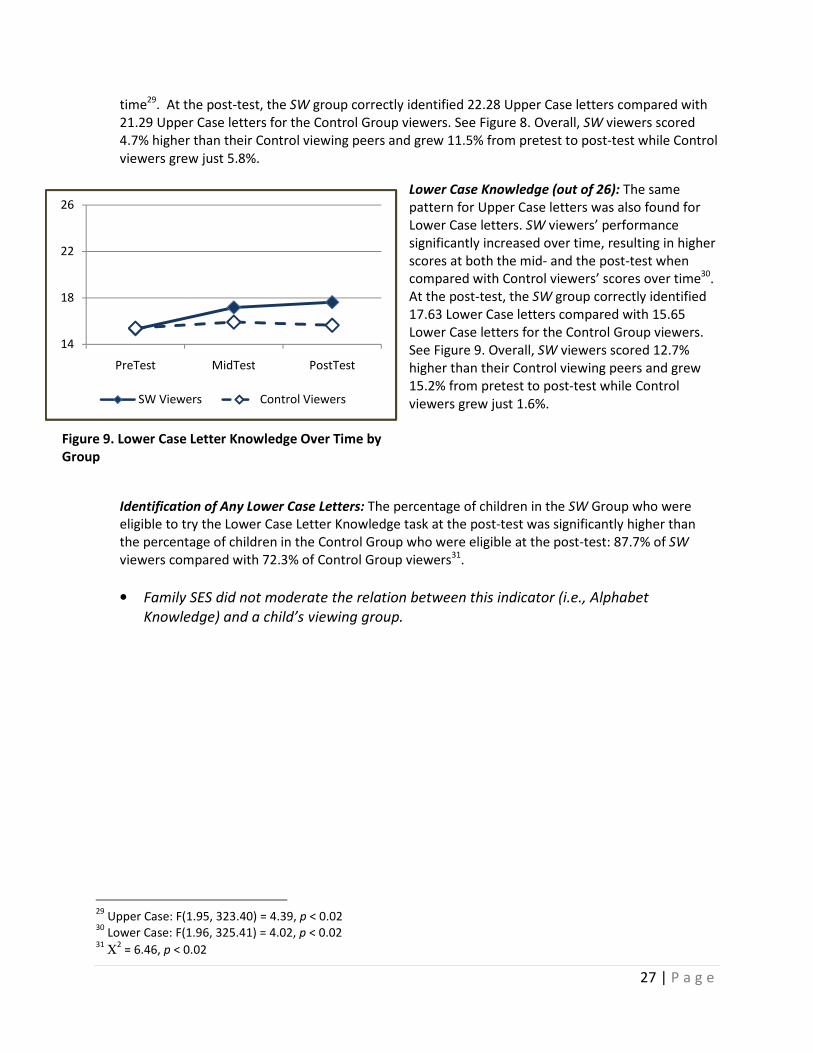
27 | P a g e
Figure 10. Lower Case Letter Knowledge Over Time by
Group
14
18
22
26
PreTest MidTest PostTest
SW Viewers Control Viewers
Figure 9. Lower Case Letter Knowledge Over Time by
Group
14
18
22
26
PreTest MidTest PostTest
SW Viewers Control Viewers
time29. At the post-test, the SW group correctly identified 22.28 Upper Case letters compared with
21.29 Upper Case letters for the Control Group viewers. See Figure 8. Overall, SW viewers scored
4.7% higher than their Control viewing peers and grew 11.5% from pretest to post-test while Control
viewers grew just 5.8%.
Lower Case Knowledge (out of 26): The same
pattern for Upper Case letters was also found for
Lower Case letters. SW viewers’ performance
significantly increased over time, resulting in higher
scores at both the mid- and the post-test when
compared with Control viewers’ scores over time30.
At the post-test, the SW group correctly identified
17.63 Lower Case letters compared with 15.65
Lower Case letters for the Control Group viewers.
See Figure 9. Overall, SW viewers scored 12.7%
higher than their Control viewing peers and grew
15.2% from pretest to post-test while Control
viewers grew just 1.6%.
Identification of Any Lower Case Letters: The percentage of children in the SW Group who were
eligible to try the Lower Case Letter Knowledge task at the post-test was significantly higher than
the percentage of children in the Control Group who were eligible at the post-test: 87.7% of SW
viewers compared with 72.3% of Control Group viewers31.
• Family SES did not moderate the relation between this indicator (i.e., Alphabet
Knowledge) and a child’s viewing group.
29
Upper Case: F(1.95, 323.40) = 4.39, p < 0.02 30
Lower Case: F(1.96, 325.41) = 4.02, p < 0.02 31
Χ2 = 6.46, p < 0.02
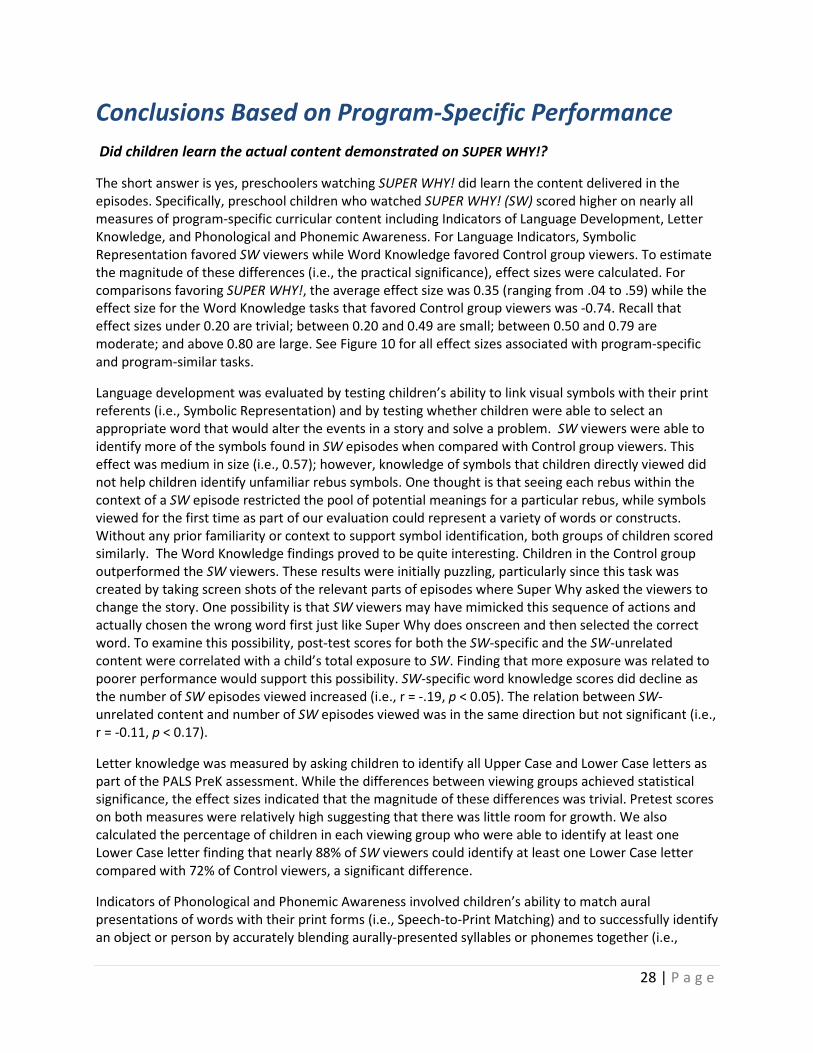
28 | P a g e
Conclusions Based on Program-Specific Performance
Did children learn the actual content demonstrated on SUPER WHY!?
The short answer is yes, preschoolers watching SUPER WHY! did learn the content delivered in the
episodes. Specifically, preschool children who watched SUPER WHY! (SW) scored higher on nearly all
measures of program-specific curricular content including Indicators of Language Development, Letter
Knowledge, and Phonological and Phonemic Awareness. For Language Indicators, Symbolic
Representation favored SW viewers while Word Knowledge favored Control group viewers. To estimate
the magnitude of these differences (i.e., the practical significance), effect sizes were calculated. For
comparisons favoring SUPER WHY!, the average effect size was 0.35 (ranging from .04 to .59) while the
effect size for the Word Knowledge tasks that favored Control group viewers was -0.74. Recall that
effect sizes under 0.20 are trivial; between 0.20 and 0.49 are small; between 0.50 and 0.79 are
moderate; and above 0.80 are large. See Figure 10 for all effect sizes associated with program-specific
and program-similar tasks.
Language development was evaluated by testing children’s ability to link visual symbols with their print
referents (i.e., Symbolic Representation) and by testing whether children were able to select an
appropriate word that would alter the events in a story and solve a problem. SW viewers were able to
identify more of the symbols found in SW episodes when compared with Control group viewers. This
effect was medium in size (i.e., 0.57); however, knowledge of symbols that children directly viewed did
not help children identify unfamiliar rebus symbols. One thought is that seeing each rebus within the
context of a SW episode restricted the pool of potential meanings for a particular rebus, while symbols
viewed for the first time as part of our evaluation could represent a variety of words or constructs.
Without any prior familiarity or context to support symbol identification, both groups of children scored
similarly. The Word Knowledge findings proved to be quite interesting. Children in the Control group
outperformed the SW viewers. These results were initially puzzling, particularly since this task was
created by taking screen shots of the relevant parts of episodes where Super Why asked the viewers to
change the story. One possibility is that SW viewers may have mimicked this sequence of actions and
actually chosen the wrong word first just like Super Why does onscreen and then selected the correct
word. To examine this possibility, post-test scores for both the SW-specific and the SW-unrelated
content were correlated with a child’s total exposure to SW. Finding that more exposure was related to
poorer performance would support this possibility. SW-specific word knowledge scores did decline as
the number of SW episodes viewed increased (i.e., r = -.19, p < 0.05). The relation between SW-
unrelated content and number of SW episodes viewed was in the same direction but not significant (i.e.,
r = -0.11, p < 0.17).
Letter knowledge was measured by asking children to identify all Upper Case and Lower Case letters as
part of the PALS PreK assessment. While the differences between viewing groups achieved statistical
significance, the effect sizes indicated that the magnitude of these differences was trivial. Pretest scores
on both measures were relatively high suggesting that there was little room for growth. We also
calculated the percentage of children in each viewing group who were able to identify at least one
Lower Case letter finding that nearly 88% of SW viewers could identify at least one Lower Case letter
compared with 72% of Control viewers, a significant difference.
Indicators of Phonological and Phonemic Awareness involved children’s ability to match aural
presentations of words with their print forms (i.e., Speech-to-Print Matching) and to successfully identify
an object or person by accurately blending aurally-presented syllables or phonemes together (i.e.,
29 | P a g e
Blending). Both indicators involved the presentation of words that were found in SW episodes as well as
similar words that were not found in any SW episodes. Statistical significance was found for both tasks
using content found in SW episodes. The magnitude of the effect for the Speech-to-Print Matching was
medium (i.e., 0.59) and large for the Blending task (i.e., 0.87). For content not found in SW episodes,
only Speech-to-Print Matching achieved statistical significance while effect sizes for both tasks were in
the small range (i.e., 0.33 for Speech-to-Print Matching and 0.29 for Blending). The results for the SW-
specific Blending task were further moderated by family SES. Children from low SES and working-class
families obtained scores that were significantly higher than their Control group peers while SW viewers
from middle SES families actually did slightly less well than their Control group peers. The magnitude of
the differences was relatively large for the working-class children; watching SUPER WHY! resulted in an
effect size of .54, a medium effect. In contrast, while in opposite directions, the magnitude of the
differences for children from low and middle SES families was, at best, small (i.e., an effect size below
±0.20 is trivial while an effect size between ±0.20 and ±0.49 is small; Cohen, 1988). Although there were
no statistically significant differences by group for the program-similar blending tasks, the effect sizes for
each of the different SES categories suggests practical or meaningful differences. SW viewers from all
three SES categories scored higher than their Control group peers. The size of the effect was roughly 3
times as large for the lowest SES category compared with the highest SES category. Further, as SES
increased, the effect size decreased by roughly 0.30 standard deviation units (i.e., a third of a standard
deviation).
In sum, children who viewed SUPER WHY! were able to learn much of the content featured in the
program. Although scores on program-similar assessments favored SW viewers, most of these tests
were not significant. It is likely that children performed well on the program-specific content tasks
because they were familiar with the content and the presentation of that content while the program-
similar tasks contained content that was unfamiliar. It is also possible that the tasks used to evaluate
program-specific and –similar content were challenging in and of themselves (e.g., children were
presented with three words and asked to select the word that matched a verbal presentation of that
word). During the program-specific tasks, children were able to process the task complexity because
they did not need to use as many cognitive resources to process the content (i.e., word, phrase) used in
a particular task. In contrast, task complexity coupled with unfamiliar content may have overloaded the
child’s cognitive resources, resulting in more difficulty and no differences between the groups. The
normative assessments are tasks that are quite familiar with preschoolers (e.g., naming letters, making
rhymes) and demand little in the way of task complexity. That is, the increased familiarity associated
with the tasks allowed preschoolers to use their resources to process content more successfully.
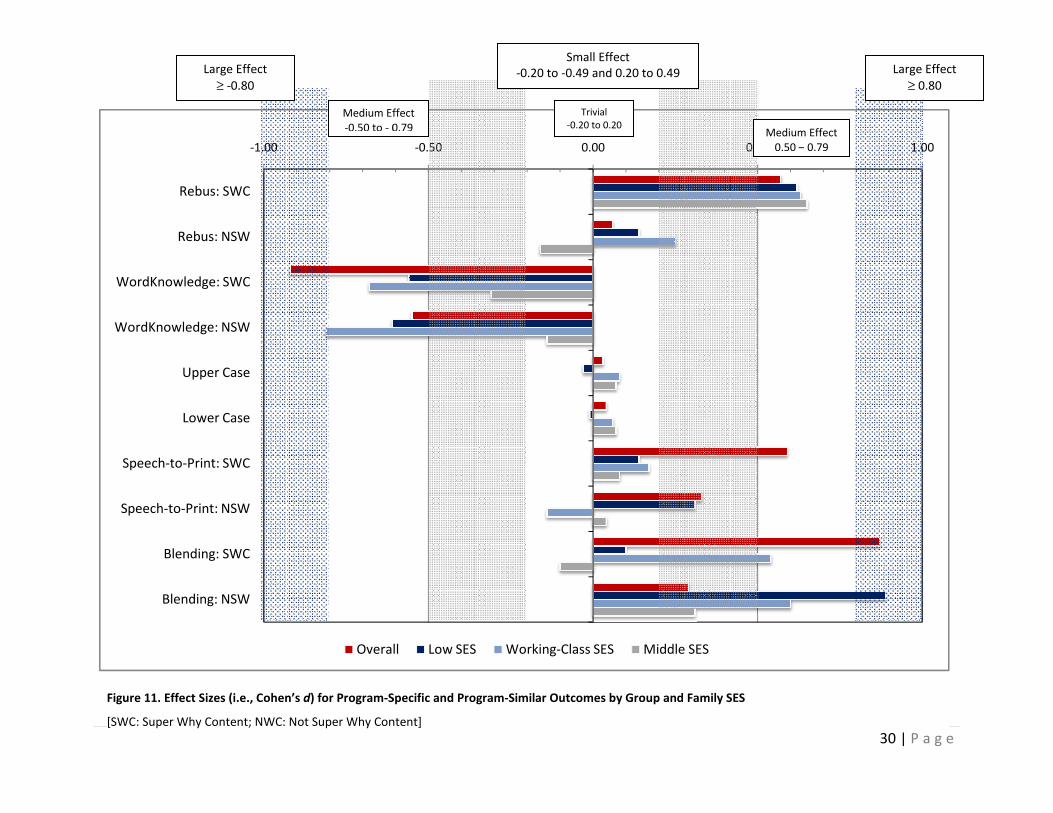
-1.00
Rebus: SWC
Rebus: NSW
WordKnowledge: SWC
WordKnowledge: NSW
Upper Case
Lower Case
Speech-to-Print: SWC
Speech-to-Print: NSW
Blending: SWC
Blending: NSW
Overall
Figure 12. Effect Sizes (i.e., Cohen’s d) for Program-Specific and Program
[SWC: Super Why Content; NWC: Not Super Why Content
-1.00
Rebus: SWC
Rebus: NSW
WordKnowledge: SWC
WordKnowledge: NSW
Upper Case
Lower Case
Speech-to-Print: SWC
Speech-to-Print: NSW
Blending: SWC
Blending: NSW
Overall
Figure 11. Effect Sizes (i.e., Cohen’s d) for Program-Specific and Program
[SWC: Super Why Content; NWC: Not Super Why Content
Medium Effect
-0.50 to - 0.79
Large Effect
≥ -0.80
-0.50 0.00 0.50
Overall Low SES Working-Class SES Middle SES
Specific and Program-Similar Outcomes by Group and Family SES
SWC: Super Why Content; NWC: Not Super Why Content]
-0.50 0.00 0.50
Overall Low SES Working-Class SES Middle SES
Specific and Program-Similar Outcomes by Group and Family SES
SWC: Super Why Content; NWC: Not Super Why Content]
Trivial
-0.20 to 0.20 Medium Effect
0.79
Small Effect
-0.20 to -0.49 and 0.20 to 0.49
Medium Effect
0.5
30 | P a g e
1.001.00
Large Effect
≥ 0.80
Medium Effect
0.50 – 0.79
31 | P a g e
Objective 2: Did program-specific content learning
produce changes on standardized measures of early
literacy that are predictive of later reading success?
Transfer of learning is the ultimate goal in any educational television program (Fisch, 2004). Transfer
refers to a child’s ability to encode, store, and retrieve skills associated with program-specific content
and apply those skills to successfully complete unrelated tasks (Fisch et al., 2005). As described above
for program-specific content, the evaluation plan involved a two-step process: 1) group differences were
tested and 2) the impact of a family’s SES on each indicator was evaluated. All tests involving group
differences are reported below regardless of statistical significance. Tests evaluating whether a family’s
SES moderated group differences (i.e., are group differences the same or different by each level of
family SES; low, working-class, and middle/upper SES) are reported below only when these tests are
statistically significant. A moderated effect is present if one or both of the following interactions are
significant: the 3-way interaction among Group, SES, and Wave or the 2-way interaction between Group
and SES. A moderator is a variable that affects the strength of the relationship between the treatment
and outcome. In this regard, children from low SES families may be more powerfully affected by the
intervention when compared with children from higher SES families.
Indicators of Language Development
IGDI Picture Naming
The Picture Naming task evaluates young children’s vocabulary knowledge. Children were asked to
name as many picture cards as they could in one minute. Performance on this task did not differ by
viewing group: SW viewers identified 23.11 pictures and Control viewers identified 23.18 pictures32.
• Family SES did not moderate the relation between this indicator (i.e., Picture Naming)
and a child’s viewing group.
Indicators of Letter Knowledge
Alphabet Letter Naming Fluency
Alphabet Naming Fluency was examined by timing the administration of both the Upper Case and Lower
Case letter knowledge subscales of the PALS PreK Alphabet Knowledge task. See Figure 11.
32
F(1, 166) = 0.01, n.s.
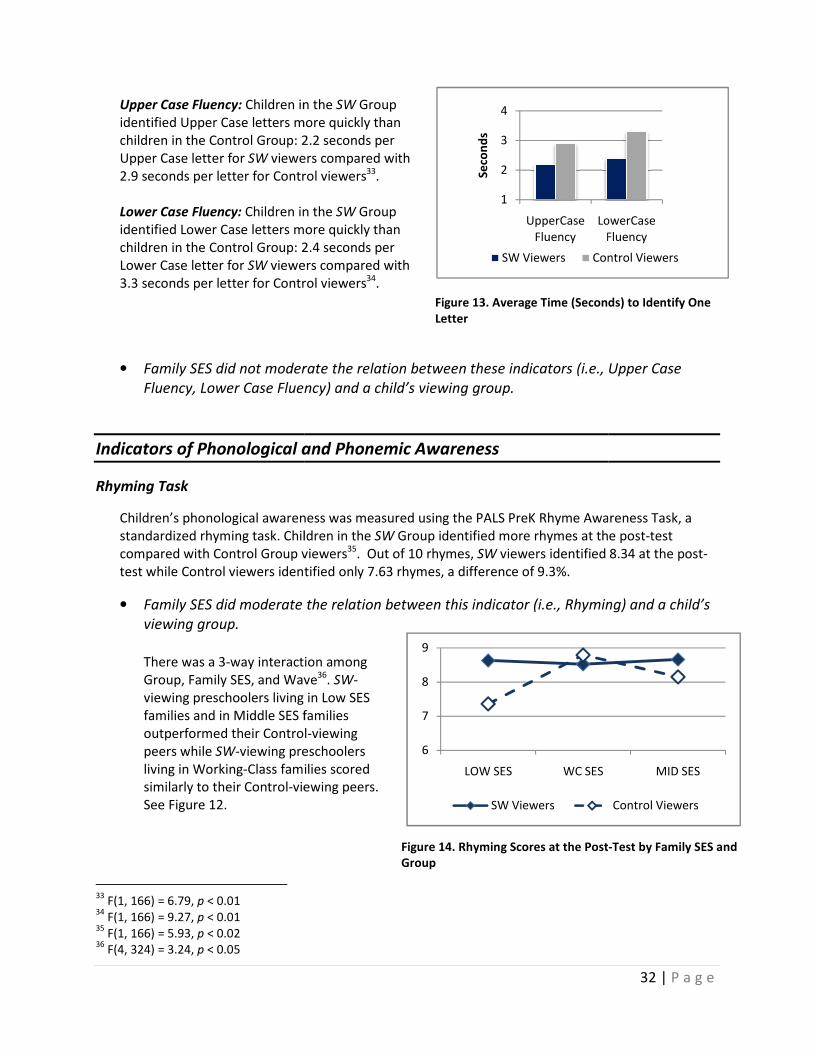
Upper Case Fluency: Children in the
identified Upper Case letters more quickly than
children in the Control Group: 2.2 seconds per
Upper Case letter for SW viewers compared with
2.9 seconds per letter for Control viewers
Lower Case Fluency: Children in the
identified Lower Case letters more quickly than
children in the Control Group: 2.4 seconds per
Lower Case letter for SW viewers compared with
3.3 seconds per letter for Control viewers
• Family SES did not moderate the relation between these indic
Fluency, Lower Case Fluency) and a child’s viewing group.
Indicators of Phonological and Phonemic Awareness
Rhyming Task
Children’s phonological awareness was measured using the PALS PreK
standardized rhyming task. Children in the
compared with Control Group viewers
test while Control viewers identified only
• Family SES did moderate the relation between this indicator (i.e., Rhyming) and a child’s
viewing group.
There was a 3-way interaction among
Group, Family SES, and Wave
viewing preschoolers living in Low SES
families and in Middle SES families
outperformed their Control
peers while SW-viewing preschoolers
living in Working-Class families scored
similarly to their Control-viewing peers.
See Figure 12.
33
F(1, 166) = 6.79, p < 0.01 34
F(1, 166) = 9.27, p < 0.01 35
F(1, 166) = 5.93, p < 0.02 36
F(4, 324) = 3.24, p < 0.05
6
7
8
9
LOW SES WC SES
SW Viewers
1
2
3
4
UpperCase
Fluency
LowerCase
Fluency
Se
con
ds
SW Viewers Control Viewers
Figure 13. Average Time (Seconds) to Identify One
Letter
Children in the SW Group
identified Upper Case letters more quickly than
children in the Control Group: 2.2 seconds per
viewers compared with
2.9 seconds per letter for Control viewers33.
Children in the SW Group
identified Lower Case letters more quickly than
children in the Control Group: 2.4 seconds per
viewers compared with
3.3 seconds per letter for Control viewers34.
Family SES did not moderate the relation between these indicators (i.e., Upper Case
Fluency, Lower Case Fluency) and a child’s viewing group.
Indicators of Phonological and Phonemic Awareness
Children’s phonological awareness was measured using the PALS PreK Rhyme Awareness Task, a
Children in the SW Group identified more rhymes at the post
compared with Control Group viewers35. Out of 10 rhymes, SW viewers identified 8.34 at the post
test while Control viewers identified only 7.63 rhymes, a difference of 9.3%.
Family SES did moderate the relation between this indicator (i.e., Rhyming) and a child’s
way interaction among
Group, Family SES, and Wave36. SW-
viewing preschoolers living in Low SES
families and in Middle SES families
outperformed their Control-viewing
viewing preschoolers
Class families scored
viewing peers.
Figure 14. Rhyming Scores at the Post
Group
32 | P a g e
MID SES
Control Viewers
LowerCase
Fluency
Control Viewers
. Average Time (Seconds) to Identify One
ators (i.e., Upper Case
Rhyme Awareness Task, a
Group identified more rhymes at the post-test
viewers identified 8.34 at the post-
Family SES did moderate the relation between this indicator (i.e., Rhyming) and a child’s
-Test by Family SES and
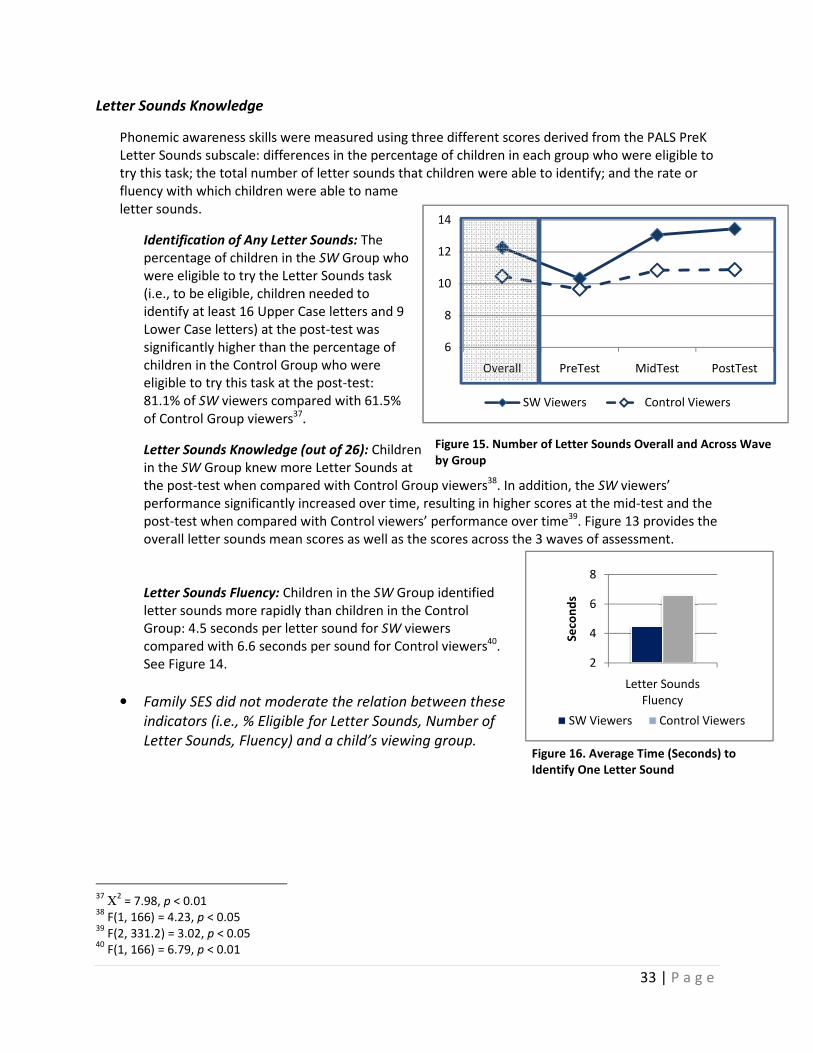
Letter Sounds Knowledge
Phonemic awareness skills were measured using three different scores derived from the PALS PreK
Letter Sounds subscale: differences in the percentage of children in each group who were eligible to
try this task; the total number of letter sounds that children were able to identify; and the rate or
fluency with which children were able to name
letter sounds.
Identification of Any Letter Sounds:
percentage of children in the
were eligible to try the Letter Sounds task
(i.e., to be eligible, children needed to
identify at least 16 Upper Case letters and 9
Lower Case letters) at the post
significantly higher than the percentage of
children in the Control Group who were
eligible to try this task at the post
81.1% of SW viewers compared with 61.5%
of Control Group viewers37.
Letter Sounds Knowledge (out of 26):
in the SW Group knew more Letter Sounds at
the post-test when compared with Control Group viewers
performance significantly increased over time, resulting in higher scores at the mid
post-test when compared with Control viewers’ performance over time
overall letter sounds mean scores as well as the scores
Letter Sounds Fluency: Children in the
letter sounds more rapidly than children in the Control
Group: 4.5 seconds per letter sound for
compared with 6.6 seconds per sound for Control vie
See Figure 14.
• Family SES did not moderate the relation between these
indicators (i.e., % Eligible for Letter Sounds, Number of
Letter Sounds, Fluency) and
37
Χ2 = 7.98, p < 0.01
38 F(1, 166) = 4.23, p < 0.05
39 F(2, 331.2) = 3.02, p < 0.05
40 F(1, 166) = 6.79, p < 0.01
6
8
10
12
14
Overall PreTest
SW Viewers
Figure 16. Average Time (Seconds) to
Identify One Letter Sound
Figure 15. Number of Letter Sounds Overall and Across Wave
by Group
Phonemic awareness skills were measured using three different scores derived from the PALS PreK
Letter Sounds subscale: differences in the percentage of children in each group who were eligible to
try this task; the total number of letter sounds that children were able to identify; and the rate or
fluency with which children were able to name
Identification of Any Letter Sounds: The
percentage of children in the SW Group who
were eligible to try the Letter Sounds task
children needed to
identify at least 16 Upper Case letters and 9
Lower Case letters) at the post-test was
significantly higher than the percentage of
children in the Control Group who were
eligible to try this task at the post-test:
pared with 61.5%
.
Letter Sounds Knowledge (out of 26): Children
Group knew more Letter Sounds at
test when compared with Control Group viewers38. In addition, the SW
performance significantly increased over time, resulting in higher scores at the mid
test when compared with Control viewers’ performance over time39. Figure 1
overall letter sounds mean scores as well as the scores across the 3 waves of assessment.
Children in the SW Group identified
letter sounds more rapidly than children in the Control
Group: 4.5 seconds per letter sound for SW viewers
compared with 6.6 seconds per sound for Control viewers40.
Family SES did not moderate the relation between these
indicators (i.e., % Eligible for Letter Sounds, Number of
Letter Sounds, Fluency) and a child’s viewing group.
2
4
6
8S
eco
nd
s
SW Viewers
33 | P a g e
MidTest PostTest
Control Viewers
. Average Time (Seconds) to
Identify One Letter Sound
. Number of Letter Sounds Overall and Across Wave
Phonemic awareness skills were measured using three different scores derived from the PALS PreK
Letter Sounds subscale: differences in the percentage of children in each group who were eligible to
try this task; the total number of letter sounds that children were able to identify; and the rate or
SW viewers’
performance significantly increased over time, resulting in higher scores at the mid-test and the
. Figure 13 provides the
of assessment.
Letter Sounds
Fluency
SW Viewers Control Viewers
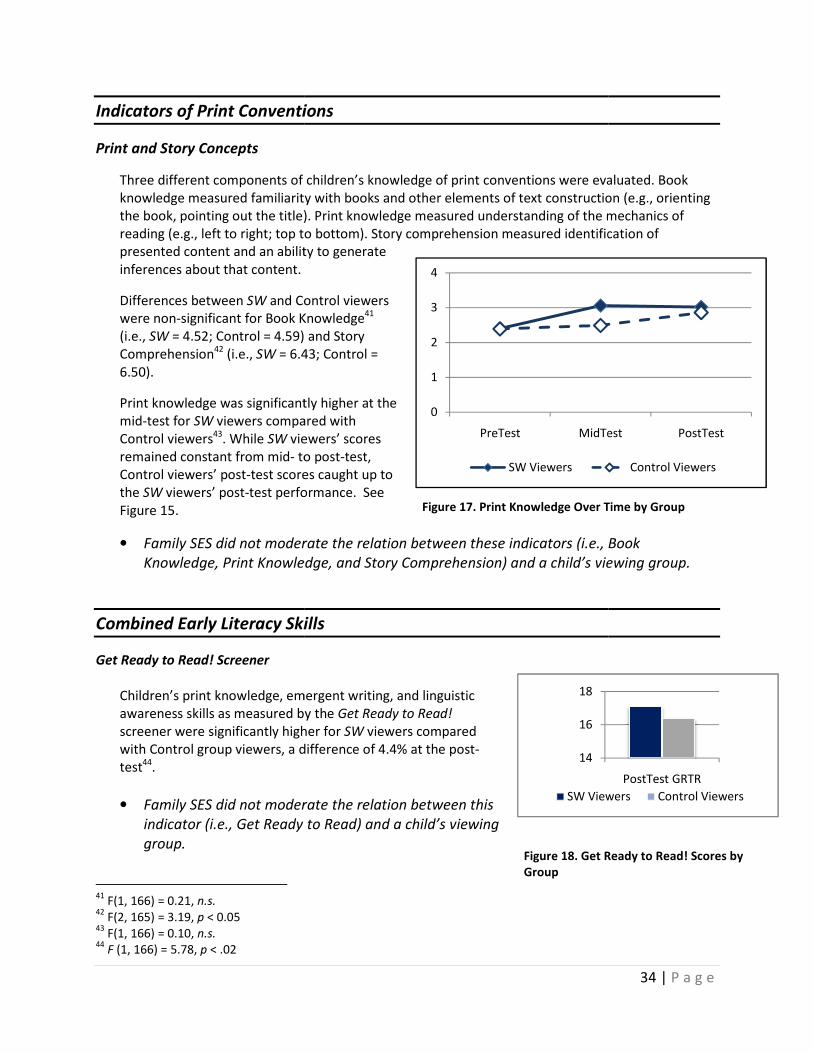
Indicators of Print Conventions
Print and Story Concepts
Three different components of children’s knowledge of print conventions were evaluated. Book
knowledge measured familiarity with books and other elements of text construction (e.g., orienting
the book, pointing out the title). Print knowledge measure
reading (e.g., left to right; top to botto
presented content and an ability to generate
inferences about that content.
Differences between SW and Control viewers
were non-significant for Book Knowledge
(i.e., SW = 4.52; Control = 4.59) and Story
Comprehension42 (i.e., SW = 6.43; Contro
6.50).
Print knowledge was significantly higher at the
mid-test for SW viewers compared with
Control viewers43. While SW viewers’ scores
remained constant from mid- to post
Control viewers’ post-test scores caught up to
the SW viewers’ post-test performance. See
Figure 15.
• Family SES did not moderate the relation between these indicators (i.e., Book
Knowledge, Print Knowledge, and Story Comprehension) and a child’s viewing
Combined Early Literacy Skills
Get Ready to Read! Screener
Children’s print knowledge, emergent writing, and linguistic
awareness skills as measured by the
screener were significantly higher for
with Control group viewers, a difference of 4.4% at the post
test44.
• Family SES did not moderate the relation between this
indicator (i.e., Get Ready to Read) and a child’s viewing
group.
41
F(1, 166) = 0.21, n.s. 42
F(2, 165) = 3.19, p < 0.05 43
F(1, 166) = 0.10, n.s. 44
F (1, 166) = 5.78, p < .02
Figure 18. Get Ready to Read! Scores by
Group
0
1
2
3
4
PreTest MidTest
SW Viewers
Figure 17. Print Knowledge Over Time by Group
Indicators of Print Conventions
Three different components of children’s knowledge of print conventions were evaluated. Book
familiarity with books and other elements of text construction (e.g., orienting
the book, pointing out the title). Print knowledge measured understanding of the mechanics of
reading (e.g., left to right; top to bottom). Story comprehension measured identification of
presented content and an ability to generate
inferences about that content.
and Control viewers
significant for Book Knowledge41
= 4.52; Control = 4.59) and Story
= 6.43; Control =
Print knowledge was significantly higher at the
viewers compared with
viewers’ scores
to post-test,
test scores caught up to
test performance. See
Family SES did not moderate the relation between these indicators (i.e., Book
Knowledge, Print Knowledge, and Story Comprehension) and a child’s viewing
Combined Early Literacy Skills
knowledge, emergent writing, and linguistic
awareness skills as measured by the Get Ready to Read!
screener were significantly higher for SW viewers compared
Control group viewers, a difference of 4.4% at the post-
Family SES did not moderate the relation between this
indicator (i.e., Get Ready to Read) and a child’s viewing
14
16
18
SW Viewers
34 | P a g e
. Get Ready to Read! Scores by
MidTest PostTest
Control Viewers
. Print Knowledge Over Time by Group
Three different components of children’s knowledge of print conventions were evaluated. Book
familiarity with books and other elements of text construction (e.g., orienting
understanding of the mechanics of
fication of
Family SES did not moderate the relation between these indicators (i.e., Book
Knowledge, Print Knowledge, and Story Comprehension) and a child’s viewing group.
PostTest GRTR
SW Viewers Control Viewers
35 | P a g e
Conclusions Based on Normative Performance
Did program-specific content learning produce changes on normative, standardized measures
of early literacy?
For the most part, the answer to this question is also yes. SUPER WHY! (SW) viewers outperformed their
Control group peers on the majority of the normative literacy measures. Statistically significant results
were found for Indicators of Letter Knowledge, Phonological and Phonemic Awareness, and a combined
measure of early literacy skills. There were no differences for Indicators of Language and some
inconsistent differences for Print Conventions. The magnitude of these differences (i.e., the practical
significance) averaged 0.51, a medium effect (Range: -0.003 to 1.75). For comparisons favoring SW, the
average effect size was also of medium size, 0.64 (ranging from .003 to 1.75). See Figure 17 for effect
sizes across all normative outcomes by group and family SES.
Children’s language or vocabulary knowledge was not significantly related to either viewing group.
While children who viewed SW did learn program-specific language content, this content was more a
function of familiarity with symbols and would not necessarily lead to higher general vocabulary scores.
There is evidence that educational television as a whole positively predicts gains on standardized
assessments of vocabulary for children as young as 15 months to children in early elementary school
(Anderson, Huston, Schmitt, Linebarger, & Wright, 2001; Linebarger & Walker, 2005; Wright et al., 2001)
The role of program format in supporting vocabulary development has also been examined. Narrative
programs like SUPER WHY! and expository programs like the control viewing stimulus (i.e., Zoboomafoo)
have both been found to support the acquisition of vocabulary (Linebarger & Piotrowski, 2006; Wright
et al., 2001). One way to evaluate whether both educational programs viewed in this study supported
vocabulary is to examine whether there was significant growth for all children from pretest to post-test.
All children’s scores significantly grew from 21.37 names per minute to 24.66 names per minute45 during
the 8-week intervention period and was similar across all levels of family SES. There is research
suggesting that vocabulary gains might take time to surface (Biemiller & Boote, 2006) which would help
to explain why vocabulary gains have been documented in several longitudinal investigations (Anderson
et al., 2001; Linebarger & Walker, 2005; Wright et al., 2001) but not in short-term experimental studies
(e.g., Linebarger et al., 2004).
Children’s letter knowledge for both program-specific and normative performance was evaluated using
different scores derived from the normative Alphabet Knowledge test (i.e., PALS PreK). Program-specific
performance was based on the number of Upper Case and Lower Case letters accurately identified. To
determine whether children’s knowledge of specific letters associated with watching SW repeatedly was
generalized to another metric of letter knowledge, we included a measure of the length of time it took
for children to complete both the Upper Case and the Lower Case subscales. These two pieces of
information (i.e., total score and length of time) were combined to form fluency scores. Letter naming
fluency refers to a child’s ability to recognize random letters automatically or effortlessly and is a
powerful predictor of later reading proficiency (Daly, Wright, Kelly, & Martens, 1997; Stanovich,
Feeman, & Cunningham, 1983; Torgeson, Wagner, Simmons, & Laughon, 1990). Fluency has been linked
to later reading success in several ways. Quick and effortless letter naming frees up cognitive resources
that can be used to engage in more sophisticated reading skills (e.g., encode and store words). To
become fluent, children must have multiple opportunities to see and hear letter names. With repetition,
45
Picture Naming: growth from pretest to post-test? F(2, 165) = 17.62, p < 0.001
36 | P a g e
children strengthen these connections between print and its aural referent and are able to direct
attention to more cognitively complex tasks (Adams, 1990; Ehri, 1998).
Indicators of Phonological and Phonemic Awareness evaluated children’s ability to detect rhyming
patterns and to identify individual letter sounds. Rhyming is one of the easiest and earliest indicators of
phonological awareness. With rhyming practice, children will progress to hearing and isolating individual
sounds in words (e.g., cat is composed of 3 sounds, /k/ /ă/ /t/). One character’s super power is word
play of which rhyming is key (i.e., Wonder Red). SW viewers were able to benefit from Wonder Red’s
production of rhymes. Across the spectrum of phonological and phonemic awareness skills, identifying
letter sounds is considered a more sophisticated skill fundamental to the acquisition of phonemic
awareness.
Print conventions were evaluated using a story book task that measured children’s understanding of
text rules (e.g., how to orient a book, what a title and author represent and where that information can
be found, discriminating between print and pictures); their understanding of the mechanics of print
(e.g., reading left to right and top to bottom, sweeping left at the end of a line of print, distinguishing
between individual words); and their ability to comprehend the story at both a concrete and an
inferential level. Preschoolers who possess these skills have more developed logical reasoning skills and
possess a readiness to learn word level skills (Venn & Jahn, 2004). In this study, significantly different
effects favoring SW viewers were confined to mid-test differences. By the post-test, means across
viewing groups were similar. To investigate this a bit further, children who scored perfectly on the print
knowledge subscale were contrasted with those who did not (but may have gotten all but one item
correct, may have gotten no items correct, or fell somewhere between). More SW viewers answered all
print knowledge questions correctly compared with Control group viewers (i.e., 55.7% for SW viewers
vs. 40.0% of Control group viewers)46. Analyzing the 4 individual items on this scale indicated that more
SW viewers were able to identify the sweep back to the left after finishing a line of text when compared
with Control group viewers’ ability to identify the sweep left (i.e., 81.1% of SW viewers compared with
67.7% of Control group viewers).
Normative Performance As a Whole
The acquisition of early literacy skills occurs within the everyday environments where preschoolers
spend their time. Children whose environments are richly filled with language- and literacy-based
materials and whose daily interactions with parents, caregivers, siblings and peers are also infused with
frequent high-quality language- and literacy-promoting interactions often have little difficulty navigating
a path to conventional reading success. In contrast, those children whose daily environments are
characterized by few language and literacy materials and impoverished interactions are at a substantial
disadvantage. By formal school entry, these children are typically far behind their more advantaged
peers. Even at this early age, it is often extremely difficult to catch up without intensive remedial
instruction. Even with this remediation, these children will always be at increased risk for reading-
specific as well as general academic failure (e.g., Hart & Risley, 1995; Juel, 1988; Stanovich, 1986;
Walker, Greenwood, Hart, & Carta, 1994).
SUPER WHY! provided all preschoolers in this study with language- and literacy-learning opportunities
that translated into literacy gains across most of the early literacy indicators (i.e., alphabet knowledge,
phonological awareness, phonemic awareness, and knowledge of the mechanics of reading). The
46
Χ2 = 3.95, p < 0.05
37 | P a g e
acquisition of these specific skills also contributed to SW viewers’ stronger performance on a general
early literacy screener. While all SW-viewing preschoolers in this study significantly improved their early
literacy skills, when there were interactions between viewing group and family SES, children from lower
SES families who watched SW always outperformed their control group peers while children whose
families were from middle SES backgrounds often already had these skills prior to the intervention. In
these cases, both viewing groups performed similarly.
The most impressive set of findings from this study involved children’s alphabet knowledge skills. Across
the board, SW viewers were able to identify more upper and lower case letters and their corresponding
letter sounds. Letter and sound naming skills are foundational skills that represent major landmarks in
the acquisition of literacy skills and that are predictive of conventional reading success (Burgess &
Lonigan, 1998; Foulin, 2005; Rathvon, 2004). Watching SW not only improved letter and sound
identification but, perhaps more importantly, improved preschoolers’ letter and sound naming speed or
fluency. Fluencies in letter and sound identification are critical precursors to the acquisition of
phonological sensitivity, the alphabetic principle (i.e., letter-sound correspondence), and visual word
recognition. Phonological sensitivity refers to the ability to detect and manipulate the sound structure of
oral language (includes skills such as rhyming, alliteration, blending, segmenting). As children’s skills
develop, their ability to discriminate the sounds of speech becomes finer and eventually leads to
phonemic sensitivity or the ability to discriminate the smallest units of sounds in words (i.e., phonemes).
The largest gains (i.e., effect sizes) across all early literacy skills measured in this study were the effects
found for SW-viewing preschoolers’ letter and sound naming speed (i.e., Cohen’s d ranged from 1.51 to
1.94; Cohen (1988) reports that effect sizes above 0.80 are large effects). While identifying letters and
sounds are important skills, children’s speed in doing so is also closely linked to later reading
achievement. Faster naming is indicative of greater automaticity (i.e., little processing needs to be
devoted to identifying letters or sounds) and ultimately frees up preschoolers’ limited cognitive
processing skills, making them available for more sophisticated cognitive processing. The likely path of
effects proceeds from letter recognition to letter-sound knowledge and phonological sensitivity, further
discriminations representing phonemic sensitivity that ultimately supports the acquisition of the
alphabetic principle and conventional reading and spelling skills (Foulin, 2005). Watching SW resulted in
universally large effects on all aspects of letter knowledge ranging from the easiest skill (i.e., Upper Case
Letter Identification) to the more complex (i.e., faster rates of sound identification). The mechanisms
linking letter knowledge to conventional reading success operate through a combination of reduced
processing resources needed to name letters and sounds and enhanced phonological and phonemic
sensitivity. Over time and with more exposure, these skills will contribute to conventional reading and
spelling success (Burgess & Lonigan, 1998; Foulin, 2005).
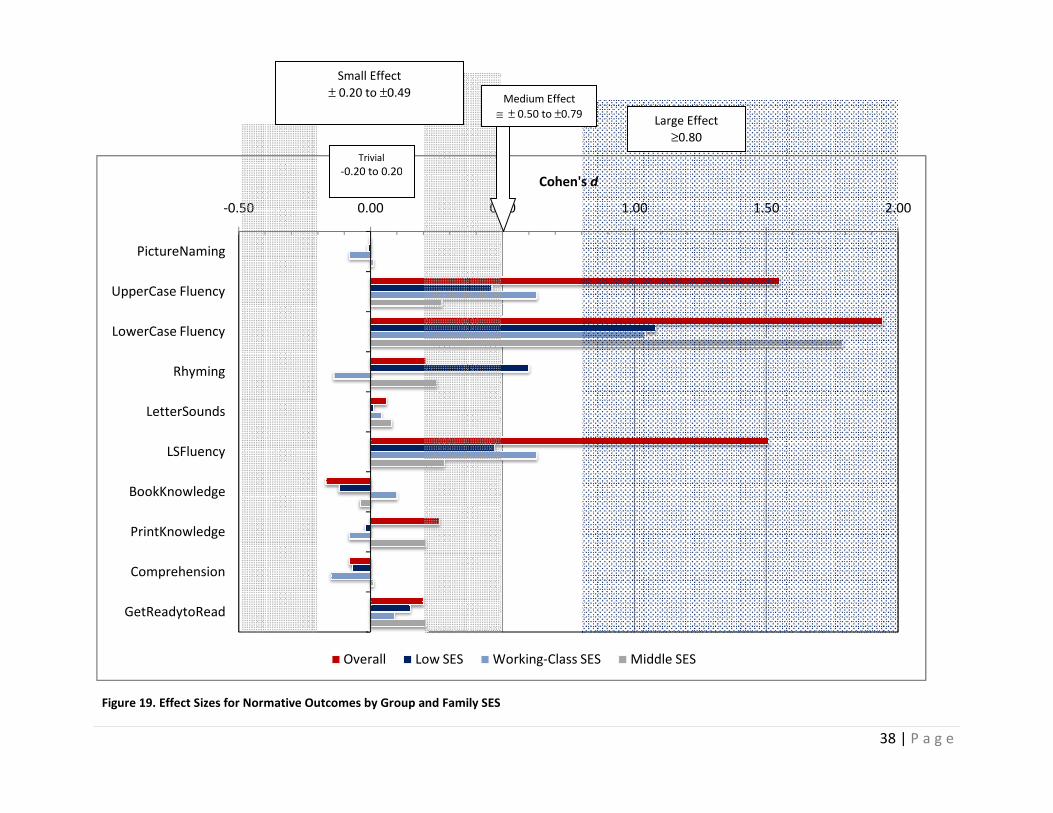
-0.50 0.00
PictureNaming
UpperCase Fluency
LowerCase Fluency
Rhyming
LetterSounds
LSFluency
BookKnowledge
PrintKnowledge
Comprehension
GetReadytoRead
Overall
Figure 19. Effect Sizes for Normative Outcomes by Group and Family SES
Trivial
-0.20 to 0.20
Small Effect
± 0.20 to ±0.49
0.50 1.00 1.50
Cohen's d
Low SES Working-Class SES Middle SES
by Group and Family SES
Large Effect
≥0.80
0.20 to 0.20
Effect
0.49 Medium Effect
≅ ± 0.50 to ±0.79
38 | P a g e
2.00
39 | P a g e
Objective 3: How Much Exposure to SUPER WHY! Does it
Take to Produce Meaningful Change?
Children assigned to the SUPER WHY! group obtained higher scores on language development, letter
knowledge, and phonological and phonemic awareness indicators for both program-specific and
normative assessments when compared with their Control-viewing peers. These comparisons were
made using Analysis of Variance (ANOVA) models. ANOVAs test for statistically significant group
differences. Recall that statistically significant findings rely on a p-value that reflects the odds or
probability that findings were not the result of chance or, alternatively, that these group differences are
likely to be found again and again if the study was repeated. These analyses do not, however, provide
information about the role that exposure plays in the viewing-outcomes process. Exposure measures
the amount of SUPER WHY! that children viewed. In contrast, ANOVAs can only indicate that children
who watched SUPER WHY! did better than children who watched an alternate program.
The analyses presented in this section use exposure to predict post-test performance on all outcomes.
Modeling the relations between exposure and outcomes answers questions about just how much Super
Why exposure it takes to produce meaningful change on the outcomes of interest. Recall that effect
sizes were computed for all outcomes. Effect sizes indicate the magnitude or size of an effect that
resulted from assignment to group and participation in the experiment. These values ranged from trivial
(i.e., little or no effect; both groups performed equally well) to large (i.e., the difference between
viewing groups favored SW viewers and was substantial) with most effects falling in the moderate
range.
There were 11 different indicators of both program-specific and normative performance (i.e., 22
indicators in all). Program-specific performance favored SW viewers on 7 of 11 indicators; favored
Control group viewers on 1 of 11 indicators; and was equivalent for 3 of 11 indicators. Normative
performance also favored Super Why viewers on 7 of 11 indicators; did not favor Control group viewers
on any of the 11 indicators; and was equivalent on 4 of 11 indicators.
Defining Exposure
Families were first randomly assigned to a viewing group. As part of their initial enrollment into the
study, parents were told that they would need to have their child watch a new episode each day for a
total of 20 days47. During that time, parents kept detailed viewing logs. Once the first set of 20 episodes
was viewed, our research team collected the round one diaries, delivered a new diary, and asked the
families to view each of the first 20 episodes a second time. Diaries contained spaces to record which
episode they watched on a given day, how many times they watched that episode, who was present
during the viewing, and what the child and/or parent did while viewing a particular episode. In addition
to the assigned episode, many families allowed their children to watch episodes previously viewed. For
the next set of analyses, exposure refers to the total number of episodes each child viewed over the
course of the project. Tables 2 and 3 detail the relations between exposure and outcomes.
47
At the time of the study, there were 20 episodes of Super Why available
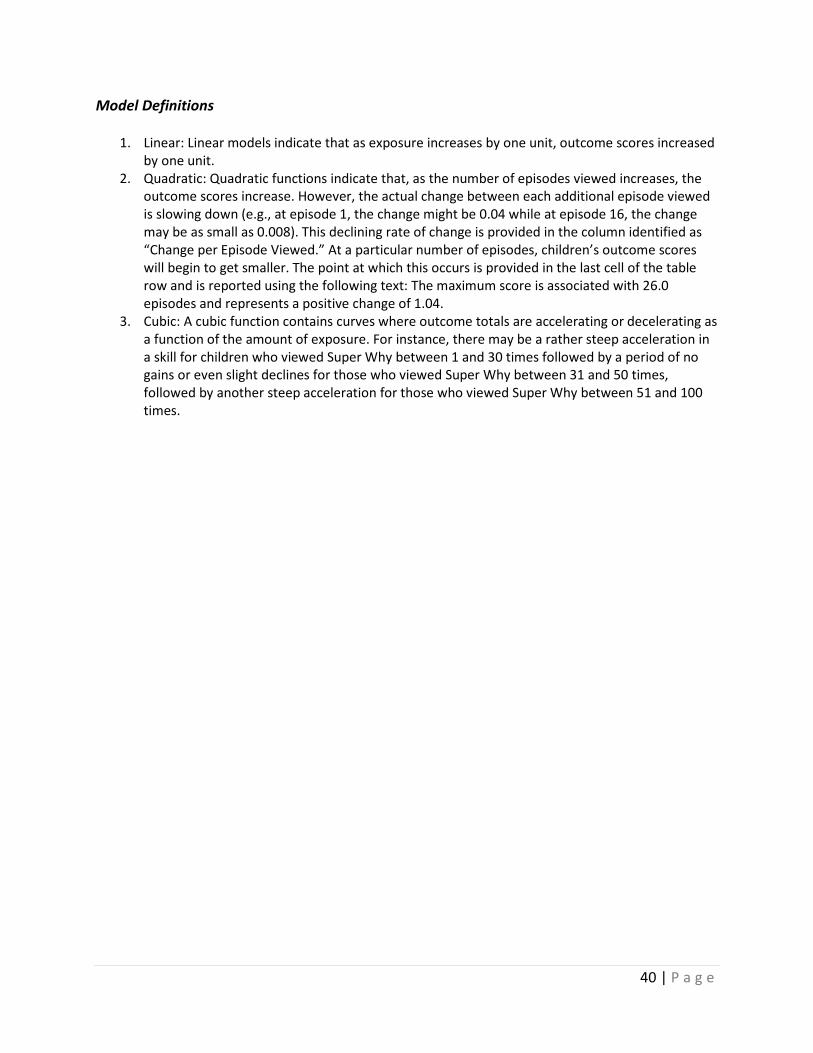
40 | P a g e
Model Definitions
1. Linear: Linear models indicate that as exposure increases by one unit, outcome scores increased
by one unit.
2. Quadratic: Quadratic functions indicate that, as the number of episodes viewed increases, the
outcome scores increase. However, the actual change between each additional episode viewed
is slowing down (e.g., at episode 1, the change might be 0.04 while at episode 16, the change
may be as small as 0.008). This declining rate of change is provided in the column identified as
“Change per Episode Viewed.” At a particular number of episodes, children’s outcome scores
will begin to get smaller. The point at which this occurs is provided in the last cell of the table
row and is reported using the following text: The maximum score is associated with 26.0
episodes and represents a positive change of 1.04.
3. Cubic: A cubic function contains curves where outcome totals are accelerating or decelerating as
a function of the amount of exposure. For instance, there may be a rather steep acceleration in
a skill for children who viewed Super Why between 1 and 30 times followed by a period of no
gains or even slight declines for those who viewed Super Why between 31 and 50 times,
followed by another steep acceleration for those who viewed Super Why between 51 and 100
times.
41 | P a g e
Table 3. Exposure as Predictor of Program-Specific Performance
Total Exposure (Mean = 38.9 episodes viewed; SD = 32.3)
Model Type
Change per Episode
Viewed
Episodes Needed
for 1 Point Change
Standard Deviation
(SD)
Episodes Needed for SD
Change
Language Indicators
Rebus Symbols: SWC Linear .36 2.8 episodes 2.87 symbols 8.0 episodes
Rebus Symbols: NSW No relation between viewing and outcome
Word Knowledge: SWC Linear -0.03 33.3 episodes48 0.67 words 22.3 episodes
Word Knowledge: NSW Cubic Scores are higher
through 2 episodes
Flat from 9 – 58
episodes
Growing again from
59 episodes forward
Achieves 0.67 SD by 97
episodes
Letter Knowledge Indicators
Upper Case: SWC Linear 0.31 3.23 episodes 6.40 letters 20.7 episodes
Lower Case: SWC Linear 0.40 2.5 episodes 9.70 letters 24.3 episodes
Phonological and Phonemic Awareness Indicators
Speech-to-Print: SWC Quadratic 0.94/1.26 -0.9/-1.15 2.40 words matched
Speech-to-Print: NSW No relation between viewing and outcome
Blending: SWC Linear 0.07 14.3 episodes 1.07 blends 15.3 episodes
Blending: NSW Quadraticc 0.039 (1 episode) to
0.008 (16.6 episodes)
16.6 episodes The maximum score is associated with 26.0
episodes and represents a positive change of 1.04
Note. SWC = Super Why-Specific Content; NSW = Non-Super Why Content
48
For every 33.3 episodes viewed, SW viewers’ scores declined by 1 point.
42 | P a g e
Table 4. Exposure as Predictor of Normative Performance
Total Exposure (Mean = 38.9 episodes viewed; SD = 32.3)
Model Type
Change per Episode
Viewed
Episodes Needed
for 1 Point Change
Standard
Deviation (SD)
Episodes Needed for SD
Change
Language Indicators
Picture Naming No relation between viewing and outcome
Letter Knowledge Indicators
Upper Case Fluencya Quadratic 0.008 (1 episode) to 0.005
letters/sec (9.2 episodes)
9.2 episodes The fastest letter-naming rate is with 29.3
episodes (1.4 sec/letter), increasing from there
Lower Case Fluencya Quadratic 0.012 (1 episode) to 0.010
letters/sec (3.8 episodes)
3.8 episodes The fastest letter-naming rate is with 25.0
episodes (1.7 sec/letter), increasing from there
Phonological and Phonemic Awareness Indicators
Rhyming Linear 0.10 rhymes (of 10) 10 episodes 2.40 rhymes 24.0 episodes
Letter Sounds Quadratic 0.276 (1 episode) to 0.275
(1.4 episodes)
1.4 episodes The highest letter-sound score is found with 5.7
episodes (15.7 sounds), dropping from there
Letter Sounds Fluencya Quadratic 0.013 (1 episode) to 0.012
(2 episodes)
< 1 episode The fastest sound rate is with 25.0 episodes
(2.2 sec/sound) dropping from there
Print Conventions Indicators
Book Knowledge No relation between viewing and outcome
Print Knowledge Quadratic 0.384 (0 episode) to 0.355
(1 episode)
< 1 episode The highest print knowledge score is with 23.0
episodes (3.48 points), dropping from there
Comprehension No relation between viewing and outcome
Combined Early Literacy Task
Get Ready to Read Linear 0.18 points 5.6 episodes 2.78 points 13.3 episodes aFor fluency scores, 1 point is equivalent to 1 second.

43 | P a g e
Dosage Conclusion
While previous sections examined whether assignment to viewing group differentiated children’s
literacy skills, this set of analyses evaluated just how many episodes of SW it took to produce meaningful
change in outcome scores. Meaningful change was defined as the number of episodes it took to increase
a child’s score by 1 point49 and to increase a child’s score by a standard deviation50.
Dosage for Program-Specific Outcomes
For outcomes favoring SW viewers, the average number of episodes it took to move a child’s score by
one point was about 8 episodes, while moving scores by a standard deviation took about 19 episodes.
Language development and letter identification required the least number of episodes: 2.8 for language
and 2.9 for letter identification. In contrast, the relation between exposure and speech-to-print
matching was curvilinear (scores increased with exposure through 5 episodes and then declined slightly
with more exposure) while blending scores needed the most episodes for change (15.5 episodes).
Dosage for Normative Outcomes
As with program-specific outcomes, normative outcomes favoring SW viewers also shifted by one point
relatively easy; however, almost all relations between normative outcomes and exposure were
curvilinear (i.e., quadratic functions). Curvilinear relations indicated that as exposure increased initially,
outcome scores increased. At a particular point in exposure, the benefits of watching more episodes
were not found. That is, the change associated with each additional episode viewed became smaller and
smaller. We have noted in Table 3 how much exposure was associated with the maximum change per
episode and the maximum outcome score. On average, the maximum outcome score was achieved after
viewing 20.8 episodes with diminishing gains after that point (and, in some cases, scores began to
decline as children’s exposure level increased). One explanation for this relationship may be that
children who have these skills were not interested in watching the program after a certain point while
those children who did not have all of the featured skills continued to watch the program more
frequently than was asked by the evaluators. To examine this possibility, correlations were computed
among total exposure and parent-reported indices of child’s initial reading ability. Children watched
fewer episodes if, at the start of the study, they knew more alphabet letters (-0.16); knew more letter
sounds (-0.24); or were better readers (r = -0.28). Given these correlations, it is likely that children who
watched more episodes of SW needed more exposure to evidence the same levels of change for
children who had more sophisticated skills at the start.
These analyses indicate that generally fewer than 20 episodes were needed to produce meaningful
change on the outcomes of interest for both program-specific and normative tasks. Situating these
findings with those from Objectives 1 and 2, it is clear that SUPER WHY! is a powerful intervention for
young children. The effect sizes presented earlier further highlight that, while performance improved
nearly universally for children from all levels of SES, the strength of the effects were stronger for
children from low SES families.
49
For fluency scores, it was how many episodes it took to decrease their naming speed by 1 second. 50
Recall that a standard deviation represents the spread around a particular mean where 68% of children’s scores
fall (e.g., 68% of children’s Lower Case Letter Knowledge scores fall between 6.9 and 26). Moving a child’s score by
a standard deviation represents a substantial shift.
44 | P a g e
Objective 4: Did children like the program?
Appeal was assessed in two ways. First, children were asked about SUPER WHY! as a whole including
how much they liked the program, how it compared to a self-identified favorite program, how much
they liked the words onscreen or featured in the show, and what some of the new words they learned
were. Next, a battery of items targeting each of the 4 main characters was administered.
Program Appeal
How Much Did I Like the Program?
Overall, 96.8% liked SUPER WHY! either a little or a lot. There were no significant differences by
gender or family SES.
Did I Learn New Words While Watching Super Why?
Overall, 53.2% of children reported learning new words. When asked to list the new words, 47.6% of
these children accurately listed words featured in SUPER WHY!. Words included: sun, bun, big, cat,
rat, power to read, stop, one, bump, change the story, ball, train, and small.
Character Appeal
Character appeal was evaluated by presenting a picture of each of the 4 main characters and asking
children to: 1) name the character; 2) tell the data collector about that character; 3) ask the child if s/he
would want to be this character’s friend; 3) ask why/why not be character’s friend; 4) ask how much the
child liked the character; 5) ask why or why not; 6) ask the child to identify the character’s power.
Super Why
Nearly all children were able to identify Super Why (i.e., 98.9%). When prompted to tell the data
collector about Super Why, 35.8% of children who were able to articulate a reason (i.e., 33.3%
provided no response) were most likely to mention his “power” (i.e., 9.7%) or that he had the ability
to “change the story” and “save the day” (i.e., 25.8%).
Three-quarters of children would be Super Why’s friend. Responses were quite varied for the follow-
up why prompt ranging from just liking the character (i.e., 11.6%) to he is nice or friendly (i.e., 7.4%),
he helps with reading (5.3%), he can change the story (4.2%), and he is helpful (4.2%). Some children
made reference to Super Why as a TV show that they enjoyed overall (4.2%) or made a connection
between Super Why and themselves (i.e., 4.2%).
Over 90% of children reported liking Super Why a little (i.e., 26.3%) or a lot (i.e., 63.2%). Children
reported wanting to be his friend because they like him (13.7%); he’s nice or friendly (7.4%), he has
a cape, flyer, or Y writer (5.3%); he is helpful (5.3%); and he can read (4.2%).
45 | P a g e
There were no gender differences found for identifying Super Why, wanting to be his friend, or liking
him.
Princess Presto
Nearly all children were able to identify Princess Presto (i.e., 94.1%). When prompted to tell the data
collector about Princess Presto, 34.7% of children mentioned that she would spell or write words;
9.5% mentioned her wand and her dress; 6.3% mentioned her appearance; and 5.3% mentioned
that she could fly or do magic.
Just over half of children would be Princess Presto’s friend (58.2%). Gender-related responses were
provided by 13.7% of the children, all but one of these respondents were boys who would not be
her friend because she’s a girl. Appearance reasons were next at 12.6% of respondents (9 girls and 3
boys) followed by just liking the character (7.4%), liking her wand or dress (6.3%); or she was nice
(5.3%).
Just over two-thirds reported liking Princess Presto a little (27.4%) or a lot (43.2%). The follow-up
prompt generated similar answers to why a child would or would not be Princess Presto’s friend:
boys did not want to be friends with a girl (13.7%; 12 boys did not want to be friends because of her
gender while 1 girl wanted to be her friend because she was a girl) while girls liked her because she
was pretty or beautiful (10.5%; 8 girls liked her because she was beautiful while 2 boys disliked her
because she looked like a girl); and 6.3% would be her friend because she could fly and do magic.
Only 28.6% of boys would be friends with Princess Presto while nearly all girls would be her friend
(92.9%)51. In addition to being friends, girls also reported liking Princess Presto more than boys liked
her52 (i.e., girls: 1.76, boys: 0.64). Nearly 79% of girls and only 15.1% of boys reported liking Princess
Presto a lot while 50.9% of boys and 2.4% of girls did not like her. Finally, 34.0% of boys and 19.0%
of girls liked Princess Presto a little bit.
Alpha Pig
Nearly all children were able to identify Alpha Pig (i.e., 97.8%). When prompted to tell the data
collector about Alpha Pig, 43.2% of children mentioned that he makes, builds, fixes, or sings letters
and the alphabet while 16.8% mentioned that he has tools and builds things (with no specific
reference to letters or the alphabet).
Over 81% would be Alpha Pig’s friend. Nearly 16% wanted to be his friend because Alpha Pig was
cool, super, or funny while 9.5% mentioned that he does some activity (i.e., builds, fixes, sings) with
letters or the alphabet; 8.4% connected Alpha Pig to themselves (e.g., he builds really fast and so do
I, I could help him build a house).
Over 90% of children reported liking Alpha Pig a little (i.e., 26.3%) or a lot (i.e., 65.3%). The follow-up
prompt generated similar answers to why a child would be Alpha Pig’s friend: because they just like
him (15.8%); he has a tool box, a hammer, a helmet, or goggles (8.4%); or he’s nice and friendly
(7.4%).
51
Χ2 = 38.43, p < 0.001
52 F(1, 93) = 72.35, p < 0.001
46 | P a g e
There were no gender differences found for identifying Alpha Pig, wanting to be his friend, or liking
him.
Wonder Red
Nearly all children were able to identify Wonder Red (i.e., 92.5%). When prompted to tell the data
collector about Wonder Red, 29.0% mentioned that she changes words or changes the first letter
and 10.8% mentioned her rollerblades or skates.
Over two-thirds of the children would be Wonder Red’s friend (69.2%). When asked why, children
were most likely to connect themselves to Wonder Red; that is, 11.7% mentioned that Wonder Red
did or had something they did or had (e.g., “Wonder Red has rollerblades and I have Heelies”).
Gender-related responses were provided by 10.6% of the children, all but two of these respondents
were boys who would not be her friend because she’s a girl. Finally, 10.6% would be her friend
because she had roller-skates or some other object that they liked.
Nearly 80% reported liking Wonder Red a little (27.7%) or a lot (52.1%). The follow-up prompt
generated a number of different responses with no category identified by more than 8.4% of the
children (i.e., 8.4% liked her because she had some object that was usually her rollerblades).
Girls reported liking Wonder Red more than boys53 (i.e., girls: 1.83, boys: 0.90). Nearly 86% of girls
and 25% of boys reported liking Wonder Red a lot while 34.6% of boys and 2.4% of girls did not like
her. Finally, 40.4% of boys and 11.9% of girls liked Wonder Red a little bit.
Aggregate Character Analysis
Several different aggregate analyses were conducted to evaluate whether a child’s gender or family
SES moderated the ability to name the four main characters, how many characters children would
be friends with, and how much they liked these characters.
Naming. On average, children were able to accurately identify 3.5 of the 4 characters by name54.
Friends. Boys would be friends with 2.22
characters while girls would be friends
with 3.50 characters55.
Likeability. Girls’ average likeability rating
was 1.70 (out of 2) while boys’ likeability
rating was 1.1456. Girls’ ratings were
consistent across the four characters
while boys’ ratings varied in gender-
stereotypical ways (i.e., boys liked the
female characters much less than the
male characters). While girls liked both
female and both male characters equally
and boys liked both male characters
53
F(1, 93) = 48.15, p < 0.001 54
F(1, 93) = 0.95, n.s. 55
F(1, 93) = 27.19, p < 0.001 56
F(1, 92) = 49.88, p < 0.001
0.0
0.5
1.0
1.5
2.0
SuperWhy PrincessPresto AlphaPig WonderRed
Boys Girls
Figure 20. Likeability Ratings (out of 2) for Each Character by Child's
Gender
47 | P a g e
equally, boys gave different likeability ratings for the two female characters, rating Wonder Red
more highly than Princess Presto. See Figure 12.
Super Powers
The Power to Read
When polled regarding which super power Super Why possessed, 82.5% accurately stated “the
power to read.” Children were also asked (at a later point in the survey) who they would want to
teach them to read. When asked who they would want to teach them to read, 71.6% picked Super
Why; 15.8% picked Wonder Red; 6.3% picked Princess Presto; and 4.2% picked Alpha Pig.
The Power to Spell
When polled regarding which super power Princess Presto had, 80.5% accurately identified “spelling
power.” Children were also asked (at a later point in the survey) who they would want to teach
them to spell: 67.4% picked Princess Presto; 13.7% picked Wonder Red; 9.5% picked Alpha Pig; and
8.4% picked Super Why.
Alphabet Power
When polled regarding which super power Alpha Pig had, 82.6% accurately stated “alphabet
power.” Children were also asked (at a later point in the survey) who they would want to teach
them the alphabet: 86.3% picked Alpha Pig; 7.4% picked Super Why; 3.2% picked Wonder Red; and
2.1% picked Princess Presto.
Word Power
When polled regarding which super power Wonder Red had, 70.9% accurately identified “word
power.” Children were also asked (at a later point in the survey) who they would want to teach
them words: 67.4% picked Wonder Red; 13.7% picked Super Why; 9.5% picked Princess Presto; and
6.3% picked Alpha Pig.
Parasocial Interactions
Who would you want to come to your birthday party?
Children picked Super Why (18.1%); Princess Presto (18.1%); and both Super Why and Alpha Pig
(18.1%) most frequently. Collectively, 13.8% would invite all 4 characters to their birthday party.
Who would you want to talk with if you were sad?
When sad, children wanted to talk with Super Why (34.7%) followed by Alpha Pig (21.1%); Princess
Presto (17.9%); and Wonder Red (13.7%). Around 5% would talk to none of them when sad.
Conversely, 4.2% would talk to all of them when sad.
48 | P a g e
Favorites (and not so favorite)
Who is your favorite character?
Just under 37% picked Super Why as their favorite character (36.8%) while 20.0% picked Princess
Presto; 14.7% picked Alpha Pig; 8.4% picked Wonder Red; 6.3% picked all of them; 3.2% picked both
boys; and 3.2% picked both girls.
A child’s favorite character significantly differed by gender57. The majority of boys picked Super Why
as their favorite (56.6%) followed by Alpha Pig (18.9%). In contrast, girls selected Princess Presto as
their favorite (45.2%) followed by Wonder Red (16.7%), Super Why (11.9%), and Alpha Pig (9.5%).
Who is your least favorite character?
Just over 43% stated that they liked all of the characters (43.2%) while 20% said they disliked
Princess Presto (18 boys and 1 girl); 9.5% did not like Alpha Pig; and 8.4% reported disliking both
girls. Only 3.2% disliked Super Why.
A child’s least favorite character also significantly differed by gender58. The majority of boys picked
Princess Presto as their least favorite (34.0%). In contrast, girls selected Alpha Pig as their least
favorite, although only a small percentage did so (11.9%). Interestingly, 24.5% of boys and 66.7% of
girls stated that they liked all of the characters.
What is your favorite part of the program?
The vast majority of children reported that they liked all of the program (43.0%) while 16.1%
mentioned solving the story problem and changing the story; 9.7% mentioned a specific episode
(e.g., The Ant and the Grasshopper; Little Red Riding Hood; Jack and the Beanstalk); and 8.6%
mentioned reading (e.g., jumping into the story to read it, Super Why reading the story).
What is your least favorite part of the program?
When asked to describe their least favorite part of Super Why, 63.2% said they liked all of it while
10.5% reported a specific episode or character (e.g., “the one where the guy had food and the other
one didn’t”); and 5.3% mentioned anything that Princess Presto did.
How Did SUPER WHY! Compare to My Favorite Show?
Children were first asked what their favorite television show was. This question was then followed
up with “How did SUPER WHY! compare to your favorite show? Did you like it more, less, or the
same?” Six percent of preschoolers said their favorite show was SUPER WHY!; 5.3% reported that
their favorite program was Dora the Explorer, and 3.2% said they liked George Shrinks best. There
were 62 different programs mentioned.
For those who did not choose SUPER WHY! as their favorite program, 57.3% of preschoolers said
they liked SUPER WHY! as much as their favorite show, 12.2% liked SUPER WHY! more and 30.5%
said they liked it less than their favorite show. Among those who liked SUPER WHY! less than their
57
Χ2 = 55.06, p < 0.001
58 Χ
2 = 43.11, p < 0.001

49 | P a g e
favorite shows, 17 of 25 different programs were either entertainment (with no educational
content; Scooby Doo) or violence-themed (e.g., Pokemon). When asked why, 20% of the children
made a reference to some violent theme (e.g., they have better battles). Of those children who
ranked Super Why the same as their favorite program, 38.3% said it was because both programs
were cool, funny, or good. Finally, for those who liked Super Why more, 20% said that it helped
them read or change a story while 10% said that the friends on the show were nice.
50 | P a g e
Conclusion: SUPER WHY! Viewers Liked the Program
and Its Characters A Lot
The preschoolers in this project overwhelming liked SUPER WHY! and the four main characters in the
show. Over half of the children reported that they learned new words while watching and half of these
children were accurately able to identify words or phrases found in the show. Nearly two-thirds of
children who watched the show reported that they would change nothing about the show.
Children were able to recall almost all of the characters’ names. A majority of children were able to
articulate why they liked each character, with most responses mentioning the character’s specific skills
focus or, more generally, reading. Most children were also able to identify a character’s ‘power’ and,
when asked later in the survey which character they would have teach them a specific skill, most often
selected the character who modeled that skill in the show.
Princess Presto seemed to generate the most disparate comments. While a third of the children
mentioned that she spelled or wrote words, other more stereotypical responses trickled into children’s
comments. Both boys and girls liked Super Why and Alpha Pig equally. Girls liked both Princess Presto
and Wonder Red equally. Boys, on the other hand, gave more favorable ratings to Wonder Red when
compared with Princess Presto. This finding is not surprising given that Princess Presto is more
stereotypically like a girl whereas Wonder Red tends to possess more ‘tom-boy’ like or gender-neutral
characteristics. For instance, girls were more likely to provide appearance-related reasons for liking
Princess Presto or wanting to be her friend while no such responses were provided for Wonder Red.
Findings such as these have been found in previous evaluations of children’s television programs
(Linebarger & Piotrowski, 2006). This trend should be further investigated as it is unclear whether
Princess Presto’s overt girlishness overshadows all that she says or contributes to each episode.
Appearance themes were only reported for her and not for either male character or Wonder Red. On
the flip side, Wonder Red was positively rated by the boys in this study, with 25% liking her a lot and
34.6% of boys liking her a little (compared with 15.1% who liked Princess Presto a lot and 34% who liked
her a little).
51 | P a g e
OVERALL CONCLUSION
Did children learn from SUPER WHY!?
The most prominent finding in this project was that preschool children who watched SUPER WHY! across
an 8-week period (i.e., the average SW viewer watched SW roughly 37 times or for 18.5 hours)
performed significantly better on nearly all program-specific measures and most of the standardized
measures of early reading achievement when compared with those preschool children who watched an
alternate program. More specifically, preschool children demonstrated significant growth on targeted
early literacy skills featured in SW including indicators of language development, letter knowledge,
phonological and phonemic awareness, print conventions, and a combined early literacy skills task.
Growth was seen across each type of assessment including growth in program-specific content featured
in the different episodes and growth on standardized measures of early reading ability.
Learning to read begins quite early in a young child’s life with the precursors to conventional reading
success present long before children enter formal schooling. In order for young children to learn to read,
they need multiple and sustained enriching experiences with language, storytelling, and early reading.
Preliminary evidence suggests that SW not only engaged preschoolers (e.g., over 97% reported liking
SW) but also provided critical instruction through its language- and literacy-enriching activities and
lessons. Exposure to these activities and lessons enhanced preschoolers’ early literacy skills, resulting in
learning the content directly featured in the program. The ultimate goal of learning, however, is to be
able to successfully transfer information or skills acquired in one context to another context. The specific
skills and content that preschoolers acquired while watching SW did substantially transfer to generalized
growth on standardized assessments of most of the key early literacy skills measured in this project.
A child’s socioeconomic status (i.e., SES; as measured by an income-to-needs ratio that uses family
income and family size in combination with poverty thresholds developed by the US Census) moderated
several of the results including two program-specific tests and one normative test. SW viewers from Low
SES families who viewed SW obtained significantly higher scores on the two program-specific blending
tasks (both SW and Unrelated content) and the normative rhyming task when compared with their low
SES Control-group peers. Consistent with prior research, effect sizes describing the magnitude of the
difference between viewing groups for children from low SES homes were much higher than effect sizes
for children living in working class and middle SES families. For the most part, SW viewers from low-SES
and working-class SES homes demonstrated substantial improvements over their Control viewing peers
on tests measuring language and phonological and phonemic awareness skills via both program-specific
and standardized tests. The scores that middle- and upper-middle SES SW viewers obtained were
modestly higher than their Control viewing peers, likely because they had many of these skills at the
beginning of the study, leaving little room to capture growth on the various assessments. In cases where
family SES did not matter, all SW viewers outperformed their Control viewing peers, suggesting that
watching SW provided universal learning opportunities that were beneficial for all children as well as
begin to bridge the learning achievement gap between poor and non-poor children in an entertaining
and highly desirable form.
Acquiring early literacy skills is a complex and lengthy process. These results suggest that viewing SW
can play a key role in this process, leading to positive growth in key early literacy skills that, in turn, have
been linked to the development of later conventional reading success. These effects emerged after
relatively little exposure. That is, meaningful changes were found for both program-specific and
52 | P a g e
normative outcomes with as few as 2 or 3 exposures and generally no more than 25 exposures (i.e., for
more complex literacy skills). The largest effects in this study were found for fluency measures,
indicating that watching SW over time helped children move from simple identification of letters and
sounds to more fluent, automatic processing of letters and sounds. Letter knowledge accuracy and
fluency represent foundational skills in the journey to conventional reading success (Burgess & Lonigan,
1998; Foulin, 2005; Rathvon, 2004). By watching SW, preschoolers’ scores across all indices of alphabet
knowledge improved dramatically. In fact, with just under 20 hours of exposure, the magnitude of the
differences between SW viewers and Control viewers averaged 1.67, a huge effect (Cohen, 1998).
The results also demonstrated that viewing SW is universally beneficial as well as particularly powerful
for children from low-SES homes. These children by virtue of living in homes with fewer high quality
educational materials and experiences are at significant risk for later reading failure. Moreover, they are
also likely to spend more time watching television and to report that they value the viewing experience
more highly than their peers living in homes with more educational materials and experiences available
(Bickham, Vandewater, Huston, Lee, Caplovitz, & Wright, 2003; Knowledge Networks, 2005; Roberts,
Foehr, & Rideout, 2005). Given these documented effects on learning as well as the strong appeal of the
program and its characters, SUPER WHY! affords a unique opportunity to implement a scalable and
effective intervention with little cost and much benefit to these children and their families.
Although television is often criticized for promoting intellectual passivity, these findings underscore the
educational power of television particularly when a program has been developed using scientifically-
based research and has been coupled with entertaining characters and formats. SUPER WHY! is the
newest addition to the arsenal of high quality, educational television programs (e.g., Sesame Street,
Between the Lions, Blue’s Clues) that are empirically created; scientifically evaluated; and subsequently
found to help young children encode, store, retrieve, and transfer program content, in SUPER WHY!’s
case, to gains in early literacy skills embedded within an engaging and motivating context.
SUPER WHY! provides preschool children with literacy-rich material and experiences that not only
contribute positively to their early literacy skills, but also help to set them on a positive literacy
trajectory that will enable them to achieve conventional reading success. Previous research documents
a relationship between viewing high-quality educational television when a preschooler and more time
spent reading for leisure as well as higher GPAs when a teenager controlling for a number of important
demographic characteristics including parent education, age, ability, gender, and birth order (Anderson
et al. , 2001). Most of the early viewing in that longitudinal study was Sesame Street, a program that is
more holistically focused on school readiness (of which literacy, letters, etc. are just a part). The primary
curriculum in SW targets early literacy skills and, as a result, each episode is heavily layered with
learning strategies that deliver literacy-rich content (see Vaala et al., 2009). It is likely that early and
extended interactions with SW, particularly for children who have few other material or social resources
in their homes, will not only provide them with crucial opportunities for language and literacy learning
but also help to bridge the achievement gap between children at risk for reading failure and their peers
who have more material and social resources available. Purcell-Gates (1996) proposed that early literacy
experiences are embedded within the social and cultural milieu surrounding young children. When that
milieu is lacking the necessary literacy- and language-rich experiences, television can become an
important and unduplicated educational resource (see Mielke, 1994). Children from minority or low SES
families spend more time with television, see it as a worthwhile way to spend their time, report a sense
of competence at processing its messages, and, as a result, are able to benefit from educational content
(Linebarger et al., 2004; Linebarger & Piotrowski, 2009). Further, these children often demonstrate more

53 | P a g e
substantial learning gains when compared with peers living in middle SES families (e.g., Fisch, 2004;
Linebarger et al., 2004).
Did Children Like SUPER WHY!?
Overall, 97% of preschoolers who rated the show and its characters reported liking it. The majority of
children liked Super Why and Alpha Pig while girls were especially favorable toward the two female
leads. Finally, boys were more favorable toward Wonder Red and less favorable toward Princess Presto.
When asked if they would change any parts of the program, children were most likely to comment that
they liked all of it. The remaining responses were fairly idiosyncratic and tied to specific SW episodes.
Finally, over half of the children reported learning new words from the show and 48% of those children
were able to list these words and phrases.
What Limitations Do These Findings Have?
Children who viewed at home were randomly assigned to viewing group while the children who viewed
at school were all in the SW group. Despite random assignment, there were some initial differences by
group for both an environmental variable (i.e., actual number of books available favored children in the
SW group) and a researcher-developed learning outcome (i.e., Speech to Print Matching, Near Transfer).
Although we used ANCOVA models to control for unexpected pre-test differences, it is possible that we
were unable to control for all variables that might differ between the groups and be responsible for
these findings. There is considerable convergence across a majority of the learning outcomes that
suggests these pre-test differences did not bias the results in favor of SW viewers.
Second, during the course of the project, SUPER WHY! began airing on television. We asked parents to
refrain from showing their children the alternate program used in this study (i.e., control group parents
were asked to not show their children SW episodes). To determine whether children did see SW
episodes despite these efforts, we showed each child a picture of the four SW characters and asked
children whether they recognized the television program depicted in the picture. Because preschoolers
tend to respond affirmatively to interviewer yes/no questions, we followed this question up with a
request for the name of the program. About one-third of the control group viewers said that they
recognized SW and were able to correctly label the program. A future report will more closely examine
the role of exposure to SW both within the SW group and those children in the control group who
recognized and accurately labeled “SUPER WHY!” at the post-test.
What Recommendations Would These Findings Suggest?
Only 1 of the 4 program-similar assessments was significantly different by group. Generalizing program
content to similar content not found in the program appeared more challenging than generalizing
program content to normative assessments. It is possible that the tasks used in this study were either
too difficult or too easy resulting in measurement problems rather than a true inability of the child to
demonstrate a particular skill. It is likely that it was difficult for children to process both the task
structure and the unfamiliar content simultaneously.
SUPER WHY! viewers’ performance on the Word Change task was lower than their Control viewing
peers. This task was created using the same format as the SW episode. When Super Why intervenes to
‘change the story’, the screen lists 3 possible word choices. It is possible that SW viewers may purposely
not select the correct word on the first try because Super Why selects the wrong word first. Although
54 | P a g e
this was not the intended effect, this finding reinforces the powerful impact that high-quality
educational television can exert on young children. Because the task modeled the steps used in the
program to “change the story” and not whether children understood the meaning of the words available
to change the story, it is not possible to determine whether the SW viewers did know the word
meanings and chose not to apply them in this task in an effort to model how Super Why ‘changes the
story’ in every episode.
Three different normative outcomes also demonstrated no significant differences by group: vocabulary,
book knowledge, and story comprehension. Although there is a sizable body of literature positively
linking child educational TV knowledge with vocabulary development, in this study and in another study
of literacy skill acquisition from a specific program (i.e., Between the Lions), no vocabulary gains were
noted. Conversely, programs like Arthur & Friends and Clifford the Big Red Dog have been associated
with larger vocabularies and more expressive language use while playing. If vocabulary is to remain a
major focus of this program, then using more explicit vocabulary-learning strategies may be needed. The
large number of skills in this program, however, may necessitate a reduction in the total number of
educational lessons contained in each episode to avoid overwhelming preschoolers’ limited cognitive
capacity. Finally, Biemiller and Boote (2006) note that vocabulary effects may actually become evident
later, as children have had time to incorporate the new vocabulary into their existing store.
55 | P a g e
Adams, M.J. (1990). Beginning to read: Thinking and learning about print.
Cambridge,MA: MIT Press.
Anderson, D. R. (2000). Researching Blue's Clues: Viewing behavior and impact.
Media Psychology, 2 (2), 179–194.
Anderson, D. R., Huston, A. C., Schmitt, K. L., Linebarger, D. L., & Wright, J. C.
(2001). Early childhood television viewing and adolescent behavior:
The recontact study. Monographs of the Society for Research in Child
Development, 66.
Bickham, D. S., Vandewater, E. A., Huston, A. C., Lee, J. H., Caplovitz, A. G., &
Wright, J. C. (2003). Predictors of Children's Media Use: An Examination
of Three Ethnic Groups. Media Psychology 5, 107-137.
Biemiller, A. & Boote, C. (2006). An Effective Method for Building Vocabulary in
Primary Grades. Journal of Educational Psychology, 98 (1), 44-62.
Burgess, S. R., & Lonigan, C. J. (1998). Bidirectional relations of phonological
sensitivity and prereading abilities: Evidence from a preschool sample.
Journal of Experimental Child Psychology, 70, 117-141.
Cohen, J. (1988) Statistical Power Analysis for the Behavioral Sciences (2nd ed)
Hillsdale, NJ: Lawrence Erlbaum.
Daly, E., Wright, J., Kelly, S., & Martens, B. (1997). Measures of early academic
skills: Reliability and validity with a first grade sample. School Psychology
Quarterly, 12, 268-280.
Ehri, L. C. (1998). Grapheme-phoneme knowledge is essential for learning to
read words in English. In J.L. Metsala and L.C. Ehri (Eds). Word
recognition in beginning literacy (pp. 3-40). Mahwah, NJ: Erlbaum.
Fisch, S. M. (2004). Children's Learning from Educational Television. Mahwah,
New Jersey: Lawrence Erlbaum.
Fisch, S. M., Kirkorian, H. L., & Anderson, D. R. (2005). Transfer of learning in
informal education: The case of television. In J. P. Mestre (Ed.), Transfer
of learning from a modern multidisciplinary perspective (pp. 371-393).
Greenwich, CT: Information Age.
Fisch, S. M., & Truglio, R. T. (2001). Why children learn from Sesame Street. In S.
M. Fisch & R. T. Truglio (Eds.), “G” is for growing: Thirty years of
research on children and Sesame Street (pp. 233-244). Mahwah, NJ:
Erlbaum.
Foulin, J. N. (2005). Why is letter-name knowledge such a good predictor of
learning to read? Reading and Writing, 18, 129-155.
Hart, B., & Risley, R. T. (1995). Meaningful differences in the everyday experience
of young American children. Baltimore: Paul H. Brookes.
56 | P a g e
Hedges, L. V. (2008). What Are Effect Sizes and Why Do We Need Them? Child
Development Perspectives, 2(3), 167-171.
Invernizzi, M., & Sullivan, A., & Meir, J.. (2004). Phonological awareness literacy
screening for preschool (PALS-PreK). Teachers' Manual. Charlottesville,
VA: University Printing.
Juel, C. (1988). Learning to read and write: A longitudinal study of 54 children
from first through fourth grades. Journal of Educational Psychology, 80,
437-447.
Knowledge Networks (2005). Spring 2005 ownership and trend report. The
Home Technology Monitor. Retrieved November 12, 2007 online from:
http://www.knowledgenetworks.com/news/releases/2005/101405_ht
m.html.
Linebarger, D. L., Kosanic, A., Greenwood, C. R., & Doku, N. S. (2004). Effects of
viewing the television program Between the Lions on the emergent
literacy skills of young children. Journal of Educational Psychology, 96
(2), 297-308.
Linebarger, D. L., & Piotrowski, J. T. (2009). The impact of TV narratives on the
early literacy skills of preschoolers. British Journal of Developmental
Psychology.
Linebarger, D. L., & Piotrowski, J. T. (2006). Pinky Dinky Doo: Evaluating the
educational impact and appeal of Pinky Dinky Doo on preschool
children: A final report prepared for Sesame Workshop. Philadelphia, PA:
Annenberg School for Communication, University of Pennsylvania.
Linebarger, D. L., & Walker, D. (2005). Infants’ and toddlers’ television viewing
and relations to language outcomes. American Behavioral Scientist, 46,
624-645.
Mielke, K. (1994). Sesame Street and children in poverty. Media Studies Journal,
8, 125-134.
Missall, K. N., & McConnell, S. R. (2004). Technical Report: Psychometric
characteristics of individual growth and development indicators –
Picture Naming, Rhyming & Alliteration. Minneapolis, MN: Center for
Early Education and Development.
National Early Literacy Panel (2007). Synthesizing the scientific research on
development of early literacy in young children. National Institute for
Literacy, Washington DC.
Neuman, S. B., & Celano, D. (2001). Access to print in low-income and middle-
income communities. Reading Research Quarterly, 36(1), 8-27.
Neuman, S.B. & Roskos, K. (2005). The state of state prekindergarten standards.
Early Childhood Research Quarterly, 20(2), 125-145.
57 | P a g e
Purcell-Gates, V. (1996). Stories, coupons, and the “TV Guide”: Relationships
between home literacy experiences and emergent literacy knowledge.
Reading Research Quarterly, 31(4), 406-428.
Rathvon, N. (2004). Early Reading Assessment: A Practitioner’s Handbook. New
York: Guilford.
Rice, M. L., Huston, A. C., & Wright, J. C. (1982). The forms of television: Effects
on children's attention, comprehension, and social behavior. In D. Pearl,
L. Bouthilet, & J. B. Lazar (Eds.), Television and behavior: Vol. 2. Ten
years of scientific progress and implications for the 80's (pp. 24 38).
Washington D.C.: Government Printing Office
Roberts, D. F., Foehr, U. G., Rideout, V. 2005. Generation M: Media in the Lives
of 8–18 Year-olds. A Kaiser Family Foundation Study.
Singer, D.G. & Singer, J.L. (2001). Handbook of Children and the Media.
Thousand Oaks, CA: Sage Publications, 2001.
Smith, J., Brooks-Gunn, J., & Klebanov, P. (1997). The consequences of living in
poverty on young children’s cognitive development. In G. J. Duncan & J.
Brooks-Gunn (Eds.), Consequences of growing up poor (pp. 132-189).
New York, NY: Russell Sage Foundation.
Stanovich, K. E., Feeman, D. J., & Cunningham, A. E. (1983). The development of
the relation between letter-naming speed and reading ability. Bulletin of
the Psychomic Society, 21, 199-202.
Stanovich, K. E. (1986). Matthew effects in reading: Some consequences of
individual differences in the acquisition of literacy. Reading Research
Quarterly, 21, 360-406.
Thompson, B. (1999). Journal editorial policies regarding statistical significance
tests: Heat is to fire as p is to importance. Educational Psychology
Review, 11, 157–169.
Torgeson, J. K., Wagner, R. K., Simmons, K., & Laughon, P. (1990). Identifying
phonological coding problems in disabled readers: Naming, counting, or
span measures? Learning Disabilities Quarterly, 13, 236-243.
Vaala, S. V., Barr, R. F., Garcia, A., Salerno, K., Brey, E., Fenstermacher, S. K., et al
(2009). Content analysis of teaching strategies embedded in infant
programming. Poster session to be presented at the biennial meeting of
the Society for Research in Child Development, Denver, CO.
Venn, E., & Jahn, M. (2004). Using Individually Appropriate Instruction in
Preschool. In Teaching and Learning in Preschool (pp. 23-32). Newark,
DE: International Reading Association.

58 | P a g e
Walker, D., Greenwood, C. R., Hart, B., & Carta, J. (1994). Prediction of school
outcomes based on early language production and socioeconomic
factors. Child Development, 65, 606-621.
Woodcock, R. W. (1968). Rebus as a medium in beginning reading instruction.
(ERIC Document Reproduction Service No. ED046631). Peabody College
for Teachers, Nashville, TN.
Wright, J. C., Huston, A. C., Murphy, K. C., St Peters, M., Piñon, M., Scantlin, R., &
Kotler, J. (2001). The relations of early television viewing to school
readiness and vocabulary of children from low-income families: The
Early Window Project. Child Development 72, 1347-1366.
The contents of this document were developed under a cooperative
US Department of Education, the Corporation for Public Broadcasting, and the Public
Broadcasting System for the Ready to Learn Initiative, PR# U295A050003. However, these
contents do not necessarily represent the policy of the Departm
should not assume endorsement by the Federal Government.
The contents of this document were developed under a cooperative agreement between the
US Department of Education, the Corporation for Public Broadcasting, and the Public
Broadcasting System for the Ready to Learn Initiative, PR# U295A050003. However, these
contents do not necessarily represent the policy of the Department of Education and you
should not assume endorsement by the Federal Government.
59 | P a g e
agreement between the
US Department of Education, the Corporation for Public Broadcasting, and the Public
Broadcasting System for the Ready to Learn Initiative, PR# U295A050003. However, these
ent of Education and you


![SUMMATIVE ASSESSMENT- I & II - stdavsuratgarh.orgstdavsuratgarh.org/documents/Publication_S.St16_46... · SOCIAL SCIENCE SUMMATIVE ASSESSMENT- I & II [264] SOCIAL SCIENCE Summative](https://img.pdfslide.us/doc/110x75/5b2f04f37f8b9a94168c482a/summative-assessment-i-ii-social-science-summative-assessment-i-ii-264.jpg)