Embed Size (px)
Citation preview
Summary Statistics: Mean, Median, Standard
Deviation, and More
“Seek simplicity and then distrust it.”(Dr. Monticino)
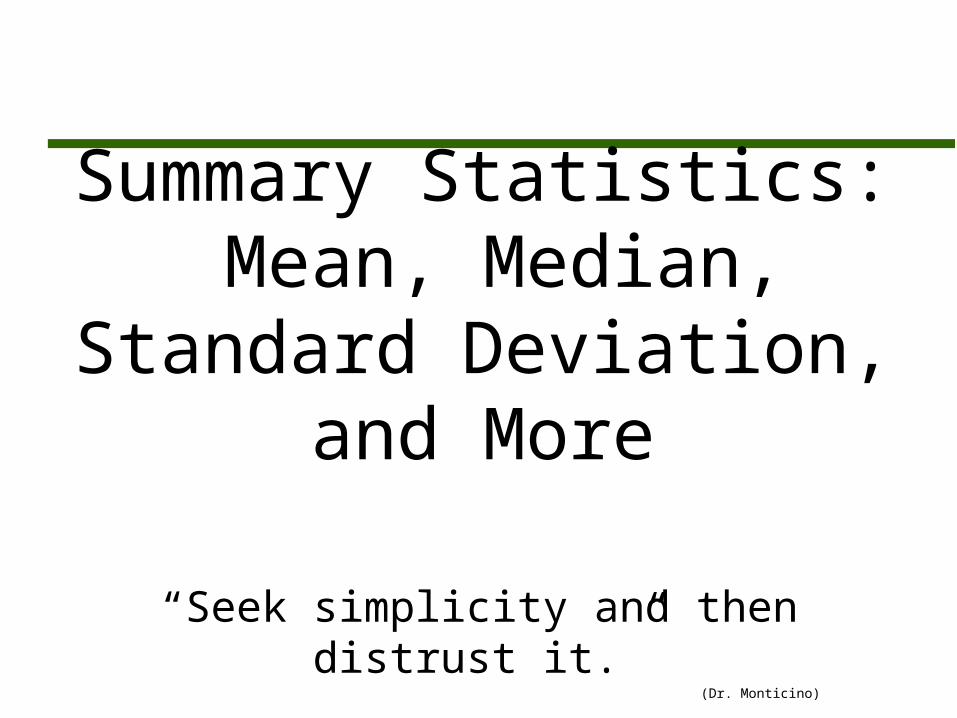
Assignment Sheet Read Chapter 4 Homework #3: Due Wednesday Feb. 9th
Chapter 4 exercise set A: 1 -6, 8, 9 exercise set C: 1, 2, 3 exercise set D: 1 - 4, 8, exercise set E: 4, 5, 7, 8, 11, 12
Quiz #2 will be over Chapter 2 Quiz #3 on basic summary statistic calculations –
mean, median, standard deviation, IQR, SD units If you’d like a copy of notes - email me
Overview Measures of central tendency
Mean (average) Median Outliers
Measures of dispersion Standard deviation
Standard deviation units Range IQR
Review and applications
Central Tendency
Measures of central tendency - mean and median - are useful in obtaining a single number summary of a data set Mean is the arithmetic average Median is a value such that at least 50% of the
data is less and at least 50% is greater
Example
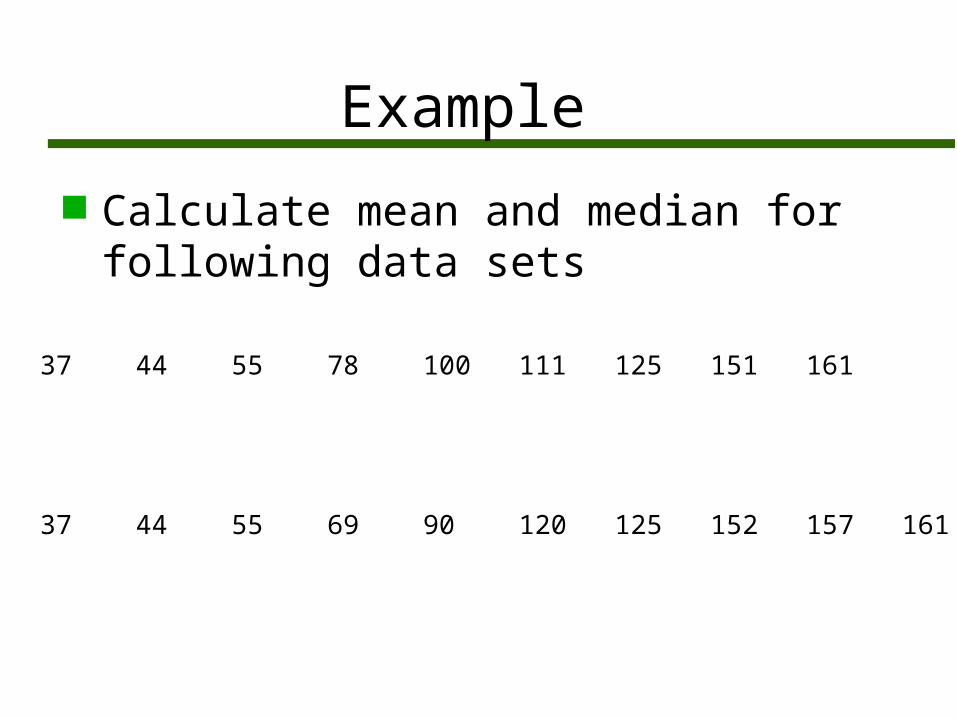
Calculate mean and median for following data sets
37 44 55 78 100 111 125 151 161
37 44 55 69 90 120 125 152 157 161
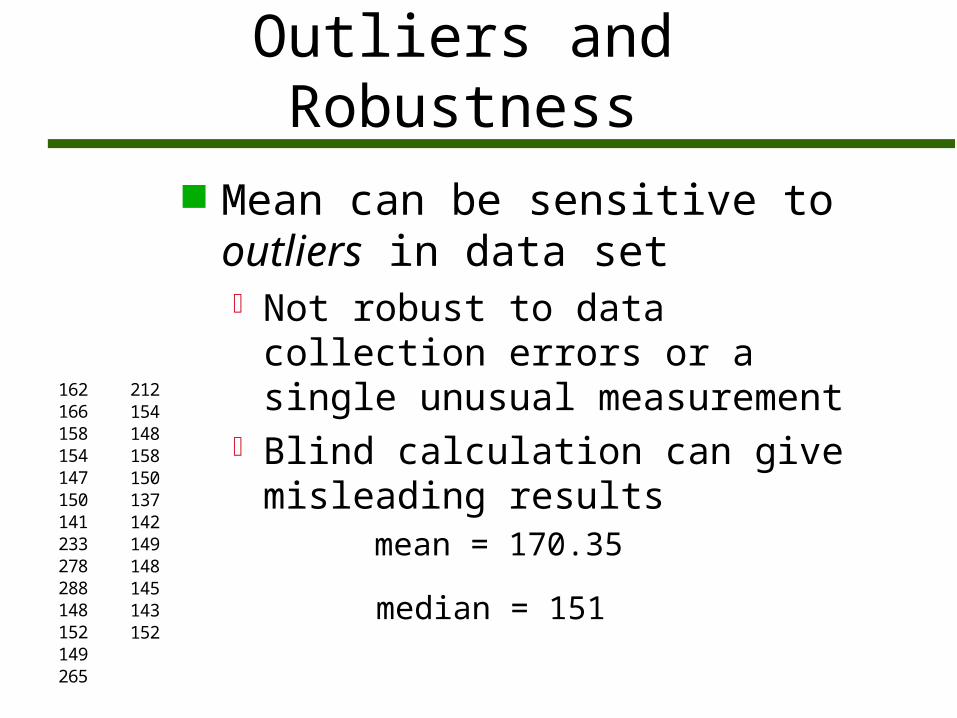
Outliers and Robustness Mean can be sensitive to outliers in data set Not robust to data collection
errors or a single unusual measurement
Blind calculation can give misleading results
mean = 170.35
median = 151
162166158154147150141233278288148152149265
212154148158150137142149148145143152
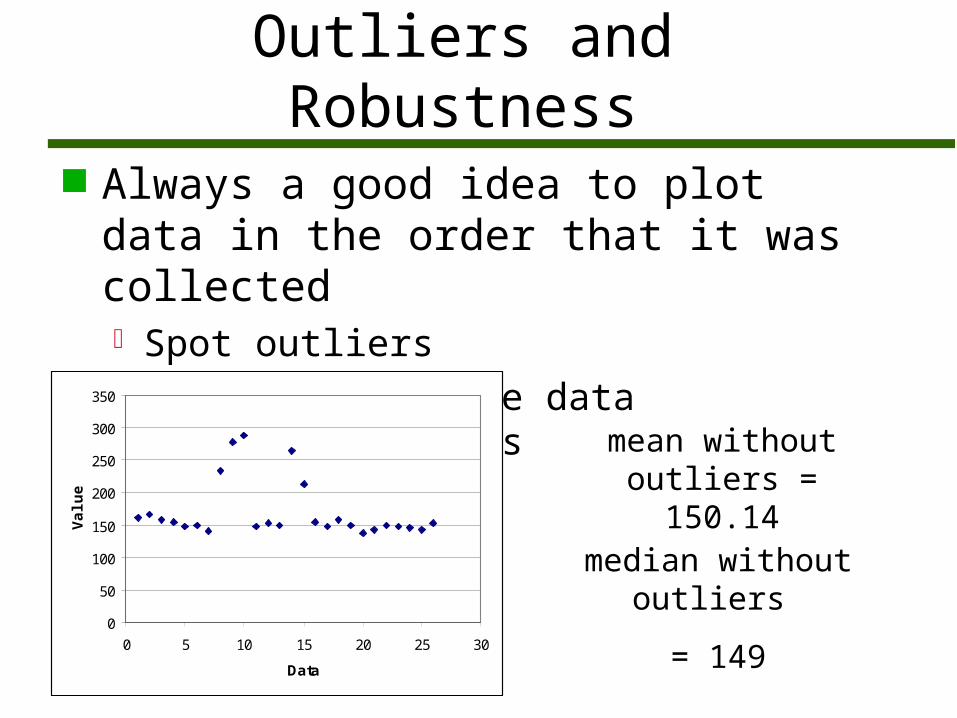
Outliers and Robustness Always a good idea to plot data in
the order that it was collected Spot outliers Identify possible data collection errors
mean without outliers = 150.14
median without outliers
= 1490
50
100
150
200
250
300
350
0 5 10 15 20 25 30
Data
Val
ue
Outliers and Robustness
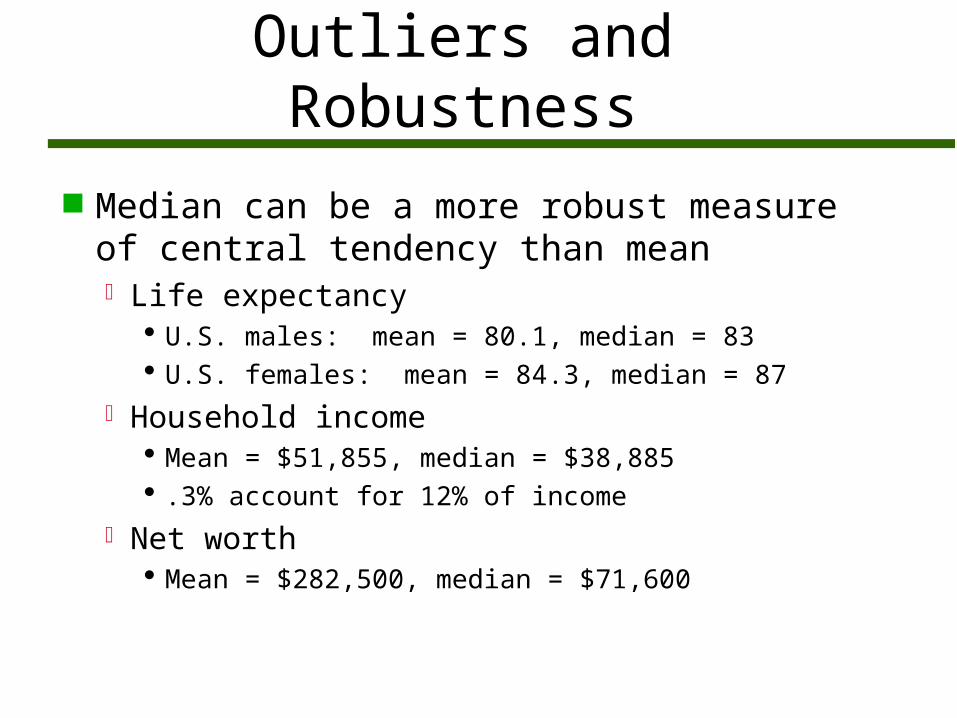
Median can be a more robust measure of central tendency than mean Life expectancy
U.S. males: mean = 80.1, median = 83 U.S. females: mean = 84.3, median = 87
Household income Mean = $51,855, median = $38,885 .3% account for 12% of income
Net worth Mean = $282,500, median = $71,600
Which Central Tendency Measure?
Calculate mean, median and mode Plot data Create histogram to inspect mode(s) Do not delete data points
If analyze data without outliers, report and explain outliers
Many statistical studies involve studying the difference between population means Reporting the mean may be dictated by
objective of study
Which Central Tendency Measure?
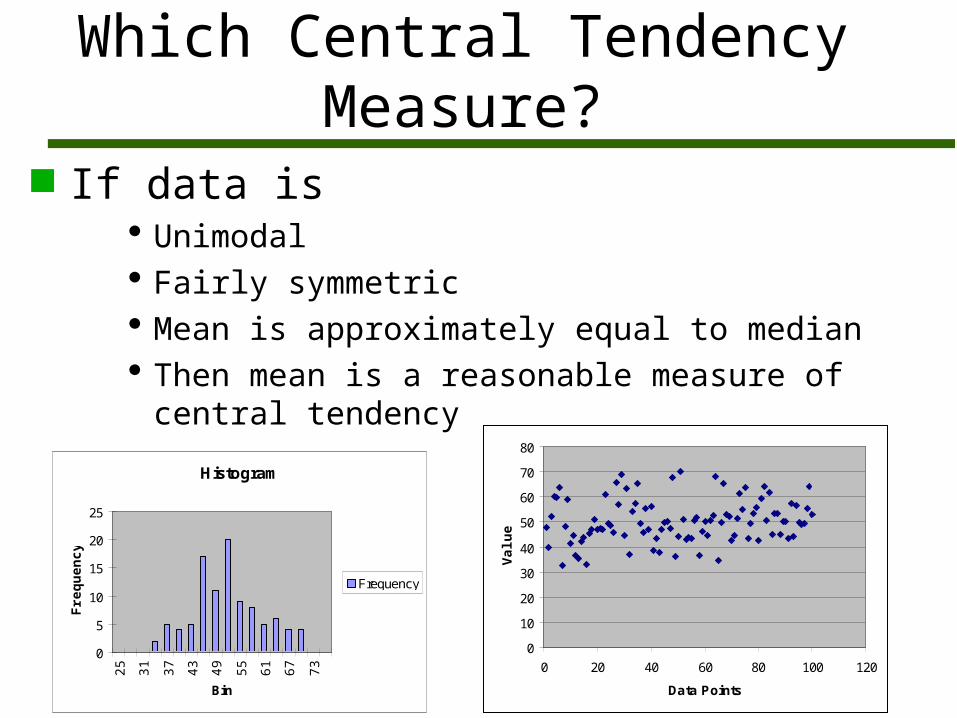
If data is Unimodal Fairly symmetric Mean is approximately equal to median Then mean is a reasonable measure of central
tendency
0
10
20
30
40
50
60
70
80
0 20 40 60 80 100 120
Data Points
Val
ue
Histogram
0
5
10
15
20
25
25 31 37 43 49 55 61 67 73
Bin
Fre
qu
ency
Frequency
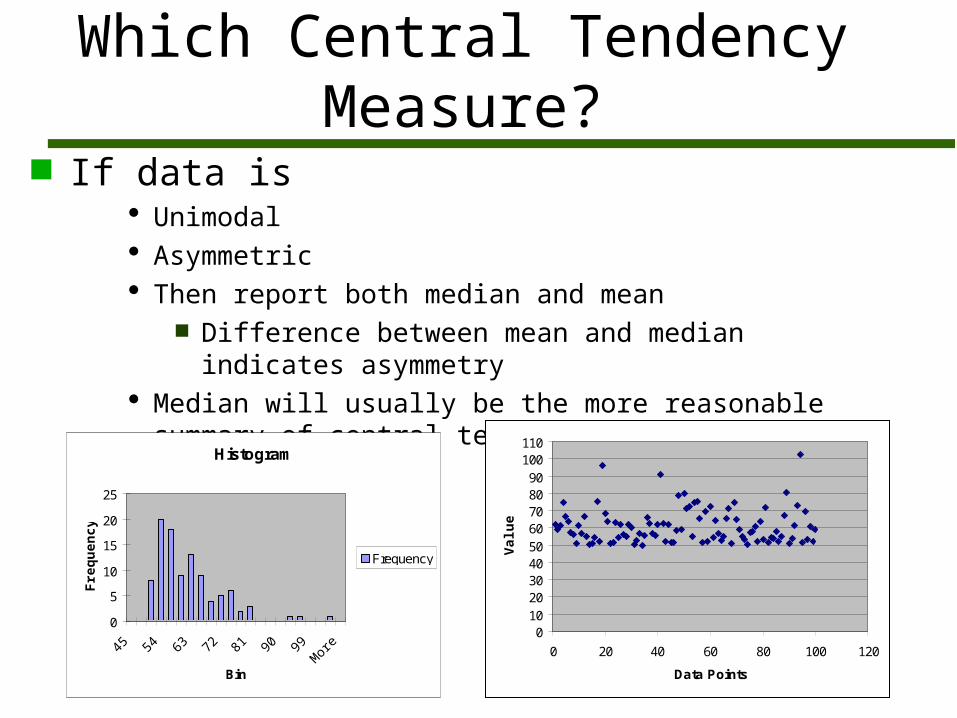
Which Central Tendency Measure?
If data is Unimodal Asymmetric Then report both median and mean
Difference between mean and median indicates asymmetry
Median will usually be the more reasonable summary of central tendency
Histogram
0
5
10
15
20
25
45 54 63 72 81 90 99M
ore
Bin
Fre
qu
ency
Frequency
0102030405060708090
100110
0 20 40 60 80 100 120
Data Points
Val
ue
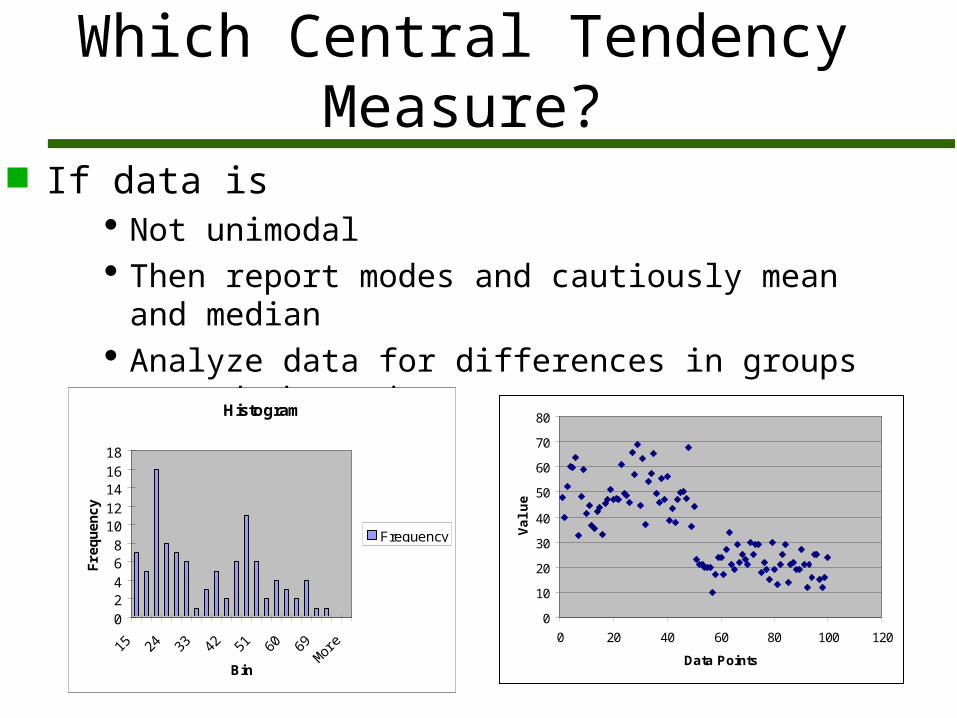
Which Central Tendency Measure?
If data is Not unimodal Then report modes and cautiously mean and
median Analyze data for differences in groups around
the modes
0
10
20
30
40
50
60
70
80
0 20 40 60 80 100 120
Data Points
Val
ue
Histogram
02468
1012141618
15 24 33 42 51 60 69M
ore
Bin
Fre
qu
en
cy
Frequency
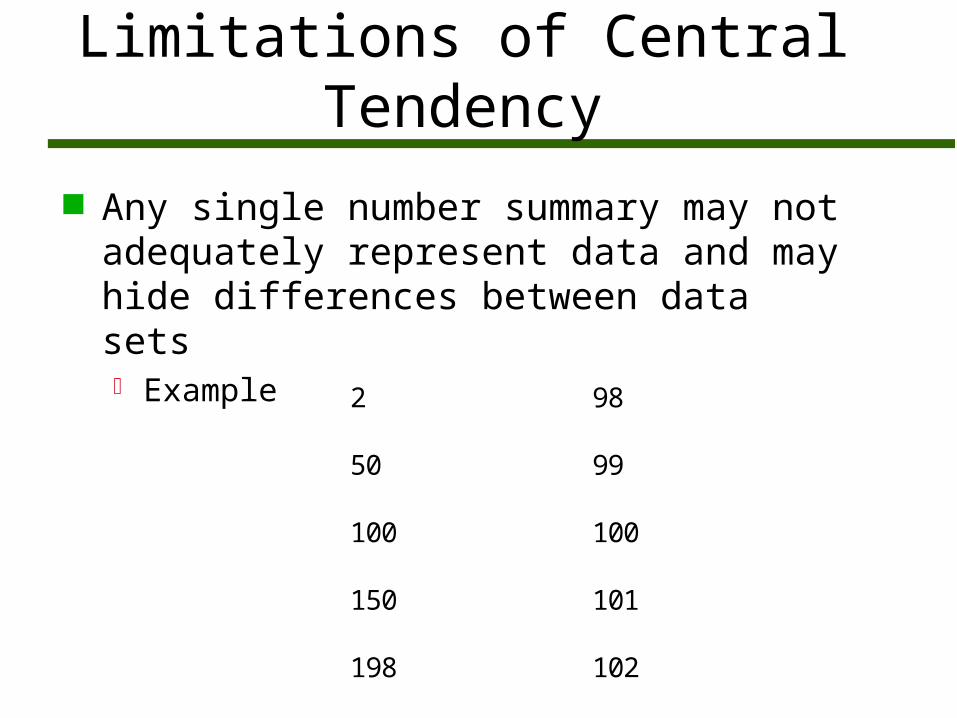
Limitations of Central Tendency
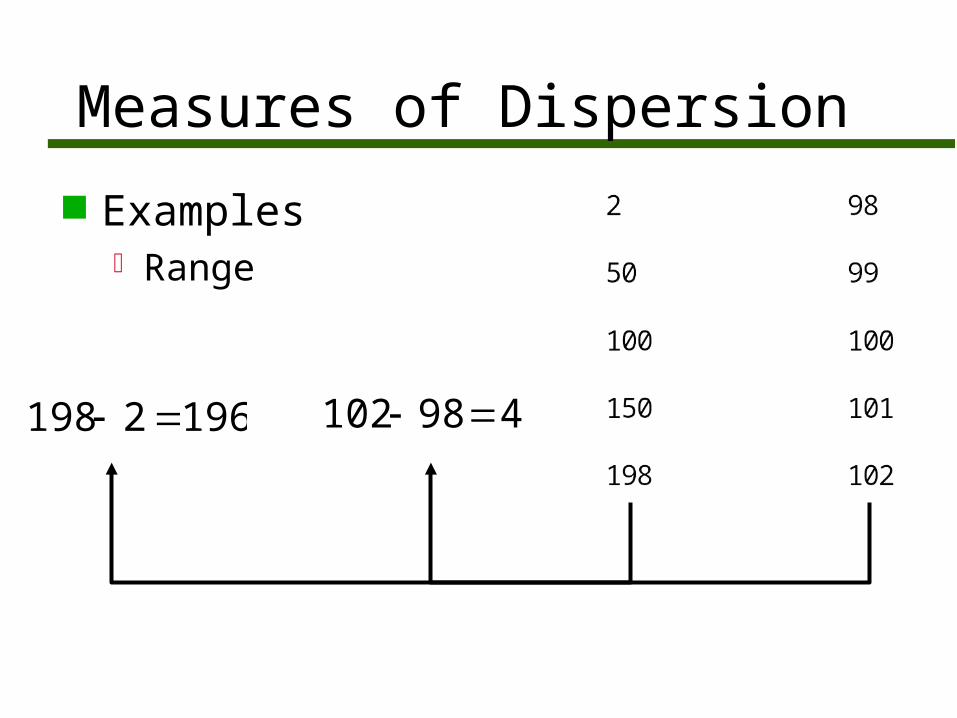
Any single number summary may not adequately represent data and may hide differences between data sets Example
2 98
50 99
100 100
150 101
198 102
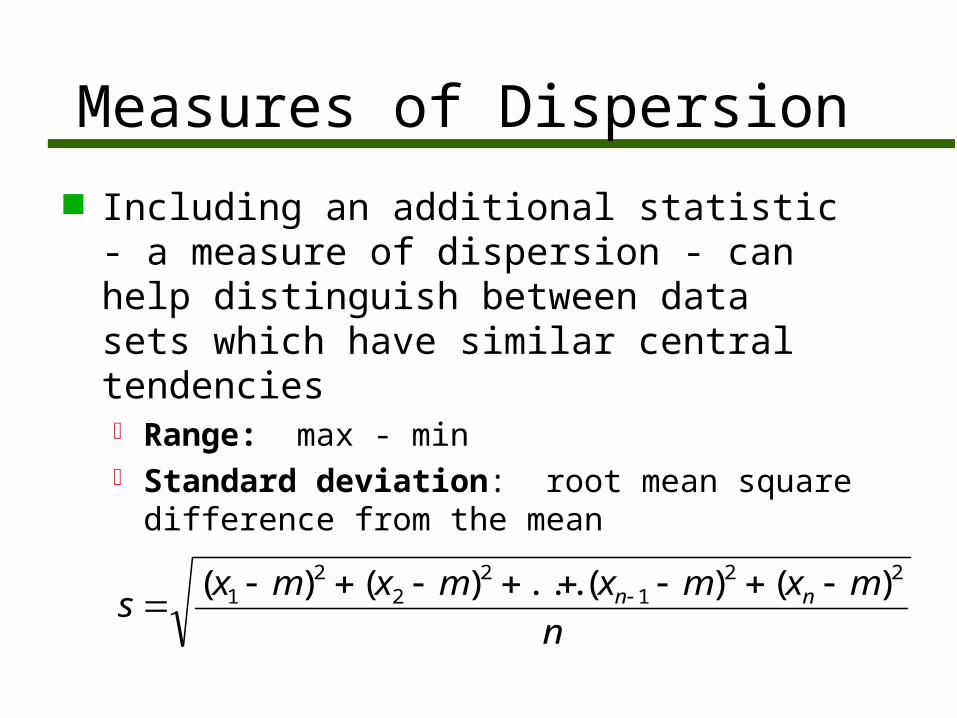
Measures of Dispersion
Including an additional statistic - a measure of dispersion - can help distinguish between data sets which have similar central tendencies Range: max - min Standard deviation: root mean square difference
from the mean
n
mxmxmxmxs nn
221
22
21 )()(...)()(
Measures of Dispersion
Examples Range
1962198 498102
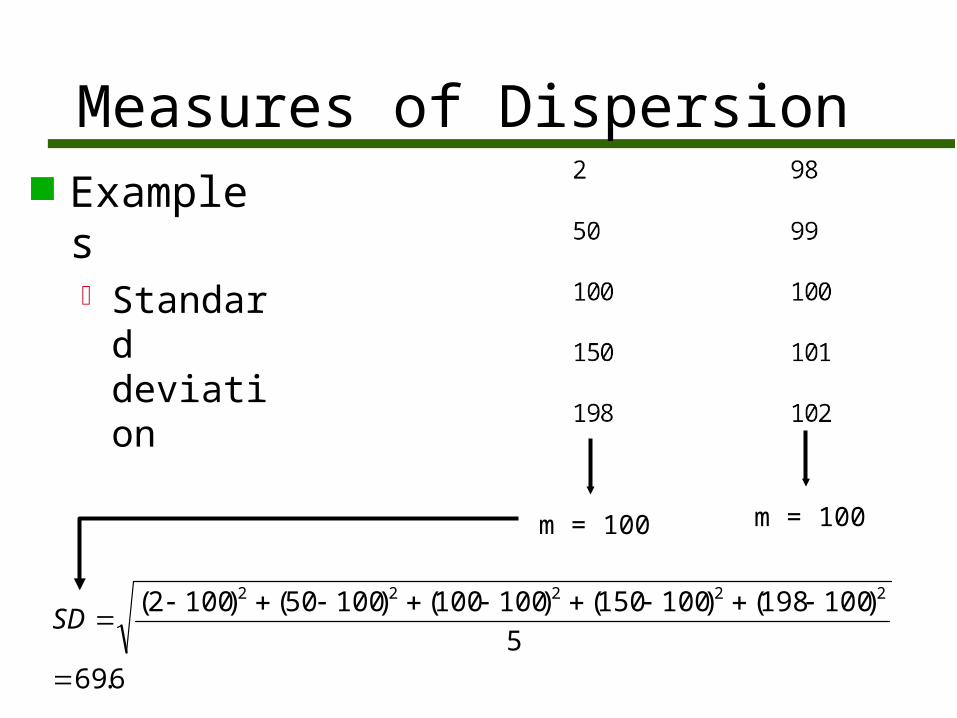
Measures of Dispersion Example
s Standar
d deviation
m = 100 m = 100
6.695
)100198()100150()100100()10050()1002( 22222
SD
Measures of Dispersion
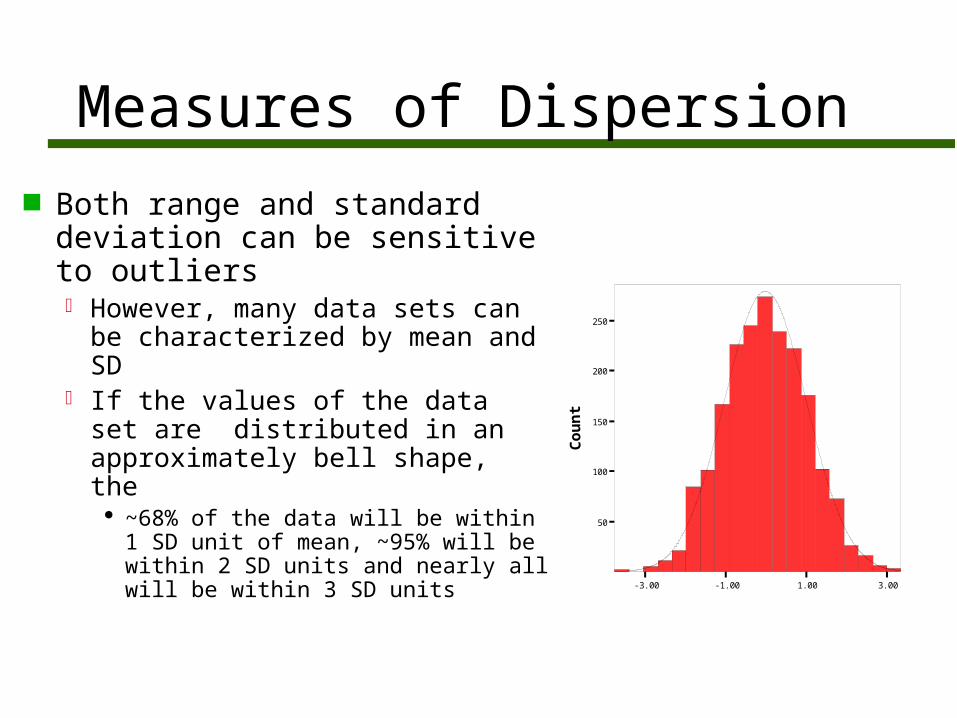
Both range and standard deviation can be sensitive to outliers However, many data sets can
be characterized by mean and SD
If the values of the data set are distributed in an approximately bell shape, the ~68% of the data will be within 1
SD unit of mean, ~95% will be within 2 SD units and nearly all will be within 3 SD units -3.00 -1.00 1.00 3.00
50
100
150
200
250
Co
un
t
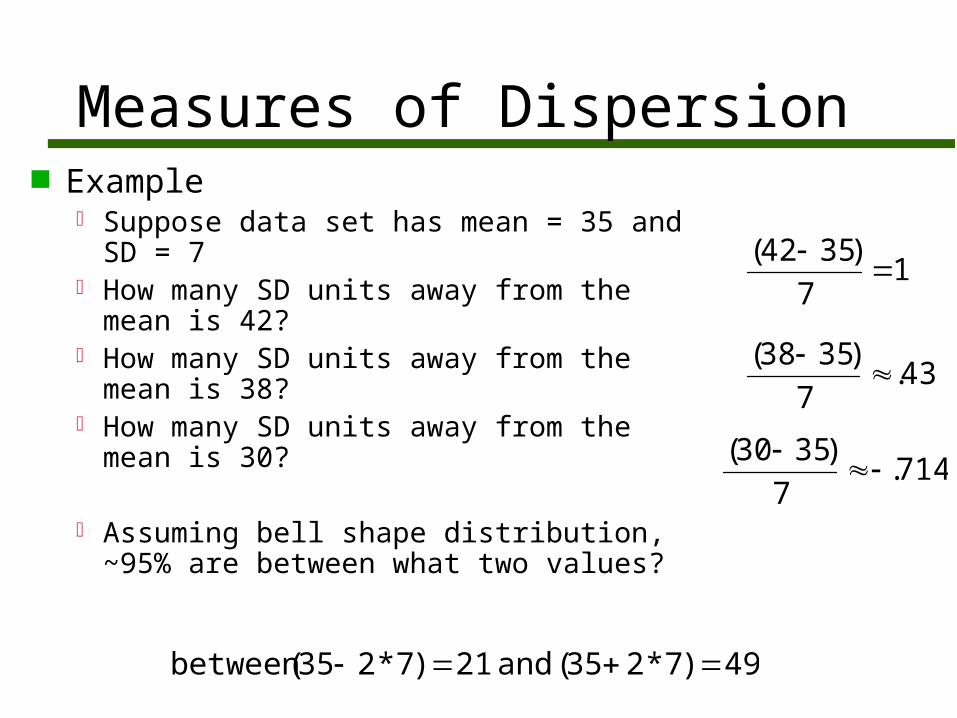
Measures of Dispersion Example
Suppose data set has mean = 35 and SD = 7
How many SD units away from the mean is 42?
How many SD units away from the mean is 38?
How many SD units away from the mean is 30?
Assuming bell shape distribution, ~95% are between what two values?
17
)3542(
43.7
)3538(
714.7
)3530(
49)7*235( and 21)7*235(between
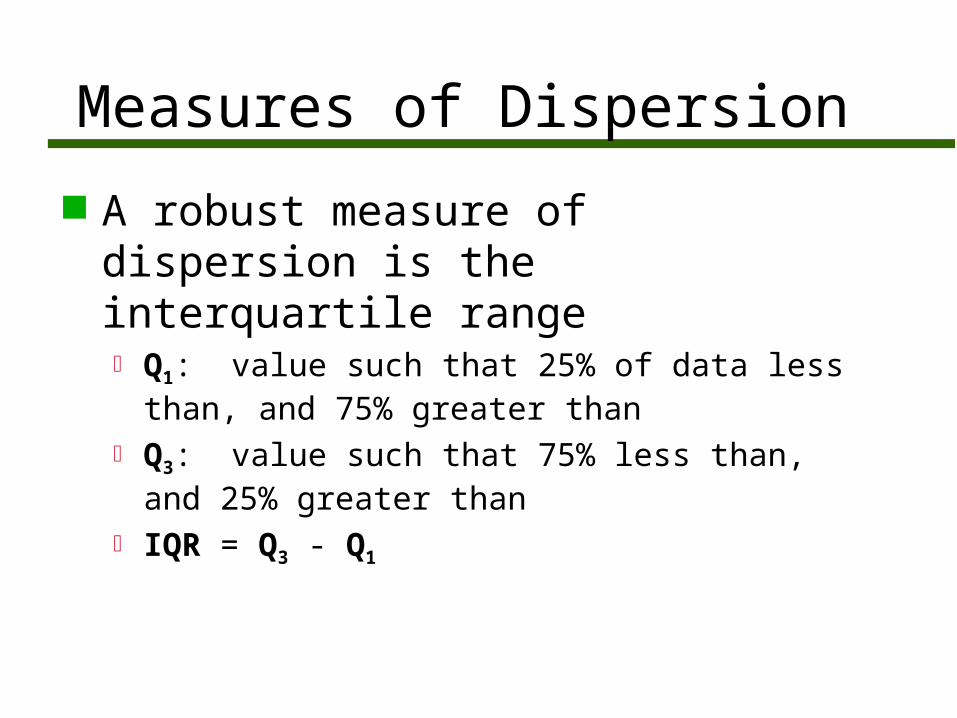
Measures of Dispersion
A robust measure of dispersion is the interquartile range Q1: value such that 25% of data less than, and
75% greater than Q3: value such that 75% less than, and 25%
greater than IQR = Q3 - Q1
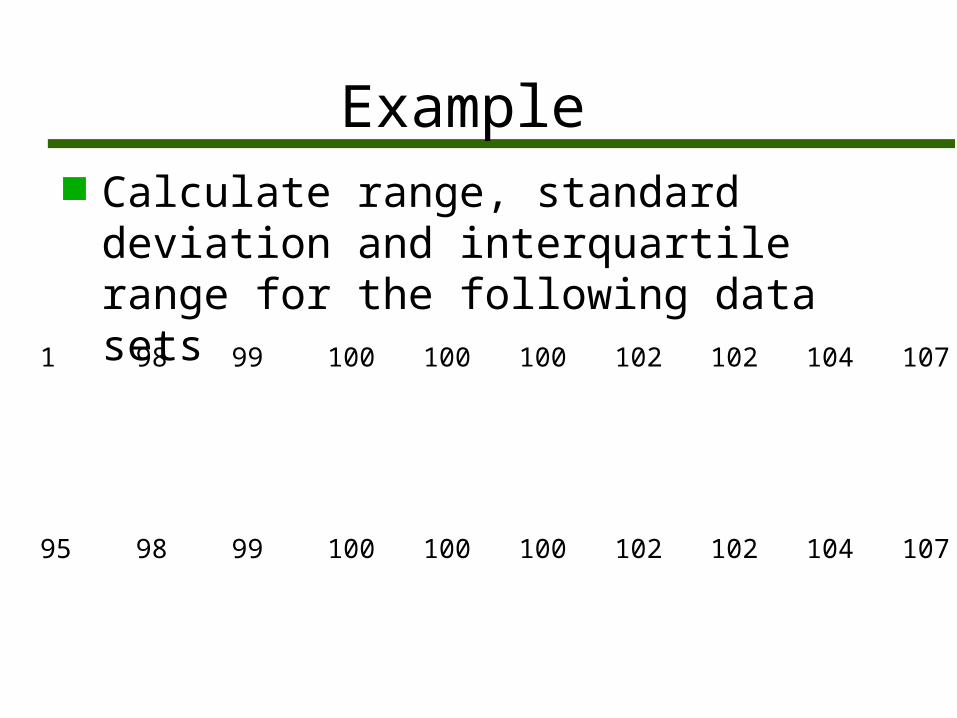
Example Calculate range, standard
deviation and interquartile range for the following data sets
1 98 99 100 100 100 102 102 104 107
95 98 99 100 100 100 102 102 104 107
Assignment, Discussion, Evaluation
Read Chapter 4 Discussion problems
Chapter 4 exercise set A: 1 -6, 8, 9 exercise set C: 1, 2, 3 exercise set D: 1 - 4, 8, exercise set E: 4, 5, 7, 8, 11, 12
Quiz #3 on basic summary statistic calculations – mean, median, standard deviation, IQR, SD units
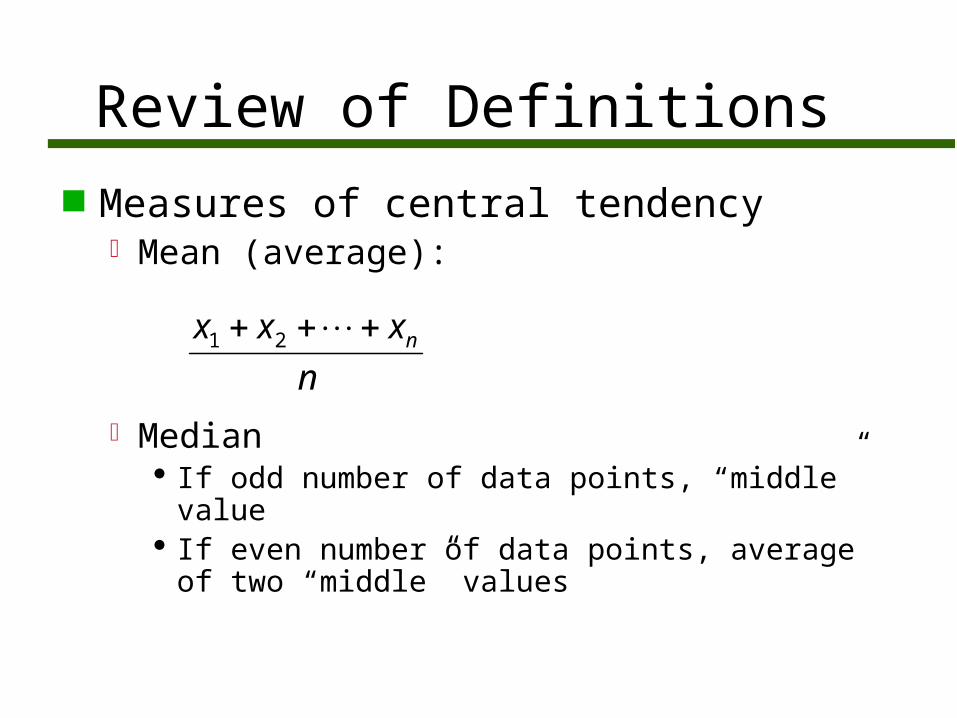
Review of Definitions
Measures of central tendency Mean (average):
Median If odd number of data points, “middle” value If even number of data points, average of two
“middle” values
n
xxx n 21
Question and Examples Can mean be larger than median? Can
median be larger than mean? Give examples
Can mean be a negative number? Can the median?
The average height of three men is 69 inches. Two other men enter the room of heights 73 and 70 inches. What is the average height of all five men?

Questions and Examples The average of a data set is 30.
A value of 8 is added to each element in the data set. What is the new average?
Each element of the data set is increased by 5%. What is the new average?
Suppose that data consists of only 1’s and 0’s What does the average represent?
Application: an experiment is performed and only two outcomes can occur
Label one type of outcome 1 and the other 0
For the data set 31, 45, 72, 86, 62, 78, 50, find the median, Q1 (25th percentile) and Q3 (75th percentile)
Review of Definitions
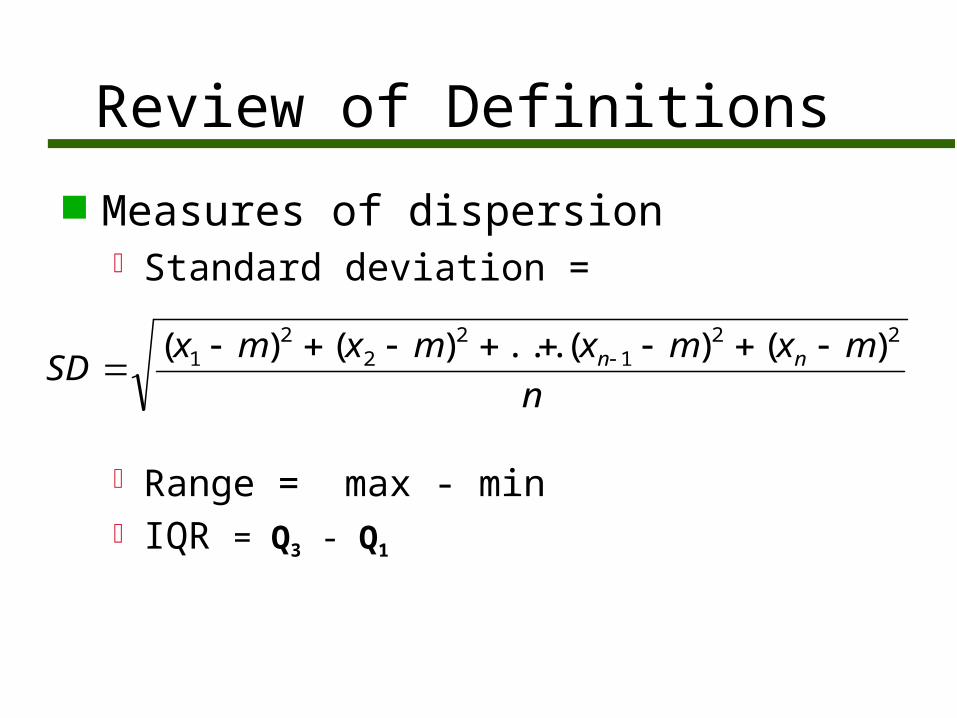
Measures of dispersion Standard deviation =
Range = max - min IQR = Q3 - Q1
n
mxmxmxmxSD nn
221
22
21 )()(...)()(
Questions and Examples Can the SD be negative? Can the range? Can
the IQR? Can the SD equal 0? For the data set 3,1,5,2,1,6 find the SD, range
and IQR The average weight for U.S. men is 175 lbs and
the standard deviation is 20 lbs If a man weighs 190 lbs., how many standard
deviation units away from the mean weight is he? Assuming a normal (bell-shaped) distribution for
weight, ninety-five percent of U.S. men weigh between what two values?
Questions and Examples
The average of a data set is 23 and the standard deviation is 5 A value of 8 is added to each element
in the data set. What is the new standard deviation?
Each element of the data set is increased by 5%. What is the new standard deviation?
(Dr. Monticino)