Embed Size (px)
Citation preview

2013S U M M A R Y R E P O R T

This summary report is a product of the staff of the International Bank for Reconstruction and Development/ The World Bank, prepared after Africa Health Forum 2013, an event co-hosted by the World Bank and the U.S. State Department Office of Global Health Diplomacy, in collaboration with Harmonization for Health in Africa. The findings, interpretations and conclusions expressed in this report do not necessarily reflect the views of the Executive Directors of the World Bank or the governments they represent, or of any of the hosting entities and partners.

SUMMARY REPORT i
AFRICA HEALTH FORUM 2013F I N A N C E A N D C A PA C I T Y F O R R E S U LT S
APRIL 18-19, 2013 | WASHINGTON, D.C.
S U M M A R Y R E P O R T
CONTENTS
About the Forum . . . . . . . . . . . . . . . . . . . . . . . . . . . . . . . . . . . . . . . . . . . . . . . . . . . . . . . . . 1
Key Messages from the Forum . . . . . . . . . . . . . . . . . . . . . . . . . . . . . . . . . . . . . . . . . . . . . . . . 2
Demonstrating value for money . . . . . . . . . . . . . . . . . . . . . . . . . . . . . . . . . . . . . . . . . . . . . 2
Sustainable domestic financing improves a country’s health and economy . . . . . . . . . . . . . . . . . . 3
Access to health in poor and underserved areas . . . . . . . . . . . . . . . . . . . . . . . . . . . . . . . . . . . 4
Using evidence to influence policies . . . . . . . . . . . . . . . . . . . . . . . . . . . . . . . . . . . . . . . . . . 6
Capacity building for medical staff, managers, and administrators . . . . . . . . . . . . . . . . . . . . . . . . 6
Mutual accountability and donor coordination . . . . . . . . . . . . . . . . . . . . . . . . . . . . . . . . . . . . 7
Wrap-up and next steps . . . . . . . . . . . . . . . . . . . . . . . . . . . . . . . . . . . . . . . . . . . . . . . . . . . . 8
Annexes . . . . . . . . . . . . . . . . . . . . . . . . . . . . . . . . . . . . . . . . . . . . . . . . . . . . . . . . . . . . . . . 9
Health Millennium Development Goals Status in Sub-Saharan Africa . . . . . . . . . . . . . . . . . . . . . 10
Background briefs . . . . . . . . . . . . . . . . . . . . . . . . . . . . . . . . . . . . . . . . . . . . . . . . . . . . . . 11
1. Health or Wealth: Which Comes First? . . . . . . . . . . . . . . . . . . . . . . . . . . . . . . . . . . . . . 132. How to Translate Mineral Wealth into Health and Social Development . . . . . . . . . . . . . . . . 173. Health Financing and Fiscal Health in Africa . . . . . . . . . . . . . . . . . . . . . . . . . . . . . . . . . 214. Results-Based Financing for Health . . . . . . . . . . . . . . . . . . . . . . . . . . . . . . . . . . . . . . . 255. Capacity Development for Better Implementation and Results . . . . . . . . . . . . . . . . . . . . . 296. Public Private Partnerships for Health . . . . . . . . . . . . . . . . . . . . . . . . . . . . . . . . . . . . . 337. Information to Improve Value for Money in Health . . . . . . . . . . . . . . . . . . . . . . . . . . . . . 378. Fixing Labor Market Leakages . . . . . . . . . . . . . . . . . . . . . . . . . . . . . . . . . . . . . . . . . . 419. The Roles of Research-Based, Non-State Actors in Building Capacity . . . . . . . . . . . . . . . . . 45
for Effectiveness and Sustainability in Africa’s Health SectorFormat and Agenda . . . . . . . . . . . . . . . . . . . . . . . . . . . . . . . . . . . . . . . . . . . . . . . . . . . . 49
Participants . . . . . . . . . . . . . . . . . . . . . . . . . . . . . . . . . . . . . . . . . . . . . . . . . . . . . . . . . 51

AFRICA HEALTH FORUM 2013: FINANCE AND CAPACITY FOR RESULTSii

ABOUT THE FORUM
During the 2013 World Bank–International Monetary Fund Spring Meetings in
Washington, DC, African Ministers of Finance and Health from 30 countries, along
with development partners, participated in the Africa Health Forum 2013: Finance
and Capacity for Results. The landmark event was co-hosted by the World Bank
and the U.S. State Department Office of Global Health Diplomacy, in collaboration
with Harmonization for Health in Africa, a network of agencies and donors that
aims to provide coordinated support to African countries in strengthening their
health systems.
The Forum was convened in response to a request from African Heads of State and Government to the World Bank to work with partners to provide practical support to build the capacities of countries in preparing for a future in which they will take full responsibility for financing, managing, and evaluating their own development and programs. The Forum built on prior efforts by Harmonization for Health in Africa1.
Designed to stimulate debate among Ministers of Finance and Health, the Forum was an opportunity for countries to share both successes and challenges in the areas of sustainable health financing and institutional capacity to improve health outcomes. It helped explore policy options that support the establishment of sustainable health systems and presented examples of scalable results from across Africa.
1 Earlier efforts to bring together ministers of finance and health include: African Union Heads of State 15th Summit, Kampala, Uganda, 2010 – side event on health financing www.africa-union.org/root/au/conferences/2010/july/summit/15thsummit.html; Sixth Joint Annual Meetings of the African Union Conference of Ministers of Economy and Finance and Conference of African Ministers of Finance, Planning and Economic Development of the United Nations Economic Commission for Africa, Addis Ababa, Ethiopia, March 2011 – panel discussion on health financing (www.uneca.org/cfm),WHO Regional Committee for Africa’s 61st Session, Yamoussoukro, Côte d’Ivoire, 2011 – panel discussion on health financing (www.afro.who.int/en/sixty-first-session.html), Harmonization for Health in Africa’s conference hosted by AfDB, Tunis, Tunisia, July 2012 – Value for Money, Sustainability and Accountability in the Health Sector (www.hha-online.org/hso/conference).
SUMMARY REPORT 1
AFRICA HEALTH FORUM 2013F I N A N C E A N D C A PA C I T Y F O R R E S U LT S
APRIL 18-19, 2013 | WASHINGTON, D.C.
S U M M A R Y R E P O R T

KEY MESSAGES FROM THE FORUM
Africa is now a continent defined by its possibilities. Sub-Saharan countries have been less affected by the economic downturn than many of their external partners. In fact, the regional economic outlook is positive, with annual growth projected to rise to 5.9 percent in 2014.2 Many African countries are discovering large deposits of natural resources, yielding revenues that could be invested in health and human capital. The region also has a burgeoning youth population. With strategic high-impact investments in health, education, and employment, African economies can benefit from changes in population age structure and dependency ratios, and reap a demographic dividend.
But Sub-Saharan Africa’s improving domestic fiscal health and natural resources wealth has not automatically resulted in better health for people. Yet better health, nutrition, and demographic outcomes have preceded economic growth in countries across the world. Investments in human capital are no less important than investments in physical capital such as energy or roads. For example, investing in nutrition in the first 1,000 days of a child’s life can permanently boost his or her lifetime earnings and productivity.
2 www.imf.org/external/pubs/ft/weo/2013/update/02/.
A number of salient messages emerged from the Forum including the urgent need to demonstrate value for money in health; the human and economic benefits of improving sustainable domestic financing; and the importance of increasing access to health in poor and underserved areas. Participants also highlighted the need to use evidence to influence policies and build greater capacity among medical staff, managers, and administrators; and emphasized mutual accountability and donor coordination. These messages are summarized below.
#1 Demonstrating value for money
Better nutrition, health, and demographic outcomes have spurred productivity worldwide. Securing Africa’s future rests on achieving large-scale rapid health results. The global community is focusing more on funding for results to support country ownership and promote innovation and efficiency. Homegrown innovations and experiments are yielding value for money, including results-based financing, improved management of resources and accountability, stronger donor coordination and alignment to a country’s single strategic plan, and effective public-private partnerships. Functional systems are required to deliver results. Even with results-focused strategies, systemic weakness continues to be a limiting factor. Demonstrating value for money will help sustain and increase domestic investments in health.
Some highlights from the proceedings:
Where something is working, seriously consider scaling up: World Bank Vice President for Africa Makhtar Diop noted that although investments in health in Africa have more than doubled over the past decade, finding additional external resources to finance health in a changing global economy is going to be difficult. Not all countries have natural resources revenues to tap, he added, emphasizing that demonstrating ‘value for money’ in health is important and that where something is working, a scale-up should be considered seriously. For example, Results-Based Financing in health has been delivering rapid results by giving frontline health centers greater autonomy and offering performance-based incentives to health workers.
World Bank Vice President for Africa Makhtar Diop addresses Forum Participants.
AFRICA HEALTH FORUM 2013: FINANCE AND CAPACITY FOR RESULTS2

Money alone doesn’t yield results; how it is used matters too. Ngozi Okonjo-Iweala, Nigeria’s Minister of Finance and Coordinating Minister for the Economy noted that health funding alone does not yield results; how it is used matters, too. As an example, Nigeria used to depend on external funding for immunization because government disbursements did not coincide with when vaccines were needed. However, disbursements of external funds were also unpredictable. In 2012, by changing the disbursement schedule and front-loading all immunization resources at the fiscal year’s beginning, Nigeria reduced its dependence on external assistance.
Performance-based financing can help achieve real results. Burundi’s Minister of Finance and Economic Development Planning, Tabu Aballah Manirakiza, noted that following a five-year pilot that finished in 2010, a nationwide performance-based financing initiative is now yielding dramatic improvements in health indicators. Assisted deliveries have risen from 34 percent at baseline to 60 percent in 2010 and 72 percent in 2012. The maternal mortality ratio fell from over 600 deaths per 100,000 live births to 450 in 2012. And the child vaccination rate rose from 45 percent to 91 percent in 2012. Three challenges remain: maintaining the level of financing and the predictability and dependability of funding, improving health insurance program, and promoting the autonomy of hospitals.
Minister of Public Health André Mama Fouda of Cameroon mentioned that through a US$25-million World Bank loan, a performance-based financing pilot is under way in four regions promoting maternal and child health and combating communicable diseases. The pilot is in line with the country’s three-pillar poverty-reduction strategy: to enhance service delivery, improve governance in the health sector and reduce corruption, and strengthen cooperation among the donors. Thanks to this effort, more women come to hospitals for prenatal consultation and delivery in cleaner and better managed facilities, and vaccination rates are going up. Performance-based financing also has resulted in higher retention of skilled health-sector staff in Cameroon’s remote areas.
Dr. Shahnaz Sharif, Director, Kenya’s Ministry of Public Health and Sanitation, emphasized that performance-based financing has helped measure results in terms of outcomes rather than inputs. While this tactic has improved health indicators even in the remote areas of Kenya, changing the system remains challenging.
Encouragingly, donors are now accepting the same procurement system, which should accelerate the use of the results-oriented approach.
#2 Sustainable domestic financing improves a country’s health and economy
United States Deputy Secretary of State Burns noted that to safeguard the significant investments made by all, and the results achieved, governments—in partnership with civil society and the private sector—should lead, implement, and eventually pay for all aspects of their health system. He emphasized that partnership between Ministries of Finance and Ministries of Health were critical.
There was a rich discussion on how to channel African countries’ higher revenues from economic growth to expand domestic financing for health. Uncertainties in the quantity and timing of aid disbursements make domestic financing even more important. Potential sources of domestic financing include revenues from reallocating poorly targeted subsidies, earmarked revenues from wealth generated by natural resources, special levies, general tax revenue, and community insurance contributions.
Panel on Sustainable Financing for Results. L to R: Maria Kiwanuka, Minister of Finance, Planning & Economic Development, Uganda; Tendai L. Biti, Minister of Finance, Zimbabwe; Andre Mama Fouda, Minister of Public Health, Cameroon; Makhtar Diop, World Bank Vice President for Africa (chair); D. Hussain A. H. Mwinyi, Minister of Health & Social Welfare, Tanzania; Ngozi Okonjo-Iweala, Minister of Finance and Coordinating Minister for the Economy, Nigeria.
SUMMARY REPORT 3

During the Forum, Margaret Chan, Director General of the World Health Organization, recognized that self-reliance is the ultimate objective of every country. She noted Africa’s resilience in the face of the recent financial crisis, and its continuing growth trajectory, and also called on African governments to put wealth to good use by improving people’s health.
Sustainable domestic financing themes that emerged during the Forum include:
• Mobilizing domestic funding for health financing can ensure the highest impact and sustainable health outcomes, strengthen systems, develop and refine pro-poor strategies, and improve access and equity.
• Pro-poor health programs are expected to create a positive revenue feedback loop, as people graduate from poverty and contribute to the resource base.
• Through an open dialogue between ministries of finance and health, increasing domestic financing for health can begin to reduce a country’s dependence on donor support.
• Mobilizing multiple sources of domestic sources of funding—public revenue, community support, and private sector contribution—will lead to improved health outcomes by expanding coverage to residents who are poor and live in remote areas.
Using external financing smartly: As domestic funding grows, external funding should be targeted at exploring catalytic solutions that promote sustainability. For example, the government of Rwanda implemented targeted strategies while building up systems, leading to steep declines in morbidity and mortality with a modest but focused investment. Strategic areas that external financing could support include health management information systems, and monitoring and evaluation.
Homegrown solutions for sustainable domestic financing: While there is no one single answer, techniques African countries are trying to implement include:
Redirecting funds from natural resource subsidies. Nigeria’s government reduced petroleum subsidies, redirecting those savings to programs tackling malaria, HIV, and maternal and infant mortality among poor people. Of US$13.7 billion in petroleum subsidies, the government was able to redirect roughly US$3 billion—half to the federal government and half to the states—to strengthen social safety nets, including helping fund the president’s Saving One Million Lives program.
Imposing a special levy on corporations. In 1999, Zimbabwe introduced a special 3-percent tax on the formal-sector employers and workers to fund AIDS prevention and treatment. Zimbabwe’s HIV/AIDS prevalence fell from 29 percent in 1998 to 13 percent in 2012, and the number of Zimbabweans on antiretroviral treatment for HIV/AIDS has risen from 8,000 in 2004 to 500,000 in 2012.
Require community member insurance contribution. In Rwanda, a community-based insurance system launched in 1999 requires individuals to contribute US$5 a year. Similarly, in Uganda, where people regularly pay to visit traditional healers, the government decided its population could afford to share health care costs. Requiring patient payment has sparked a business-like approach to service delivery—villagers may have to walk farther to a clinic and pay for services, but in return, the government will ensure that health care center is staffed with qualified professionals and stocked with supplies.
#3 Access to health services in poor and underserved areas
Underlying much of the Forum discussion was an impetus to find effective ways to deliver health services to poor and vulnerable people. Successful examples
Panel on Sustainable Institutions for Health. L to R: Miatta Kargbo, Minister of Health and Sanitation, Sierra Leone; Chris Mulenga, Deputy Minister of Health, Zambia; Christian Onyebuchi Chukwu, Minister of Health, Nigeria; Awa M. Coll-Seck, Minister of Health, Senegal (chair); Raymonde Coffie Goudou, Minister of Health and Sanitation, Cote d’Ivoire; Douglas Mombeshora, Deputy Minister of Health and Child Welfare, Zimbabwe.
AFRICA HEALTH FORUM 2013: FINANCE AND CAPACITY FOR RESULTS4

included training and deployment of health extension workers, incentives to improve availability of skilled workers in underserved areas, use of results-based financing to deliver life-saving services for women and children more effectively, and investments in primary health care.
Major themes discussed included:
• Out-of-pocket costs paid by poor people in rural areas may pose a barrier to accessing primary health care.
• Recruiting health care professionals at the district level can help ensure staff retention at local health clinics. Other incentives such as remote allowances should be considered.
• Leveraging alternative ways of providing services to the poorest by striving for a mix among government, nongovernmental organizations, and the private sector.
• Training mid-level health care professionals on procedures that can be performed in rural locations.
While concluding the Forum, World Bank President Jim Yong Kim highlighted the role of community health workers, both to employ people from among the poorest groups and increase their consumptive capacity, and to deliver better outcomes.
Deploying health extension workers to rural areas. More than 35,000 trained health extension workers in Ethiopia are helping families fight malnutrition and disease. This network is one of the country’s greatest assets as it ramps up health care. These workers conduct checkups of pregnant women in their homes, for example, helping increase the number of women receiving antenatal care. Other outcomes include improvements in child immunization rates and a drop in malaria cases. Child mortality has dropped by nearly a third in seven years, from 123 per 1,000 live births in 2005 to 88 in 2011. Many development partners are supporting Ethiopia to strengthen its health system further and ramp up life-saving health services, with a renewed focus on results. The World Bank’s new Health MDGs Program-for-Results credit to Ethiopia, approved in February 2013, links disbursement with the achievement of specific health-related results over the next four years.
According to Dr. Uzziel Ndagijimana, Permanent Secretary in Rwanda’s Ministry of Health, universal health coverage has two aspects: geographical coverage
and financial accessibility. Roughly 45,000 village-level workers are trained in malaria, pneumonia, and family planning including the administration of injectables and these workers provide basic health services in communities.
Abolish user fees for primary health care. In Zimbabwe, a World Bank-funded pilot study, which started July 2011 in 18 of 62 districts, abolished user fees for mothers and children under age 5 and helped ensure access in the rural district councils and district hospitals. The results are positive. More mothers are delivering in clinics and attending antenatal care services. And more children are accessing services like vaccinations.
In Zambia, high maternal mortality rates remain a challenge. Only roughly 47 percent of births are attended by a skilled health worker at a facility; the majority are home deliveries. Rural communities have limited access to health care: only half are within 5 kilometers of a health facility.3 To help encourage women to seek prenatal and childbirth medical attention, the government in 2006 abolished user fees for rural primary health care based on evidence that cost can deter women from seeking professional health services. Results are to be determined.
3 www.unicef.org/zambia/5109_8457.html.
Ambassador Eric Goosby, Head, U.S. State Department Office of Global Health Diplomacy and United States Global HIV/AIDS Coordinator, with Simon Bland, Chair of the Global Fund Board (left), and Ambassador Leslie Rowe, Deputy Special Representative, US State Department Office of Global Health Diplomacy.
SUMMARY REPORT 5

Mickey Chopra, UNICEF’s chief of health and associate director of programs noted that to get to the point where the probability of a child dying or a mother dying in childbirth is the same in Ethiopia or Niger as it is in Europe, more focus is needed on reaching families, villages, and women who are not being reached at the moment. He emphasized that it is more cost-effective now to focus on the poor and the unreached than it has ever been before. The tradeoff between equity and efficiency is no longer a tradeoff, he noted.
#4 Using evidence to influence policies Scientific knowledge of what works in health care continues to grow. Investing for impact requires evidence-based health and resource allocation policies. Moreover, rigorous evaluations must accompany implementation. Effective and ongoing monitoring and evaluation should inform management decisions. And continuous performance measurement is critical to ensuring impact.
Examples include:
• Using findings from rigorous impact evaluation of results-based financing pilots, adjusting the program as necessary based on findings, and if proved effective expanding nationally.
• Prioritizing funding for high-impact interventions to achieve better outcomes in health, nutrition, and population.
The World Bank helps generate data and evidence to feed into health policymaking. Core diagnostics include public expenditure reviews in health development, service delivery indicators, poverty assessments, and country health status reports.
Training Nigeria’s lower-level health workers to administer critical drugs. In Nigeria, where the primary cause of maternal mortality is hemorrhaging, studies conducted with development partners showed that a lifesaving drug could be administered by health care workers at a lower skill level. Misoprostol, the drug used to treat hemorrhaging, is now on Nigeria’s essential drug list as an intervention for pregnancy and childbirth complications. Prof. Onyebuchi Chukwu, Nigeria’s Minister of Health highlighted the need for good data despite the expense involved in producing it.
Dr. Addis Tamire Woldemariam, Director General at the Ethiopia’s ministry of health, commented on the importance of building the evidence base for gauging and tracking performance, with information flowing both ways in the system to enhance efficiency and promote transparency and accountability.
#5 Capacity building for medical staff, managers, and administratorsHuman resource capacity is very important in the health sector. Forum participants identified three areas of need: medical professionals, health managers and administrators, and low- and mid-level health care workers.
Most African countries need to continue building skills of medical providers, especially those who serve the most vulnerable. Representatives from Botswana and Republic of Congo expressed concern that infrastructure is more advanced than skills in many African countries.
While much human resource development in health has focused on training medical professionals, a major new theme identified at the Forum is the need for stronger investments in skills for managing health systems. Countries want to strengthen coordinated planning, build management information systems, improve monitoring and evaluation systems, and develop a culture of data for decision making.
Health Ministries must know how to invest for impact, coordinate funding streams, and advocate for more domestic funding. Country representatives at the Forum asked partners to provide practical support and to help build capacity in planning, financing, managing, and evaluating country-level health programs. In addition, external development partners were asked to continue facilitating dialogue between finance and health ministries, particularly about ensuring accountability, maximizing investment impact, and improving service delivery.
Every level of health manager—from top to bottom—must know how to collect, analyze, and use data for planning, accountability, and impact investment. Miatta B. Kargbo, Sierra Leone’s Minister of Health and Sanitation noted the importance of involving and partnering with local governments, instead of pushing implementation strategies down to them.
AFRICA HEALTH FORUM 2013: FINANCE AND CAPACITY FOR RESULTS6

In Côte d’Ivoire, health ministry officials noted that patients admitted to hospital for an unrelated condition frequently contracted malaria during their stay, despite the availability of insecticide-treated bed nets. Coffie Goudou, Côte d’Ivoire’s Minister of Health said that all kinds of problems were seen when it came to sanitation and hygiene, including mosquito larvae in pools of water. Government officials engaged partners in implementing training among medical personnel about improving the environment through steps such as eliminating stagnant water.
In Zambia, under relatively new government leadership, the Ministry of Health was realigned into two sectors—primary and tertiary health care—to allow for focused improvement in both areas. For the latter, the minister of health decided to create more teaching facilities and hospitals to improve Zambia’s ability to deliver specialized health care. Since independence, Zambia had only the one teaching hospital. Zambia’s Deputy Minister of Health, Christopher Mulenga said that the country had come up with a program to create about 12 teaching hospitals by 2015.
#6 Mutual accountability and donor coordination Government officials and donors both emphasized the importance of country-driven leadership and partner coordination to achieve sustainable results and systems. They also highlighted mutual accountability in fostering overall health system development rather than operating parallel programs.
External partners recognize that juggling multiple funders creates transaction costs for the host national government. Downstream coordination of implementation can also yield efficiencies such as encouraging rational geographic distribution of service delivery and assistance in country and ensuring that funding gets to the front line.
A key message throughout the Forum was the importance of accountability and shared responsibility. Effective dialogue can catalyze a country’s transition from development assistance to a partnership of mutual accountability and coordinated approach, resulting in sustainable impact. Social accountability for health services is also important.
World Bank Group President Jim Yong Kim said to Ministers that they had every right to demand that the
multilateral donor community stopped coming at them in a fragmented way.
Miatta B. Kargbo, Sierra Leone’s Minister of Health and Sanitation said that since inheriting a dysfunctional system after the civil war ended in 2002, the focus now is on equity, efficiency, accountability, and sustainability. Progress is evident in three areas:
• A coordination mechanism has been established, which includes donors as well as nongovernmental organizations.
• Funders are pooling their resources to facilitate the channeling mechanism.
• Planning and budgeting cycles are aligned and involve communities based on resource mapping.
In addition, results-based financing is being piloted, enhancing the efficiency of management and service delivery. Sierra Leone convenes everyone, including civil society, for an annual review forum to review progress and analyze resource allocation.
Forum panelists delineated a three-pronged approach to ensuring accountability includes assessing and managing:
• What strengths, resources, and ideas partners bring as input.
• How those inputs are channeled.
• How they are used.
Kiyoshi Kodera, Vice President, JICA with Margaret Chan, Director General, WHO.
SUMMARY REPORT 7

Coordination of donor funding also includes three key steps:
• Identify priorities.
• Channel funds accordingly.
• Coordinate implementation.
Makhtar Diop, World Bank Vice President for Africa, cited the Global Fund to Fight AIDS, Tuberculosis and Malaria’s willingness to help Tanzania in 2009 when the government fell short of funds to pay health personnel. The Global Fund subsidized the salaries that year, based on this government-identified priority. He said that all donors should be able to identify such binding constraints and pool their resources in helping countries to address issues in a timely way.
Each country also should conduct an annual review, convening representatives from the donor community,
ministries, and civil society to review programmatic and financial reports. With all parties at the table, government officials can lead a discussion about priorities and resources.
An Ethiopia forum participant, Dr. Addis Tamire Woldemariam, Director General for the Ministry of Health, said that duplication of effort and resources in African countries has been a problem. He said that countries should somehow advocate the one-plan, one-budget, one-report strategy to use their resources more efficiently in resource-constrained settings in Africa.
Wrap-up and next steps
The global health community needs to make services available, acceptable, accessible, and equitable. Countries need to establish roadmaps to achieve these goals. To achieve this vision, more effective and sustainable institutions are essential. Countries and donors should work together to improve local institutions and networks of institutions.
The Forum provided a venue for ministries of finance and health to bring new thinking to the table and exchange innovative ideas. Some development partners are considering a funding facility to help with this critical task. While no single solution exists, the Forum discussions yielded several concrete actionable items as noted in the key messages.
In his closing remarks, World Bank Group President Jim Yong Kim noted that as the bottom 40 percent of people participate in economic growth, the healthy populations that result will drive the economic growth
of the future.
World Bank Group President Jim Yong Kim concludes the Forum with Vice President for Africa Makhtar Diop.
AFRICA HEALTH FORUM 2013: FINANCE AND CAPACITY FOR RESULTS8

SUMMARY REPORT 9
ANNEXES

HEALTH MILLENNIUM DEVELOPMENT GOALS STATUS IN SUB-SAHARAN AFRICA
Goals Status in Sub-Saharan Africa
MDG 1C: Halve the proportion of people who suffer from hunger.
Many countries are producing a new generation locked in low-productive capacities due to malnutrition’s effects on children’s physical and cognitive development. While stunting in children under age 5 fell from 1990 to 2011 globally, the estimated number of stunted African children rose from 46 million to 56 million in that period.1 Countries affected by stunting and other forms of malnutrition lose at least 2–3 percent of gross domestic product, billions of dollars in waged employment and avoidable health care spending.
MDG 4: Reduce child mortality. Declines in fertility improve an infant’s chances at survival. While the total fertility rate in low- and middle-income countries is now below 3 children per woman, in Sub-Saharan Africa the fertility rate is 5.1 children per woman and the UN recently increased by more than 5 percent the estimated average number of children per woman in 15 high-fertility Sub-Saharan countries.2 The annual rate of decline in child deaths in Sub-Saharan Africa has risen. From 1990 to 2000, the number fell just 13.5 percent, but the next 11 years saw a 29.2 percent drop.3 Yet the region’s under-five mortality rate (109 deaths per 1,000 live births in 2011) remains the world’s highest by far.4
MDG 5: Improve maternal health.
Lack of access to skilled routine and emergency care is blamed for most pregnancy- and childbirth-related deaths. One in 39 women in Sub-Saharan Africa dies of such causes.5 The region’s 162,000 maternal deaths in 2010 accounted for 56 percent of the global tally. While this figure represented a 41-percent decline since 1990, the maternal mortality ratio fell only 2.7 percent on average between 1990 and 2010.
MDG 6A and 6B: Halt and begin reversing the spread of HIV/AIDS by 2015. Achieve universal access to treatment for HIV/AIDS for all those who need it by 2010.
The number of people in Africa receiving antiretroviral treatment increased from fewer than 1 million in 2005 to 7.1 million in 2012, with nearly 1 million added in the last year alone. AIDS-related deaths are also continuing to fall¾dropping by 32 percent from 2005 to 2011¾as are the numbers of new HIV infections, which fell 33 percent from 2001 to 2011. Yet Africa remains more affected by HIV than any other region, accounting for 69 percent of people living with HIV. In 2011, new HIV infections in Africa totaled 1.8 million, and 1.2 million died of AIDS-related illnesses.6
MDG 6C: Have halted by 2015 and begun to reverse the incidence of malaria and other major diseases.
Since 2005, deaths from malaria have fallen from more than 1 million to about 600,000, mostly in Africa. Malaria mortality in Africa has fallen 33 percent since 2000, yet one African child dies every minute from malaria.7
1 www.who.int/topics/millennium_development_goals/hunger/en/index.html.2 www.un.org/apps/news/story.asp?NewsID=45165.3 Committing to Child Survival: A Promised Renewed, Progress Report 2012, UNICEF, September 2012, page 42, http://apromiserenewed.org/files/APR_Progress_
Report_2012_final_web3.pdf.4 Ibid.5 www.who.int/topics/millennium_development_goals/maternal_health/en/index.html.6 Update, Joint United Nations Programme on HIV/AIDS (UNAIDS), May 2013, www.unaids.org/en/media/unaids/contentassets/documents/
unaidspublication/2013/20130521_Update_Africa.pdf.7 www.who.int/mediacentre/factsheets/fs094/en/.
AFRICA HEALTH FORUM 2013: FINANCE AND CAPACITY FOR RESULTS10

BACKGROUND BRIEFS
SUMMARY REPORT 11

AFRICA HEALTH FORUM 2013: FINANCE AND CAPACITY FOR RESULTS12

Investing in people, especially in their health, is not something that typically requires justification. What has received considerable attention, however, is the question of whether investing in wealth generation leads to good health and nutrition outcomes, or whether investing in people’s health is a critical element in creating societal wealth. This is a timely and relevant question for Africa. Many African countries are growing economically, in large part due to expansion in extractive industries and high global prices for raw materials, yet investment in health and nutrition has lagged behind. This has resulted in stubbornly high levels of maternal mortality and malnutrition across the continent, and high fertility in many countries.
This note summarizes the key headlines on this issue. The emerging picture is of a possible virtuous cycle of health feeding into wealth, which then feeds into health, but the evidence appears to be much stronger, especially in Africa, on the ‘Health-producing-Wealth’ side of the equation. The evidence is presented in three sections. The first section takes advantage of Africa’s heterogeneous wealth generation to better understand the impact of wealth on health. The second section looks at East Asia, a region that has done
well on both health and wealth and draws lessons for which came first. The last section summarizes the relevant econometric evidence from the work of the Growth Commission and the findings of the Copenhagen Consensus to identify which health and nutrition investments have an impact on productivity and economic development.
Wasted Wealth in africa?A recent analysis of the Middle Income Country profiles in Africa showed surprising findings: Better-off countries, especially those driven by mineral wealth, appear not to be doing well on human development measures, especially health. If the Wealth-producing-
Health side of the virtuous cycle is strong, we would expect to see a clear relationship in African countries between per capita income and measures of health and nutrition outcomes. Figures 1, 2 and 3 show that: (i) while the relationship between health and wealth is stable for countries outside Sub-Saharan Africa (SSA), it is not so for SSA countries; (ii) SSA countries as a group are performing badly on health relative to wealth when compared to other countries; (iii) Higher-income SSA countries are performing worse than countries in the rest of the world with similar incomes; and (iv) Oil-rich SSA countries are doing badly on health, nutrition, and educational attainment. The takeaway message here is that wealth has not produced health in most better-off SSA countries.
This brief is a product of the staff of the International Bank for Reconstruction and Development/The World Bank, prepared ahead of Africa Health Forum 2013: Finance and Capacity for Results, an event co-hosted by the World Bank and the U.S. State Department Office of Global Health Diplomacy, in collaboration with Harmonization for Health in Africa. The findings, interpretations, and conclusions expressed in this brief do not necessarily reflect the views of the Executive Directors of the World Bank or the governments they represent, or of any of the hosting entities and partners.
references
Health and growth / edited by Michael Spence and Maureen Lewis, Washington, D.C. World Bank, c2009. , ISBN 9780821376591
Copenhagen Consensus - http://thousanddays.org/wp-content/uploads/2013/03/Copenhagen-Consensus-RESULTS.pdf
Wagstaff et al. 2009 – Reforming China’s Rural Health System, Washington, D.C. World Bank
Wage earners, who had benefitted from deworming when in school, worked on average 5.2 more hours per week and were more likely to have better-paid jobs. Men were three times more likely to be employed in manufacturing, and women more likely to be in wage labor than casual labor. Average adult earnings rose more than 20 percent, almost identical to the increase seen when poor populations were dewormed in the southern USA. When increased hours of labor are viewed as a gain in endowment, the estimated social financial rate of return is about 65 percent a year.
For many countries in Africa, increasing agricultural productivity is essential to reduce poverty, since the agricultural sector typically has the highest poverty rate (often around two-thirds) of any occupational group. But areas with high potential for agricultural growth thanks to good rainfall, proximity to water sources, or with agricultural investments (irrigation) are also likely to be risk areas for mosquito-borne diseases. Disease prevention and treatment efforts are therefore important. Estimates from Chad, Congo and Rwanda suggest that with each malaria episode, a worker loses between US$8 and US$18 in productivity, rising to US$31 in
Ethiopia when medical costs are included. In Nigeria, where 51 percent of people report a malaria episode, malaria testing and treatment increases the labor supply and productivity of sugar cane workers, and accounts for a 26 percentage point increase in earnings. Similarly, successful control of riverblindness in Africa has freed more than 25 million hectares of arable land from the risk of disease, enough to feed some 17 million people.
The micro-economic evidence on returns to investments in health and nutrition has prompted the Copenhagen Consensus to summarize the global best-buys and to rank these investments as highly cost effective. A May 2012 press release by the group stated that:
“The single most important investment, according to the panel, would step up the fight against malnutrition…Likewise, just $300 million would prevent 300,000 child deaths if it were used to strengthen the Global Fund’s Affordable Medicines Facility-malaria financing mechanism, which makes combination therapies cheaper for poor countries. Put in economic terms, the benefits are 35 times higher than the costs – even without taking into account that it safeguards our most effective malaria drug from future drug resistance.”
Questions to MinistersThere is strong evidence that investments in health and nutrition are not only good for people’s health but also for economic development. Given that economic growth alone, especially when driven by extractive industries, does not appear to have a positive impact on population health:
n What would it take to increase investments in cost effective and productivity-enhancing interventions in nutrition, maternal and child health, and disease management?
n How do we ensure that any increases in allocations to health produce the expected results?
Health or Wealth: Which Comes First?
Key Messages1. African countries that are experiencing strong economic growth
from mineral revenues have not translated this wealth into improved health and nutrition for all.
2. Data from the East Asian tigers that have achieved both health and wealth show that health and nutrition improvements actually came before economic take-off.
3. There is strong microeconomic evidence in Africa and elsewhere that investing in the health and nutrition of young children has proven payoffs in terms of productivity and family wealth as well as human capital in these countries.
2013
SUMMARY REPORT 13

AfricA HeAltH forum 2013 finAnce And cApAcity for results 2 3
What about Micro evidence?The Growth Commission recently brought together strong evidence on the drivers of economic growth. Of course, there were no simple answers and the data did not point to a single global solution for improving economic growth. However, there was strong empirical evidence in Africa linking investments in health and nutrition to improved productivity and economic development.
Some interventions are particularly relevant to Africa because they target the obstacles that poor people face when trying to increase their earning potential. Most malnutrition in Africa, Asia or Latin America happens in the first 1,000 days of a child’s life, from conception to age two, with serious long-term consequences. Investments to improve nutritional outcomes,
such as distributing vitamin and mineral supplements and promoting exclusive breast-feeding, are therefore most cost-effective during these early years. These investments have very high economic rates of return, and can lock in human capital for future economic growth. In Guatemala, boys exposed to an early childhood nutrition program before age three earned 46 percent more thirty years later.
Similarly, in slum and rural areas of Africa with limited sanitation, worm infection is a common constraint on poor children’s development. In Kenya, deworming schoolchildren was the most cost-effective way of reducing absenteeism, gaining the equivalent of an additional year of schooling for only US $3.50 per child.
Figure 1: Per Capita Income and Under-5 Mortality (2010)
Figure 2: Per Capita Income and Life Expectancy (2010)
Figure 3: Per Capita Income and Malnutrition (2010)
Figure 5: Nutrition interventions in the earliest years (first 1,000 days) produce the greatest returns to investment
Figure 4: Trends in East Asia What caMe first in east asia?East Asia has been the model region for success in improving both health and nutrition as well as increasing per capita income. Trends in some East Asian countries help clarify which sides of the virtuous cycle have stronger evidence.
The four charts opposite (for China, Malaysia, South Korea, and Thailand) unambiguously show that improvements in health (infant mortality in the red squares) came before the strong uptake in the economy (GNP per capita in the yellow line). South Korea and China show the most dramatic drops in mortality (or improvements in life expectancy), long before the economic uptake, but all four countries clearly show the importance of addressing health first.
A detailed analysis of the China data (Wagstaff et al. 2009) confirms these basic findings showing that reductions in child mortality were strongest in China between 1960 and 1980 (before the economic liberalization and rapid economic growth). Similarly, China showed the greatest improvements in stunting rates long before the economic boom.
0
500
1000
1500
2000
infa
nt m
orta
lity/
1000
live b
irths
GNP per capita
2500
0
1000
2000
3000
4000
5000
6000
020004000600080001000012000140001600018000
0
500
1000
1500
2000
2500
3000
0
10
20
30
40
50
60
70
80
90
0
10
20
30
40
50
60
70
0
20
40
60
80
100
120
0
20
40
60
80
100
120
1960
1968
1976
1984
1992
2000
2008
1960
1968
1976
1984
1996
2000
2008
1960
1968
1976
1984
1996
2000
2008
1960
1967
1981
1988
1995
2002
2009
THAILAND
CHINA
MALAYSIA
SOUTH KOREA
Unde
r-5 m
orta
lity r
ate (
per 1
000
live b
irths
)Figure 1: Per Capita Income and Under-5 Mortality (2010)
0 50
10
0 15
0 20
00
10
20
30
4050
60
70
80
6 7 8 9 10 11
6 7 8 9 10 11
4 6 8 10 12
GNI Per Capita PPP (log)
Life
Expe
ctan
cy at
Birt
hM
alnu
tritio
n-w
eigh
t for
age (
% o
f chi
ldre
n un
der 5
)
Figure 2: Per Capita Income and Life Expectancy (2010)
Figure 3: Per Capita Income and Malnutrition (2010)
GNI Per Capita PPP (log)
GNI Per Capita PPP (log)
Non-SSA SSA non-resourceSSA resource non-oil SSA resource oil
Non-SSA SSA non-resourceSSA resource non-oil SSA resource oil
Non-SSA SSA non-resourceSSA resource non-oil SSA resource oil
Chad
Equatorial Guinea
NigeriaCameroon
Congo, Rep.Sudan
Gabon
Angola
Cote d'Ivoire
MaliCongo, Dem. Rep.
Guinea
MauritaniaMozambiqueZambia
Ghana
Namibia
Botswana
Angola
Angola
Equatorial GuineaNigeria
Nigeria
Cameroon
Cameroon
Cote d'Ivoire
Cote d'Ivoire
Congo, Rep.
Congo, Rep.
Sudan
Sudan
Gabon
Mali
Mali
Congo, Dem. Rep.
Congo, Dem. Rep.
Guinea
Guinea
Mauritania
Mauritania
Mozambique
Mozambique
Zambia
Zambia
Ghana
Ghana
Namibia
Namibia
Botswana
Botswana
Chad
Unde
r-5 m
orta
lity r
ate (
per 1
000
live b
irths
)
Figure 1: Per Capita Income and Under-5 Mortality (2010)
0 50
10
0 15
0 20
00
10
20
30
4050
60
70
80
6 7 8 9 10 11
6 7 8 9 10 11
4 6 8 10 12
GNI Per Capita PPP (log)
Life
Expe
ctan
cy at
Birt
hM
alnu
tritio
n-w
eigh
t for
age (
% o
f chi
ldre
n un
der 5
)
Figure 2: Per Capita Income and Life Expectancy (2010)
Figure 3: Per Capita Income and Malnutrition (2010)
GNI Per Capita PPP (log)
GNI Per Capita PPP (log)
Non-SSA SSA non-resourceSSA resource non-oil SSA resource oil
Non-SSA SSA non-resourceSSA resource non-oil SSA resource oil
Non-SSA SSA non-resourceSSA resource non-oil SSA resource oil
Chad
Equatorial Guinea
NigeriaCameroon
Congo, Rep.Sudan
Gabon
Angola
Cote d'Ivoire
MaliCongo, Dem. Rep.
Guinea
MauritaniaMozambiqueZambia
Ghana
Namibia
Botswana
Angola
Angola
Equatorial GuineaNigeria
Nigeria
Cameroon
Cameroon
Cote d'Ivoire
Cote d'Ivoire
Congo, Rep.
Congo, Rep.
Sudan
Sudan
Gabon
Mali
Mali
Congo, Dem. Rep.
Congo, Dem. Rep.
Guinea
Guinea
Mauritania
Mauritania
Mozambique
Mozambique
Zambia
Zambia
Ghana
Ghana
Namibia
Namibia
Botswana
Botswana
Chad
Rate
of re
turn
to in
vest
men
t in
hum
an ca
pita
l
Age
Programs targeted towards the earliest years
Preschool programs
Schooling
School4-5Preschool
0-3 Post-school
Job training
AFRICA HEALTH FORUM 2013: FINANCE AND CAPACITY FOR RESULTS14

AfricA HeAltH forum 2013 finAnce And cApAcity for results 2 3
What about Micro evidence?The Growth Commission recently brought together strong evidence on the drivers of economic growth. Of course, there were no simple answers and the data did not point to a single global solution for improving economic growth. However, there was strong empirical evidence in Africa linking investments in health and nutrition to improved productivity and economic development.
Some interventions are particularly relevant to Africa because they target the obstacles that poor people face when trying to increase their earning potential. Most malnutrition in Africa, Asia or Latin America happens in the first 1,000 days of a child’s life, from conception to age two, with serious long-term consequences. Investments to improve nutritional outcomes,
such as distributing vitamin and mineral supplements and promoting exclusive breast-feeding, are therefore most cost-effective during these early years. These investments have very high economic rates of return, and can lock in human capital for future economic growth. In Guatemala, boys exposed to an early childhood nutrition program before age three earned 46 percent more thirty years later.
Similarly, in slum and rural areas of Africa with limited sanitation, worm infection is a common constraint on poor children’s development. In Kenya, deworming schoolchildren was the most cost-effective way of reducing absenteeism, gaining the equivalent of an additional year of schooling for only US $3.50 per child.
Figure 1: Per Capita Income and Under-5 Mortality (2010)
Figure 2: Per Capita Income and Life Expectancy (2010)
Figure 3: Per Capita Income and Malnutrition (2010)
Figure 5: Nutrition interventions in the earliest years (first 1,000 days) produce the greatest returns to investment
Figure 4: Trends in East Asia What caMe first in east asia?East Asia has been the model region for success in improving both health and nutrition as well as increasing per capita income. Trends in some East Asian countries help clarify which sides of the virtuous cycle have stronger evidence.
The four charts opposite (for China, Malaysia, South Korea, and Thailand) unambiguously show that improvements in health (infant mortality in the red squares) came before the strong uptake in the economy (GNP per capita in the yellow line). South Korea and China show the most dramatic drops in mortality (or improvements in life expectancy), long before the economic uptake, but all four countries clearly show the importance of addressing health first.
A detailed analysis of the China data (Wagstaff et al. 2009) confirms these basic findings showing that reductions in child mortality were strongest in China between 1960 and 1980 (before the economic liberalization and rapid economic growth). Similarly, China showed the greatest improvements in stunting rates long before the economic boom.
0
500
1000
1500
2000
infa
nt m
orta
lity/
1000
live b
irths
GNP per capita
2500
0
1000
2000
3000
4000
5000
6000
020004000600080001000012000140001600018000
0
500
1000
1500
2000
2500
3000
0
10
20
30
40
50
60
70
80
90
0
10
20
30
40
50
60
70
0
20
40
60
80
100
120
0
20
40
60
80
100
120
1960
1968
1976
1984
1992
2000
2008
1960
1968
1976
1984
1996
2000
2008
1960
1968
1976
1984
1996
2000
2008
1960
1967
1981
1988
1995
2002
2009
THAILAND
CHINA
MALAYSIA
SOUTH KOREA
Unde
r-5 m
orta
lity r
ate (
per 1
000
live b
irths
)
Figure 1: Per Capita Income and Under-5 Mortality (2010)
0 50
10
0 15
0 20
00
10
20
30
4050
60
70
80
6 7 8 9 10 11
6 7 8 9 10 11
4 6 8 10 12
GNI Per Capita PPP (log)
Life
Expe
ctan
cy at
Birt
hM
alnu
tritio
n-w
eigh
t for
age (
% o
f chi
ldre
n un
der 5
)
Figure 2: Per Capita Income and Life Expectancy (2010)
Figure 3: Per Capita Income and Malnutrition (2010)
GNI Per Capita PPP (log)
GNI Per Capita PPP (log)
Non-SSA SSA non-resourceSSA resource non-oil SSA resource oil
Non-SSA SSA non-resourceSSA resource non-oil SSA resource oil
Non-SSA SSA non-resourceSSA resource non-oil SSA resource oil
Chad
Equatorial Guinea
NigeriaCameroon
Congo, Rep.Sudan
Gabon
Angola
Cote d'Ivoire
MaliCongo, Dem. Rep.
Guinea
MauritaniaMozambiqueZambia
Ghana
Namibia
Botswana
Angola
Angola
Equatorial GuineaNigeria
Nigeria
Cameroon
Cameroon
Cote d'Ivoire
Cote d'Ivoire
Congo, Rep.
Congo, Rep.
Sudan
Sudan
Gabon
Mali
Mali
Congo, Dem. Rep.
Congo, Dem. Rep.
Guinea
Guinea
Mauritania
Mauritania
Mozambique
Mozambique
Zambia
Zambia
Ghana
Ghana
Namibia
Namibia
Botswana
Botswana
Chad
Rate
of re
turn
to in
vest
men
t in
hum
an ca
pita
l
Age
Programs targeted towards the earliest years
Preschool programs
Schooling
School4-5Preschool
0-3 Post-school
Job training
SUMMARY REPORT 15

Investing in people, especially in their health, is not something that typically requires justification. What has received considerable attention, however, is the question of whether investing in wealth generation leads to good health and nutrition outcomes, or whether investing in people’s health is a critical element in creating societal wealth. This is a timely and relevant question for Africa. Many African countries are growing economically, in large part due to expansion in extractive industries and high global prices for raw materials, yet investment in health and nutrition has lagged behind. This has resulted in stubbornly high levels of maternal mortality and malnutrition across the continent, and high fertility in many countries.
This note summarizes the key headlines on this issue. The emerging picture is of a possible virtuous cycle of health feeding into wealth, which then feeds into health, but the evidence appears to be much stronger, especially in Africa, on the ‘Health-producing-Wealth’ side of the equation. The evidence is presented in three sections. The first section takes advantage of Africa’s heterogeneous wealth generation to better understand the impact of wealth on health. The second section looks at East Asia, a region that has done
well on both health and wealth and draws lessons for which came first. The last section summarizes the relevant econometric evidence from the work of the Growth Commission and the findings of the Copenhagen Consensus to identify which health and nutrition investments have an impact on productivity and economic development.
Wasted Wealth in africa?A recent analysis of the Middle Income Country profiles in Africa showed surprising findings: Better-off countries, especially those driven by mineral wealth, appear not to be doing well on human development measures, especially health. If the Wealth-producing-
Health side of the virtuous cycle is strong, we would expect to see a clear relationship in African countries between per capita income and measures of health and nutrition outcomes. Figures 1, 2 and 3 show that: (i) while the relationship between health and wealth is stable for countries outside Sub-Saharan Africa (SSA), it is not so for SSA countries; (ii) SSA countries as a group are performing badly on health relative to wealth when compared to other countries; (iii) Higher-income SSA countries are performing worse than countries in the rest of the world with similar incomes; and (iv) Oil-rich SSA countries are doing badly on health, nutrition, and educational attainment. The takeaway message here is that wealth has not produced health in most better-off SSA countries.
This brief is a product of the staff of the International Bank for Reconstruction and Development/The World Bank, prepared ahead of Africa Health Forum 2013: Finance and Capacity for Results, an event co-hosted by the World Bank and the U.S. State Department Office of Global Health Diplomacy, in collaboration with Harmonization for Health in Africa. The findings, interpretations, and conclusions expressed in this brief do not necessarily reflect the views of the Executive Directors of the World Bank or the governments they represent, or of any of the hosting entities and partners.
references
Health and growth / edited by Michael Spence and Maureen Lewis, Washington, D.C. World Bank, c2009. , ISBN 9780821376591
Copenhagen Consensus - http://thousanddays.org/wp-content/uploads/2013/03/Copenhagen-Consensus-RESULTS.pdf
Wagstaff et al. 2009 – Reforming China’s Rural Health System, Washington, D.C. World Bank
Wage earners, who had benefitted from deworming when in school, worked on average 5.2 more hours per week and were more likely to have better-paid jobs. Men were three times more likely to be employed in manufacturing, and women more likely to be in wage labor than casual labor. Average adult earnings rose more than 20 percent, almost identical to the increase seen when poor populations were dewormed in the southern USA. When increased hours of labor are viewed as a gain in endowment, the estimated social financial rate of return is about 65 percent a year.
For many countries in Africa, increasing agricultural productivity is essential to reduce poverty, since the agricultural sector typically has the highest poverty rate (often around two-thirds) of any occupational group. But areas with high potential for agricultural growth thanks to good rainfall, proximity to water sources, or with agricultural investments (irrigation) are also likely to be risk areas for mosquito-borne diseases. Disease prevention and treatment efforts are therefore important. Estimates from Chad, Congo and Rwanda suggest that with each malaria episode, a worker loses between US$8 and US$18 in productivity, rising to US$31 in
Ethiopia when medical costs are included. In Nigeria, where 51 percent of people report a malaria episode, malaria testing and treatment increases the labor supply and productivity of sugar cane workers, and accounts for a 26 percentage point increase in earnings. Similarly, successful control of riverblindness in Africa has freed more than 25 million hectares of arable land from the risk of disease, enough to feed some 17 million people.
The micro-economic evidence on returns to investments in health and nutrition has prompted the Copenhagen Consensus to summarize the global best-buys and to rank these investments as highly cost effective. A May 2012 press release by the group stated that:
“The single most important investment, according to the panel, would step up the fight against malnutrition…Likewise, just $300 million would prevent 300,000 child deaths if it were used to strengthen the Global Fund’s Affordable Medicines Facility-malaria financing mechanism, which makes combination therapies cheaper for poor countries. Put in economic terms, the benefits are 35 times higher than the costs – even without taking into account that it safeguards our most effective malaria drug from future drug resistance.”
Questions to MinistersThere is strong evidence that investments in health and nutrition are not only good for people’s health but also for economic development. Given that economic growth alone, especially when driven by extractive industries, does not appear to have a positive impact on population health:
n What would it take to increase investments in cost effective and productivity-enhancing interventions in nutrition, maternal and child health, and disease management?
n How do we ensure that any increases in allocations to health produce the expected results?
Health or Wealth: Which Comes First?
Key Messages1. African countries that are experiencing strong economic growth
from mineral revenues have not translated this wealth into improved health and nutrition for all.
2. Data from the East Asian tigers that have achieved both health and wealth show that health and nutrition improvements actually came before economic take-off.
3. There is strong microeconomic evidence in Africa and elsewhere that investing in the health and nutrition of young children has proven payoffs in terms of productivity and family wealth as well as human capital in these countries.
2013
AFRICA HEALTH FORUM 2013: FINANCE AND CAPACITY FOR RESULTS16

This brief is a product of the staff of the International Bank for Reconstruction and Development/The World Bank, prepared ahead of Africa Health Forum 2013: Finance and Capacity for Results, an event co-hosted by the World Bank and the U.S. State Department Office of Global Health Diplomacy, in collaboration with Harmonization for Health in Africa. The findings, interpretations, and conclusions expressed in this brief do not necessarily reflect the views of the Executive Directors of the World Bank or the governments they represent, or of any of the hosting entities and partners.
Many countries with large endowments of valuable natural resources do not fare better in terms of human development outcomes than less endowed countries, and in fact often do worse.
This paradoxical situation is all too common in a large number of countries in Sub-Saharan Africa today. Many Middle Income Countries (MICs) in the region are doing worse than the average Low Income Country (LIC). In Sub-Saharan Africa, MICs, which are typically rich in natural resources, have greater inequality than LICs and equally undiversified economies. Small resource-rich MICs are doing worse on the 2015 Millennium Development Goals (MDGs) and on human development outcomes (controlling for income levels), and have less developed institutions.
Yet this situation is not inevitable. Some countries across the world have been able to effectively manage natural resources and translate this wealth into sustained economic growth, improved living conditions, and better nutrition, health and education levels for their populations. Many resource-rich
countries in Sub-Saharan Africa could adapt the lessons from these international experiences to their social, political and institutional reality. An important takeaway is that building human capital is critical to promote diversified economic growth, reduce poverty and inequality, and create economic opportunities.
Country ExpEriEnCEs aCross thE World The evidence from countries such as Chile (the largest copper producer in the world), Botswana
(rich in diamonds) and Malaysia and Norway (blessed with oil), highlights the strong link between inclusive political and economic institutions and development. In these countries, institutions are anchored in well-defined and accepted principles that govern the conduct, relationship, and interaction among individuals and groups within society. As a result, governments tend to be run in accordance with the rule of law, protecting and empowering citizens to be politically and economically active, and helping those in need.
n What needs to be done to strengthen capacity to manage the technical aspects of natural resource management? For example, establishing a small cadre of well-trained technical specialists able to deal with the challenges of managing natural resources at each level from exploration to exploitation.
n What needs to be done to enhance countries’ ability to transparently account for funding allocated for social development? For example, adopting/adapting policy/institutional mechanisms, such as program budgeting, budget execution controls, and performance management, to help guide funding decisions in sectoral ministries, controlling expenditures and assessing results achieved.
n How could countries share experiences in natural resource management, successful or otherwise, to better inform policies that promote longer-term goals such as the MDGs and the post-2015 agenda?
n What can be done to help to diffuse and develop capacity in countries to adopt good practices such as those of the Extractive Industries Transparency Initiative?
QuEstions to MinistErs
MorE on thE topiC
Arellano, J-P. 2012. Copper Mining and its impact on Chile development. Nº35 // Volume 16 // July-December 2012 @journal.
Bitran, R., Escobar, L., and Gassibe, P. 2010. “After Chile’s Health Reform: Increase In Coverage And Access, Decline In Hospitalization And Death Rates,” Health Affairs, vol. 29, No. 12, pp. 2161-2170.
Hong Teck Chua, H.T., and Cheah, J. H. C. 2011. “Financing Universal Coverage in Malaysia: a case study.” BMC Public Health 2012, 12(Suppl 1):S7. http://www.biomedcentral.com/1471-2458/12/S1/S7
IMF. 2007. Guide on Resource Revenue Transparency. Washington DC: IMF .
Lange, G-M., and M. Wright. 2004. “Sustainable development in mineral economies: the example of Botswana,” Environment and Development Economics, vol. 9, No. 4, pp. 485–505.
Marquez, P. 2013. “Institutions and Systems Matter for Health and Social Development.” http://blogs.worldbank.org/health/institutions-and-systems-matter-for-health-and-social-development
Marquez, P. 2012. “Ethics, Values and Health Systems.” http://blogs.worldbank.org/health/ethics-values-and-health-systems
Pineda, J. and F. Rodriguez. 2010. “Curse or blessing? Natural resources and human development,” Human Development Research Paper 2010/04. New York: UNDP.
Tenth Malaysia Plan 2011-2015. Speech by the Prime Minister in the Dewan Rakyat on June 10, 2010.
UNDP. 2011. Managing Natural Resources for Human Development in Low-Income Countries. WP 2011-002. UNDP Regional Bureau for Africa.
World Bank. 2006. Where is the Wealth of Nations - Measuring Capital for the 21st Century. Washington D.C: World Bank.
on norWay oil Fund
General website: http://www.regjeringen.no/en/dep/fin/Selected-topics/the-government-pension-fund/government-pension-fund-global-gpfg.html?id=697027
Brief history and rationale: http://www.regjeringen.no/pages/7772/FactSheet_year-end2011.pdf
How the fund is managed: http://www.regjeringen.no/en/dep/fin/Documents-and-publications/propositions-and-reports/Reports-to-the-Storting/2011-2012/meld-st-17-20112012-2.html?id=680515
How to Translate Mineral Wealth into Health and Social Development
KEy MEssagEsn African countries with rich endowments of natural resources largely
do not have good human development outcomes. However, this situation is not inevitable and much can be done to build human capital in resource-rich countries.
n Chile, Botswana, Malaysia and Norway offer valuable experiences that resource-rich African countries can adapt to their own contexts. Inclusive political and economic institutions are a common factor that has influenced development in these four countries.
n Natural resource wealth management should consider both the long-term requirements for economic growth when these revenues dwindle, as well as the immediate need to cut poverty, reduce inequality, and build human capital as a key contributing factor to diversified growth over the medium and longer term.
2013
SUMMARY REPORT 17

for human development, applies in countries with younger populations that need to be more healthy and productive.
n Botswana has effectively controlled the spread of HIV/AIDS by rolling out prevention interventions, increasing access to voluntary testing and counseling services, and providing treatment to more than 90 percent of people who need it. Between 2001 and 2011, the rate of new HIV infections in Botswana dropped by 73 percent, and the number of people dying from AIDS-related causes declined by 71 percent over 2005-2011 because of scaled-up treatment efforts and the steady decline in HIV incidence. Unlike in other countries, Botswana’s national HIV/AIDS response has been funded primarily by public revenue.
n Chile’s well-defined and implemented programs in health, education and social protection have proved powerful assets to reduce poverty and inequality while promoting social cohesion and stability. Chile has successfully used revenues from soaring copper prices (see Figure 2) for human development through a large social development fund. Moreover, Chile’s experience shows how governments become more accountable to citizens when poverty falls and people take greater interest in how the government uses natural resource revenues for the benefit of the whole population.
In the health sector, Chile adopted a Regime of Explicit
Health Guarantees in 2005, mandating coverage by public and private health insurers of a comprehensive benefit package. This has considerably increased access to health services and improved early detection and treatment of chronic conditions. It has further contributed to the country’s very high human development level (Chile ranks 44 out of 187 countries with comparable data).
What are the Lessons? Overall, the combination of sound economic policies, strong institutions and a commitment to social development in these countries has helped reduce poverty and build the human capital needed to sustain economic growth, modernize institutions and systems, enhance job opportunities, and raise living standards.
These country experiences are highly relevant and applicable to other countries, particularly those African MICs that have been enjoying a mineral boom and rapid economic growth over the past decade but continue to have high levels of poverty and inequality and low human development indicators (often far from meeting
key MDG targets such as reducing maternal mortality by 75 percent between 1990 and 2015). The key lesson from Botswana, Chile, Malaysia and Norway is that natural resources management in developing countries should consider both requirements for long-term investment in the context of less abundant capital, as well as the urgent need to cut poverty and expand education, health, and social protection. In the health sector, it is clear from these country experiences that how a health system is structured reflects decisions on what kind of society a country wants to have. It is broad social goals that will ultimately guide policy and institutional decisions concerning the most appropriate and contextually relevant organizational forms, health care financing arrangements, and service delivery mechanisms that could be adopted to attain the intermediate goals of a health system (improved access, quality, efficiency, and fairness). These contribute to achieving the ultimate goals of a health system (improved health status, financial protection, and patient satisfaction with health care received).
Economic Policies and Institutional Measures. Chile since the early 1990s is a good example of how mineral wealth can help develop and strengthen institutional and governance arrangements, not only to mobilize additional government revenue through effective taxation policies on mining activity, but more importantly, to manage increased public revenues transparently. Economic and social stabilization funds were established to minimize the negative impact of fluctuations in copper prices on government revenues. In response to a new demographic scenario characterized by an ageing population, a Pension Reserve Fund was set up to guarantee basic solidarity pensions to those who were not able to save enough for their retirement. Investments were made abroad to prevent harmful appreciation of the local currency. And new mechanisms, such as program budgeting, budget execution controls, and performance management, now help guide funding decisions in sectoral
ministries, controlling expenditures and assessing results achieved.
Leveraging Revenues for Investing in Human Capital. Reflecting a desire to be socially and politically inclusive and protect people from the effects of ill health, disability and old age, Malaysia, Norway, Botswana and Chile have all markedly increased their social spending. Over time, this has helped people in these countries gain more equitable access to health, education and social protection.
n Under Malaysia’s 2006-2010 Ninth Development Plan, poverty eradication programs cut poverty from 5.7 percent in 2005 to 3.8 percent in 2009, and education and health conditions were significantly improved (see Figure 1). Recognizing that “health is an important asset in the development of human capital”, and that “a healthy society contributes to a dynamic and productive nation”, the government has further strengthened one of the best health systems in Southeast
Asia by promoting public-private partnerships to improve access to health services, coverage, and quality of care. Using regional WHO comparators, Malaysia fares well in terms of providing universal health care to all citizens, with total health expenditure close to 5 percent of GDP, out-of-pocket payment roughly a third of total health expenditure, comprehensive social safety nets for vulnerable people, and a tax-based financing system that serves as a national risk pooled scheme for the population.
n The Norway Oil Fund, established in 1990 to underpin long-term considerations as petroleum revenues began to flow into the Norwegian economy, was renamed the Government Pension Fund Global in 2006 as part of a broader pension reform, highlighting the Fund’s role in supporting the government savings necessary to meet the rapid rise in public pension expenditures as the population ages. The same principle, of harnessing resources
0
1000
15000
10000
5000
0
3000
4000
5000
6000
1960
1990
1991
1992
1993
1994
1995
1996
1997
1998
1999
2000
2001
2002
2003
2004
2005
2006
2007
2008
2009
2010
2011
2012
1970 1980 1990 2000 2010 2020
GNI per capita (constant 2000 US$)
Series 1
0
20
40
60
80
100
1960 1970 1980 1990 2000 2010 2020
School enrollment, primary (% gross) School enrollment, secondary (% gross)
0
10
20
30
40
50
60
1960 1970 1980 1990 2000 2010 2020
Mortality rate, under-5 (per 1,000 live births)
Figure 1: Malaysia: GNI per capita, school enrollment, and under-5 mortality rate.
Source: Elaboration with data from World Bank’s World Development Indicators.
0
1000
15000
10000
5000
0
3000
4000
5000
6000
1960
1990
1991
1992
1993
1994
1995
1996
1997
1998
1999
2000
2001
2002
2003
2004
2005
2006
2007
2008
2009
2010
2011
2012
1970 1980 1990 2000 2010 2020
GNI per capita (constant 2000 US$)
Series 1
0
20
40
60
80
100
1960 1970 1980 1990 2000 2010 2020
School enrollment, primary (% gross) School enrollment, secondary (% gross)
0
10
20
30
40
50
60
1960 1970 1980 1990 2000 2010 2020
Mortality rate, under-5 (per 1,000 live births)
Figure 2: Chile’s Copper Prices in US dollars (US$/MT (Metric Ton)
Source: Elaboration with data from Bloomberg 2012.
AfricA HeAltH forum 2013 finAnce And cApAcity for results 2 3AFRICA HEALTH FORUM 2013: FINANCE AND CAPACITY FOR RESULTS18

for human development, applies in countries with younger populations that need to be more healthy and productive.
n Botswana has effectively controlled the spread of HIV/AIDS by rolling out prevention interventions, increasing access to voluntary testing and counseling services, and providing treatment to more than 90 percent of people who need it. Between 2001 and 2011, the rate of new HIV infections in Botswana dropped by 73 percent, and the number of people dying from AIDS-related causes declined by 71 percent over 2005-2011 because of scaled-up treatment efforts and the steady decline in HIV incidence. Unlike in other countries, Botswana’s national HIV/AIDS response has been funded primarily by public revenue.
n Chile’s well-defined and implemented programs in health, education and social protection have proved powerful assets to reduce poverty and inequality while promoting social cohesion and stability. Chile has successfully used revenues from soaring copper prices (see Figure 2) for human development through a large social development fund. Moreover, Chile’s experience shows how governments become more accountable to citizens when poverty falls and people take greater interest in how the government uses natural resource revenues for the benefit of the whole population.
In the health sector, Chile adopted a Regime of Explicit
Health Guarantees in 2005, mandating coverage by public and private health insurers of a comprehensive benefit package. This has considerably increased access to health services and improved early detection and treatment of chronic conditions. It has further contributed to the country’s very high human development level (Chile ranks 44 out of 187 countries with comparable data).
What are the Lessons? Overall, the combination of sound economic policies, strong institutions and a commitment to social development in these countries has helped reduce poverty and build the human capital needed to sustain economic growth, modernize institutions and systems, enhance job opportunities, and raise living standards.
These country experiences are highly relevant and applicable to other countries, particularly those African MICs that have been enjoying a mineral boom and rapid economic growth over the past decade but continue to have high levels of poverty and inequality and low human development indicators (often far from meeting
key MDG targets such as reducing maternal mortality by 75 percent between 1990 and 2015). The key lesson from Botswana, Chile, Malaysia and Norway is that natural resources management in developing countries should consider both requirements for long-term investment in the context of less abundant capital, as well as the urgent need to cut poverty and expand education, health, and social protection. In the health sector, it is clear from these country experiences that how a health system is structured reflects decisions on what kind of society a country wants to have. It is broad social goals that will ultimately guide policy and institutional decisions concerning the most appropriate and contextually relevant organizational forms, health care financing arrangements, and service delivery mechanisms that could be adopted to attain the intermediate goals of a health system (improved access, quality, efficiency, and fairness). These contribute to achieving the ultimate goals of a health system (improved health status, financial protection, and patient satisfaction with health care received).
Economic Policies and Institutional Measures. Chile since the early 1990s is a good example of how mineral wealth can help develop and strengthen institutional and governance arrangements, not only to mobilize additional government revenue through effective taxation policies on mining activity, but more importantly, to manage increased public revenues transparently. Economic and social stabilization funds were established to minimize the negative impact of fluctuations in copper prices on government revenues. In response to a new demographic scenario characterized by an ageing population, a Pension Reserve Fund was set up to guarantee basic solidarity pensions to those who were not able to save enough for their retirement. Investments were made abroad to prevent harmful appreciation of the local currency. And new mechanisms, such as program budgeting, budget execution controls, and performance management, now help guide funding decisions in sectoral
ministries, controlling expenditures and assessing results achieved.
Leveraging Revenues for Investing in Human Capital. Reflecting a desire to be socially and politically inclusive and protect people from the effects of ill health, disability and old age, Malaysia, Norway, Botswana and Chile have all markedly increased their social spending. Over time, this has helped people in these countries gain more equitable access to health, education and social protection.
n Under Malaysia’s 2006-2010 Ninth Development Plan, poverty eradication programs cut poverty from 5.7 percent in 2005 to 3.8 percent in 2009, and education and health conditions were significantly improved (see Figure 1). Recognizing that “health is an important asset in the development of human capital”, and that “a healthy society contributes to a dynamic and productive nation”, the government has further strengthened one of the best health systems in Southeast
Asia by promoting public-private partnerships to improve access to health services, coverage, and quality of care. Using regional WHO comparators, Malaysia fares well in terms of providing universal health care to all citizens, with total health expenditure close to 5 percent of GDP, out-of-pocket payment roughly a third of total health expenditure, comprehensive social safety nets for vulnerable people, and a tax-based financing system that serves as a national risk pooled scheme for the population.
n The Norway Oil Fund, established in 1990 to underpin long-term considerations as petroleum revenues began to flow into the Norwegian economy, was renamed the Government Pension Fund Global in 2006 as part of a broader pension reform, highlighting the Fund’s role in supporting the government savings necessary to meet the rapid rise in public pension expenditures as the population ages. The same principle, of harnessing resources
0
1000
15000
10000
5000
0
3000
4000
5000
6000
1960
1990
1991
1992
1993
1994
1995
1996
1997
1998
1999
2000
2001
2002
2003
2004
2005
2006
2007
2008
2009
2010
2011
2012
1970 1980 1990 2000 2010 2020
GNI per capita (constant 2000 US$)
Series 1
0
20
40
60
80
100
1960 1970 1980 1990 2000 2010 2020
School enrollment, primary (% gross) School enrollment, secondary (% gross)
0
10
20
30
40
50
60
1960 1970 1980 1990 2000 2010 2020
Mortality rate, under-5 (per 1,000 live births)
Figure 1: Malaysia: GNI per capita, school enrollment, and under-5 mortality rate.
Source: Elaboration with data from World Bank’s World Development Indicators.
0
1000
15000
10000
5000
0
3000
4000
5000
6000
1960
1990
1991
1992
1993
1994
1995
1996
1997
1998
1999
2000
2001
2002
2003
2004
2005
2006
2007
2008
2009
2010
2011
2012
1970 1980 1990 2000 2010 2020
GNI per capita (constant 2000 US$)
Series 1
0
20
40
60
80
100
1960 1970 1980 1990 2000 2010 2020
School enrollment, primary (% gross) School enrollment, secondary (% gross)
0
10
20
30
40
50
60
1960 1970 1980 1990 2000 2010 2020
Mortality rate, under-5 (per 1,000 live births)
Figure 2: Chile’s Copper Prices in US dollars (US$/MT (Metric Ton)
Source: Elaboration with data from Bloomberg 2012.
AfricA HeAltH forum 2013 finAnce And cApAcity for results 2 3SUMMARY REPORT 19

This brief is a product of the staff of the International Bank for Reconstruction and Development/The World Bank, prepared ahead of Africa Health Forum 2013: Finance and Capacity for Results, an event co-hosted by the World Bank and the U.S. State Department Office of Global Health Diplomacy, in collaboration with Harmonization for Health in Africa. The findings, interpretations, and conclusions expressed in this brief do not necessarily reflect the views of the Executive Directors of the World Bank or the governments they represent, or of any of the hosting entities and partners.
Many countries with large endowments of valuable natural resources do not fare better in terms of human development outcomes than less endowed countries, and in fact often do worse.
This paradoxical situation is all too common in a large number of countries in Sub-Saharan Africa today. Many Middle Income Countries (MICs) in the region are doing worse than the average Low Income Country (LIC). In Sub-Saharan Africa, MICs, which are typically rich in natural resources, have greater inequality than LICs and equally undiversified economies. Small resource-rich MICs are doing worse on the 2015 Millennium Development Goals (MDGs) and on human development outcomes (controlling for income levels), and have less developed institutions.
Yet this situation is not inevitable. Some countries across the world have been able to effectively manage natural resources and translate this wealth into sustained economic growth, improved living conditions, and better nutrition, health and education levels for their populations. Many resource-rich
countries in Sub-Saharan Africa could adapt the lessons from these international experiences to their social, political and institutional reality. An important takeaway is that building human capital is critical to promote diversified economic growth, reduce poverty and inequality, and create economic opportunities.
Country ExpEriEnCEs aCross thE World The evidence from countries such as Chile (the largest copper producer in the world), Botswana
(rich in diamonds) and Malaysia and Norway (blessed with oil), highlights the strong link between inclusive political and economic institutions and development. In these countries, institutions are anchored in well-defined and accepted principles that govern the conduct, relationship, and interaction among individuals and groups within society. As a result, governments tend to be run in accordance with the rule of law, protecting and empowering citizens to be politically and economically active, and helping those in need.
n What needs to be done to strengthen capacity to manage the technical aspects of natural resource management? For example, establishing a small cadre of well-trained technical specialists able to deal with the challenges of managing natural resources at each level from exploration to exploitation.
n What needs to be done to enhance countries’ ability to transparently account for funding allocated for social development? For example, adopting/adapting policy/institutional mechanisms, such as program budgeting, budget execution controls, and performance management, to help guide funding decisions in sectoral ministries, controlling expenditures and assessing results achieved.
n How could countries share experiences in natural resource management, successful or otherwise, to better inform policies that promote longer-term goals such as the MDGs and the post-2015 agenda?
n What can be done to help to diffuse and develop capacity in countries to adopt good practices such as those of the Extractive Industries Transparency Initiative?
QuEstions to MinistErs
MorE on thE topiC
Arellano, J-P. 2012. Copper Mining and its impact on Chile development. Nº35 // Volume 16 // July-December 2012 @journal.
Bitran, R., Escobar, L., and Gassibe, P. 2010. “After Chile’s Health Reform: Increase In Coverage And Access, Decline In Hospitalization And Death Rates,” Health Affairs, vol. 29, No. 12, pp. 2161-2170.
Hong Teck Chua, H.T., and Cheah, J. H. C. 2011. “Financing Universal Coverage in Malaysia: a case study.” BMC Public Health 2012, 12(Suppl 1):S7. http://www.biomedcentral.com/1471-2458/12/S1/S7
IMF. 2007. Guide on Resource Revenue Transparency. Washington DC: IMF .
Lange, G-M., and M. Wright. 2004. “Sustainable development in mineral economies: the example of Botswana,” Environment and Development Economics, vol. 9, No. 4, pp. 485–505.
Marquez, P. 2013. “Institutions and Systems Matter for Health and Social Development.” http://blogs.worldbank.org/health/institutions-and-systems-matter-for-health-and-social-development
Marquez, P. 2012. “Ethics, Values and Health Systems.” http://blogs.worldbank.org/health/ethics-values-and-health-systems
Pineda, J. and F. Rodriguez. 2010. “Curse or blessing? Natural resources and human development,” Human Development Research Paper 2010/04. New York: UNDP.
Tenth Malaysia Plan 2011-2015. Speech by the Prime Minister in the Dewan Rakyat on June 10, 2010.
UNDP. 2011. Managing Natural Resources for Human Development in Low-Income Countries. WP 2011-002. UNDP Regional Bureau for Africa.
World Bank. 2006. Where is the Wealth of Nations - Measuring Capital for the 21st Century. Washington D.C: World Bank.
on norWay oil Fund
General website: http://www.regjeringen.no/en/dep/fin/Selected-topics/the-government-pension-fund/government-pension-fund-global-gpfg.html?id=697027
Brief history and rationale: http://www.regjeringen.no/pages/7772/FactSheet_year-end2011.pdf
How the fund is managed: http://www.regjeringen.no/en/dep/fin/Documents-and-publications/propositions-and-reports/Reports-to-the-Storting/2011-2012/meld-st-17-20112012-2.html?id=680515
How to Translate Mineral Wealth into Health and Social Development
KEy MEssagEsn African countries with rich endowments of natural resources largely
do not have good human development outcomes. However, this situation is not inevitable and much can be done to build human capital in resource-rich countries.
n Chile, Botswana, Malaysia and Norway offer valuable experiences that resource-rich African countries can adapt to their own contexts. Inclusive political and economic institutions are a common factor that has influenced development in these four countries.
n Natural resource wealth management should consider both the long-term requirements for economic growth when these revenues dwindle, as well as the immediate need to cut poverty, reduce inequality, and build human capital as a key contributing factor to diversified growth over the medium and longer term.
2013
AFRICA HEALTH FORUM 2013: FINANCE AND CAPACITY FOR RESULTS20

This brief is a product of the staff of the International Bank for Reconstruction and Development/The World Bank and USAID, prepared ahead of Africa Health Forum 2013: Finance and Capacity for Results, an event co-hosted by the World Bank and the U.S. State Department Office of Global Health Diplomacy, in collaboration with Harmonization for Health in Africa. The findings, interpretations, and conclusions expressed in this brief do not necessarily reflect the views of the Executive Directors of the World Bank or the governments they represent, or of any of the hosting entities and partners.
Countries in Sub-Saharan Africa (SSA) and global stakeholders alike have been committed to develop effective and sustainable health financing systems that aim to ensure access to appropriate services and avoid financial hardship to pay for these services. Making progress towards Universal Health Coverage (UHC) also calls for more effort and innovation in the reform of health financing systems. While the goal of universal access is shared, the specific instruments and models vary across and even within countries, and reflect the social, economic, political and institutional histories and aspirations of each society. No single model or formula applies to all. This brief presents both historical and current trends in health financing, including variations in how efficiently resources for health are used and in the pace of progress towards the Millennium Development Goals (MDGs). Further, by discussing both challenges and promising approaches on the ground, it sets the stage for discussion on how to reform health financing systems in Africa.
The CurrenT STaTe of healTh finanCing in afriCaLow per capita health spending, slow growth in health spending, and weak results focus. SSA has very low per capita health spending and slow growth in health spending compared with other regions, except for South Asia (Figure 1). South Asia
spends less on health than SSA but has better health outcomes for most key indicators. The challenge for SSA is thus not only the low level of spending but also the results and
returns for current allocations. In 2010, average per capita total health expenditure for SSA stood at US$84, compared to South Asia (US$47), East Asia and Pacific (US$183), Middle
PromiSing aPProaCheS uSed on The groundPromising health sector reform initiatives in many countries have resulted in rapid scaling up of service coverage and improved efficiency in how resources are used.
n Health financing strategy: It is encouraging that many countries are undertaking or keen to develop comprehensive national health financing strategies, and to push towards a more efficient health financing system and universal health coverage.
n Efficiency improvement initiatives: During the last decade, various initiatives have been undertaken to improve efficiency of financial allocation to and within the health sector. Countries are taking solid steps towards harmonizing external assistance, lifting the risk-pooling level from household to community, region and country (e.g., Ghana and Rwanda), reducing direct payment at time of care and introducing pre-payment mechanisms, and focusing more on results.
n Pay-for-Results: Incentives can be effectively used at different levels (individuals, institutions and countries) to finance high-impact interventions. The Results-Based Financing (RBF) approach at the facility level, pioneered in Rwanda, has resulted in substantial increase in coverage of high-impact interventions such as immunization, family planning, mosquito nets, and skilled attendance at delivery. Today, over 20 SSA countries are piloting some form of RBF. Development partners are also trying out this mechanism at the country level, e.g., the new World Bank financing instrument known as Program-For-Results (PforR) will now be used in Ethiopia to link disbursement directly with achieving national program results.
n Building safety nets for the poor: There have been efforts to establish social safety nets in many SSA countries. Through these initiatives, poor people identified may have improved access to basic health services, among other services, so that they do not have to skip necessary care or endure financial hardship related to it.
QueSTionS To miniSTerS n What is the trajectory for a sustainable
health financing arrangement that is more domestic, more affordable and less dependent on external sources? Please share your experiences and policy actions in innovative domestic and external financing approaches including risk pooling, revenues from taxes, and links to revenues from extractive industries.
n A shift from investments that focus on inputs and processes to those that focus on results and systemic changes is already underway, including various forms of results-based financing. How can health spending become more efficient and ensure tangible results?
n What are your priorities in strengthening health financing systems and what support do you require from external partners?
referenCeS
UNFPA, UNICEF, WHO and World Bank. 2012. Trends in Maternal Mortality: 1990:2010. Geneva.
UNFPA, UNICEF, WHO and World Bank. 2012. Trends in Child Mortality: 1990:2010. New York.
International Health Partnership. 2009. Taskforce on Innovative International Financing for Health Systems: More money for health, and more health for the money: final report. Geneva
WHO. 2011. World Health Report 2010 – Health systems financing: the path to universal coverage. Geneva
Harmonization for Health in Africa. 2010. Investing in Health for Africa: the case for strengthening systems for better health outcomes. Geneva
Ishrat Husain, Scott Stewart, Katilyn Patierno, Karen Cavanaugh. 2013. Health Financing: A brief review of affordability, equity and efficiency in Sub-Saharan Africa. Washington D.C.
0
50
100
150
200
250
Per capita health expenditure 2000 Per capita health expenditure 2010
Unde
r -5
Mor
talit
y 200
0
Unde
r -5
Mor
talit
y 201
0
0 10 20 30 40 50 600
50
100
150
200
250
0 10 20 30 40 50 60
SLE
MLITCD
BFISLE
GNBCAF
NER BDI
GIN BENLBR
MWITZA
COMKEN
TGOUGA RWA
MDG
ETH
ERI
GMB
MOZ
MLIBFITCDRWA
CAFGNB MOZ GIN
LBRBEN
ETHTZA GNB
TGOKENCOMMDG
ERI
UGA
MWIBDI
NER
Sources: WHO’s GHO database and IMF’s World Economic Outlook database ; Zimbabwe and South Sudan are excluded
Figure 4: Under-five mortality vs. per capita health expenditure among low income SSA countries
Health Financing and Fiscal Health in AfricaBridging Collaboration between Ministries of Finance and Health
Key meSSageSn Average per capita health spending is low in Africa, but higher
than in South Asia. Yet South Asia, in general, has better health outcomes. So Africa not only needs more money for health, it also needs more health for the money.
n In many African countries, external resources account for a substantial proportion of total health expenditure. However, it is mostly fragmented and unpredictable. This trend raises the question of sustainability. Countries have to build more domestic capacity for health, with the intention of becoming self-financing in the medium- to long-term.
n Household out-of-pocket health expenditure is unacceptably high in SSA. This is both inefficient and inequitable. There is a need for country-led policies and strategies that can help reduce out-of-pocket payment based on each unique social, economic and political context.
2013
1995 1997 1999 2001 2003 2005 2007 2009
EAP ECA LACMNA SAS SSA
Per c
apita
hea
lth ex
pend
iture
, (co
nsta
nt 20
05 in
tern
atio
nal d
olla
rs)
0
200
400
600
800
Figure 1: Per capita total health expenditure (PPP adjusted) by region and time
Sources: aggregate level data from World Bank HNP databank, PPP adjusted constant dollars in 2005 are used and the data is for developing countries only
SUMMARY REPORT 21

n Additional epidemiological challenges: With the communicable disease burden still high, many countries are also facing a rapidly increasing threat from non-communicable diseases that tend to become chronic, and from injuries, imposing a direct financial burden on governments, employers and households, and slowing down the economy.
n Attention to service quality: The quality of services may be of concern for many countries, especially in rural areas. With low-quality services, expanded coverage will not necessarily translate into improved health outcomes. Preliminary study results examining antenatal services indicate that quality of service often lags behind access. In many countries, more than half the pregnant women receiving antenatal services are not informed of pregnancy complications during their visit.
There is a pressing need to align health financing within the macro-economic and social context.
n Can population health benefit from projected economic growth and how? SSA has proved to be resilient to the economic crisis and is likely to continue strong growth during the coming years. SSA economies are projected to grow at 5 percent to 6 percent for 2013-2017 (WEO, October 2012 projections). General government revenues are projected to be 28 percent of GDP for the coming years. There is a need to ensure that the poor benefit from these gains.
n Strategic planning is important for countries refining their health financing, because emerging economies are often faced with rapid urbanization, massive population migration and increasing formal and informal employment. Globally, many countries are struggling to integrate health financing arrangements segregated by residence, employment status, and industry, among others.
Delivering more value-for-money. Making health systems more efficient will help countries to get more value out of their health spending, and release resources from the current envelope for expanded or targeted coverage. The WHO estimates that that 20–40 percent of global health spending is wasted through inefficiency. Fragmentation of the health financing system, partially with heavy reliance on external financing, and the high proportion of out-of-pocket spending are major sources of inefficiency. As shown in Figure 4, compared with the variation in under-five mortality in 2000, the variation in health spending between countries is relatively small; however, after one decade, health spending variation has increased significantly given that many countries have managed to increase their health spending, while variation in under-five mortality remains about the same. It is important to understand how efficient countries are using the increased fiscal envelope, to explore sources of inefficiency in each country, and identify ways for improvement.
East and North Africa (US$203), Europe and Central Asia (US$438) and Latin America and the Caribbean (US$670).
Total health expenditure as a share of GDP increased only slightly from 5.8 percent in 1995 to 6.5 percent in 2010. Similarly, health as a share of total government expenditure registered a modest increase, from 9.8 percent in 2004 to 10.8 percent in 20101. The average per capita total health expenditure for SSA has more than doubled, increasing from US$32 in 1995 to US$84 in 2010. However, much of the increase is from external sources and there is a wide variation across countries in the magnitude and level of increases.
Public-private health financing and out-of-pocket expenditure have remained more or less the same. Private expenditure on health accounts for over half the total expenditure on health, with a slight decline in 2010 to 55 percent from 61 percent in 1995. On average, household out-of-pocket spending constitutes about one-third
of total health expenditure in SSA, 30 percent in 1995 and 32 percent in 2010. However, in some countries out-of-pocket expenditure is a much higher share of health expenditure. For instance, it accounts for more than 60 percent in Cameroon, Central African Republic, Chad, Sierra Leone, Cote d’Ivoire, Guinea and Guinea-Bissau. This creates a major challenge in terms of financial protection, as out-of-pocket spending impoverishes people and excludes them from accessing health services.
External resources remain important for health. Despite the global economic slump, donors gave generously to global health, though at a slower rate. Development assistance for health remains an important source of health financing in SSA (Figure 2). Development assistance for health for SSA has grown substantially from US$0.53 billion in 1990 to US$5.43 billion in 2008. A third of development assistance for health is invested in three diseases (HIV, TB and Malaria)2. In many cases, external resources are fragmented and
unpredictable, and uncertain since the global economic downturn.
Low income SSA countries rely heavily on external assistance for health. This is in comparison with middle and high income SSA countries (Figure 3). As of 2010, six countries have more than 40 percent of their total health expenditure from external assistance—Burundi, Malawi, Tanzania, Rwanda, Gambia and Liberia. At this critical moment, it is imperative for countries to continue to improve the efficiency of existing health expenditures as well as critically explore mobilization of additional domestic resources.
ChallengeSSSA countries need to tackle great challenges in improving access to and quality of basic essential services while reducing dependency on external assistance.
n Slow progress towards MDGs: With only a couple of years to 2015, SSA still faces big challenges in achieving MDG 4 and 5. The average maternal mortality ratio for SSA (500 per 100,000) far exceeds the levels in South Asia (220) and Latin America and the Caribbean (80). Despite a faster decline in the under-five mortality rate, the highest rates of child mortality are still in SSA—where 1 in 9 children dies before age five, more than 16 times the average for developed regions (1 in 152) and significantly higher than in South Asia (1 in 16). In 2010, with 13 percent of the world’s population, SSA accounted for 56 percent of maternal deaths, 49 percent of under-five child deaths and 69 percent of HIV/AIDS cases3 .
Figure 3: External assistance for health as a percentage of total health expenditures, 2010
Sources: WHO’s GHO database and IMF’s World Economic Outlook database ; Zimbabwe and South Sudan are excluded
0
10
20
30
40
50
60
70
80
90
100
Countries, sorted by GDP per capita (2010)
Countries are grouped by 2010 World Bank income group categories
Exte
rnal
Ass
istan
ce as
% o
f Tot
al H
ealth
Expe
nditu
res
Low income Lower middle income Upper middle
and high income
Buru
ndi
DRC
Liberi
a
Mala
wi
Sierra
Leon
e
Ethiop
ia
Nige
r
Mad
agas
car
Eritre
a
CAR
Guine
a
Moz
ambiq
ue
Togo
Ugan
da
Guine
a-Bis
sau
Tanz
ania
Rwan
da
Burki
na Fa
so
Gam
bia
Benin
Mali
Chad
Com
oros
Keny
a
Leso
tho
Sene
gal
Côte
d'Ivo
ire
Cam
eroon
São T
omé a
nd Pr
íncipe
Zam
bia
Ghan
a
Nige
ria
Cong
o
Swaz
iland
Cape
Verd
e
Ango
la
Nam
ibia
Sout
h Afri
ca
Mau
ritius
Botsw
ana
Gabo
n
Seyc
helle
s
Equa
toria
l Guin
ea
AfricA HeAltH forum 2013 finAnce And cApAcity for results 2 3
Figure 2: Proportion of external assistance out of total health expenditure by region and time
Sources: aggregate level data from World Bank HNP databank and data for developing countries only
1995 1997 1999 2001 2003 2005 2007 2009
Exte
rnal
reso
urce
s on
heal
th as
% o
fto
tal h
ealth
expe
nditu
re (%
)
0
2
4
6
8
10
12
EAP ECA LAC MNA SAS SSA
1 Source: aggregate level data from World Bank HNP databank, current dollars for 2010 are used and the data is for developing countries only.
2 Institute for Health Metrics and Evaluation (IHME) global database3 Data for number of living with HIV is as of 2011.
AFRICA HEALTH FORUM 2013: FINANCE AND CAPACITY FOR RESULTS22

n Additional epidemiological challenges: With the communicable disease burden still high, many countries are also facing a rapidly increasing threat from non-communicable diseases that tend to become chronic, and from injuries, imposing a direct financial burden on governments, employers and households, and slowing down the economy.
n Attention to service quality: The quality of services may be of concern for many countries, especially in rural areas. With low-quality services, expanded coverage will not necessarily translate into improved health outcomes. Preliminary study results examining antenatal services indicate that quality of service often lags behind access. In many countries, more than half the pregnant women receiving antenatal services are not informed of pregnancy complications during their visit.
There is a pressing need to align health financing within the macro-economic and social context.
n Can population health benefit from projected economic growth and how? SSA has proved to be resilient to the economic crisis and is likely to continue strong growth during the coming years. SSA economies are projected to grow at 5 percent to 6 percent for 2013-2017 (WEO, October 2012 projections). General government revenues are projected to be 28 percent of GDP for the coming years. There is a need to ensure that the poor benefit from these gains.
n Strategic planning is important for countries refining their health financing, because emerging economies are often faced with rapid urbanization, massive population migration and increasing formal and informal employment. Globally, many countries are struggling to integrate health financing arrangements segregated by residence, employment status, and industry, among others.
Delivering more value-for-money. Making health systems more efficient will help countries to get more value out of their health spending, and release resources from the current envelope for expanded or targeted coverage. The WHO estimates that that 20–40 percent of global health spending is wasted through inefficiency. Fragmentation of the health financing system, partially with heavy reliance on external financing, and the high proportion of out-of-pocket spending are major sources of inefficiency. As shown in Figure 4, compared with the variation in under-five mortality in 2000, the variation in health spending between countries is relatively small; however, after one decade, health spending variation has increased significantly given that many countries have managed to increase their health spending, while variation in under-five mortality remains about the same. It is important to understand how efficient countries are using the increased fiscal envelope, to explore sources of inefficiency in each country, and identify ways for improvement.
East and North Africa (US$203), Europe and Central Asia (US$438) and Latin America and the Caribbean (US$670).
Total health expenditure as a share of GDP increased only slightly from 5.8 percent in 1995 to 6.5 percent in 2010. Similarly, health as a share of total government expenditure registered a modest increase, from 9.8 percent in 2004 to 10.8 percent in 20101. The average per capita total health expenditure for SSA has more than doubled, increasing from US$32 in 1995 to US$84 in 2010. However, much of the increase is from external sources and there is a wide variation across countries in the magnitude and level of increases.
Public-private health financing and out-of-pocket expenditure have remained more or less the same. Private expenditure on health accounts for over half the total expenditure on health, with a slight decline in 2010 to 55 percent from 61 percent in 1995. On average, household out-of-pocket spending constitutes about one-third
of total health expenditure in SSA, 30 percent in 1995 and 32 percent in 2010. However, in some countries out-of-pocket expenditure is a much higher share of health expenditure. For instance, it accounts for more than 60 percent in Cameroon, Central African Republic, Chad, Sierra Leone, Cote d’Ivoire, Guinea and Guinea-Bissau. This creates a major challenge in terms of financial protection, as out-of-pocket spending impoverishes people and excludes them from accessing health services.
External resources remain important for health. Despite the global economic slump, donors gave generously to global health, though at a slower rate. Development assistance for health remains an important source of health financing in SSA (Figure 2). Development assistance for health for SSA has grown substantially from US$0.53 billion in 1990 to US$5.43 billion in 2008. A third of development assistance for health is invested in three diseases (HIV, TB and Malaria)2. In many cases, external resources are fragmented and
unpredictable, and uncertain since the global economic downturn.
Low income SSA countries rely heavily on external assistance for health. This is in comparison with middle and high income SSA countries (Figure 3). As of 2010, six countries have more than 40 percent of their total health expenditure from external assistance—Burundi, Malawi, Tanzania, Rwanda, Gambia and Liberia. At this critical moment, it is imperative for countries to continue to improve the efficiency of existing health expenditures as well as critically explore mobilization of additional domestic resources.
ChallengeSSSA countries need to tackle great challenges in improving access to and quality of basic essential services while reducing dependency on external assistance.
n Slow progress towards MDGs: With only a couple of years to 2015, SSA still faces big challenges in achieving MDG 4 and 5. The average maternal mortality ratio for SSA (500 per 100,000) far exceeds the levels in South Asia (220) and Latin America and the Caribbean (80). Despite a faster decline in the under-five mortality rate, the highest rates of child mortality are still in SSA—where 1 in 9 children dies before age five, more than 16 times the average for developed regions (1 in 152) and significantly higher than in South Asia (1 in 16). In 2010, with 13 percent of the world’s population, SSA accounted for 56 percent of maternal deaths, 49 percent of under-five child deaths and 69 percent of HIV/AIDS cases3 .
Figure 3: External assistance for health as a percentage of total health expenditures, 2010
Sources: WHO’s GHO database and IMF’s World Economic Outlook database ; Zimbabwe and South Sudan are excluded
0
10
20
30
40
50
60
70
80
90
100
Countries, sorted by GDP per capita (2010)
Countries are grouped by 2010 World Bank income group categories
Exte
rnal
Ass
istan
ce as
% o
f Tot
al H
ealth
Expe
nditu
res
Low income Lower middle income Upper middle
and high income
Buru
ndi
DRC
Liberi
a
Mala
wi
Sierra
Leon
e
Ethiop
ia
Nige
r
Mad
agas
car
Eritre
a
CAR
Guine
a
Moz
ambiq
ue
Togo
Ugan
da
Guine
a-Bis
sau
Tanz
ania
Rwan
da
Burki
na Fa
so
Gam
bia
Benin
Mali
Chad
Com
oros
Keny
a
Leso
tho
Sene
gal
Côte
d'Ivo
ire
Cam
eroon
São T
omé a
nd Pr
íncipe
Zam
bia
Ghan
a
Nige
ria
Cong
o
Swaz
iland
Cape
Verd
e
Ango
la
Nam
ibia
Sout
h Afri
ca
Mau
ritius
Botsw
ana
Gabo
n
Seyc
helle
s
Equa
toria
l Guin
ea
AfricA HeAltH forum 2013 finAnce And cApAcity for results 2 3
Figure 2: Proportion of external assistance out of total health expenditure by region and time
Sources: aggregate level data from World Bank HNP databank and data for developing countries only
1995 1997 1999 2001 2003 2005 2007 2009
Exte
rnal
reso
urce
s on
heal
th as
% o
fto
tal h
ealth
expe
nditu
re (%
)
0
2
4
6
8
10
12
EAP ECA LAC MNA SAS SSA
1 Source: aggregate level data from World Bank HNP databank, current dollars for 2010 are used and the data is for developing countries only.
2 Institute for Health Metrics and Evaluation (IHME) global database3 Data for number of living with HIV is as of 2011.
SUMMARY REPORT 23

This brief is a product of the staff of the International Bank for Reconstruction and Development/The World Bank and USAID, prepared ahead of Africa Health Forum 2013: Finance and Capacity for Results, an event co-hosted by the World Bank and the U.S. State Department Office of Global Health Diplomacy, in collaboration with Harmonization for Health in Africa. The findings, interpretations, and conclusions expressed in this brief do not necessarily reflect the views of the Executive Directors of the World Bank or the governments they represent, or of any of the hosting entities and partners.
Countries in Sub-Saharan Africa (SSA) and global stakeholders alike have been committed to develop effective and sustainable health financing systems that aim to ensure access to appropriate services and avoid financial hardship to pay for these services. Making progress towards Universal Health Coverage (UHC) also calls for more effort and innovation in the reform of health financing systems. While the goal of universal access is shared, the specific instruments and models vary across and even within countries, and reflect the social, economic, political and institutional histories and aspirations of each society. No single model or formula applies to all. This brief presents both historical and current trends in health financing, including variations in how efficiently resources for health are used and in the pace of progress towards the Millennium Development Goals (MDGs). Further, by discussing both challenges and promising approaches on the ground, it sets the stage for discussion on how to reform health financing systems in Africa.
The CurrenT STaTe of healTh finanCing in afriCaLow per capita health spending, slow growth in health spending, and weak results focus. SSA has very low per capita health spending and slow growth in health spending compared with other regions, except for South Asia (Figure 1). South Asia
spends less on health than SSA but has better health outcomes for most key indicators. The challenge for SSA is thus not only the low level of spending but also the results and
returns for current allocations. In 2010, average per capita total health expenditure for SSA stood at US$84, compared to South Asia (US$47), East Asia and Pacific (US$183), Middle
PromiSing aPProaCheS uSed on The groundPromising health sector reform initiatives in many countries have resulted in rapid scaling up of service coverage and improved efficiency in how resources are used.
n Health financing strategy: It is encouraging that many countries are undertaking or keen to develop comprehensive national health financing strategies, and to push towards a more efficient health financing system and universal health coverage.
n Efficiency improvement initiatives: During the last decade, various initiatives have been undertaken to improve efficiency of financial allocation to and within the health sector. Countries are taking solid steps towards harmonizing external assistance, lifting the risk-pooling level from household to community, region and country (e.g., Ghana and Rwanda), reducing direct payment at time of care and introducing pre-payment mechanisms, and focusing more on results.
n Pay-for-Results: Incentives can be effectively used at different levels (individuals, institutions and countries) to finance high-impact interventions. The Results-Based Financing (RBF) approach at the facility level, pioneered in Rwanda, has resulted in substantial increase in coverage of high-impact interventions such as immunization, family planning, mosquito nets, and skilled attendance at delivery. Today, over 20 SSA countries are piloting some form of RBF. Development partners are also trying out this mechanism at the country level, e.g., the new World Bank financing instrument known as Program-For-Results (PforR) will now be used in Ethiopia to link disbursement directly with achieving national program results.
n Building safety nets for the poor: There have been efforts to establish social safety nets in many SSA countries. Through these initiatives, poor people identified may have improved access to basic health services, among other services, so that they do not have to skip necessary care or endure financial hardship related to it.
QueSTionS To miniSTerS n What is the trajectory for a sustainable
health financing arrangement that is more domestic, more affordable and less dependent on external sources? Please share your experiences and policy actions in innovative domestic and external financing approaches including risk pooling, revenues from taxes, and links to revenues from extractive industries.
n A shift from investments that focus on inputs and processes to those that focus on results and systemic changes is already underway, including various forms of results-based financing. How can health spending become more efficient and ensure tangible results?
n What are your priorities in strengthening health financing systems and what support do you require from external partners?
referenCeS
UNFPA, UNICEF, WHO and World Bank. 2012. Trends in Maternal Mortality: 1990:2010. Geneva.
UNFPA, UNICEF, WHO and World Bank. 2012. Trends in Child Mortality: 1990:2010. New York.
International Health Partnership. 2009. Taskforce on Innovative International Financing for Health Systems: More money for health, and more health for the money: final report. Geneva
WHO. 2011. World Health Report 2010 – Health systems financing: the path to universal coverage. Geneva
Harmonization for Health in Africa. 2010. Investing in Health for Africa: the case for strengthening systems for better health outcomes. Geneva
Ishrat Husain, Scott Stewart, Katilyn Patierno, Karen Cavanaugh. 2013. Health Financing: A brief review of affordability, equity and efficiency in Sub-Saharan Africa. Washington D.C.
0
50
100
150
200
250
Per capita health expenditure 2000 Per capita health expenditure 2010
Unde
r -5
Mor
talit
y 200
0
Unde
r -5
Mor
talit
y 201
00 10 20 30 40 50 60
0
50
100
150
200
250
0 10 20 30 40 50 60
SLE
MLITCD
BFISLE
GNBCAF
NER BDI
GIN BENLBR
MWITZA
COMKEN
TGOUGA RWA
MDG
ETH
ERI
GMB
MOZ
MLIBFITCDRWA
CAFGNB MOZ GIN
LBRBEN
ETHTZA GNB
TGOKENCOMMDG
ERI
UGA
MWIBDI
NER
Sources: WHO’s GHO database and IMF’s World Economic Outlook database ; Zimbabwe and South Sudan are excluded
Figure 4: Under-five mortality vs. per capita health expenditure among low income SSA countries
Health Financing and Fiscal Health in AfricaBridging Collaboration between Ministries of Finance and Health
Key meSSageSn Average per capita health spending is low in Africa, but higher
than in South Asia. Yet South Asia, in general, has better health outcomes. So Africa not only needs more money for health, it also needs more health for the money.
n In many African countries, external resources account for a substantial proportion of total health expenditure. However, it is mostly fragmented and unpredictable. This trend raises the question of sustainability. Countries have to build more domestic capacity for health, with the intention of becoming self-financing in the medium- to long-term.
n Household out-of-pocket health expenditure is unacceptably high in SSA. This is both inefficient and inequitable. There is a need for country-led policies and strategies that can help reduce out-of-pocket payment based on each unique social, economic and political context.
2013
1995 1997 1999 2001 2003 2005 2007 2009
EAP ECA LACMNA SAS SSA
Per c
apita
hea
lth ex
pend
iture
, (co
nsta
nt 20
05 in
tern
atio
nal d
olla
rs)
0
200
400
600
800
Figure 1: Per capita total health expenditure (PPP adjusted) by region and time
Sources: aggregate level data from World Bank HNP databank, PPP adjusted constant dollars in 2005 are used and the data is for developing countries only
AFRICA HEALTH FORUM 2013: FINANCE AND CAPACITY FOR RESULTS24

What is Results-Based Financing? Results-Based Financing (RBF) is an instrument that links financing to pre-determined results, with payment made only upon verification that the agreed-upon results have actually been delivered. RBF can help improve both supply- and demand-side performance of health systems striving for Universal Health Coverage. In an RBF program payments are made based on the quantity and quality of health services delivered after verification. (For an example of how RBF can work at a health facility level see the box on page 4). The evidence from a series of countries in Africa indicates that RBF can strengthen core health system functions, increasing the efficiency and accountability of the health system. In many countries the design of RBF programs has included the removal of user fees, thus reducing the financial burden of accessing care.
Results-Based Financing has expanded rapidly in Africa: There are currently 3 countries1 with nationwide programs and 14 countries2 with ongoing pilots. Six countries are in the advanced planning stage and RBF initiatives are being discussed in 9 countries. Based on a country’s specific context and health sector priorities, the World Bank supports the design, implementation and evaluation of RBF programs with financing from the International Development
1 Sierra Leone, Burundi and Rwanda2 Benin, Zimbabwe, Zambia, Burkina Faso, CAR, DRC,
Congo, Kenya, Tanzania, Nigeria, Chad, Cameroon, Malawi, Mozambique
Association (IDA) and the Health Results Innovation Trust Fund. All the programs are accompanied by
rigorous impact evaluations. Figure 1 shows the scale of RBF programs in Africa in 2013.
This brief is a product of the staff of the International Bank for Reconstruction and Development/The World Bank, prepared ahead of Africa Health Forum 2013: Finance and Capacity for Results, an event co-hosted by the World Bank and the U.S. State Department Office of Global Health Diplomacy, in collaboration with Harmonization for Health in Africa. The findings, interpretations, and conclusions expressed in this brief do not necessarily reflect the views of the Executive Directors of the World Bank or the governments they represent, or of any of the hosting entities and partners.
Next StepS Many countries with performance-based financing pilots are exploring ways to scale up and sustain these programs. Based on evidence from evaluations and operational data, policy makers have various opportunities for effectively moving forward the dialogue around RBF in the broader sectoral discussions.
1. Financial Sustainability: In order to ensure longer-term sustainability of RBF, it must be considered part and parcel of a broader and more comprehensive health financing strategy. A few ways in which RBF could be financed in future include: (i) linking future civil servant salary increases to performance (through RBF); or (ii) investing some proportion of the capital budget in making existing facilities function better (through RBF).
2. Integration of RBF into Government Systems: RBF mechanisms and principles need to be integrated into the public health system and government financial system. This has happened in a few countries such as Burundi where the
government is financing 52 percent of the cost of RBF. In a number of other countries, RBF is now a line item in the health budget. This will ensure RBF is aligned with the overall objectives and design of country systems.
3. Harmonizing the Use of Donor Funds: Aligning external funding to support performance-based payments based on results could increase the impact of donor financing. This has been done with funds from the Global Fund, PEPFAR and GAVI. This can be a model for harmonizing other donor funds as well.
Moving forward, the financial sustainability of successful RBF programs needs to be considered as
part of a comprehensive financing strategy for the health sector.
QueStioNS to MiNiSterSn What kind of additional information
would be helpful to you in thinking about the role of RBF in your health system?
n What are the measures you would need to take to integrate the RBF approach in the wider health financing agenda?
n How can institutions like the World Bank and other partners be helpful in this process?
Results-Based Financing for Health
Key MeSSageSn Over the past five years, Results-Based Financing (RBF) for health
has been extensively tested in Africa as a promising approach to work towards Universal Health Coverage.
n RBF approaches are achieving good results; increasing coverage as well as quality of services while targeting resources to vulnerable populations.
n A well-designed RBF program can strengthen core health system functions, increasing value for money and accountability of the health system.
n In many countries the design of RBF programs has included removing user fees, thus improving financial access for essential health services.
Table 1: The effect of performance incentives on child health outcomes in Rwanda — Average Z-scores [0-23 months]
Baseline Control PBF Difference
Ht. for Age 0-23 months -0.03 -0.2 -0.04 0.16
Wt. for Age 0-23 months -0.31 -0.18 0.35 0.53
Ht. for Age 24-47 months -1.95 -1.8 -1.55 0.25
Wt. for Age 24-47 months -0.75 0.69 0.72 0.03
Box 1: How RBF works – A Simplified Example
n Defining a Package of Services: A package of priority services is defined at the national level and an analysis takes place to determine the fees associated with delivering these services. A key element of the design is the separation of functions between the purchaser of the services and the verifier of services.
n Paying for Quantity and Quality: Individual health facilities are provided funds based on the quantity and quality of services they produce. The total amount for volume of services is e adjusted for the remoteness of the facility (equity bonus), as urban or peri-urban facilities could earn a disproportionate amount. The total would also be adjusted by a quality correction based on a checklist administered at the facility every quarter.
Example of Performance Based Financing (PBF) in a Health Facilityn Verification: Before the funds are paid to the health facility, the quantity of services
provided is verified. In addition, an independent organization visits a number of randomly selected patients from the registers in their homes to see whether they received the service listed in the health facility’s register.
n Use of Funds: The funds earned by the health facility can be used for: (i) health facility operational costs, (ii) performance bonus for health workers according to defined criteria; and (iii) savings. The facility has substantial autonomy in how to use the funds but has to keep proper accounts.
National Scale-up (3)
Pilots Ongoing (14)
Advanced Planning (6)
Under Discussion (9)
Impact Evaluation (16)
Africa 2013: Scaling up RBF Programs
MAURITANIA
MALI
GUINEA BISSAU GUINEA
SIERRA LEONE
LIBERIA
CÔTE D’IVOIRE
BURKINA FASO
GHANA
TOGO
BENIN
NIGER CHAD SUDAN ERITREA
Djibouti SENEGAL
NIGERIA
CAMEROON CENTRAL AFRICAN
REPUBLIC
ETHIOPIA
SOMALIA
KENYA UGANDA
EQUATORIAL GUINEA
SAO TOME AND PRINCIPE
S-SUDAN
GABON RWANDA
BURUNDI
TANZANIA
MAURITIUS
COMOROS MAYOTTE
SEYCHELLES
DEM. REP. OF CONGO
ANGOLA
NAMIBIA BOTSWANA
ZAMBIA
MALAWI
ZIMBABWE
MOZAMBIQUE
SOUTH AFRICA
SWAZILAND
LESOTHO
(Fr.)
MAD
AGAS
CAR
CONG
O
THE GAMBIA
Zanzibar
COMOROS
2013
Figure 1: Africa 2013: Scaling up RBF Programs
Service Number Provided Unit Price Total Earned
Child fully vaccinated 100 $5 $500
Skilled birth attendance 20 $10 $200
Curative care <5 years of age 1,000 $0.5 $500
Total $1,200
Remoteness (Equity) Bonus +50% $1,800
Quality correction 60% $1,080
SUMMARY REPORT 25

rBF StreNgtheNS Key health SySteM FuNctioNSAccountability: RBF programs make health systems more accountable by shifting the focus from inputs to results. Linking payments to performance strengthens the governance of the system and allows ongoing monitoring of the results that government and partner resources are ‘buying’. There is strong evidence that linking financing to results produces better outcomes than similar financing without the link to results. Figure 2 shows this effect in health facilities in Zambia.
Efficiency: RBF can be used as an instrument to improve efficiency in the health system. For example, by setting the payments high for services (such as deliveries) performed at health centers, RBF increases efficiency by allowing hospital resources to be used for complicated care. This has been the experience in Zimbabwe (Figure 3). In Rwanda, RBF reduced the gap between provider knowledge and practice
of appropriate clinical procedures by 20 percent, implying a large gain in efficiency3.
Equity: There are multiple channels by which RBF programs can improve equity. Many programs provide remoteness bonus to facilities in the remote areas. In Burundi, program’s investment has allowed remote provinces to catch up with the better off in terms of improving quality of care. As shown in figure 4, the variation across provinces in quality of care becomes narrow over time.
reSultSRBF programs increase quantity and quality of maternal and child health services. Evidence from a randomized trial in Rwanda shows that the RBF program has a positive impact on health outcomes, and quality. The evaluation showed a significant increase in coverage of institutional deliveries and preventive care visits for children in the facilities with performance-based financing as compared to the baseline and the control facilities receiving the same amount of funds but not linked to performance4. Similar results were found in the analysis of operational data5 from several other programs, including Burundi, DRC, Zimbabwe and Zambia. Figure 7 shows an example from Burundi and Zimbabwe, demonstrating a large increase in the number of post-natal care visits compared to the first quarter of the performance-based financing program.
In Rwanda, the impact evaluation showed a significant increase in quality of care in facilities with performance-based financing as compared to control facilities. This finding is very important as it shows that under RBF both quantity of services and quality can improve at the same time. An analysis of operational data from several other countries is showing a promising pattern of improvement in quality scores in RBF facilities. Figure 8 shows the Nigeria example.
The impact evaluation from the Rwanda Performance-based financing program shows the all-important link between the increase in quantity and quality of services and better health for people. It examined the effect of performance incentives for health care providers to provide more and higher quality care in Rwanda on child health outcomes. The incentives had an important and statistically significant effect on the weight-for-age of children aged 0 – 23 months and on the height-for-age of children aged 24 – 49 months.
3 Gertler, P. and C. Vermeersch (2012). Using Performance Incentives to Improve Health Outcomes. Policy Research Working Paper WPS6100. Washington DC, The World Bank
4 Basinga, P., P. Gertler, et al. (2011). “Effect on maternal and child health services in Rwanda of payment to primary health-care providers for performance: an impact evaluation.” The Lancet 377: 1421-1428. Gertler, P. and C. Vermeersch (2012). Using Performance Incentives to Improve Health Outcomes. Policy Research Working Paper WPS6100. Washington DC, The World Bank. Walque, D. d., P. J. Gertler, et al. (2013). Using Provider Performance Incentives to Increase HIV Testing and Counseling Services in Rwanda. Policy Research Working Paper No 6364. Washington DC, The World Bank.
5 The majority of the data except from Rwanda is operational data. Impact evaluations in those countries are ongoing.
Figure 2: Zambia: Increase in coverage of institutional deliveries in districts with performance-based financing and districts with input-based financing
2012
Pure control
Input-based
Output-based
Estim
ated c
overa
ge (%
)
Jan Feb Mar Apr May June Jul Aug Sep Oct Nov Dec0%
2%
4%
6%
8%
10%
12%
14%
Figure 3: Zimbabwe: Increase in number of deliveries at primary care level
20122011
Num
ber o
f Del
iver
s
0
50
100
150
200
250
Jul Aug Sept Oct Nov Dec Jan Feb Mar Apr May Jun Jul Aug
Deliveries in RHCLinear (Deliveries in RHC)
Deliveries in HospitalsLinear (Deliveries in Hospitals)
AfricA HeAltH forum 2013 finAnce And cApAcity for results 2 3
Figure 4: Burundi – Improved Quality Scores over Time and Reduced Variation / Greater Equity
0Sep. 2010
Jun.2010
Dec.2010
Mar.2011
Jun.2011
Sep.2011
Dec.2011
Mar.2012
Jun.2012
20
40
60
80
100
MwaroMuramvya
Kirundo
Cobitoke
Buja-Rural
Kayanza
Karuzi
Muyinga
Ruyigi
Cankuzo
Buja-Mairie
Ngozi
Makamba
Rutana
Bubanza
Bururi
Gitega
41
Figure 7: Percentage increase in number of post-natal care visits compared to the first quarter in Burundi and Zimbabwe
Figure 6: Increase in coverage of services in performance-based financing districts as compared to baseline and control districts (receiving input-based financing)
Figure 5: Increase in Quality of Care in RBF Facilities in Rwanda
Baseline (2006)
Stan
dard
ize P
rena
tal e
ffort
scor
e 15% Standard deviation increase due to PBF
0.1 5
0
-0.10
-0.1
Follow up (2008)-0.15
-0.10
-0.05
0.00
0.05
0.10
0.15
0.20
Control facilites
Treatment (PBF facilities)
0
10
20
30
40
50
60
70
InstitutionalDelivery
Preventive Care0-23 monthd
Preventive Care24-47 months
Baseline Control PBF
-50
0
50
100
150
Perc
ent c
hang
e com
pare
d to
firs
t qua
ter
Q 0+1 Q 0+2 Q 0+3 Q 0+4 Q 0+5 Q 0+6 Q 0+7 Q 0+8
Burundi
Zimbabwe
Figure 8: Overall quality score in health centers and hospitals in Nigeria
2011 2012Dec Mar Jun Sept Dec
Aver
age S
umm
ary H
CQu
ality
Score
20
30
40
50
60
70
80
90
Ada ma wa
2011 2012Dec Mar Jun Sept Dec
Aver
age S
umm
ary H
ospi
tal
Quali
ty Sc
ore
20
30
40
50
60
70
80
NarsarawaAdamawaOndo
AFRICA HEALTH FORUM 2013: FINANCE AND CAPACITY FOR RESULTS26

rBF StreNgtheNS Key health SySteM FuNctioNSAccountability: RBF programs make health systems more accountable by shifting the focus from inputs to results. Linking payments to performance strengthens the governance of the system and allows ongoing monitoring of the results that government and partner resources are ‘buying’. There is strong evidence that linking financing to results produces better outcomes than similar financing without the link to results. Figure 2 shows this effect in health facilities in Zambia.
Efficiency: RBF can be used as an instrument to improve efficiency in the health system. For example, by setting the payments high for services (such as deliveries) performed at health centers, RBF increases efficiency by allowing hospital resources to be used for complicated care. This has been the experience in Zimbabwe (Figure 3). In Rwanda, RBF reduced the gap between provider knowledge and practice
of appropriate clinical procedures by 20 percent, implying a large gain in efficiency3.
Equity: There are multiple channels by which RBF programs can improve equity. Many programs provide remoteness bonus to facilities in the remote areas. In Burundi, program’s investment has allowed remote provinces to catch up with the better off in terms of improving quality of care. As shown in figure 4, the variation across provinces in quality of care becomes narrow over time.
reSultSRBF programs increase quantity and quality of maternal and child health services. Evidence from a randomized trial in Rwanda shows that the RBF program has a positive impact on health outcomes, and quality. The evaluation showed a significant increase in coverage of institutional deliveries and preventive care visits for children in the facilities with performance-based financing as compared to the baseline and the control facilities receiving the same amount of funds but not linked to performance4. Similar results were found in the analysis of operational data5 from several other programs, including Burundi, DRC, Zimbabwe and Zambia. Figure 7 shows an example from Burundi and Zimbabwe, demonstrating a large increase in the number of post-natal care visits compared to the first quarter of the performance-based financing program.
In Rwanda, the impact evaluation showed a significant increase in quality of care in facilities with performance-based financing as compared to control facilities. This finding is very important as it shows that under RBF both quantity of services and quality can improve at the same time. An analysis of operational data from several other countries is showing a promising pattern of improvement in quality scores in RBF facilities. Figure 8 shows the Nigeria example.
The impact evaluation from the Rwanda Performance-based financing program shows the all-important link between the increase in quantity and quality of services and better health for people. It examined the effect of performance incentives for health care providers to provide more and higher quality care in Rwanda on child health outcomes. The incentives had an important and statistically significant effect on the weight-for-age of children aged 0 – 23 months and on the height-for-age of children aged 24 – 49 months.
3 Gertler, P. and C. Vermeersch (2012). Using Performance Incentives to Improve Health Outcomes. Policy Research Working Paper WPS6100. Washington DC, The World Bank
4 Basinga, P., P. Gertler, et al. (2011). “Effect on maternal and child health services in Rwanda of payment to primary health-care providers for performance: an impact evaluation.” The Lancet 377: 1421-1428. Gertler, P. and C. Vermeersch (2012). Using Performance Incentives to Improve Health Outcomes. Policy Research Working Paper WPS6100. Washington DC, The World Bank. Walque, D. d., P. J. Gertler, et al. (2013). Using Provider Performance Incentives to Increase HIV Testing and Counseling Services in Rwanda. Policy Research Working Paper No 6364. Washington DC, The World Bank.
5 The majority of the data except from Rwanda is operational data. Impact evaluations in those countries are ongoing.
Figure 2: Zambia: Increase in coverage of institutional deliveries in districts with performance-based financing and districts with input-based financing
2012
Pure control
Input-based
Output-based
Estim
ated c
overa
ge (%
)
Jan Feb Mar Apr May June Jul Aug Sep Oct Nov Dec0%
2%
4%
6%
8%
10%
12%
14%
Figure 3: Zimbabwe: Increase in number of deliveries at primary care level
20122011
Num
ber o
f Del
iver
s
0
50
100
150
200
250
Jul Aug Sept Oct Nov Dec Jan Feb Mar Apr May Jun Jul Aug
Deliveries in RHCLinear (Deliveries in RHC)
Deliveries in HospitalsLinear (Deliveries in Hospitals)
AfricA HeAltH forum 2013 finAnce And cApAcity for results 2 3
Figure 4: Burundi – Improved Quality Scores over Time and Reduced Variation / Greater Equity
0Sep. 2010
Jun.2010
Dec.2010
Mar.2011
Jun.2011
Sep.2011
Dec.2011
Mar.2012
Jun.2012
20
40
60
80
100
MwaroMuramvya
Kirundo
Cobitoke
Buja-Rural
Kayanza
Karuzi
Muyinga
Ruyigi
Cankuzo
Buja-Mairie
Ngozi
Makamba
Rutana
Bubanza
Bururi
Gitega
41
Figure 7: Percentage increase in number of post-natal care visits compared to the first quarter in Burundi and Zimbabwe
Figure 6: Increase in coverage of services in performance-based financing districts as compared to baseline and control districts (receiving input-based financing)
Figure 5: Increase in Quality of Care in RBF Facilities in Rwanda
Baseline (2006)
Stan
dard
ize P
rena
tal e
ffort
scor
e 15% Standard deviation increase due to PBF
0.1 5
0
-0.10
-0.1
Follow up (2008)-0.15
-0.10
-0.05
0.00
0.05
0.10
0.15
0.20
Control facilites
Treatment (PBF facilities)
0
10
20
30
40
50
60
70
InstitutionalDelivery
Preventive Care0-23 monthd
Preventive Care24-47 months
Baseline Control PBF
-50
0
50
100
150
Perc
ent c
hang
e com
pare
d to
firs
t qua
ter
Q 0+1 Q 0+2 Q 0+3 Q 0+4 Q 0+5 Q 0+6 Q 0+7 Q 0+8
Burundi
Zimbabwe
Figure 8: Overall quality score in health centers and hospitals in Nigeria
2011 2012Dec Mar Jun Sept Dec
Aver
age S
umm
ary H
CQu
ality
Score
20
30
40
50
60
70
80
90
Ada ma wa
2011 2012Dec Mar Jun Sept Dec
Aver
age S
umm
ary H
ospi
tal
Quali
ty Sc
ore
20
30
40
50
60
70
80
NarsarawaAdamawaOndo
SUMMARY REPORT 27

What is Results-Based Financing? Results-Based Financing (RBF) is an instrument that links financing to pre-determined results, with payment made only upon verification that the agreed-upon results have actually been delivered. RBF can help improve both supply- and demand-side performance of health systems striving for Universal Health Coverage. In an RBF program payments are made based on the quantity and quality of health services delivered after verification. (For an example of how RBF can work at a health facility level see the box on page 4). The evidence from a series of countries in Africa indicates that RBF can strengthen core health system functions, increasing the efficiency and accountability of the health system. In many countries the design of RBF programs has included the removal of user fees, thus reducing the financial burden of accessing care.
Results-Based Financing has expanded rapidly in Africa: There are currently 3 countries1 with nationwide programs and 14 countries2 with ongoing pilots. Six countries are in the advanced planning stage and RBF initiatives are being discussed in 9 countries. Based on a country’s specific context and health sector priorities, the World Bank supports the design, implementation and evaluation of RBF programs with financing from the International Development
1 Sierra Leone, Burundi and Rwanda2 Benin, Zimbabwe, Zambia, Burkina Faso, CAR, DRC,
Congo, Kenya, Tanzania, Nigeria, Chad, Cameroon, Malawi, Mozambique
Association (IDA) and the Health Results Innovation Trust Fund. All the programs are accompanied by
rigorous impact evaluations. Figure 1 shows the scale of RBF programs in Africa in 2013.
This brief is a product of the staff of the International Bank for Reconstruction and Development/The World Bank, prepared ahead of Africa Health Forum 2013: Finance and Capacity for Results, an event co-hosted by the World Bank and the U.S. State Department Office of Global Health Diplomacy, in collaboration with Harmonization for Health in Africa. The findings, interpretations, and conclusions expressed in this brief do not necessarily reflect the views of the Executive Directors of the World Bank or the governments they represent, or of any of the hosting entities and partners.
Next StepS Many countries with performance-based financing pilots are exploring ways to scale up and sustain these programs. Based on evidence from evaluations and operational data, policy makers have various opportunities for effectively moving forward the dialogue around RBF in the broader sectoral discussions.
1. Financial Sustainability: In order to ensure longer-term sustainability of RBF, it must be considered part and parcel of a broader and more comprehensive health financing strategy. A few ways in which RBF could be financed in future include: (i) linking future civil servant salary increases to performance (through RBF); or (ii) investing some proportion of the capital budget in making existing facilities function better (through RBF).
2. Integration of RBF into Government Systems: RBF mechanisms and principles need to be integrated into the public health system and government financial system. This has happened in a few countries such as Burundi where the
government is financing 52 percent of the cost of RBF. In a number of other countries, RBF is now a line item in the health budget. This will ensure RBF is aligned with the overall objectives and design of country systems.
3. Harmonizing the Use of Donor Funds: Aligning external funding to support performance-based payments based on results could increase the impact of donor financing. This has been done with funds from the Global Fund, PEPFAR and GAVI. This can be a model for harmonizing other donor funds as well.
Moving forward, the financial sustainability of successful RBF programs needs to be considered as
part of a comprehensive financing strategy for the health sector.
QueStioNS to MiNiSterSn What kind of additional information
would be helpful to you in thinking about the role of RBF in your health system?
n What are the measures you would need to take to integrate the RBF approach in the wider health financing agenda?
n How can institutions like the World Bank and other partners be helpful in this process?
Results-Based Financing for Health
Key MeSSageSn Over the past five years, Results-Based Financing (RBF) for health
has been extensively tested in Africa as a promising approach to work towards Universal Health Coverage.
n RBF approaches are achieving good results; increasing coverage as well as quality of services while targeting resources to vulnerable populations.
n A well-designed RBF program can strengthen core health system functions, increasing value for money and accountability of the health system.
n In many countries the design of RBF programs has included removing user fees, thus improving financial access for essential health services.
Table 1: The effect of performance incentives on child health outcomes in Rwanda — Average Z-scores [0-23 months]
Baseline Control PBF Difference
Ht. for Age 0-23 months -0.03 -0.2 -0.04 0.16
Wt. for Age 0-23 months -0.31 -0.18 0.35 0.53
Ht. for Age 24-47 months -1.95 -1.8 -1.55 0.25
Wt. for Age 24-47 months -0.75 0.69 0.72 0.03
Box 1: How RBF works – A Simplified Example
n Defining a Package of Services: A package of priority services is defined at the national level and an analysis takes place to determine the fees associated with delivering these services. A key element of the design is the separation of functions between the purchaser of the services and the verifier of services.
n Paying for Quantity and Quality: Individual health facilities are provided funds based on the quantity and quality of services they produce. The total amount for volume of services is e adjusted for the remoteness of the facility (equity bonus), as urban or peri-urban facilities could earn a disproportionate amount. The total would also be adjusted by a quality correction based on a checklist administered at the facility every quarter.
Example of Performance Based Financing (PBF) in a Health Facilityn Verification: Before the funds are paid to the health facility, the quantity of services
provided is verified. In addition, an independent organization visits a number of randomly selected patients from the registers in their homes to see whether they received the service listed in the health facility’s register.
n Use of Funds: The funds earned by the health facility can be used for: (i) health facility operational costs, (ii) performance bonus for health workers according to defined criteria; and (iii) savings. The facility has substantial autonomy in how to use the funds but has to keep proper accounts.
National Scale-up (3)
Pilots Ongoing (14)
Advanced Planning (6)
Under Discussion (9)
Impact Evaluation (16)
Africa 2013: Scaling up RBF Programs
MAURITANIA
MALI
GUINEA BISSAU GUINEA
SIERRA LEONE
LIBERIA
CÔTE D’IVOIRE
BURKINA FASO
GHANA
TOGO
BENIN
NIGER CHAD SUDAN ERITREA
Djibouti SENEGAL
NIGERIA
CAMEROON CENTRAL AFRICAN
REPUBLIC
ETHIOPIA
SOMALIA
KENYA UGANDA
EQUATORIAL GUINEA
SAO TOME AND PRINCIPE
S-SUDAN
GABON RWANDA
BURUNDI
TANZANIA
MAURITIUS
COMOROS MAYOTTE
SEYCHELLES
DEM. REP. OF CONGO
ANGOLA
NAMIBIA BOTSWANA
ZAMBIA
MALAWI
ZIMBABWE
MOZAMBIQUE
SOUTH AFRICA
SWAZILAND
LESOTHO
(Fr.)
MAD
AGAS
CAR
CONG
O
THE GAMBIA
Zanzibar
COMOROS
2013
Figure 1: Africa 2013: Scaling up RBF Programs
Service Number Provided Unit Price Total Earned
Child fully vaccinated 100 $5 $500
Skilled birth attendance 20 $10 $200
Curative care <5 years of age 1,000 $0.5 $500
Total $1,200
Remoteness (Equity) Bonus +50% $1,800
Quality correction 60% $1,080
AFRICA HEALTH FORUM 2013: FINANCE AND CAPACITY FOR RESULTS28

This brief is a product of the staff of the International Bank for Reconstruction and Development/The World Bank, prepared ahead of Africa Health Forum 2013: Finance and Capacity for Results, an event co-hosted by the World Bank and the U.S. State Department Office of Global Health Diplomacy, in collaboration with Harmonization for Health in Africa. The findings, interpretations, and conclusions expressed in this brief do not necessarily reflect the views of the Executive Directors of the World Bank or the governments they represent, or of any of the hosting entities and partners.
The objective of this note is to introduce a holistic conceptualization of capacity development and present existing opportunities to improve capacity development efforts in Africa.
Health policy design and implementation for improving health system performance are topics of public debate. New technologies facilitate the flow of information and help inform citizens about the effectiveness of public spending. Successful implementation of health policy requires local knowledge creation and sharing, citizens’ participation, consensus for local ownership and policy support, as well as transparency and accountability for stronger and sustainable implementation.
Strategies to strengthen institutional capacity should not consist exclusively of technical and/or on the job training, and should focus more on how to obtain results on the ground. Practitioners like to learn from peers, need to develop networks or communities of practice to support sustainable knowledge exchange, and seek to build consensus among multiple stakeholders as well as leadership skills to effect change. This new
vision targets various stakeholders for better health systems performance and more value for money invested in health.
Acquiring TechnicAl Knowledge F-2-F Structured Learning on Health Economics and Financing in Africa: With weak institutions and insufficient domestic health financing, African countries rely heavily on external assistance, including from international agencies. National health planning, costing, budgeting, and monitoring and evaluation are some of the areas where international agencies
and donors often assist. As a result, there are multiple methodologies, tools and even parallel systems in the same country; and training carries high opportunity costs for front line staff.
There are only two full-fledged health economics masters’ level courses in Sub-Saharan Africa. The oldest health economics program in the region, providing PhD level training, is the Health Economics Unit at the University of Cape Town, and the most recent is the regional health economics program of the CESAG in Dakar. In addition, the AERC in Kenya provides health economics training as part of its economics
(evidenced by the 2001 Abuja Declaration commitments), funding for and access to essential medicines remain insufficient. WHO estimates that on average, African governments pay 34 to 44 percent more for medicines than necessary and Transparency International estimates that 10 to 25 percent of public procurement spending is lost due to corruption. With limited resources available for essential medicines, it is vital to improve efficiency in order to ensure value for money, and the ability to ‘do more with less’.
Multiple stakeholders working together in Kenya, Tanzania, and Uganda have created vibrant coalitions to improve transparency, accountability and efficiency of pharmaceutical supply management. The Electronic Network of Procurement Practitioners (www.enepp.net) is their online community of practice fostering knowledge exchange and peer-to-peer learning among the coalitions. It provides 350 practitioners from government, private sector, and civil society with access to critical resources such as: data collection tools, country reports, seminal research, webinars and each other.
2. More Value for Money by Improving Transparency in Public Contracts
Open Contracting is a global effort to enhance public disclosure and increase citizen monitoring in all stages of public contracting. WBI,
now joined by seven partners, has convened a diverse group of over 200 stakeholders for collaborative action and collective innovation on this issue. Examples can be found today in 18 countries in Africa in health, education and extractive industries.
3. Open Development Technology Alliance (ODTA)
Better use of technology allows transparency, participation and accountability. ODTA (www.odta.net) is a knowledge platform aiming to give voice to citizens and improve accountability. Governments and policymakers, along with citizens can visualize where resources are allocated, and monitor service delivery. These tools are effective to improve budget planning, evidence-based policy design, efficiency of spending and citizens’ support. There is also potential to help address the health human resources crisis in Africa through ODTA products like citizen reports of absenteeism through mobile phones to reduce medical personnel absenteeism, quality monitoring and geo-mapping of facilities.
ODTA supports five interlinked areas of development:
n Mapping for Results / Open Aid Mapping
n Open Data / Open Government
n Citizen Feedback for Public Service Delivery
n Participatory Decision-Making
n Participatory Monitoring
Examples of application of these tools in Africa are in Ghana, Zambia, Democratic Republic of Congo, Malawi, Uganda, Tanzania and others.
4. Leadership 4 Results
Burundi, Sierra Leone and South Africa are some examples where leadership skills have been strengthened through L4R. National coaches are trained and Rapid Results Methodologies used to improve results. WBI support includes an online course on strategic communication, a web-based Help Desk (www.greaterthanleadership.org) and access to a global alumni network and materials of the “Greater than Leadership” program. One example of results achieved: Burundi increased its rate of detecting HIV among pregnant women from 3 percent to 10 percent in 60 days, and increased the number of provincial sites offering antiretroviral therapy from 74 to 105.
queSTionS To MiniSTerSn Which health skill areas, and
which capacity building approaches, are most important for World Bank and other partner support to African countries?
n From your experience, are there some clear “dos and don’ts” to follow in health capacity building efforts?
Capacity Development for Better Implementation and Results
Key MeSSAgeSn Capacity development goes beyond acquiring technical knowledge
through training and developing training capacity in local institutions. All stakeholders, including public officials, want to learn the “how-to-do” from peers facing similar challenges elsewhere.
n Collaborative action is essential to improve results. It helps build consensus and develop long-lasting technical and leadership skills.
n The information age has changed the way individuals and institutions strengthen their capacity, and provides opportunities to scale up and innovate.
n Combining knowledge and learning, multi-stakeholder collaboration and innovation is a powerful capacity-building strategy to obtain better value from public spending.
2013
SUMMARY REPORT 29

1. Francophone Network of Training Institutions for Population, Reproductive Health and Health Sector Reform (FNTI)
The first regional partnership for the WBI learning Program on Reproductive Health was developed in West Africa. The FNTI helps promote reproductive health in the context of health system strengthening policies, delivers training and creates capacity on reproductive health among decision makers and other key actors implementing policies and programs.
2. The Consortium of Universities for Global Health (CUHG)3
Some academic institutions in Africa already participate in worldwide alliances to improve knowledge in global health. CUHG builds collaboration and exchange of knowledge among interdisciplinary university global health programs working across education, research and service. The following African Universities are active members: Makerere University, Jumma University,
3 See http://www.cugh.org
Addis Ababa University, Kilimanjaro Christian Medical University College, Kwame Nkrumah University of Sciences and Technology, University of Gondar, University of KwaZulu-Natal, University of Mali, University of Nairobi, and University of Namibia.
3. Other African Networks
Regional institutions such as the AU, ECSA and WAHO are becoming important avenues for health policy decision making in Africa and are seeking to strengthen their analytical and research capacities. Other health policy and financing-related networks developing in Africa include the Southern African Equinet network of research, civil society and health sector organizations working towards and influencing equity in health in Southern Africa; APHA, doing advocacy on health policy and financing; and AfHEA, developing capacities in health economics, financing and policy.
PEER-TO-PEER LEARNING: SOUTH-SOUTH KNOwLEDGE ExCHANGE (SSKE)
Public officials and others want to learn from the experiences of others facing similar health system
challenges. A platform for SSKE is available at the World Bank and practitioners can exchange knowledge with peers in other countries, continents and regions.
The Asia & Africa Knowledge Exchange on Health Insurance is a SSKE example. The AfDB, WBI, and Networks in Asia and China facilitate knowledge exchange across continents, with sessions on challenges and practical issues related to design and implementation of health insurance. Experts from China, Ethiopia, Ghana, India, and Rwanda share data, experiences and views. The diversity of experiences and the variety of issues debated include challenges of determining premiums and benefit packages, expanding population coverage, expanding service coverage, developing effective purchasing mechanisms and ensuring equity.
developing cApAciTy To Solve probleMS Africa needs to develop capacity to build consensus as well as to design, lead and monitor the results of change processes. Building multi-stakeholder coalitions and using technology in order to improve transparency, accountability and participation is possible and showing good results. Examples in Africa include:
1. Better Value for Money in Basic Pharmaceuticals: Multi-Stakeholder Coalition Building and the Use of Information & Communication Technology
Despite efforts by African countries to increase health spending
Face-to-Face Courses offered by the World Bank Institute
WBI, the Harvard School of Public Health, and numerous other partners (including the University of Cape Town) developed the Health System Strengthening and Sustainable Financing Flagship Course for policy makers. About 20,000 people have taken it since 1998. It offers a systematic, practical approach to assess the performance of health systems, and think about how to make improvements using five main policy areas—financing, payment, regulation, organization, and behavior change. The Flagship framework has been applied to health system challenges such as pharmaceutical supply management in Africa, Universal Health Coverage, and Non-Communicable Diseases. Regional and national courses have been delivered each year in Africa.
WBI’s Reproductive Health Global Course attracts mostly African participants. It introduces and demystifies concepts of efficiency, cost-effectiveness, costing, financing, benefit-packages, priority-setting, and health system strengthening to improve reproductive health interventions. It has been delivered since 2001 in Africa by the Francophone Training Network of 8 African Universities.
courses, serving students from many African countries.
The World Bank and other development partners—notably WHO, AfDB, GIZ, JICA, and DfID, have various formal and informal training programs to improve capacity in health systems. This note describes only a sample of WB efforts, including World Bank Institute (WBI) global, regional and national courses.
SCALING UP AND ExPLORING NEw FRONTIERS THROUGH E-LEARNING
WBI provides online courses for health professionals, including:
1. Basics of Health Economics, offered 4 times a year, covers efficiency, equity, markets and market failure, financing and risk pooling mechanisms. http://einstitute.worldbank.org/ei/course/basics-health-economics
Figure 1. E-Learning Students by Region
Source: Students Records WBI E-learning Courses in Health
FLagShIp paRtnERS In SEnEgaL anD BEnIn
The Flagship program worked closely with the “Centre Africain d’Etudes Supérieures en Gestion” and “Ecole National d’Economie Appliquée” in Sénégal, and the “Institut Régional de Santé Publique” in Benin to design and co-deliver a variety of Flagship activities for countries of Francophone Africa. Countries requested focused training on public-private partnerships through contracting of health services, health insurance, and hospital reform. In response, with the help of the Flagship Program, the regional partners developed eight learning activities on contracting of health services, for approximately 200 participants from Ministries of Health and NGOs. As a result, Benin, Burkina Faso, Burundi, Madagascar, Mali, Niger and Senegal developed policies on contracting that were formally adopted by the governments of Benin, Burundi, Madagascar, and Senegal. The regional partners also offered “training of trainers” workshops and subsequently held national training events on contracting in Niger, Madagascar, Mali, Morocco and Senegal.
2. Management in Health intended for sub-national health authorities, covers strategic management, organizational behavior, financing, health information technology, strategic communications, and change management. http://einstitute.worldbank.org/ei/course/health-systems-management
3. Reproductive Health: From Advocacy to Action covering equity, targeting, and financing reproductive health activities within health systems strengthening policies. http://einstitute.worldbank.org/ei/course/reproductive-health-advocacy-action
Massive open online courses (MOOCs) offered by Stanford, Harvard, Princeton, M.I.T., Johns Hopkins and others are becoming popular and new platforms are being tested for mass learning. Free MOOCs through companies like Coursera1, Udacity, and EdX could introduce a revolution in global higher education2, with the potential to improve institutional capacity for better design and implementation of public policy.
NETwORKS
Networks enable organizations to showcase their work and connect with each other and with international partners for information sharing and peer learning around development challenges and innovations.
1 Coursera is currently the market leader amongst MOOCs with 2.4 million students taking 214 courses from 33 universities. http://www.ted.com/talks/daphne_koller_what_we_re_learning_from_online_education.html
2 New York Times: Op-Ed by Thomas Friedman, “Revolution Hits the Universities” January 26, 2013 http://nyti.ms/W5DuoN
Other
Middle East and North Africa
Eastern Europe and Central Asia
Latin America and Caribbean
Africa
Asia
53%
19%13%
3%
7%
5%
Other
Middle East and North Africa
Eastern Europe and Central Asia
Latin America and Caribbean
Africa
Asia
53%
19%13%
3%
7%
5%
AfricA HeAltH forum 2013 finAnce And cApAcity for results 2 3AFRICA HEALTH FORUM 2013: FINANCE AND CAPACITY FOR RESULTS30

1. Francophone Network of Training Institutions for Population, Reproductive Health and Health Sector Reform (FNTI)
The first regional partnership for the WBI learning Program on Reproductive Health was developed in West Africa. The FNTI helps promote reproductive health in the context of health system strengthening policies, delivers training and creates capacity on reproductive health among decision makers and other key actors implementing policies and programs.
2. The Consortium of Universities for Global Health (CUHG)3
Some academic institutions in Africa already participate in worldwide alliances to improve knowledge in global health. CUHG builds collaboration and exchange of knowledge among interdisciplinary university global health programs working across education, research and service. The following African Universities are active members: Makerere University, Jumma University,
3 See http://www.cugh.org
Addis Ababa University, Kilimanjaro Christian Medical University College, Kwame Nkrumah University of Sciences and Technology, University of Gondar, University of KwaZulu-Natal, University of Mali, University of Nairobi, and University of Namibia.
3. Other African Networks
Regional institutions such as the AU, ECSA and WAHO are becoming important avenues for health policy decision making in Africa and are seeking to strengthen their analytical and research capacities. Other health policy and financing-related networks developing in Africa include the Southern African Equinet network of research, civil society and health sector organizations working towards and influencing equity in health in Southern Africa; APHA, doing advocacy on health policy and financing; and AfHEA, developing capacities in health economics, financing and policy.
PEER-TO-PEER LEARNING: SOUTH-SOUTH KNOwLEDGE ExCHANGE (SSKE)
Public officials and others want to learn from the experiences of others facing similar health system
challenges. A platform for SSKE is available at the World Bank and practitioners can exchange knowledge with peers in other countries, continents and regions.
The Asia & Africa Knowledge Exchange on Health Insurance is a SSKE example. The AfDB, WBI, and Networks in Asia and China facilitate knowledge exchange across continents, with sessions on challenges and practical issues related to design and implementation of health insurance. Experts from China, Ethiopia, Ghana, India, and Rwanda share data, experiences and views. The diversity of experiences and the variety of issues debated include challenges of determining premiums and benefit packages, expanding population coverage, expanding service coverage, developing effective purchasing mechanisms and ensuring equity.
developing cApAciTy To Solve probleMS Africa needs to develop capacity to build consensus as well as to design, lead and monitor the results of change processes. Building multi-stakeholder coalitions and using technology in order to improve transparency, accountability and participation is possible and showing good results. Examples in Africa include:
1. Better Value for Money in Basic Pharmaceuticals: Multi-Stakeholder Coalition Building and the Use of Information & Communication Technology
Despite efforts by African countries to increase health spending
Face-to-Face Courses offered by the World Bank Institute
WBI, the Harvard School of Public Health, and numerous other partners (including the University of Cape Town) developed the Health System Strengthening and Sustainable Financing Flagship Course for policy makers. About 20,000 people have taken it since 1998. It offers a systematic, practical approach to assess the performance of health systems, and think about how to make improvements using five main policy areas—financing, payment, regulation, organization, and behavior change. The Flagship framework has been applied to health system challenges such as pharmaceutical supply management in Africa, Universal Health Coverage, and Non-Communicable Diseases. Regional and national courses have been delivered each year in Africa.
WBI’s Reproductive Health Global Course attracts mostly African participants. It introduces and demystifies concepts of efficiency, cost-effectiveness, costing, financing, benefit-packages, priority-setting, and health system strengthening to improve reproductive health interventions. It has been delivered since 2001 in Africa by the Francophone Training Network of 8 African Universities.
courses, serving students from many African countries.
The World Bank and other development partners—notably WHO, AfDB, GIZ, JICA, and DfID, have various formal and informal training programs to improve capacity in health systems. This note describes only a sample of WB efforts, including World Bank Institute (WBI) global, regional and national courses.
SCALING UP AND ExPLORING NEw FRONTIERS THROUGH E-LEARNING
WBI provides online courses for health professionals, including:
1. Basics of Health Economics, offered 4 times a year, covers efficiency, equity, markets and market failure, financing and risk pooling mechanisms. http://einstitute.worldbank.org/ei/course/basics-health-economics
Figure 1. E-Learning Students by Region
Source: Students Records WBI E-learning Courses in Health
FLagShIp paRtnERS In SEnEgaL anD BEnIn
The Flagship program worked closely with the “Centre Africain d’Etudes Supérieures en Gestion” and “Ecole National d’Economie Appliquée” in Sénégal, and the “Institut Régional de Santé Publique” in Benin to design and co-deliver a variety of Flagship activities for countries of Francophone Africa. Countries requested focused training on public-private partnerships through contracting of health services, health insurance, and hospital reform. In response, with the help of the Flagship Program, the regional partners developed eight learning activities on contracting of health services, for approximately 200 participants from Ministries of Health and NGOs. As a result, Benin, Burkina Faso, Burundi, Madagascar, Mali, Niger and Senegal developed policies on contracting that were formally adopted by the governments of Benin, Burundi, Madagascar, and Senegal. The regional partners also offered “training of trainers” workshops and subsequently held national training events on contracting in Niger, Madagascar, Mali, Morocco and Senegal.
2. Management in Health intended for sub-national health authorities, covers strategic management, organizational behavior, financing, health information technology, strategic communications, and change management. http://einstitute.worldbank.org/ei/course/health-systems-management
3. Reproductive Health: From Advocacy to Action covering equity, targeting, and financing reproductive health activities within health systems strengthening policies. http://einstitute.worldbank.org/ei/course/reproductive-health-advocacy-action
Massive open online courses (MOOCs) offered by Stanford, Harvard, Princeton, M.I.T., Johns Hopkins and others are becoming popular and new platforms are being tested for mass learning. Free MOOCs through companies like Coursera1, Udacity, and EdX could introduce a revolution in global higher education2, with the potential to improve institutional capacity for better design and implementation of public policy.
NETwORKS
Networks enable organizations to showcase their work and connect with each other and with international partners for information sharing and peer learning around development challenges and innovations.
1 Coursera is currently the market leader amongst MOOCs with 2.4 million students taking 214 courses from 33 universities. http://www.ted.com/talks/daphne_koller_what_we_re_learning_from_online_education.html
2 New York Times: Op-Ed by Thomas Friedman, “Revolution Hits the Universities” January 26, 2013 http://nyti.ms/W5DuoN
Other
Middle East and North Africa
Eastern Europe and Central Asia
Latin America and Caribbean
Africa
Asia
53%
19%13%
3%
7%
5%
Other
Middle East and North Africa
Eastern Europe and Central Asia
Latin America and Caribbean
Africa
Asia
53%
19%13%
3%
7%
5%
AfricA HeAltH forum 2013 finAnce And cApAcity for results 2 3SUMMARY REPORT 31

This brief is a product of the staff of the International Bank for Reconstruction and Development/The World Bank, prepared ahead of Africa Health Forum 2013: Finance and Capacity for Results, an event co-hosted by the World Bank and the U.S. State Department Office of Global Health Diplomacy, in collaboration with Harmonization for Health in Africa. The findings, interpretations, and conclusions expressed in this brief do not necessarily reflect the views of the Executive Directors of the World Bank or the governments they represent, or of any of the hosting entities and partners.
The objective of this note is to introduce a holistic conceptualization of capacity development and present existing opportunities to improve capacity development efforts in Africa.
Health policy design and implementation for improving health system performance are topics of public debate. New technologies facilitate the flow of information and help inform citizens about the effectiveness of public spending. Successful implementation of health policy requires local knowledge creation and sharing, citizens’ participation, consensus for local ownership and policy support, as well as transparency and accountability for stronger and sustainable implementation.
Strategies to strengthen institutional capacity should not consist exclusively of technical and/or on the job training, and should focus more on how to obtain results on the ground. Practitioners like to learn from peers, need to develop networks or communities of practice to support sustainable knowledge exchange, and seek to build consensus among multiple stakeholders as well as leadership skills to effect change. This new
vision targets various stakeholders for better health systems performance and more value for money invested in health.
Acquiring TechnicAl Knowledge F-2-F Structured Learning on Health Economics and Financing in Africa: With weak institutions and insufficient domestic health financing, African countries rely heavily on external assistance, including from international agencies. National health planning, costing, budgeting, and monitoring and evaluation are some of the areas where international agencies
and donors often assist. As a result, there are multiple methodologies, tools and even parallel systems in the same country; and training carries high opportunity costs for front line staff.
There are only two full-fledged health economics masters’ level courses in Sub-Saharan Africa. The oldest health economics program in the region, providing PhD level training, is the Health Economics Unit at the University of Cape Town, and the most recent is the regional health economics program of the CESAG in Dakar. In addition, the AERC in Kenya provides health economics training as part of its economics
(evidenced by the 2001 Abuja Declaration commitments), funding for and access to essential medicines remain insufficient. WHO estimates that on average, African governments pay 34 to 44 percent more for medicines than necessary and Transparency International estimates that 10 to 25 percent of public procurement spending is lost due to corruption. With limited resources available for essential medicines, it is vital to improve efficiency in order to ensure value for money, and the ability to ‘do more with less’.
Multiple stakeholders working together in Kenya, Tanzania, and Uganda have created vibrant coalitions to improve transparency, accountability and efficiency of pharmaceutical supply management. The Electronic Network of Procurement Practitioners (www.enepp.net) is their online community of practice fostering knowledge exchange and peer-to-peer learning among the coalitions. It provides 350 practitioners from government, private sector, and civil society with access to critical resources such as: data collection tools, country reports, seminal research, webinars and each other.
2. More Value for Money by Improving Transparency in Public Contracts
Open Contracting is a global effort to enhance public disclosure and increase citizen monitoring in all stages of public contracting. WBI,
now joined by seven partners, has convened a diverse group of over 200 stakeholders for collaborative action and collective innovation on this issue. Examples can be found today in 18 countries in Africa in health, education and extractive industries.
3. Open Development Technology Alliance (ODTA)
Better use of technology allows transparency, participation and accountability. ODTA (www.odta.net) is a knowledge platform aiming to give voice to citizens and improve accountability. Governments and policymakers, along with citizens can visualize where resources are allocated, and monitor service delivery. These tools are effective to improve budget planning, evidence-based policy design, efficiency of spending and citizens’ support. There is also potential to help address the health human resources crisis in Africa through ODTA products like citizen reports of absenteeism through mobile phones to reduce medical personnel absenteeism, quality monitoring and geo-mapping of facilities.
ODTA supports five interlinked areas of development:
n Mapping for Results / Open Aid Mapping
n Open Data / Open Government
n Citizen Feedback for Public Service Delivery
n Participatory Decision-Making
n Participatory Monitoring
Examples of application of these tools in Africa are in Ghana, Zambia, Democratic Republic of Congo, Malawi, Uganda, Tanzania and others.
4. Leadership 4 Results
Burundi, Sierra Leone and South Africa are some examples where leadership skills have been strengthened through L4R. National coaches are trained and Rapid Results Methodologies used to improve results. WBI support includes an online course on strategic communication, a web-based Help Desk (www.greaterthanleadership.org) and access to a global alumni network and materials of the “Greater than Leadership” program. One example of results achieved: Burundi increased its rate of detecting HIV among pregnant women from 3 percent to 10 percent in 60 days, and increased the number of provincial sites offering antiretroviral therapy from 74 to 105.
queSTionS To MiniSTerSn Which health skill areas, and
which capacity building approaches, are most important for World Bank and other partner support to African countries?
n From your experience, are there some clear “dos and don’ts” to follow in health capacity building efforts?
Capacity Development for Better Implementation and Results
Key MeSSAgeSn Capacity development goes beyond acquiring technical knowledge
through training and developing training capacity in local institutions. All stakeholders, including public officials, want to learn the “how-to-do” from peers facing similar challenges elsewhere.
n Collaborative action is essential to improve results. It helps build consensus and develop long-lasting technical and leadership skills.
n The information age has changed the way individuals and institutions strengthen their capacity, and provides opportunities to scale up and innovate.
n Combining knowledge and learning, multi-stakeholder collaboration and innovation is a powerful capacity-building strategy to obtain better value from public spending.
2013
AFRICA HEALTH FORUM 2013: FINANCE AND CAPACITY FOR RESULTS32

This brief is a product of the staff of the World Bank Group, prepared ahead of Africa Health Forum 2013: Finance and Capacity for Results, an event co-hosted by the World Bank and the U.S. State Department Office of Global Health Diplomacy, in collaboration with Harmonization for Health in Africa. The findings, interpretations, and conclusions expressed in this brief do not necessarily reflect the views of the Executive Directors of the World Bank or the governments they represent, or of any of the hosting entities and partners.
Motivations for HealtH PPPs Governments everywhere are grappling with rising healthcare costs and increased demand for healthcare services in the face of ongoing budget constraints. As governments struggle to stretch their healthcare funding and produce better results, many are increasingly turning to PPPs with the private sector. There are four key factors driving governments worldwide to use the PPP model for health sector improvements:
n Desire to improve operation of public health services and facilities and to expand access to higher quality services
n Opportunity to leverage private investment for the benefit of public services
n Desire to formalize arrangements with non-profit partners who deliver an important share of public services
n More potential partners for governments as private healthcare sector matures
The potential benefits of public funding and private delivery of health facilities and services are well-known, but the path from publicly-run hospitals to publicly-funded and privately-provided hospital services is not so well-known and can be challenging.
Defining Public Private PartnersHiPs The terms used to describe these PPP arrangements can vary across countries, legal systems, and disciplines – PPPs may be called “administrative concessions” in Spain, “hospital conversions” in Australia, “social organization” in Brazil and “social mobilization” in Vietnam. In Africa, there are projects for “co-location”, “public private partnerships” and “PPPs”.
What PPPS are… Initiatives that establish a contract between a public agency and a private entity (for- profit or not-for-profit) for the provision of services, facilities and/or equipment. A PPP exists when members of the public sector, such as federal, state, and/or local officials and agencies, join with
members of the private sector, for example: service providers, employers, philanthropies, media, civic groups, families and other service providers, in pursuit of a common vision and goals. In equal partnerships, all of the partners bring resources to the table, contribute to the development and implementation of the project, and benefit from its results.
What PPPS are not… PPPs do not involve divestiture or getting the public sector out of providing services. PPPs are not privatization! For example, when the Republic of Georgia decided it had too many hospitals for its needs, the master plan called for one third to remain “as is” (public infrastructure and government service provision), one third to be privatized (sold to private sector, no agreement for funding or to continue hospital
Questions to Ministersn What could development partners do differently to assist you in developing PPPs?
n What do you need in terms of capacity building assistance to increase your activity in health PPPs?
Case 5: sao Paulo (brazil) hospitalsn Sao Paolo State Government
financed, built and equipped 16 new hospitals under traditional public works contracts.
n The state was not able to complete and operate all the hospitals, so contracted with not-for-profit hospital operators to manage the hospitals (including all clinical and non-clinical services).
n The contract obliges the operator to treat all local residents.
n The hospital operator receives global fixed budget from the Sao Paolo State Government, provided specified patient volume and quality parameters are achieved.
n Government also provides capital expenditure reimbursement, within set parameters.
Results: to date, it appears that through these contracts, Government provides higher quality services for the same cost as public provision.
Case 6: Queen ‘Mamohato Memorial Hospital and clinics PPP (lesotho)n The Government of Lesotho
had steadily increased spending for its aging national referral hospital, Queen Elizabeth II, yet services, facilities and equipment continued to decline.
n In 2009, Government tendered for a PPP health network, fully replacing the hospital and refurbishing and expanding a network of primary care clinics to improve services to the capital city of Maseru.
n The winning bidder, Tsepong, designed and built the hospital and provides all clinical and non-clinical services. Tsepong is a consortium comprising local and regional Basotho doctors, investors and service providers, led by Netcare, a healthcare provider based in South Africa.
n The PPP agreement is very detailed, with a pre-agreed set of payments based on services and performance, including.
performance measures, monitoring and accreditation requirements.
Results: the clinics opened in 2010 and the new Queen ‘Mamohato Memorial Hospital in 2011. Facilities and service quality have dramatically improved, with neonatal mortality cut in half.
Public Private Partnerships for Health: PPPs are Here and Growing
Key Messagesn Health PPPs are becoming more popular globally, but are not a new
or just a passing fashion. Health services and facilities have been delivered under public-private collaborative arrangements in many well-performing health systems around the world for many years.
n The term PPP is widespread but often misunderstood, leading to misunderstandings amongst government, the general public and potential partners.
n This note provides a snapshot of PPPs for health, together with definitions, examples and brief case summaries selected to stimulate thought and discussion on the use of health PPPs in Africa.
2013
SUMMARY REPORT 33

Case 2: Performance based financing (Pbf) to improve Health sector results
n PBF programs, being tested now in South Asia and Sub-Saharan Africa, provide for direct payments to health facilities contracting with government based on the quantity and quality of services delivered.
n Quality and quantity of services is generally monitored, with strict verifications procedures established.
n Participating facilities may include faith-based mission hospitals and clinics, NGOs and fully private entities.
n PBFs may include performance bonuses for reaching or surpassing specific goals, but often do not cover the full cost of services, requiring governments to assume provision of many inputs (e.g. salaries, equipment and some drugs).
Results: PBF programs can deliver big improvements - in Haiti immunization rates rose from 34% (2000) to 100% (2005). In Afghanistan, contracted facilities demonstrated an 18% rise in both the quality and quantity of care in the two years under study.
services, may be converted or knocked down); and one third PPP (contracted to private operators for delivery of hospital services
with funding from the social health insurer). Only a third of the services could therefore be considered public private partnerships.
The following table provides clear references for the types of public private partnerships seen in the health sector.
CAsesThe following two cases illustrate models of health systems strengthening through local workforce development and research. One represents an established non-governmental program with a history of growth and change, while the other presents the plan of a recently launched public-sector program with great promise for national transformation.
Case 3: riders for Health (the gambia)
n Reliable transport is one critical success factor to health care delivery, affecting many key inputs including health workers, ambulances, supply stock outs and lab services.
n The Gambia partnered with Riders for Health, a not-for-profit, to provide transport management and, eventually, full fleet management for all trucks, cars, motorcycles and ambulances.
n The contract is based on an agreed cost per kilometer, covers “last mile” space, and includes provisions for preventative maintenance and training for the 100% local staff. Contracts may also include vehicle leasing for renewal.
n Capital funding, when required, was provided through local and regional banks.
Results: In the Gambia, the Ministry of Health’s partnership with Riders produced a highly reliable and cost effective national health transport network. to date, the fleet has experienced only two negligent breakdowns in over 7 million kilometers travelled. similar pilot projects are underway in Nigeria, DRC, Zimbabwe, lesotho, and Zambia.
Case 1: african Programme for onchocerciasis control (aPoc: the “riverblindness Programme”)
n 28 countries form a partnership with a pharmaceutical company (Merck) and 30+ development partners.
n Merck provides treatment free (“as much as necessary for as long as necessary”) and funds the system for delivering treatment to the countries.
n Countries allocate resources for free delivery to the population at risk, using national health systems, with additional financial support from development partners.
n People at risk receive treatment free at the point of delivery through the public community health system, and public good
accrues because areas which were previously infectious become safe for public access.
Results: 95 million people a year in 28 countries receive treatment, and 25M hectares of arable land are brought back into use, enough to feed 17 million people.
Case 4: food fortification (salt iodization)
n Food fortification can reduce potentially damaging micronutrient deficiencies. Salt iodization prevents iodine deficiency, which causes large IQ deficits among children, mental retardation, still-births and other effects.
n Successful food fortification programs depend on PPPs. Between 1993 and 2005 China increased iodized salt production form 3.3 million tons to 8 million tons per year, and today over 96% of the salt is iodized.
n Introduction of legislation in 1993, high level government commitment, and a strong partnership with the salt industry led to these dramatic results.
n Globally, over 70% of the salt is iodized and 84 million young brains are protected; but, nearly 38 million children are still born unprotected from Iodine Deficiency Disorders (IDDs), one third of them in Africa. There is also re-emergence of IDDs in industrialized nations.
Results: PPPs for food fortification can be a highly cost effective intervention, widely accepted by the public, private industry and civil society. successful results, however, require an integrated, sustained program of shared responsibility that includes policies, standards and monitoring to produce effective results. Many countries in Africa like Burundi, Kenya, lesotho, Rwanda, swaziland and Zimbabwe have also achieved universal salt iodization using similar strategies.
Defining Categories of Public Private Partnerships
Category Private sector responsibility Public sector responsibility Examples
Public Health Services PPP
· Manages services under contract with government or public insurance fund
· May provide clinical and nonclinical services· May provide commodities, especially
pharmaceuticals, at concessionary rates· May employ staff and/or also be responsible for
new capital investment, depending on contract
· Contracts or otherwise forms a partnership with a private sector entity for the provision of public services
· Pays private operator for services provided, and monitors and regulates services and contract compliance
· Partnership may include development partners
African Programme for Onchocerciasis Control (“Riverblindness”)
Performance-Based Financing (PBF)
Riders for Health (Transport)
Food Fortification (Salt Iodization)
Hospital Services PPP
· Manages public hospital under contract with government or public insurance fund
· Provides clinical and nonclinical services· May employ all staff and/or be responsible for
new capital investment, depending on contract
· Contracts with private firm for provision of public hospital services
· Pays private operator for services provided, and monitors and regulates services and contract compliance
· Partnership may include development partners
Brazil: Sao Paulo Hospitals
Facilities-finance PPP
· Finances, constructs, and owns new public hospital and leases it back to government
· Manages hospital and makes phased lease payments to private developer
United Kingdom: Private Finance Initiative
Combined Facilities and Services PPP
· Finances, constructs, and operates new public hospital and provides nonclinical or clinical services, or both
· Reimburses operator for capital and recurrent costs for services provided; provides relevant public premises (e.g. land; building)
Lesotho: Queen’Mamohato Memorial Hospital and Clinics
Co-location PPP · Operates private wing or department· Fulfills agreed payment and service access
conditions; appropriately maintains public land or building used
· Manages public hospital for public patients Manages relationship with private unit (e.g. sharing joint costs, staff, and equipment)
· Supervises fulfillment of patient access and other conditions
South Africa: Pelonomi & Universitas Hospitals
AfricA HeAltH forum 2013 finAnce And cApAcity for results 2 3AFRICA HEALTH FORUM 2013: FINANCE AND CAPACITY FOR RESULTS34

Case 2: Performance based financing (Pbf) to improve Health sector results
n PBF programs, being tested now in South Asia and Sub-Saharan Africa, provide for direct payments to health facilities contracting with government based on the quantity and quality of services delivered.
n Quality and quantity of services is generally monitored, with strict verifications procedures established.
n Participating facilities may include faith-based mission hospitals and clinics, NGOs and fully private entities.
n PBFs may include performance bonuses for reaching or surpassing specific goals, but often do not cover the full cost of services, requiring governments to assume provision of many inputs (e.g. salaries, equipment and some drugs).
Results: PBF programs can deliver big improvements - in Haiti immunization rates rose from 34% (2000) to 100% (2005). In Afghanistan, contracted facilities demonstrated an 18% rise in both the quality and quantity of care in the two years under study.
services, may be converted or knocked down); and one third PPP (contracted to private operators for delivery of hospital services
with funding from the social health insurer). Only a third of the services could therefore be considered public private partnerships.
The following table provides clear references for the types of public private partnerships seen in the health sector.
CAsesThe following two cases illustrate models of health systems strengthening through local workforce development and research. One represents an established non-governmental program with a history of growth and change, while the other presents the plan of a recently launched public-sector program with great promise for national transformation.
Case 3: riders for Health (the gambia)
n Reliable transport is one critical success factor to health care delivery, affecting many key inputs including health workers, ambulances, supply stock outs and lab services.
n The Gambia partnered with Riders for Health, a not-for-profit, to provide transport management and, eventually, full fleet management for all trucks, cars, motorcycles and ambulances.
n The contract is based on an agreed cost per kilometer, covers “last mile” space, and includes provisions for preventative maintenance and training for the 100% local staff. Contracts may also include vehicle leasing for renewal.
n Capital funding, when required, was provided through local and regional banks.
Results: In the Gambia, the Ministry of Health’s partnership with Riders produced a highly reliable and cost effective national health transport network. to date, the fleet has experienced only two negligent breakdowns in over 7 million kilometers travelled. similar pilot projects are underway in Nigeria, DRC, Zimbabwe, lesotho, and Zambia.
Case 1: african Programme for onchocerciasis control (aPoc: the “riverblindness Programme”)
n 28 countries form a partnership with a pharmaceutical company (Merck) and 30+ development partners.
n Merck provides treatment free (“as much as necessary for as long as necessary”) and funds the system for delivering treatment to the countries.
n Countries allocate resources for free delivery to the population at risk, using national health systems, with additional financial support from development partners.
n People at risk receive treatment free at the point of delivery through the public community health system, and public good
accrues because areas which were previously infectious become safe for public access.
Results: 95 million people a year in 28 countries receive treatment, and 25M hectares of arable land are brought back into use, enough to feed 17 million people.
Case 4: food fortification (salt iodization)
n Food fortification can reduce potentially damaging micronutrient deficiencies. Salt iodization prevents iodine deficiency, which causes large IQ deficits among children, mental retardation, still-births and other effects.
n Successful food fortification programs depend on PPPs. Between 1993 and 2005 China increased iodized salt production form 3.3 million tons to 8 million tons per year, and today over 96% of the salt is iodized.
n Introduction of legislation in 1993, high level government commitment, and a strong partnership with the salt industry led to these dramatic results.
n Globally, over 70% of the salt is iodized and 84 million young brains are protected; but, nearly 38 million children are still born unprotected from Iodine Deficiency Disorders (IDDs), one third of them in Africa. There is also re-emergence of IDDs in industrialized nations.
Results: PPPs for food fortification can be a highly cost effective intervention, widely accepted by the public, private industry and civil society. successful results, however, require an integrated, sustained program of shared responsibility that includes policies, standards and monitoring to produce effective results. Many countries in Africa like Burundi, Kenya, lesotho, Rwanda, swaziland and Zimbabwe have also achieved universal salt iodization using similar strategies.
Defining Categories of Public Private Partnerships
Category Private sector responsibility Public sector responsibility Examples
Public Health Services PPP
· Manages services under contract with government or public insurance fund
· May provide clinical and nonclinical services· May provide commodities, especially
pharmaceuticals, at concessionary rates· May employ staff and/or also be responsible for
new capital investment, depending on contract
· Contracts or otherwise forms a partnership with a private sector entity for the provision of public services
· Pays private operator for services provided, and monitors and regulates services and contract compliance
· Partnership may include development partners
African Programme for Onchocerciasis Control (“Riverblindness”)
Performance-Based Financing (PBF)
Riders for Health (Transport)
Food Fortification (Salt Iodization)
Hospital Services PPP
· Manages public hospital under contract with government or public insurance fund
· Provides clinical and nonclinical services· May employ all staff and/or be responsible for
new capital investment, depending on contract
· Contracts with private firm for provision of public hospital services
· Pays private operator for services provided, and monitors and regulates services and contract compliance
· Partnership may include development partners
Brazil: Sao Paulo Hospitals
Facilities-finance PPP
· Finances, constructs, and owns new public hospital and leases it back to government
· Manages hospital and makes phased lease payments to private developer
United Kingdom: Private Finance Initiative
Combined Facilities and Services PPP
· Finances, constructs, and operates new public hospital and provides nonclinical or clinical services, or both
· Reimburses operator for capital and recurrent costs for services provided; provides relevant public premises (e.g. land; building)
Lesotho: Queen’Mamohato Memorial Hospital and Clinics
Co-location PPP · Operates private wing or department· Fulfills agreed payment and service access
conditions; appropriately maintains public land or building used
· Manages public hospital for public patients Manages relationship with private unit (e.g. sharing joint costs, staff, and equipment)
· Supervises fulfillment of patient access and other conditions
South Africa: Pelonomi & Universitas Hospitals
AfricA HeAltH forum 2013 finAnce And cApAcity for results 2 3SUMMARY REPORT 35

This brief is a product of the staff of the World Bank Group, prepared ahead of Africa Health Forum 2013: Finance and Capacity for Results, an event co-hosted by the World Bank and the U.S. State Department Office of Global Health Diplomacy, in collaboration with Harmonization for Health in Africa. The findings, interpretations, and conclusions expressed in this brief do not necessarily reflect the views of the Executive Directors of the World Bank or the governments they represent, or of any of the hosting entities and partners.
Motivations for HealtH PPPs Governments everywhere are grappling with rising healthcare costs and increased demand for healthcare services in the face of ongoing budget constraints. As governments struggle to stretch their healthcare funding and produce better results, many are increasingly turning to PPPs with the private sector. There are four key factors driving governments worldwide to use the PPP model for health sector improvements:
n Desire to improve operation of public health services and facilities and to expand access to higher quality services
n Opportunity to leverage private investment for the benefit of public services
n Desire to formalize arrangements with non-profit partners who deliver an important share of public services
n More potential partners for governments as private healthcare sector matures
The potential benefits of public funding and private delivery of health facilities and services are well-known, but the path from publicly-run hospitals to publicly-funded and privately-provided hospital services is not so well-known and can be challenging.
Defining Public Private PartnersHiPs The terms used to describe these PPP arrangements can vary across countries, legal systems, and disciplines – PPPs may be called “administrative concessions” in Spain, “hospital conversions” in Australia, “social organization” in Brazil and “social mobilization” in Vietnam. In Africa, there are projects for “co-location”, “public private partnerships” and “PPPs”.
What PPPS are… Initiatives that establish a contract between a public agency and a private entity (for- profit or not-for-profit) for the provision of services, facilities and/or equipment. A PPP exists when members of the public sector, such as federal, state, and/or local officials and agencies, join with
members of the private sector, for example: service providers, employers, philanthropies, media, civic groups, families and other service providers, in pursuit of a common vision and goals. In equal partnerships, all of the partners bring resources to the table, contribute to the development and implementation of the project, and benefit from its results.
What PPPS are not… PPPs do not involve divestiture or getting the public sector out of providing services. PPPs are not privatization! For example, when the Republic of Georgia decided it had too many hospitals for its needs, the master plan called for one third to remain “as is” (public infrastructure and government service provision), one third to be privatized (sold to private sector, no agreement for funding or to continue hospital
Questions to Ministersn What could development partners do differently to assist you in developing PPPs?
n What do you need in terms of capacity building assistance to increase your activity in health PPPs?
Case 5: sao Paulo (brazil) hospitalsn Sao Paolo State Government
financed, built and equipped 16 new hospitals under traditional public works contracts.
n The state was not able to complete and operate all the hospitals, so contracted with not-for-profit hospital operators to manage the hospitals (including all clinical and non-clinical services).
n The contract obliges the operator to treat all local residents.
n The hospital operator receives global fixed budget from the Sao Paolo State Government, provided specified patient volume and quality parameters are achieved.
n Government also provides capital expenditure reimbursement, within set parameters.
Results: to date, it appears that through these contracts, Government provides higher quality services for the same cost as public provision.
Case 6: Queen ‘Mamohato Memorial Hospital and clinics PPP (lesotho)n The Government of Lesotho
had steadily increased spending for its aging national referral hospital, Queen Elizabeth II, yet services, facilities and equipment continued to decline.
n In 2009, Government tendered for a PPP health network, fully replacing the hospital and refurbishing and expanding a network of primary care clinics to improve services to the capital city of Maseru.
n The winning bidder, Tsepong, designed and built the hospital and provides all clinical and non-clinical services. Tsepong is a consortium comprising local and regional Basotho doctors, investors and service providers, led by Netcare, a healthcare provider based in South Africa.
n The PPP agreement is very detailed, with a pre-agreed set of payments based on services and performance, including.
performance measures, monitoring and accreditation requirements.
Results: the clinics opened in 2010 and the new Queen ‘Mamohato Memorial Hospital in 2011. Facilities and service quality have dramatically improved, with neonatal mortality cut in half.
Public Private Partnerships for Health: PPPs are Here and Growing
Key Messagesn Health PPPs are becoming more popular globally, but are not a new
or just a passing fashion. Health services and facilities have been delivered under public-private collaborative arrangements in many well-performing health systems around the world for many years.
n The term PPP is widespread but often misunderstood, leading to misunderstandings amongst government, the general public and potential partners.
n This note provides a snapshot of PPPs for health, together with definitions, examples and brief case summaries selected to stimulate thought and discussion on the use of health PPPs in Africa.
2013
AFRICA HEALTH FORUM 2013: FINANCE AND CAPACITY FOR RESULTS36

This brief is a product of the staff of the International Bank for Reconstruction and Development/The World Bank, prepared ahead of Africa Health Forum 2013: Finance and Capacity for Results, an event co-hosted by the World Bank and the U.S. State Department Office of Global Health Diplomacy, in collaboration with Harmonization for Health in Africa. The findings, interpretations, and conclusions expressed in this brief do not necessarily reflect the views of the Executive Directors of the World Bank or the governments they represent, or of any of the hosting entities and partners.
Recent developments—from a leveling out of resources for health to a greater emphasis on value for money and accountability for results—underscore the need for more and better information on the effectiveness of current health spending. Reducing inefficiencies in the use of existing resources is also important to those advocating for more resources, as inefficiencies will detract from returns to any additional resources for health. This makes achieving and demonstrating value for money more important than ever. In addressing information needs for improving value for money, a first step is to focus on value—interpreted as improved quality and performance of health service delivery; value for money will follow.1
Trends in Resources Available for Health: Governments are the largest source of health spending in developing countries. In 2010 aggregate government spending on health in Africa was estimated at 3.5 times higher than total development assistance for health in Africa.2 After experiencing vast increases in the 1990s–2000s, government health spending has now stagnated in 20 African countries. Given the uncertain economic climate facing developing and developed countries alike, it is unlikely that past increases in government and
aid spending will be repeated.3 In recent years there have been highly visible calls for improved value for money for health spending, most recently the Tunis Declaration on Value for Money.4
Linking Financing to Results: This is a trend that is on the rise in Africa at multiple levels. Examples range from changes in the way officials are rewarded (e.g. performance-based contracting of senior officials; performance-based financing of health facility staff ) to the way governments or partners finance sectoral programs (e.g. performance-linked agreements between ministries of finance and
sectoral ministries; cash-on-delivery aid; the World Bank’s Program-for-Results financing instrument).
Calls for Improved Accountability: The MDGs are a strong example of accountability for government effectiveness. Central to the success of the race to the MDGs is that it made governments’ performance targets public and performance was tracked in the public domain by non-experts. An initiative aimed specifically at tracking progress on the health-related MDGs is the Commission on Information and Accountability5 for Women’s and Children’s Health.
InformatIon Is not an end In Itself…Information can both inform and spur action, or quoting Goethe: “Knowing is not enough, we must apply. Willing is not enough, we must do.” There has been much action toward improving quality and effectiveness. Quality requires knowing what to do. This is very effectively done by WHO and others through the establishment of clinical guidelines and the implementation of checklists.9 Reviews of the health service delivery literature have repeatedly concluded that success requires continuous monitoring and adaptation during implementation.10
In management, this is called “Learning from failure”. Closely linked is the notion that without the correct information we are doomed
to repeat failures. The information and communications technology revolution holds tremendous promise to accelerate our ability to learn from both positive and negative experiences. On this topic, World Bank Group President Jim Kim blogged: “I’m convinced that revolutionary advances in communications and information processing, when linked to an enlightened approach to failure, can help transform our pursuit of ability to achieve development results, even in the poorest countries.”11
Finally, in a critique of some development policy practitioners (including the World Bank), Bill Easterly made the distinction between “Planners” and “Searchers”.
A key difference is how they use information—planners use
information to devise more detailed plans, and searchers use information to track performance and do mid-course corrections. While good plans rest on good information, tracking implementation is arguably of even greater importance.
QuestIons to mInIstersn To Ministers of Finance: In your
experience, what information or type of analysis has provided the most compelling and credible arguments about value for money of health spending?
n To Ministers of Health: How do you think improved information and analysis could contribute to efforts to improve the quality of service delivery?
Information to Improve Value for Money in Health
Key messagesn A recent leveling out of resources for health, alongside highly
visible calls for greater results and accountability, underscores the need for information on value for money in health spending.
n While there has been significant progress in health data quality, including better expenditure and health outcome data, important gaps remain in the quality, timeliness, and comparability of data. There is also too little timely data on service delivery and insufficient information for accountability.
n Impact evaluation has expanded the information base on service delivery, but routine program monitoring data remains weak— a potential missed opportunity.
n Financing is increasingly linked to results. When information is used to reward performance or quality, data credibility and methodological rigor are essential.
n Information can both inform and spur action; learning from failure is critical, as is adaptation of implementation as informed by this learning process.
2013
1 Deming contended that quality tends to increase and costs fall over time when people and organizations focus primarily on quality,
defined by the ratio: Quality =
Results of work effortsTotal costs . However, when people and organizations focus primarily on costs, costs tend to rise and quality
declines over time. http://en.wikipedia.org/wiki/W._Edwards_Deming.
2 Institute for Health Metrics and Evaluation. 2010. Financing Global Health 2009: Tracking Development Assistance for Health. University of Washington, Seattle, WA.
3 The 2012 report on health expenditure trends has the sub-title “The End of a Golden Era” referring to the likely slowing of increases in future health spending.
4 “Tunis Declaration on Value, Sustainability and Accountability in the Health Sector: A Joint Declaration by the Ministers of Finance and Ministers of Health of Africa”, African Development Bank, July 2012.
5 In 2011 the UN convened the high-level Commission on Information and Accountability for Women’s and Children’s Health to make countries and their partners accountable for delivery against the Global Strategy for Women’s and Children’s Health Strategy. The Commission proposed a framework for global reporting, oversight and accountability. The framework included (i) measures to track flow of resources; and (ii) identification of key indicators to track results. (WHO. 2011. Keeping Promises, Measuring Results. Commission on Information and Accountability for Women’s and Children’s Health).
6 Lim SS, Stein DB, Charrow A, Murray CJL. Tracking progress towards universal childhood immunisation and the impact of global initiatives: a systematic analysis of three-dose diphtheria, tetanus, and pertussis immunisation coverage. Lancet 2008.
7 As of November 2011, there are close to 390 datasets that have been uploaded to the KODI site, with a plan currently in place to upload more data over the next year. There have been over 17,000 page views and over 2,500 datasets downloaded and embedded to various websites and portals. https://opendata.go.ke/.
8 Galasso E., and Yau, J. 2006. “Learning Through Monitoring: Lessons from a Large-Scale Nutrition Program in Madagascar”, World Bank Policy Research Working Paper, Paper No. 4058, Washington, DC.
9 A key finding from the literature is that the use of job aids, printed cards and checklists accounted for much of the variation in the quality of obstetric care. See Adeyi, O. and R. Morrow (1997). “Essential obstetric care: assessment and determinants of quality.” Social Science and Medicine 45(11): 1631-9. Most recently, the merits of checklists (in health care settings and everyday life) received huge much media coverage following Atul Gawande’s book: “The Checklist Manifesto: How to Get Things Right”.
10 Peters D.H., El-Saharty S., Siadat B., Janovsky K., and Vujicic M. (Eds) Improving Health Service Delivery in Developing Countries: From Evidence to Action, Directions in Development series, 2009. World Bank, Washington DC.
11 Kim, 2012. “Big Idea 2013: Learning Fast From Failure” LinkedIn Blog. http://www.linkedin.com/today/post/article/20121211162106-32702694-big-idea-2013-learning-fast-from-failure.
SUMMARY REPORT 37

But as impact evaluation designs grow more sophisticated and surveys more detailed, routine program monitoring systems remain weak and underfunded. Yet the latter continue to be important. There have been some positive examples of using programmatic or monitoring information to understand impact evaluation findings.8 Better program information can also address an often-voiced criticism of impact evaluation, which is that it fails to look into the “black box” of service delivery. It would be a huge missed opportunity if the evaluation expertise and resources of impact evaluations are not applied equally to the monitoring and evaluation needs of a program or project. Results-based financing for health is an example of a large multi-country effort where impact evaluation has been applied alongside efforts to improve information systems for monitoring implementation.
servIce delIvery data: crItIcal to assess effIcIency and value for moneyOne of the gaps identified earlier is the lack of standardized information on the production of services in health centers and hospitals that can be used to assess their technical efficiency. This is critical to assess value for money and examine why health expenditures do not translate into optimal quality services. Figure 1 shows how information from the “black box” of service delivery can identify areas in
the service delivery chain where value for money can be improved. In addition to tracking the availability of critical inputs, the choice of service delivery indicators must reflect the understanding that the quality of health services is critically dependent on what health workers know (i.e. knowledge and competence) and what they do (i.e. provider effort).
do our data meet the current challenges?There have been significant improvements in certain types of information. For example, the availability and quality of expenditure data has improved over recent years. While important gaps remain, governments and international agencies (notably WHO and the Institute for Health Metrics and Evaluation) produce annual reports on government and donor health spending. Comparable cross-country data on health outcomes have progressively improved through better disease surveillance systems and household surveys. In fact, the Demographic and Health Surveys have become the gold standard for measurement of health indicators including infant mortality, under-five mortality, and fertility, among others. Despite these improvements, some challenges remain:
n Data quality and third-party verification. Over the past few decades we have seen vast investments in health management information systems (MIS). When information is used to reward performance or quality, self-reported MIS data often lack credibility and methodological rigor. For example, vast differences in estimates of immunization coverage from MIS and survey data have raised serious questions about the use of MIS data as evidence for performance-based reimbursements.6
n Time dimensionality of data. Data are only useful if available for analysis and use within the timeframe required for decision-
making. Some decisions are made quarterly, some annually. Whether the data source is an MIS or a survey, it is only valuable if it is available to decision-makers on time.
n Comparability of data and repetition of surveys. Lots of data are collected through various once-off surveys. However, the full returns to the investment are realized only when a repeat survey allows trends to be observed and performance to be tracked. Moreover, comparison across information sources and tracking over time requires consistent definition of indicators. The value of data collection lies exactly in the ability to compare and assess trends. The lack of comparability results in considerable inefficiency when tracking performance over time or across sub-national or national boundaries.
n Information on Service Delivery. Improving efficiency requires better service delivery at the facility level. As facility data often lack comparability, WHO and USAID recently led the development of a survey tool called Service Availability and Readiness Assessment (SARA). This has been an important step toward standardization of indicators of service availability and readiness, although some gaps remain in indicators of service delivery performance (see box on Service Delivery Indicators).
n Information for accountability. The Commission on Information and Accountability emphasized that without information there
can be no accountability. Without accurate measurement, it is hard to reward performance or hold stakeholders accountable. But health data efforts usually serve supply-side needs. The demand-side—from parents and consumers of services to parliamentarians and advocates concerned with improved accountability for public resources—is often overlooked. Information about service delivery performance and quality is seldom communicated in simple terms through popular media. In fact, this information is frequently regarded as confidential. However, there are signs of change. The Kenyan Ministry of Information, Communications and Technology has implemented the Kenya Open Data Initiative,7 a visionary effort to make key government data publicly available through a single online portal. Even this bold initiative has had difficulties with government ministries on sharing information about sectoral results.
monItorIng & evaluatIon faIlures persIst despIte the Impact evaluatIon revolutIon—a mIssed opportunIty?Ensuring value for money requires that the most effective interventions or programs be implemented. Impact evaluation has emerged as an important tool to provide robust and credible evidence on the impact of a development intervention, and to assess which changes can be attributed to it.
Service Delivery inDicatorS
Service Delivery Indicators is an Africa-wide initiative and partnership of the World Bank, the African Development Bank and the African Economic Research Consortium. It aims to fill the existing gap in standardized data on service delivery with a focus on the knowledge and effort of service providers.
The vision is that this data will be collected every 2 to 3 years, allowing decision-makers to track performance over time and across geographic areas, and aid decision-making as policymakers improve the quality of service delivery and the efficiency of health spending.
The surveys also collect information on facility-level flow of resources, which is often done as part of public expenditure tracking surveys. By combining performance data and expenditure data this data source is an important complement to existing data architecture to address value for money questions.
Service Delivery Data to improve value for money
Knowledge and Effort of Service Providers
Teachers healTh workers
Absence from school Absence from the health facility
Absence from classroom Workload per clinician
Time spent teaching in the classroom Skills to reach correct diagnosis
Teachers with minimum knowledge Adherence to clinical guidelines
Quality of instructions Skills to handle life-threatening complications
Availability of Key Inputs
schools healTh faciliTies
Minimum teaching equipment available
Minimum medical equipment available
Student-teacher ratio Drugs in stock
Textbooks per student Workload per clinician
School infrastructure Health facility infrastructure
$ $ $ $ $
Inputs
Expenditure
Provider AbilityProvider Effort Outcomes
n Infrastructure n Equipment/Supplies n Human Resources
n What providers known What providers do
AfricA HeAltH forum 2013 finAnce And cApAcity for results 2 3AFRICA HEALTH FORUM 2013: FINANCE AND CAPACITY FOR RESULTS38

But as impact evaluation designs grow more sophisticated and surveys more detailed, routine program monitoring systems remain weak and underfunded. Yet the latter continue to be important. There have been some positive examples of using programmatic or monitoring information to understand impact evaluation findings.8 Better program information can also address an often-voiced criticism of impact evaluation, which is that it fails to look into the “black box” of service delivery. It would be a huge missed opportunity if the evaluation expertise and resources of impact evaluations are not applied equally to the monitoring and evaluation needs of a program or project. Results-based financing for health is an example of a large multi-country effort where impact evaluation has been applied alongside efforts to improve information systems for monitoring implementation.
servIce delIvery data: crItIcal to assess effIcIency and value for moneyOne of the gaps identified earlier is the lack of standardized information on the production of services in health centers and hospitals that can be used to assess their technical efficiency. This is critical to assess value for money and examine why health expenditures do not translate into optimal quality services. Figure 1 shows how information from the “black box” of service delivery can identify areas in
the service delivery chain where value for money can be improved. In addition to tracking the availability of critical inputs, the choice of service delivery indicators must reflect the understanding that the quality of health services is critically dependent on what health workers know (i.e. knowledge and competence) and what they do (i.e. provider effort).
do our data meet the current challenges?There have been significant improvements in certain types of information. For example, the availability and quality of expenditure data has improved over recent years. While important gaps remain, governments and international agencies (notably WHO and the Institute for Health Metrics and Evaluation) produce annual reports on government and donor health spending. Comparable cross-country data on health outcomes have progressively improved through better disease surveillance systems and household surveys. In fact, the Demographic and Health Surveys have become the gold standard for measurement of health indicators including infant mortality, under-five mortality, and fertility, among others. Despite these improvements, some challenges remain:
n Data quality and third-party verification. Over the past few decades we have seen vast investments in health management information systems (MIS). When information is used to reward performance or quality, self-reported MIS data often lack credibility and methodological rigor. For example, vast differences in estimates of immunization coverage from MIS and survey data have raised serious questions about the use of MIS data as evidence for performance-based reimbursements.6
n Time dimensionality of data. Data are only useful if available for analysis and use within the timeframe required for decision-
making. Some decisions are made quarterly, some annually. Whether the data source is an MIS or a survey, it is only valuable if it is available to decision-makers on time.
n Comparability of data and repetition of surveys. Lots of data are collected through various once-off surveys. However, the full returns to the investment are realized only when a repeat survey allows trends to be observed and performance to be tracked. Moreover, comparison across information sources and tracking over time requires consistent definition of indicators. The value of data collection lies exactly in the ability to compare and assess trends. The lack of comparability results in considerable inefficiency when tracking performance over time or across sub-national or national boundaries.
n Information on Service Delivery. Improving efficiency requires better service delivery at the facility level. As facility data often lack comparability, WHO and USAID recently led the development of a survey tool called Service Availability and Readiness Assessment (SARA). This has been an important step toward standardization of indicators of service availability and readiness, although some gaps remain in indicators of service delivery performance (see box on Service Delivery Indicators).
n Information for accountability. The Commission on Information and Accountability emphasized that without information there
can be no accountability. Without accurate measurement, it is hard to reward performance or hold stakeholders accountable. But health data efforts usually serve supply-side needs. The demand-side—from parents and consumers of services to parliamentarians and advocates concerned with improved accountability for public resources—is often overlooked. Information about service delivery performance and quality is seldom communicated in simple terms through popular media. In fact, this information is frequently regarded as confidential. However, there are signs of change. The Kenyan Ministry of Information, Communications and Technology has implemented the Kenya Open Data Initiative,7 a visionary effort to make key government data publicly available through a single online portal. Even this bold initiative has had difficulties with government ministries on sharing information about sectoral results.
monItorIng & evaluatIon faIlures persIst despIte the Impact evaluatIon revolutIon—a mIssed opportunIty?Ensuring value for money requires that the most effective interventions or programs be implemented. Impact evaluation has emerged as an important tool to provide robust and credible evidence on the impact of a development intervention, and to assess which changes can be attributed to it.
Service Delivery inDicatorS
Service Delivery Indicators is an Africa-wide initiative and partnership of the World Bank, the African Development Bank and the African Economic Research Consortium. It aims to fill the existing gap in standardized data on service delivery with a focus on the knowledge and effort of service providers.
The vision is that this data will be collected every 2 to 3 years, allowing decision-makers to track performance over time and across geographic areas, and aid decision-making as policymakers improve the quality of service delivery and the efficiency of health spending.
The surveys also collect information on facility-level flow of resources, which is often done as part of public expenditure tracking surveys. By combining performance data and expenditure data this data source is an important complement to existing data architecture to address value for money questions.
Service Delivery Data to improve value for money
Knowledge and Effort of Service Providers
Teachers healTh workers
Absence from school Absence from the health facility
Absence from classroom Workload per clinician
Time spent teaching in the classroom Skills to reach correct diagnosis
Teachers with minimum knowledge Adherence to clinical guidelines
Quality of instructions Skills to handle life-threatening complications
Availability of Key Inputs
schools healTh faciliTies
Minimum teaching equipment available
Minimum medical equipment available
Student-teacher ratio Drugs in stock
Textbooks per student Workload per clinician
School infrastructure Health facility infrastructure
$ $ $ $ $
Inputs
Expenditure
Provider AbilityProvider Effort Outcomes
n Infrastructure n Equipment/Supplies n Human Resources
n What providers known What providers do
AfricA HeAltH forum 2013 finAnce And cApAcity for results 2 3SUMMARY REPORT 39

This brief is a product of the staff of the International Bank for Reconstruction and Development/The World Bank, prepared ahead of Africa Health Forum 2013: Finance and Capacity for Results, an event co-hosted by the World Bank and the U.S. State Department Office of Global Health Diplomacy, in collaboration with Harmonization for Health in Africa. The findings, interpretations, and conclusions expressed in this brief do not necessarily reflect the views of the Executive Directors of the World Bank or the governments they represent, or of any of the hosting entities and partners.
Recent developments—from a leveling out of resources for health to a greater emphasis on value for money and accountability for results—underscore the need for more and better information on the effectiveness of current health spending. Reducing inefficiencies in the use of existing resources is also important to those advocating for more resources, as inefficiencies will detract from returns to any additional resources for health. This makes achieving and demonstrating value for money more important than ever. In addressing information needs for improving value for money, a first step is to focus on value—interpreted as improved quality and performance of health service delivery; value for money will follow.1
Trends in Resources Available for Health: Governments are the largest source of health spending in developing countries. In 2010 aggregate government spending on health in Africa was estimated at 3.5 times higher than total development assistance for health in Africa.2 After experiencing vast increases in the 1990s–2000s, government health spending has now stagnated in 20 African countries. Given the uncertain economic climate facing developing and developed countries alike, it is unlikely that past increases in government and
aid spending will be repeated.3 In recent years there have been highly visible calls for improved value for money for health spending, most recently the Tunis Declaration on Value for Money.4
Linking Financing to Results: This is a trend that is on the rise in Africa at multiple levels. Examples range from changes in the way officials are rewarded (e.g. performance-based contracting of senior officials; performance-based financing of health facility staff ) to the way governments or partners finance sectoral programs (e.g. performance-linked agreements between ministries of finance and
sectoral ministries; cash-on-delivery aid; the World Bank’s Program-for-Results financing instrument).
Calls for Improved Accountability: The MDGs are a strong example of accountability for government effectiveness. Central to the success of the race to the MDGs is that it made governments’ performance targets public and performance was tracked in the public domain by non-experts. An initiative aimed specifically at tracking progress on the health-related MDGs is the Commission on Information and Accountability5 for Women’s and Children’s Health.
InformatIon Is not an end In Itself…Information can both inform and spur action, or quoting Goethe: “Knowing is not enough, we must apply. Willing is not enough, we must do.” There has been much action toward improving quality and effectiveness. Quality requires knowing what to do. This is very effectively done by WHO and others through the establishment of clinical guidelines and the implementation of checklists.9 Reviews of the health service delivery literature have repeatedly concluded that success requires continuous monitoring and adaptation during implementation.10
In management, this is called “Learning from failure”. Closely linked is the notion that without the correct information we are doomed
to repeat failures. The information and communications technology revolution holds tremendous promise to accelerate our ability to learn from both positive and negative experiences. On this topic, World Bank Group President Jim Kim blogged: “I’m convinced that revolutionary advances in communications and information processing, when linked to an enlightened approach to failure, can help transform our pursuit of ability to achieve development results, even in the poorest countries.”11
Finally, in a critique of some development policy practitioners (including the World Bank), Bill Easterly made the distinction between “Planners” and “Searchers”.
A key difference is how they use information—planners use
information to devise more detailed plans, and searchers use information to track performance and do mid-course corrections. While good plans rest on good information, tracking implementation is arguably of even greater importance.
QuestIons to mInIstersn To Ministers of Finance: In your
experience, what information or type of analysis has provided the most compelling and credible arguments about value for money of health spending?
n To Ministers of Health: How do you think improved information and analysis could contribute to efforts to improve the quality of service delivery?
Information to Improve Value for Money in Health
Key messagesn A recent leveling out of resources for health, alongside highly
visible calls for greater results and accountability, underscores the need for information on value for money in health spending.
n While there has been significant progress in health data quality, including better expenditure and health outcome data, important gaps remain in the quality, timeliness, and comparability of data. There is also too little timely data on service delivery and insufficient information for accountability.
n Impact evaluation has expanded the information base on service delivery, but routine program monitoring data remains weak— a potential missed opportunity.
n Financing is increasingly linked to results. When information is used to reward performance or quality, data credibility and methodological rigor are essential.
n Information can both inform and spur action; learning from failure is critical, as is adaptation of implementation as informed by this learning process.
2013
1 Deming contended that quality tends to increase and costs fall over time when people and organizations focus primarily on quality,
defined by the ratio: Quality =
Results of work effortsTotal costs . However, when people and organizations focus primarily on costs, costs tend to rise and quality
declines over time. http://en.wikipedia.org/wiki/W._Edwards_Deming.
2 Institute for Health Metrics and Evaluation. 2010. Financing Global Health 2009: Tracking Development Assistance for Health. University of Washington, Seattle, WA.
3 The 2012 report on health expenditure trends has the sub-title “The End of a Golden Era” referring to the likely slowing of increases in future health spending.
4 “Tunis Declaration on Value, Sustainability and Accountability in the Health Sector: A Joint Declaration by the Ministers of Finance and Ministers of Health of Africa”, African Development Bank, July 2012.
5 In 2011 the UN convened the high-level Commission on Information and Accountability for Women’s and Children’s Health to make countries and their partners accountable for delivery against the Global Strategy for Women’s and Children’s Health Strategy. The Commission proposed a framework for global reporting, oversight and accountability. The framework included (i) measures to track flow of resources; and (ii) identification of key indicators to track results. (WHO. 2011. Keeping Promises, Measuring Results. Commission on Information and Accountability for Women’s and Children’s Health).
6 Lim SS, Stein DB, Charrow A, Murray CJL. Tracking progress towards universal childhood immunisation and the impact of global initiatives: a systematic analysis of three-dose diphtheria, tetanus, and pertussis immunisation coverage. Lancet 2008.
7 As of November 2011, there are close to 390 datasets that have been uploaded to the KODI site, with a plan currently in place to upload more data over the next year. There have been over 17,000 page views and over 2,500 datasets downloaded and embedded to various websites and portals. https://opendata.go.ke/.
8 Galasso E., and Yau, J. 2006. “Learning Through Monitoring: Lessons from a Large-Scale Nutrition Program in Madagascar”, World Bank Policy Research Working Paper, Paper No. 4058, Washington, DC.
9 A key finding from the literature is that the use of job aids, printed cards and checklists accounted for much of the variation in the quality of obstetric care. See Adeyi, O. and R. Morrow (1997). “Essential obstetric care: assessment and determinants of quality.” Social Science and Medicine 45(11): 1631-9. Most recently, the merits of checklists (in health care settings and everyday life) received huge much media coverage following Atul Gawande’s book: “The Checklist Manifesto: How to Get Things Right”.
10 Peters D.H., El-Saharty S., Siadat B., Janovsky K., and Vujicic M. (Eds) Improving Health Service Delivery in Developing Countries: From Evidence to Action, Directions in Development series, 2009. World Bank, Washington DC.
11 Kim, 2012. “Big Idea 2013: Learning Fast From Failure” LinkedIn Blog. http://www.linkedin.com/today/post/article/20121211162106-32702694-big-idea-2013-learning-fast-from-failure.
AFRICA HEALTH FORUM 2013: FINANCE AND CAPACITY FOR RESULTS40

This brief is a product of the staff of the International Bank for Reconstruction and Development/The World Bank, prepared ahead of Africa Health Forum 2013: Finance and Capacity for Results, an event co-hosted by the World Bank and the U.S. State Department Office of Global Health Diplomacy, in collaboration with Harmonization for Health in Africa. The findings, interpretations, and conclusions expressed in this brief do not necessarily reflect the views of the Executive Directors of the World Bank or the governments they represent, or of any of the hosting entities and partners.
The average share of government health expenditure devoted to the health worker wage bill in Sub-Saharan Africa (SSA) is significant at 40 percent, although lower than in many other regions (Figure 1). Within SSA, there are many variations by country.
Despite such investments, African countries continue to face a “human resources for health (HRH) crisis”—in which a small number of qualified, well-performing health workers cannot meet actual need—to varying degrees. This impedes health outcome improvements and economic growth. The problem is particularly pronounced in rural or marginalized areas. This is troubling, as there is a well-accepted relationship between health outputs, such as skilled attendance at birth, and availability of health workers (Figure 2). In many countries, the inequitable distribution of health workers stands in the way of better health for people, especially women and children.
The HRH crisis in many countries can be explained by constraints in labor market supply, labor market demand, and in performance. Insufficient labor market supply refers to a situation where insufficient numbers of health workers are produced, or numbers are reduced by labor market exit, such as outmigration,
non-functioning accountability and supervision mechanisms (particularly for facility managers over health workers), 2) low motivation of health workers, due to challenging working and living conditions, few opportunities for professional advancement, and few performance-linked monetary or non-monetary incentives.
POLICY IMPLICATIONSIdentify and Address HRH Leakages. Traditional approaches to address the HRH crisis have focused mainly on increasing production of health workers, without first paying attention to labor market leaks and inefficiencies. Figure 5 shows common leakages in Togo because of outmigration, unemployment, and a large rural/urban imbalance. Only 150 out of 890 doctors trained actually end up serving 80 percent
of the population. Of them, many are absent, unresponsive, unproductive and unmotivated. Fixing these inefficiencies and leakages will require identifying country-specific, cost-effective strategies and mechanisms that focus on changing health worker behavior through incentives,
adopting innovative education models (including rural pipeline policies), increasing opportunities for funding for HRH (including labor market demand) especially in rural and marginalized areas, and strengthening management and accountability systems (particularly at the facility level).
Figure 1: The Health Sector Wage Bill as a Share of Public Spending on Health, by Region, Mean
a. By region
10
20
30
40
50
60
70
Shar
e of p
ublic
spen
ding
on
heal
th (%
)
World Bank region
EAP ECA LAC MENA SA SSA
QueSTIONS TO MINISTerSHRH is a critical issue for low and middle income countries aiming to achieve Universal Health Coverage, achieve critical health outcome improvements, and foster economic growth.
n What is needed to scale up efforts to identify and fix existing inefficiencies and leakages in the health labor market, which will be unique on a country to country basis?
n What would it take to redistribute funding for health and other
sectors more equitably between urban and rural areas, to improve rural working and living conditions for health workers and ensure resources exist to hire them?
n What would it take to better decentralize health worker training to rural areas, and to adopt education strategies linked to reducing outmigration, better skill sets to address local challenges, and increasing rural job uptake?
n How can facility managers be empowered with better skills, incentives, decision making authority, and tools to raise funding, so that they can more effectively manage their health workers?
n How can the private sector play a larger role in addressing the HRH crisis (and shoulder some of the public sector funding constraints), and how can its reach and access be expanded to reach the rural poor?
Fixing Labor Market Leakages: Getting More Bang for Your Buck on Human Resources for Health
KeY MeSSAgeSn Despite significant investment in health workers, African countries
face a crisis in terms of human resources for health (HRH). This deeply affects their ability to deliver health results on the ground, achieve Universal Health Coverage, and foster economic growth.
n In many countries, the HRH crisis can be explained by insufficient numbers of health workers primarily in the rural labor market (supply), lack of funding to employ health workers (demand), and/or issues related to their performance.
n Simply scaling up production of health workers is not a good enough fix, as urban unemployment, rural shortages, health sector attrition, including migration abroad, as well as absenteeism and low productivity (labor market leakages and inefficiencies) will waste investments.
n Potential solutions need to identify and address country specific labor market leakages and inefficiencies including through: (i) monetary and non-monetary incentives, (ii) innovative education models (including rural pipeline models), (iii) increasing opportunities for funding for HRH particularly in rural areas, and (iv) strengthening management and accountability systems in frontline facilities.
2013
Source: World Health Organization.
Note: EAP = East Asia and the Pacific; ECA = Europe and Central Asia; LAC = Latin America and the Caribbean; MENA = Middle East and North Africa; SA = South Asia; SSA = Sub-Saharan Africa
Figure 5: Loss of Investment in Production from Leakages - Example of Togo
Source: World Bank, Country Status Report, Togo, 2011
Production890 doctors
trained
Migration:250
Retired: 20
Unemployed: 20
Employed full-time in
private for profit sector: 200
Employed full time in
Government sector:
400
Service 80% of the population:150 doctors
Concentrated in the capital city (20% of population) 75% of employed doctors
SUMMARY REPORT 41

COMMON CONSTrAINTS TO LABOr MArKeT DeMANDInsufficient Funding for Wages: Wage bill funding is considered insufficient if neither the public nor private sectors can adequately absorb health workers. This can occur when there is rapid scale-up in production, urban oversupply (a common issue), or reduction in outmigration, without concomitant expansion of wage bill allocations or private sector employment opportunities. Rural areas commonly suffer from wage funding insufficiency. Public sector funding is often disproportionately allocated towards urban areas, where most of the higher-paid health workers are employed and most of the larger secondary and tertiary level hospitals located. The private for-profit sector is also disproportionately found in urban areas.
Fiscal Re-centralization: In many countries, non-functioning or reversed decentralization policies have curtailed local health providers’ income and ability to hire and retain health workers. This is sometimes made worse by rural health facilities being unable to mobilize discretionary resources of their own, sometimes because of the limited number of patients willing or able to purchase services. In Sudan for example, the more rural states such as North Kordofan, Kassala, or Red Sea receive much less revenue from federal transfers and own sources than more urban or centrally located states.
Limited Patient Ability to Pay: Limited revenues particularly from rural populations constrain private-sector demand for health workers, and/or public sector income augmentation opportunities. Assessments in SSA overwhelmingly show that rural populations are poorer than urban ones. Lack of health insurance for rural populations also prevents them from buying adequate health services and thus generating rural revenue and demand for HRH (including from the private sector).
COMMON PerfOrMANCe ISSueSLimited Health Worker Competencies: A critical challenge many countries face is under-developed competencies of health workers (knowledge and skills), often because of the limited physical, technical and organizational capacity of health training organizations. Moreover, in-service training and continuing development opportunities are often lacking or unevenly available. Specialist skill sets, especially in critical areas such as obstetrics, pediatrics, internal medicine and infectious diseases are also often highly limited by meager postgraduate medical training
opportunities. Where they exist, such opportunities are often concentrated only in urban areas (with little linkage to the realities found in many rural areas).
Challenging Working Conditions: Equipment and supplies shortages frequently prevent health workers from delivering services adequately, especially in rural areas, where inefficient supply chain mechanisms have only limited reach. This is complicated by additional systems challenges including poor flow of information, and capacity issues such as excessive workload, limited staff and support services, and infrastructure challenges.
Sub-par Application of Effort: A common performance limitation in many countries is the gap between what health workers know how to do, and actually do (Figure 4). This “know-do” gap is often a reflection of low productivity levels, health worker absenteeism, and inadequate responsiveness. The gap is often linked to two main challenges 1) inadequate or
or disproportionate job uptake in urban over rural areas. Insufficient
labor market demand refers to a situation where there are insufficient resources (public or private) available to hire health workers.
Finally, problems with health worker
performance include insufficient skills to carry out services, lack of equipment and supplies to apply skills, or low attendance, motivation, and productivity.
COMMON CONSTrAINTS TO LABOr MArKeT SuPPLYLow Labor Production: Health training institutions often lack the physical, technical and organizational capacity to produce larger numbers of health workers. Capacity varies between countries, with Sudan producing more than 3,000 doctors a year, while Zambia produces fewer than a hundred. Health training institutions in most African countries lack teachers, teaching supplies, infrastructure, and sufficient management capacity.
Preferences for Urban and Out-of-Country Employment: Given comparatively lower salaries and fewer opportunities at home for post-graduate education, health workers often migrate abroad. If they remain in their own countries, they tend to prefer urban over rural jobs, as the former offer better income, better education for their children, and better working/living conditions. Figure 3 shows how the probability of rural job uptake (in this case for nurses in Ethiopia) is closely linked to the provision of different types of monetary and non-monetary incentives. There are also strong links between the socioeconomic and/or geographic background of health workers (as well as exposure to rural areas during training, for example) and their willingness to remain in the country or work in rural areas (Lemiere and Herbst et al, 2013).
AfricA HeAltH forum 2013 finAnce And cApAcity for results 2 3
Figure 2: Health worker density is correlated with skilled attendance at birth, Africa, 2005–09
Figure 4: The Know-do Gap: The gap between what health workers know how to do, and actually do
Source: WHO/Global Atlas (2005–2009) and UNICEF (latest year available).
Figure 3: Findings from a Discrete Choice Experiment: Share of nurses in Ethiopia willing to accept a rural job, as a function of the rural wage bonus (horizontal axis), with alternative in-kind attribute incentives
Source: Jack and others in Berhanu Feysia and others, 2012
00 1 2 3 4 5 6
10
20
30
40
50
60
70
80
90
100
Skill
ed at
tend
ance
at b
irth
(%)
Health worker density (per 1,000 population)
Botswana
Namibia
Zambia
DRC
Benin
Sierra LeoneBurundi
Eritrea
ChadEthiopia
Mauritius
South AfricaGabon
R2 = 0.475
-0.5
0.2
0.4
0.5
0.6
00 0.5 0 1.5 2 2.5 3
Prob
abili
ty o
f lan
ding
rura
l job
Wage bonus (as a multiple of base salary)
Basic housing and equipment
Equipment
Superior housing
Basic housing
Supervisions
Time
Baseline
Health worker performance(process quality)
KNOW-DO GAP
Actual performance
Potential performance (knowledge, equipment)
Leonard at al, (2007)J of Human Resources
AFRICA HEALTH FORUM 2013: FINANCE AND CAPACITY FOR RESULTS42

COMMON CONSTrAINTS TO LABOr MArKeT DeMANDInsufficient Funding for Wages: Wage bill funding is considered insufficient if neither the public nor private sectors can adequately absorb health workers. This can occur when there is rapid scale-up in production, urban oversupply (a common issue), or reduction in outmigration, without concomitant expansion of wage bill allocations or private sector employment opportunities. Rural areas commonly suffer from wage funding insufficiency. Public sector funding is often disproportionately allocated towards urban areas, where most of the higher-paid health workers are employed and most of the larger secondary and tertiary level hospitals located. The private for-profit sector is also disproportionately found in urban areas.
Fiscal Re-centralization: In many countries, non-functioning or reversed decentralization policies have curtailed local health providers’ income and ability to hire and retain health workers. This is sometimes made worse by rural health facilities being unable to mobilize discretionary resources of their own, sometimes because of the limited number of patients willing or able to purchase services. In Sudan for example, the more rural states such as North Kordofan, Kassala, or Red Sea receive much less revenue from federal transfers and own sources than more urban or centrally located states.
Limited Patient Ability to Pay: Limited revenues particularly from rural populations constrain private-sector demand for health workers, and/or public sector income augmentation opportunities. Assessments in SSA overwhelmingly show that rural populations are poorer than urban ones. Lack of health insurance for rural populations also prevents them from buying adequate health services and thus generating rural revenue and demand for HRH (including from the private sector).
COMMON PerfOrMANCe ISSueSLimited Health Worker Competencies: A critical challenge many countries face is under-developed competencies of health workers (knowledge and skills), often because of the limited physical, technical and organizational capacity of health training organizations. Moreover, in-service training and continuing development opportunities are often lacking or unevenly available. Specialist skill sets, especially in critical areas such as obstetrics, pediatrics, internal medicine and infectious diseases are also often highly limited by meager postgraduate medical training
opportunities. Where they exist, such opportunities are often concentrated only in urban areas (with little linkage to the realities found in many rural areas).
Challenging Working Conditions: Equipment and supplies shortages frequently prevent health workers from delivering services adequately, especially in rural areas, where inefficient supply chain mechanisms have only limited reach. This is complicated by additional systems challenges including poor flow of information, and capacity issues such as excessive workload, limited staff and support services, and infrastructure challenges.
Sub-par Application of Effort: A common performance limitation in many countries is the gap between what health workers know how to do, and actually do (Figure 4). This “know-do” gap is often a reflection of low productivity levels, health worker absenteeism, and inadequate responsiveness. The gap is often linked to two main challenges 1) inadequate or
or disproportionate job uptake in urban over rural areas. Insufficient
labor market demand refers to a situation where there are insufficient resources (public or private) available to hire health workers.
Finally, problems with health worker
performance include insufficient skills to carry out services, lack of equipment and supplies to apply skills, or low attendance, motivation, and productivity.
COMMON CONSTrAINTS TO LABOr MArKeT SuPPLYLow Labor Production: Health training institutions often lack the physical, technical and organizational capacity to produce larger numbers of health workers. Capacity varies between countries, with Sudan producing more than 3,000 doctors a year, while Zambia produces fewer than a hundred. Health training institutions in most African countries lack teachers, teaching supplies, infrastructure, and sufficient management capacity.
Preferences for Urban and Out-of-Country Employment: Given comparatively lower salaries and fewer opportunities at home for post-graduate education, health workers often migrate abroad. If they remain in their own countries, they tend to prefer urban over rural jobs, as the former offer better income, better education for their children, and better working/living conditions. Figure 3 shows how the probability of rural job uptake (in this case for nurses in Ethiopia) is closely linked to the provision of different types of monetary and non-monetary incentives. There are also strong links between the socioeconomic and/or geographic background of health workers (as well as exposure to rural areas during training, for example) and their willingness to remain in the country or work in rural areas (Lemiere and Herbst et al, 2013).
AfricA HeAltH forum 2013 finAnce And cApAcity for results 2 3
Figure 2: Health worker density is correlated with skilled attendance at birth, Africa, 2005–09
Figure 4: The Know-do Gap: The gap between what health workers know how to do, and actually do
Source: WHO/Global Atlas (2005–2009) and UNICEF (latest year available).
Figure 3: Findings from a Discrete Choice Experiment: Share of nurses in Ethiopia willing to accept a rural job, as a function of the rural wage bonus (horizontal axis), with alternative in-kind attribute incentives
Source: Jack and others in Berhanu Feysia and others, 2012
00 1 2 3 4 5 6
10
20
30
40
50
60
70
80
90
100
Skill
ed at
tend
ance
at b
irth
(%)
Health worker density (per 1,000 population)
Botswana
Namibia
Zambia
DRC
Benin
Sierra LeoneBurundi
Eritrea
ChadEthiopia
Mauritius
South AfricaGabon
R2 = 0.475
-0.5
0.2
0.4
0.5
0.6
00 0.5 0 1.5 2 2.5 3
Prob
abili
ty o
f lan
ding
rura
l job
Wage bonus (as a multiple of base salary)
Basic housing and equipment
Equipment
Superior housing
Basic housing
Supervisions
Time
Baseline
Health worker performance(process quality)
KNOW-DO GAP
Actual performance
Potential performance (knowledge, equipment)
Leonard at al, (2007)J of Human Resources
SUMMARY REPORT 43

This brief is a product of the staff of the International Bank for Reconstruction and Development/The World Bank, prepared ahead of Africa Health Forum 2013: Finance and Capacity for Results, an event co-hosted by the World Bank and the U.S. State Department Office of Global Health Diplomacy, in collaboration with Harmonization for Health in Africa. The findings, interpretations, and conclusions expressed in this brief do not necessarily reflect the views of the Executive Directors of the World Bank or the governments they represent, or of any of the hosting entities and partners.
The average share of government health expenditure devoted to the health worker wage bill in Sub-Saharan Africa (SSA) is significant at 40 percent, although lower than in many other regions (Figure 1). Within SSA, there are many variations by country.
Despite such investments, African countries continue to face a “human resources for health (HRH) crisis”—in which a small number of qualified, well-performing health workers cannot meet actual need—to varying degrees. This impedes health outcome improvements and economic growth. The problem is particularly pronounced in rural or marginalized areas. This is troubling, as there is a well-accepted relationship between health outputs, such as skilled attendance at birth, and availability of health workers (Figure 2). In many countries, the inequitable distribution of health workers stands in the way of better health for people, especially women and children.
The HRH crisis in many countries can be explained by constraints in labor market supply, labor market demand, and in performance. Insufficient labor market supply refers to a situation where insufficient numbers of health workers are produced, or numbers are reduced by labor market exit, such as outmigration,
non-functioning accountability and supervision mechanisms (particularly for facility managers over health workers), 2) low motivation of health workers, due to challenging working and living conditions, few opportunities for professional advancement, and few performance-linked monetary or non-monetary incentives.
POLICY IMPLICATIONSIdentify and Address HRH Leakages. Traditional approaches to address the HRH crisis have focused mainly on increasing production of health workers, without first paying attention to labor market leaks and inefficiencies. Figure 5 shows common leakages in Togo because of outmigration, unemployment, and a large rural/urban imbalance. Only 150 out of 890 doctors trained actually end up serving 80 percent
of the population. Of them, many are absent, unresponsive, unproductive and unmotivated. Fixing these inefficiencies and leakages will require identifying country-specific, cost-effective strategies and mechanisms that focus on changing health worker behavior through incentives,
adopting innovative education models (including rural pipeline policies), increasing opportunities for funding for HRH (including labor market demand) especially in rural and marginalized areas, and strengthening management and accountability systems (particularly at the facility level).
Figure 1: The Health Sector Wage Bill as a Share of Public Spending on Health, by Region, Mean
a. By region
10
20
30
40
50
60
70
Shar
e of p
ublic
spen
ding
on
heal
th (%
)
World Bank region
EAP ECA LAC MENA SA SSA
QueSTIONS TO MINISTerSHRH is a critical issue for low and middle income countries aiming to achieve Universal Health Coverage, achieve critical health outcome improvements, and foster economic growth.
n What is needed to scale up efforts to identify and fix existing inefficiencies and leakages in the health labor market, which will be unique on a country to country basis?
n What would it take to redistribute funding for health and other
sectors more equitably between urban and rural areas, to improve rural working and living conditions for health workers and ensure resources exist to hire them?
n What would it take to better decentralize health worker training to rural areas, and to adopt education strategies linked to reducing outmigration, better skill sets to address local challenges, and increasing rural job uptake?
n How can facility managers be empowered with better skills, incentives, decision making authority, and tools to raise funding, so that they can more effectively manage their health workers?
n How can the private sector play a larger role in addressing the HRH crisis (and shoulder some of the public sector funding constraints), and how can its reach and access be expanded to reach the rural poor?
Fixing Labor Market Leakages: Getting More Bang for Your Buck on Human Resources for Health
KeY MeSSAgeSn Despite significant investment in health workers, African countries
face a crisis in terms of human resources for health (HRH). This deeply affects their ability to deliver health results on the ground, achieve Universal Health Coverage, and foster economic growth.
n In many countries, the HRH crisis can be explained by insufficient numbers of health workers primarily in the rural labor market (supply), lack of funding to employ health workers (demand), and/or issues related to their performance.
n Simply scaling up production of health workers is not a good enough fix, as urban unemployment, rural shortages, health sector attrition, including migration abroad, as well as absenteeism and low productivity (labor market leakages and inefficiencies) will waste investments.
n Potential solutions need to identify and address country specific labor market leakages and inefficiencies including through: (i) monetary and non-monetary incentives, (ii) innovative education models (including rural pipeline models), (iii) increasing opportunities for funding for HRH particularly in rural areas, and (iv) strengthening management and accountability systems in frontline facilities.
2013
Source: World Health Organization.
Note: EAP = East Asia and the Pacific; ECA = Europe and Central Asia; LAC = Latin America and the Caribbean; MENA = Middle East and North Africa; SA = South Asia; SSA = Sub-Saharan Africa
Figure 5: Loss of Investment in Production from Leakages - Example of Togo
Source: World Bank, Country Status Report, Togo, 2011
Production890 doctors
trained
Migration:250
Retired: 20
Unemployed: 20
Employed full-time in
private for profit sector: 200
Employed full time in
Government sector:
400
Service 80% of the population:150 doctors
Concentrated in the capital city (20% of population) 75% of employed doctors
AFRICA HEALTH FORUM 2013: FINANCE AND CAPACITY FOR RESULTS44

This brief was drafted by Claire-Cecile Pierre, Harvard University, ahead of Africa Health Forum 2013: Finance and Capacity for Results, an event co-hosted by the World Bank and the U.S. State Department Office of Global Health Diplomacy, in collaboration with Harmonization for Health in Africa. The findings, interpretations, and conclusions expressed in this brief do not necessarily reflect the views of the Executive Directors of the World Bank or the governments they represent, or of any of the hosting entities and partners.
Every day, Ministers of Health, Ministers of Finance and senior managers have to make critical decisions about their goals for social protection, the structure of their health systems, and the budget allocations needed to reach these goals. Many have proposed that these decisions have greater impact if they are based on real-time, context-appropriate data and evidence. The World Health Organization (WHO) emphasizes that six areas must be addressed and aligned for a successful health system: health service delivery, health workforce, health information systems, access to essential medicines, health systems financing, and leadership and governance. This paper will explore the ways in which research institutions can strengthen two of these building blocks: a) health workforce development in the public sector and b) governance through locally relevant research and data to support policy and decision making.
THE PROMISE OF AFRICAN RESEARCH Greater capacity in African research institutions raises the potential availability of locally relevant data for evidence-based decisions in
the public sector. The values of research institutions—among them rigorous critical thinking, knowledge sharing, and training—should make them strong contributors to the global health equity movement. But competition for funding and the tendency to be theory-based rather than implementation-based have limited their impact. Over the past three decades, however, research institutions have increasingly
developed models of partnership which address these challenges.
Think tanks that review studies, analyze practice data and compare models to generate advice on local and global issues can enable policymakers and the public to make informed decisions. Despite the recent reduction in the number of global think tanks, and the relatively small percentage operating primarily
QuESTIONS TO MINISTERSGiven the resources already available, including increasing amounts of country-specific, country-directed research, what additional tools and platforms
do Ministers of Health and of Finance envision to a) continue to strengthen local institutions to undertake such research and become centers of excellence
b) improve the translation of this research into national policies that support their decision making process on health care financing? The Roles of Research-Based, Non-State Actors in
Building Capacity for Effectiveness and Sustainability in Africa’s Health Sector
KEy MESSAgESn Research will have greater impact when locally relevant and
regionally contextualized, with country-specific data and practices included in the analysis.
n Research-based, non-state actors can build capacity and effectiveness in the health sector by improving evidence-based policy through research, and strengthening governance through training.
n Building a health workforce includes training public policy, administration, and management practitioners, as well as clinicians and technicians.
n Strong public-sector research units are needed to collect, interpret, and analyze data to ensure informed policies and critical reviews of private research findings.
n Under country ownership, public-private research and training partnerships can result in country-wide workforce development.
n Impact must be rigorously measured. Think tanks and research institutions should be tracked not just on the number of publications, but also the impact of their recommendations, and on whether the graduates from their training programs can plan, manage and implement change.
2013
REFERENCES
African Economic Research Consortium. (2011). Annual Report, 2010/11. Nairobi, Kenya.
Bulletin of the World Health Organization. (2007). Mapping Africa’s advanced public health education capacity: the AfriHealth project. Geneva, Switzerland.
Ifakara Health Institute. (2009). IHI strategic plan, 2008-2013: “delivering operational excellence”. Dar es Salaam, Tanzania.
Mbadlanyana, T., Nompumelelo S., and J. Cilliers. (2011). Shaping African futures: think tanks and the need for endogenous knowledge production in Sub-Saharan Africa. Foresight, 13, 64-84.
Novak, S. (2012, May 12). Hands-on medical education in Rwanda. The New York Times.
The World Bank. (2013). Setting reasonable performance targets for public service delivery. Washington, DC: Azevedo, J. P. and Newman, J.
The World Bank. (2013). Using administrative data to evaluate municipal reforms. Washington, DC: Bruhn, M. and McKenzie, D.
University of Pennsylvania, International Relations Program. (2013). Think tanks and civil society program. Philadelphia, PA.
M., Stephen, G. Chee, R. Patsika, E. Malangalila, D. Chitama, E. Van Praag and G. Schettler. (2011). Tanzania Health System Assessment 2010. Bethesda, MD: Health Systems 20/20 project, Abt Associates Inc.
World Health Organization. (2007). What is health policy and systems research and why does it matter? Geneva, Switzerland: Sara Bennett.
World Health Organization. (2008). Maximizing positive synergies between health systems and global health initiatives. Geneva, Switzerland: Sara Bennett.
SUMMARY REPORT 45

Between 2005 and 2009, IHI staff produced over 100 peer-reviewed papers and created an electronic database of Tanzania-specific research. IHI develops and employs Tanzanian scientists, who in 2011 published 55 reports covering public health topics ranging from disease-specific research (malaria) to health systems research. Through collaboration with other countries (Malawi, Mozambique, Kenya), IHI seeks to better understand issues of accountability, impact of policies and outcomes of investments in healthcare workforce development. This makes IHI’s research relevant
to local and regional policies. The Institute has been able to secure competitive research grants for more than 80 percent of its income, supplemented by funding from the governments of Tanzania, Switzerland, UK, Ireland and Norway.
IHI’s model also includes training. In partnership with local universities, IHI offers short courses and programs to build local capacity for research. IHI has established partnerships with Sokoine University of Agriculture, University of Dodoma, the Hubert Kairuki Memorial University and more recently the Nelson Mandela African
Institute of Science and Technology (NMAIST-Arusha). Through these partnerships, senior IHI scientists assist with the design, development and delivery of the courses taught at these universities in Tanzania, while offering research opportunities for their faculty. This mutually beneficial arrangement is expected to ensure that IHI expertise is put to use in teaching, while also enabling academic staff to pursue their research interests. Other universities in Ghana, Senegal, Kenya, and South Africa have similar programs aimed at increasing the region’s research expertise.
in Africa, the continent does have 554 think tanks, 53 in Kenya alone. The African Economic Research Consortium (AERC) is an example of an organization concerned with researching current topics on the continent as well as training the next generation of African researchers. AERC uses technology to make publications accessible to both the public sector and the public and encourages cross-country collaboration. Its fellowships and training programs are attended by students from 27 countries, many of whom move into public sector positions. The potential for this model that combines technology, training and research with cross-country collaboration is of great value to the region. Other think tanks such as AMREF, CRES and HSCR have also taken on this challenge. Continued support for these efforts should be considered.
THE CHALLENgE OF BuILDINg A HEALTHCARE WORKFORCE FOR gOVERNANCE The literature on healthcare workforce development emphasizes the need for clinicians and healthcare technicians who can deliver clinical services. However, there is also an urgent need for professionals trained in administration, policy, and research who can forecast, plan and manage the sector.
African universities can play a major role in building the country’s public health governance capacity by training skilled public health professionals. Yet, a 2007 article based on 2001-2003 survey data from AfriHealth-CORED showed that over half (55%) of African countries had no postgraduate public health
programs. Of those who did, units offering public health programs were often small.
Also, programs should avoid the tendency to equate training with capacity building, and address other factors, such as retention, especially for graduates hoping to join the public sector. As the number of university programs and research institutions increases, a focus on locally relevant and globally aware studies will ensure that trainees enter the workforce ready to contribute to private sector growth and public sector governance. Public health, public administration and public policy program graduates will need opportunities in academia, independent research institutions and the public sector that provide them with meaningful work, professional development ladders and proper space for innovation.
CASESThe following two cases illustrate models of health systems strengthening through local workforce development and research. One represents an established non-governmental program with a history of growth and change, while the other presents the plan of a recently launched public-sector program with great promise for national transformation.
Case 2: Rwanda’s Human Resources for Health Program
Despite a lot of recent progress in health, rates of maternal and child illness are still high in Rwanda, and the burden of poorly treated diseases is substantial. To make further progress, Rwanda must improve its healthcare workforce. About 633 physicians, 6,970 nurses, and 10 Rwandan dental surgeons serve a population of over 10 million people. WHO considers Rwanda one of 57 countries worldwide with a critical shortage of health workers.
In 2012 the Rwandan Ministry of Health (MOH) decided to address the country’s need for a robust healthcare workforce by building its clinical, research and administrative capacity through an ambitious seven-year Human Resources for Health (HRH) Program. HRH is a model of investment in human capital under country leadership, aligning local and international research-based institutions under one vision. Initiated by a
public health sector dedicated to effective policies and rational implementation, HRH is designed to produce graduates skilled in the use of evidence-based approaches to decision making with a subset dedicated to careers in research.
Setting clear targets to deliver and manage care, the MOH was able to identify local and international partners best equipped to deliver high quality training to young professionals. The government seeks to increase the number of clinicians and introduce the role of ‘health manager’ into the Rwandan health system. Two new degree programs in Hospital and Healthcare Administration and in International Health Management are therefore planned at the School of Public Health. The Government also recognizes the importance of research. Through the HRH Program, the Health Sciences Research Center will be established
to support Rwandan faculty and students to pursue research opportunities. The Center will connect international researchers with Rwandan researchers, help Rwandan researchers to develop grant proposals and secure funding, and provide statistical and administrative support to research projects.
With initial funding from the US government and contributions from the Rwandan government, HRH is designed as a program that will, at the end of the seven years, become fully funded and managed by the Rwandan government. The program is designed to offer the trainees locally relevant research opportunities as well as access to international funding and publication opportunities, through collaborations that will spark innovation, push quality and increase retention.
Case 1: Tanzania’s Ifakara Health Institute – a local program with regional relevance
Balancing priorities in research collaboration between resource-poor and resource-rich nations has proven difficult. The history of research in the developing world has been, perhaps unintentionally, largely determined by scientists from developed countries, in ways that have not always benefited the resource-poor countries. In this dominant (yet improving) climate, the Ifakara Health Institute (IHI), established in
1949 by a Swiss doctor and now an independent, non-profit organization led by Tanzanians, is an interesting example.
Tanzania’s 2010 Health Sector Assessment revealed mixed performance over the past decade. Significant improvements were noted: an increase in total expenditures for health (including the government’s contribution), a decline in HIV prevalence and in
infant and under-five mortality. Serious challenges were also highlighted, including “increasingly scarce HRH worsened by poor HR management.”1 In collaboration with local universities, IHI is trying to address some of these challenges as an autonomous research-based entity.
1 M., Stephen, G. Chee, R. Patsika, E. Malangalila, D. Chitama, E. Van Praag and G. Schettler. (2011). Tanzania Health System Assessment 2010. Bethesda, MD: Health Systems 20/20 project, Abt Associates Inc.
AfricA HeAltH forum 2013 finAnce And cApAcity for results 2 3AFRICA HEALTH FORUM 2013: FINANCE AND CAPACITY FOR RESULTS46

Between 2005 and 2009, IHI staff produced over 100 peer-reviewed papers and created an electronic database of Tanzania-specific research. IHI develops and employs Tanzanian scientists, who in 2011 published 55 reports covering public health topics ranging from disease-specific research (malaria) to health systems research. Through collaboration with other countries (Malawi, Mozambique, Kenya), IHI seeks to better understand issues of accountability, impact of policies and outcomes of investments in healthcare workforce development. This makes IHI’s research relevant
to local and regional policies. The Institute has been able to secure competitive research grants for more than 80 percent of its income, supplemented by funding from the governments of Tanzania, Switzerland, UK, Ireland and Norway.
IHI’s model also includes training. In partnership with local universities, IHI offers short courses and programs to build local capacity for research. IHI has established partnerships with Sokoine University of Agriculture, University of Dodoma, the Hubert Kairuki Memorial University and more recently the Nelson Mandela African
Institute of Science and Technology (NMAIST-Arusha). Through these partnerships, senior IHI scientists assist with the design, development and delivery of the courses taught at these universities in Tanzania, while offering research opportunities for their faculty. This mutually beneficial arrangement is expected to ensure that IHI expertise is put to use in teaching, while also enabling academic staff to pursue their research interests. Other universities in Ghana, Senegal, Kenya, and South Africa have similar programs aimed at increasing the region’s research expertise.
in Africa, the continent does have 554 think tanks, 53 in Kenya alone. The African Economic Research Consortium (AERC) is an example of an organization concerned with researching current topics on the continent as well as training the next generation of African researchers. AERC uses technology to make publications accessible to both the public sector and the public and encourages cross-country collaboration. Its fellowships and training programs are attended by students from 27 countries, many of whom move into public sector positions. The potential for this model that combines technology, training and research with cross-country collaboration is of great value to the region. Other think tanks such as AMREF, CRES and HSCR have also taken on this challenge. Continued support for these efforts should be considered.
THE CHALLENgE OF BuILDINg A HEALTHCARE WORKFORCE FOR gOVERNANCE The literature on healthcare workforce development emphasizes the need for clinicians and healthcare technicians who can deliver clinical services. However, there is also an urgent need for professionals trained in administration, policy, and research who can forecast, plan and manage the sector.
African universities can play a major role in building the country’s public health governance capacity by training skilled public health professionals. Yet, a 2007 article based on 2001-2003 survey data from AfriHealth-CORED showed that over half (55%) of African countries had no postgraduate public health
programs. Of those who did, units offering public health programs were often small.
Also, programs should avoid the tendency to equate training with capacity building, and address other factors, such as retention, especially for graduates hoping to join the public sector. As the number of university programs and research institutions increases, a focus on locally relevant and globally aware studies will ensure that trainees enter the workforce ready to contribute to private sector growth and public sector governance. Public health, public administration and public policy program graduates will need opportunities in academia, independent research institutions and the public sector that provide them with meaningful work, professional development ladders and proper space for innovation.
CASESThe following two cases illustrate models of health systems strengthening through local workforce development and research. One represents an established non-governmental program with a history of growth and change, while the other presents the plan of a recently launched public-sector program with great promise for national transformation.
Case 2: Rwanda’s Human Resources for Health Program
Despite a lot of recent progress in health, rates of maternal and child illness are still high in Rwanda, and the burden of poorly treated diseases is substantial. To make further progress, Rwanda must improve its healthcare workforce. About 633 physicians, 6,970 nurses, and 10 Rwandan dental surgeons serve a population of over 10 million people. WHO considers Rwanda one of 57 countries worldwide with a critical shortage of health workers.
In 2012 the Rwandan Ministry of Health (MOH) decided to address the country’s need for a robust healthcare workforce by building its clinical, research and administrative capacity through an ambitious seven-year Human Resources for Health (HRH) Program. HRH is a model of investment in human capital under country leadership, aligning local and international research-based institutions under one vision. Initiated by a
public health sector dedicated to effective policies and rational implementation, HRH is designed to produce graduates skilled in the use of evidence-based approaches to decision making with a subset dedicated to careers in research.
Setting clear targets to deliver and manage care, the MOH was able to identify local and international partners best equipped to deliver high quality training to young professionals. The government seeks to increase the number of clinicians and introduce the role of ‘health manager’ into the Rwandan health system. Two new degree programs in Hospital and Healthcare Administration and in International Health Management are therefore planned at the School of Public Health. The Government also recognizes the importance of research. Through the HRH Program, the Health Sciences Research Center will be established
to support Rwandan faculty and students to pursue research opportunities. The Center will connect international researchers with Rwandan researchers, help Rwandan researchers to develop grant proposals and secure funding, and provide statistical and administrative support to research projects.
With initial funding from the US government and contributions from the Rwandan government, HRH is designed as a program that will, at the end of the seven years, become fully funded and managed by the Rwandan government. The program is designed to offer the trainees locally relevant research opportunities as well as access to international funding and publication opportunities, through collaborations that will spark innovation, push quality and increase retention.
Case 1: Tanzania’s Ifakara Health Institute – a local program with regional relevance
Balancing priorities in research collaboration between resource-poor and resource-rich nations has proven difficult. The history of research in the developing world has been, perhaps unintentionally, largely determined by scientists from developed countries, in ways that have not always benefited the resource-poor countries. In this dominant (yet improving) climate, the Ifakara Health Institute (IHI), established in
1949 by a Swiss doctor and now an independent, non-profit organization led by Tanzanians, is an interesting example.
Tanzania’s 2010 Health Sector Assessment revealed mixed performance over the past decade. Significant improvements were noted: an increase in total expenditures for health (including the government’s contribution), a decline in HIV prevalence and in
infant and under-five mortality. Serious challenges were also highlighted, including “increasingly scarce HRH worsened by poor HR management.”1 In collaboration with local universities, IHI is trying to address some of these challenges as an autonomous research-based entity.
1 M., Stephen, G. Chee, R. Patsika, E. Malangalila, D. Chitama, E. Van Praag and G. Schettler. (2011). Tanzania Health System Assessment 2010. Bethesda, MD: Health Systems 20/20 project, Abt Associates Inc.
AfricA HeAltH forum 2013 finAnce And cApAcity for results 2 3SUMMARY REPORT 47

This brief was drafted by Claire-Cecile Pierre, Harvard University, ahead of Africa Health Forum 2013: Finance and Capacity for Results, an event co-hosted by the World Bank and the U.S. State Department Office of Global Health Diplomacy, in collaboration with Harmonization for Health in Africa. The findings, interpretations, and conclusions expressed in this brief do not necessarily reflect the views of the Executive Directors of the World Bank or the governments they represent, or of any of the hosting entities and partners.
Every day, Ministers of Health, Ministers of Finance and senior managers have to make critical decisions about their goals for social protection, the structure of their health systems, and the budget allocations needed to reach these goals. Many have proposed that these decisions have greater impact if they are based on real-time, context-appropriate data and evidence. The World Health Organization (WHO) emphasizes that six areas must be addressed and aligned for a successful health system: health service delivery, health workforce, health information systems, access to essential medicines, health systems financing, and leadership and governance. This paper will explore the ways in which research institutions can strengthen two of these building blocks: a) health workforce development in the public sector and b) governance through locally relevant research and data to support policy and decision making.
THE PROMISE OF AFRICAN RESEARCH Greater capacity in African research institutions raises the potential availability of locally relevant data for evidence-based decisions in
the public sector. The values of research institutions—among them rigorous critical thinking, knowledge sharing, and training—should make them strong contributors to the global health equity movement. But competition for funding and the tendency to be theory-based rather than implementation-based have limited their impact. Over the past three decades, however, research institutions have increasingly
developed models of partnership which address these challenges.
Think tanks that review studies, analyze practice data and compare models to generate advice on local and global issues can enable policymakers and the public to make informed decisions. Despite the recent reduction in the number of global think tanks, and the relatively small percentage operating primarily
QuESTIONS TO MINISTERSGiven the resources already available, including increasing amounts of country-specific, country-directed research, what additional tools and platforms
do Ministers of Health and of Finance envision to a) continue to strengthen local institutions to undertake such research and become centers of excellence
b) improve the translation of this research into national policies that support their decision making process on health care financing? The Roles of Research-Based, Non-State Actors in
Building Capacity for Effectiveness and Sustainability in Africa’s Health Sector
KEy MESSAgESn Research will have greater impact when locally relevant and
regionally contextualized, with country-specific data and practices included in the analysis.
n Research-based, non-state actors can build capacity and effectiveness in the health sector by improving evidence-based policy through research, and strengthening governance through training.
n Building a health workforce includes training public policy, administration, and management practitioners, as well as clinicians and technicians.
n Strong public-sector research units are needed to collect, interpret, and analyze data to ensure informed policies and critical reviews of private research findings.
n Under country ownership, public-private research and training partnerships can result in country-wide workforce development.
n Impact must be rigorously measured. Think tanks and research institutions should be tracked not just on the number of publications, but also the impact of their recommendations, and on whether the graduates from their training programs can plan, manage and implement change.
2013
REFERENCES
African Economic Research Consortium. (2011). Annual Report, 2010/11. Nairobi, Kenya.
Bulletin of the World Health Organization. (2007). Mapping Africa’s advanced public health education capacity: the AfriHealth project. Geneva, Switzerland.
Ifakara Health Institute. (2009). IHI strategic plan, 2008-2013: “delivering operational excellence”. Dar es Salaam, Tanzania.
Mbadlanyana, T., Nompumelelo S., and J. Cilliers. (2011). Shaping African futures: think tanks and the need for endogenous knowledge production in Sub-Saharan Africa. Foresight, 13, 64-84.
Novak, S. (2012, May 12). Hands-on medical education in Rwanda. The New York Times.
The World Bank. (2013). Setting reasonable performance targets for public service delivery. Washington, DC: Azevedo, J. P. and Newman, J.
The World Bank. (2013). Using administrative data to evaluate municipal reforms. Washington, DC: Bruhn, M. and McKenzie, D.
University of Pennsylvania, International Relations Program. (2013). Think tanks and civil society program. Philadelphia, PA.
M., Stephen, G. Chee, R. Patsika, E. Malangalila, D. Chitama, E. Van Praag and G. Schettler. (2011). Tanzania Health System Assessment 2010. Bethesda, MD: Health Systems 20/20 project, Abt Associates Inc.
World Health Organization. (2007). What is health policy and systems research and why does it matter? Geneva, Switzerland: Sara Bennett.
World Health Organization. (2008). Maximizing positive synergies between health systems and global health initiatives. Geneva, Switzerland: Sara Bennett.
AFRICA HEALTH FORUM 2013: FINANCE AND CAPACITY FOR RESULTS48
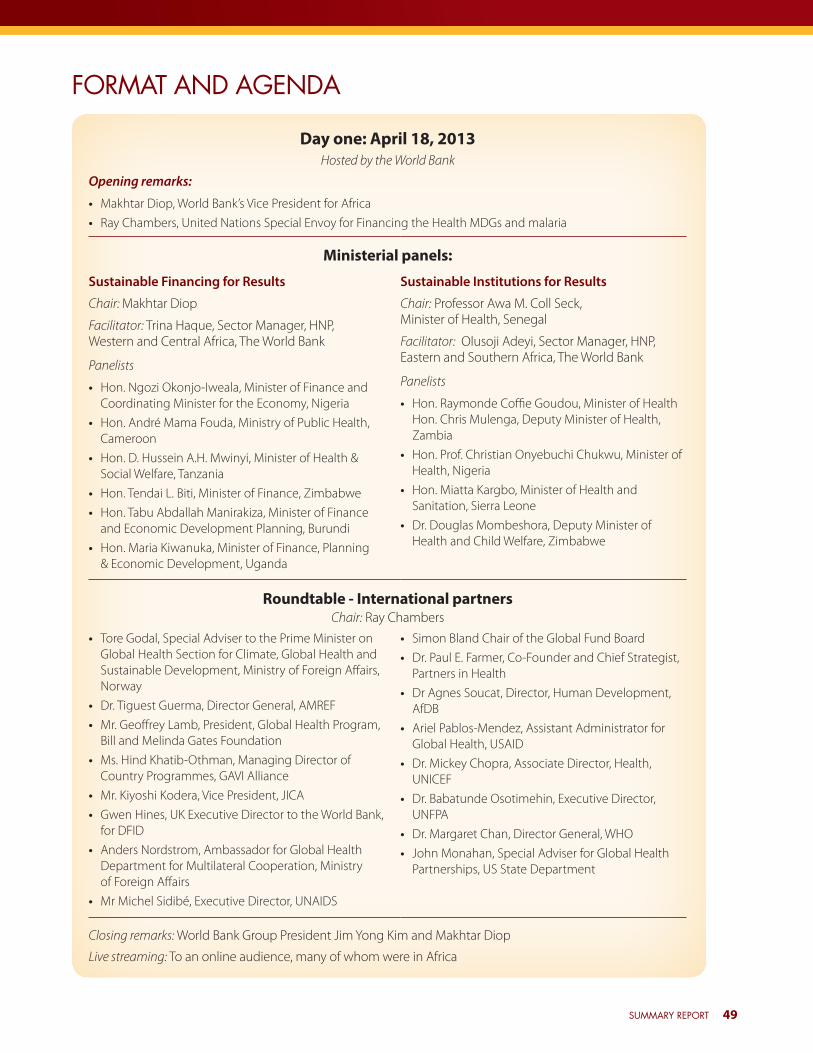
Day one: April 18, 2013Hosted by the World Bank
Opening remarks:
• Makhtar Diop, World Bank’s Vice President for Africa• Ray Chambers, United Nations Special Envoy for Financing the Health MDGs and malaria
Ministerial panels:
Sustainable Financing for Results Sustainable Institutions for Results
Chair: Makhtar Diop
Facilitator: Trina Haque, Sector Manager, HNP, Western and Central Africa, The World Bank
Panelists
• Hon. Ngozi Okonjo-Iweala, Minister of Finance and Coordinating Minister for the Economy, Nigeria
• Hon. André Mama Fouda, Ministry of Public Health, Cameroon
• Hon. D. Hussein A.H. Mwinyi, Minister of Health & Social Welfare, Tanzania
• Hon. Tendai L. Biti, Minister of Finance, Zimbabwe• Hon. Tabu Abdallah Manirakiza, Minister of Finance
and Economic Development Planning, Burundi• Hon. Maria Kiwanuka, Minister of Finance, Planning
& Economic Development, Uganda
Chair: Professor Awa M. Coll Seck, Minister of Health, Senegal
Facilitator: Olusoji Adeyi, Sector Manager, HNP, Eastern and Southern Africa, The World Bank
Panelists
• Hon. Raymonde Coffie Goudou, Minister of Health Hon. Chris Mulenga, Deputy Minister of Health, Zambia
• Hon. Prof. Christian Onyebuchi Chukwu, Minister of Health, Nigeria
• Hon. Miatta Kargbo, Minister of Health and Sanitation, Sierra Leone
• Dr. Douglas Mombeshora, Deputy Minister of Health and Child Welfare, Zimbabwe
Roundtable - international partnersChair: Ray Chambers
• Tore Godal, Special Adviser to the Prime Minister on Global Health Section for Climate, Global Health and Sustainable Development, Ministry of Foreign Affairs, Norway
• Dr. Tiguest Guerma, Director General, AMREF• Mr. Geoffrey Lamb, President, Global Health Program,
Bill and Melinda Gates Foundation• Ms. Hind Khatib-Othman, Managing Director of
Country Programmes, GAVI Alliance• Mr. Kiyoshi Kodera, Vice President, JICA• Gwen Hines, UK Executive Director to the World Bank,
for DFID• Anders Nordstrom, Ambassador for Global Health
Department for Multilateral Cooperation, Ministry of Foreign Affairs
• Mr Michel Sidibé, Executive Director, UNAIDS
• Simon Bland Chair of the Global Fund Board• Dr. Paul E. Farmer, Co-Founder and Chief Strategist,
Partners in Health• Dr Agnes Soucat, Director, Human Development,
AfDB • Ariel Pablos-Mendez, Assistant Administrator for
Global Health, USAID• Dr. Mickey Chopra, Associate Director, Health,
UNICEF• Dr. Babatunde Osotimehin, Executive Director,
UNFPA• Dr. Margaret Chan, Director General, WHO• John Monahan, Special Adviser for Global Health
Partnerships, US State Department
Closing remarks: World Bank Group President Jim Yong Kim and Makhtar Diop
Live streaming: To an online audience, many of whom were in Africa
FORMAT AND AGENDA
SUMMARY REPORT 49

Day two: April 19, 2013Hosted by U.S. State Department’s Office of Global Health Diplomacy
Opening remarks:
• Ambassador Leslie V. Rowe, Deputy Special Representative at the U.S. Office of Global Health Diplomacy • Deputy Secretary of State William J. Burns
Summary of day one:
• Ritva Reinikka, Director, Human Development in the World Bank’s Africa Region
Technical panels:
Making the Most of What We Have for Sustainable Health Systems Strengthening
Expanding the Health Resource Base Toward Universal Coverage
Chair: Dr. Nils Daulaire, Assistant Secretary for Global Affairs, U.S. Department of Health and Human Services
Facilitator: David de Ferranti, President, Results for Development Institute
Panelists
• Dr. Sharif Shahnaaz Kassim, Director, Ministry of Public Health and Sanitation, Kenya
• Hon. Yah Martor Zolia, Deputy Minister for Planning, Ministry of Health and Social Welfare, Liberia
• Hon. Prof. Christian Onyebuchi Chukwu, Minister of Health, Nigeria
• Dr. Agnes Soucat, Director, Human Development, African Development Bank
Chair: Dr. Ariel Pablos-Mendez, Assistant Administrator, Global Health Bureau, U.S. Agency for International Development
Facilitator: Daniella Ballou-Aares, Senior Development Advisor, Office of the Secretary, U.S. State Department
Panelists
• Dr. Addis Tamire Woldemariam, Director General, Federal Ministry of Health, Ethiopia
• Professor A.M. Coll Seck, Minister of Health, Senegal
• Dr. Uzziel Ndagijimana, Permanent Secretary, Ministry of Health, Rwanda
• Dr. Bokar Toure, Director, Health Systems and Services Cluster, WHO-AFRO
Closing remarks:
• Hon. D. Hussein A.H. Mwinyi, Minister of Health & Social Welfare, Tanzania • Hon François Ibovi, Minister of Health and Population, Republic of Congo• Ambassador Eric Goosby, head of the U.S. Office of Global Health Diplomacy and U.S. global AIDS
coordinator
AFRICA HEALTH FORUM 2013: FINANCE AND CAPACITY FOR RESULTS50

PARTICIPANTS
Featured Forum participants included Ministers of Finance, Ministers of Health, and senior health officials from 30 African countries: Benin, Botswana, Burundi, Cameroon, Côte d’Ivoire, Democratic Republic of Congo, Republic of Congo, Equatorial Guinea, Ethiopia, Gabon, the Gambia, Ghana, Guinea, Kenya, Lesotho, Liberia, Mozambique, Niger, Nigeria, Rwanda, Senegal, Seychelles, Sierra Leone, South Africa, South Sudan, Swaziland, Tanzania, Uganda, Zambia, and Zimbabwe.
The Forum also drew principals and senior officers from international health funding and development agencies, private foundations, centers of excellence, and civil society organizations:
• African Development Bank (AfDB), African Union (AU), Economic Community of West African States (ECOWAS), Common Market of Eastern and Southern Africa (COMESA), Southern Africa Development Community (SADC), Office of the UN Secretary General’s Special Representative for Financing the Millennium Development Goals (MDGs) and Malaria, the Joint United Nations Programme on HIV/AIDS (UNAIDS), United Nations Economic Commission for Africa (UNECA), United Nations Population Fund (UNFPA), United Nations Children’s Fund (UNICEF), World Health Organization (WHO), and Stop TB Partnership.
• DFID, Japan International Cooperation Agency, Norway, Sweden, and U.S. government agencies (Health and Human Services, Office of Global Health Diplomacy, and U.S. Agency for International Development).
• Bill and Melinda Gates Foundation, Clinton Health Access Initiative, Children’s Investment Fund Foundation (UK), GAVI Alliance, Global Fund to Fight AIDS, Tuberculosis and Malaria, Management Sciences for Health, Partnership for Maternal, Newborn and Child Health, Rockefeller Foundation, and Roll Back Malaria.
• African Health Economics Association (AfHEA), African Leaders Malaria Alliance, African Medical and Research Foundation, Center for Global Development, Ghana Coalition of NGOs in Health, Health Systems Action Network, One Campaign, Partners in Health, Save the Children, and Sightsavers.
SUMMARY REPORT 51


The Africa Health Forum 2013: Finance and Capacity for Results was hosted by the World Bank and the
U.S. State Department Office of Global Health Diplomacy, in collaboration with Harmonization for Health in Africa.


![SUMMARY OF NEGOTIATIONS · World Bank with a request that the World Bank Executive Directors be invited to adopt Annex C to this Summary, Draft World Bank Resolution No. [IBRD 2018-xxx],](https://img.pdfslide.us/doc/110x75/5e6c06686ddea24c4128f890/summary-of-negotiations-world-bank-with-a-request-that-the-world-bank-executive.jpg)