Embed Size (px)
Citation preview

Summary Report on a
Survey of State Experiences with
MtBE and Other Oxygenate Contamination
at LUST Sites
August 2003
A Project of the New England Interstate Water Pollution Control Commission (NEIWPCC)
Boott Mills South 100 Foot of John Street, 1st Floor
Lowell, Massachusetts 01852-1124

2
Introduction
In 2002, the New England Interstate Water Pollution Control Commission (NEIWPCC) received a grant from the EPA Office of Underground Storage Tanks to develop and conduct a survey of the states, the District of Columbia, and the U.S. territories to determine how MtBE and other oxygenate contamination is affecting state LUST programs and the cleanup of contaminated sites. This survey is a follow-up to a survey conducted in 2000 by NEIWPCC that focused mostly on state experiences with MtBE at LUST sites.
The 55-question (plus numerous subquestions) “Survey of State Experiences with MtBE and Other Oxygenate Contamination at LUST Sites” focused on the following oxygenates: methyl tertiary-butyl ether (MtBE), tertiary-butyl alcohol (TBA), ethanol, tert-amyl methyl ether (TAME), ethyl tertiary-butyl ether (EtBE), and diisopropyl ether (DIPE). As with the 2000 survey, all 50 states responded. (None of the territories or D.C. responded.)
Ellen Frye of Enosis—the Environmental Outreach Group, conducted the survey for NEIWPCC. The survey questions were developed with input and suggestions from several state and federal leaking underground storage tank (LUST) program personnel and one environmental consultant. Special thanks to Patricia Ellis, Delaware Department Natural Resources and Environmental Control, Tank Management Branch, for her invaluable assistance in the question-development effort.
The following summary of state responses provides an impressive snapshot of state experiences with MtBE and oxygenates, to date. We urge you to also examine the compiled results of the survey, available on NEIWPCC’s Web site at www.neiwpcc.org. From these responses, you will learn far more about state experiences than we could possibly include in this summary. Many states took the time to explain their answers in careful detail. Inasmuch as this survey was designed to capture information from the states for the states, we particularly hope that state UST/LUST program personnel will use this information to learn from each other.
We hope that by conducting this survey, more states will begin to seek answers to the kinds of questions we’ve asked, so that, in time, we will all better understand the occurrence and extent of oxygenates in LUST-related soil and groundwater environs. Forty-three states consider oxygenates other than MtBE to be a current, impending, potential, or unknown problem. We thank all who took the time to respond to this survey.

3
1. State Oxygenate Standards MtBE Forty-two states reported that they have action levels, cleanup levels, or drinking water standards for MtBE. One state has proposed standards. Thirty-eight states had MtBE standards in 2000. (See Table 1.) For a complete at-a-glance picture of state MtBE action levels, cleanup levels, and drinking water standards from both the 2000 and 2003 surveys, see Appendix 1. The levels in the appendix are shown in parts per million (ppm) for soils and parts per billion (ppb) for groundwater. As you will see from this chart, while many states have shifted oxygenate concentration levels toward increased protectiveness over the past three years, the shift has not been dramatic. The following is a characterization of state MtBE levels as of March/April 2003: • Twenty-three states have soil action levels ranging from 0.005 to 60 ppm, with average levels around 0.3 ppm. (20 states had soil action levels in 2000.) • Twenty-seven states have soil cleanup levels ranging from 0.005 to 319,000 ppm, with average levels around 0.3 ppm. (28 states had soil cleanup levels in 2000.) Many levels vary considerably and/or are site-specific, depending on risk-related conditions. • Thirty-one states have groundwater action levels ranging from 12 to 202,000 ppb, with the greatest percentage of levels in the 20 to 70 ppb range. (26 states had groundwater action levels in 2000.) Again, it is important to note that risk is a big factor in many action determinations. For example, 202,000 ppb represents Hawaii’s “drinking water not threatened” level; 20 ppb is its “drinking water threatened” level. • Thirty-four states have groundwater cleanup levels ranging from 10 to 51,000,000 ppb, with the greatest percentage of levels in the 20 to 70 ppb range. (32 states had groundwater cleanup levels in 2000.) For many states, these values are very risk dependent. For example, Oregon’s value is 20 – 51,000,000 ppb. The Oregon response notes that the “applicable risk-based concentration for a given site is based on the relevant exposure pathway(s).” • Twelve states have primary drinking water standards ranging from 10 to 240 ppb. • Six states have secondary Drinking Water Standards ranging from 5 ppb to 400 ppb. • Eleven states use EPA’s drinking water advisory range (20-40 ppb) as a drinking water standard. • Thirteen states have some kind of state (or other) “health advisory.” These range from 20 to 200 ppb.
Many states provided additional comments to explain the details of their standards. These notes provide a more complete picture of how action and cleanup levels are used in remediation decision making. Fifteen states are considering making changes to their levels; primarily to either lower existing MtBE standards or add standards for other oxygenates.

4
Other Oxygenates Table 1 shows the number of states that, as of this survey, have some kind of an action level, cleanup level, or drinking water standard for each of the oxygenates of concern. Methanol was added to this list because seven states listed this oxygena te under “other” in the survey. Table 2 shows the various action and cleanup levels for the few states that address TBA, ethanol, TAME, EtBE, DIPE, and methanol. For those who are interested in how oxygenate as well as MtBE levels were determined, the survey compilation provides the names of the state contact person(s) who has this information. Table 1. Numbers of states that currently have, or expect to have, oxygenate action levels, cleanup levels, or drinking water standards. (Comparison data for 2000 and 2003 available only for MtBE.) Oxygenate 2000 2003 Proposed
(as of 2003)
MtBE
38 42 1
TBA
7 3
Ethanol
4
TAME
4 1
EtBE
3 2
DIPE
6 2
Methanol
7
Other Anything detected would trigger action/must be reported
3

5
Table 2. State oxygenate action levels, cleanup levels, and drinking water standards. Oxygenate
Soil Action Level
Soil Cleanup Level
Groundwater Action Level
Groundwater Cleanup Level
Drinking Water Level
TBA 50 ppb, 78, 000 ppb, 100 mg/Kg, any detected
4.1 ppm, 78,000 ppb, site-specific
12 ppb, 140 ppb, 1.0 mg/L, 3,900 ppb, any detected
100 ppb, 3,900 ppb, site-specific
15 ppb, 50ppb, 3,900 ppb
Ethanol 100 mg/Kg, 3.8X10⁷ppb, any detected
3.8X10⁷ppb, site-specific
1.0 mg/L, 1.9X10⁶ ppb, any detected
1.9X10⁶ ppb, site-specific
50 ppb, 1.9X10⁶ ppb
TAME 3,600 ppb, 3,900 ppb, any detected
3,900 ppb, site-specific
190 ppb (aesthetic), 910 ppb (health), any detected
190 ppb (aesthetic), 910 ppb (health), site-specific
190 ppb (aesthetic), 910 ppb (health), 50 ppb
EtBE 980 ppb, any detected
980 ppb, site-specific
49 ppb (aesthetic), any detected
49 ppb (aesthetic), site-specific
49 ppb (aesthetic), 50 ppb (health)
DIPE 0.37 ppm, 100 ppm, 600 ppb, any detected
0.37 ppm, 600 ppb, site-specific
0.07 ppm, 1.0 ppm, 30 ppb, any detected
0.07 ppm, 20 ppm, 30 ppb, site-specific
0.07 ppm, 30 ppb, 50 ppb
Methanol 33,000 ppm (residential, 340,000 non-residential), 1,000 ppm, 74,000 ppb, any detected
10 ppm, 18 ppm, 3,700 ppb, 4,000 ppb, any detected
5,000 ppm, 3,700 ppb, 50 ppb, 3.5 ppm
Enforceability and Change
The enforceability of oxygenate levels varies from state to state. Fifteen states reported that their MtBE and/or groundwater standards for oxygenates are enforceable. Ten states indicated that the levels they use are advisory, not enforceable, or questionable. Other state enforceability responses included all standards, any level that is part of a corrective action plan, action and/or cleanup levels, MtBE in drinking water, or failure to notify. The detailed explanations provided by the states are available in the survey compilation. Twelve states have recently changed some aspect of their fuel-oxygenate standards, and 15 states are considering making changes. The primary reasons why changes were or will be implemented were to add MtBE to the state list of chemicals of concern or guidance, to make MtBE levels more protective, or to add other fuel oxygenates as contaminants of concern.
Asked if U.S. EPA could provide any assistance with regard to making any changes to fuel-oxygenate standards, 27 states said “yes,” six said “no,” and seven did not know. With regard to the kind of assistance they would like from U.S. EPA, 21 states indicated they wanted MCLs for the oxygenates, nine said technical assistance, two said health advisories, and four said toxicological data.

6
2. Oxygenate Analysis Table 3 shows how many states require sampling and analysis for the listed oxygenates in the various fuel-release scenarios in groundwater at LUST sites. Table 4 addresses the same parameters in soil. All but two states indicated they require sampling and analysis for at least MtBE in groundwater. Of the two that do not, Kentucky said that sampling is required for drinking water sources only, and Alaska said that sampling can be required by a project manager on a case-by-case basis. Only 34 states responded that they require sampling and analysis for MtBE in soil. Table 3. Numbers of states that require sampling and analysis for specific oxygenates in groundwater at LUST sites. Oxygenate
All suspected releases
Gasoline only
Heating oil
Jet fuel Diesel fuel
Waste Oil
MtBE 17 31 6 8 7 1 TBA 5 11 4 2 Ethanol 1 5 2 2 TAME 4 8 3 2 EtBE 4 7 3 2 DIPE 4 9 2 4 3 Other (e.g., TBF, Methanol, ETBA)
2 4 1 1
Table 4. Numbers of states that require sampling and analysis for specific oxygenates in soil at LUST sites. Oxygenate
All suspected releases
Gasoline only
Heating oil
Jet fuel Diesel fuel
Waste oil
MtBE 12 22 4 5 4 1 TBA 3 7 2 1 Ethanol 1 3 TAME 3 5 1 EtBE 3 5 1 DIPE 3 5 1 2 1 Other (e.g., TBF, Methanol, ETBA)
3 3
Sampling Frequency Tables 5 and 6 indicate the percent of the time states request oxygenate analysis of groundwater and soil at LUST sites. Forty-one states indicated that they request

7
analysis for MtBE in groundwater 80 to 100 percent of the time; 28 states request this analysis in soil 80 to 100 percent of the time. Several states indicated they request this analysis for the other oxygenates at this frequency. Another small group of states indicated they request this analysis for the other oxygenates up to 20 percent of the time. Table 5. Percent of the time states request oxygenate analysis of groundwater at LUST sites. Percentage (of the time)
MtBE TBA Ethanol TAME EtBE DIPE Other oxygen-ates
0 - 20%
3 9 7 7 7 7 6
20 - 40%
40 - 60%
1 1
60 - 80%
2 1
80 - 100%
41 10 3 7 7 8
Percentages based on: Ø Hard data - 10 Ø Estimates - 33
Table 6. Percent of the time states request oxygenate analysis of soil at LUST sites. Percentage (of the time)
MtBE TBA Ethanol TAME EtBE DIPE Other oxygen-ates
0 - 20%
2 4 2 2 2 2 2
20 - 40%
40 - 60%
1
60 - 80%
1 1 1 1 1 1
80 - 100%
28 6 2 4 4 5
Percentages based on: Ø Hard data - 8 Ø Estimates - 20
Analytical Methods Tables 7 and 8 show the most commonly used analytical methods for each of the oxygenates. For both groundwater and soil, US EPA SW-846 Method 8240/8260 (GC/MS) is used most commonly for all the oxygenates, US EPA SW-846 Method

8
8020/8021 (GC/PID), a combination of 8020/21 and 8240/60, and US EPA Drinking Water Method 524 (GC/MS) are the second, third, and fourth most commonly used methods. Table 7. Analytical methods used by states for oxygenates in groundwater. Method
MtBE TBA Ethanol TAME EtBE DIPE Other Oxygen-ates
US EPA SW-846 Method 8020/8021 (GC/PID)
23 1 1 1 1 1 1
US EPA SW-846 Method 8240/8260 (GC/MS)
31 11 6 10 10 10 4
A combination of 8020/21 and 8240/60
19 8 4 6 5 5 2
US EPA Drinking Water Method 502 (GC/PID)
4 1
US EPA Drinking Water Method 524 (GC/MS)
12 5 2 4 3 3 1
A combination of 502/524 ASTM D4815 1 1 2 2 2 Others: • 1 - State-specific method – IA • 1 - Modified 8260 • 1 - 8015 • 1- SW-846 Method 5031 • 1 - All EPA methods that meet NH specs • 2 - EPA 602 • 1 - 6210 D

9
Table 8. Analytical methods used by states for oxygenates in soil. Method
MtBE TBA Ethanol TAME EtBE DIPE Other Oxygen-ates
US EPA SW-846 Method 8021 (GC/PID)
15 1 1 1 1 2 1
US EPA SW-846 Method 8260 (GC/MS)
19 4 2 4 4 5 2
A combination of 8021 and 8260 18 7 4 5 4 5 2 US EPA Drinking Water Method 502 (GC/PID)
US EPA Drinking Water Method 524 (GC/MS)
1 1 1 1 1 1 1
A combination of 502/524 ASTM D4815 1 1 2 2 2 Others: • 1 – GC/MS version of IA method • 1 – 8015 • All methods that meet NH specs. • 1 – Modified Method 624

10
3. Site Assessment Only four states said they investigate MtBE or other oxygenate plumes differently from BTEX plumes because of the potential for “diving” plumes. Seventeen states said they did so “rarely” and one state said “in some cases.” Twenty-five states said they do not investigate oxygenate plumes differently. It is clear, however, that many states are aware of the diving plume issue but that many deal with this situation on a case-by-case, risk-related basis. Eleven states said they require 3-dimensional characterization of MtBE plumes; one state said “sometimes.” (Seventeen said yes to this question in 2000, but mostly occasionally.) Thirteen states said they have documented one to five cases of diving plumes, three said 10 to 15 cases, and six said more than 15 cases. Twenty-two states said they are taking extra steps to make sure oxygenates are not migrating beyond standard monitoring parameters. One state said extra steps are taken on a site-specific basis; one said rarely; one said in some cases; and one said sometimes. Twenty-three states said they are not taking any extra steps.
The typical types of steps cited included: • Multi- level sampling (nested wells, shorter-screened wells) • Deeper wells • Monitor drinking water wells downgradient or in the area of an MtBE release • Use of tracers in plume analysis. In instances where there is no state standard for an oxygenate compound, states
were asked what factors they use to determine when to test for them. Seven states had no deciding factors. Other state responses are summarized as follows:
• Depth to groundwater 0 • Groundwater flow rate 0 • Proximity to drinking water receptor 16 • General vulnerability analysis 7 • All of the above. 9 Other factors: • When the presence of other compounds in a release product is suspected. • Try to look for oxygenates at a release site at least once. • Regulations require testing for oxygenates in all soil and groundwater samples collected. • Required to sample for MtBE when an UST system is near domestic-use wells, springs, and cisterns. • When there is a large MtBE release with anaerobic conditions. • Orphan sites. • Risk-based. • The presence of MtBE triggers sampling for other oxygenates. • Conduct a full analysis once or twice a year at select sites with high MtBE concentrations.

11
New Jersey has research planned to document the ability/effectiveness of GC/MS methods to identify other oxygenates. Thirty-five states allow for dynamic work plans (i.e., field-determined based on site conditions) with respect to well placement and screen positions. Thirteen states allow for this sometimes. Oxygenate Detections
States were asked to provide hard data or estimates of percent detections of the oxygenates they sampled and analyzed in groundwater and soil during 2002. Tables 9 and 10 provide the averages and ranges of the state responses. Eleven states indicated that they do not have this information. Table 9. Percent detections of oxygenates sampled and analyzed in groundwater during 2002. Oxygenate
All suspected releases
Gasoline only
Heating oil
Jet fuel Diesel fuel
MtBE Average: 54% Range: 3.5 – 100%
Average: 60% Range: 5 – 96%
Average: 15% (2 entries)
1 entry: 100%
Average: 15% (2 entries)
TBA Average: 1% (3 entries) Range: 30-32% (2 entries)
Average: 36% Range: 1 – 75%
Ethanol 1 entry: 11%
TAME Average: 9.6% Range: 4 – 15%
Average: 32% Range: 4 – 40%
EtBE Average: 6.5% (2 entries)
Average: 18% (3 entries)
DIPE Average: 6.5% (2 entries)
Average: 23.6% Range: 5 – 50%
Other oxygenates (e.g., methanol, TBF, ETBA)
SC data: ETBA – 31%; TBF – 7%; TAA – 47%
Ø Hard data – 9 Ø Estimates - 27

12
Table 10. Percent detections of oxygenates sampled and analyzed in soil during 2002. Oxygenate
All suspected releases
Gasoline only
Heating oil
Jet fuel Diesel fuel
MtBE Average: 38% Range: 3.4 – 100%
Average: 45% Range: 10 – 90%
TBA 1 entry: 10% 1 entry: 60% Ethanol TAME 1 entry: 10% EtBE DIPE 1 entry: 20% Other oxygenates
Ø Hard data – 5 Ø Estimates - 11
Reopening Sites Six states indicated they are considering reopening some sites to look for MtBE, six said they did not know, and 38 said they are not. Two states said they were considering reopening sites to look for TBA. The criteria for reopening a site included: new information, such as impacted wells or receptors; property transfers/real estate Phase 2; and concerns about sites closed prior to the introduction MtBE assessment in the state. When asked how many previously closed sites had been reopened because of post-closure detection of oxygenates, 22 states said “none,” eight provided estimates ranging from 1 to 20, and 19 did no t know. Reasons why sites has been reopened included suspected contamination, environmental audit of a no further action site, potential impact to potable water, and property transfer/real estate Phase 2.
Table 11 lists 31 state estimates/hard data on how many sites were closed before analysis of MtBE or other oxygenates was required. As stated above, most of these sites will never be reopened unless site-specific concerns emerge. The remaining states were not able to provide this information. Four states anticipated that more information would need to be gathered at some of these sites; 16 did not expect that more information would be needed; 11 did not know. Table 11. Numbers of sites closed before analysis of MtBE or other oxygenates was required listed by state (estimates or hard data supplied). CA - 10,000 ME - none, testing for
MtBE began in the mid 1980s.
PA - 2,000
CO - 4,755 MD – 5,500 RI - very few, MtBE has been analyzed in LUST samples since the 1980s.
DE – 1,020 sites MN – ~ 100. Full VOC SC – 1,311
13
w/documented gasoline releases
sampling has been required at all sites since at least 1989.
FL - few sites were closed before the Division requested MtBE sampling at LUST sites—required for almost 15 years.
MS - ~ 5,770 TX – 9,000-10,000
HI - 600 MT – 1,225 UT – 1,930 ID – hundreds NE – 2,300 VA - >5,000 IL – 10,000 NV – ~ 2,000 VT – 360 before 1991 IN – 180 NH – 4 sites; however,
many were closed when the standard was much higher.
WA - ~5,000
IA – nearly 2,150 NM - MtBE analysis was required very early in the program.
WY - 400
KY - 8,975 OH - 4,500 LA - several thousand OK - 1,400 Exceeding Action Levels
States were asked to give their best estimate of how often oxygenate levels exceed groundwater action levels. Table 12 provides a summary of state responses. Table 12. Percent of the time oxygenate levels exceed groundwater action levels. Percent (of the time)
MtBE TBA Ethanol TAME EtBE DIPE
0 - 20% 16 5 2 4 4 4 20 - 40% 5 40 - 60% 6 1 1 60 - 80% 6 1 80 - 100% 9 Don’t know 5 2 3 3 3 3 Percentages are based on: Ø Hard data – 8 Ø Estimates – 30
Concentrations in the Environment States were asked what, in their experience, had been the highest concentration of oxygenates in the hot spot/core of an oxygenate plume and at the receptor. Table 13 provides a listing of state responses. Reported concentrations in MtBE hot spots ranged from 200 to 9,131,994 ppb; receptor concentrations ranged from 6 to 28,000 ppb. (These concentrations are considerably higher than those reported in 2000.) Concentrations in TBA hot spots ranged from 215 to 250,000 ppb; receptor concentrations ranged from 12 to 1,000 ppb. Concentrations in TAME hot spots ranged from 41 to 170,000 ppb; receptor concentrations ranged from <5 to 1,000 ppb.

14
Table 13. Highest concentration of oxygenates in the hot spot/core of an oxygenate plume and at the receptor, state by state. Oxygenate Hot spot/core of plume
(ppb) Receptor (ppb)
MtBE AK -10,300; AZ - 68,000; AR - >10,000; CA - 2,000,000; CO - 170,000; CT - 100,000; DE - 300,000; GA - 300; ID - 50,000; IA - 99,400; KS, MD - 500,000; LA- 25,000; ME -1,000,000; MI - 344,000; MN – 73,000; MT - 19,800; NE - 38,610; NV - 220,000; NH - 180,000/170,000; NJ - >500,000; NM - 450,000; NY - 4,400,000; NC - >10,000; OH - 265,000; OR - 250,000; RI - 2,200,000; SC - 2,500,00*; SD, TN - 200; TX - 9,131,994; UT - 101,000; VA - 1,240,000; VT - 536,000; WA - 7,150; WV - 5,000; WI - 4,000*; WY - 4,300
AR - 350; CT, DE - 25,000; IN - 450; IA - 63; GA, MN - 50; KS -1,300; LA -1,000; ME - 6,500; MD, SC* -1,000+; MO - 335; MT - 30; NE - 5.5; NV - ~10; NH - 10,000; NJ - 1,000-4,500; NY - 28,000; NC - 800; OH - 360; OR - 185; RI - 1,100; SD - 200; TN - 70-80; TX - 2,000-3,000 (est.); UT- 6; VA - 44,144*; VT - 27,000; WV - <20; WI - 1,700**, WY - 2,250
TBA CA - 99,000; ME - 215; NV - 50,000; NH - 200,000; NJ - 250,000; SC - 39,400; VT - 811
DE -1,000 (est.); ME - 215; NH - 48; VA - ~500*, VT - 12
Ethanol SC - 9,800,000 TAME DE -170,000; ME -41;
MD - 50-100; NV - 240; NH - 4,500; SC - 1,700; VT - 20,300
DE -1,000 (est.); ME - 41; MD - 5 or less; NH - 70; VT - 14
EtBE ME, NV - ~20; NH - 10s-100s; SC - 60; VT - 622
MD -5 or less; NH - 2.1
DIPE MD-5 -100; NH -10s-100s, SC - 8,700; VT - 296
MD -5 or less; NH -0.68; VT - 1
Other oxygenates (e.g., methanol, TBF, ETBA)
SC: ETBA - 7,940, TBF - 20,800, TAA - 76,000
DE – Receptor a public or private well, not a compliance point. MI - Concentrations at receptors not independently tracked. Water wells have been impacted at 22 sites. Approximately 700 sites have MtBE impacts over 40 ppb in groundwater. SC* – Listed values for MtBE are not from the same release at the same site but are the highest values reported as of March 15, 2003. VA* - In sample collected from water supply well. WI* - *estimate at monitoring well; **actual at water supply well.

15
4. MtBE Plume Lengths Eighteen states say they track MtBE plume lengths from gasoline releases; 15 say they sometimes do. Average MtBE plume lengths reported by the states are summarized in Table 14. Sixteen states reported that these plumes are often longer than typical BTEX plumes; 16 said they are sometimes longer, 3 said rarely, and 12 did not know. Table 15 summarizes the maximum length of any MtBE plume observed in a state. The MtBE plume in East Patchogue (Long Island), New York was more than 9,000-feet long. Table 16 summarizes the maximum length of any MtBE plume observed in bedrock. Only 17 states were able to provide estimates for this question. Table 14. Average MtBE plume lengths. Plume length (feet) Number of states 10 - 50 0 51 – 100 3 101 – 250 12 251 – 500 10 >500 2 Don’t know 8 Table 15. Maximum length any MtBE plume observed in a state. Plume length (feet) Number of states 50 – 250 1 250 – 500 3 500 – 1000 2 1000 – 5000 26 >9,000 1 Don’t know 16 Table 16. Maximum length any MtBE plume observed in bedrock in a state. Plume length (feet) Number of states 50 – 250 0 250 – 500 3 500 – 1000 3 1000 – 5000 11 Don’t know 30
16
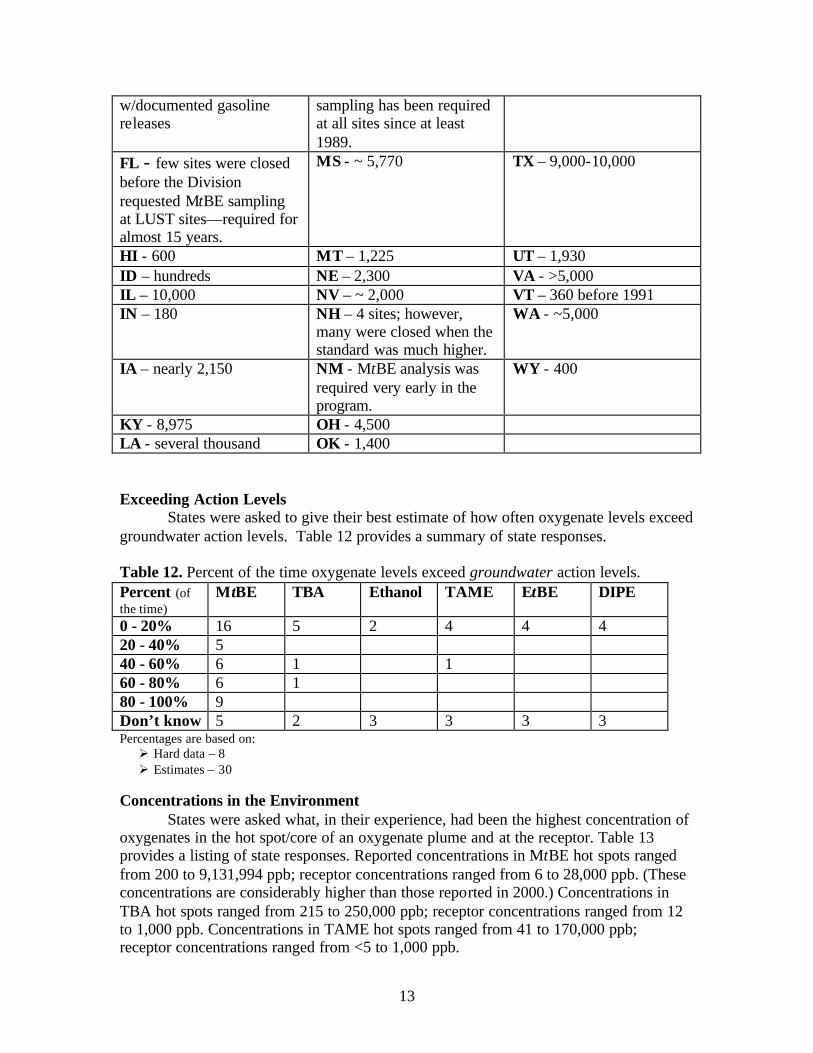
5. MtBE Impacts in Drinking Water
Twenty-four states reported that their drinking water program requires routine analysis for MtBE in drinking water. (This number was the same in 2000.) Seven states did not know the answer to this question. Again, the failure of 26 states to routinely analyze for MtBE reflects back to the lack of a federal MCL. Drinking water programs in Minnesota, New Hampshire, New Mexico, and Rhode Island began analyzing for MtBE in the mid to late 1980s. Most of the other states began analysis in the late 1990s to early 2000s. Sixteen states reported that their LUST program routinely reviews MtBE data from the drinking water program. Based on these responses, it appears that there is a disconnect between more than half of the state LUST programs and drinking water programs.
Table 17 state estimates of numbers of public and private drinking water wells that have been contaminated by MtBE at any level. Thirteen states did not know or did not have access to information as to how many public and private drinking water wells in their state have been contaminated by MtBE at any level. (The survey defined public wells as groundwater supply systems that serve more than 25 households.)
The New Hampshire Department of Environmental Services and the United States Geological Survey (USGS) are in the process of conducting a random sampling of wells in that state. So far, about 25 percent of the wells tested have some level of MtBE, mostly very low levels. New Hampshire’s estimate of 30,000 to 40,000 private wells with some level of MtBE is based on a statistical calculation of existing information on the prevalence of MtBE at detectable concentrations and the early results of this study. Table 18 summarizes state responses to the question of how many private well users states provided with bottled water or point-of-use treatment because of oxygenate problems. Thirty states did not have this information. Table 17. State estimates of numbers of public and private drinking water wells that have been contaminated by MtBE at any level. # of wells # of states (private) # of states (public) 1 - 10 9 12 11 - 50 3 7 51 - 100 6 2 101 - 500 9 5 > 500 (provide an estimate) NH – 30,000 – 40,000
NY - 866
Table 18. Number of private well users provided with bottled water or point-of-use treatment because of oxygenate problems. # of wells Number of states 1 – 10 9 11 – 50 3 51 – 100 4 101 – 500 7 >500 2

17
6. Oxygenate Remediation
Thirty-three states said that MtBE drives the cleanup or investigation activities at LUST sites either never or less than 20 percent of the time. This would suggest that for more than half of the states MtBE is not a significant factor in release remediation. For five states, however, MtBE drives cleanups 60 to more than 80 percent of the time. Table 19 summarizes these responses. Table 19. Percentage of time that MtBE drives the cleanup or investigation activities at LUST sites. Percentage of time Number of states Never 12 < 20 21 20 – 40 4 40 – 60 3 60 – 80 3 > 80 2 Don’t know 5 The states were asked what percentage of their LUST sites are undergoing remediation for the oxygenates of concern in this survey. However, because the wording of the question did not make it clear whether we were asking about oxygenate-only sites or oxygenate/BTEX sites (our intent), the results indicate two different interpretations. Therefore, this information cannot provide any useful insight as to trends. The state responses were as follows: • MtBE: AZ >50%; CO, HI - 1%; DE -50%; FL -90%; ID, OR - 20%; IL, NE,
VA <10%; IN - 57%; KS – 30%; KY, MN, MS, ND, OK- 0%; LA <20%; ME, RI - 80%; MI - 3.4%; MT – 30%; NV – 60-80%; NH – 10%; NM – 43%; NC – 5%; OH – 14%; SC – 85%; TN, UT – 15%; TX, WY - <1%; VT – 20-40%; WV – 2%
• TBA : DE - 20%; MT <1%; NV - 10% • TAME DE - 20%; NV – 1% • EtBE NV – 1% • DIPENV – 1% • Don’t know - 16 states States with no standards for the oxygenates of concern in this survey were asked to indicate if they require treatment for any specific oxygenates. Very few states answered this question. The responses for the states that did are as follows:

18
• MtBE: 12 • Ethanol: 5 • TBA: 8 • TAME: 7
• EtBE: 8 • DIPE: 7 • Other oxygenates (e.g., methanol,TBF, ETBA): 7
Experiences with Remediation of MtBE
States were asked what percentage of their LUST remediation cases are at sites where MtBE is the only concern. Thirteen states responded that they have no such sites; most of the other states indicated they have fewer that 10 percent. California reported that it has about 10 percent of MtBE-only cases, which amounts to about 1,350 sites in that state. Maine reported 40 percent, which amounts to about 643 sites. Twenty-eight states reported that BTEX has been successfully remediated but MtBE remains at less than 10 percent of sites; two states said 20 to 30 percent of sites; and one said 30 to 50 percent of sites. Texas responded that MtBE remains at 50 to 70 percent of its sites, about 5,000 to 7,000 sites. Eighteen states did not have this information. The states were asked how long it takes, on average, to clean up sites with MtBE levels greater than 100 ppb and less than 100 ppb. Responses for levels greater than 100 ppb ranged from 6 months (OK) to 10 years (CA). Of the 15 states that answered this question, the average was 3 to 5 years. For levels less than 100 ppb, responses ranged from 1 to 7 years. Of the 12 states that answered this question, the average was 2 to 5 years. Thirty-four states said they have remediated sites with MtBE contamination to closure; seven said they have not; and nine said they did not know. When asked how many sites with MtBE contamination they have closed, ten states said more than 100, two said 51 to 100, seven said 11 to 50, and five said 1 to 10. Alabama said about 400 and Arkansas said about 250. When asked if their state is taking a more aggressive role in nonaqueous-phase liquid (NAPL) recovery to prevent MtBE plumes from migrating off site, 17 said yes, 26 said no, 4 said they have always been aggressive with NAPL recovery, and 2 did not know. This question should have been worded such that a comparison was clearly being made between 2000 and 2003. As it stands, the “no” answers to this question could mean that the states are simply not very aggressive or that they are aggressive but no more so than any other time. The four states that indicated they have always been aggressive made statements to that effect in their responses
By “aggressive” states generally indicated that they do one or more of the following:
• Remove the NAPL • Undertake source control/over excavate • Treat release as an emergency response when NAPL present • Aggressively recover free product FP recovery/bail, vacuum.
Thirty-eight states that use risk-based decision making (RBDM) in corrective action said they account for MtBE in the process; seven said they do not; two do not use

19
RBDM; two did not know. (In 2000, 34 states said they account for MtBE in the process.) Thirteen states said they account for other oxygenates in the RBDM process. States said they account for the oxygenates in the RBDM process in the following ways:
• Consider them chemicals of concern • Treat the same as BTEX • Establish site-specific levels for oxygenates using available data • Establish a pseudo-reference dose based on parameters used to calculate other chemicals of concern • Require calibration for TBA in water analytical methods; GC/MS sampling methods used for contaminant ID. • Use same institutional controls as for MtBE • Base corrective action decisions on estimated risk to receptors • Chemical must pose no significant risk based on a standard or a site-specific risk assessment • Use risk-based criteria for common oxygenates • Require that the plume be defined and stable or decreasing • Base risk on proximity to nearby wells.
Experiences with Remediation Technologies States were asked to rate technologies they have used to remediate oxygenates in soil and groundwater using the following codes: poor (P), moderately good (MG), good (G), very good (VG). Table 20 summarizes the state responses as rated for each technology and oxygenate. Fourteen states were not able to answer this question. It is interesting to see the variety of MtBE ratings for just about every technology. The most widely used technologies for remediation of MtBE in soil were soil vapor extraction (SVE) and biodegradation, and probably excavation (was added by the states under the “other” category). As would be expected, the ratings for SVE leaned toward the “good” end of the spectrum, while those for biodegradation leaned toward the “poor” end. The variety of ratings within specific groundwater remediation technologies provides a greater portion of food for speculation. While it is no surprise that pump and treat and monitored natural attenua tion get overall poor marks and that point-of-use treatment and soil excavation get overall high marks, even these technologies have some more positive and more negative ratings. Ratings for most of the other groundwater technologies seem to go every which way. Ratings for the other oxygenates are too few to be significant. The speculative aspect of these ratings is the question of why state responses vary so widely for given technologies. Does this variation have anything to do with geography and soils? Does it have to do with limited experience with a technology so that whatever the success or failure, that is where current state opinion rests? Does it have to do with the manner in which the technology has been applied—competence versus incompetence in the field? The heart of the answer probably lies with the fact that all remediation is site-specific. The state responses provide us with a snapshot of experiences with technologies, but not a compelling sense of success trends.

20
Table 20. State ratings of technologies they have used to remediate oxygenates in soil and groundwater. (Ratings = poor (P), moderately good (MG), good (G), very good (VG).) Medium Technology MtBE Ethanol TBA TAME EtBE DIPE Soil Soil vapor extraction
MG–10 G–3 VG-12
VG-1 P-1
MG-1
Low temperature thermal desorption
G-1 VG-3
VG-1 VG-1
Biodegradation
P-12 MG-6 G-3
G-1
Other technologies, or combinations of technologies: Dual-phase extraction – VG-1 Excavation – MG-1, VG-6; VG – 1 (TBA) ORC – VG-1 <3% Hydrogen peroxide – VG-1 Overexcavation – VG-1
Groundwater Point-of-use treatment
(e.g., carbon, air stripping) MG-4 MG/G-1 G-9 VG-9
P-1 VG-1
MG-1 MG/G-1
Pump and Treat
P-9 MG-7 MG/G-1 G-8 VG-2
VG - 1 MG-1
Air sparging
P-1 MG-12 MG/G-1 G-6 VG-7
VG - 1 MG-1
Biosparging
P-4 MG-3 G-5 VG-3
VG-1
Bioreactor
P-2 MG/P-1 MG-2 G-1

21
Medium Technology MtBE Ethanol TBA TAME EtBE DIPE Monitored Natural
Attenuation
P-8 P/MG-1 MG-13 G-1 VG-4
VG - 1
Dual-Phase Extraction/ Multi-Phase Extraction
MG-7 G-12 G/VG-1 VG-6
VG – 1, MG/G - 1
G/VG – 1, G - 1
Soil Excavation
P-1 P/MG-1 MG-3 G-9 VG-13
VG – 1, P/MG – 1
G – 1, P/MG - 1
Chemical oxidation
P-5 MG-5 G-4 G/VG-1 VG-1
MG-1
Enhanced Aerobic Bioremediation (e.g., bugs and nutrients, oxygen sparging, ORC)
P-5 P/MG-1 MG-2 G-6 VG-4
VG-1, G - 1
MG-1
Other technologies, or combinations of technologies AS/SVE in combination w/chemical destruction – VG-1 (M tBE, TBA, TAME) Phytoremediation for low levels (<100 ppb) - G-1 Free product removal, fluid-vapor recovery – MG-1
22
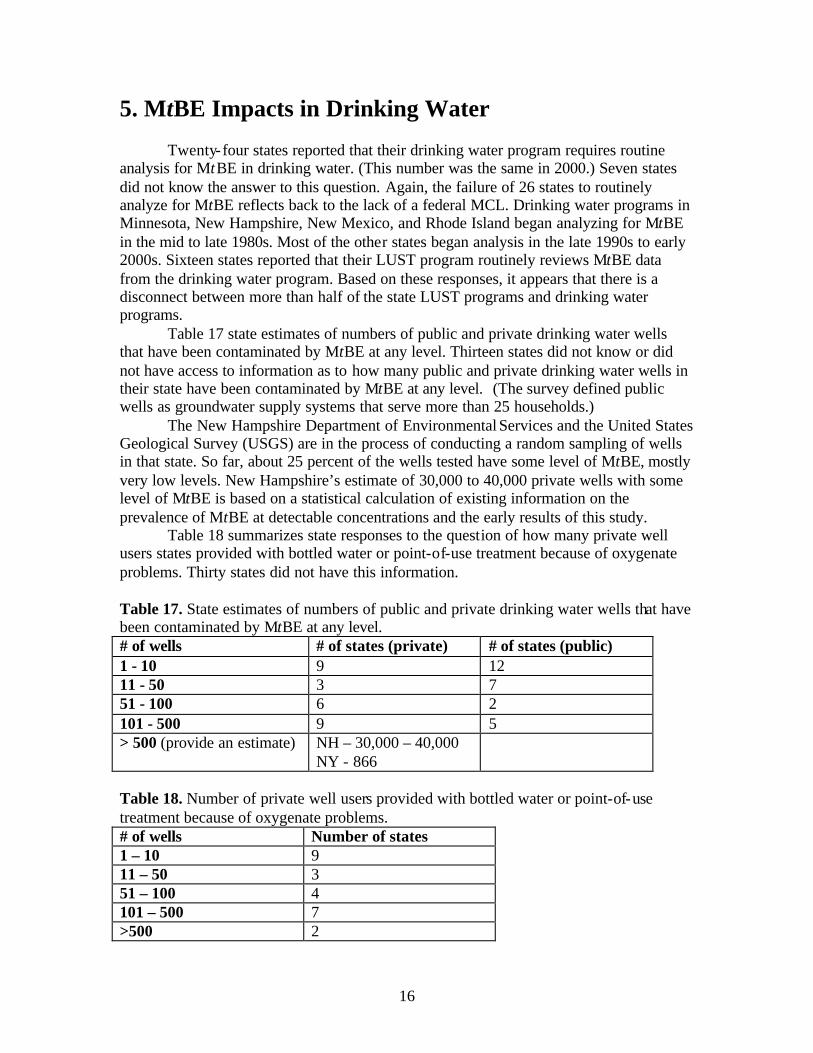
7. Remediation Cost Impacts
Twenty-three states said that MtBE has had a noticeable impact on the cost of LUST-site remediation, 19 said it has not, seven do not know, and one suspects it will. (In 2000, 15 states indicated they had experienced increased costs associated with MtBE remediation.)
In Table 21, states were asked to estimate what percent of their sites fall into each of the categories in the right-hand column. Most of the states entered their responses so that the percentages in each of the left-hand boxes added up to 100 percent. A few states checked off only one box, so their response was recorded as 100 percent, meaning that their cleanups averaged out to that percentage because of MtBE. California and New York, however, specifically wrote in 100 percent in a single category. The right-hand column also included the averages of the percentages of sites for each cost increase category. Table 21. Estimated percentages of sites that fall into cleanup-cost-increase categories. Effect of MtBE on Cleanup Costs
Percentage of Sites
No increased cost 53% of the time averaged
DE, NH - 10; NV - 20; MT, SC-80; KS, RI -40; IN, VT - 50; CT - 70;FL - 90; IL >95
Small increase in cost (< 20% more) 38% of the time averaged
FL - 5; ME - 10; MT - 10-15; CT, NV, OR, RI, VT -20; AR, DE, IN, NH - 30; KS - 40; SC - 47; WV - 50; VA->95; MD, MO - 100
Significant increase in cost (20 – 50%) 28% of the time averaged
FL - 3; MT <5; CT - 5; VT <10; IN, ME - 10; SC - 18; RI – 30; DE, NH - 40; NV - 45; WV - 50;NY - 100
Very significant increase in cost (50 – 100%) 10% of the time averaged
OR <1; FL - 2; IL , VA <5; CT, SC - 5; RI - 9; VT <10; IN, KS, MT, NV, NH - 10; DE - 15; ME - 50
Cost more than doubled 20% of the time average w/CA 8.5% average without/CA
IN <1; RI - 1; SC- 3; NV <5; DE - 5; VT <10; FL, KS, NH - 10; ME - 30; CA - 100
States provided the following reasons why MtBE has driven up remediation costs: • Longer plumes • Difficulty to air strip • Inefficiency of carbon • Depends on environmental sensitivity of area • More mobile, less biodegradable than BTEX • More wells, more investigation • Need for 3-D site characterization

23
• Higher installation and O&M costs • MtBE-only sites, so all costs are MtBE-related • Additional monitoring • Cost of corrective action directly related to size, length, width, depth of plume • Receptor impacts • High MtBE concentrations • Carbon break-through

24
8. Long-Term Management of LUST Sites
The biggest question associated with long-term management of LUST sites is that when residual levels of contaminants are left in the soil, will long-term protection of human health be assured? Ten states said that none of their sites have been closed at something other than a fixed cleanup level. Other responses ranged from 1 to 100 percent with varying reasons. Twenty-two states did not have this information. Forty-eight states said that in their UST/LUST program “no further action” (NFA) for petroleum hydrocarbons and oxygenates in soil, water, and groundwater means inactivation of the file or no further action at this time (with a possible re-opener in the future). Only one state (IL) said that NFA means no further action at any future time (i.e., release of responsibility for responsible party). One state did not know.
Post-NFA conditions can re-open a site included: • New discovery of product • Any impacts to human health and safety • Impacts to receptors • New information that indicates risk • New release • Vapor intrusion problem • Any reoccurrence of contamination • Change of laws or rules.
Forty states said that NFA criteria or considerations are no different for sites
impacted by BTEX than by MtBE. Eight states said their criteria are different. Thirty-five states said their UST program has requirements/mechanisms for long-
term management of petroleum hydrocarbon residual contamination (BTEX, TPH, or oxygenates) left in place at UST remediation sites. These requirements/mechanisms include:
• Institutional controls (deed restrictions/notice to deed, etc) 25 states • Regional or local land-use restrictions (e.g., zoning) 11 states • Site tracking database 26 states Others provided by states: • Incorporate site into a groundwater management zone • Engineered barriers • Notice to utilities and well permitting authority • Exposure prevention management plan • Soil management plan • Notification to DOT of soil left under roads • Periodic reviews • Classified as “closed-meets standards” or “closed-doesn’t meet standards” • State Registry of Releases lists contaminated properties with no documented human health risk by county, UST permit number, street address, tax map number, and facility latitude and longitude • Site located on GIS.

25
For UST programs that require long-term management of residual petroleum hydrocarbon contamination left in place or beyond NFA, eight states require this for all sites, fifteen require it only for specific types of sites, one requires it only for RNA or monitoring only sites, and one requires it only for groundwater sites. Additional variations on long-term management are provided in the survey compilation. Thirty-two states think their UST/LUST program’s current or available mechanisms for long-term management of residual contamination are sufficient to protect receptors from potential future exposure, six do not, and ten do not know. Six states said that additional long-term management guidance or legislation is planned, one said maybe, and ten did not know.

26
9. Vapor-Intrusion Pathway
Draft U.S. EPA guidance for evaluating the Vapor-Intrusion Pathway (November 29, 2002) has been published for comments and review at: http://www.epa.gov/correctiveaction/eis/vapor.htm. The guidance is suggested for use at Brownfields, RCRA Corrective Action, and Superfund sites for evaluating environmental indicators. The guidance is specific in stating that it should not be used at UST/LUST sites; however, Indiana and Pennsylvania have incorporated earlier versions in draft guidance for evaluating the pathway at all sites. This section of our survey was designed to gain an understanding of the status of the states with respect to vapor intrusion guidance. It does not directly relate to the subject of oxygenates.
Twenty-three states have guidance for evaluating the vapor- intrusion pathway, three have guidance in draft of in progress, 22 do not, and one is evaluating the prospect. Of the states that have guidance, drafts, or work in progress, 25 said the guidance is applicable to UST/LUST sites, and one said sometimes. Seventeen said the guidance applicable to other programs as well. Thirteen states are considering making revisions to their vapor- intrusion pathway guidance. Seven states without guidance said they are considering implementing guidance, one said maybe. The survey compilation provides Web addresses provided by the states that have guidance.

27
10. Oxygenate Miscellany
Over the years, there has been some speculation as to whether the introduction of various oxygenates into gasolines is causing any compatibility problems with the UST-system components. We decided to ask the states if they had observed any compatibility/functionality issues with the storage and use of gasolines that contain the various oxygenates. California suggested that MtBE is incompatible with automatic tank gauging capacitance technology. Alabama, Delaware, and Nevada express suspicions that MtBE may be the cause of failures they have seen, but they have not documented any causes. Nineteen states said they had not had any compatibility/functionality issues related to MtBE; 28 states did not know. The bottom line here is the data do not exist. Twenty-two states (24 in 2000) said they are finding oxygenate contamination that they are unable to attribute to an UST release (e.g., AST, auto accident, lawn mower); 12 said they are not, and 16 did not know. The suggested sources for these non-UST oxygenates were:
• Environmental washout in surface water • Surface spills – auto accidents, lawnmowers, auto maintenance, UST overfills • Sloppy housekeeping/gasoline handling • ASTs • Junkyards • Use of fuel in brush pile burning or as an insecticide.
Eight states said their program has documented trends of oxygenate impacts in
soil or groundwater from UST facilities where a product release has not been confirmed; 31 states had not and 10 did not know. For the states that had noted trends, the suspected mechanisms included the following:
• Vapor releases, leaking sumps, housekeeping • Surface spills during delivery and dispensing • Boat, auto repair, and auto salvage operations • On-site migration.
Thirty seven state respondents said they consider oxygenates other than MtBE to be a potential or unknown problem; six consider them to be a current problem, two, an impending problem, and six, not a problem. One state did not know. (Two states split their vote among the choices.) We asked the forty-three states that consider oxygenates other than MtBE to be a current, impending, potential, or unknown problem what kind of information could your program use to better deal with oxygenate issues. Their responses consisted of the following:
• Information on physical and chemical characteristics • An analysis of the issues and investigation of sites • Remediation technologies and site characterization • MCLs and toxicological data • Health-based data • Information on what is being added to gasoline at refineries • Guidance on level of effort needed to protect receptors • Cleanup standards
28
• Information on fate and transport • Information on vapor releases impacting groundwater • Testing methods for spill bucket and piping sumps.
For the six states that do not perceive oxygenates to be a problem in their state,
their reasons why included the following: • Use of MtBE is down, trend of problem sites is down, and cleanups are no more complicated than BTEX • Not finding many oxygenates when testing for VOCs • Other than MtBE, oxygenates are in low levels • Not much RFG in the state • Oxygenates are not significant drivers in remediation • State uses mostly ethanol as its oxygenate, and risks are low • Haven’t been a problem.
29
11. Conclusions
This survey provides us with a snapshot of state experiences with MtBE and other oxygenates at LUST sites. The results of this survey, when taken together, are much like a work of art; if viewed thoughtfully, the information can speak volumes.
The survey shows that while many states have made a shift in requiring more protective oxygenate concentration levels over the past three years, the shift has not been dramatic. For example, since 2000, only five additional states have, or expect to have, MtBE action levels, cleanup levels, or drinking water standards. Seven or fewer states have standards or levels for any of the other oxygenates addressed in this survey.
The variability in cleanup, action, or drinking water levels or the absence of levels continues to reflect back to the lack of federal leadership in producing MCLs or health and toxicity information for any of the oxygenates. As one respondent noted: “If MtBE is considered by EPA to be a national issue, then it ought to be a national priority. The federal government should give priority to all fuel oxygenates in terms of research. They need to establish a reference dose, a cancer potency factor, or an MCL for all of the oxygenates.”
Some states have moved ahead with adopting action levels or cleanup levels—conservative or less so—grabbing at some aspect of information that is available, such as a reference dose. A number of states have zeroed- in on either the earlier EPA advisory of 70 ppb or the more recent advisory of 20 to 40 ppb. Some states have adopted advisory or guidance levels that cannot really be enforceable until a federal standard is available. All in all, it seems clear that many LUST regulators would like nothing better than some solid information that would give credence to their efforts to protect human health and the environment and “stick” when cleanup decisions are put to the test.
The survey itself shows that most of the states are sampling for, analyzing for, and undertaking remediation of MtBE associated with petroleum releases at LUST sites, even without standards. Far fewer, however, are addressing the potential presence of other oxygenates at these sites.
The question that cannot be answered with this survey is: “How seriously are individual states looking for oxygenates?” We can surmise that states with conservative action levels, cleanup levels, or drinking water standards are serious about finding oxygenates in the LUST environment. We can also assume that some states with less stringent standards may still be very serious about sampling and analyzing for oxygenates, doing the best they can with whatever tools they have and focusing primarily on risk to drinking water receptors. But there is also the school of thought that goes “don’t seek, and ye shall not find.”
We learned from the survey which analytical methods states are using. How effective these methods are depends on which compounds are being investigated and the ability of the method as implemented to detect desired concentrations. U.S. EPA has recently released a fact sheet on Analytical Methodologies for Fuel Oxygenates to assist states in this regard.
The survey indicates that MtBE in groundwater is detected in gasoline releases (averaged among the states) 60 percent of the time. We must keep in mind that detection levels that states use vary—the lower the detection level, the more likely the detection.

30
Reported concentrations of MtBE in “hot spots” ranged from 200 to 9,131,994 ppb; receptor concentrations ranged from 6 to 28,000 ppb.
Based on the responses to this survey, most states do not intend to reopen closed sites to look for MtBE or TBA unless they have reason to suspect a problem. Yet 32 states said MtBE plumes are often or sometimes longer than typical BTEX plumes. Only 11 states require three-dimensional characterization of plumes, and less than half of the states are taking extra steps to make sure oxygenates are not migrating beyond standard monitoring parameters. So to what degree are we missing these oxygenates at the site-characterization stage?
Thirty-three states say that MtBE drives cleanup/investigative activities less than 20 percent of the time or never. Most of the states say there are very few cases to none where MtBE is the only concern. In most states, less than 10 percent of the sites have situations where BTEX has been successfully remediated but MtBE remains. We can see from the state ratings of technologies used to remediate oxygenates in soil and groundwater that some technologies have proven to be very successful. Thirty-four states say they have remediated sites with MtBE to closure. When asked approximately how many such sites have been closed, however, state responses indicate that there have been relatively few. More than half of the states are not particularly aggressive in NAPL recovery.
With all of these responses, at first glance it would appear that MtBE is not too big a remediation concern in the states. At second glance, it would appear that we are figuring out how to live with oxygenates in the environment. The majority of states use some form of risk-based corrective action process and most account for MtBE in this process. Most states have some kind of no-further-action provision that allows for inactivation of a file with the possibility for a reopen in the future if circumstances warrant. Most have some kind of long-term management provision to ensure that sites with residual contamination will not be a threat to receptors. Very few states intend to reopen sites that were closed before they had an MtBE standard.
Finally, twenty-three states say MtBE has had a noticeable impact on the cost of remediation in their state. Could this be an additional incentive to leave oxygenates that are not a direct threat to a receptor in place? When we find the relatively few states that seem to be struggling hard with analyzing for, discovering, and cleaning up oxygenates, we are left to wonder, why them?
Although we have learned much through this effort, we find there is still much more we need to know. We mustn’t stop here.