Embed Size (px)
Citation preview
www.ipms-ethiopia.orgwww.eap.gov.et Working Paper No. 30
Canadian InternationalDevelopment Agency
Agence canadienne dedéveloppement international
Summary report of market-oriented developmental changes in the IPMS Pilot Learning Woredas
Federal Democratic Republic of EthiopiaMinistry of Agriculture
Summary report of market-oriented developmental changes in the IPMS Pilot Learning Woredas
Berhanu Gebremedhin,* Dirk Hoekstra, Aklilu Bogale, Kahsay Berhe and Azage Tegegne
* Corresponding author: [email protected]
Improving Productivity and Market Success of Ethiopian Farmers Project (IPMS)—International Livestock
Research Institute (ILRI), Addis Ababa, Ethiopia
ILRI works with partners worldwide to help poor people keep their farm animals alive and productive, increase and sustain their livestock and farm productivity, and find profitable markets for their animal products. ILRI’s headquarters are in Nairobi, Kenya; we have a principal campus in Addis Ababa, Ethiopia, and 14 offices in other regions of Africa and Asia. ILRI is part of the Consultative Group on International Agricultural Research (www.cgiar.org), which works to reduce hunger, poverty and environmental degradation in developing countries by generating and sharing relevant agricultural knowledge, technologies and policies.
© 2012 International Livestock Research Institute (ILRI)
This publication is copyrighted by the International Livestock Research Institute (ILRI). It is licensed for use under the Creative Commons Attribution-Noncommercial-Share Alike 3.0 Unported License. To view this license, visit http://creativecommons.org/licenses/by-nc-sa/3.0/. Unless otherwise noted, you are
free to copy, duplicate, or reproduce, and distribute, display, or transmit any part of this publication or portions thereof without permission, and to make translations, adaptations, or other derivative works under the following conditions:
ATTRIBUTION. The work must be attributed, but not in any way that suggests endorsement by ILRI or the author(s) NON-COMMERCIAL. This work may not be used for commercial purposes. SHARE ALIKE. If this work is altered, transformed, or built upon, the resulting work must be distributed only under the same or similar license to this one.
NOTICE: For any reuse or distribution, the license terms of this work must be made clear to others. Any of the above conditions can be waived if permission is obtained from the copyright holder. Nothing in this license impairs or restricts the author’s moral rights. Fair dealing and other rights are in no way affected by the above. The parts used must not misrepresent the meaning of the publication. ILRI would appreciate being sent a copy of any materials in which text, photos etc. have been used.
Editing, design and layout—ILRI Editorial and Publishing Services, Addis Ababa, Ethiopia.
Citation: Gebremedhin, B., Hoekstra, D., Bogale, A., Berhe, K. and Tegegne, A. 2012. Summary report of market-oriented developmental changes in the IPMS Pilot Learning Woredas. IPMS (Improving Productivity and Market Success) of Ethiopian Farmers Project Working Paper 30. Nairobi: ILRI.
iii
Contents
Tables iv
Figures v
Executive summary 1
1 Background 8
2 Methodology 12
3 Changes in market orientation and market participation of households 13
3.1 Cereals (teff, wheat and rice) 13
3.2 Pulses 17
3.3 Oil crops 21
3.4 Fibre crops 22
3.5 Fruits 22
3.6 Vegetables 28
3.7 Coffee 32
3.8 Improved dairy 33
3.9 Small ruminant fattening 36
3.10 Cattle fattening 38
3.11 Poultry 41
3.12 Apiculture 43
4 Changes in attitude and behaviour about HIV/AIDS 45
5 Extent to which the IPMS approach improved the capabilities of groups, cooperatives and unions 46
6 Extent of institutionalization of the IPMS approach within the PLWs 48
7 Extent to which the IPMS approach has spread to neighbouring woredas 49
8 Conclusions and implications 50
iv
Tables
Table 1. Revenue from the sale of improved market-oriented cereals and pulses production 3
Table 2. Revenue from the sale of improved market-oriented fruits and vegetables production 3
Table 3. Revenue from market-oriented livestock enterprises 4
Table 4. List of priority commodities considered for the developmental change study 10
v
Figures
Figure 1. Map of Ethiopia showing IPMS Pilot Learning Woredas 9
Figure 2. Developments in market-oriented improved teff production 14
Figure 3. Developments in market-oriented improved wheat production 15
Figure 4. Developments in market-oriented chickpea production in Ada’a 17
Figure 5. Developments in improved market-oriented haricot bean production 18
Figure 6. Developments in market-oriented improved lentils production in Ada’a and Atsbi 20
Figure 7. Developments in improved market-oriented banana production in IPMS PLWs 23
Figure 8. Total number of banana trees producing fruits and total production 24
Figure 9. Developments in improved market-oriented papaya production in IPMS PLWs 25
Figure 10. Development in improved market-oriented mango production in IPMS PLWs 26
Figure 11. Developments in improved market-oriented avocado production in IPMS PLWs 27
Figure 12. Developments in market-oriented improved onion production in IPMS PLWs 28
Figure 13. Developments in improved market-oriented tomato production in IPMS PLWs 30
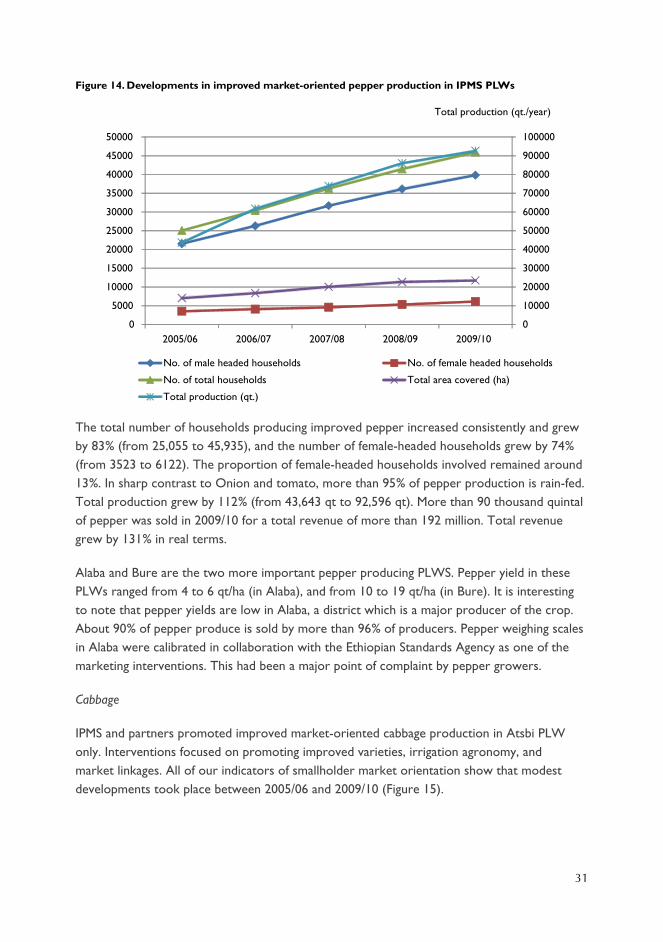
Figure 14. Developments in improved market-oriented pepper production in IPMS PLWs 31
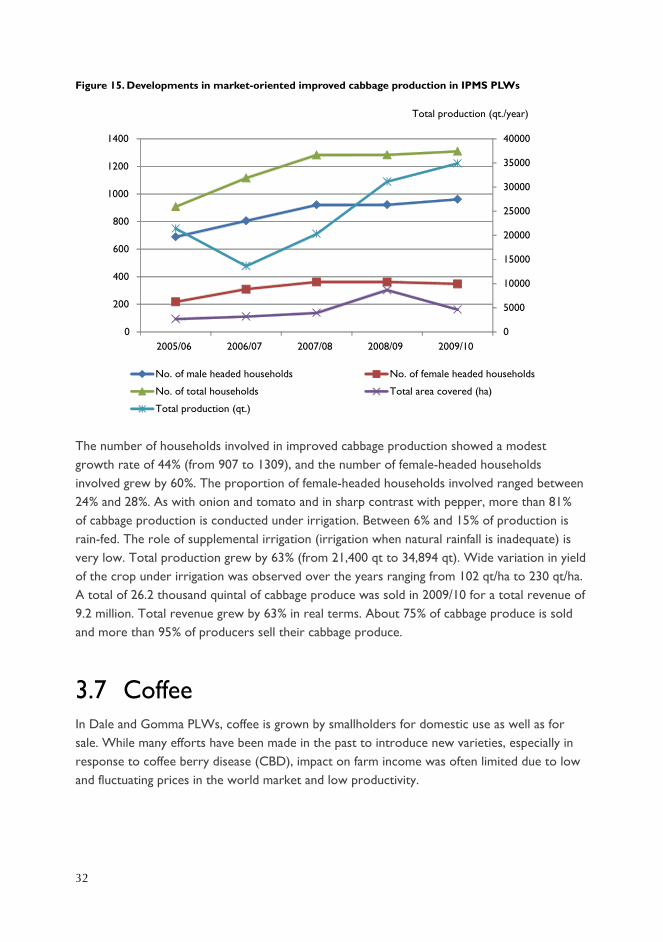
Figure 15. Developments in market-oriented improved cabbage production in IPMS PLWs 32
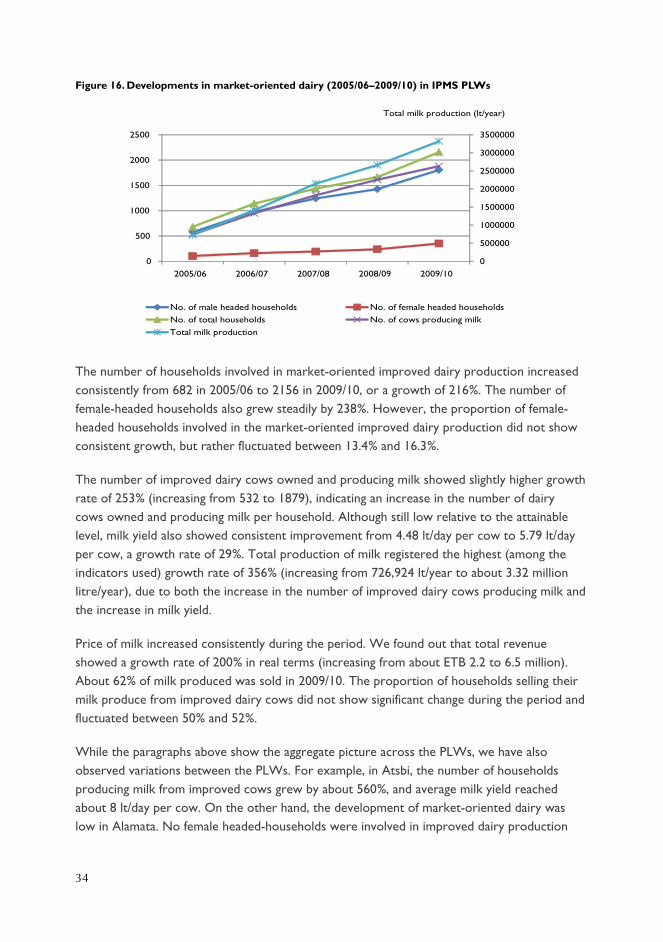
Figure 16. Developments in market-oriented dairy (2005/06–2009/10) in IPMS PLWs 34
Figure 17. Developments in market-oriented small-ruminant fattening (2005/06–2009/10) (number of households involved in fattening) 36
Figure 18. Developments in market-oriented small-ruminant fattening (2005/06–2009/10) (number of animals fattened, sold and revenue) 37
Figure 19. Developments in market-oriented cattle fattening (2005/06–2009/10) (number of households involved) in IPMS PLWs 38
Figure 20. Developments in market-oriented cattle fattening (2005/06–2009/10) (number of animals fattened, sold and revenue) in IPMS PLWs 39
Figure 21. Developments in market-oriented poultry (2005/06–2009/10) production in IPMS PLWs 41
Figure 22. Developments in apiculture using modern hives in IPMS PLWs 43
1
Executive summary
The IPMS project, funded by the Canadian International Development Agency (CIDA) and implemented by the International Livestock Research Institute (ILRI) on behalf of the Ethiopian Ministry of Agriculture (MoA), is intended to demonstrate, on a pilot basis, market-oriented transformation of men and women smallholder farmers in Ethiopia. The project operated in 10 pilot learning woredas (PLW) in the regions of Tigray, Amhara, Oromia and the South.
The project introduced and promoted interventions in close partnership with regional, zonal and woreda partners. Hence, the achievement is joint results of these partnerships.
The overall goal of the project is to contribute to improved agricultural productivity and production through market-oriented agricultural development, as a means for achieving improved and sustainable livelihoods for the rural population’.
The project purpose is to strengthen the effectiveness of the government’s effort to transform agricultural and rural development in Ethiopia through market-oriented agricultural development’.
The IPMS project followed a participatory market-oriented commodity value chain development approach and innovation system perspective to identify and implement its interventions. In this regard, in addition to introducing new and improved production technologies, the project played active roles in promoting innovative institutional arrangements for input supply and marketing, enhanced knowledge sharing mechanisms and linking and building capacities of value chain actors.
The project has the following four objectives
Improved knowledge management,1.
Capacity building of value chain actors2.
Participatory commodity development and3.
Research, synthesis and promotion of lessons and experiences4.
2
Results using several indicators of market-oriented developmental changes showed significant changes between 2005/05 and 2009/10. Key indicators used to measure the changes are number of households involved in the production of improved market-oriented commodities, area covered by such crop commodities, total volume of production, and revenue from the sale of the commodities.
The results are summarized below under three headings:
Effect on market orientation and market participation of producers•
Improvements in input supply and services•
Extent of institutionalization of the IPMS approach within and beyond the PLWs•
Effect on market orientation and market participation of producers
Market orientation and market participation of producers as measured by the revenue generated from the production and sale of the improved market-oriented commodities at constant prices has improved significantly, registering high growth rates.
Cereals and pulses
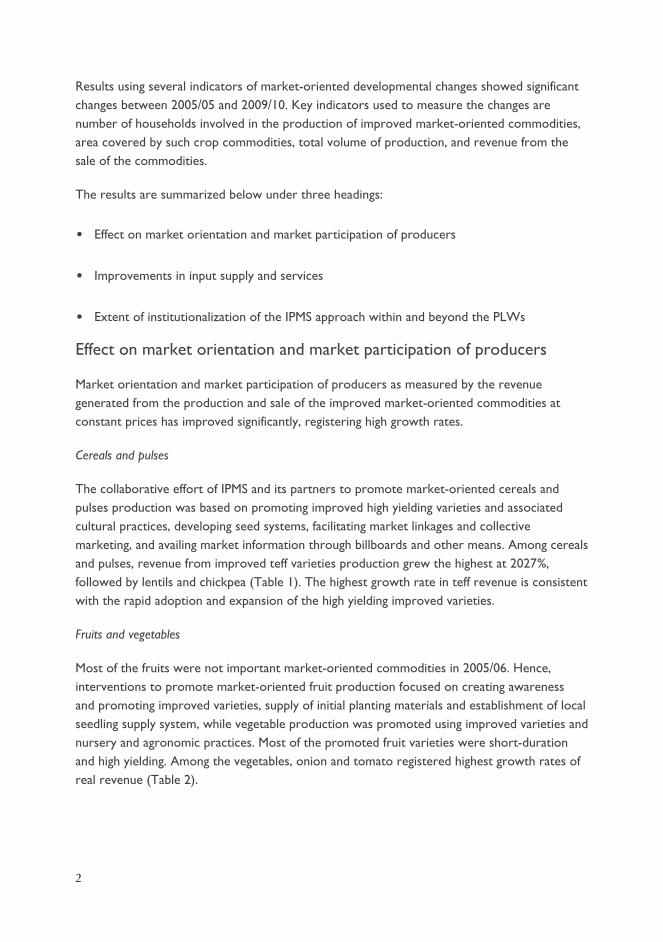
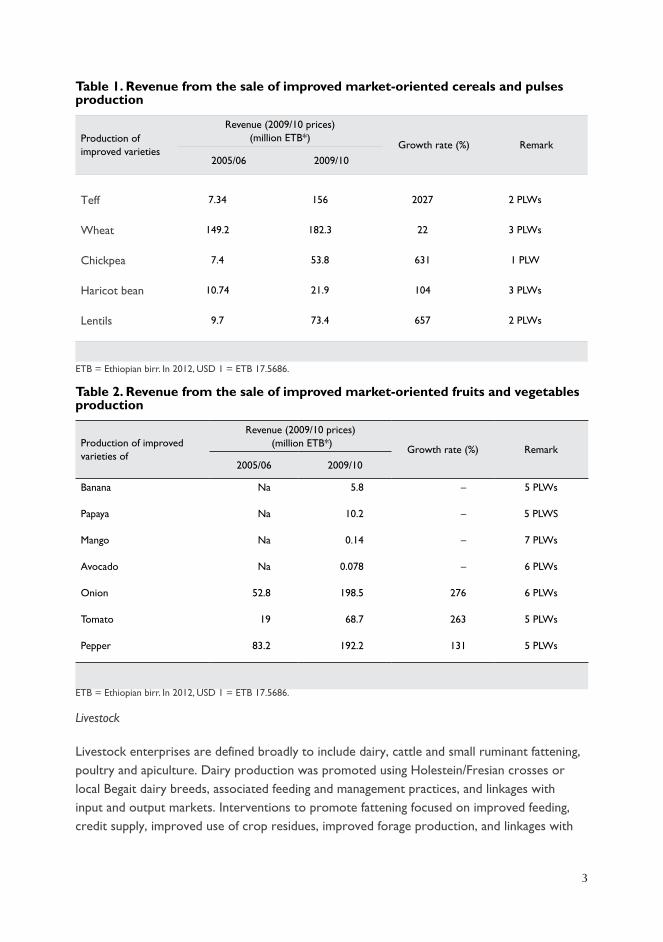
The collaborative effort of IPMS and its partners to promote market-oriented cereals and pulses production was based on promoting improved high yielding varieties and associated cultural practices, developing seed systems, facilitating market linkages and collective marketing, and availing market information through billboards and other means. Among cereals and pulses, revenue from improved teff varieties production grew the highest at 2027%, followed by lentils and chickpea (Table 1). The highest growth rate in teff revenue is consistent with the rapid adoption and expansion of the high yielding improved varieties.
Fruits and vegetables
Most of the fruits were not important market-oriented commodities in 2005/06. Hence, interventions to promote market-oriented fruit production focused on creating awareness and promoting improved varieties, supply of initial planting materials and establishment of local seedling supply system, while vegetable production was promoted using improved varieties and nursery and agronomic practices. Most of the promoted fruit varieties were short-duration and high yielding. Among the vegetables, onion and tomato registered highest growth rates of real revenue (Table 2).
3
Table 1. Revenue from the sale of improved market-oriented cereals and pulses production
Production of improved varieties
Revenue (2009/10 prices) (million ETB*)
Growth rate (%) Remark2005/06 2009/10
Teff 7.34 156 2027 2 PLWs
Wheat 149.2 182.3 22 3 PLWs
Chickpea 7.4 53.8 631 1 PLW
Haricot bean 10.74 21.9 104 3 PLWs
Lentils 9.7 73.4 657 2 PLWs
ETB = Ethiopian birr. In 2012, USD 1 = ETB 17.5686.
Table 2. Revenue from the sale of improved market-oriented fruits and vegetables production
Production of improved varieties of
Revenue (2009/10 prices) (million ETB*)
Growth rate (%) Remark2005/06 2009/10
Banana Na 5.8 – 5 PLWs
Papaya Na 10.2 – 5 PLWS
Mango Na 0.14 – 7 PLWs
Avocado Na 0.078 – 6 PLWs
Onion 52.8 198.5 276 6 PLWs
Tomato 19 68.7 263 5 PLWs
Pepper 83.2 192.2 131 5 PLWs
ETB = Ethiopian birr. In 2012, USD 1 = ETB 17.5686.
Livestock
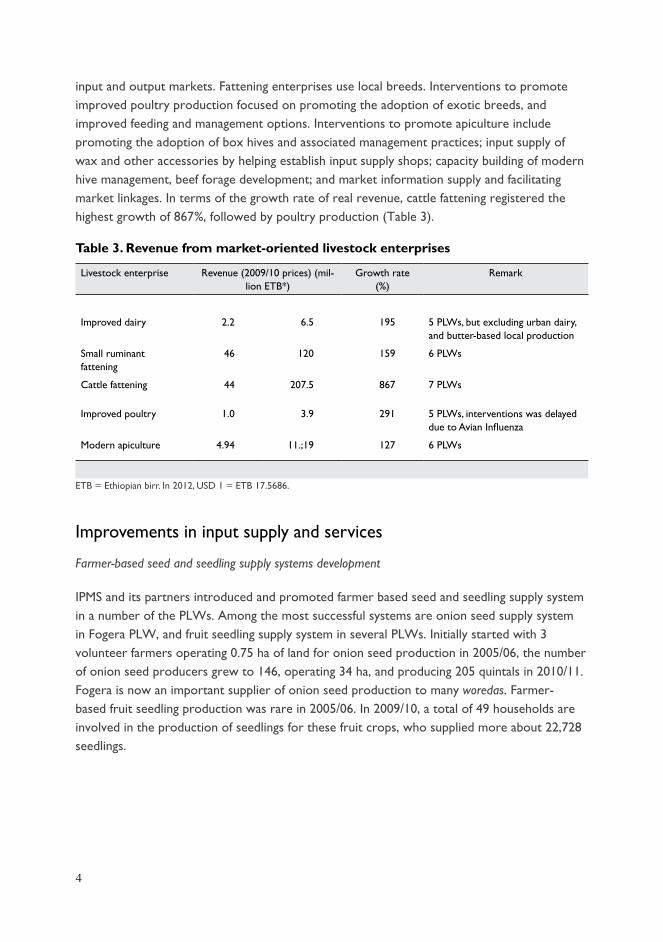
Livestock enterprises are defined broadly to include dairy, cattle and small ruminant fattening, poultry and apiculture. Dairy production was promoted using Holestein/Fresian crosses or local Begait dairy breeds, associated feeding and management practices, and linkages with input and output markets. Interventions to promote fattening focused on improved feeding, credit supply, improved use of crop residues, improved forage production, and linkages with
4
input and output markets. Fattening enterprises use local breeds. Interventions to promote improved poultry production focused on promoting the adoption of exotic breeds, and improved feeding and management options. Interventions to promote apiculture include promoting the adoption of box hives and associated management practices; input supply of wax and other accessories by helping establish input supply shops; capacity building of modern hive management, beef forage development; and market information supply and facilitating market linkages. In terms of the growth rate of real revenue, cattle fattening registered the highest growth of 867%, followed by poultry production (Table 3).
Table 3. Revenue from market-oriented livestock enterprises
Livestock enterprise Revenue (2009/10 prices) (mil-lion ETB*)
Growth rate (%)
Remark
Improved dairy 2.2 6.5 195 5 PLWs, but excluding urban dairy, and butter-based local production
Small ruminant fattening
46 120 159 6 PLWs
Cattle fattening 44 207.5 867 7 PLWs
Improved poultry 1.0 3.9 291 5 PLWs, interventions was delayed due to Avian Influenza
Modern apiculture 4.94 11.;19 127 6 PLWs
ETB = Ethiopian birr. In 2012, USD 1 = ETB 17.5686.
Improvements in input supply and services
Farmer-based seed and seedling supply systems development
IPMS and its partners introduced and promoted farmer based seed and seedling supply system in a number of the PLWs. Among the most successful systems are onion seed supply system in Fogera PLW, and fruit seedling supply system in several PLWs. Initially started with 3 volunteer farmers operating 0.75 ha of land for onion seed production in 2005/06, the number of onion seed producers grew to 146, operating 34 ha, and producing 205 quintals in 2010/11. Fogera is now an important supplier of onion seed production to many woredas. Farmer-based fruit seedling production was rare in 2005/06. In 2009/10, a total of 49 households are involved in the production of seedlings for these fruit crops, who supplied more about 22,728 seedlings.
5
Hormone-assisted mass insemination
To address the critical bottleneck of shortage of genetically improved animals, the IPMS project initiated the use of mass insemination in targeted production areas using hormones to regulate the oestrus cycle as a possible alternative option in different milk sheds in Tigray, Amhara, Oromia and SNNPRS. This mass AI intervention aims at improving the effectiveness of the AI service delivery (more inseminations/AI technician) and the efficiency of the insemination (increasing pregnancy rate/first insemination). Effectiveness results of mass insemination showed result of about 45 inseminations/AI technician per week (as compared to 6 insemination/AI technician per week in the existing system). Efficiency results showed that an achievement of pregnancy rate of 62% (compared to the current national average rate of 27%).
Conservation tillage
IPMS and partners promoted conservation technology (using herbicides) in Bure and Metema districts and many neighbouring districts of these woredas. Various trainings were given to public and private sector agricultural staff. In 2010 cropping season, private shops in Metema and Bure sold 16,000 and 13,000 litres of round-up, respectively, for conservation tillage activities. In Metema teff was not cultivated by farmers when IPMS started operation in 2004/05. About 420 ha of land, which was under grasslands for many years, was under teff in 2010, as a result of conservation tillage. In Bure, about 3250 ha crop land was planted using conservation tillage technology in 2010. In this district, one farmers’ union is now engaged in buying and retailing this herbicide to member farmers, while many private shops are supplying this herbicide to farmers in Metema and neighbouring districts.
Forage seed and seedling supply, and forage production
Feed supply was identified as most critical constraint of livestock production in almost all PLWs. Hence, IPMS and partners intervened in the development of improved forage production by facilitating forage seed and seedling supply, capacity building, introducing and promoting cut and carry system, and linking forage development with market-oriented livestock production.
Significant increase in forage biomass was achieved in Atsbi, particularly from the enclosed degraded hillsides and grazing bottom lands. From a total of about 10,542 ha grazing bottom lands, about 71% (or 7479 ha) was enclosed and utilized under cut and carry system. Moreover, about 13,404 ha of degraded hillsides were enclosed for cut and carry, of which about 1242 ha had improved forage enrichment plantation in 2009/10. It was estimated that a total forage biomass of about 92,011 t was harvested from the enclosed hillsides and bottom lands, and irrigated and backyard forages in 2009/10, an increase of about 326% over the free grazing hillsides and bottom lands.
6
Extent of institutionalization of the IPMS approach within and beyond the PLWs
An assessment of the extent to which the IPMS approach (participatory value chain development, bottom–up extension, and mainstreaming HIV-AIDS and environment in agricultural development) showed that the approach has been institutionalized either highly or moderately in the PLWs. Results also show that the approach has spread to neighbouring woredas in about half of the cases.
Conclusions and implications
As a project aimed at piloting market-oriented transformation of subsistence smallholder agriculture, the IPMS project and its partners have tested several innovative approaches to technology transfer, agricultural knowledge management, input supply and services, market linkages, and synthesis and promotion of experiences and lessons. Following the participatory value chain development framework and the innovation systems perspective, significant market-oriented developmental changes have been registered. The IPMS approach has proved to be a useful approach to transform smallholder subsistence agriculture into market-oriented production.
Hence, the overall message of the experiences of IPMS and its partners is that smallholder based market-oriented agricultural development can be successfully achieved if participatory value chain development approach supported by innovation systems perspective is used. The experience of IPMS and its partners shows that such an approach can be scaled out and up for wider impact. The following implications stand out:
While improved technology is critical to improve productivity and thus surplus production, •the value chain framework stipulates that technology may not be sufficient for successful transformation of subsistence agriculture into market orientation. Technology promotion should be accompanied by other value chain considerations.
The innovation systems perspective implies that many actors may have important •contributions to make in commodity development. Sound understanding of the roles, actions and interactions of actors in order to better utilize the synergies of actors’ roles towards market-oriented development is required.
Development is a continuous process and should be accompanied by continuous learning •and innovation. The IPMS project had an embedded results-based monitoring and evaluation (RBM&E) system which helped monitor and evaluate progress to feed back to project implementation for better performance. The experience shows that critical constraints can and do change in the development process.
7
The IPMS experience has also shown that sustainable transformation of subsistence •agriculture requires the institutionalization of innovative approaches to technology transfer, input supply and services, and markets. Such institutionalization primarily requires awareness creation and capacity building of agricultural staff at various levels.
Development of knowledge/skills per input intensive market-oriented commodities such •as irrigated fruits and vegetables, apiculture and milk for urban centres will be limited to the more entrepreneurial type of producers. Hence, strategies for commercialization transformation of smallholders need to corporate alternative livelihood strategies for farm families who may not be successfully entrepreneurial in agricultural production.
8
1 Background
The IPMS project is intended to demonstrate, on a pilot basis, market-oriented transformation of men and women smallholder farmers in Ethiopia. It is a project funded by the Canadian International Development Agency (CIDA), and implemented by the International Livestock Research Institute (ILRI) on behalf of the Ethiopian Ministry of Agriculture. The overall goal of the project is ‘to contribute to improved agricultural productivity and production through market-oriented agricultural development, as a means for achieving improved and sustainable livelihoods for the rural population’. The project purpose is ‘to strengthen the effectiveness of the government’s effort to transform agricultural and rural development in Ethiopia through market-oriented agricultural development’.
The IPMS project follows participatory market-oriented commodity value chain development approach and innovation system perspective to identify and implement its interventions. In this regard, in addition to introducing new and improved production technologies, the project played active role in promoting innovative institutional arrangements for input supply and marketing, enhanced knowledge sharing mechanisms and linking and building capacities of value chain actors.
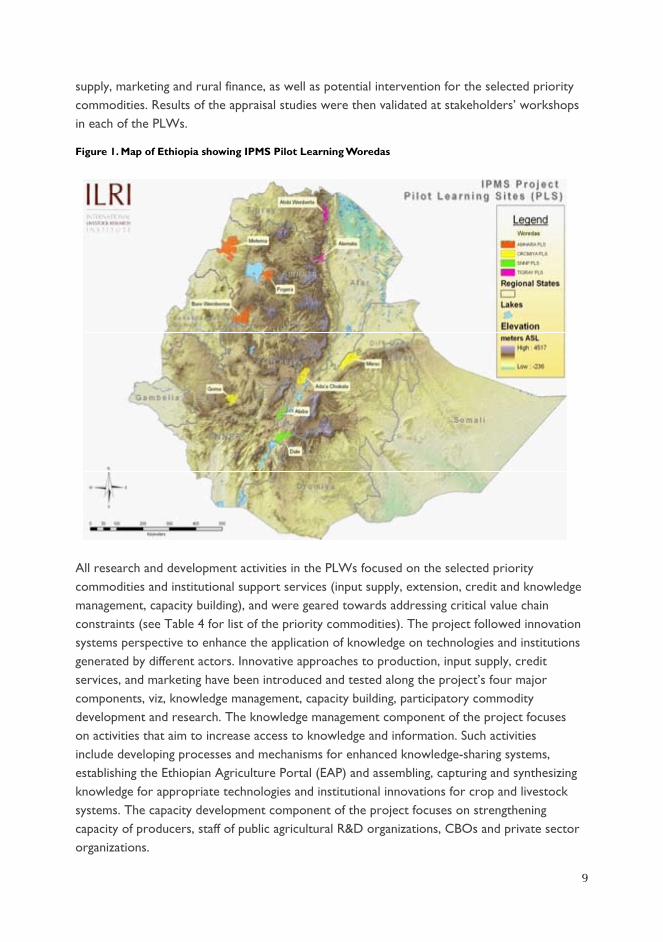
The project operates in ten Pilot Learning Woredas (PLWs) in Tigray, Amhara, Oromia and the Southern Nations, Nationalities and Peoples’ Regional (SNNPR) States (Figure 1). These PLWs were selected in consultation with the Regional Advisory and Learning Committees (RALC) and the National Advisory and Learning Committee (NALC) at regional and federal levels, respectively. The PLWs were selected based on their potential for market-oriented agricultural development. Except Bure and Gomma PLWs which started implementation in 2007/08, implementation of project activities in the remaining eight PLWs started in 2004/05. In each of these PLWs, priority market-oriented commodities were selected in a participatory manner based on the development priorities expressed by the farming communities, frontline agricultural extension agents, researchers, experts, the private sector and other relevant stakeholders. Rapid appraisal studies were conducted in each of the PLWs on the bio-physical and socio-economic characteristics of the PLWs, existing institutional arrangements for input
9
supply, marketing and rural finance, as well as potential intervention for the selected priority commodities. Results of the appraisal studies were then validated at stakeholders’ workshops in each of the PLWs.
Figure 1. Map of Ethiopia showing IPMS Pilot Learning Woredas
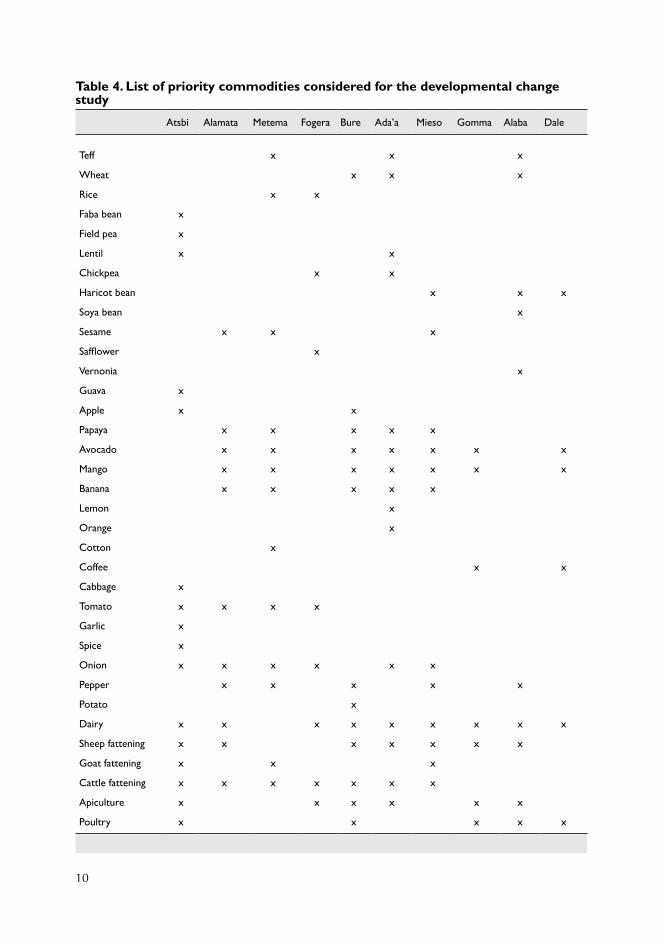
All research and development activities in the PLWs focused on the selected priority commodities and institutional support services (input supply, extension, credit and knowledge management, capacity building), and were geared towards addressing critical value chain constraints (see Table 4 for list of the priority commodities). The project followed innovation systems perspective to enhance the application of knowledge on technologies and institutions generated by different actors. Innovative approaches to production, input supply, credit services, and marketing have been introduced and tested along the project’s four major components, viz, knowledge management, capacity building, participatory commodity development and research. The knowledge management component of the project focuses on activities that aim to increase access to knowledge and information. Such activities include developing processes and mechanisms for enhanced knowledge-sharing systems, establishing the Ethiopian Agriculture Portal (EAP) and assembling, capturing and synthesizing knowledge for appropriate technologies and institutional innovations for crop and livestock systems. The capacity development component of the project focuses on strengthening capacity of producers, staff of public agricultural R&D organizations, CBOs and private sector organizations.
10
Table 4. List of priority commodities considered for the developmental change study
Atsbi Alamata Metema Fogera Bure Ada’a Mieso Gomma Alaba Dale
Teff x x x
Wheat x x x
Rice x x
Faba bean x
Field pea x
Lentil x x
Chickpea x x
Haricot bean x x x
Soya bean x
Sesame x x x
Safflower x
Vernonia x
Guava x
Apple x x
Papaya x x x x x
Avocado x x x x x x x
Mango x x x x x x x
Banana x x x x x
Lemon x
Orange x
Cotton x
Coffee x x
Cabbage x
Tomato x x x x
Garlic x
Spice x
Onion x x x x x x
Pepper x x x x x
Potato x
Dairy x x x x x x x x x
Sheep fattening x x x x x x x
Goat fattening x x x
Cattle fattening x x x x x x x
Apiculture x x x x x x
Poultry x x x x x
11
The participatory commodity development component of the project mainly engages in identifying and promoting appropriate technologies, processes and institutional innovations for participatory market-led development of priority commodities in PLWs. These include introducing alternatives methods and approaches to develop institutional arrangements for input supply, marketing and appropriate service delivery system. The research (development and promotion of recommendations) component of the project focuses on activities related to generating, synthesizing, and promoting innovative lessons and recommendations to facilitate market-oriented agricultural development policies and strategies. All project activities gave ex-plicit and due attention to the three cross-cutting issues of gender, HIV/AIDS and the environ-ment. The project has an inbuilt M&E system that monitors and evaluates outputs, outcomes and impact.
The purpose of this report is to present key summary results on the development results that the project together with partners and collaborators has achieved in the PLWs. The report is structured as follows: the next section presents the methodology of the study. Section 3 deals with changes that have occurred with regard to crop commodities, while section 4 deals with livestock commodities. Section 5 presents achievements in institutional development.
12
2 Methodology
The data used for this analysis were collected from peasant association (PA) level survey conducted in all PAs of the ten PLWs. Nineteen ‘impact type’ indicators were developed based on the project’s Performance Measurement Framework (PMF). Survey instrument was developed to collect the necessary data related to the nineteen ‘impact type’ indicators. The survey considered all crop and livestock commodities in which IPMS made interventions. The data were collected during June–October 2010 for the production year of 2009/10. For each market-oriented commodity, five-year time series data (2005/06–2009/10) were collected on the number of households producing, area covered, total production, prices and household market participation. Group interview with farmers, DAs and key informant surveys were used to collect the relevant data. Secondary data from records kept by development agents (DAs), subject matter specialists (SMSs) and other woreda level sources were also used to complement and/or verify the data collected from group interview. The PA level survey data were complemented by data from a baseline survey and diagnostic studies conducted at the beginning of the project, and several specific case studies conducted by IPMS staff, students and partners, including gender analysis.
Results are based on descriptive analysis of the data. Growth rates for quantitative changes in the number of households producing the market-oriented commodities, area under these commodities, total production, and revenue obtained from the sale of the produce were computed for the period 2005/06 to 2009/10. Growth rates in revenue from the sale of the produce of the market-oriented commodities were computed in real terms by computing the revenue in both years in the 2009/10 constant prices. All prices used are farmer reported selling prices. However, comparisons of yield levels of the commodities were made for the period 2004/05 to 2009/10, as long as comparable yield data were collected and available from the baseline survey for 2004/05, and/or for the period 2005/06 to 2009/10. Qualitative analysis was used for farmer perceptions of the changes in farmer attitudes towards HIV/AIDS, and expert opinions on the level of adoption of the IPMS approach within and beyond the PLWs.
13
3 Changes in market orientation and market participation of households
3.1 Cereals (teff, wheat and rice)The collaborative effort of IPMS and its partners to promote market-oriented teff, wheat and rice production focused on promoting improved varieties and cultural practices, developing seed systems, and availing market information through billboard and other means which may have improved bargaining power of farmers and the price they received. Improved teff and wheat varieties were promoted in Ada’a and Alaba. Improved wheat production was also promoted in Bure. In Metema PLW, where teff production was new until IPMS and partners started promoting it as a result of the expansion of minimum tillage technology, only local varieties were planted. Rice production was promoted mainly in Fogera, where flood rice production was already practised when IPMS started operation in 2004/05. IPMS also introduced and tested upland rice varieties into higher altitude areas of Fogera for production under rain fed conditions. Rice was also introduced in Metema, although area coverage is still very low due to problems related to polishing (post-harvest problems).
Teff
Interventions to promote market-oriented improved teff production focused on promoting the improved varieties of Kuncho (DZ Cr 387), DZ-196, and DZ Cr-37, and associated management practices, in Ada’a, and DZ CR-37 in Alaba. Seed system for Kuncho was developed in both Ada and Alaba PLWs. Changes in market-orientation in improved teff in Ada’a and Alaba PLWs as measured by the number of households involved in production, total area covered, total production (Figure 2) and revenue obtained during 2005/06–2009/10 were consistent and very high.
14
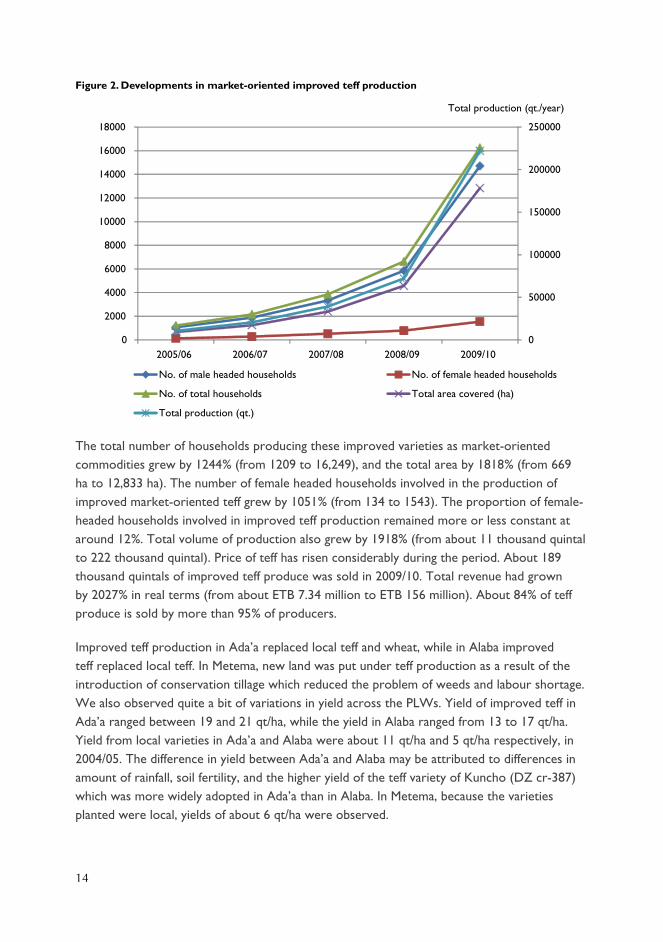
Figure 2. Developments in market-oriented improved teff production
The total number of households producing these improved varieties as market-oriented commodities grew by 1244% (from 1209 to 16,249), and the total area by 1818% (from 669 ha to 12,833 ha). The number of female headed households involved in the production of improved market-oriented teff grew by 1051% (from 134 to 1543). The proportion of female-headed households involved in improved teff production remained more or less constant at around 12%. Total volume of production also grew by 1918% (from about 11 thousand quintal to 222 thousand quintal). Price of teff has risen considerably during the period. About 189 thousand quintals of improved teff produce was sold in 2009/10. Total revenue had grown by 2027% in real terms (from about ETB 7.34 million to ETB 156 million). About 84% of teff produce is sold by more than 95% of producers.
Improved teff production in Ada’a replaced local teff and wheat, while in Alaba improved teff replaced local teff. In Metema, new land was put under teff production as a result of the introduction of conservation tillage which reduced the problem of weeds and labour shortage. We also observed quite a bit of variations in yield across the PLWs. Yield of improved teff in Ada’a ranged between 19 and 21 qt/ha, while the yield in Alaba ranged from 13 to 17 qt/ha. Yield from local varieties in Ada’a and Alaba were about 11 qt/ha and 5 qt/ha respectively, in 2004/05. The difference in yield between Ada’a and Alaba may be attributed to differences in amount of rainfall, soil fertility, and the higher yield of the teff variety of Kuncho (DZ cr-387) which was more widely adopted in Ada’a than in Alaba. In Metema, because the varieties planted were local, yields of about 6 qt/ha were observed.
0
50000
100000
150000
200000
250000
0
2000
4000
6000
8000
10000
12000
14000
16000
18000
2005/06 2006/07 2007/08 2008/09 2009/10
No. of male headed households No. of female headed households
No. of total households Total area covered (ha)
Total production (qt.)
Total production (qt./year)
15
Wheat
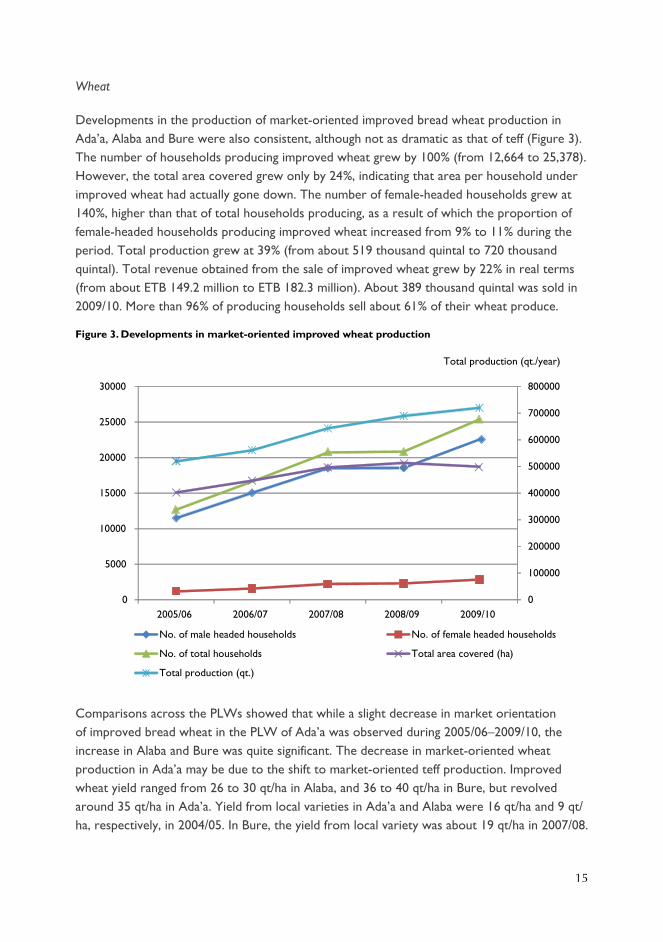
Developments in the production of market-oriented improved bread wheat production in Ada’a, Alaba and Bure were also consistent, although not as dramatic as that of teff (Figure 3). The number of households producing improved wheat grew by 100% (from 12,664 to 25,378). However, the total area covered grew only by 24%, indicating that area per household under improved wheat had actually gone down. The number of female-headed households grew at 140%, higher than that of total households producing, as a result of which the proportion of female-headed households producing improved wheat increased from 9% to 11% during the period. Total production grew at 39% (from about 519 thousand quintal to 720 thousand quintal). Total revenue obtained from the sale of improved wheat grew by 22% in real terms (from about ETB 149.2 million to ETB 182.3 million). About 389 thousand quintal was sold in 2009/10. More than 96% of producing households sell about 61% of their wheat produce.
Figure 3. Developments in market-oriented improved wheat production
Comparisons across the PLWs showed that while a slight decrease in market orientation of improved bread wheat in the PLW of Ada’a was observed during 2005/06–2009/10, the increase in Alaba and Bure was quite significant. The decrease in market-oriented wheat production in Ada’a may be due to the shift to market-oriented teff production. Improved wheat yield ranged from 26 to 30 qt/ha in Alaba, and 36 to 40 qt/ha in Bure, but revolved around 35 qt/ha in Ada’a. Yield from local varieties in Ada’a and Alaba were 16 qt/ha and 9 qt/ha, respectively, in 2004/05. In Bure, the yield from local variety was about 19 qt/ha in 2007/08.
0
100000
200000
300000
400000
500000
600000
700000
800000
0
5000
10000
15000
20000
25000
30000
2005/06 2006/07 2007/08 2008/09 2009/10
Total production (qt./year)
No. of male headed households No. of female headed households
No. of total households Total area covered (ha)
Total production (qt.)
16
There was variation in the proportion of wheat sold across the PLWs. In 2009/10, about 47%, 70% and 60% of wheat produce was sold in Ada’a, Alaba and Bure, respectively.
Rice
Rice is a recent introduction to Ethiopia. In the Fogera PLW, flood rice production was introduced in the early 1980s through technical support of North Korean experts. However, upland rice was introduced to Fogera and Metema by IPMS and partners. The most popular flood rice variety grown in Fogera is the x-jigna. The expansion of flood rice production in the lowland flooded areas prompted interest in growing upland rice by the upland farmers. However, low level of awareness about suitable varieties, lack of input supply services, lack of experience in rice agronomy and processing, were major deterrents for farmers. Hence, IPMS and partners conducted on-farm trials of four rice varieties (NERICA-3, NERICA-4, SUPERICA-1, and PAWE-1). In addition, farmer-to-farmer seed multiplication and exchange system was introduced. Volunteer farmers were identified for seed multiplication. IPMS and partners, particularly SG-2000 and the regional research institute, ARARI, also introduced parboiling technology to hotels and restaurants in Woreta and Bahir Dar towns. Trainings on rice value addition (processing and others) were also given to farmers and other value chain actors. NERICA-4 was most preferred upland rice variety.
The introduction of upland rice also triggered interest in the upland farmers to use the lowland variety, x-jigna. As a result, x-jigna is now widely grown in the uplands, especially when the rain sets in early enough and heavy. In the uplands the total area under x-jigna reached more than 6000 ha in 2010/11 from nothing in 2004/05. Area under NERICA-4 reached just over 50 ha. An increase in area of about 4000 ha was also observed in the paddy rice growing lowland system. An average yield of about 44 qt/ha was also recorded, compared with the baseline yield of about 39 qt/ha in 2004/05. The number of households who produce upland rice in Fogera also increased slightly. In Metema, the number of farmers producing upland rice reached 207 in 2009/10, from nothing in 2007/08, when IPMS started introducing the crop. Almost all producers participate in the market as sellers of their rice produce in both PLWs. It should be noted that the expansion of rice production is also influenced by the rising prices.
Conservation tillage
IPMS and partners promoted conservation technology (using herbicides) in Bure and Metema districts and many neighbouring districts of these woredas. Various trainings were given to public and private sector agricultural staff. In 2010 cropping season, private shops in Metema and Bure sold 16,000 and 13,000 litres of round-up, respectively, for conservation tillage activities. In Metema teff was not cultivated by farmers when IPMS started operation in 2004/05. As a result of the promotion of conservation tillage, which reduced the problem of labour shortage for weeding, farmers started growing teff. As a result, about 420 ha of land, which was under grasslands for many years, was under teff in 2010. Similarly, in Bure, farmers
17
have started using this herbicide for wheat, teff, maize and chickpea production. About 3250 ha crop land was planted using conservation tillage technology during 2010 in Bure, which was more than double when compared to the year before. In this district, one farmers’ union is now engaged in buying and retailing this herbicide to member farmers, while many private shops are supplying this herbicide to farmers in Metema and neighbouring districts.
3.2 Pulses IPMS and partners promoted improved market-oriented pulses production in several of the PLWs. Faba bean and field pea were promoted in Atsbi; lentils in Atsbi and Ada’a; chickpea in Ada’a; and haricot beans in Mieso, Alaba and Dale. Interventions to promote improved market-oriented pulses focused on promoting improved varieties and associated cultural practices, input–output market linkages, collective marketing and developing seed system. All indicators of market-orientation show consistent developments in household market orientation in pulses.
Chickpea
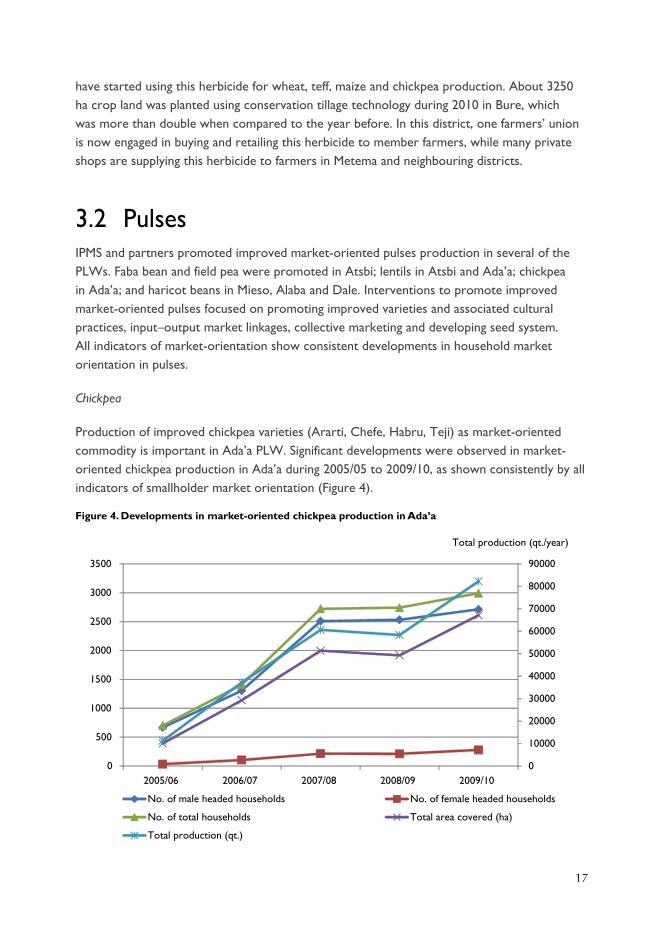
Production of improved chickpea varieties (Ararti, Chefe, Habru, Teji) as market-oriented commodity is important in Ada’a PLW. Significant developments were observed in market-oriented chickpea production in Ada’a during 2005/05 to 2009/10, as shown consistently by all indicators of smallholder market orientation (Figure 4).
Figure 4. Developments in market-oriented chickpea production in Ada’a
0
10000
20000
30000
40000
50000
60000
70000
80000
90000
0
500
1000
1500
2000
2500
3000
3500
2005/06 2006/07 2007/08 2008/09 2009/10
Total production (qt./year)
No. of male headed households No. of female headed households
No. of total households Total area covered (ha)
Total production (qt.)
18
The number of households producing market-oriented improved chickpea varieties grew by 327% (from 700 to 2992). The total area under chickpea grew even faster at 566% (from 392 ha to 2610 ha), raising the household area under improved chickpea from 0.56 ha to 0.87 ha. The proportion of female-headed households involved increased consistently, but slowly, from 5% to 9%. The growth rate of total production was faster than that of number of households involved or total area cultivated, due to improvements in yield. Total production registered growth rate of 630%, while yield improved from 29 qt/ha to 32 qt/ha. The baseline yield of the Dessi variety in 2004/05 was about 15 qt/ha. In 2009/10, about 7.3 million qt of chickpea was sold. Total revenue from the sale of chickpea showed that revenue grew by 631% in real terms (from ETB 7.4 million to ETB 53.8 million). About 88% of chickpea produce is sold, and more than 95% of producers sell their chickpea produce.
Haricot bean
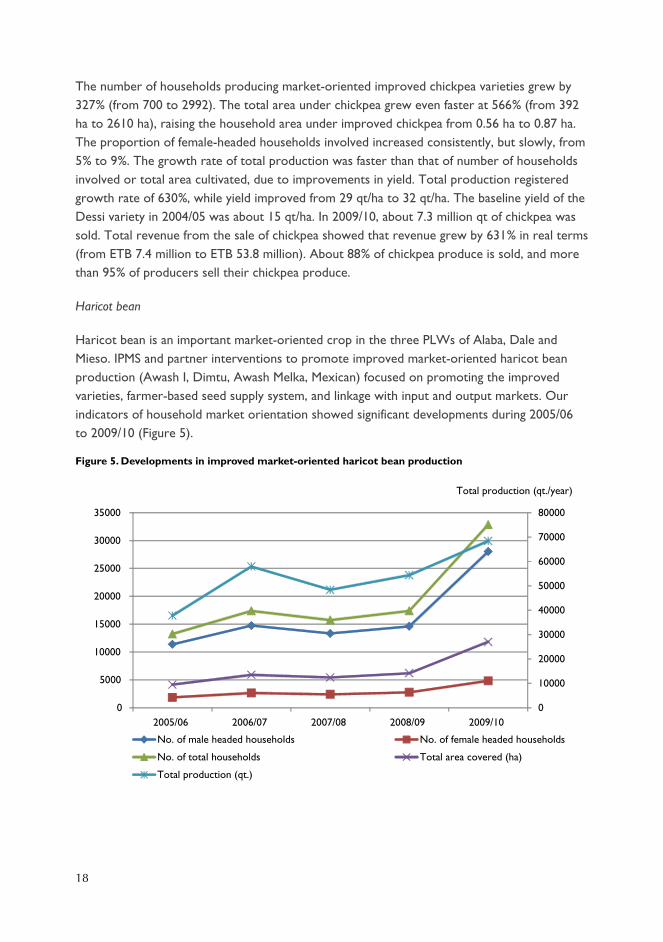
Haricot bean is an important market-oriented crop in the three PLWs of Alaba, Dale and Mieso. IPMS and partner interventions to promote improved market-oriented haricot bean production (Awash I, Dimtu, Awash Melka, Mexican) focused on promoting the improved varieties, farmer-based seed supply system, and linkage with input and output markets. Our indicators of household market orientation showed significant developments during 2005/06 to 2009/10 (Figure 5).
Figure 5. Developments in improved market-oriented haricot bean production
0
10000
20000
30000
40000
50000
60000
70000
80000
0
5000
10000
15000
20000
25000
30000
35000
2005/06 2006/07 2007/08 2008/09 2009/10
Total production (qt./year)
No. of male headed households No. of female headed households
No. of total households Total area covered (ha)
Total production (qt.)
19
The total number of households involved in improved market-oriented haricot bean production grew by 148% (from 13,239 to 32,855), and the total area covered grew by 185% (from 4148 ha to 11,832 ha). The proportion of female-headed households involved fluctuated between 14 and 16%. We also observed that total production grew by 81%, lower growth rate than that of total number of households involved or total area covered, showing that there really was decline in yield during the period. About 47,000 quintals of haricot bean production was sold in 2009/10. Total revenue obtained from the sale of haricot beans grew by 104% in real terms (from 10.74 million to 21.9 million). About 61% of haricot bean produce was sold in 2009/10. More than 88% of households sold their haricot been produce during 2005/06 and 2008/09, but the proportion dropped sharply to only 54% in 2009/10, perhaps because of the drought. Comparison across the three PLWs showed that, while a general yield decline trend was observed in all of them, the decline was more pronounced in Dale. The baseline yields in 2004/05 were 12 qt/ha and 5 qt/ha in Dale and Alaba, respectively.
Lentils
Lentils is an important market-oriented commodity in Atsbi and Ada’a PLWs. Area under lentils in Atsbi is lower than in Ada’a. Initially, lentils was not considered as a priority market-oriented commodity in Ada’a. However, prompted by the growing market demand for the crop, and the expansion of the Alamaya variety lentil crop in neighbouring woredas, farmers in Ada’a showed strong interest in growing the crop. IPMS and partners responded to farmers interest by providing capacity building to extension agents and farmers in agronomic practices, conducting variety demonstrations at FTCs, providing price information through billboards, and capacity building on lentil processing to the Yerer Farmer Cooperative Union. In Atsbi, interventions were limited to creating awareness on the availability of improved varieties, and capacity building in agronomic practices and value addition during the initial implementation period of the project. Significant developments were observed in market-oriented lentils production in the two PLWs during 2005/06 to 2009/10 (Figure 6).
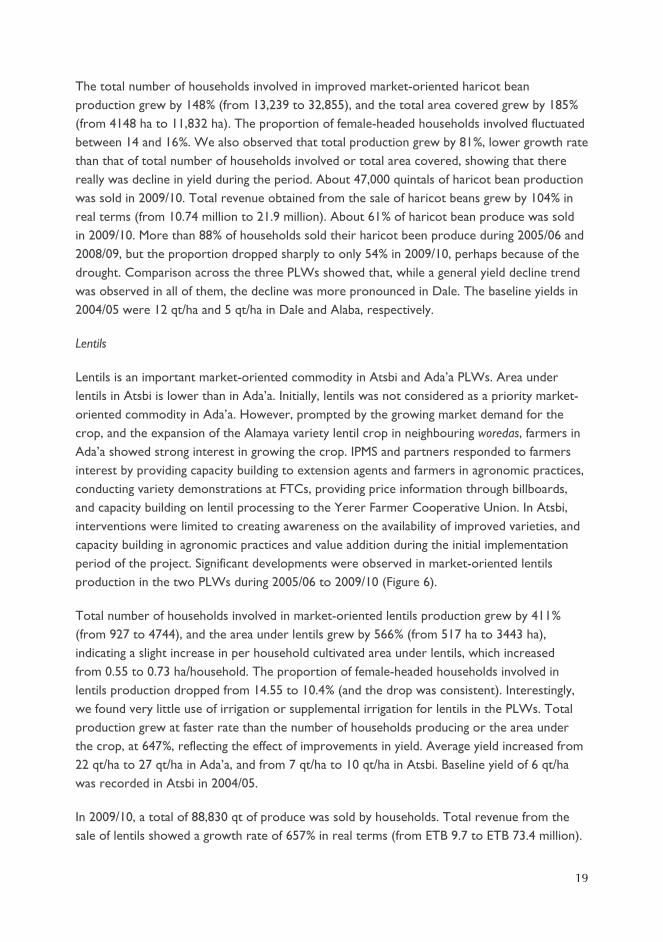
Total number of households involved in market-oriented lentils production grew by 411% (from 927 to 4744), and the area under lentils grew by 566% (from 517 ha to 3443 ha), indicating a slight increase in per household cultivated area under lentils, which increased from 0.55 to 0.73 ha/household. The proportion of female-headed households involved in lentils production dropped from 14.55 to 10.4% (and the drop was consistent). Interestingly, we found very little use of irrigation or supplemental irrigation for lentils in the PLWs. Total production grew at faster rate than the number of households producing or the area under the crop, at 647%, reflecting the effect of improvements in yield. Average yield increased from 22 qt/ha to 27 qt/ha in Ada’a, and from 7 qt/ha to 10 qt/ha in Atsbi. Baseline yield of 6 qt/ha was recorded in Atsbi in 2004/05.
In 2009/10, a total of 88,830 qt of produce was sold by households. Total revenue from the sale of lentils showed a growth rate of 657% in real terms (from ETB 9.7 to ETB 73.4 million).
20
About 86% of lentil produce was sold, and more than 90% of producers participated in the lentil market as sellers.
Figure 6. Developments in market-oriented improved lentils production in Ada’a and Atsbi
Comparison across the PLWs showed that although number of producers of lentils grew steadily in both PLWs, the increase was much more dramatic in Ada’a. Nearly all producers in Ada’a and more than 80% in Atsbi sell their lentils produce.
Other pulses:
IPMS and partners made preliminary interventions to promote market-oriented fava beans and field pea production in Atsbi. Interventions were limited to creating awareness on the availability of improved varieties, and capacity building in agronomic practices including moisture conservation and irrigation use, pest control and value addition. However, these interventions were limited to the initial years of implementation of the project.
Faba beans
Faba bean is an important market-oriented crop in Atsbi and indicators of market orientation show slight improvements in household market orientation in faba bean production in the PLW. The number of households producing improved faba bean varieties as market-oriented commodity in the PLW showed consistent but slow growth rate of only 12% (from 3085 in 2005/06 to 3452 in 2009/10). Total number of female-headed households involved in market-oriented faba bean production grew even slower at only 4%. However, in sharp contrast with cereals, about a third of improved faba bean producers were female headed households. Area
0
100
200
300
400
500
600
700
800
900
1000
0
500
1000
1500
2000
2500
3000
3500
4000
4500
5000
2005/06 2006/07 2007/08 2008/09 2009/10
Total production (qt./year)
No. of male headed households No. of female headed households
No. of total households Total area covered (ha)
Total production (qt.)
21
under improved faba bean in Atsbi also grew by 8% (from 854 ha to 922 ha), an increase all of which came with the use of irrigation or supplemental irrigation. Total revenue from the sale of faba beans grew by 10% in real terms (from about 4.6 million to about 5 million). About 65% of faba bean produce was sold in 2009/10 and more than 70% of faba bean producers sold their faba bean produce. Faba bean yield ranged from 14 to 19 qt/ha, compared with baseline yield levels of 7 qt/ha in 2004/05.
Field pea
Field pea is another important market-oriented commodity in Atsbi. Indicators show slight improvements in market-oriented field pea production in the PLW. The number of households producing field pea grew by 13% (from 2561 to 2893), and the number of female-headed households, by 21%, (from 720 to 876), thus raising the proportion of female-headed households involved in market-oriented improved field pea production slightly. The proportion of female-headed households involved rose slightly from 28% to 30%. The area under field peas fluctuated during 2005/06 to 2009/10 but reached 724 ha from 635 ha in 2005/06.
Total production of field peas in the PLW grew by 23% (from 8470 qt to 10,438 qt). Slight increase in yield (from 13 qt/ha to 15 qt/ha) contributed to the increase in production. Field pea production under supplemental or full irrigation rose slightly from 33 ha in 2005/06 to 85 ha in 2009/10. Total revenue from the sale of field peas grew by 23% in real terms (from about 3.7 million to 4.53 million). More than 70% of field pea produce is sold by more than 75% of producers.
3.3 Oil cropsSesame
The project started work on sesame in Metema, Mieso and Alamata. Sesame production in Alamata and Mieso did not expand. In Metema, where improved sesame production expanded relatively better, interventions were limited to few sites and some agronomic improvements including use of minimum tillage, pest management and improved postharvest store management. Use of roundup was introduced and promoted together with minimum tillage, as a result of which the area under sesame increased significantly. Introduction of round up and minimum tillage also resulted in reduction of cost of production. Interventions on sesame were also made in postharvest store management.
The project also started on noug in Fogera, but the commodity was dropped since incentives for growing the crop in comparison to other crops were low. An attempt to introduce Vernonia in Alamata, Alaba and Mieso failed because the company which agreed to purchase and process the seeds for export never materialized. A small project with SNV’s BOAM project to develop an export market for safflower petal in Fogera, remained limited in scale.
22
3.4 Fibre cropsCotton
Cotton had also been identified as a potential marketable commodity in Alamata and Metema PLWs. In Alamata the commodity was dropped after a year for lack of marketing/processing opportunities since a ginnery which was planned for Alamata did not materialize. In Metema, the commodity was grown by both larger scale investors and smallholders (less than 5 ha holding), but support by the project was more to large scale farmers. Area cultivated had dropped considerably and farmers lost interest during the initial period of implementation of the IPMS project. Recently, however, because of the introduction of cruiser, minimum tillage and better marketing arrangements—cotton production increased significantly, although the share of smallholder farmers remained still low. Project support focused on establishing links with Middle Awash large scale farmers and developing a cotton seed system. Delta pine was introduced to Metema through this system.
3.5 FruitsFruit production was very limited in most of the IPMS PLWs when IPMS started operation. Hence, most of the interventions focused on creating awareness and introducing fruit production using improved varieties and input supply of initial planting materials and establishment of local seedling supply system. A survey of the impact of fruit development on women showed that 82% of surveyed women reported that their work load was increased, but only 22% and 35% reported that they were responsible for selling the produce and control the income, respectively.
Nursery development
IPMS and its partners also worked on promoting farmer-operated fruit nurseries in the PLWS. Farmer-operated fruit nurseries were particularly promoted for avocado, banana, mango and apple. A total of 17 farmers operated avocado nurseries in Ada’a, Alaba, Bure, Dale, and Gomma PLWs in 2009, of which 4 were female-headed. A total of 7251 avocado seedlings were sold in 2009 for a total value of ETB 121,000. Mango nurseries were promoted in Dale, Alaba and Ada’a, where nine households operated nurseries all of which were male-headed. A total of 3948 seedlings were sold in 2009 for a total value of ETB 73,483.
Banana nurseries were established in Bure and Metema, where 15 households operated nurseries of which 3 are female-headed. A total of 7604 seedlings were sold in 2009 for a total value of ETB 58, 000. Farmer-operated fruit nurseries were established in Bure and Atsbi. In Bure, 4 households operated nurseries in 20012 and produced and supplied about 2500 seedlings. In Atsbi, 4 households operated apple nurseries in 2012 producing 1425 seedlings.
23
Banana
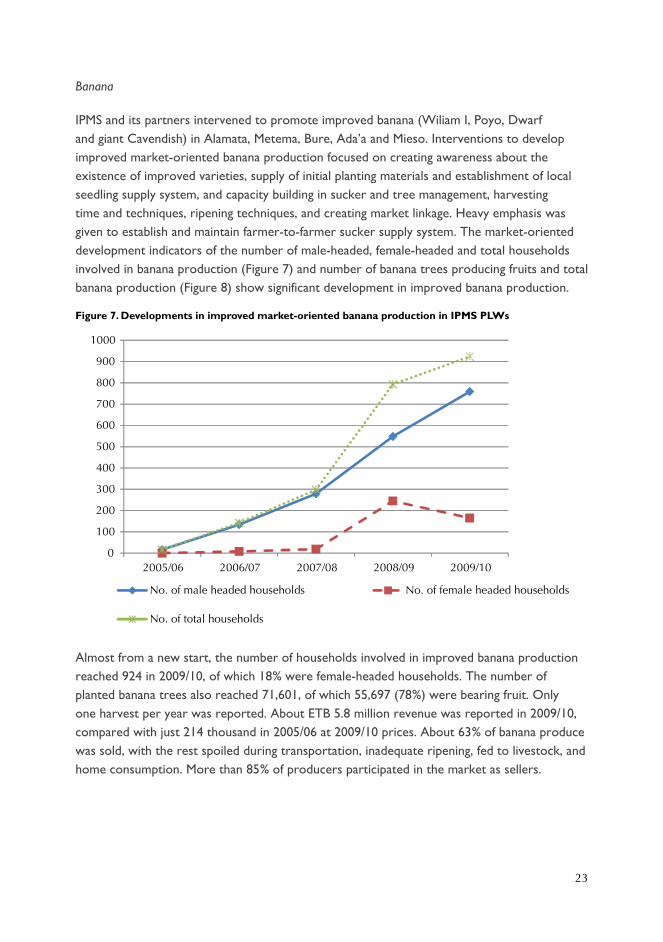
IPMS and its partners intervened to promote improved banana (Wiliam I, Poyo, Dwarf and giant Cavendish) in Alamata, Metema, Bure, Ada’a and Mieso. Interventions to develop improved market-oriented banana production focused on creating awareness about the existence of improved varieties, supply of initial planting materials and establishment of local seedling supply system, and capacity building in sucker and tree management, harvesting time and techniques, ripening techniques, and creating market linkage. Heavy emphasis was given to establish and maintain farmer-to-farmer sucker supply system. The market-oriented development indicators of the number of male-headed, female-headed and total households involved in banana production (Figure 7) and number of banana trees producing fruits and total banana production (Figure 8) show significant development in improved banana production.
Figure 7. Developments in improved market-oriented banana production in IPMS PLWs
Almost from a new start, the number of households involved in improved banana production reached 924 in 2009/10, of which 18% were female-headed households. The number of planted banana trees also reached 71,601, of which 55,697 (78%) were bearing fruit. Only one harvest per year was reported. About ETB 5.8 million revenue was reported in 2009/10, compared with just 214 thousand in 2005/06 at 2009/10 prices. About 63% of banana produce was sold, with the rest spoiled during transportation, inadequate ripening, fed to livestock, and home consumption. More than 85% of producers participated in the market as sellers.
0
100
200
300
400
500
600
700
800
900
1000
2005/06 2006/07 2007/08 2008/09 2009/10
No.ofmaleheadedhouseholds No.offemaleheadedhouseholds
No.oftotalhouseholds
24
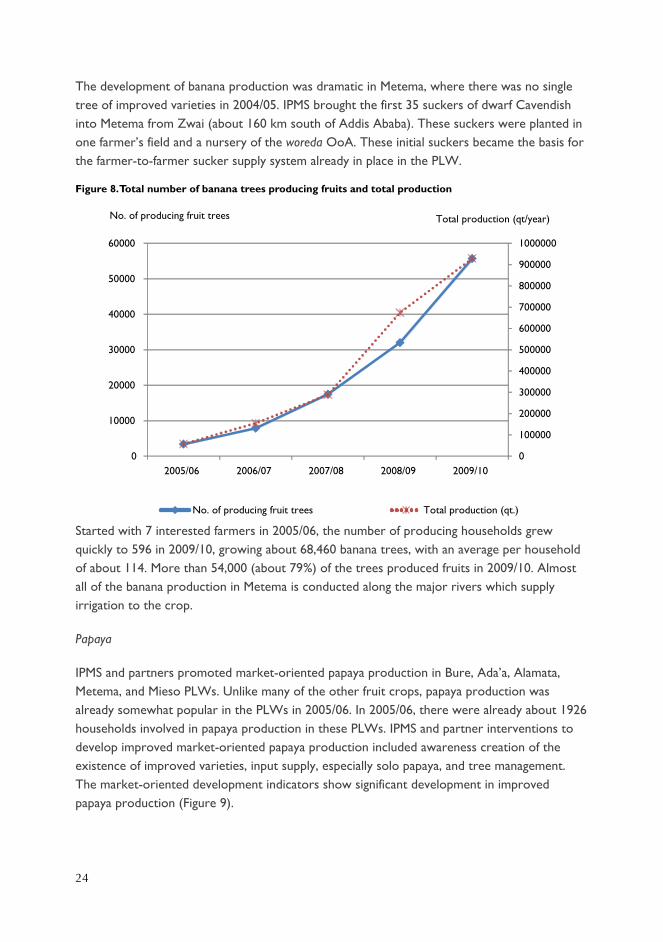
The development of banana production was dramatic in Metema, where there was no single tree of improved varieties in 2004/05. IPMS brought the first 35 suckers of dwarf Cavendish into Metema from Zwai (about 160 km south of Addis Ababa). These suckers were planted in one farmer’s field and a nursery of the woreda OoA. These initial suckers became the basis for the farmer-to-farmer sucker supply system already in place in the PLW.
Figure 8. Total number of banana trees producing fruits and total production
Started with 7 interested farmers in 2005/06, the number of producing households grew quickly to 596 in 2009/10, growing about 68,460 banana trees, with an average per household of about 114. More than 54,000 (about 79%) of the trees produced fruits in 2009/10. Almost all of the banana production in Metema is conducted along the major rivers which supply irrigation to the crop.
Papaya
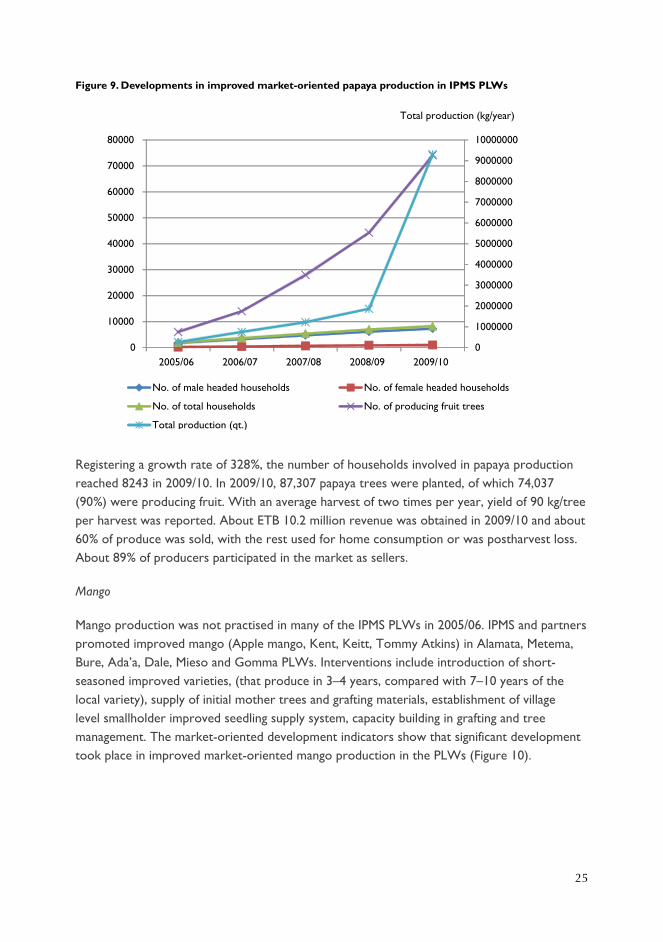
IPMS and partners promoted market-oriented papaya production in Bure, Ada’a, Alamata, Metema, and Mieso PLWs. Unlike many of the other fruit crops, papaya production was already somewhat popular in the PLWs in 2005/06. In 2005/06, there were already about 1926 households involved in papaya production in these PLWs. IPMS and partner interventions to develop improved market-oriented papaya production included awareness creation of the existence of improved varieties, input supply, especially solo papaya, and tree management. The market-oriented development indicators show significant development in improved papaya production (Figure 9).
0
100000
200000
300000
400000
500000
600000
700000
800000
900000
1000000
0
10000
20000
30000
40000
50000
60000
2005/06 2006/07 2007/08 2008/09 2009/10
No. of producing fruit trees Total production (qt.)
No. of producing fruit trees Total production (qt/year)
25
Figure 9. Developments in improved market-oriented papaya production in IPMS PLWs
Registering a growth rate of 328%, the number of households involved in papaya production reached 8243 in 2009/10. In 2009/10, 87,307 papaya trees were planted, of which 74,037 (90%) were producing fruit. With an average harvest of two times per year, yield of 90 kg/tree per harvest was reported. About ETB 10.2 million revenue was obtained in 2009/10 and about 60% of produce was sold, with the rest used for home consumption or was postharvest loss. About 89% of producers participated in the market as sellers.
Mango
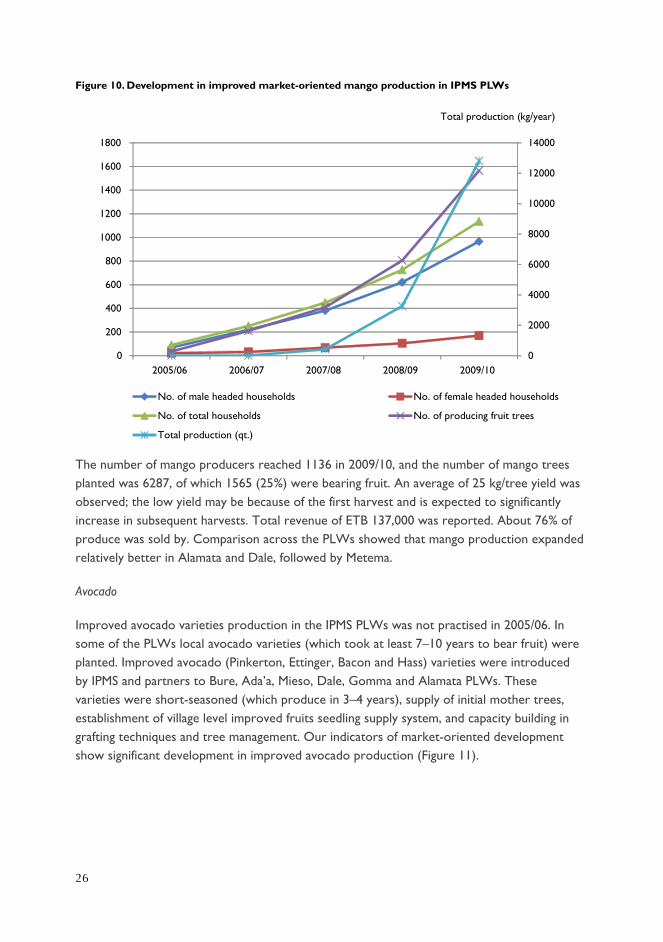
Mango production was not practised in many of the IPMS PLWs in 2005/06. IPMS and partners promoted improved mango (Apple mango, Kent, Keitt, Tommy Atkins) in Alamata, Metema, Bure, Ada’a, Dale, Mieso and Gomma PLWs. Interventions include introduction of short-seasoned improved varieties, (that produce in 3–4 years, compared with 7–10 years of the local variety), supply of initial mother trees and grafting materials, establishment of village level smallholder improved seedling supply system, capacity building in grafting and tree management. The market-oriented development indicators show that significant development took place in improved market-oriented mango production in the PLWs (Figure 10).
0
1000000
2000000
3000000
4000000
5000000
6000000
7000000
8000000
9000000
10000000
0
10000
20000
30000
40000
50000
60000
70000
80000
2005/06 2006/07 2007/08 2008/09 2009/10
No. of male headed households No. of female headed households
No. of total households No. of producing fruit trees
Total production (qt.)
Total production (kg/year)
26
Figure 10. Development in improved market-oriented mango production in IPMS PLWs
The number of mango producers reached 1136 in 2009/10, and the number of mango trees planted was 6287, of which 1565 (25%) were bearing fruit. An average of 25 kg/tree yield was observed; the low yield may be because of the first harvest and is expected to significantly increase in subsequent harvests. Total revenue of ETB 137,000 was reported. About 76% of produce was sold by. Comparison across the PLWs showed that mango production expanded relatively better in Alamata and Dale, followed by Metema.
Avocado
Improved avocado varieties production in the IPMS PLWs was not practised in 2005/06. In some of the PLWs local avocado varieties (which took at least 7–10 years to bear fruit) were planted. Improved avocado (Pinkerton, Ettinger, Bacon and Hass) varieties were introduced by IPMS and partners to Bure, Ada’a, Mieso, Dale, Gomma and Alamata PLWs. These varieties were short-seasoned (which produce in 3–4 years), supply of initial mother trees, establishment of village level improved fruits seedling supply system, and capacity building in grafting techniques and tree management. Our indicators of market-oriented development show significant development in improved avocado production (Figure 11).
0
2000
4000
6000
8000
10000
12000
14000
0
200
400
600
800
1000
1200
1400
1600
1800
2005/06 2006/07 2007/08 2008/09 2009/10
No. of male headed households No. of female headed households
No. of total households No. of producing fruit trees
Total production (qt.)
Total production (kg/year)
27
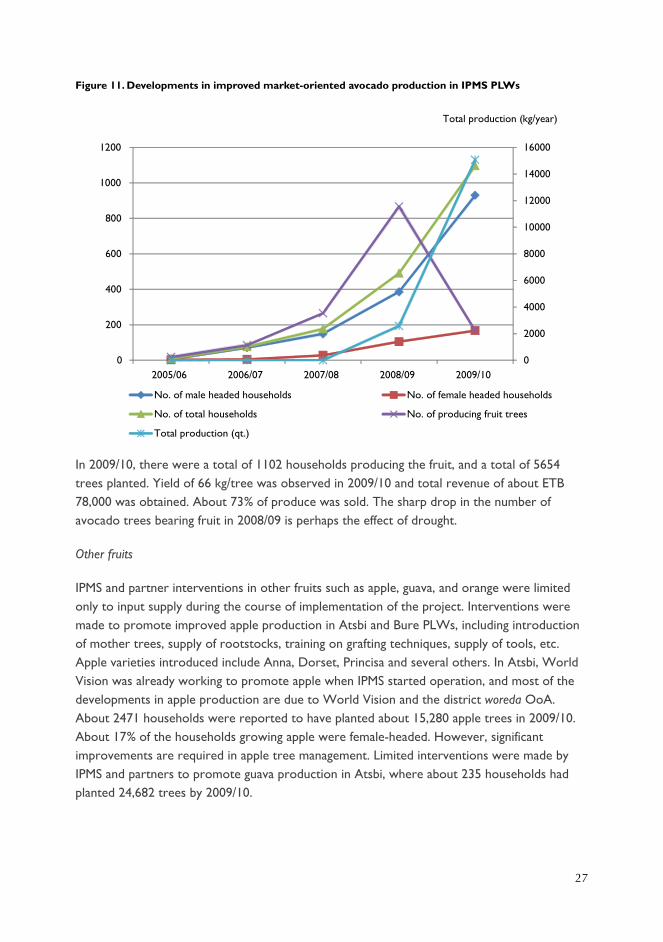
Figure 11. Developments in improved market-oriented avocado production in IPMS PLWs
In 2009/10, there were a total of 1102 households producing the fruit, and a total of 5654 trees planted. Yield of 66 kg/tree was observed in 2009/10 and total revenue of about ETB 78,000 was obtained. About 73% of produce was sold. The sharp drop in the number of avocado trees bearing fruit in 2008/09 is perhaps the effect of drought.
Other fruits
IPMS and partner interventions in other fruits such as apple, guava, and orange were limited only to input supply during the course of implementation of the project. Interventions were made to promote improved apple production in Atsbi and Bure PLWs, including introduction of mother trees, supply of rootstocks, training on grafting techniques, supply of tools, etc. Apple varieties introduced include Anna, Dorset, Princisa and several others. In Atsbi, World Vision was already working to promote apple when IPMS started operation, and most of the developments in apple production are due to World Vision and the district woreda OoA. About 2471 households were reported to have planted about 15,280 apple trees in 2009/10. About 17% of the households growing apple were female-headed. However, significant improvements are required in apple tree management. Limited interventions were made by IPMS and partners to promote guava production in Atsbi, where about 235 households had planted 24,682 trees by 2009/10.
0
2000
4000
6000
8000
10000
12000
14000
16000
0
200
400
600
800
1000
1200
2005/06 2006/07 2007/08 2008/09 2009/10
No. of male headed households No. of female headed households
No. of total households No. of producing fruit trees
Total production (qt.)
Total production (kg/year)
28
3.6 VegetablesVegetables have become an important source of cash income to households in several of the IPMS PLWs. Vegetable production was practised in very small scale in most of the woredas. IPMS and partners promoted vegetable production using improved varieties and nursery and agronomic practices. Survey results on the impact of improved vegetable production on women showed that 82% of surveyed women reported that their work load was increased, but only 38% and 20% of them reported that they were responsible for selling the produce and control the income, respectively.
Onion
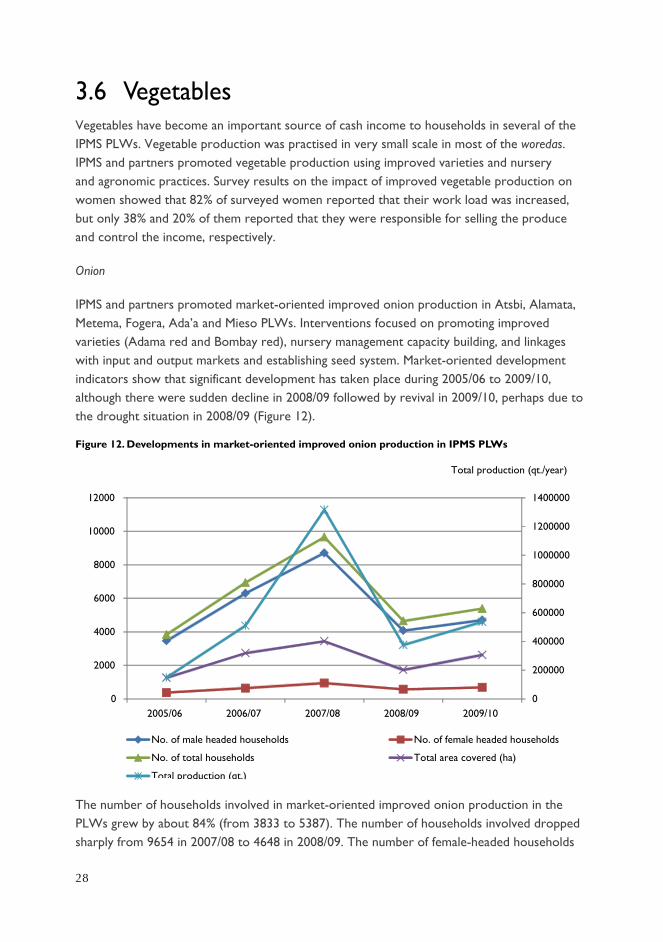
IPMS and partners promoted market-oriented improved onion production in Atsbi, Alamata, Metema, Fogera, Ada’a and Mieso PLWs. Interventions focused on promoting improved varieties (Adama red and Bombay red), nursery management capacity building, and linkages with input and output markets and establishing seed system. Market-oriented development indicators show that significant development has taken place during 2005/06 to 2009/10, although there were sudden decline in 2008/09 followed by revival in 2009/10, perhaps due to the drought situation in 2008/09 (Figure 12).
Figure 12. Developments in market-oriented improved onion production in IPMS PLWs
The number of households involved in market-oriented improved onion production in the PLWs grew by about 84% (from 3833 to 5387). The number of households involved dropped sharply from 9654 in 2007/08 to 4648 in 2008/09. The number of female-headed households
0
200000
400000
600000
800000
1000000
1200000
1400000
0
2000
4000
6000
8000
10000
12000
2005/06 2006/07 2007/08 2008/09 2009/10
No. of male headed households No. of female headed households
No. of total households Total area covered (ha)
Total production (qt.)
Total production (qt./year)
29
involved in onion production also grew by 84% (from 373 to 687), with a sharp drop in 2008/09. This turning point is caused by drought in Atsbi, Alamata, Metema, Ada’a and Mieso PLWs, but by price collapse in Fogera.
The proportion of female-headed households involved in onion production increased consistently but slightly from about 10% to 13%. The total area under improved onion grew by about 109% (from 1255 ha to 2623 ha). Area per household under improved onion increased slightly from 0.33 ha to about 0.5 ha. Interestingly between 77% and 93% of onion production is practised under irrigation, and between 5% and 21%, under supplemental irrigation. Total production grew by 261% (from about 150 thousand quintal to 540 thousand quintal), higher than the growth rate of total number of households and area covered, showing the effect of improvements in yield. For example, onion yield under irrigation increased from 100 qt/ha to 307 qt/ha in Ada’a and from 118 qt/ha to 248 qt/ha in Fogera. Slight decline in irrigated yield was observed in Alamata, Metema and Mieso PLWs, while the yield remained the same in Atsbi at about 150 qt/ha. The baseline yield of onion in Fogera in 2004/05 was about 72 qt/ha, while yield in the other PLWs was lower. About half a million quintal onion bulb was sold in 2009/10, for a total revenue of about ETB 199 million. Total revenue grew by 276% in real terms. About 90% of produce is sold by about 96% of producers.
Remarkable success has been achieved in the IPMS and partners’ intervention to introduce farmer-based onion seed supply system in Fogera. A diagnostic study of onion value chain in Fogera showed that onion seed supply was the key constraint for the development of the value chain. As a result, IPMS and partners decided to introduce farmer-based onion seed supply. Initially started with 3 volunteer farmers in 2005/06, the number of onion seed producers rose to 92 in 2009/10 and 146 in 20010/11. Area under onion seed production also grew to 34 ha in 2010/11 from just 0.75 ha in 2005/06. Volume of production increased from just 6 qt initially to 205 qt in 20010/11. The revenue from onion seed reached more than ETB 8 million in 2010/11 from 150 thousand initially. Fogera onion seed producers are now supplying certified onion seed to as far as Alamata, Kobo, Dembia, Bure and some woredas in Oromia.
Tomato
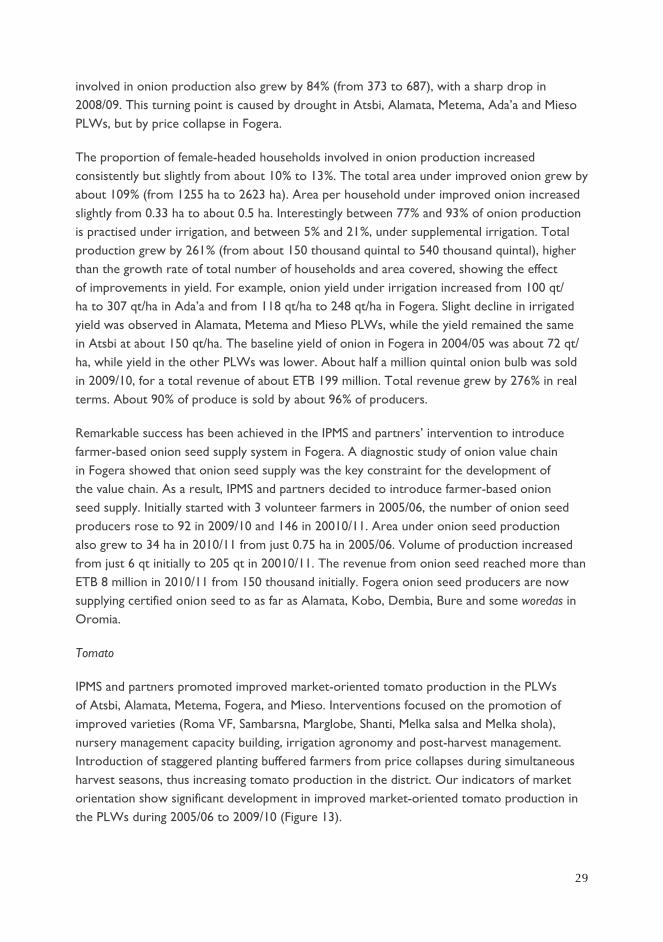
IPMS and partners promoted improved market-oriented tomato production in the PLWs of Atsbi, Alamata, Metema, Fogera, and Mieso. Interventions focused on the promotion of improved varieties (Roma VF, Sambarsna, Marglobe, Shanti, Melka salsa and Melka shola), nursery management capacity building, irrigation agronomy and post-harvest management. Introduction of staggered planting buffered farmers from price collapses during simultaneous harvest seasons, thus increasing tomato production in the district. Our indicators of market orientation show significant development in improved market-oriented tomato production in the PLWs during 2005/06 to 2009/10 (Figure 13).
30
Figure 13. Developments in improved market-oriented tomato production in IPMS PLWs
The total number of households involved in improved tomato production increased consistently and grew by 202% (from 1685 to 5082). The number of female-headed households grew at a lesser rate, at 176%, resulting in the decline in the proportion of female-headed households involved from 15% to 12%. As with Onion, 88% to 94% of tomato production is done under irrigation, and 2% to 5%, under supplemental irrigation. The total area under tomato grew by 264%. Area per household under tomato production ranged from 0.19 ha to 0.23 ha. Total volume of production grew by 267% (from 82,475 qt to 302,715 qt.). About 272 thousand quintal was sold in 2009/10, for a total revenue of close to 69 million. Total revenue grew by 263% in real terms. About 91% of produce is sold, and more than 90% of producers sell their produce. Tomato yield ranged from 190 to 300 qt/ha in Alamata, from 200 to 275 qt/ha in Atsbi, and from 250 to 400 qt/ha in Fogera. Baseline yields of below 54 qt/ha were observed in 2004/05.
Pepper
IPMS and partner promoted improved market-oriented pepper production in the PLWs of Alamata, Metema, Bure, Alaba and Mieso. Interventions to promote market-oriented pepper production focused on promoting the improved varieties, Mareko Fana, and some selected local varieties, improved cultural practices market linkages, delivery of market information and weighing scale calibration. Pepper production in these PLWs was already popular in 2005/06, but our indicators of market orientation also show that there have been consistent developments in market-oriented improved pepper production during 2005/06 to 2009/10 (Figure 14).
0
50000
100000
150000
200000
250000
300000
350000
0
1000
2000
3000
4000
5000
6000
2005/06 2006/07 2007/08 2008/09 2009/10
No. of male headed households No. of female headed households
No. of total households Total area covered (ha)
Total production (qt.)
Total production (qt./year)
31
Figure 14. Developments in improved market-oriented pepper production in IPMS PLWs
The total number of households producing improved pepper increased consistently and grew by 83% (from 25,055 to 45,935), and the number of female-headed households grew by 74% (from 3523 to 6122). The proportion of female-headed households involved remained around 13%. In sharp contrast to Onion and tomato, more than 95% of pepper production is rain-fed. Total production grew by 112% (from 43,643 qt to 92,596 qt). More than 90 thousand quintal of pepper was sold in 2009/10 for a total revenue of more than 192 million. Total revenue grew by 131% in real terms.
Alaba and Bure are the two more important pepper producing PLWS. Pepper yield in these PLWs ranged from 4 to 6 qt/ha (in Alaba), and from 10 to 19 qt/ha (in Bure). It is interesting to note that pepper yields are low in Alaba, a district which is a major producer of the crop. About 90% of pepper produce is sold by more than 96% of producers. Pepper weighing scales in Alaba were calibrated in collaboration with the Ethiopian Standards Agency as one of the marketing interventions. This had been a major point of complaint by pepper growers.
Cabbage
IPMS and partners promoted improved market-oriented cabbage production in Atsbi PLW only. Interventions focused on promoting improved varieties, irrigation agronomy, and market linkages. All of our indicators of smallholder market orientation show that modest developments took place between 2005/06 and 2009/10 (Figure 15).
0
10000
20000
30000
40000
50000
60000
70000
80000
90000
100000
0
5000
10000
15000
20000
25000
30000
35000
40000
45000
50000
2005/06 2006/07 2007/08 2008/09 2009/10
No. of male headed households No. of female headed households
No. of total households Total area covered (ha)
Total production (qt.)
Total production (qt./year)
32
Figure 15. Developments in market-oriented improved cabbage production in IPMS PLWs
The number of households involved in improved cabbage production showed a modest growth rate of 44% (from 907 to 1309), and the number of female-headed households involved grew by 60%. The proportion of female-headed households involved ranged between 24% and 28%. As with onion and tomato and in sharp contrast with pepper, more than 81% of cabbage production is conducted under irrigation. Between 6% and 15% of production is rain-fed. The role of supplemental irrigation (irrigation when natural rainfall is inadequate) is very low. Total production grew by 63% (from 21,400 qt to 34,894 qt). Wide variation in yield of the crop under irrigation was observed over the years ranging from 102 qt/ha to 230 qt/ha. A total of 26.2 thousand quintal of cabbage produce was sold in 2009/10 for a total revenue of 9.2 million. Total revenue grew by 63% in real terms. About 75% of cabbage produce is sold and more than 95% of producers sell their cabbage produce.
3.7 CoffeeIn Dale and Gomma PLWs, coffee is grown by smallholders for domestic use as well as for sale. While many efforts have been made in the past to introduce new varieties, especially in response to coffee berry disease (CBD), impact on farm income was often limited due to low and fluctuating prices in the world market and low productivity.
0
5000
10000
15000
20000
25000
30000
35000
40000
0
200
400
600
800
1000
1200
1400
2005/06 2006/07 2007/08 2008/09 2009/10
No. of male headed households No. of female headed households
No. of total households Total area covered (ha)
Total production (qt.)
Total production (qt./year)
33
Low coffee productivity was mainly caused by low yielding varieties, diseases, poor management practices and low and fluctuating prices. Interventions to solve these problems included introduction of hybrid coffee varieties and locally improved coffee varieties, improved disease control ( coffee wilt disease) and improved agronomic management ( especially weeding and harvesting), and establishment of coffee marketing groups and facilitating market linkages. The introduced improved varieties were hybrid coffee (Aba Buna) in Gomma and a local improved pure line variety called Angafa in Dale. These are high yielding and disease resistant varieties released by the national research system.
However, it is fair to say that most of the marketing interventions are the result of higher level interventions such as ECX (see knowledge management). Insufficient supply of improved coffee seedlings and insufficient supply of nursery equipment and coffee management tools were other problems identified. To alleviate these problems, interventions related to establishment of private hybrid coffee nurseries with mother trees for future supply of scions, establishment of private nurseries for improved local varieties and mother trees for future supply of seeds, and development of private shops for nursery equipment supply and coffee management tools were made. Credit service for rural shops supplying inputs for coffee seedlings production and improving coffee bean quality was also established.
3.8 Improved dairyDairy production from improved dairy cows (Holstein/Friesian cross, Begait) was one of the key commodities IPMS and its partners focused on in their effort to promote commercialization of smallholders in livestock production. Promoting adoption of improved dairy cows and associated feeding and management practices, and linkages with input and output markets were the major interventions. Survey results on the impact of dairy development on women showed that 83% of surveyed women reported that their work load increased, and 72% reported that they are responsible for selling the product, but only 48% reported that they control the income.
Improved dairy was an important commodity in Atsbi, Alamata, Fogera, Bure and Ada’a PLWs. Smallholder commercialization in dairy in the IPMS PLWs as indicated by the number of households involved, the number of improved dairy cows owned and producing milk, and the total amount of milk produced and sold, showed significant development between 2005/06 and 2009/10 (Figure 16). This shows that the IPMS and partners interventions to develop market-oriented dairy production has been effective and could result in a large scale impact if and when successful efforts are made to scale up and out the practice.
34
Figure 16. Developments in market-oriented dairy (2005/06–2009/10) in IPMS PLWs
The number of households involved in market-oriented improved dairy production increased consistently from 682 in 2005/06 to 2156 in 2009/10, or a growth of 216%. The number of female-headed households also grew steadily by 238%. However, the proportion of female-headed households involved in the market-oriented improved dairy production did not show consistent growth, but rather fluctuated between 13.4% and 16.3%.
The number of improved dairy cows owned and producing milk showed slightly higher growth rate of 253% (increasing from 532 to 1879), indicating an increase in the number of dairy cows owned and producing milk per household. Although still low relative to the attainable level, milk yield also showed consistent improvement from 4.48 lt/day per cow to 5.79 lt/day per cow, a growth rate of 29%. Total production of milk registered the highest (among the indicators used) growth rate of 356% (increasing from 726,924 lt/year to about 3.32 million litre/year), due to both the increase in the number of improved dairy cows producing milk and the increase in milk yield.
Price of milk increased consistently during the period. We found out that total revenue showed a growth rate of 200% in real terms (increasing from about ETB 2.2 to 6.5 million). About 62% of milk produced was sold in 2009/10. The proportion of households selling their milk produce from improved dairy cows did not show significant change during the period and fluctuated between 50% and 52%.
While the paragraphs above show the aggregate picture across the PLWs, we have also observed variations between the PLWs. For example, in Atsbi, the number of households producing milk from improved cows grew by about 560%, and average milk yield reached about 8 lt/day per cow. On the other hand, the development of market-oriented dairy was low in Alamata. No female headed-households were involved in improved dairy production
0
500000
1000000
1500000
2000000
2500000
3000000
3500000
0
500
1000
1500
2000
2500
2005/06 2006/07 2007/08 2008/09 2009/10
No. of male headed households No. of female headed households
No. of total households No. of cows producing milk
Total milk production (lt/year)
Total milk
production
35
in Fogera and Bure districts. On the other hand, involvement of female-headed households in improved dairy was high in Atsbi and Alamata (about 20%) and the proportion of female-headed households in Ada’a showed significant and steady change from just 2% to 21%.
It should be noted that the IPMS and partner interventions in improved dairy production focused on promoting improved breeds and associated management and feeding practices. However, the interventions are likely to have spillover effect on dairy production from local cows, especially in the more remote rural areas where butter production/sale system prevails. Hence the impact of the IPMS and partner interventions are likely to be much higher than what is reported in this summary report. Moreover, the IPMS and partner interventions were not limited to only the rural areas. Urban or peri-urban dairy enterprises were also beneficiaries of the interventions, but are not included in this report. Hence, it is likely that the impact reported here further underestimated due to the exclusion of the urban and peri-urban dairy system.
Mass insemination
Lack or shortage of genetically improved animals is a key constraint in the dairy and meat value chains. To address this bottleneck the IPMS project initiated the use of mass insemination in targeted production areas using hormones to regulate the oestrus cycle as a possible alternative option in different milk sheds in Tigray, Amhara, Oromia and SNNPRS. This mass AI intervention aims at improving the efficiency of the insemination (increasing pregnancy rate/first insemination) and the effectiveness of the AI service delivery (more inseminations/AI technician). Effectiveness results of mass insemination in 2 milk sheds indicate that 200 and 175 animals were treated with hormones/inseminated over a 2 week period by 2 AI technicians per milk shed. This results in about 45 inseminations/AI technician per week—as compared to 6 insemination/AI technician per week in the existing system. Initial results indicate that pregnancy rate of 62% which is a significant improvement compared to the current national average rate of 27%, mainly as a result of timely availability of well-trained AI technicians at the time of planned heat period.
A second round of action research on mass insemination has taken place in the past months based on i) an assessment of the initial results and lessons learned by the stakeholders and ii) new knowledge and technology including the use of sex fixer to increase the probability of birth of female calves. So far, a total of 2097 cows composed of 450 in Oromia, 572 cows in Tigray, 511 cows in SNNPR and 564 cows in Amhara have been synchronized and about 1000 cows have been given sex fixer. Preliminary results of the pregnancy rate from Tigray showed 77% pregnancy rate in Adigrat (out of 120 cows treated) and 73% in Wukro (out of 104 cows treated). The average pregnancy rate from the two locations was about 75%. Data from other sites are not yet available.
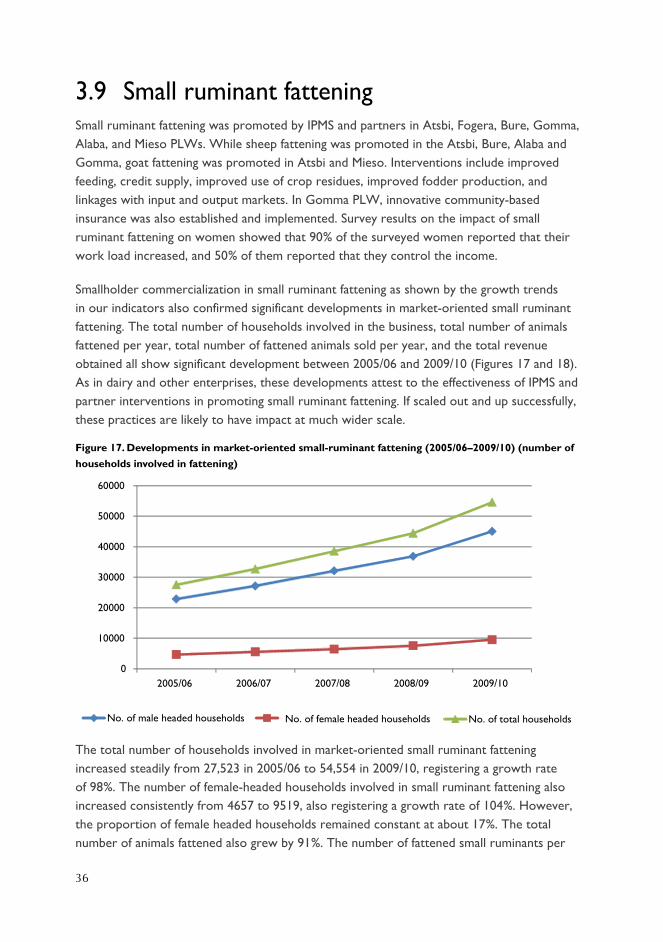
36
3.9 Small ruminant fatteningSmall ruminant fattening was promoted by IPMS and partners in Atsbi, Fogera, Bure, Gomma, Alaba, and Mieso PLWs. While sheep fattening was promoted in the Atsbi, Bure, Alaba and Gomma, goat fattening was promoted in Atsbi and Mieso. Interventions include improved feeding, credit supply, improved use of crop residues, improved fodder production, and linkages with input and output markets. In Gomma PLW, innovative community-based insurance was also established and implemented. Survey results on the impact of small ruminant fattening on women showed that 90% of the surveyed women reported that their work load increased, and 50% of them reported that they control the income.
Smallholder commercialization in small ruminant fattening as shown by the growth trends in our indicators also confirmed significant developments in market-oriented small ruminant fattening. The total number of households involved in the business, total number of animals fattened per year, total number of fattened animals sold per year, and the total revenue obtained all show significant development between 2005/06 and 2009/10 (Figures 17 and 18). As in dairy and other enterprises, these developments attest to the effectiveness of IPMS and partner interventions in promoting small ruminant fattening. If scaled out and up successfully, these practices are likely to have impact at much wider scale.
Figure 17. Developments in market-oriented small-ruminant fattening (2005/06–2009/10) (number of
households involved in fattening)
The total number of households involved in market-oriented small ruminant fattening increased steadily from 27,523 in 2005/06 to 54,554 in 2009/10, registering a growth rate of 98%. The number of female-headed households involved in small ruminant fattening also increased consistently from 4657 to 9519, also registering a growth rate of 104%. However, the proportion of female headed households remained constant at about 17%. The total number of animals fattened also grew by 91%. The number of fattened small ruminants per
0
10000
20000
30000
40000
50000
60000
2005/06 2006/07 2007/08 2008/09 2009/10
No. of male headed households No. of total householdsNo. of female headed households
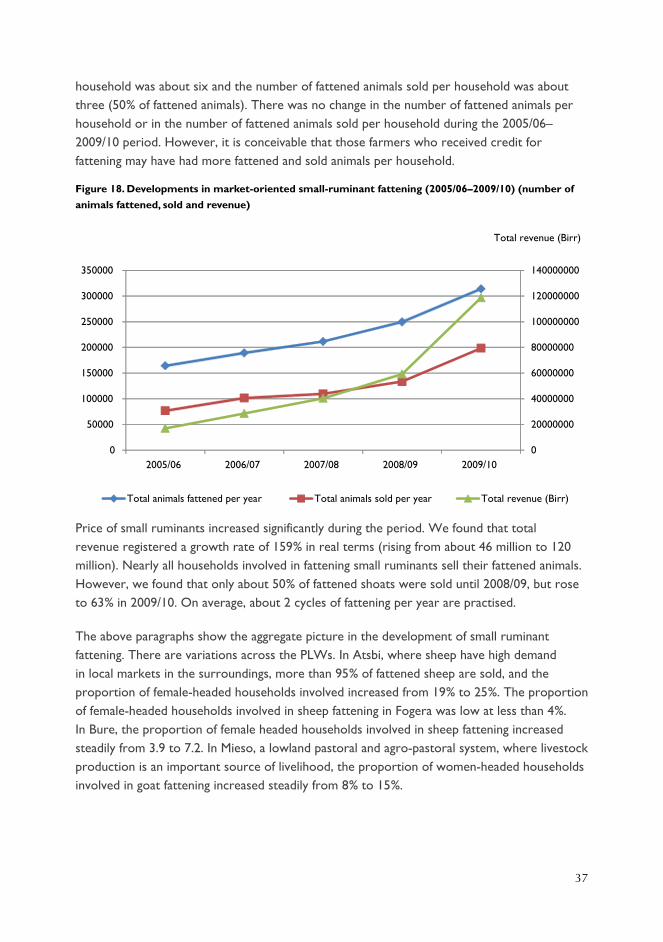
37
household was about six and the number of fattened animals sold per household was about three (50% of fattened animals). There was no change in the number of fattened animals per household or in the number of fattened animals sold per household during the 2005/06–2009/10 period. However, it is conceivable that those farmers who received credit for fattening may have had more fattened and sold animals per household.
Figure 18. Developments in market-oriented small-ruminant fattening (2005/06–2009/10) (number of
animals fattened, sold and revenue)
Price of small ruminants increased significantly during the period. We found that total revenue registered a growth rate of 159% in real terms (rising from about 46 million to 120 million). Nearly all households involved in fattening small ruminants sell their fattened animals. However, we found that only about 50% of fattened shoats were sold until 2008/09, but rose to 63% in 2009/10. On average, about 2 cycles of fattening per year are practised.
The above paragraphs show the aggregate picture in the development of small ruminant fattening. There are variations across the PLWs. In Atsbi, where sheep have high demand in local markets in the surroundings, more than 95% of fattened sheep are sold, and the proportion of female-headed households involved increased from 19% to 25%. The proportion of female-headed households involved in sheep fattening in Fogera was low at less than 4%. In Bure, the proportion of female headed households involved in sheep fattening increased steadily from 3.9 to 7.2. In Mieso, a lowland pastoral and agro-pastoral system, where livestock production is an important source of livelihood, the proportion of women-headed households involved in goat fattening increased steadily from 8% to 15%.
0
20000000
40000000
60000000
80000000
100000000
120000000
140000000
0
50000
100000
150000
200000
250000
300000
350000
2005/06 2006/07 2007/08 2008/09 2009/10
Total animals fattened per year Total animals sold per year Total revenue (Birr)
Total revenue (Birr)
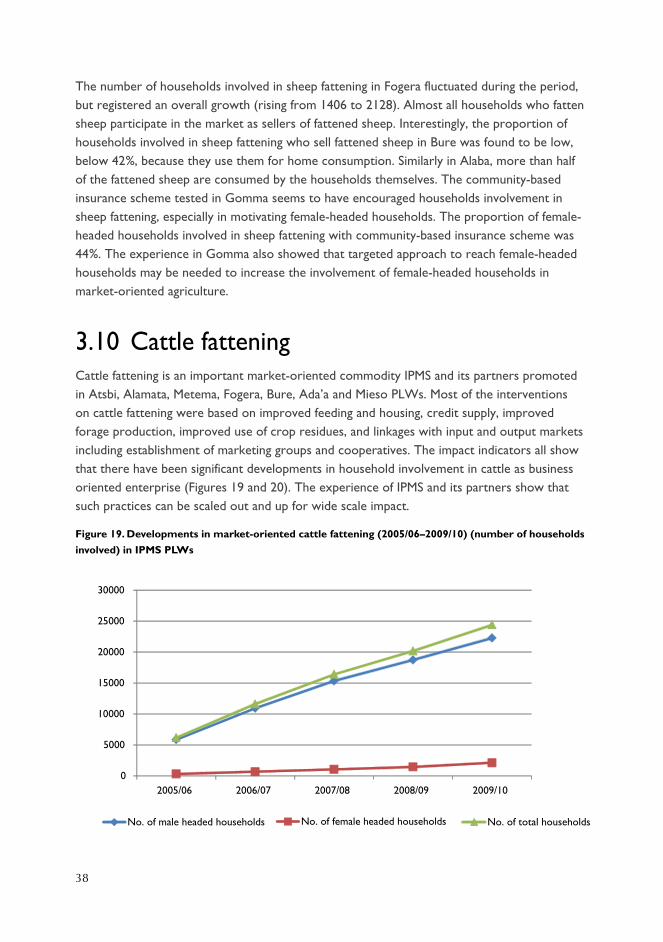
38
The number of households involved in sheep fattening in Fogera fluctuated during the period, but registered an overall growth (rising from 1406 to 2128). Almost all households who fatten sheep participate in the market as sellers of fattened sheep. Interestingly, the proportion of households involved in sheep fattening who sell fattened sheep in Bure was found to be low, below 42%, because they use them for home consumption. Similarly in Alaba, more than half of the fattened sheep are consumed by the households themselves. The community-based insurance scheme tested in Gomma seems to have encouraged households involvement in sheep fattening, especially in motivating female-headed households. The proportion of female-headed households involved in sheep fattening with community-based insurance scheme was 44%. The experience in Gomma also showed that targeted approach to reach female-headed households may be needed to increase the involvement of female-headed households in market-oriented agriculture.
3.10 Cattle fatteningCattle fattening is an important market-oriented commodity IPMS and its partners promoted in Atsbi, Alamata, Metema, Fogera, Bure, Ada’a and Mieso PLWs. Most of the interventions on cattle fattening were based on improved feeding and housing, credit supply, improved forage production, improved use of crop residues, and linkages with input and output markets including establishment of marketing groups and cooperatives. The impact indicators all show that there have been significant developments in household involvement in cattle as business oriented enterprise (Figures 19 and 20). The experience of IPMS and its partners show that such practices can be scaled out and up for wide scale impact.
Figure 19. Developments in market-oriented cattle fattening (2005/06–2009/10) (number of households
involved) in IPMS PLWs
0
5000
10000
15000
20000
25000
30000
2005/06 2006/07 2007/08 2008/09 2009/10
No. of male headed households No. of female headed households No. of total households
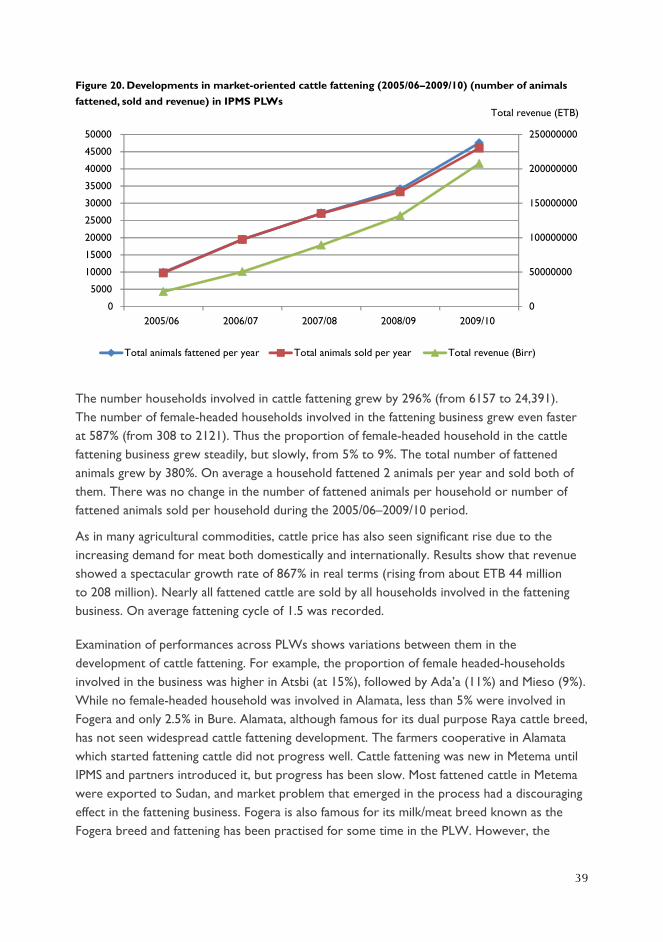
39
Figure 20. Developments in market-oriented cattle fattening (2005/06–2009/10) (number of animals
fattened, sold and revenue) in IPMS PLWs
The number households involved in cattle fattening grew by 296% (from 6157 to 24,391). The number of female-headed households involved in the fattening business grew even faster at 587% (from 308 to 2121). Thus the proportion of female-headed household in the cattle fattening business grew steadily, but slowly, from 5% to 9%. The total number of fattened animals grew by 380%. On average a household fattened 2 animals per year and sold both of them. There was no change in the number of fattened animals per household or number of fattened animals sold per household during the 2005/06–2009/10 period.
As in many agricultural commodities, cattle price has also seen significant rise due to the increasing demand for meat both domestically and internationally. Results show that revenue showed a spectacular growth rate of 867% in real terms (rising from about ETB 44 million to 208 million). Nearly all fattened cattle are sold by all households involved in the fattening business. On average fattening cycle of 1.5 was recorded.
Examination of performances across PLWs shows variations between them in the development of cattle fattening. For example, the proportion of female headed-households involved in the business was higher in Atsbi (at 15%), followed by Ada’a (11%) and Mieso (9%). While no female-headed household was involved in Alamata, less than 5% were involved in Fogera and only 2.5% in Bure. Alamata, although famous for its dual purpose Raya cattle breed, has not seen widespread cattle fattening development. The farmers cooperative in Alamata which started fattening cattle did not progress well. Cattle fattening was new in Metema until IPMS and partners introduced it, but progress has been slow. Most fattened cattle in Metema were exported to Sudan, and market problem that emerged in the process had a discouraging effect in the fattening business. Fogera is also famous for its milk/meat breed known as the Fogera breed and fattening has been practised for some time in the PLW. However, the
0
50000000
100000000
150000000
200000000
250000000
0
5000
10000
15000
20000
25000
30000
35000
40000
45000
50000
2005/06 2006/07 2007/08 2008/09 2009/10
Total animals fattened per year Total animals sold per year Total revenue (Birr)
Total revenue (ETB)
40
number of households involved in fattening has not been high, although increased over time. Bure, a PLW rich in wheat crop residues, is not new to cattle fattening and has seen significant development since IPMS and partners’ interventions began in 2007/08. Ada’a PLW, because of its good market access and availability of crop residues, especially teff straw, has also seen remarkable development in cattle fattening. Mieso is famous for its supply of cattle both for domestic consumption and for export, and maize and sorghum stovers are widely used as feed for cattle and for fattening purposes. Significant development was observed in cattle fattening in Mieso.
Forage seed and seedling supply and forage development
Feed supply was identified as most critical constraint of livestock production in almost all PLWs. Hence, IPMS and partners intervened in the development of improved forage production by facilitating forage seed and seedling supply, capacity building, introducing and promoting cut and carry system, and linking forage development with market-oriented livestock production. In Atsbi degraded hillsides and grazing bottom lands were enclosed and managed under cut and carry system, with some enrichment plantations of improved forage varieties. Backyard forage production was promoted in Atsbi, Fogera, Mieso, Alaba, Gomma and Bure. Irrigated forage production was promoted in Atsbi, Alamata and Ada’a. In Fogera, Amecala clearance followed by enclosing and improved forage plantation showed significant improvement in forage biomass production. In Alaba, forage seed production was promoted and some farmers specialized in forage and forage seed production. Gomma legume forage seed supply led to development of backyard forage production. In Metema where natural pasture is relatively abundant, hay baling was introduced.
Significant increase in forage biomass was achieved in Atsbi, particularly from the enclosed degraded hillsides and grazing bottom lands. An important intervention that contributed to biomass increase in Atsbi was introduction of improved forage species, cut and carry system, and the fact harvesting was done only above 10 cm of the forage plants leaving the bottom part and the root zone intact to facilitate re-growth. The combined effort of the woreda office of agriculture (OoA), the regional Bureau of Agriculture (BoA), the regional research institute, and NGOs to raise and supply improved forage seedlings for enrichment plantations was also pivotal in the increase.
From a total of about 10,542 ha grazing bottom lands, about 71% (or 7479 ha) was enclosed and utilized under cut and carry system. Moreover, about 13,404 ha of degraded hillsides were enclosed for cut and carry, of which about 1242 ha had improved forage enrichment plantation in 2009/10. It was estimated that a total forage biomass of about 92,011 t was harvested from the enclosed hillsides and bottom lands, and irrigated and backyard forages in 2009/10, an increase of about 326% over the free grazing hillsides and bottom lands. About 40% of this biomass was contributed by the bottom lands, followed by the hillsides. Forage biomass
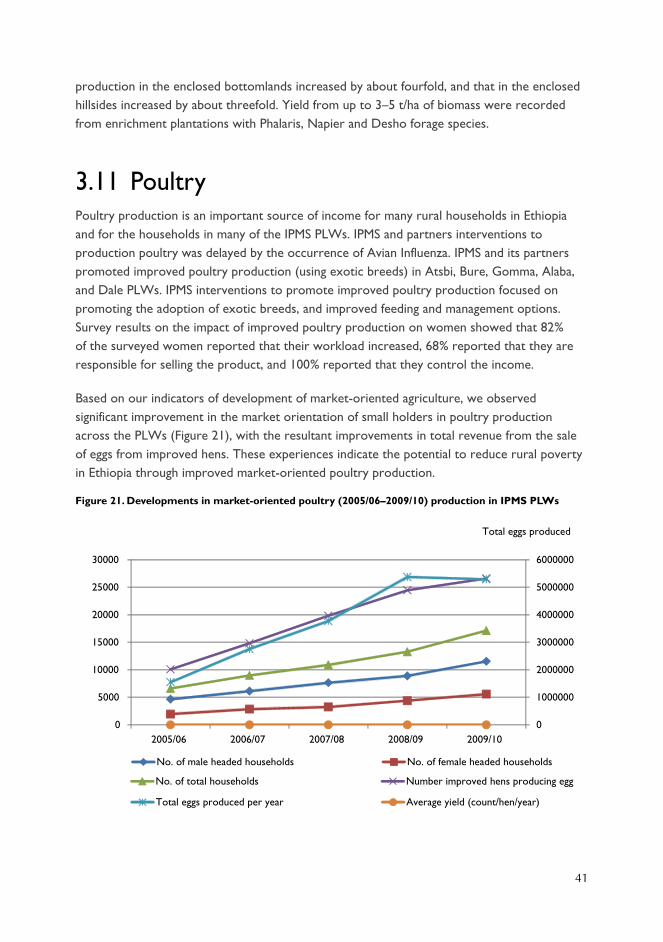
41
production in the enclosed bottomlands increased by about fourfold, and that in the enclosed hillsides increased by about threefold. Yield from up to 3–5 t/ha of biomass were recorded from enrichment plantations with Phalaris, Napier and Desho forage species.
3.11 PoultryPoultry production is an important source of income for many rural households in Ethiopia and for the households in many of the IPMS PLWs. IPMS and partners interventions to production poultry was delayed by the occurrence of Avian Influenza. IPMS and its partners promoted improved poultry production (using exotic breeds) in Atsbi, Bure, Gomma, Alaba, and Dale PLWs. IPMS interventions to promote improved poultry production focused on promoting the adoption of exotic breeds, and improved feeding and management options. Survey results on the impact of improved poultry production on women showed that 82% of the surveyed women reported that their workload increased, 68% reported that they are responsible for selling the product, and 100% reported that they control the income.
Based on our indicators of development of market-oriented agriculture, we observed significant improvement in the market orientation of small holders in poultry production across the PLWs (Figure 21), with the resultant improvements in total revenue from the sale of eggs from improved hens. These experiences indicate the potential to reduce rural poverty in Ethiopia through improved market-oriented poultry production.
Figure 21. Developments in market-oriented poultry (2005/06–2009/10) production in IPMS PLWs
0
1000000
2000000
3000000
4000000
5000000
6000000
0
5000
10000
15000
20000
25000
30000
2005/06 2006/07 2007/08 2008/09 2009/10
Total eggs produced
No. of male headed households No. of female headed households
No. of total households Number improved hens producing egg
Total eggs produced per year Average yield (count/hen/year)
42
The number of households involved in improved poultry production grew by 159% (from 6602 in 2005/06 to 17,126 in 2009/10). The number of female-headed households involved grew at even faster rate of 186%. Similarly, the proportion of female-headed households involved increased from 30% in 2005/06 to 33% in 2009/10. The number of improved hens producing eggs also grew by 163%, and the total number of eggs produced, by 242%. Interestingly, we observed improvements in egg productivity, which grew by 29%, rising from 154/hen per year to 199/hen per year. Total revenue from the sale of eggs from improved hens grew by 291% in real terms (rising from nearly 1 million to 3.9 million at 2009/10 prices). About 72% of eggs produced was sold by more than 85% of producers.
Examination of improved poultry development across the PLWs shows some variations. For example, an interesting feature of poultry production in Atsbi is the fact that more than 50% of producers of improved chicken are female-headed households. Atsbi also saw progressive increase in the proportion of households selling eggs from improved hens, increasing from 77% to 96%. On the contrary, the proportion of female-headed households involved in the production of improved chicken in Bure showed a steady decline from 37.5% to 18.6%. The growth rate of egg productivity increase was the highest in Alaba, at 46% (from 130 eggs/hen per year to 190 eggs/hen per year). Dale was the PLW that saw significant intervention to promote improved poultry production, including farmer-based pullet supply, improved feeding and management interventions. However, the number of households who produce eggs from improved chicken does not show significant change during the period, increasing by only 18% (from 1532 to 1811). About 202 eggs were sold per household in Dale in 2009/10.
Women groups producing day-old chicks and pullets
IPMS and partners pilot tested women group based day-old chicken and pullet production for sale in Dale. Five women groups with 80 members managed to raise day-old chickens to three months old pullets. This was in response to a diagnosed problem in the supply system of pullets for the poultry value chain for egg production. A total of 4,000 day old chicks were raised (50/farmer) and in total 3,470 pullets were produced after 3 to 4 months. Out of this, 3113 pullets were sold and 357 kept by the women. Average sale price was ETB 50 and the total production value was ETB 173,500.
All inputs required including purchase of day old chicks, vaccines, feed, water and feeding equipment and a hay box brooder was purchased with a loan obtained from the revolving credit fund. On average each farmer borrowed about ETB 1300, amounting to 104,000 in total. Average return to women/family labour was ETB 810. About 26 women (or family) earned 900 to 1160 ETB, while the remaining ones earned 350–850 ETB.
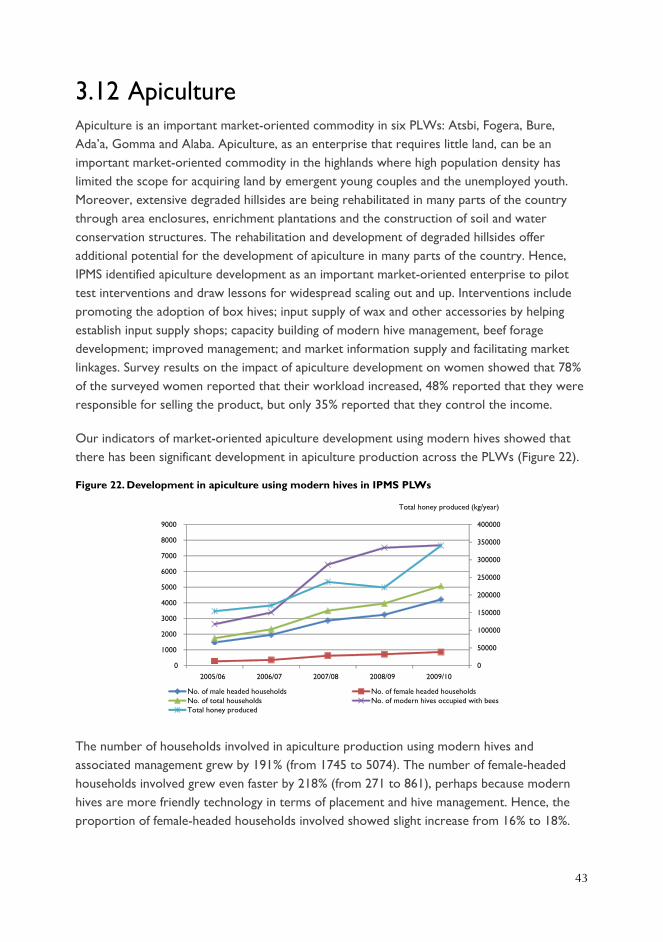
43
3.12 Apiculture Apiculture is an important market-oriented commodity in six PLWs: Atsbi, Fogera, Bure, Ada’a, Gomma and Alaba. Apiculture, as an enterprise that requires little land, can be an important market-oriented commodity in the highlands where high population density has limited the scope for acquiring land by emergent young couples and the unemployed youth. Moreover, extensive degraded hillsides are being rehabilitated in many parts of the country through area enclosures, enrichment plantations and the construction of soil and water conservation structures. The rehabilitation and development of degraded hillsides offer additional potential for the development of apiculture in many parts of the country. Hence, IPMS identified apiculture development as an important market-oriented enterprise to pilot test interventions and draw lessons for widespread scaling out and up. Interventions include promoting the adoption of box hives; input supply of wax and other accessories by helping establish input supply shops; capacity building of modern hive management, beef forage development; improved management; and market information supply and facilitating market linkages. Survey results on the impact of apiculture development on women showed that 78% of the surveyed women reported that their workload increased, 48% reported that they were responsible for selling the product, but only 35% reported that they control the income.
Our indicators of market-oriented apiculture development using modern hives showed that there has been significant development in apiculture production across the PLWs (Figure 22).
Figure 22. Development in apiculture using modern hives in IPMS PLWs
0
50000
100000
150000
200000
250000
300000
350000
400000
0
1000
2000
3000
4000
5000
6000
7000
8000
9000
2005/06 2006/07 2007/08 2008/09 2009/10
Total honey produced (kg/year)
No. of male headed households No. of female headed householdsNo. of total households No. of modern hives occupied with beesTotal honey produced
The number of households involved in apiculture production using modern hives and associated management grew by 191% (from 1745 to 5074). The number of female-headed households involved grew even faster by 218% (from 271 to 861), perhaps because modern hives are more friendly technology in terms of placement and hive management. Hence, the proportion of female-headed households involved showed slight increase from 16% to 18%.
44
The number of modern hives occupied with bees grew by 190% (from 2644 to 7676), and total honey produced from improved hives grew by 121%. Average honey yield during the first harvest season (after the main rainy season) was registered to be 27 kg/hive, while the yield during the second harvest season (after the short rains) was half as much (13 kg/hive).
On average, about 34 kg/household per year was sold. Honey prices increased steadily during the period. We computed revenue from the sale of honey in 2005/06 using 2009/10 prices. Total revenue showed a growth rate in real terms of 127% (from 4.94 million to 11.19 million). More than 90% of honey produced using modern hives is sold by more than 85% of producing households.
It must be noted that IPMS interventions were not limited only to promoting modern hives and honey production. Interventions were also made in promoting transitional (top bar hives) and the multiplication of bee colonies through colony splitting and queen rearing for sale. Hence, the impact of IPMS and partner interventions in apiculture is likely to be higher if these effects are also included. For example, more than half a million was obtained as cash income from the sale of bee colonies produced from modern or traditional hives in Atsbi in 2009/10.
Comparisons across PLWs showed variations in the development of modern apiculture. For example, in Atsbi, the proportion of female-headed households involved in improved honey production increased steadily from 19% to 27%. In Fogera, involvement of female-headed households in modern honey production in was very low (about 1%), and below 4% in Alaba and Bure. Average honey sold per household was high in Atsbi at 60 kg/year. Honey yield during the 1st harvest season was also high in Atsbi at 35 kg/hive. In some of the PLWs, honey yield during the second harvest seasons drop sharply to about 3 kg/hive. The growth rate in the number of households producing and the total number of beehives occupied with bee colonies was the highest in Bure, both increasing by about twentyfold.
45
4 Changes in attitude and behaviour about HIV/AIDS
IPMS and its partners also worked on awareness creation about the HIV virus and the AIDS disease and attempted to promote its prevention methods. The prevention methods promoted were voluntary testing, protection from unsafe sex, protection from non-sexual transmission methods, pre-marital HIV testing, and providing support to infected individuals. IPMS ‘impact type’ survey collected information on changes in household behaviour regarding the prevention methods on a five-scale (significantly improved, moderately improved, did not change, deteriorated moderately, deteriorated significantly) measurement.
Across all PLWs, the change in attitude with regard to voluntary testing was rated either significantly improved or moderately improved more than 95% of the time. The change in attitude with regard to protection from unsafe sex was also rated significantly or moderately improved more than 90% of the time in nine of the ten PLWs. In Alaba PLW, significantly or moderate improvement was rated only 72% of the time. It is interesting to see that, in general, improvement in attitude towards protection from unsafe sex was rated lower than the change in attitude towards voluntary testing.
Farmer view that attitude towards protection from non-sexual methods of protection has improved either significantly or moderately more than 90% of the time across all PLWs. With regard to pre-marital HIV testing, farmers in 7 of the PLWs rated the improvement in attitude to be significant or moderately significant more than 90% of the time. Significant or moderate improvement in attitude was also reported 80% of the time in Dale. However, farmers in Mieso and Alaba reported that there was no change in behaviour 69% of the time. Farmer ratings regarding improvements in behaviour in providing support to HIV-infected was reported as moderate improvement more than 74% of the time in only five of the PLWs. Farmers in Dale viewed moderate improvement about 66% of the time. Four of the PLWs (Bure, Mieso, Gomma and Alaba) reported that there had not been improvement in behaviour in providing support to infected people more than 63% of the time.
46
5 Extent to which the IPMS approach improved the capabilities of groups, cooperatives and unions
The IPMS ‘impact type’ survey also asked farmer groups, cooperatives or unions about the extent to which IPMS approach (participatory market-oriented value chain approach to agricultural development) and its interventions in the PLWS have improved their capability in input and output marketing, financial management, productivity and product diversification. Responses were sought on a five-point scale (improved significantly, moderately, no effect, deteriorated moderately or significantly).
The Ada’a cooperative union responded that the interventions had strengthened the union significantly or moderately more than 70% of the time. Vegetable marketing groups in Atsbi, Alamata, and fruit marketing groups in Dale also reported that the approach strengthened them significantly or moderately about 70% of the time. On the other hand coffee cooperatives in Gomma responded that the approach strengthened them moderately or significantly only about 40% of the time. Interestingly, the effect of interventions in Metema vegetable and fruit marketing groups, a PLW where IPMS and its partners succeeded in introducing fruit and vegetable systems that was unknown before, was reportedly mixed. While significant improvements were reportedly realized in output marketing, product diversification, and productivity, no improvements were realized in input supply and financial management.
The result regarding dairy groups or cooperatives is also mixed. While significant or moderate improvements were reported in Alamata about 70% of the time and in Dale about 75% of the time, no improvements were reported in Atsbi, Ada’a, and Mieso PLWs about 75% of the time. Mixed results were also reported from honey groups or cooperatives, where improvements were realized in Atsbi more than 80% of the time, no improvements were reported in the PLW of Ada’a and Gomma about 70% of the time. Fattening (small and large
47
ruminants) groups and cooperatives reported improvements across Bure, Alamata, and Ada’a PLWs. Metema fattening groups saw improvements in output marketing and productivity, but remain seriously concerned about input supply. On the other hand, Mieso groups reported no improvement except in input supply function.
48
6 Extent of institutionalization of the IPMS approach within the PLWs
The ‘impact type’ survey collected information on the extent to which the IPMS approach (participatory value chain development, bottom–up extension, and mainstreaming HIV/AIDS and gender in agricultural development) on a three-point scale (high, moderate, nil). District level partners were asked to respond to these questions. Results show that the IPMS approaches have been institutionalized either highly or moderately. The one exception is the Mieso PLW, which reported that the participatory value chain development approached has not been institutionalized due to various reasons including security problems and frequent staff turnover.
49
7 Extent to which the IPMS approach has spread to neighbouring woredas
District level partners of IPMS were also asked to evaluate the extent to which the IPMS approach has spread to neighbouring districts. While the participatory value chain development approach was reported to have spread to neighbouring woredas in 8 of the PLWs, 2 of the PLWS (Mieso and Alaba) reported no spread. The spread of bottom–up approach to extension was lower, where only five of the PLWS (Atsbi, Alamata, Ada’a, Gomma and Alaba) reported spread to neighbouring woredas. Similarly, the spread of mainstreaming HIV/AIDS and gender in agricultural development was low, where only five PLWs (Alamata, Ada’a, Alaba, Gomma, and Dale) reported spread.
50
8 Conclusions and implications
As a project aimed at piloting market-oriented transformation of subsistence smallholder agriculture, the IPMS project and its partners have tested several innovative approaches to technology transfer, agricultural knowledge management, input supply and services, market linkages, and synthesis and promotion of experiences and lessons. Following the participatory value chain development framework and the innovation systems perspective, significant market-oriented developmental changes have been registered. Promotion of improved technologies accompanied by appropriate institutional innovations in input supply, capacity building, services and marketing have increased market orientation and market participation of farmers resulting in significant increase in revenue from the sale of agricultural produce.
The value chains framework implies that, centring on the development of a market-oriented commodity, critical constraints need to be identified from the core value chain stages or processes. While improved technology is critical to improve productivity and thus surplus production, the value chain framework stipulates that technology may not be sufficient for successful transformation of subsistence agriculture into market orientation. Input supply, services and markets also deserve adequate attention. The IPMS and partners experience has shown many cases where available modern technologies were not adopted because of problems in input supply and services, and markets.
The innovation systems perspective implies that many actors may have important contributions to make in commodity development. Sound understanding of the roles, actions and interactions of actors in order to better utilize the synergies of actors’ roles towards market-oriented development is required. The IPMS and partners experience has demonstrated the usefulness of partner linkages and commodity platforms where value chain actors meet to deliberate on constraints and opportunities to develop commodities.
Development is a continuous process and should be accompanied by continuous learning and innovation. The IPMS project had an embedded results-based monitoring and evaluation (RBM&E) system which helped monitor and evaluate progress to feed back to project
51
implementation for better performance. The experience shows that critical constraints can and do change in the development process. For example, while input supply may be a critical challenge in increasing production (as was seen in onion production in Fogera and Alamata PLWs), market linkages and price collapse can be major challenges after successful increase in production. This can be true particularly for horticultural and dairy products, which are perishable and need costly storage or processing.
Market-oriented production of cereals and pulses and fattening of small and large ruminants can be adopted by a large number of farmers. On the other hand, development of knowledge/skills per input intensive market-oriented commodities such as irrigated fruits and vegetables, apiculture and milk for urban centres will be limited to the more entrepreneurial type of producers. Hence, strategies for commercialization transformation of smallholders need to corporate alternative livelihood strategies for farm families who may not be successfully entrepreneurial in agricultural production.
The IPMS experience has also shown that sustainable transformation of subsistence agriculture requires the institutionalization of innovative approaches to technology transfer, input supply and services, and markets. Such institutionalization primarily requires awareness creation and capacity building of agricultural staff at various levels. Agricultural staff need to have access to knowledge on continuous basis electronically, in printed form or through other media. Appropriate incentives for innovation and out-of-the-box thinking are also required.
The overall message of the experiences of IPMS and its partners is that smallholder based market-oriented agricultural development can be successfully achieved if participatory value chain development approach supported by innovation systems perspective is used.

www.ipms-ethiopia.orgwww.eap.gov.et Working Paper No. 30
Canadian InternationalDevelopment Agency
Agence canadienne dedéveloppement international
Summary report of market-oriented developmental changes in the IPMS Pilot Learning Woredas
Federal Democratic Republic of EthiopiaMinistry of Agriculture