Embed Size (px)
Citation preview
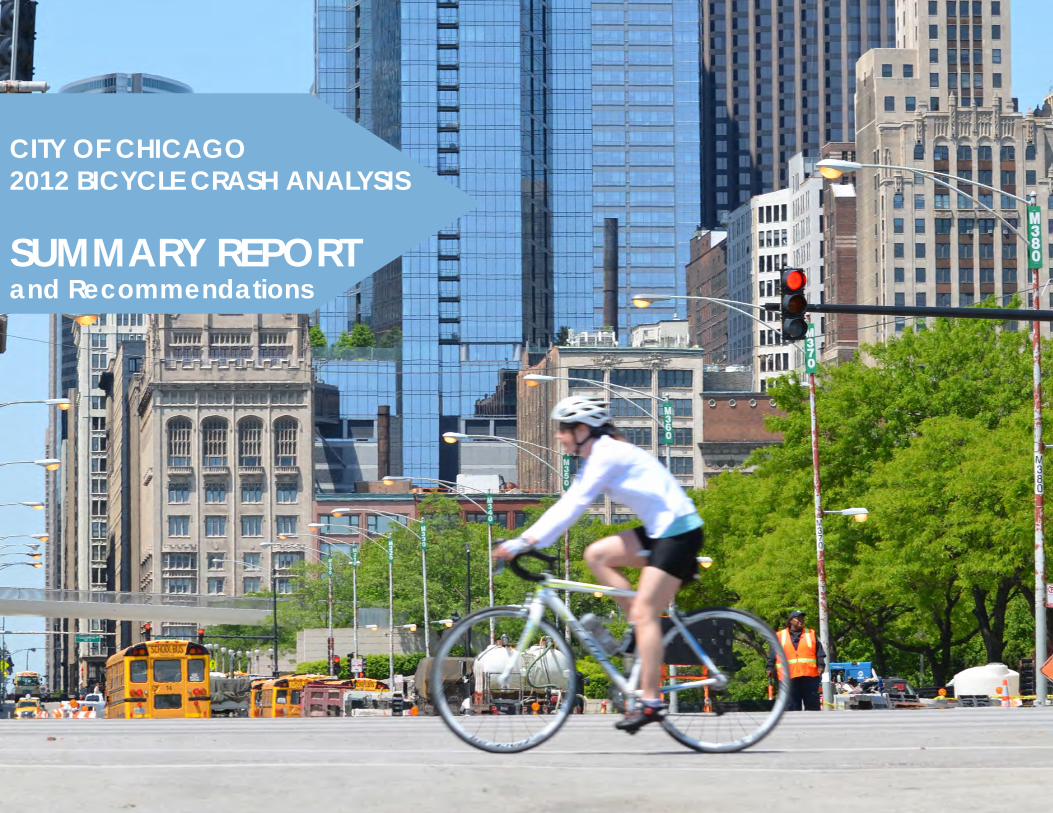
CITY OF CHICAGO2012 BICYCLE CRASH ANALYSIS
SUMMARY REPORTand Recommendations
Sum
mar
y Re
port
ii
Dear Fellow Chicagoans:
Making our streets safer for bicycling will benefit all Chicagoans even if they don’t currently ride a bike. Everyone
should feel safe on our City’s streets, from an eight-year-old learning to ride a bike for the first time to an eighty-
year-old who wants to ride to the store. To achieve this goal, it is essential for us to look at all of the factors that
contribute to the safety of bicyclists on our streets, and to take the opportunity to make our streets safer for
pedestrians and auto users at the same time.
The Chicago Bicycle Crash Analysis looks at all aspects of bicycle crashes in the city. With this report, we set out to
identify all of the factors that contribute to bicycle crashes in Chicago, and then set goals for improvement. The
period of study (2005-2010) gives us a clear picture of what we need to achieve the goals of Chicago’s Bike 2015
Plan and the Streets for Cycling Plan 2020.
The following report lays out benchmarks for various types of crash data and information. Locations, time of day,
gender and weather are just a few of the elements and factors we looked at to analyze crashes in Chicago. At the
end of the report, you will find a comprehensive set of recommendations for improvements to our bike network
and our reporting mechanisms that will work to improve bicycling for all Chicagoans and visitors alike.
Ride safe,
Gabe Klein, Commissioner
Chicago Department of Transportation
iii
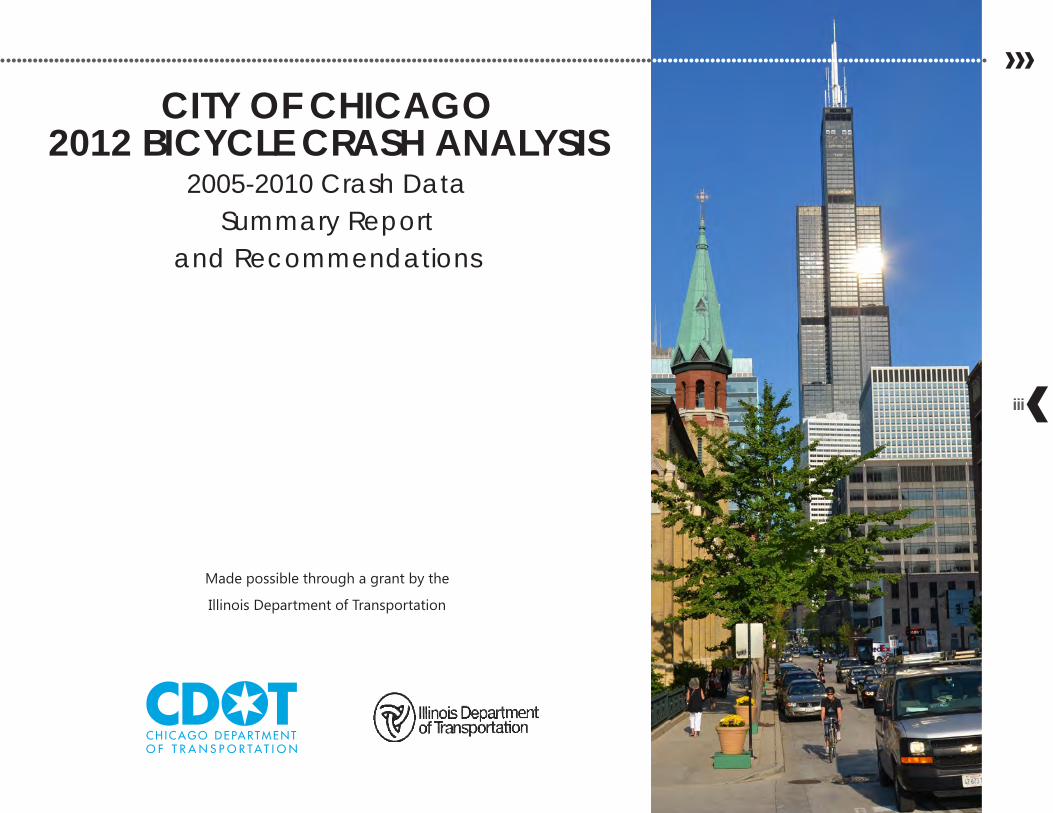
CITY OF CHICAGO2012 BICYCLE CRASH ANALYSIS
2005-2010 Crash DataSummary Report
and Recommendations
Made possible through a grant by the
Illinois Department of Transportation
Sum
mar
y Re
port
iv
Introduction 1Key findings 4Key recommendations 6Bicycle safety programs in Chicago 8Trends in bicycle crashes 10
Growth in cycling 12Fatal and injury crashes 13Comparison of bicycle and pedestrian crashes 14Comparison with peer cities 16
Cyclist and motorist characteristics 18Gender of cyclists 20Age of cyclists 21Gender and age of drivers 22
Vehicles and operators 24Driver action 26Bicyclist action 27Vehicle type and use 28Dooring 29Helmet Use 30Hit and run 31Alcohol 32
When did bicycle crashes occur 34Crashes by month 36Crashes by day of week 37Crashes by time of day 38
Crash location and conditions 40Location of bicycle crashes 42Hot spots 44Intersections 45Non-Intersection related crashes 46Dooring on arterial streets 48Weather, light and road surface conditions 49
Crash reduction strategies 50Data and reporting solutions 52Roadway design solutions 54Education and public awareness solutions 56Enforcement solutions 58Policy solutions 59Countermeasures matrix 60
Acknowledgments 61References 62
1
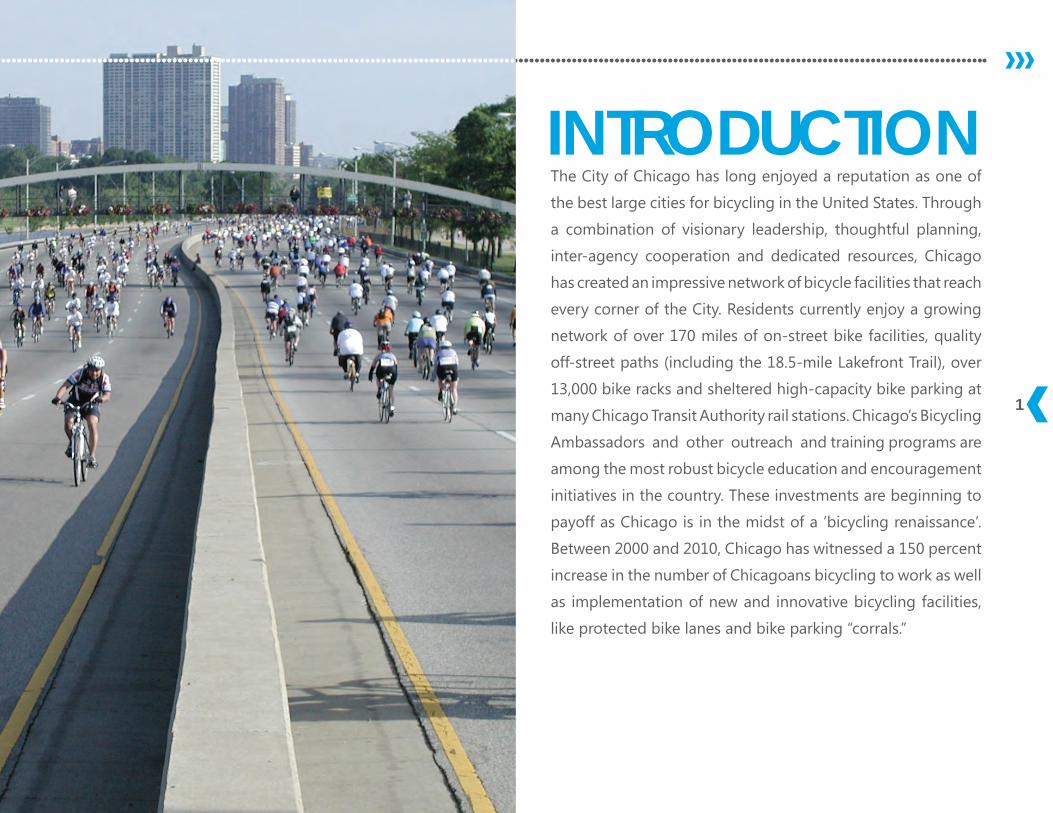
The City of Chicago has long enjoyed a reputation as one of
the best large cities for bicycling in the United States. Through
a combination of visionary leadership, thoughtful planning,
inter-agency cooperation and dedicated resources, Chicago
has created an impressive network of bicycle facilities that reach
every corner of the City. Residents currently enjoy a growing
network of over 170 miles of on-street bike facilities, quality
off-street paths (including the 18.5-mile Lakefront Trail), over
13,000 bike racks and sheltered high-capacity bike parking at
many Chicago Transit Authority rail stations. Chicago’s Bicycling
Ambassadors and other outreach and training programs are
among the most robust bicycle education and encouragement
initiatives in the country. These investments are beginning to
payoff as Chicago is in the midst of a ‘bicycling renaissance’.
Between 2000 and 2010, Chicago has witnessed a 150 percent
increase in the number of Chicagoans bicycling to work as well
as implementation of new and innovative bicycling facilities,
like protected bike lanes and bike parking “corrals.”
INTRODUCTION
Sum
mar
y Re
port
2
One key feature of a truly world-class bicycling city is the safety of its bicyclists. Bicycle crashes in Chicago remain a serious
concern. In the six-year period between 2005 and 2010, there were nearly 9,000 injury crashes involving bicyclists, with 32 bicyclist
fatalities. As a percentage of all traffic crashes, bicycle crashes are on the rise: from 6.7 percent of all crash types in 2005 to 9.8
percent of all crash types in 2010. Perhaps the most important point to be made is that with proper street design and behavior
change amongst road users, the overwhelming majority of bicycle crashes are preventable.
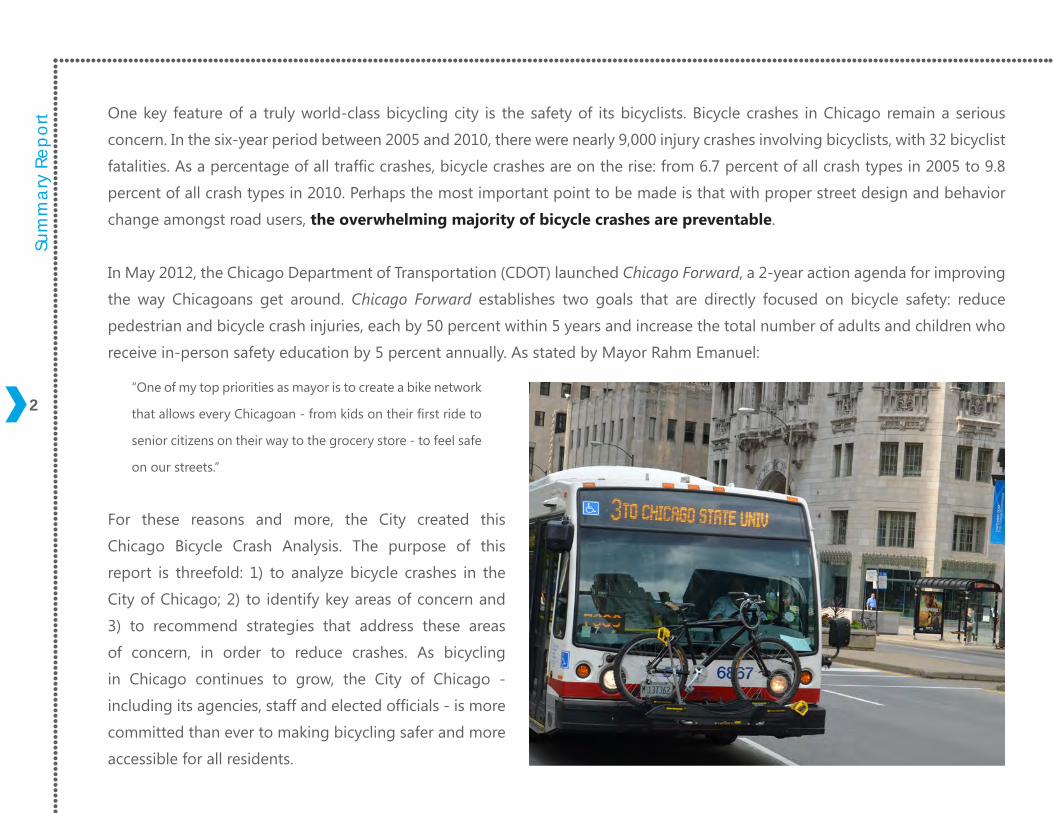
In May 2012, the Chicago Department of Transportation (CDOT) launched Chicago Forward, a 2-year action agenda for improving
the way Chicagoans get around. Chicago Forward establishes two goals that are directly focused on bicycle safety: reduce
pedestrian and bicycle crash injuries, each by 50 percent within 5 years and increase the total number of adults and children who
receive in-person safety education by 5 percent annually. As stated by Mayor Rahm Emanuel:
“One of my top priorities as mayor is to create a bike network
that allows every Chicagoan - from kids on their first ride to
senior citizens on their way to the grocery store - to feel safe
on our streets.”
For these reasons and more, the City created this
Chicago Bicycle Crash Analysis. The purpose of this
report is threefold: 1) to analyze bicycle crashes in the
City of Chicago; 2) to identify key areas of concern and
3) to recommend strategies that address these areas
of concern, in order to reduce crashes. As bicycling
in Chicago continues to grow, the City of Chicago -
including its agencies, staff and elected officials - is more
committed than ever to making bicycling safer and more
accessible for all residents.
3
To complete this report, multiple sources of information were utilized. The data used were of two different types: 1) safety data on
crashes, injuries and trauma from several sources including the Illinois Department of Transportation (Motor Vehicle Crash File 2005
to 2010 and Dooring Data 2010 to 2011), National Highway Traffic Safety Administration (Fatality Analysis Reporting System), local
police reports and the American College of Surgeons (National Trauma Data Bank); and 2) travel trend data to identify patterns in
bicycle use from the U.S. Census Bureau (American Community Survey 2005 to 2010 and the Decennial Census 2010) and the Chicago
Metropolitan Agency for Planning (Travel Tracker Survey 2007).
The research was conducted using summary statistics and graphical methods towards a systematic assessment of the “who”, “what”
and “how” of safety risks to bicyclists with the overall goal of supporting safety initiatives and long-term bicycle planning activities.
Detailed statistical analysis is left for future research.
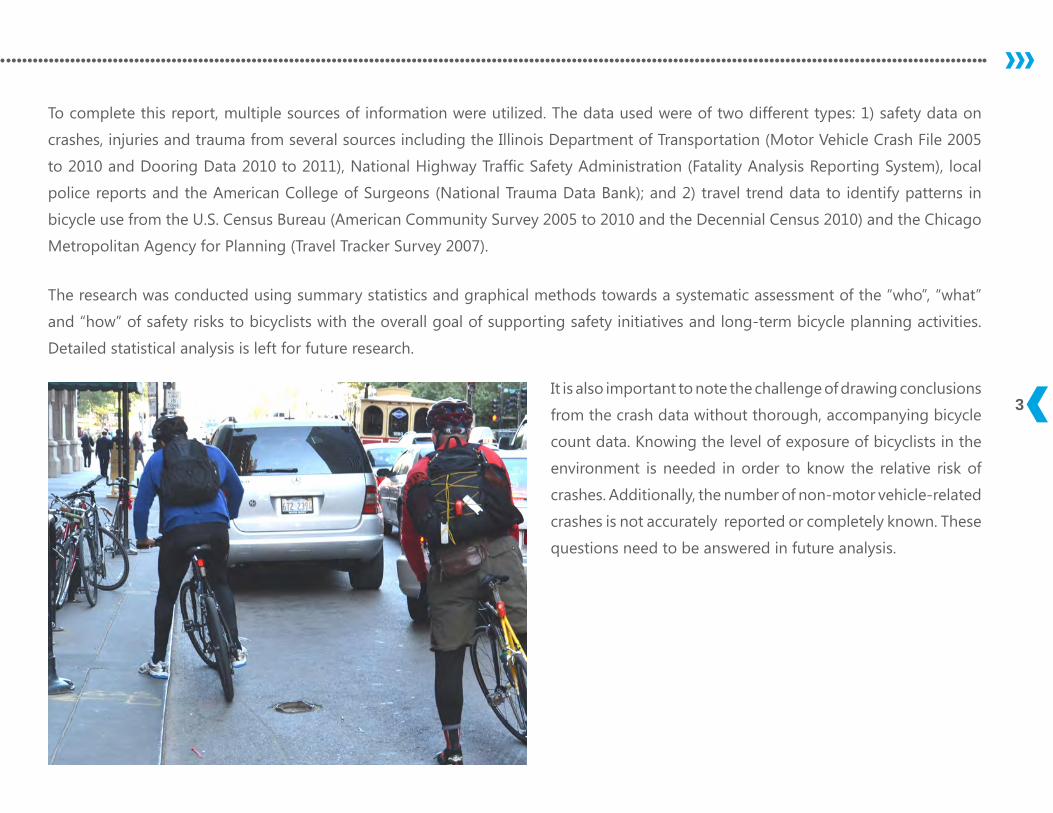
It is also important to note the challenge of drawing conclusions
from the crash data without thorough, accompanying bicycle
count data. Knowing the level of exposure of bicyclists in the
environment is needed in order to know the relative risk of
crashes. Additionally, the number of non-motor vehicle-related
crashes is not accurately reported or completely known. These
questions need to be answered in future analysis.
Sum
mar
y Re
port
4
EXTENT OF BICYCLING AND HOW HAS IT CHANGED• Since 2000, the number of bicycle commuters has increased by 150 percent.
• Nationally 0.6 percent of workers commuted to work by bicycle in 2010. In Chicago, that number was 1.3 percent, or 15,000 cyclists daily. • Among peer cities, Chicago has more bicycle commuters per capita than New York or Los Angeles, but fewer than Philadelphia
or Seattle.
KEY FINDINGS
BICYCLE CRASH SAFETY TRENDS, 2005-2010• From 2005 to 2010 some 32 cyclists in the City of Chicago were killed in crashes with motor vehicles.
• The number of fatal crashes decreased by 28 percent from seven in 2005 to five in 2010.
• Almost 9,000 bicyclist injury crashes occurred during the six-year period, or an average of 1,500 per year.
• The number of injury crashes increased 27 percent from 1,236 in 2005 to 1,566 in 2010.
WHERE DID CRASHES OCCUR• Approximately 55 percent of fatal and injury crashes occurred at intersections.
• Six of Chicago’s 77 Community Areas, those just north and northwest of the Loop, accounted for more than one-third of the
bicycle miles traveled and one-third of the bicycle injury crashes.
5CHARACTERISTICS OF CYCLISTS: GENDER AND AGE• Overall, males were three times more likely to be involved in a bicycle crash than females.
• The ratio of male to female crashes was lowest in the 20-24 age group and increased steadily with age.
• The ratio of male to female crashes was 12 times higher for males than females in the 75-84 age group.
WHEN DID CRASHES OCCUR• The largest number of injury crashes occurred between 4:00 and 7:00 P.M., but fatalities were highest between 8:00 P.M. and
midnight.
• There were five fatalities between 4:00 and 7:00 P.M., but nine fatalities between 8:00 P.M. and midnight.
• Approximately half of all crashes occurred during the summer months of June, July and August.
• Most bicycle crashes occurred during day light hours and in good weather.
• Sundays accounted for the highest percentage of fatalities, but the fewest percentage of bicycle injury crashes.
ADDITIONAL FINDINGS• The most common motorist error was failure to yield.
• The most common bicyclist error was riding against traffic.
• A helmet was known to be worn in only one fatal crash.
• Taxis were involved in 1 of 12 injury crashes.
COMPARING BICYCLE CRASHES WITH PEDESTRIAN CRASHES• While the number of motor vehicle crashes with pedestrians declined, crashes involving bicycles increased.
• Hit and run crashes accounted for 25 percent of both injury and fatal bicycle crashes, while they accounted for 41 percent of
pedestrian injury crashes and 33 percent of pedestrian fatal crashes.
Sum
mar
y Re
port
6
EDUCATION AND MARKETING SOLUTIONS• Enhance motorist and bicyclist direct education programs.
• Expand targeted enforcement outreach.
• Create broad-reaching marketing campaigns targeting high risk behaviors and road users.
• Expand commercial vehicle operator training.
• Institute enhanced driver education.
KEY RECOMMENDATIONSROADWAY DESIGN SOLUTIONS• Implement intersection design improvements at high crash locations.
• Expand the network of protected bike lanes.
• Institute traffic calming techniques to slow speeds at severe crash locations.
DATA AND REPORTING SOLUTIONS• Collect comprehensive, multi-year bicycle counts.
• Develop mechanisms for collecting non-motor vehicle related crash data.
• Regularly update and publish bicycle crash data and implement data collection improvement strategies.
• Develop and implement outcomes evaluation for non-infrastructure initiatives .
7
ENFORCEMENT SOLUTIONS• Improve police data and reporting for fatal and serious injury crashes.
• Increase the number of targeted enforcement events.
POLICY SOLUTIONS • Improve inter-agency partnerships and collaboration.
• Fully implement the Child Safety Zone initiative near schools and parks.
Sum
mar
y Re
port
8
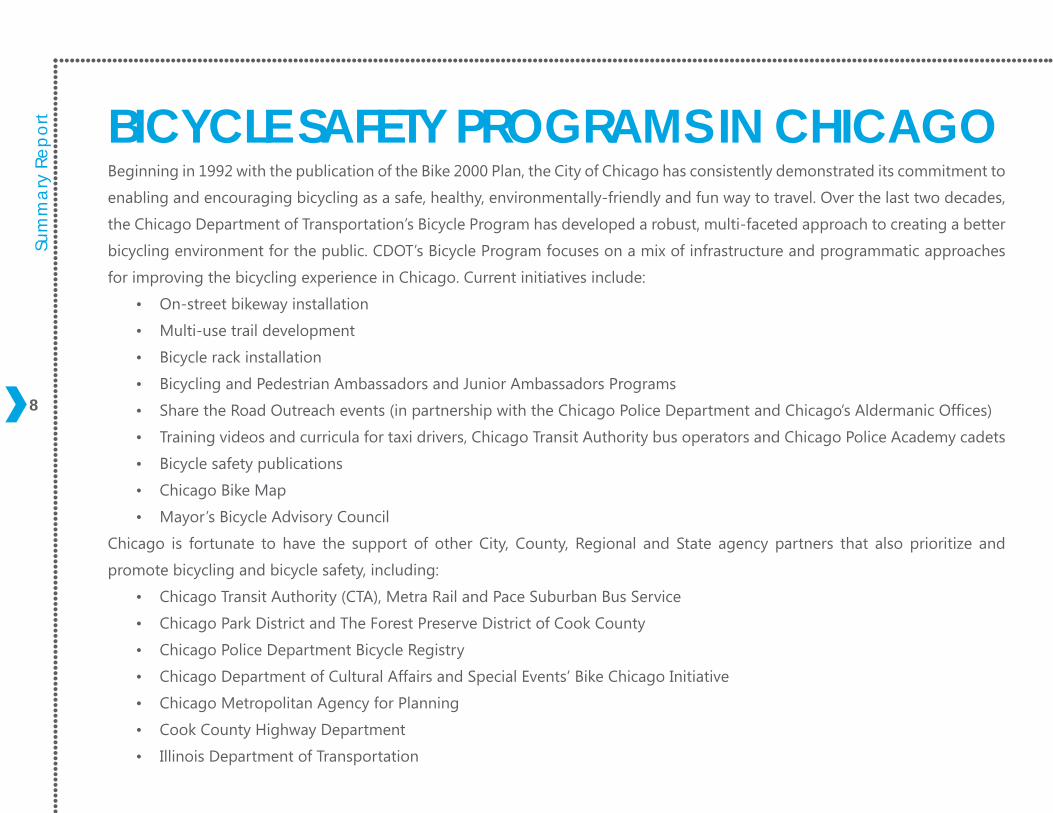
Beginning in 1992 with the publication of the Bike 2000 Plan, the City of Chicago has consistently demonstrated its commitment to
enabling and encouraging bicycling as a safe, healthy, environmentally-friendly and fun way to travel. Over the last two decades,
the Chicago Department of Transportation’s Bicycle Program has developed a robust, multi-faceted approach to creating a better
bicycling environment for the public. CDOT’s Bicycle Program focuses on a mix of infrastructure and programmatic approaches
for improving the bicycling experience in Chicago. Current initiatives include:
• On-street bikeway installation
• Multi-use trail development
• Bicycle rack installation
• Bicycling and Pedestrian Ambassadors and Junior Ambassadors Programs
• Share the Road Outreach events (in partnership with the Chicago Police Department and Chicago’s Aldermanic Offices)
• Training videos and curricula for taxi drivers, Chicago Transit Authority bus operators and Chicago Police Academy cadets
• Bicycle safety publications
• Chicago Bike Map
• Mayor’s Bicycle Advisory Council
Chicago is fortunate to have the support of other City, County, Regional and State agency partners that also prioritize and
promote bicycling and bicycle safety, including:
• Chicago Transit Authority (CTA), Metra Rail and Pace Suburban Bus Service
• Chicago Park District and The Forest Preserve District of Cook County
• Chicago Police Department Bicycle Registry
• Chicago Department of Cultural Affairs and Special Events’ Bike Chicago Initiative
• Chicago Metropolitan Agency for Planning
• Cook County Highway Department
• Illinois Department of Transportation
BICYCLE SAFETY PROGRAMS IN CHICAGO
9
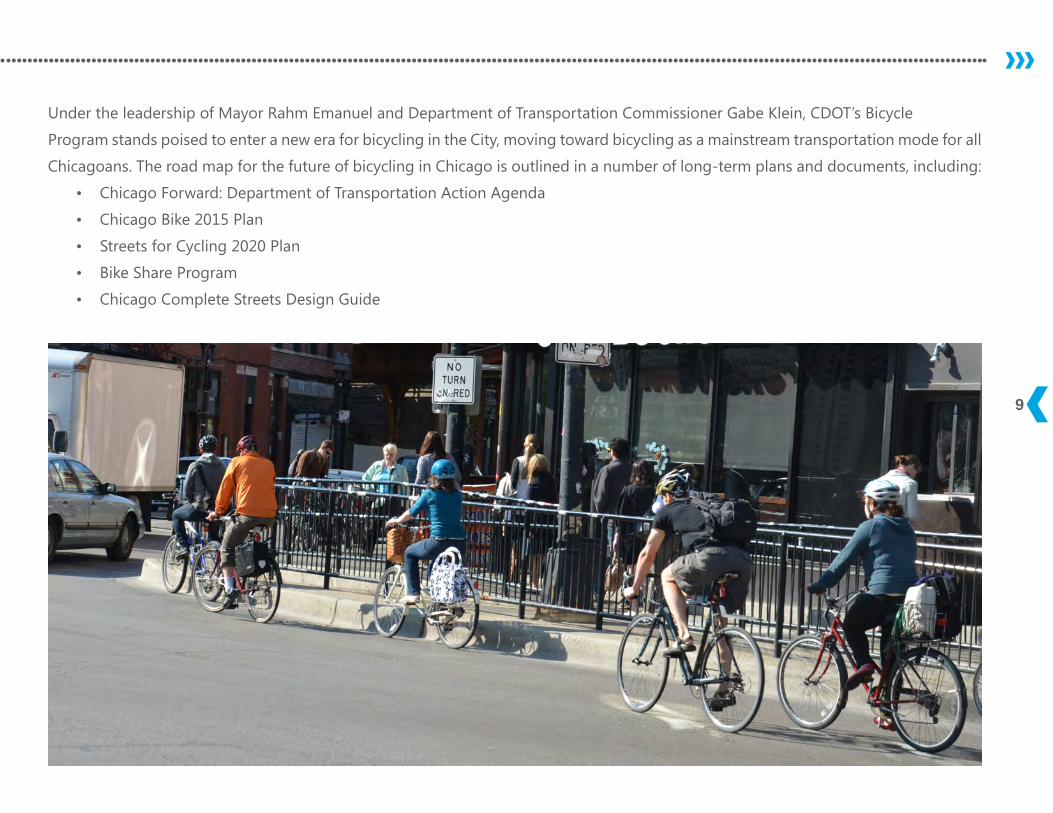
Under the leadership of Mayor Rahm Emanuel and Department of Transportation Commissioner Gabe Klein, CDOT’s Bicycle
Program stands poised to enter a new era for bicycling in the City, moving toward bicycling as a mainstream transportation mode for all
Chicagoans. The road map for the future of bicycling in Chicago is outlined in a number of long-term plans and documents, including:
• Chicago Forward: Department of Transportation Action Agenda
• Chicago Bike 2015 Plan
• Streets for Cycling 2020 Plan
• Bike Share Program
• Chicago Complete Streets Design Guide
Trends in Bicycle Crashes
Growth in cycling 12Fatal and injury crashes 13Comparison of bicycle and pedestrian crashes 14Comparison with peer cities 16C
Trends in bicycle crashes and ratesSu
mm
ary
Repo
rt
12
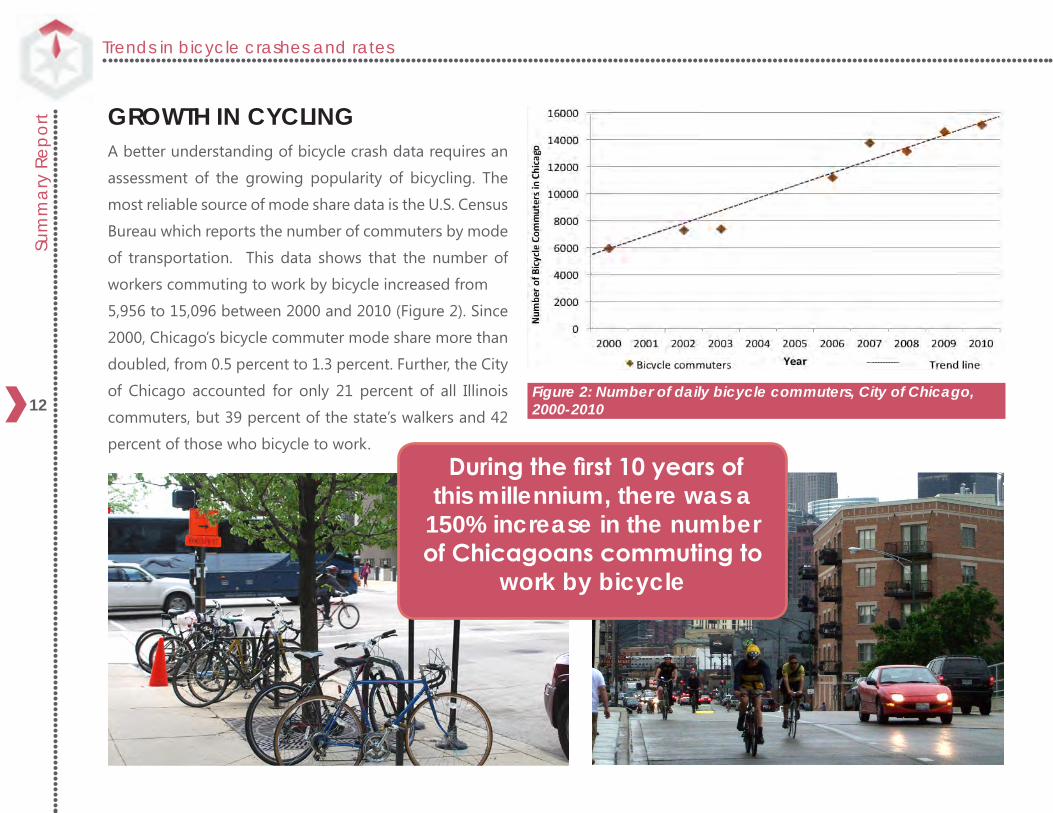
GROWTH IN CYCLINGA better understanding of bicycle crash data requires an
assessment of the growing popularity of bicycling. The
most reliable source of mode share data is the U.S. Census
Bureau which reports the number of commuters by mode
of transportation. This data shows that the number of
workers commuting to work by bicycle increased from
5,956 to 15,096 between 2000 and 2010 (Figure 2). Since
2000, Chicago’s bicycle commuter mode share more than
doubled, from 0.5 percent to 1.3 percent. Further, the City
of Chicago accounted for only 21 percent of all Illinois
commuters, but 39 percent of the state’s walkers and 42
percent of those who bicycle to work.
Figure 2: Number of daily bicycle commuters, City of Chicago, 2000-2010
During the first 10 years of this millennium, there was a
150% increase in the number of Chicagoans commuting to
work by bicycle
13
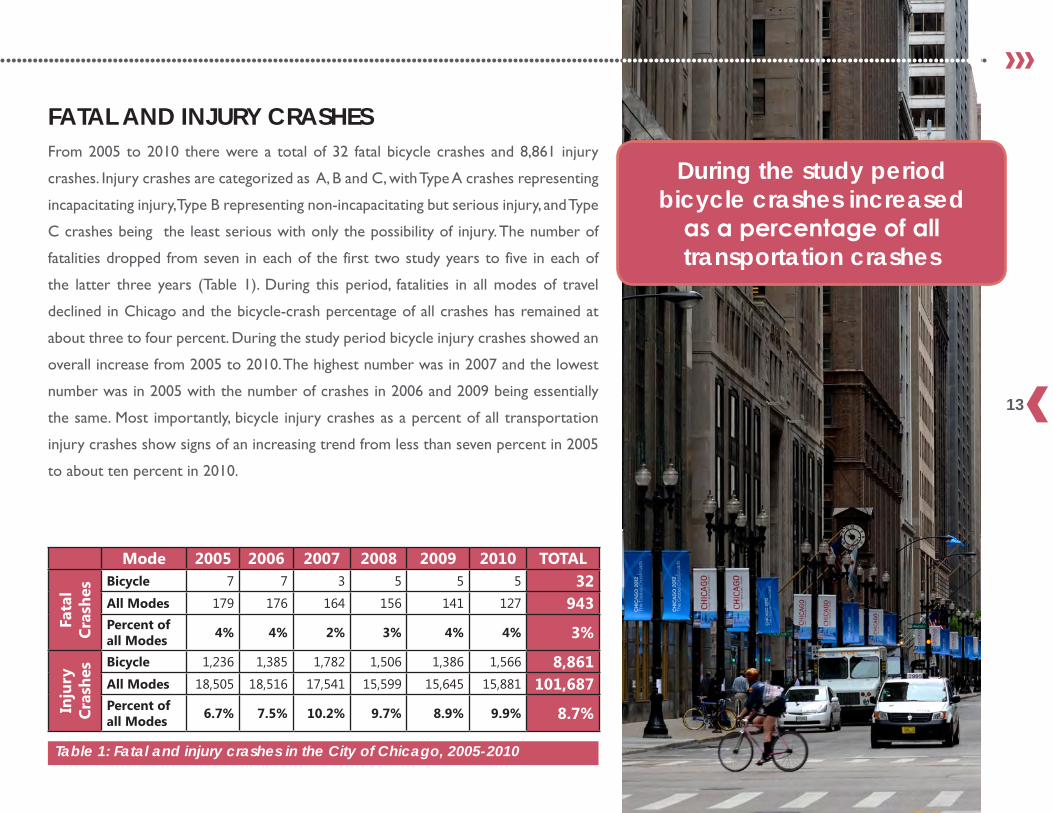
FATAL AND INJURY CRASHESFrom 2005 to 2010 there were a total of 32 fatal bicycle crashes and 8,861 injury
crashes. Injury crashes are categorized as A, B and C, with Type A crashes representing
incapacitating injury, Type B representing non-incapacitating but serious injury, and Type
C crashes being the least serious with only the possibility of injury. The number of
fatalities dropped from seven in each of the first two study years to five in each of
the latter three years (Table 1). During this period, fatalities in all modes of travel
declined in Chicago and the bicycle-crash percentage of all crashes has remained at
about three to four percent. During the study period bicycle injury crashes showed an
overall increase from 2005 to 2010. The highest number was in 2007 and the lowest
number was in 2005 with the number of crashes in 2006 and 2009 being essentially
the same. Most importantly, bicycle injury crashes as a percent of all transportation
injury crashes show signs of an increasing trend from less than seven percent in 2005
to about ten percent in 2010.
Mode 2005 2006 2007 2008 2009 2010 TOTAL
Fata
l Cr
ashe
s Bicycle 7 7 3 5 5 5 32All Modes 179 176 164 156 141 127 943Percent of all Modes 4% 4% 2% 3% 4% 4% 3%
Inju
ry
Cras
hes Bicycle 1,236 1,385 1,782 1,506 1,386 1,566 8,861
All Modes 18,505 18,516 17,541 15,599 15,645 15,881 101,687Percent of all Modes 6.7% 7.5% 10.2% 9.7% 8.9% 9.9% 8.7%
During the study period bicycle crashes increased
as a percentage of all transportation crashes
Table 1: Fatal and injury crashes in the City of Chicago, 2005-2010
Trends in bicycle crashes and ratesSu
mm
ary
Repo
rt
14
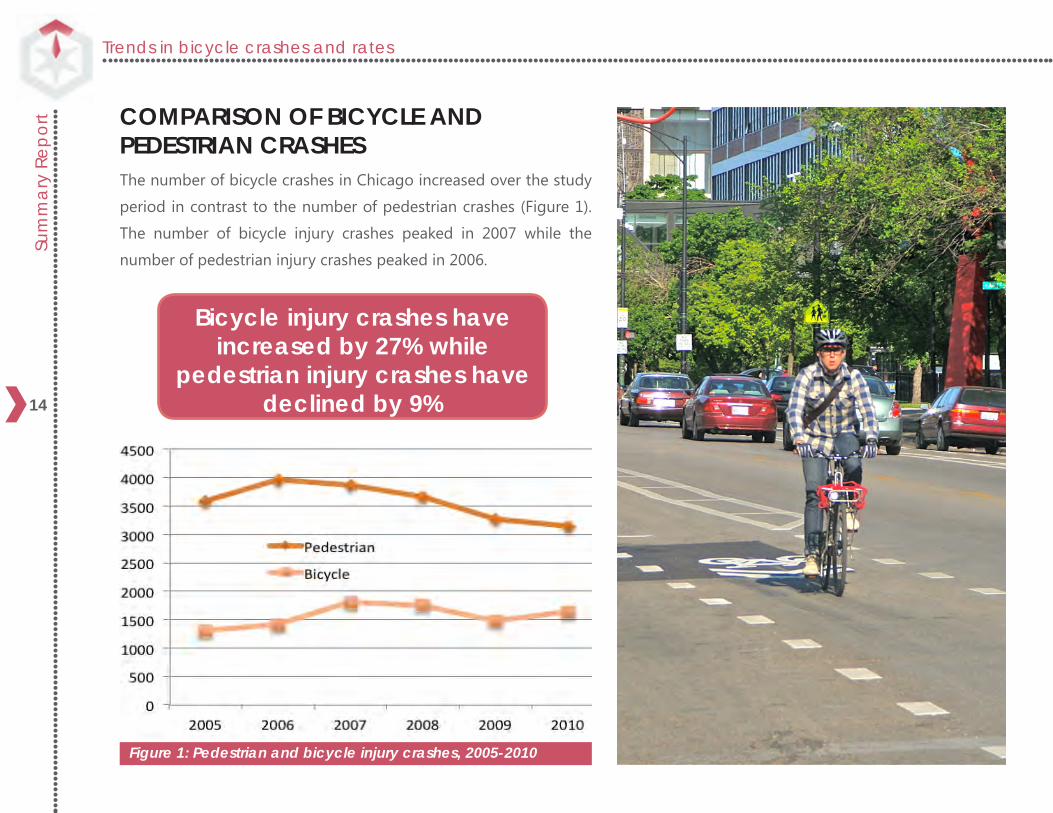
COMPARISON OF BICYCLE AND PEDESTRIAN CRASHESThe number of bicycle crashes in Chicago increased over the study
period in contrast to the number of pedestrian crashes (Figure 1).
The number of bicycle injury crashes peaked in 2007 while the
number of pedestrian injury crashes peaked in 2006.
Figure 1: Pedestrian and bicycle injury crashes, 2005-2010
Bicycle injury crashes have increased by 27% while
pedestrian injury crashes have declined by 9%
15
Trends in bicycle crashes and ratesSu
mm
ary
Repo
rt
16
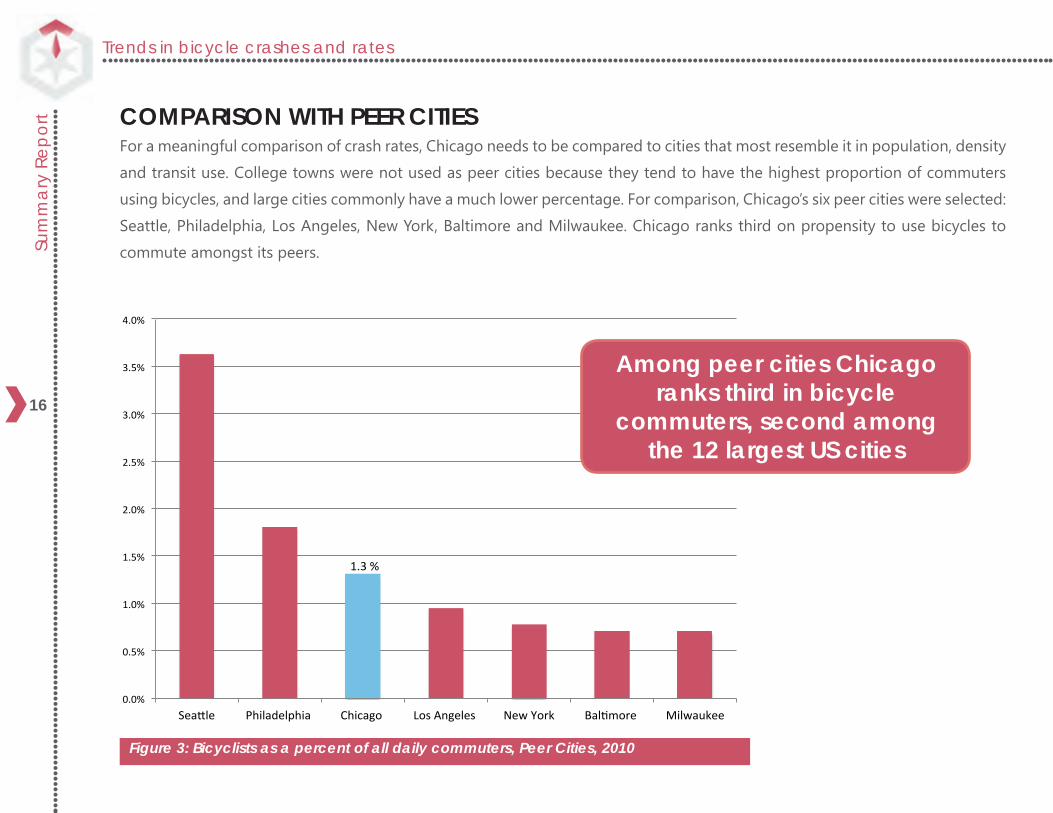
COMPARISON WITH PEER CITIESFor a meaningful comparison of crash rates, Chicago needs to be compared to cities that most resemble it in population, density
and transit use. College towns were not used as peer cities because they tend to have the highest proportion of commuters
using bicycles, and large cities commonly have a much lower percentage. For comparison, Chicago’s six peer cities were selected:
Seattle, Philadelphia, Los Angeles, New York, Baltimore and Milwaukee. Chicago ranks third on propensity to use bicycles to
commute amongst its peers.
Figure 3: Bicyclists as a percent of all daily commuters, Peer Cities, 2010
0.0%
0.5%
1.0%
1.5%
2.0%
2.5%
3.0%
3.5%
4.0%
Sea-le Philadelphia Chicago Los Angeles New York BalBmore Milwaukee
1.3 %
Among peer cities Chicago ranks third in bicycle
commuters, second among the 12 largest US cities
17
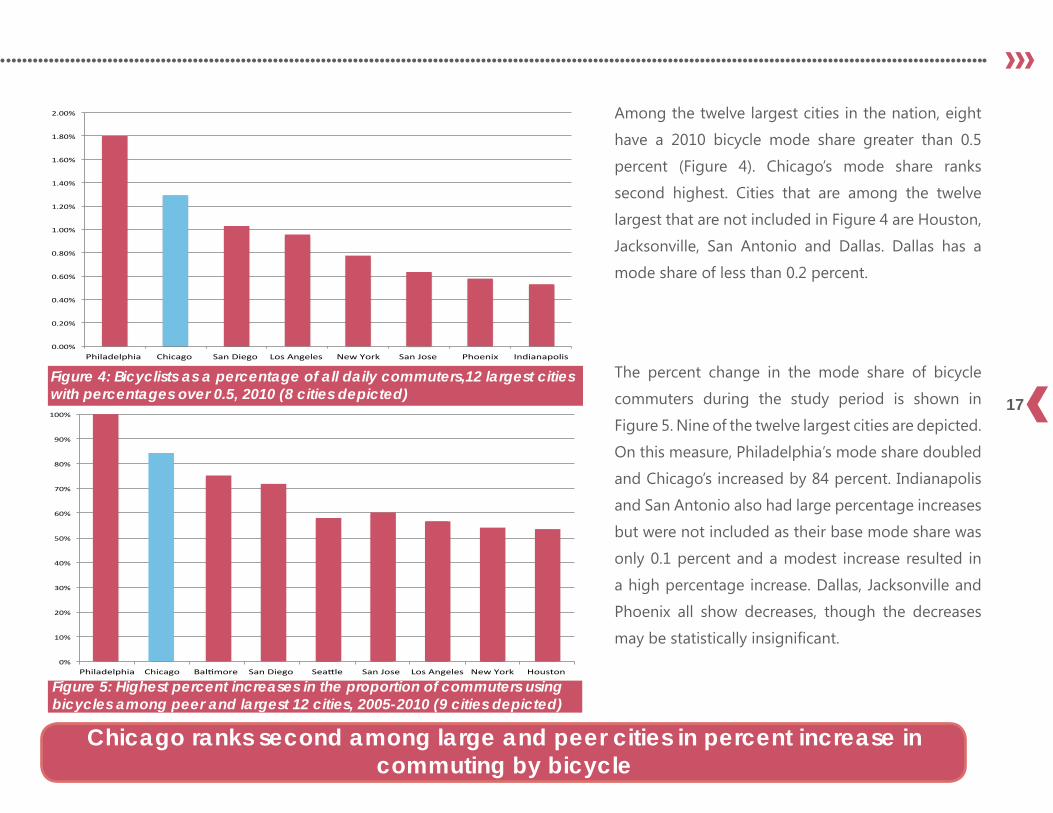
Among the twelve largest cities in the nation, eight
have a 2010 bicycle mode share greater than 0.5
percent (Figure 4). Chicago’s mode share ranks
second highest. Cities that are among the twelve
largest that are not included in Figure 4 are Houston,
Jacksonville, San Antonio and Dallas. Dallas has a
mode share of less than 0.2 percent.
The percent change in the mode share of bicycle
commuters during the study period is shown in
Figure 5. Nine of the twelve largest cities are depicted.
On this measure, Philadelphia’s mode share doubled
and Chicago’s increased by 84 percent. Indianapolis
and San Antonio also had large percentage increases
but were not included as their base mode share was
only 0.1 percent and a modest increase resulted in
a high percentage increase. Dallas, Jacksonville and
Phoenix all show decreases, though the decreases
may be statistically insignificant.
Chicago ranks second among large and peer cities in percent increase in commuting by bicycle
Figure 4: Bicyclists as a percentage of all daily commuters,12 largest cities with percentages over 0.5, 2010 (8 cities depicted)
0.00%
0.20%
0.40%
0.60%
0.80%
1.00%
1.20%
1.40%
1.60%
1.80%
2.00%
Philadelphia Chicago San Diego Los Angeles New York San Jose Phoenix Indianapolis
Figure 5: Highest percent increases in the proportion of commuters using bicycles among peer and largest 12 cities, 2005-2010 (9 cities depicted)
0%
10%
20%
30%
40%
50%
60%
70%
80%
90%
100%
Philadelphia Chicago Bal:more San Diego Sea@le San Jose Los Angeles New York Houston
Cyclist & Motorist Characteristics
Cyclist & Motorist Characteristics
Gender of cyclists 20Age of cyclists 21Gender and age of motorists 22
Cyclist characteristicsSu
mm
ary
Repo
rt
20
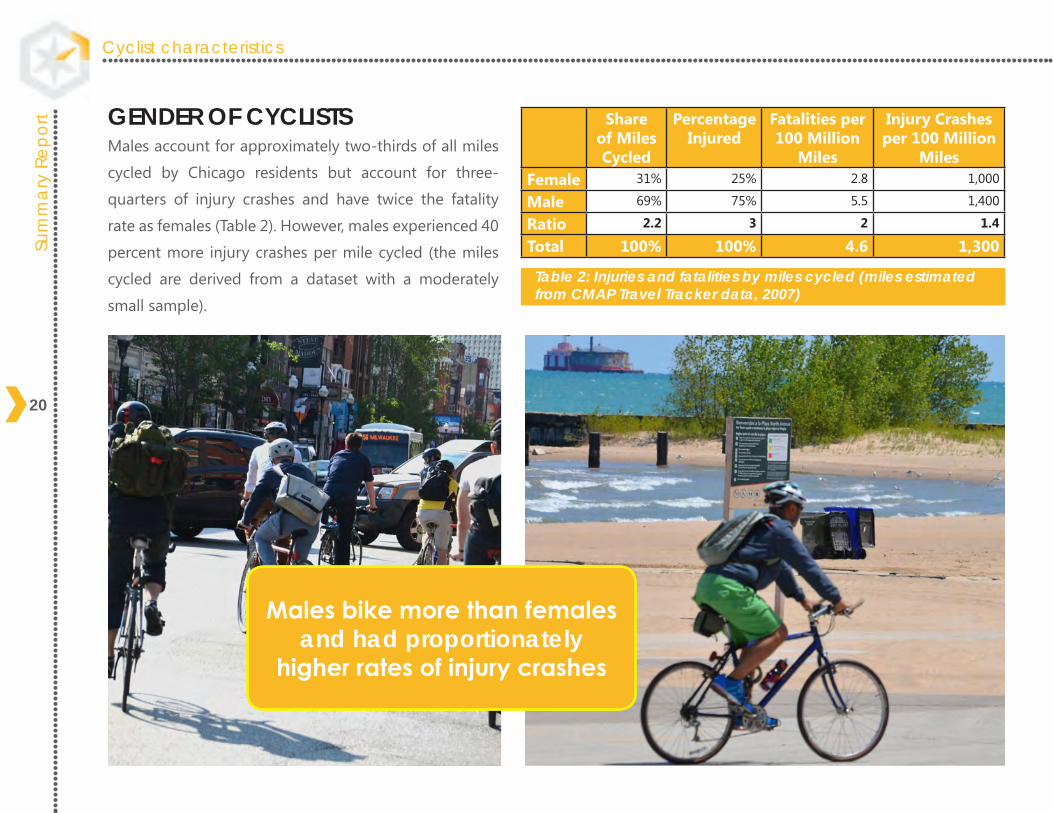
GENDER OF CYCLISTSMales account for approximately two-thirds of all miles
cycled by Chicago residents but account for three-
quarters of injury crashes and have twice the fatality
rate as females (Table 2). However, males experienced 40
percent more injury crashes per mile cycled (the miles
cycled are derived from a dataset with a moderately
small sample).
Males bike more than females and had proportionately
higher rates of injury crashes
Table 2: Injuries and fatalities by miles cycled (miles estimated from CMAP Travel Tracker data, 2007)
Share of Miles Cycled
Percentage Injured
Fatalities per 100 Million
Miles
Injury Crashes per 100 Million
MilesFemale 31% 25% 2.8 1,000
Male 69% 75% 5.5 1,400
Ratio 2.2 3 2 1.4
Total 100% 100% 4.6 1,300
21
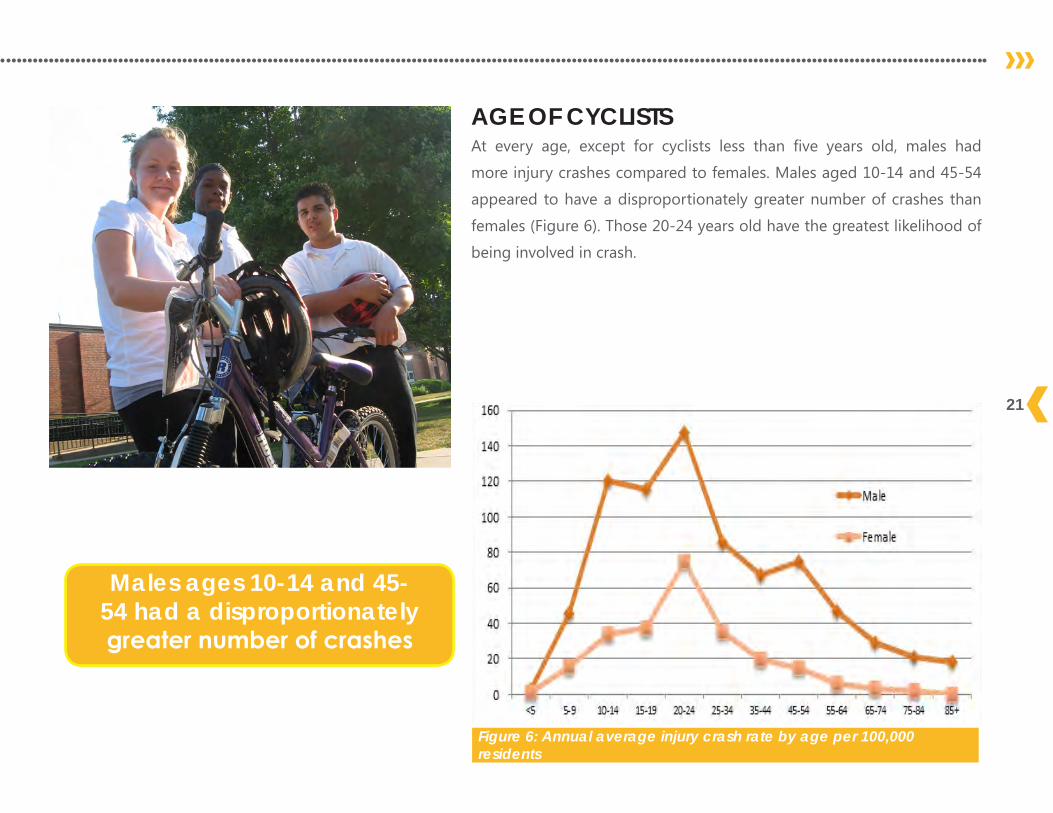
AGE OF CYCLISTSAt every age, except for cyclists less than five years old, males had
more injury crashes compared to females. Males aged 10-14 and 45-54
appeared to have a disproportionately greater number of crashes than
females (Figure 6). Those 20-24 years old have the greatest likelihood of
being involved in crash.
Figure 6: Annual average injury crash rate by age per 100,000 residents
Males ages 10-14 and 45-54 had a disproportionately greater number of crashes
Cyclist characteristicsSu
mm
ary
Repo
rt
22
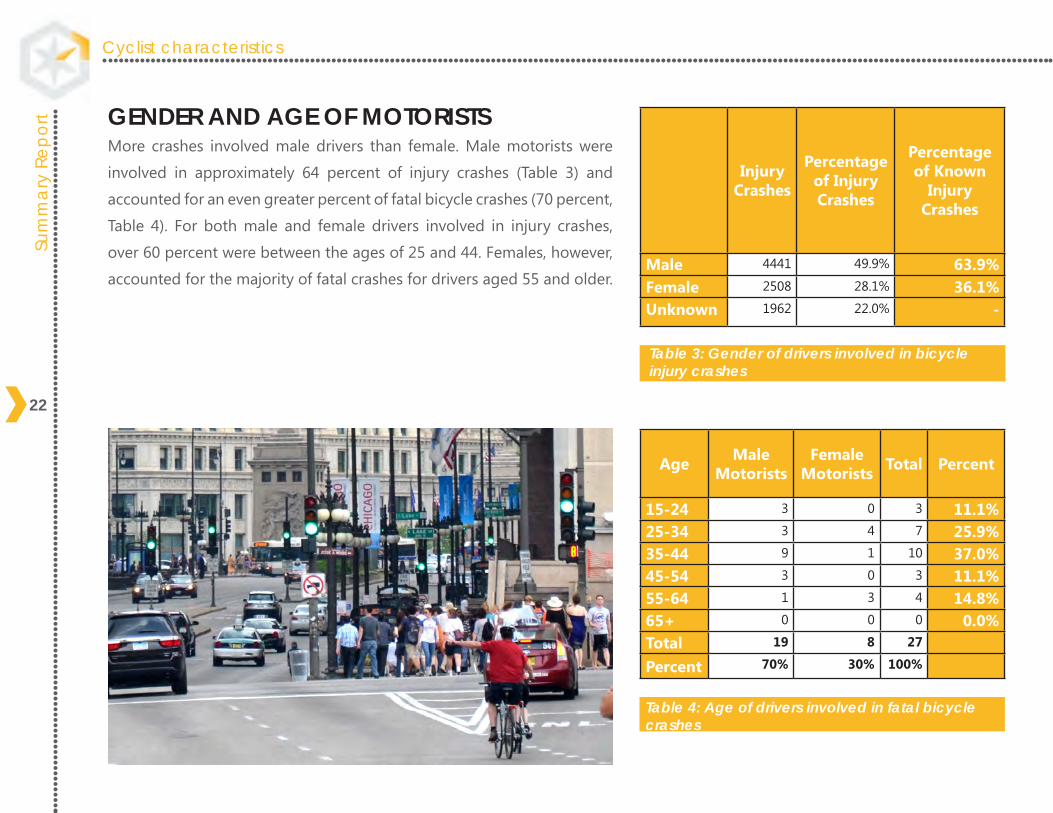
GENDER AND AGE OF MOTORISTSMore crashes involved male drivers than female. Male motorists were
involved in approximately 64 percent of injury crashes (Table 3) and
accounted for an even greater percent of fatal bicycle crashes (70 percent,
Table 4). For both male and female drivers involved in injury crashes,
over 60 percent were between the ages of 25 and 44. Females, however,
accounted for the majority of fatal crashes for drivers aged 55 and older.
Table 3: Gender of drivers involved in bicycle injury crashes
Injury Crashes
Percentage of Injury Crashes
Percentage of Known
Injury Crashes
Male 4441 49.9% 63.9%Female 2508 28.1% 36.1%Unknown 1962 22.0% -
Age Male Motorists
Female Motorists Total Percent
15-24 3 0 3 11.1%25-34 3 4 7 25.9%35-44 9 1 10 37.0%45-54 3 0 3 11.1%55-64 1 3 4 14.8%65+ 0 0 0 0.0%Total 19 8 27
Percent 70% 30% 100%
Table 4: Age of drivers involved in fatal bicycle crashes
23
Vehicles & Operators
Vehicles & Operators
Motorist action 26Bicyclist action 27Vehicle type and use 28Dooring 29Helmet use 30Hit and run 31Alcohol 32
Motorist characteristicsSu
mm
ary
Repo
rt
26
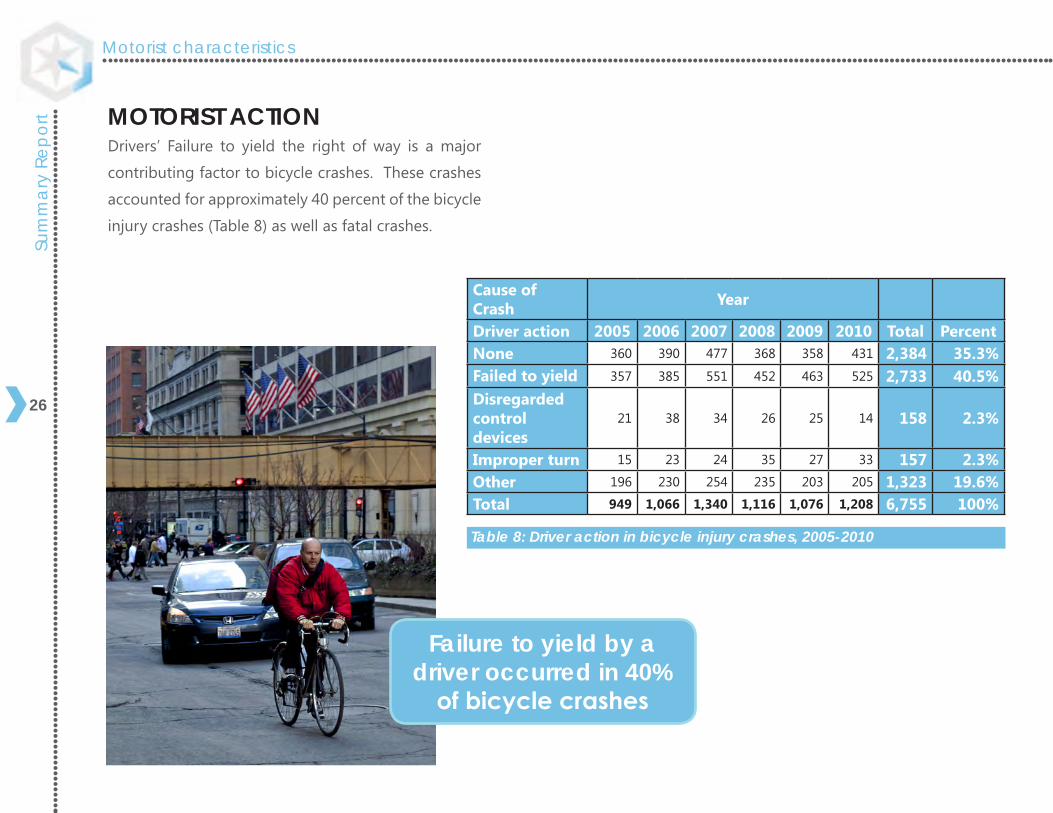
MOTORIST ACTIONDrivers’ Failure to yield the right of way is a major
contributing factor to bicycle crashes. These crashes
accounted for approximately 40 percent of the bicycle
injury crashes (Table 8) as well as fatal crashes.
Cause of Crash Year
Driver action 2005 2006 2007 2008 2009 2010 Total Percent None 360 390 477 368 358 431 2,384 35.3%Failed to yield 357 385 551 452 463 525 2,733 40.5%Disregarded control devices
21 38 34 26 25 14 158 2.3%
Improper turn 15 23 24 35 27 33 157 2.3%Other 196 230 254 235 203 205 1,323 19.6%Total 949 1,066 1,340 1,116 1,076 1,208 6,755 100%
Table 8: Driver action in bicycle injury crashes, 2005-2010
Failure to yield by a driver occurred in 40%
of bicycle crashes
27
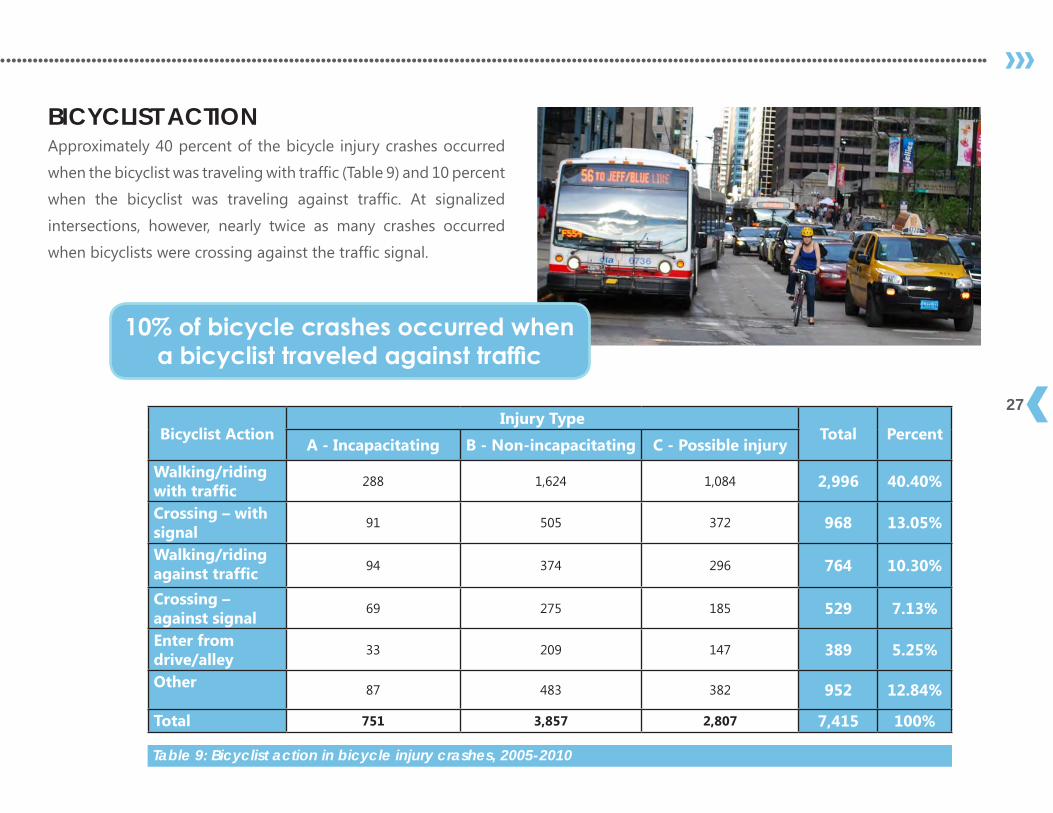
Table 9: Bicyclist action in bicycle injury crashes, 2005-2010
Bicyclist ActionInjury Type
Total Percent A - Incapacitating B - Non-incapacitating C - Possible injury
Walking/riding with traffic
288 1,624 1,084 2,996 40.40%
Crossing – with signal
91 505 372 968 13.05%
Walking/riding against traffic 94 374 296 764 10.30%
Crossing – against signal
69 275 185 529 7.13%
Enter from drive/alley
33 209 147 389 5.25%
Other 87 483 382 952 12.84%
Total 751 3,857 2,807 7,415 100%
BICYCLIST ACTIONApproximately 40 percent of the bicycle injury crashes occurred
when the bicyclist was traveling with traffic (Table 9) and 10 percent
when the bicyclist was traveling against traffic. At signalized
intersections, however, nearly twice as many crashes occurred
when bicyclists were crossing against the traffic signal.
10% of bicycle crashes occurred when a bicyclist traveled against traffic
Motorist characteristicsSu
mm
ary
Repo
rt
28
Table 7: Vehicle use during crash, 2005-2010
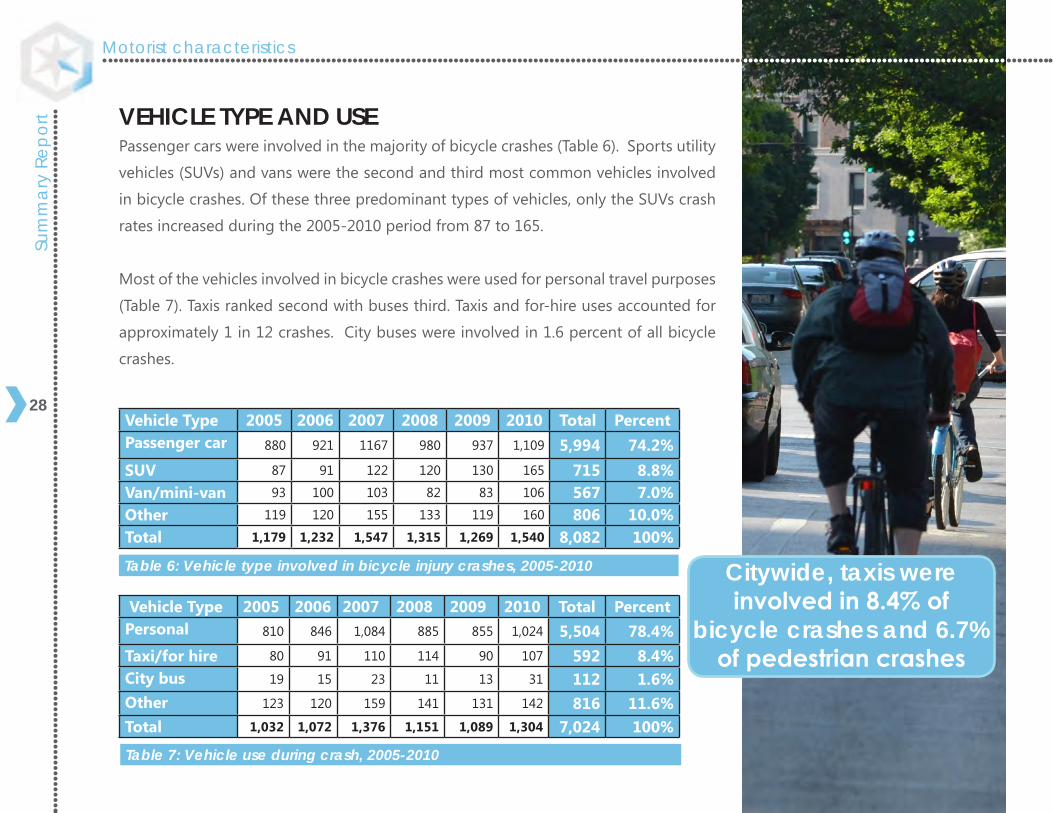
Vehicle Type 2005 2006 2007 2008 2009 2010 Total Percent Passenger car 880 921 1167 980 937 1,109 5,994 74.2%SUV 87 91 122 120 130 165 715 8.8%Van/mini-van 93 100 103 82 83 106 567 7.0%Other 119 120 155 133 119 160 806 10.0%Total 1,179 1,232 1,547 1,315 1,269 1,540 8,082 100%
VEHICLE TYPE AND USEPassenger cars were involved in the majority of bicycle crashes (Table 6). Sports utility
vehicles (SUVs) and vans were the second and third most common vehicles involved
in bicycle crashes. Of these three predominant types of vehicles, only the SUVs crash
rates increased during the 2005-2010 period from 87 to 165.
Most of the vehicles involved in bicycle crashes were used for personal travel purposes
(Table 7). Taxis ranked second with buses third. Taxis and for-hire uses accounted for
approximately 1 in 12 crashes. City buses were involved in 1.6 percent of all bicycle
crashes.
Table 6: Vehicle type involved in bicycle injury crashes, 2005-2010
Vehicle Type 2005 2006 2007 2008 2009 2010 Total Percent Personal 810 846 1,084 885 855 1,024 5,504 78.4%Taxi/for hire 80 91 110 114 90 107 592 8.4%City bus 19 15 23 11 13 31 112 1.6%Other 123 120 159 141 131 142 816 11.6%Total 1,032 1,072 1,376 1,151 1,089 1,304 7,024 100%
Citywide, taxis were involved in 8.4% of
bicycle crashes and 6.7% of pedestrian crashes
29
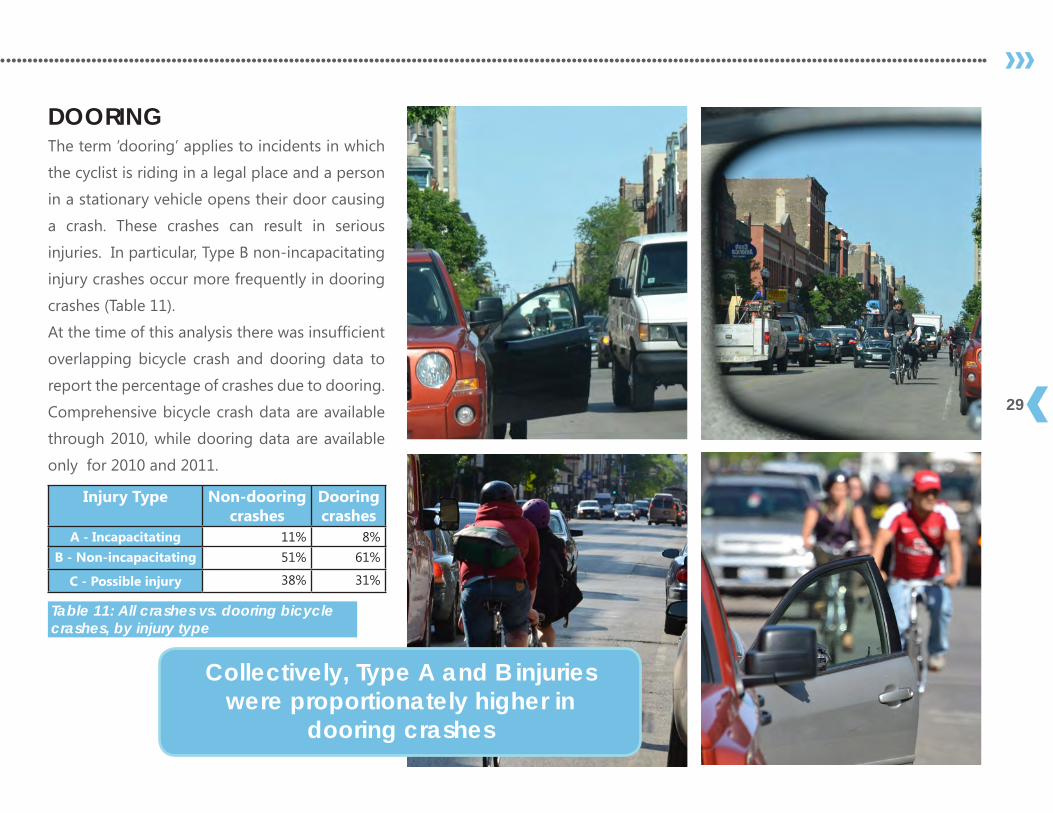
DOORINGThe term ‘dooring’ applies to incidents in which
the cyclist is riding in a legal place and a person
in a stationary vehicle opens their door causing
a crash. These crashes can result in serious
injuries. In particular, Type B non-incapacitating
injury crashes occur more frequently in dooring
crashes (Table 11).
At the time of this analysis there was insufficient
overlapping bicycle crash and dooring data to
report the percentage of crashes due to dooring.
Comprehensive bicycle crash data are available
through 2010, while dooring data are available
only for 2010 and 2011.
Injury Type Non-dooring crashes
Dooring crashes
A - Incapacitating 11% 8%B - Non-incapacitating 51% 61%
C - Possible injury 38% 31%
Table 11: All crashes vs. dooring bicycle crashes, by injury type
Collectively, Type A and B injuries were proportionately higher in
dooring crashes
Motorist characteristicsSu
mm
ary
Repo
rt
30
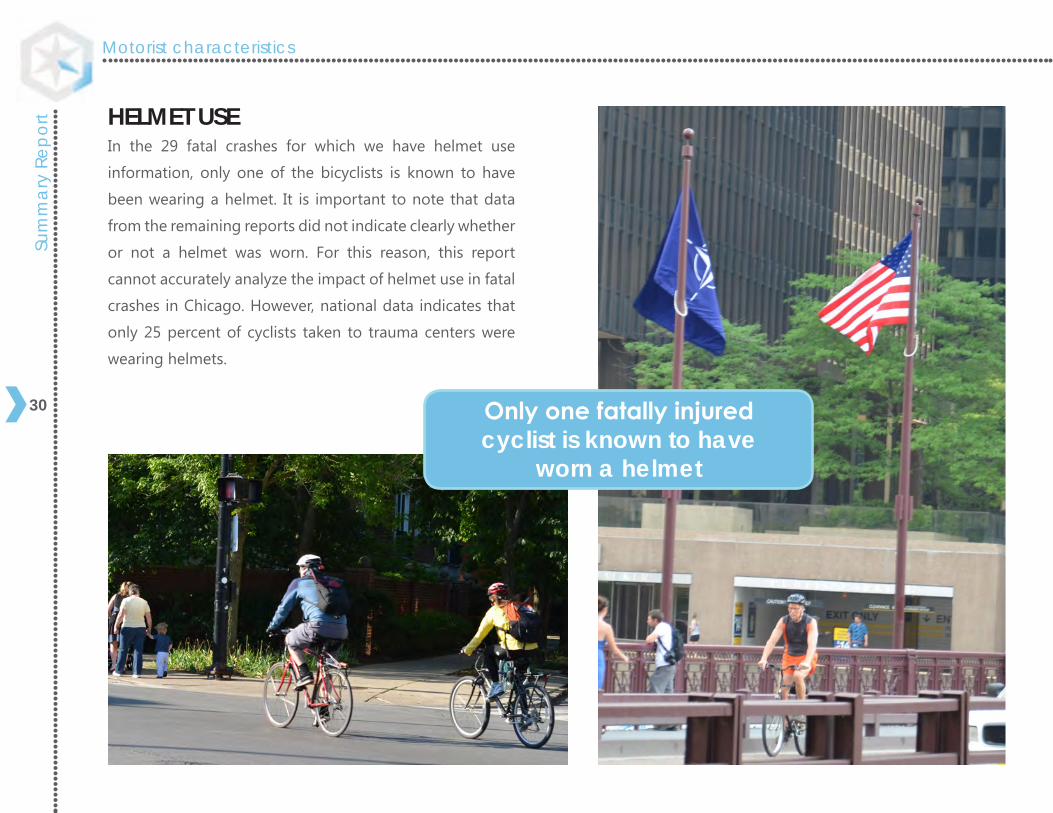
HELMET USEIn the 29 fatal crashes for which we have helmet use
information, only one of the bicyclists is known to have
been wearing a helmet. It is important to note that data
from the remaining reports did not indicate clearly whether
or not a helmet was worn. For this reason, this report
cannot accurately analyze the impact of helmet use in fatal
crashes in Chicago. However, national data indicates that
only 25 percent of cyclists taken to trauma centers were
wearing helmets.
Only one fatally injured cyclist is known to have
worn a helmet
31
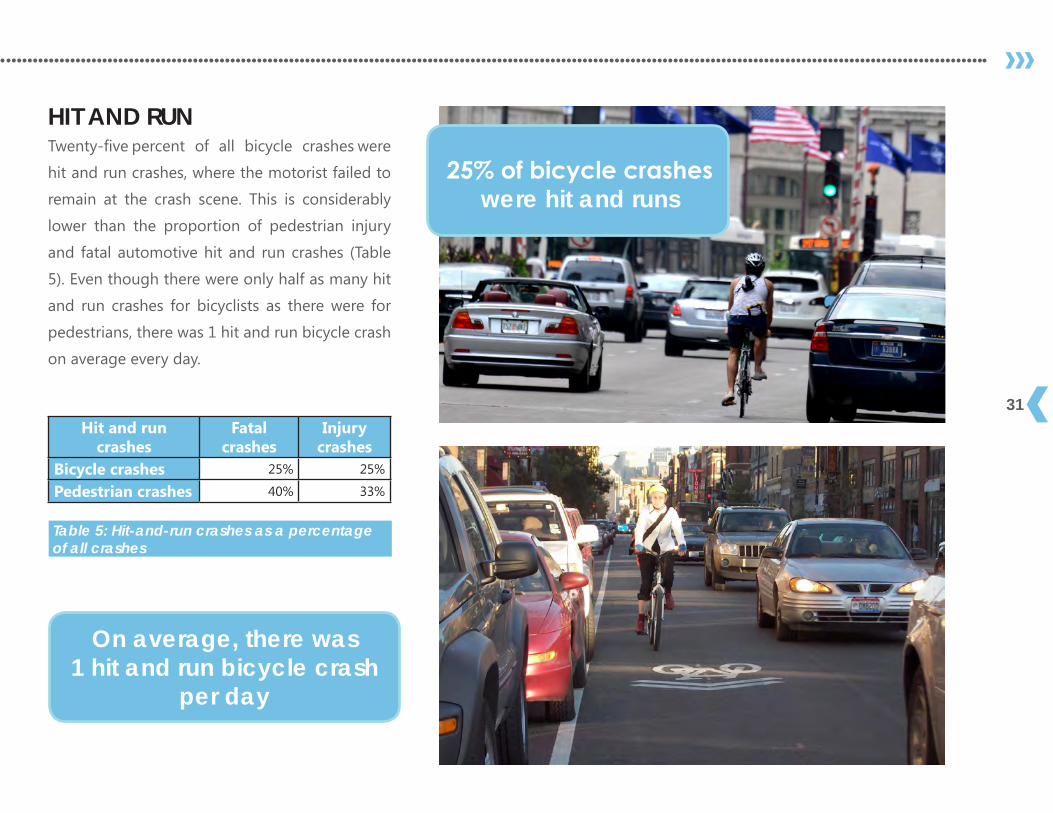
HIT AND RUNTwenty-five percent of all bicycle crashes were
hit and run crashes, where the motorist failed to
remain at the crash scene. This is considerably
lower than the proportion of pedestrian injury
and fatal automotive hit and run crashes (Table
5). Even though there were only half as many hit
and run crashes for bicyclists as there were for
pedestrians, there was 1 hit and run bicycle crash
on average every day.
Table 5: Hit-and-run crashes as a percentage of all crashes
Hit and run crashes
Fatal crashes
Injury crashes
Bicycle crashes 25% 25%
Pedestrian crashes 40% 33%
On average, there was 1 hit and run bicycle crash
per day
25% of bicycle crashes were hit and runs
Motorist characteristicsSu
mm
ary
Repo
rt
32
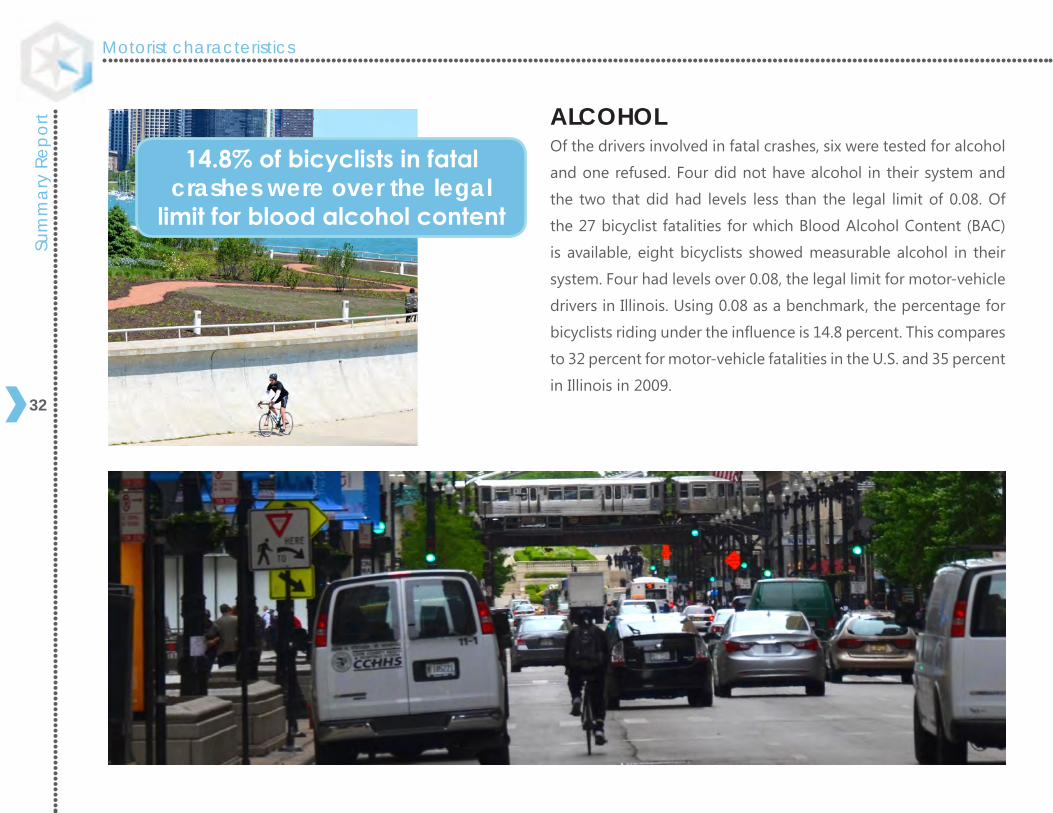
ALCOHOLOf the drivers involved in fatal crashes, six were tested for alcohol
and one refused. Four did not have alcohol in their system and
the two that did had levels less than the legal limit of 0.08. Of
the 27 bicyclist fatalities for which Blood Alcohol Content (BAC)
is available, eight bicyclists showed measurable alcohol in their
system. Four had levels over 0.08, the legal limit for motor-vehicle
drivers in Illinois. Using 0.08 as a benchmark, the percentage for
bicyclists riding under the influence is 14.8 percent. This compares
to 32 percent for motor-vehicle fatalities in the U.S. and 35 percent
in Illinois in 2009.
14.8% of bicyclists in fatal crashes were over the legal
limit for blood alcohol content
33
When Did Bicycle Crashes Occur
When Did Bicycle Crashes Occur
Crashes by month 36Crashes by day of week 37Crashes by time of day 38
When did bicycle crashes occurSu
mm
ary
Repo
rt
36
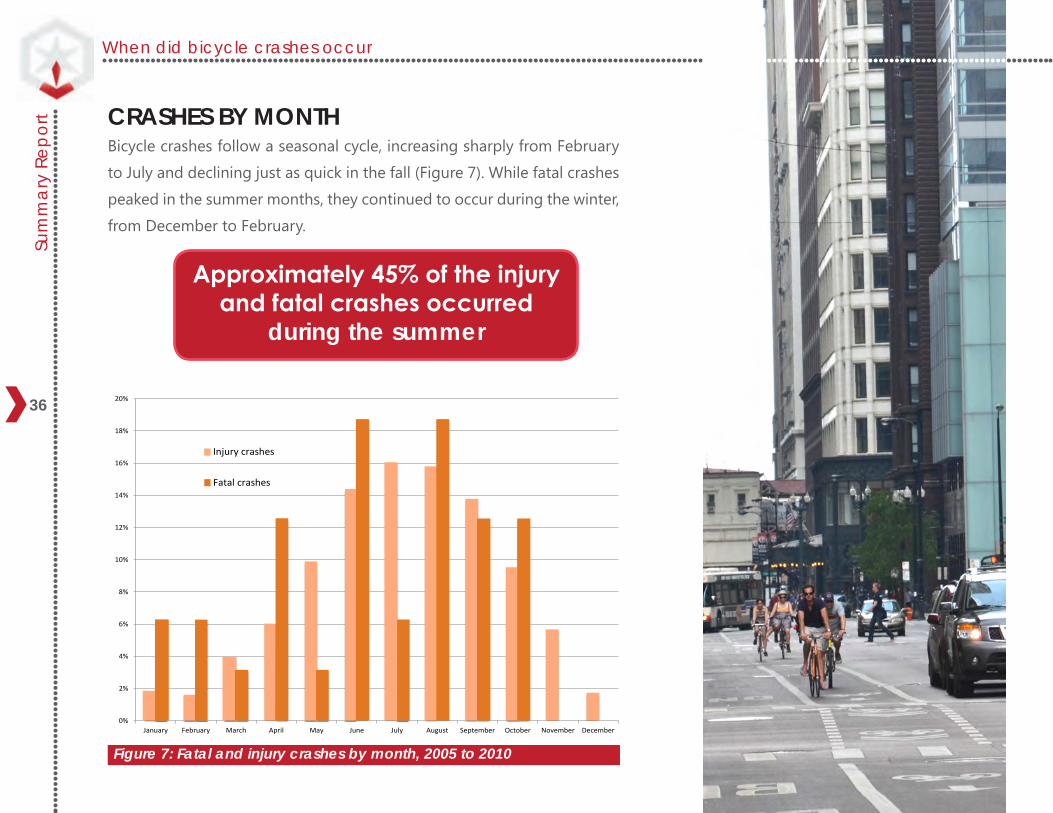
CRASHES BY MONTHBicycle crashes follow a seasonal cycle, increasing sharply from February
to July and declining just as quick in the fall (Figure 7). While fatal crashes
peaked in the summer months, they continued to occur during the winter,
from December to February.
Figure 7: Fatal and injury crashes by month, 2005 to 2010
Approximately 45% of the injury and fatal crashes occurred
during the summer
0%
2%
4%
6%
8%
10%
12%
14%
16%
18%
20%
January February March April May June July August September October November December
Injury crashes
Fatal crashes
37
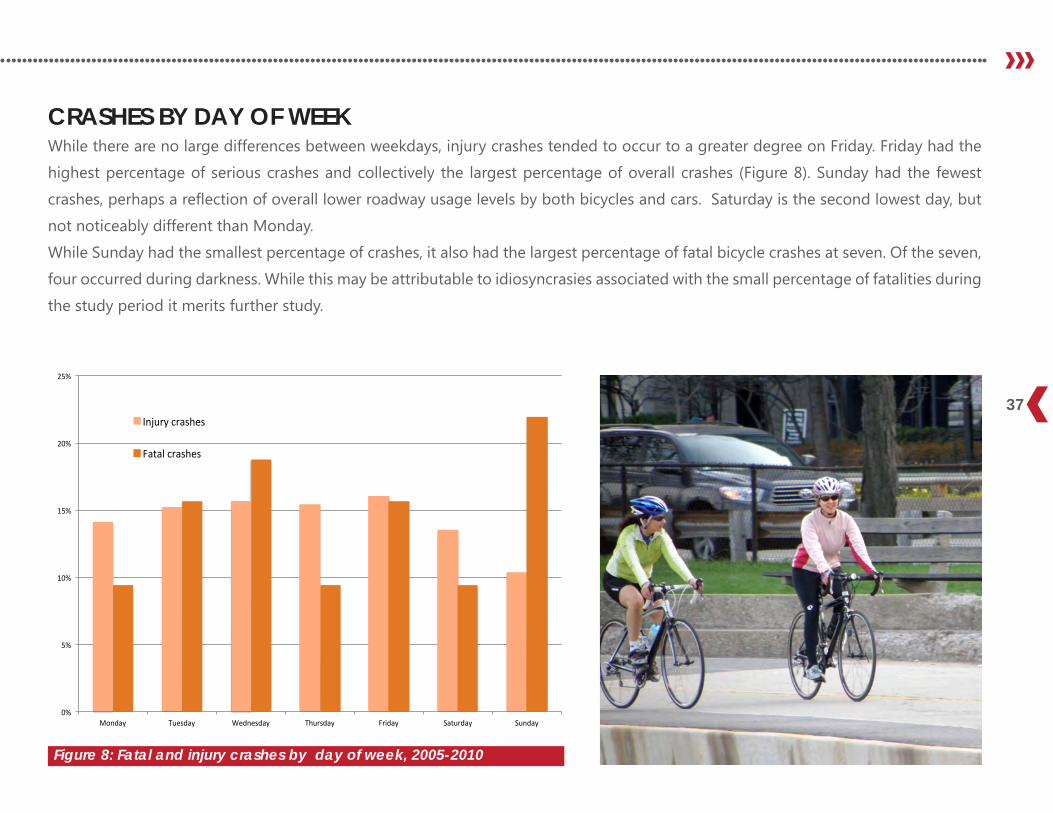
CRASHES BY DAY OF WEEKWhile there are no large differences between weekdays, injury crashes tended to occur to a greater degree on Friday. Friday had the
highest percentage of serious crashes and collectively the largest percentage of overall crashes (Figure 8). Sunday had the fewest
crashes, perhaps a reflection of overall lower roadway usage levels by both bicycles and cars. Saturday is the second lowest day, but
not noticeably different than Monday.
While Sunday had the smallest percentage of crashes, it also had the largest percentage of fatal bicycle crashes at seven. Of the seven,
four occurred during darkness. While this may be attributable to idiosyncrasies associated with the small percentage of fatalities during
the study period it merits further study.
0%
5%
10%
15%
20%
25%
Monday Tuesday Wednesday Thursday Friday Saturday Sunday
Injury crashes
Fatal crashes
Figure 8: Fatal and injury crashes by day of week, 2005-2010
When did bicycle crashes occurSu
mm
ary
Repo
rt
38
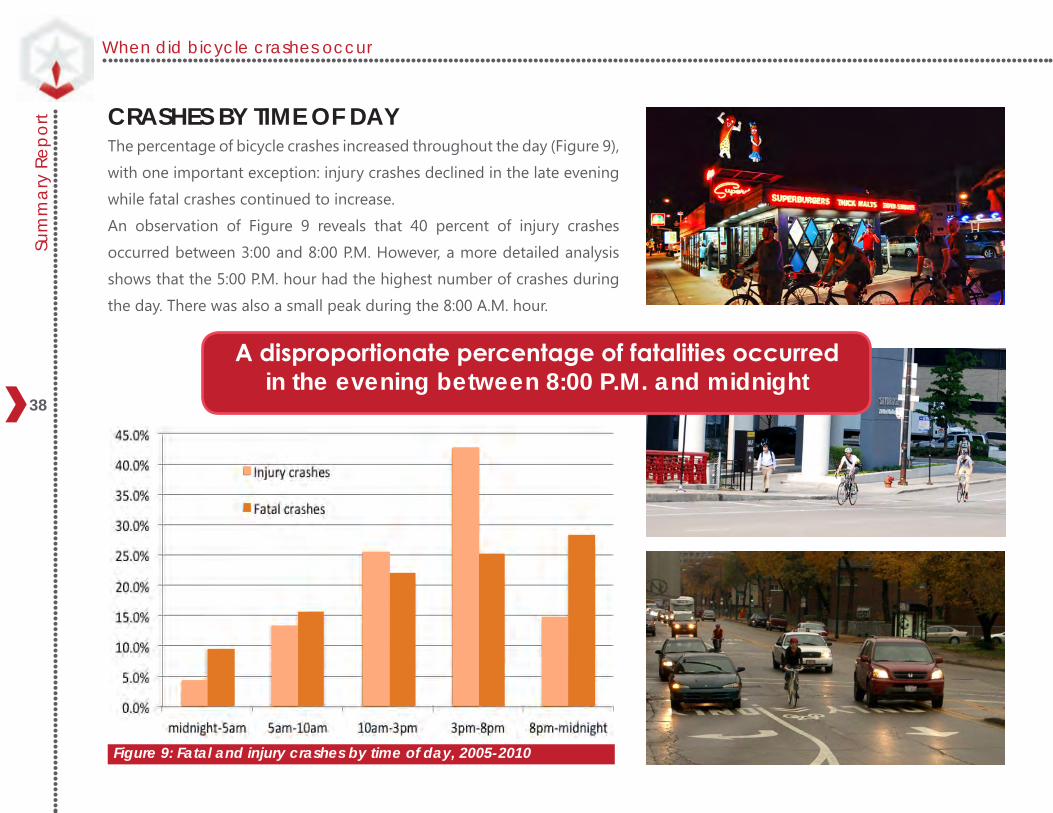
CRASHES BY TIME OF DAYThe percentage of bicycle crashes increased throughout the day (Figure 9),
with one important exception: injury crashes declined in the late evening
while fatal crashes continued to increase.
An observation of Figure 9 reveals that 40 percent of injury crashes
occurred between 3:00 and 8:00 P.M. However, a more detailed analysis
shows that the 5:00 P.M. hour had the highest number of crashes during
the day. There was also a small peak during the 8:00 A.M. hour.
Figure 9: Fatal and injury crashes by time of day, 2005-2010
A disproportionate percentage of fatalities occurred in the evening between 8:00 P.M. and midnight
39
Crash Locations & Conditions
Crash Locations & Conditions
Location of bicycle crashes 42Hot spots 44Intersections 45Non-Intersection related crashes 46Dooring on arterial streets 48Weather, light and road surface conditions 49
Crash location and conditionsSu
mm
ary
Repo
rt
42
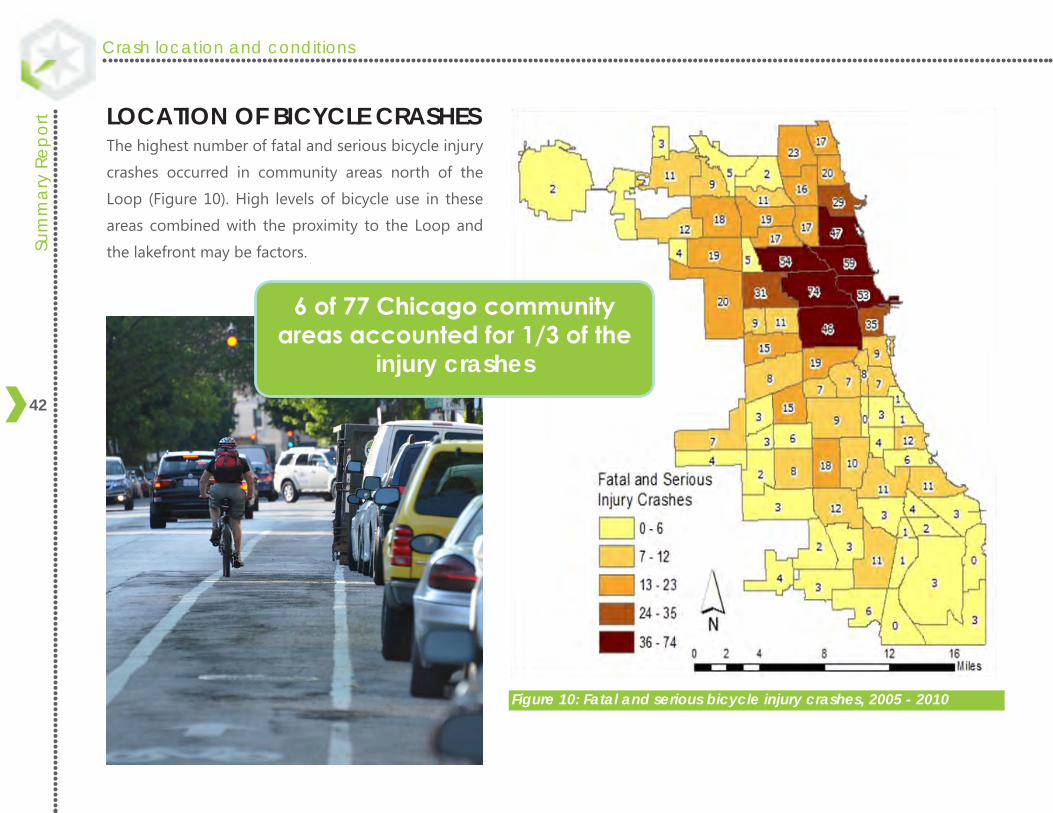
LOCATION OF BICYCLE CRASHESThe highest number of fatal and serious bicycle injury
crashes occurred in community areas north of the
Loop (Figure 10). High levels of bicycle use in these
areas combined with the proximity to the Loop and
the lakefront may be factors.
Figure 10: Fatal and serious bicycle injury crashes, 2005 - 2010
6 of 77 Chicago community areas accounted for 1/3 of the
injury crashes
43
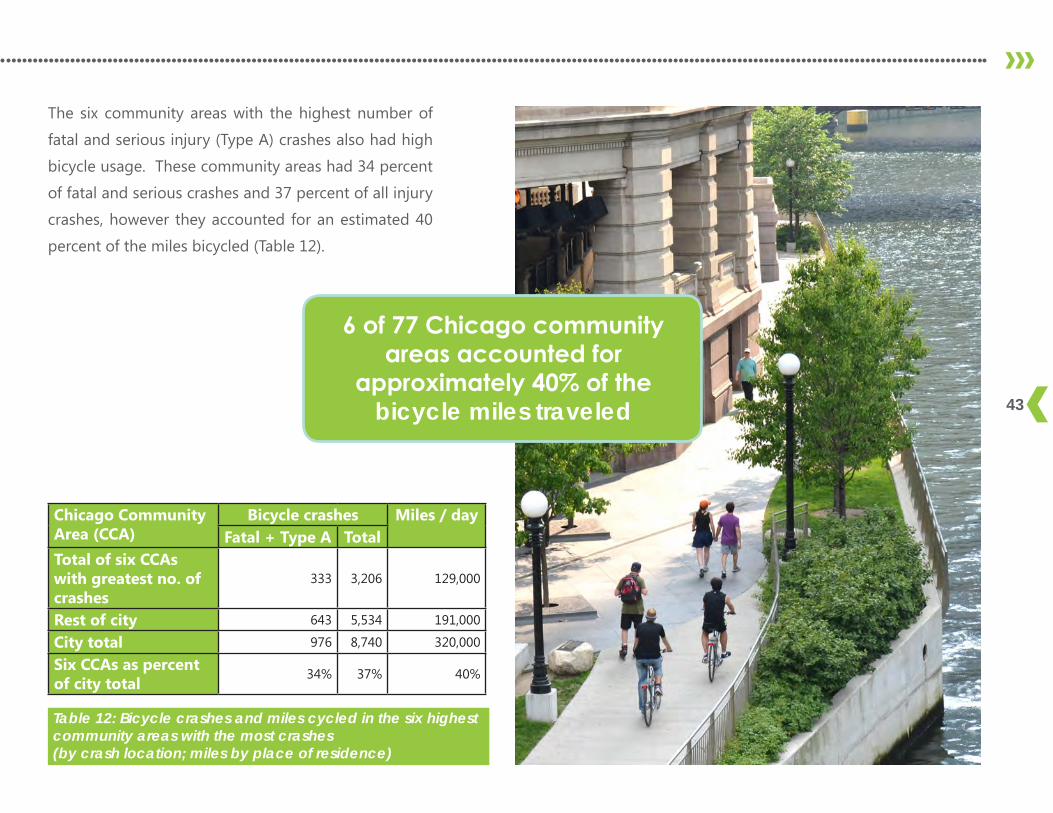
The six community areas with the highest number of
fatal and serious injury (Type A) crashes also had high
bicycle usage. These community areas had 34 percent
of fatal and serious crashes and 37 percent of all injury
crashes, however they accounted for an estimated 40
percent of the miles bicycled (Table 12).
Chicago Community Area (CCA)
Bicycle crashes Miles / dayFatal + Type A Total
Total of six CCAs with greatest no. of crashes
333 3,206 129,000
Rest of city 643 5,534 191,000
City total 976 8,740 320,000
Six CCAs as percent of city total
34% 37% 40%
Table 12: Bicycle crashes and miles cycled in the six highest community areas with the most crashes(by crash location; miles by place of residence)
6 of 77 Chicago community areas accounted for
approximately 40% of the bicycle miles traveled
Crash location and conditionsSu
mm
ary
Repo
rt
44
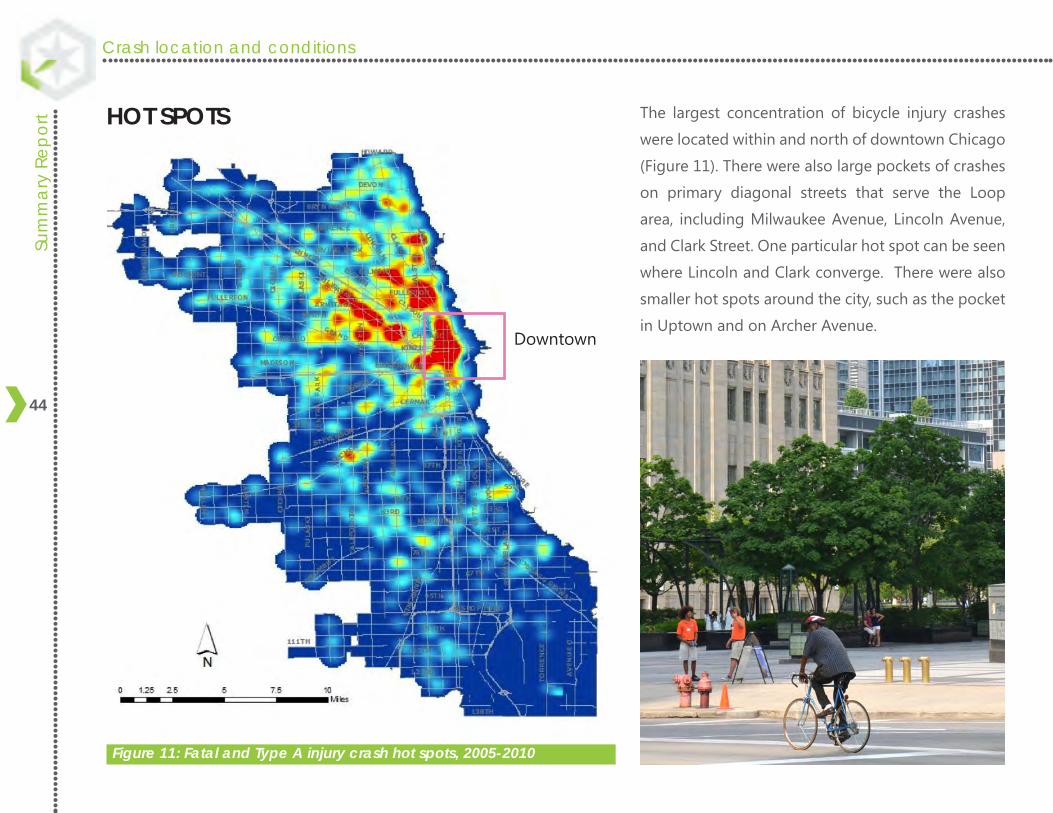
HOT SPOTS
Figure 11: Fatal and Type A injury crash hot spots, 2005-2010
The largest concentration of bicycle injury crashes
were located within and north of downtown Chicago
(Figure 11). There were also large pockets of crashes
on primary diagonal streets that serve the Loop
area, including Milwaukee Avenue, Lincoln Avenue,
and Clark Street. One particular hot spot can be seen
where Lincoln and Clark converge. There were also
smaller hot spots around the city, such as the pocket
in Uptown and on Archer Avenue. Downtown
45
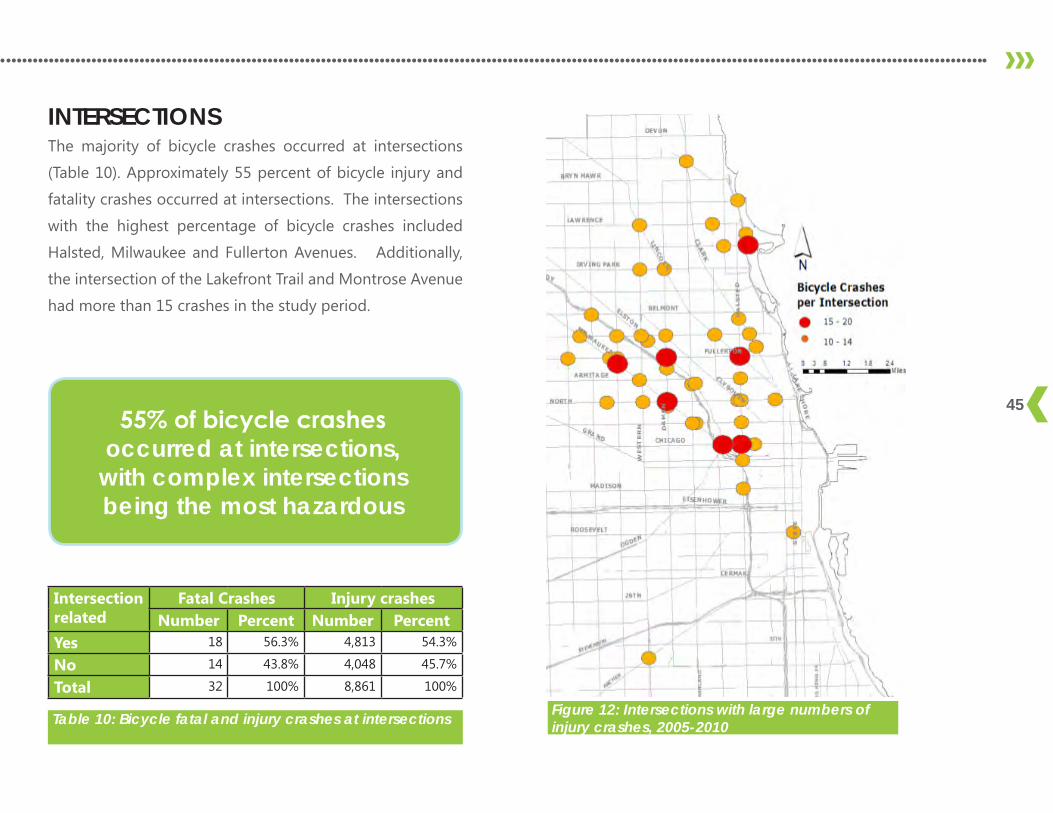
INTERSECTIONSThe majority of bicycle crashes occurred at intersections
(Table 10). Approximately 55 percent of bicycle injury and
fatality crashes occurred at intersections. The intersections
with the highest percentage of bicycle crashes included
Halsted, Milwaukee and Fullerton Avenues. Additionally,
the intersection of the Lakefront Trail and Montrose Avenue
had more than 15 crashes in the study period.
Figure 12: Intersections with large numbers of injury crashes, 2005-2010Table 10: Bicycle fatal and injury crashes at intersections
Intersection related
Fatal Crashes Injury crashesNumber Percent Number Percent
Yes 18 56.3% 4,813 54.3%
No 14 43.8% 4,048 45.7%
Total 32 100% 8,861 100%
55% of bicycle crashes occurred at intersections,
with complex intersections being the most hazardous
Crash location and conditionsSu
mm
ary
Repo
rt
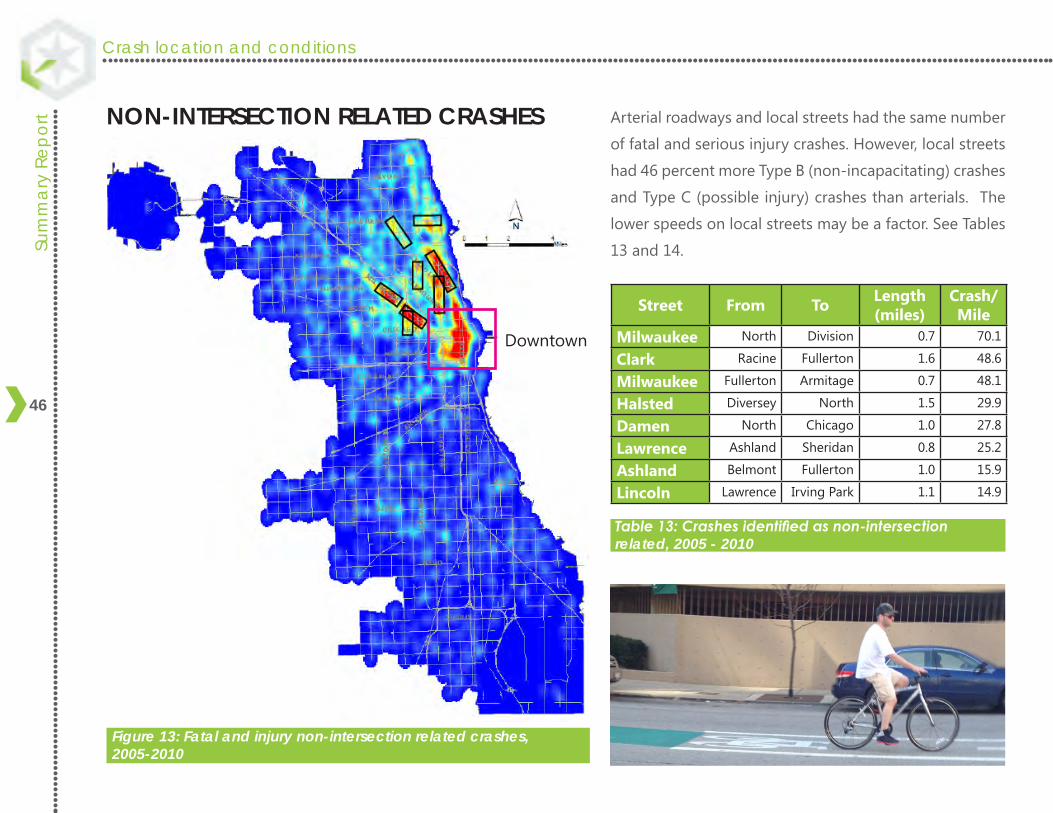
46
Arterial roadways and local streets had the same number
of fatal and serious injury crashes. However, local streets
had 46 percent more Type B (non-incapacitating) crashes
and Type C (possible injury) crashes than arterials. The
lower speeds on local streets may be a factor. See Tables
13 and 14.
NON-INTERSECTION RELATED CRASHES
Figure 13: Fatal and injury non-intersection related crashes, 2005-2010
Street From To Length (miles)
Crash/Mile
Milwaukee North Division 0.7 70.1
Clark Racine Fullerton 1.6 48.6
Milwaukee Fullerton Armitage 0.7 48.1
Halsted Diversey North 1.5 29.9
Damen North Chicago 1.0 27.8
Lawrence Ashland Sheridan 0.8 25.2
Ashland Belmont Fullerton 1.0 15.9
Lincoln Lawrence Irving Park 1.1 14.9
Table 13: Crashes identified as non-intersection related, 2005 - 2010
Downtown
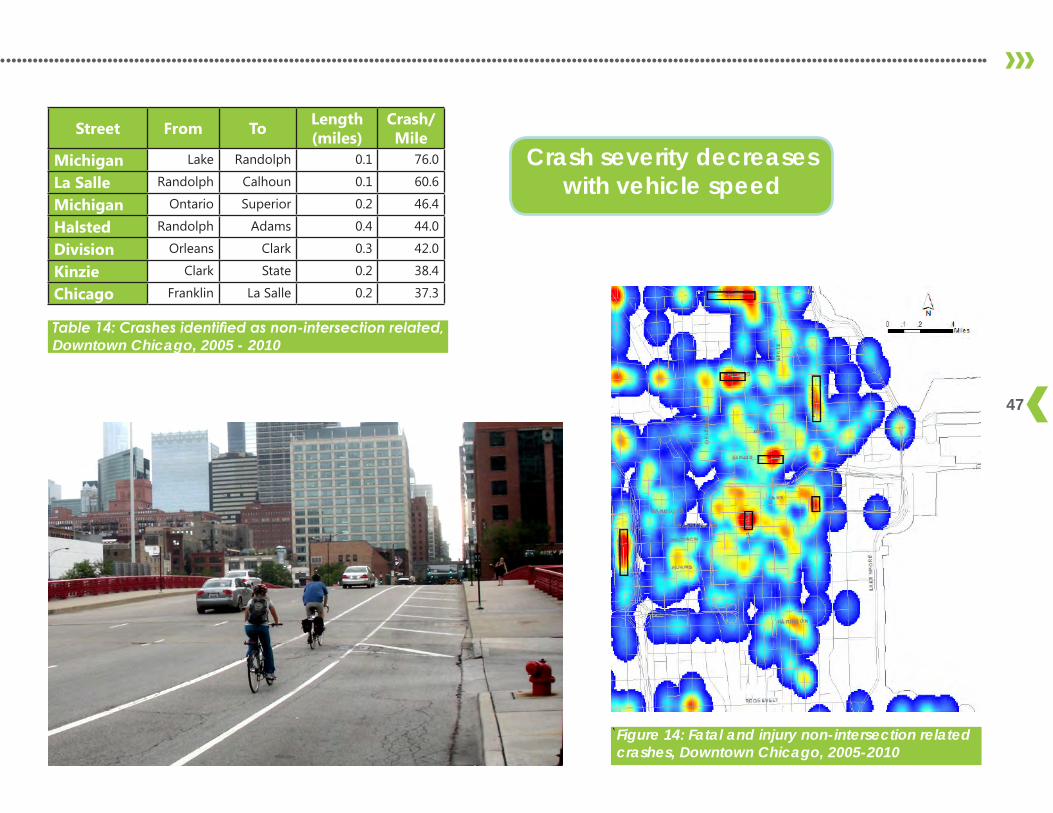
47
`Figure 14: Fatal and injury non-intersection related crashes, Downtown Chicago, 2005-2010
Street From To Length (miles)
Crash/Mile
Michigan Lake Randolph 0.1 76.0
La Salle Randolph Calhoun 0.1 60.6
Michigan Ontario Superior 0.2 46.4
Halsted Randolph Adams 0.4 44.0
Division Orleans Clark 0.3 42.0
Kinzie Clark State 0.2 38.4
Chicago Franklin La Salle 0.2 37.3
Table 14: Crashes identified as non-intersection related, Downtown Chicago, 2005 - 2010
Crash severity decreases with vehicle speed
Crash location and conditionsSu
mm
ary
Repo
rt
48
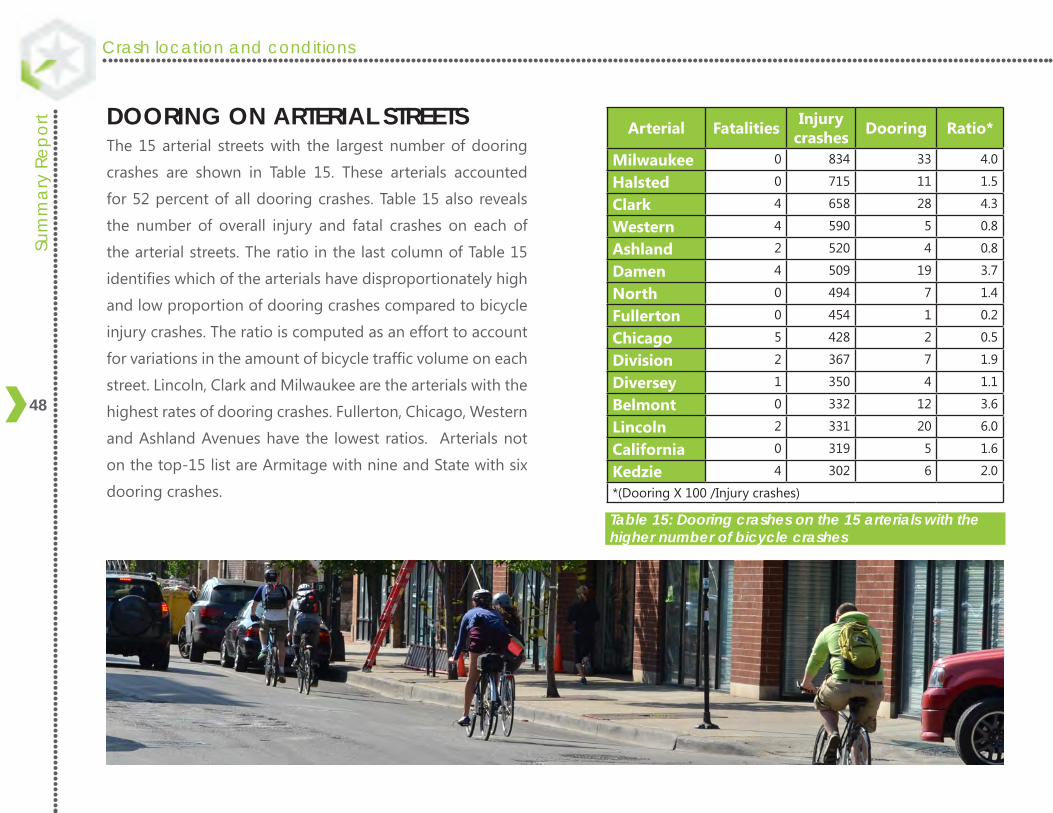
DOORING ON ARTERIAL STREETSThe 15 arterial streets with the largest number of dooring
crashes are shown in Table 15. These arterials accounted
for 52 percent of all dooring crashes. Table 15 also reveals
the number of overall injury and fatal crashes on each of
the arterial streets. The ratio in the last column of Table 15
identifies which of the arterials have disproportionately high
and low proportion of dooring crashes compared to bicycle
injury crashes. The ratio is computed as an effort to account
for variations in the amount of bicycle traffic volume on each
street. Lincoln, Clark and Milwaukee are the arterials with the
highest rates of dooring crashes. Fullerton, Chicago, Western
and Ashland Avenues have the lowest ratios. Arterials not
on the top-15 list are Armitage with nine and State with six
dooring crashes.
Table 15: Dooring crashes on the 15 arterials with the higher number of bicycle crashes
Arterial Fatalities Injury crashes Dooring Ratio*
Milwaukee 0 834 33 4.0
Halsted 0 715 11 1.5
Clark 4 658 28 4.3
Western 4 590 5 0.8
Ashland 2 520 4 0.8
Damen 4 509 19 3.7
North 0 494 7 1.4
Fullerton 0 454 1 0.2
Chicago 5 428 2 0.5
Division 2 367 7 1.9
Diversey 1 350 4 1.1
Belmont 0 332 12 3.6
Lincoln 2 331 20 6.0
California 0 319 5 1.6
Kedzie 4 302 6 2.0
*(Dooring X 100 /Injury crashes)
49
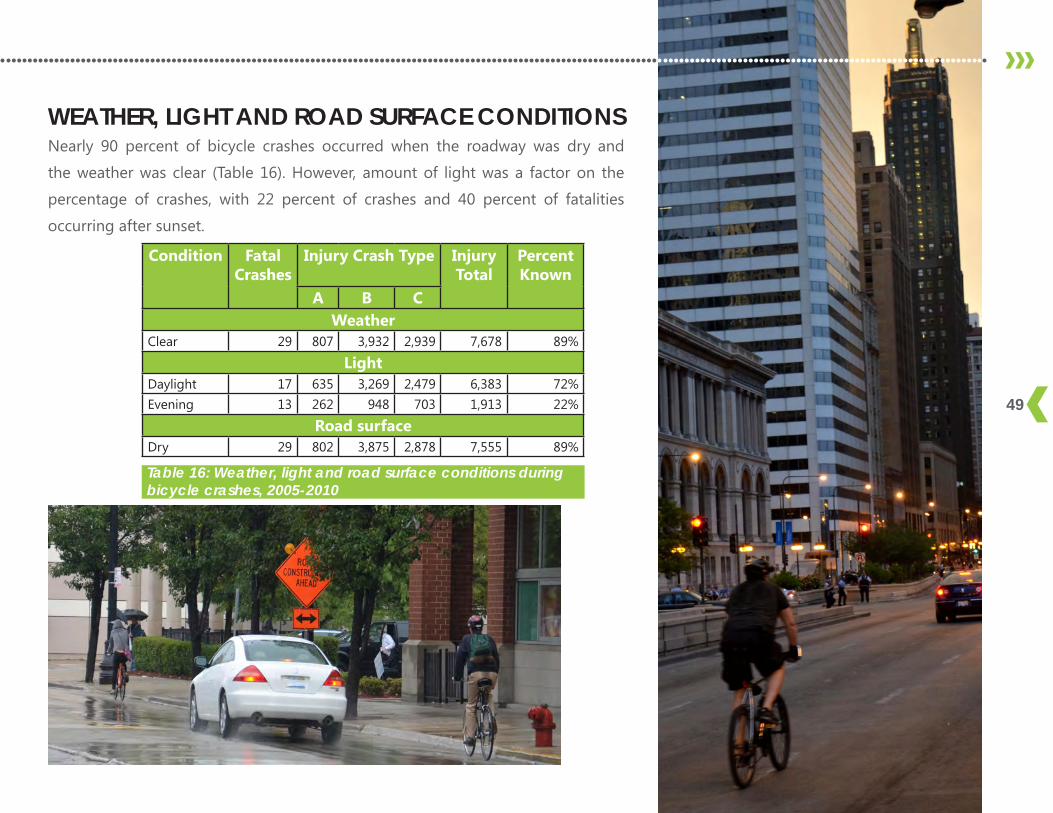
WEATHER, LIGHT AND ROAD SURFACE CONDITIONSNearly 90 percent of bicycle crashes occurred when the roadway was dry and
the weather was clear (Table 16). However, amount of light was a factor on the
percentage of crashes, with 22 percent of crashes and 40 percent of fatalities
occurring after sunset.
Table 16: Weather, light and road surface conditions during bicycle crashes, 2005-2010
Condition Fatal Crashes
Injury Crash Type Injury Total
Percent Known
A B CWeather
Clear 29 807 3,932 2,939 7,678 89%
LightDaylight 17 635 3,269 2,479 6,383 72%Evening 13 262 948 703 1,913 22%
Road surfaceDry 29 802 3,875 2,878 7,555 89%
Crash Reduction Strategies
Roadway design and engineering solutions 52Education and marketing solutions 54Data and reporting solutions 56Enforcement solutions 58Policy solutions 59Counter measures matrix 60
Crash reduction strategiesSu
mm
ary
Repo
rt
52
There has been extensive research conducted in recent years on ways to design, construct and maintain streets for
bicycle safety. National resources including the Federal Highway Administration’s BIKESAFE project (2006), the National
Association of City Transportation Officials’ Urban Bikeway Design Guide (2011), as well as the City of Chicago’s Complete
Streets Design Guide provide excellent technical guidance on facility selection and implementation. With regard to the
key findings in this report, the following are recommended as areas for highest prioritization:
Roadway Design and Engineering Solutions
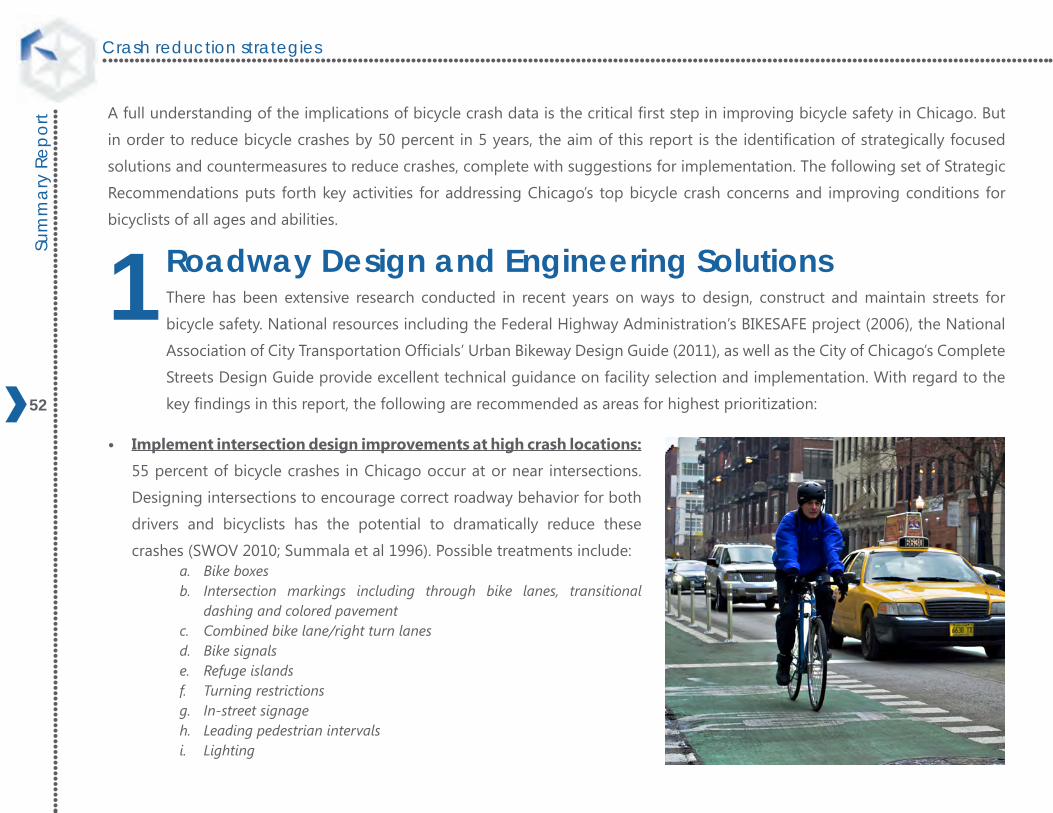
• Implement intersection design improvements at high crash locations:
55 percent of bicycle crashes in Chicago occur at or near intersections.
Designing intersections to encourage correct roadway behavior for both
drivers and bicyclists has the potential to dramatically reduce these
crashes (SWOV 2010; Summala et al 1996). Possible treatments include:a. Bike boxesb. Intersection markings including through bike lanes, transitional
dashing and colored pavementc. Combined bike lane/right turn lanesd. Bike signalse. Refuge islandsf. Turning restrictionsg. In-street signageh. Leading pedestrian intervalsi. Lighting
A full understanding of the implications of bicycle crash data is the critical first step in improving bicycle safety in Chicago. But
in order to reduce bicycle crashes by 50 percent in 5 years, the aim of this report is the identification of strategically focused
solutions and countermeasures to reduce crashes, complete with suggestions for implementation. The following set of Strategic
Recommendations puts forth key activities for addressing Chicago’s top bicycle crash concerns and improving conditions for
bicyclists of all ages and abilities.
1
53
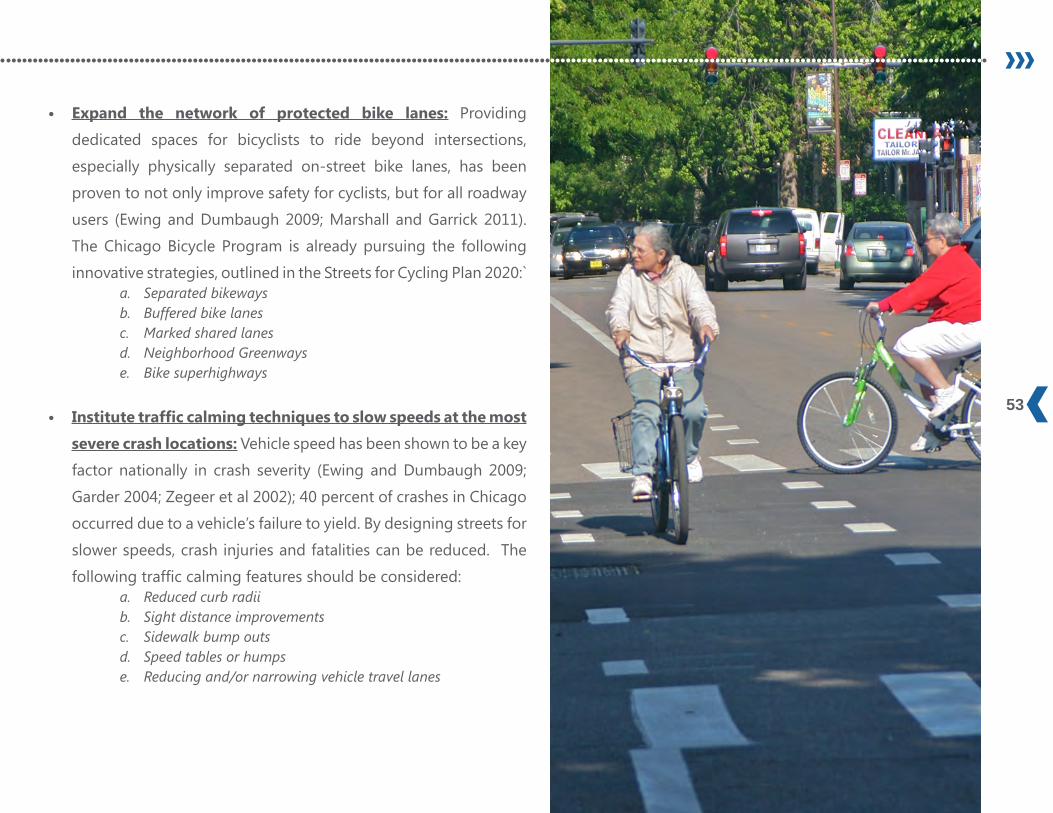
• Expand the network of protected bike lanes: Providing
dedicated spaces for bicyclists to ride beyond intersections,
especially physically separated on-street bike lanes, has been
proven to not only improve safety for cyclists, but for all roadway
users (Ewing and Dumbaugh 2009; Marshall and Garrick 2011).
The Chicago Bicycle Program is already pursuing the following
innovative strategies, outlined in the Streets for Cycling Plan 2020:`a. Separated bikewaysb. Buffered bike lanesc. Marked shared lanesd. Neighborhood Greenwayse. Bike superhighways
• Institute traffic calming techniques to slow speeds at the most
severe crash locations: Vehicle speed has been shown to be a key
factor nationally in crash severity (Ewing and Dumbaugh 2009;
Garder 2004; Zegeer et al 2002); 40 percent of crashes in Chicago
occurred due to a vehicle’s failure to yield. By designing streets for
slower speeds, crash injuries and fatalities can be reduced. The
following traffic calming features should be considered:a. Reduced curb radiib. Sight distance improvementsc. Sidewalk bump outs d. Speed tables or humpse. Reducing and/or narrowing vehicle travel lanes
Crash reduction strategiesSu
mm
ary
Repo
rt
54
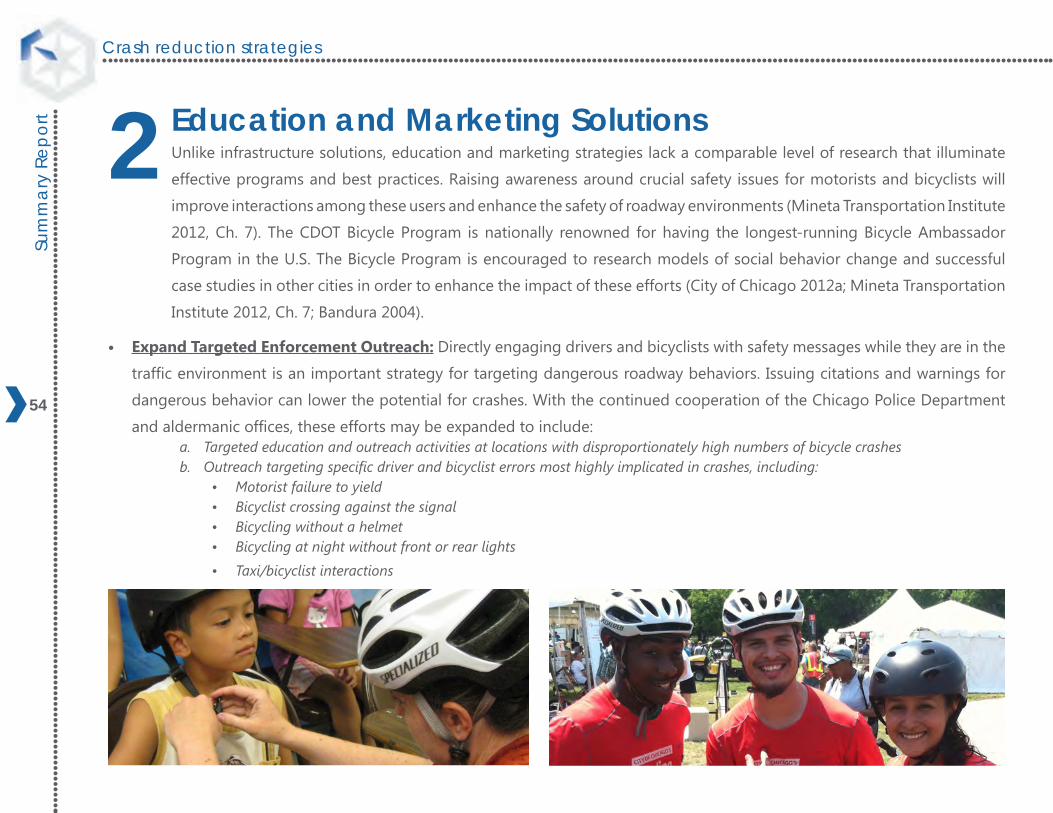
Unlike infrastructure solutions, education and marketing strategies lack a comparable level of research that illuminate
effective programs and best practices. Raising awareness around crucial safety issues for motorists and bicyclists will
improve interactions among these users and enhance the safety of roadway environments (Mineta Transportation Institute
2012, Ch. 7). The CDOT Bicycle Program is nationally renowned for having the longest-running Bicycle Ambassador
Program in the U.S. The Bicycle Program is encouraged to research models of social behavior change and successful
case studies in other cities in order to enhance the impact of these efforts (City of Chicago 2012a; Mineta Transportation
Institute 2012, Ch. 7; Bandura 2004).
Education and Marketing Solutions
• Expand Targeted Enforcement Outreach: Directly engaging drivers and bicyclists with safety messages while they are in the
traffic environment is an important strategy for targeting dangerous roadway behaviors. Issuing citations and warnings for
dangerous behavior can lower the potential for crashes. With the continued cooperation of the Chicago Police Department
and aldermanic offices, these efforts may be expanded to include:a. Targeted education and outreach activities at locations with disproportionately high numbers of bicycle crashesb. Outreach targeting specific driver and bicyclist errors most highly implicated in crashes, including:
• Motorist failure to yield• Bicyclist crossing against the signal• Bicycling without a helmet• Bicycling at night without front or rear lights
• Taxi/bicyclist interactions
2
55
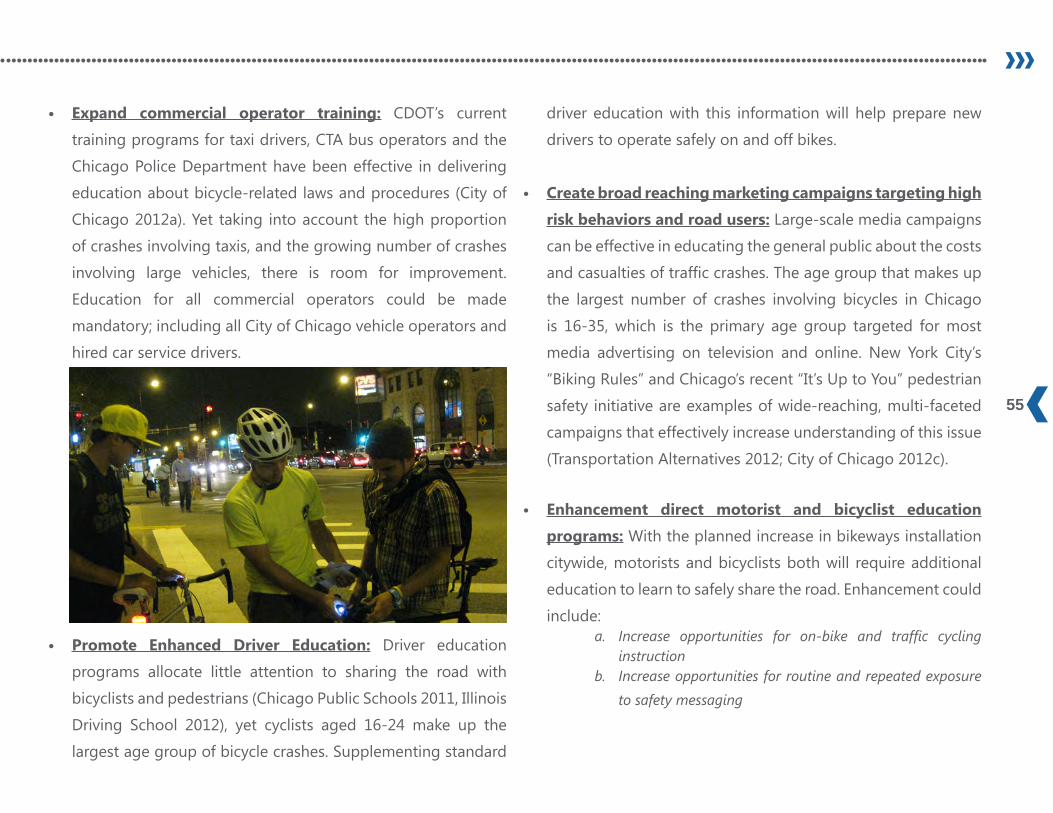
• Expand commercial operator training: CDOT’s current
training programs for taxi drivers, CTA bus operators and the
Chicago Police Department have been effective in delivering
education about bicycle-related laws and procedures (City of
Chicago 2012a). Yet taking into account the high proportion
of crashes involving taxis, and the growing number of crashes
involving large vehicles, there is room for improvement.
Education for all commercial operators could be made
mandatory; including all City of Chicago vehicle operators and
hired car service drivers.
• Promote Enhanced Driver Education: Driver education
programs allocate little attention to sharing the road with
bicyclists and pedestrians (Chicago Public Schools 2011, Illinois
Driving School 2012), yet cyclists aged 16-24 make up the
largest age group of bicycle crashes. Supplementing standard
driver education with this information will help prepare new
drivers to operate safely on and off bikes.
• Create broad reaching marketing campaigns targeting high
risk behaviors and road users: Large-scale media campaigns
can be effective in educating the general public about the costs
and casualties of traffic crashes. The age group that makes up
the largest number of crashes involving bicycles in Chicago
is 16-35, which is the primary age group targeted for most
media advertising on television and online. New York City’s
“Biking Rules” and Chicago’s recent “It’s Up to You” pedestrian
safety initiative are examples of wide-reaching, multi-faceted
campaigns that effectively increase understanding of this issue
(Transportation Alternatives 2012; City of Chicago 2012c).
• Enhancement direct motorist and bicyclist education
programs: With the planned increase in bikeways installation
citywide, motorists and bicyclists both will require additional
education to learn to safely share the road. Enhancement could
include:a. Increase opportunities for on-bike and traffic cycling
instructionb. Increase opportunities for routine and repeated exposure
to safety messaging
Crash reduction strategiesSu
mm
ary
Repo
rt
56
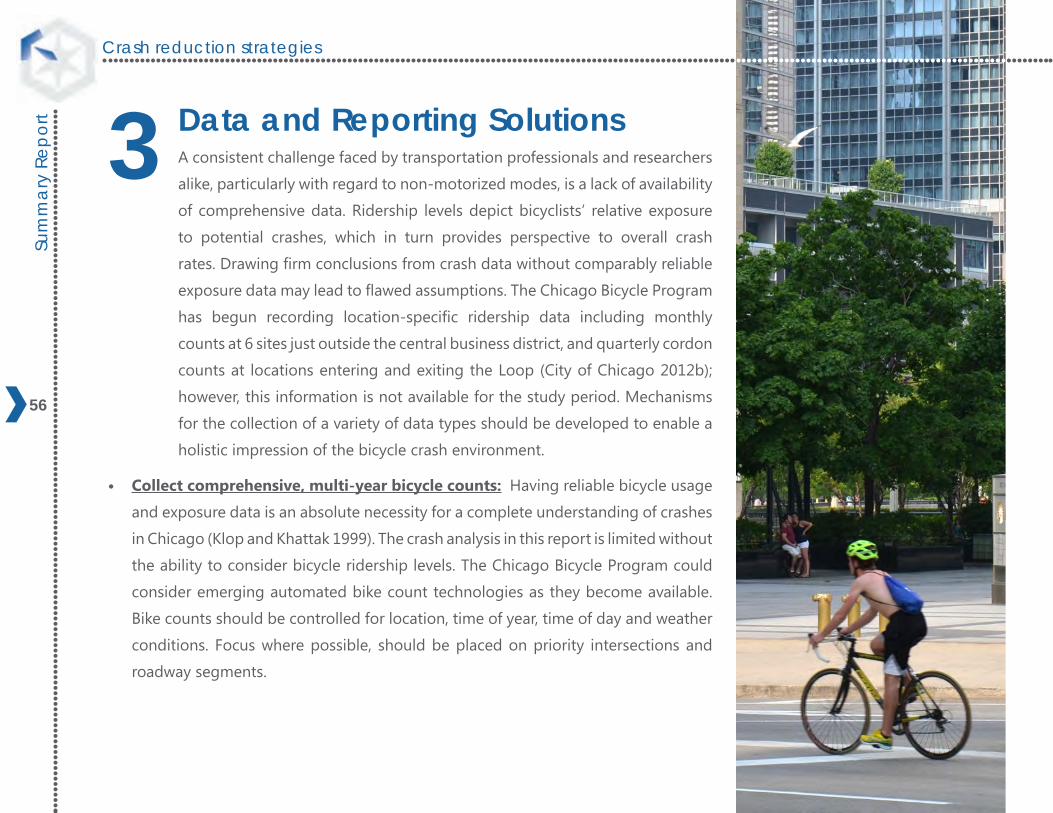
Data and Reporting SolutionsA consistent challenge faced by transportation professionals and researchers
alike, particularly with regard to non-motorized modes, is a lack of availability
of comprehensive data. Ridership levels depict bicyclists’ relative exposure
to potential crashes, which in turn provides perspective to overall crash
rates. Drawing firm conclusions from crash data without comparably reliable
exposure data may lead to flawed assumptions. The Chicago Bicycle Program
has begun recording location-specific ridership data including monthly
counts at 6 sites just outside the central business district, and quarterly cordon
counts at locations entering and exiting the Loop (City of Chicago 2012b);
however, this information is not available for the study period. Mechanisms
for the collection of a variety of data types should be developed to enable a
holistic impression of the bicycle crash environment.
• Collect comprehensive, multi-year bicycle counts: Having reliable bicycle usage
and exposure data is an absolute necessity for a complete understanding of crashes
in Chicago (Klop and Khattak 1999). The crash analysis in this report is limited without
the ability to consider bicycle ridership levels. The Chicago Bicycle Program could
consider emerging automated bike count technologies as they become available.
Bike counts should be controlled for location, time of year, time of day and weather
conditions. Focus where possible, should be placed on priority intersections and
roadway segments.
3
57
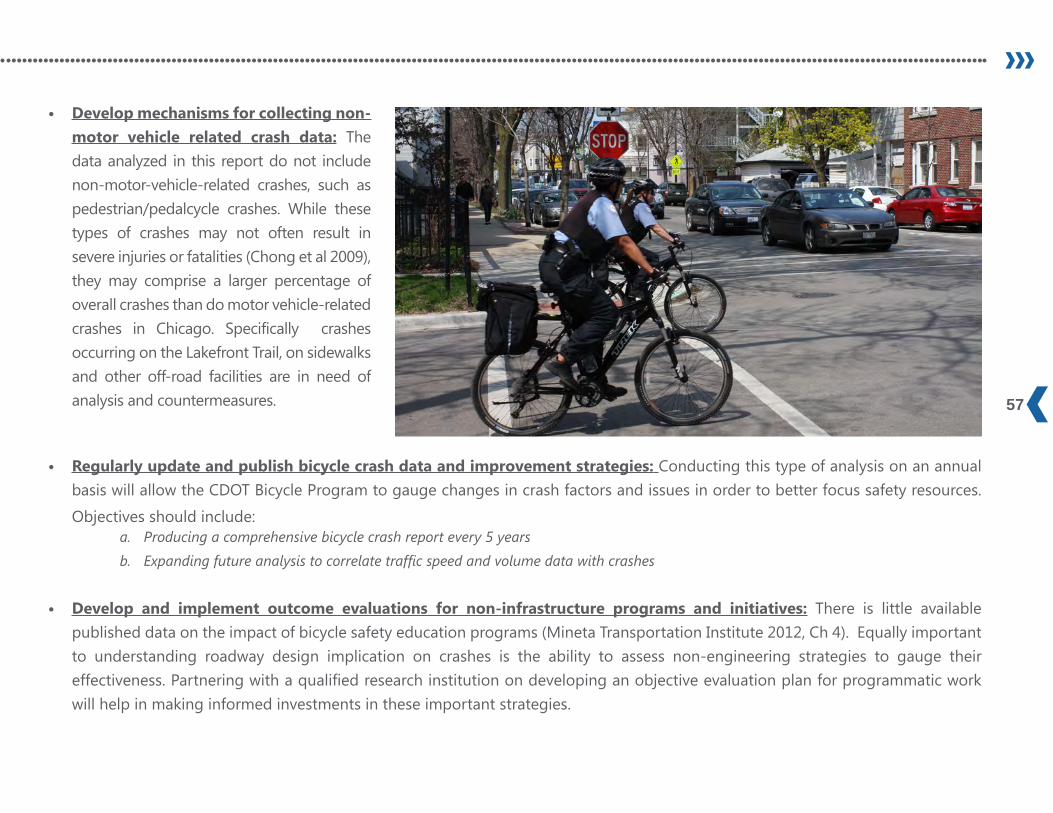
• Develop mechanisms for collecting non-motor vehicle related crash data: The data analyzed in this report do not include non-motor-vehicle-related crashes, such as pedestrian/pedalcycle crashes. While these types of crashes may not often result in severe injuries or fatalities (Chong et al 2009), they may comprise a larger percentage of overall crashes than do motor vehicle-related crashes in Chicago. Specifically crashes occurring on the Lakefront Trail, on sidewalks and other off-road facilities are in need of analysis and countermeasures.
• Regularly update and publish bicycle crash data and improvement strategies: Conducting this type of analysis on an annual basis will allow the CDOT Bicycle Program to gauge changes in crash factors and issues in order to better focus safety resources.
Objectives should include: a. Producing a comprehensive bicycle crash report every 5 years
b. Expanding future analysis to correlate traffic speed and volume data with crashes
• Develop and implement outcome evaluations for non-infrastructure programs and initiatives: There is little available published data on the impact of bicycle safety education programs (Mineta Transportation Institute 2012, Ch 4). Equally important to understanding roadway design implication on crashes is the ability to assess non-engineering strategies to gauge their effectiveness. Partnering with a qualified research institution on developing an objective evaluation plan for programmatic work will help in making informed investments in these important strategies.
Crash reduction strategiesSu
mm
ary
Repo
rt
58
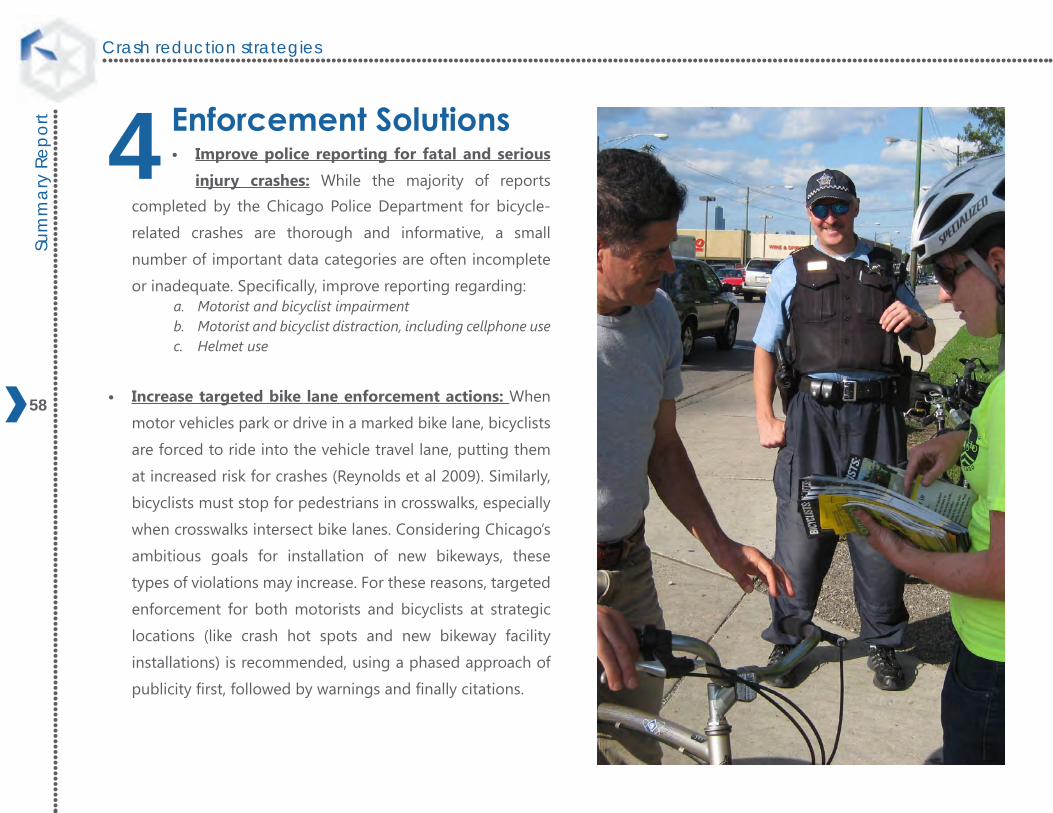
4 Enforcement Solutions• Improve police reporting for fatal and serious
injury crashes: While the majority of reports completed by the Chicago Police Department for bicycle-
related crashes are thorough and informative, a small
number of important data categories are often incomplete
or inadequate. Specifically, improve reporting regarding:a. Motorist and bicyclist impairmentb. Motorist and bicyclist distraction, including cellphone usec. Helmet use
• Increase targeted bike lane enforcement actions: When
motor vehicles park or drive in a marked bike lane, bicyclists
are forced to ride into the vehicle travel lane, putting them
at increased risk for crashes (Reynolds et al 2009). Similarly,
bicyclists must stop for pedestrians in crosswalks, especially
when crosswalks intersect bike lanes. Considering Chicago’s
ambitious goals for installation of new bikeways, these
types of violations may increase. For these reasons, targeted
enforcement for both motorists and bicyclists at strategic
locations (like crash hot spots and new bikeway facility
installations) is recommended, using a phased approach of
publicity first, followed by warnings and finally citations.
59
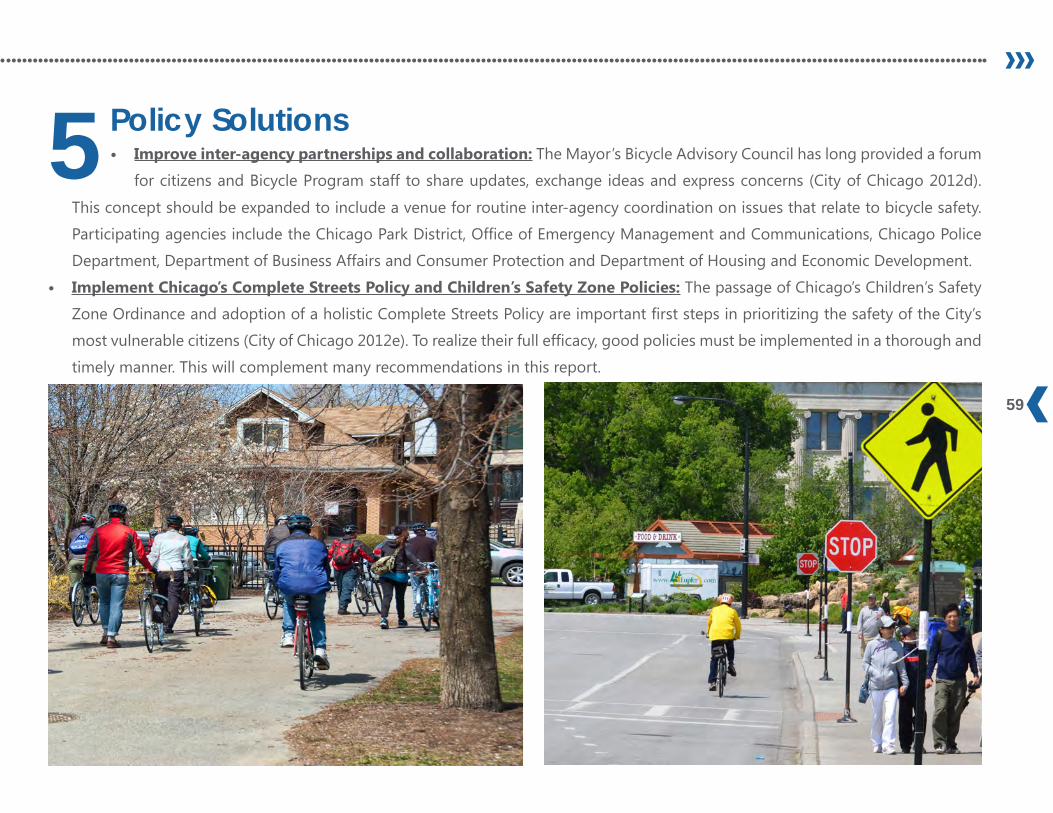
• Improve inter-agency partnerships and collaboration: The Mayor’s Bicycle Advisory Council has long provided a forum
for citizens and Bicycle Program staff to share updates, exchange ideas and express concerns (City of Chicago 2012d). 5Policy Solutions
This concept should be expanded to include a venue for routine inter-agency coordination on issues that relate to bicycle safety.
Participating agencies include the Chicago Park District, Office of Emergency Management and Communications, Chicago Police
Department, Department of Business Affairs and Consumer Protection and Department of Housing and Economic Development.
• Implement Chicago’s Complete Streets Policy and Children’s Safety Zone Policies: The passage of Chicago’s Children’s Safety
Zone Ordinance and adoption of a holistic Complete Streets Policy are important first steps in prioritizing the safety of the City’s
most vulnerable citizens (City of Chicago 2012e). To realize their full efficacy, good policies must be implemented in a thorough and
timely manner. This will complement many recommendations in this report.
Crash reduction strategiesSu
mm
ary
Repo
rt
60
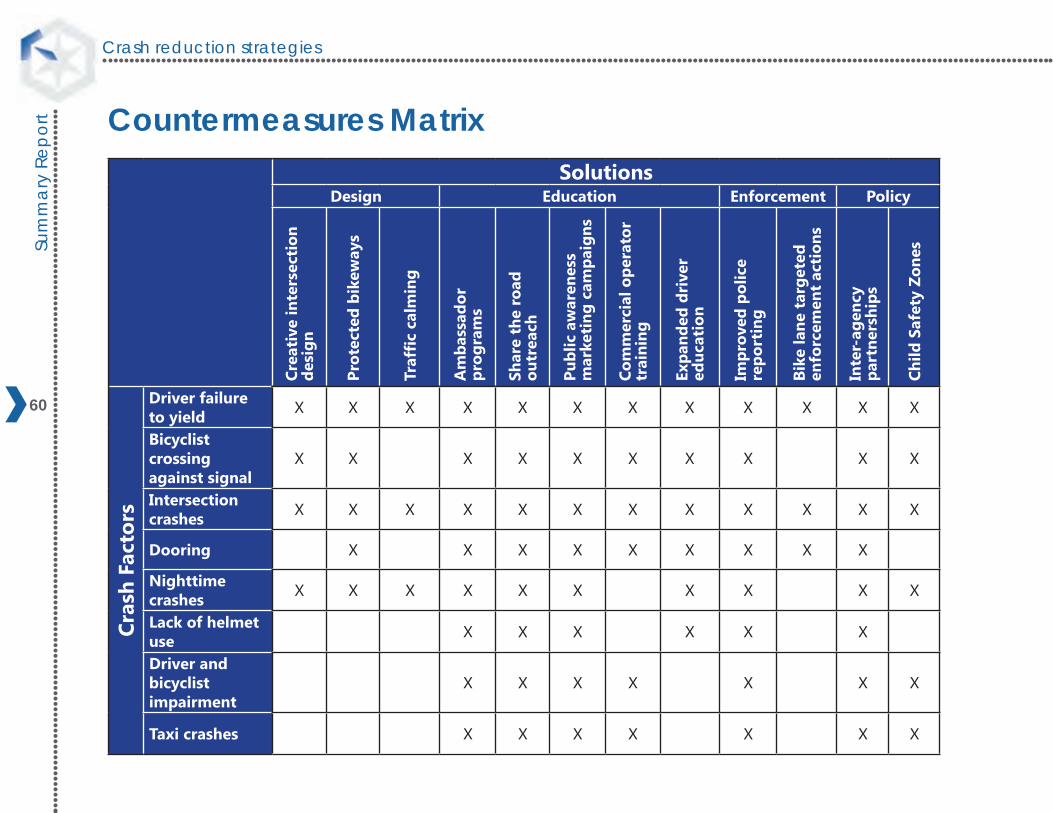
Countermeasures MatrixSolutions
Design Education Enforcement Policy
Crea
tive
inte
rsec
tion
de
sign
Prot
ecte
d bi
kew
ays
Traf
fic
calm
ing
Am
bass
ador
pr
ogra
ms
Shar
e th
e ro
ad
outr
each
Publ
ic a
war
enes
s m
arke
ting
cam
paig
ns
Com
mer
cial
ope
rato
r tr
aini
ng
Expa
nded
dri
ver
educ
atio
n
Impr
oved
pol
ice
repo
rtin
g
Bike
lane
tar
gete
d en
forc
emen
t ac
tion
s
Inte
r-ag
ency
pa
rtne
rshi
ps
Child
Saf
ety
Zone
s
Cras
h Fa
ctor
s
Driver failure to yield X X X X X X X X X X X X
Bicyclist crossing against signal
X X X X X X X X X X
Intersection crashes X X X X X X X X X X X X
Dooring X X X X X X X X X
Nighttime crashes X X X X X X X X X X
Lack of helmet use X X X X X X
Driver and bicyclist impairment
X X X X X X X
Taxi crashes X X X X X X X
61
ACKNOWLEDGMENTSCHICAGO DEPARTMENT OF TRANSPORTATIONLuann Hamilton, Deputy CommissionerBen Gomberg, Bicycle Program CoordinatorCharlie Short, Bicycling Safety and Education ManagerMike Amsden, AICP, Bikeways ProgramCarlin Thomas, Share the Road Coordinator
UNIVERSITY OF ILLINOIS AT CHICAGOPiyushimita (Vonu) Thakuriah, Professor Department of Urban Planning and PolicyDr. Siim Soot, Executive Director (Retired) Urban Transportation CenterLu Gan, Graduate Research Assistant
ACTIVE TRANSPORTATION ALLIANCEMelody Geraci, Deputy Executive DirectorAmanda Woodall, Policy ManagerPaul Halupka, Graphic Design ManagerPatrick Knapp, PlannerBrandon Whyte, Planning Intern
The authors would like to thank the following individuals and agencies for their valuable contributions to this report:
This report was made possible through a grant by the Illinois Department of Transportation
OTHER CONTRIBUTORSLori Midden, Illinois Department of TransportationParry Frank, Chicago Metropolitan Agency for PlanningTracie Smith, Children’s Memorial Hospital, ChicagoChrystal Price, American College of Surgeons William Vassilakis, formerly at the University of Illinois at Chicago Dr. Caitlin Cottrill, Postdoctoral Research Associate at Massachusetts Institute of Technology
Sum
mar
y Re
port
62
REFERENCESBandura, Albert. 2004. Health Promotion by Social Cognitive Means.
Health Education & Behavior, Vol. 31 (2): 143-164 (April 2004).
City of Chicago. 2012a. Chicago Department of Transportation: Chicago Bicycle Program. http://www.chicagobikes.org/ (accessed August 22, 2012).
---. 2012b. Chicago Department of Transportation: Chicago Bicycle Program. Bicycle Counts. http://www.chicagobikes.org/public/bikecounts.php (accessed August 22, 2012).
---. 2012c. Chicago Pedestrian Safety Campaign. About the Campaign. http://chicagopedsafety.org/aboutcampaign
(accessed August 23, 2012).
---. 2012d. Bike Plan 2015 City of Chicago. Mayor’s Bicycle Advisory Council. http://www.bike2015plan.org/mbac/index.html (accessed August 23, 2012).
---. 2012e. Office of the City Clerk: Legislative Information Center. Establishment of Children’s Safety Zones program. http://chicago.legistar.com/Legislation.aspx (accessed August 21, 2012)
Chicago Public Schools. 2011. Driver Education. http://www.cps.edu/Programs/Before_and_after_school/Pages/DriverEducation.aspx (accessed August 23, 2012).
Chong, Shanley, Roslyn Poulos, Jake Olivier, Wendy L. Watson and Raphael Grzebieta. 2010. Relative injury severity among vulnerable non-motorized road users: Comparative analysis of injury arising from bicycle–motor vehicle and bicycle–pedestrian collisions. Accident Analysis and Prevention 42 (2010) 290–296.
Ewing, Reid and Eric Dumbaugh. 2009. The Built Environment and Traffic Safety: A Review of Empirical Evidence. Journal of Planning Literature. Volume 23 Number 4 May 2009 347-367.
Federal Highway Administration. 2006. BIKESAFE: Bicycle Countermeasure Selection System. What is BIKESAFE. http://www.bicyclinginfo.org/bikesafe/ (accessed August 22, 2012).
Forsyth, Ann and Kevin Krizek. 2010. Promoting Walking and Bicycling: Assessing the Evidence to Assist Planners. Built Environment. Vol 36 No 4. (2010) 429-446.
Garder, P. E. 2004. The impact of speed and other variables on pedestrian safety in Maine. Accident Analysis and Prevention 36 (4): 533-42.
Illinois Driving School. 2012. Illinois Driving School: Classes. http://www.illinoisdriversed.com/index.htm (accessed August 23, 2012).
Jacobsen, P.L. Safety in numbers: more walkers and bicyclists, safer walking and bicycling. 2003. Injury Prevention. 9:205-209.
Klop, Jeremy and Asad Khattak. 1999. Factors Influencing Bicycle Crash Severity On Two-Lane Undivided Roadways In North Carolina. Washington D.C.: Transportation Research Board 78th Annual Meeting.
Marshall, Wesley E. and Norman W. Garrick. 2011. Evidence on Why Bike-Friendly Cities Are Safer for All Road Users. Environmental Practice. 13 (1) March 2011.
Mineta Transportation Institute. 2012. Report 11-08: Promoting Bicycle Commuter Safety. San Jose, CA: San Jose State University.
63
National Association of City Transportation Officials. 2011. Urban Bikeway Design Guide. April 2011 Edition. http://nacto.org/print-guide/ (accessed August 21, 2012).
Reynolds, Conor CO, M Anne Harris, Kay Teschke, Peter A Cripton and Meghan Winters. 2009. The impact of transportation infrastructure on bicycling injuries and crashes: a review of the literature. Environmental Health. 8:47.
Summala, Heikki, Eero Pasanen, Mikko Rasanen and Jukka Sievanen. 1996. Bicycle Accidents and Drivers’ Visual Search at Left and Right Turns. Accident Analysis and Prevention. Vol. 28, No. 2, pp. 147- 153, 1996.
SWOV. 2010. SWOV Institute for Road Safety Research. SWOV Fact Sheet: Bicycle facilities on distributor roads. Leidschendam, the Netherlands: December 2010. http://www.swov.nl/rapport/Factsheets/UK/FS_Bicycle_facilities.pdf (accessed August 22, 2012).
Transportation Alternatives. 2012. Biking Rules: A New Street Code for NYC Cyclists. http://bikingrules.org/ (accessed August 28, 2012).
Zegeer, C. V., C. Seiderman, P. Lagerwey, M. Cynecki, M. Ronkin and R. Schnieder. 2002a. Pedestrian facilities users guide—Providing safety and mobility. Report No. FHWA-RD-102-01. Washington, DC: Federal Highway Administration.