Embed Size (px)
Citation preview

AUSTRALIA'SENVIRONMENTSUMMARY REPORT
2019

The national Environmental Condition Score was at its lowest since at least 2000, decreasing 2.3 points out of ten to a score of 0.8. Scores declined in all states and territories.
The poorest conditions occurred in NT, NSW and WA. In all cases this was due to dry and hot conditions. The largest decline occurred in WA. Relatively less adverse conditions prevailed in Queensland and Tasmania.
The Environmental Condition Score is a score between 0 and 10 expressing condition relative to previous years. It is calculated as the average rankings of component scores (from top to bottom in the bar graph): inundation, streamflow (blue), vegetation growth, leaf area, soil protection, tree cover (green) and the number of hot days (orange).
SUMMARY INDICATORS
Extremely hot and dry weather in 2019 created the worst drought and fire conditions in many decades. Overall environmental condition was the poorest since at least 2000 and below- average in all states and territories.
11
National ECS and its components for 2000–2019 ECS by State and Territory and change fromthe previous year
NATIONALENVIRONMENTINDICATORSATAGLANCE
Numbers represent the relative change from 2000-2018 average conditions.
Such a change can be part of a long-term trend or be within normal variability.
Details on each of the indicators shown are provided in this report.
2 AUSTRALIA’S ENVIRONMENT IN 2019 SUMMARY REPORT

GLOBAL CHANGE
Global warming continued apace.The ozone hole was unusuallysmall.
OCEANS
No marine heat waves occurred, but the Great Barrier Reef remained in poor condition.
Oceans absorb 93% of excess heat from climate change, and global ocean temperature continued to rise. A new record was set, continuing a steady rising trend.
Global sea level continued to rise steadily by 6.2 mm, marking an increase of 72 mm since 2000 and 95 mm since 1993.
Sea level around Australia has been rising faster than the global average. The fastest rate of rise was in the Tasman Sea, which has risen by more than 150 mm since 1992.
Australian ocean surface temperature was lower than the previous year. Mean temperature was 0.09°C below the 2000–2018 average, but 0.32°C above the 1961-1990 average.
No marine heatwaves occurred, but it was the third-warmest year on record in the Tasman Sea. Cool sea temperatures prevailed northwest of Australia from June onwards, corresponding to a strong positive Indian Ocean Dipole.
The Great Barrier Reef remains in poor condition. No marine heatwaves of mass bleaching occurred, but health was poor in the northern reef and deteriorated in the central and southern reef with continuing Crown-of-Thorns starfish outbreaks.
Australian region sea surface temperature anomalyrelative to 1961-1990 (NOAA / BOM)
Maximum daily ozone hole area (NASA)
Atmospheric CO2 continued to increase rapidly by 2.5 ppm, 14% slower than the previous year but 12% faster than the average 2000–2018 rate. Average CO2
concentration reached 411 ppm; a 30% increase from 1960.
Global air temperatures continued to be high: 2019 was 0.81°C above the 1961-1990 mean and the second highest in the historical record.
The ozone hole shrunk. Maximum extent was 58% smaller than the previous year due to an unusual polar air circulation pattern.
Sea ice extent continued to decline. Ice extent on both hemispheres was the lowest since 1978. Their combined extent was 7% lower than the 2000–2018 average.
3

Australia’s population continued to grow rapidly. Population reached 25.5 million, 17% above the 2000–2018 average.
Population growth slowed down slightly in 2019. The population grew by 365,000; somewhat less than the previous three years. The increase remained driven by net immigration.
Demand for space and materials fell. The number of building approvals fell for the fourth year in a row.
Greenhouse gas emissions remained high, decreasing only 0.1% from the previous year. They were 5% above the 2000–2018 average.
Emissions decreased due to floods and drought in agriculture (-5.9% from the previous year) and due cleaner technologies in electricity generation (-1.2%) and transport (-0.5%). These reductions were offset by increases from fugitives (+4.4%),
direct combustion (+3.6%) and industry (+0.6%), mostly from oil, gas and mining.
According to Government statistics, new forests exceeded forest removals, resulting in a net uptake of 19 Mt CO2-eq. However, this number only accounts for a small part of the landscape carbon balance, and does not include large emissions from vegetation decline and bushfires.
Emissions per person fell slightly: 1.6% lower than the previous yearand 11% below the 2000–2018 average. Per capita emissions remained among the highest in the world, at 20.8 t CO2-eq in 2019; greater than for the US (1.2 times), EU (2.5 times) and world-average (3.3 times). Reasons include the high per-capita energy use, the use of polluting coal, and high non-CO2 emissions.
PEOPLE
Australia’s population continued to grow steadily and with it, the use of natural resources and environmental pollution grew.
Greenhouse gas emissions per Australian by category (ex. land cover change) (DAWE)
4 AUSTRALIA’S ENVIRONMENT IN2019 SUMMARY REPORT
2019 recorded the lowest rainfall in 119 years. Average rainfall was 229 mm: below average for a second year, 29% less than the previous year, and 40% below the 2000–2018 average.
Rainfall was extremely low in northeast NSW and southeast Queensland and in most of the arid inland, further deepening drought conditions. Above-average rainfall occurred in parts of northern Queensland and western Tasmania.
It was also the hottest year on record: 0.85°C above the 2000–2018 average and 1.52°C above the 1961-1990 average.
Maximum temperatures were very high: the average maximum temperature was 43.6 °C or 1.83 °C above the 2000–2018 average.
Many monthly heat records were broken. March and December were especially hot, but unseasonably warm conditions occurred throughout the year, contributing to extended fire seasons.
The number of days exceeding 35°C was the highest on record. Nationally there were an average 106 hot days: 36% or 28 days more than the 2000–2018 average.
Nights were cooler than the previous year because of dry soils and clear skies. However, national average minimum temperature was still 2.24°C above the 2000–2018 average.
Some inland regions had unusually frosty nights, including northern Queensland and the SA-Victoria border region.
Snow cover was below average, but 19% more than the previous year. Unseasonal snow occurred in November in Tasmania.
Dust and smoke caused major air quality problems, especially in NSW and the ACT in December. Air pollution reached unhealthy levels for 14-32 days along the NSW coast, the worst conditions since at least 2000.
WEATHER
The year was extremely dry and extremely hot.
Annual rainfall across Australia
Rank of 2019 rainfall by local government area
Average number of days with PM2.5
exceeding the health threshold at six NSW coastal stations (NSW DPIE)
5
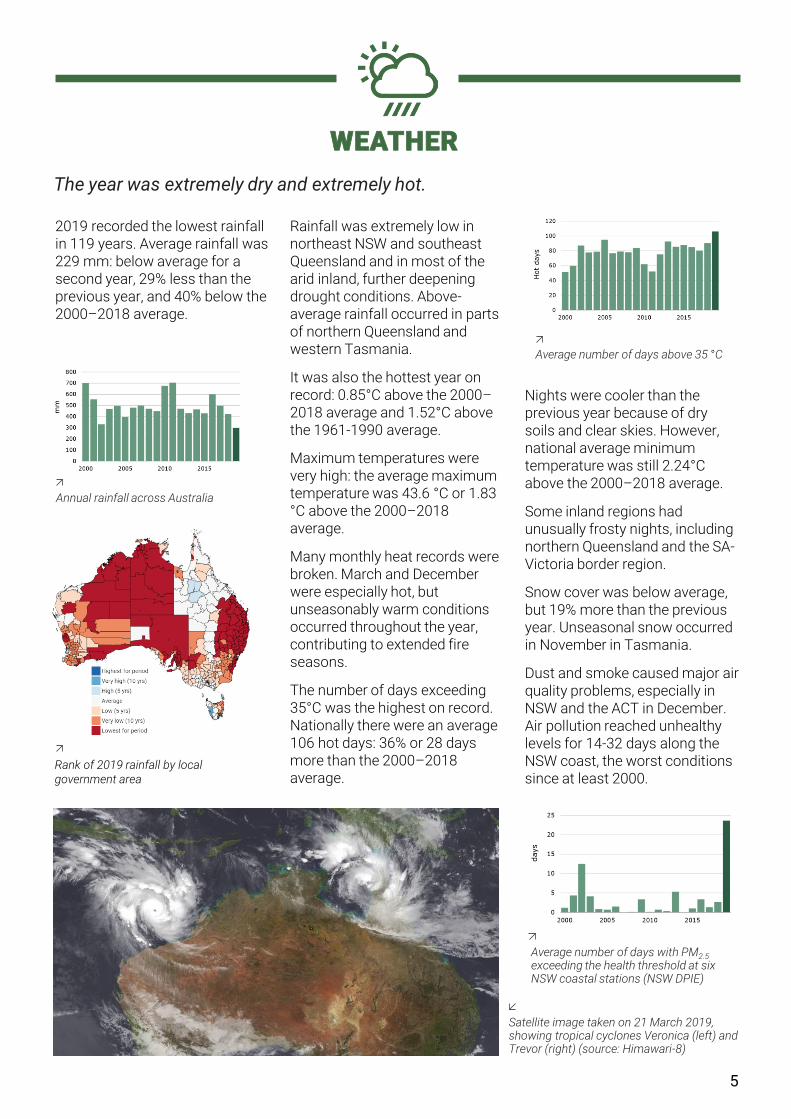
Satellite image taken on 21 March 2019, showing tropical cyclones Veronica (left) and Trevor (right) (source: Himawari-8)
Average number of days above 35 °C

FIRE
Fire activity was low in northern Australia but unprecedented in southeast Australia.
6 AUSTRALIA’S ENVIRONMENT IN 2019 SUMMARY REPORT
Closed forests Open forests and woodlands
Shrub-, heath- and grasslands Cleared and modified vegetation
Percentage area burnt by major vegetation type
2019 was a year of unpreceden-ted forest fires. Many fire emergencies occurred during the year.
During the 2018/19 fire season, large fires occurred in January in Tasmania, and from January to March in Victoria.
The 2019/2020 season started in early September with major fires in Queensland and northern NSW. Significant bushfires started in November in SA and in December in Tasmania and Victoria.
National fire activity was close to average: 10% below 2000–2018 average and 14% greater than the previous year.
The total area burnt was 26 Mha; 42% below 2000–2018 average values and 46% lower than the previous year.
However, there were large regional differences: fire activity and burn extent were below or average across most of the inland due to low fuel loads, but the highest since at least 2000 in Tasmania, along most of the East Coast and in parts of WA.
Australia’s wet forests were impacted heavily. An unprece-dented 8.7% or 0.59 Mha of closed forests was burnt, not including further bushfires in early 2020 NSW, Victoria and ACT.
NSW and Tasmania experienced extensive fires. Burn extent in NSW was 2.4 times higher than the 2000–2018 average, and 3.8 times higher in Tasmania.
Unusually dry fuel and hot weather explain high fire activity in southeast Australia.
Nationally, fuel was the driest since at least 2000 due to low fuel cover as well as low moisture content.
Total fire carbon emissions were above average at 182 Mt carbon; 24% more than the 2000–2018 average and 14% more than in the previous year.
Unusually, most emissions were from forest fires. Carbon emissions were the highest recorded in NSW and Tasmania.
Fire carbon emissions by bioregion

National river inflows were very low at 52 mm or 407,000 GL; 43% below the 2000–2018 average and 22% less than in 2018.
Extremely low river flows occurred in catchments in the Darling Basin, along the Southeast Coast and in the Timor Sea Basin.
The combination of negligible inflows, algal blooms and a sudden change to cooler weather caused mass fish kills in the Darling system.
River flows were well above average along the northern Queensland coast, and around Karratha in WA and Strahan in Tasmania.
Major floods occurred from Townsville through to the Gulf of Carpentaria due to persistent heavy rainfall in January and February. An estimated 600,000 cattle perished.
Further cyclone-related flooding occurred in March around Karratha and Port Hedland and in the Channel Country and surrounding regions.
Storage in the major irrigation reservoirs declined: combined storage in the five largest storages in the Murray-Darling Basin storage fell from 47% to 35% of capacity, and Ord Reservoir storage fell from 61% to 34% of capacity.
Urban water supplies declined for many cities, including Sydney (28% less than the previous year),
Brisbane (-25%), Canberra (-26%). Several smaller towns in the Darling Basin ran out of regular water supplies entirely.
The extent of wetland flooding was low. Total inundation fell for a third year, to the smallest area since 2002, or 26% below the 2000–2018 average.
Wetland extent was the lowest since at least 2000 in many catchments, including much of WA, Northern Australia and the Murray-Darling Basin.
Conditions were normal in the Lake Eyre Basin and above average in northern Queensland and western Tasmania.
WATER
River flows were very low, with few flood events, declining water storages and drying wetlands.
7
Rank of 2019 streamflow by catchment Annual inundated area

Soils were extremely dry. Nationally, top 6m moisture availability fell by 30 mm to the lowest value since at least 2000: 11% less than the previous year and 11% below the 2000–2018 average.
Soil moisture declined nearly everywhere, with the sharpest declines in northeast NSW and the Kimberley. Soil moisture increased in parts of Queensland and central NSW.
Soils across southeast Australia dried up rapidly after July, due to unusually dry and warm conditions in winter and spring.
Northern Australia experienced unusually dry conditions due to a weak 2018/19 monsoon and late arrival of 2019/20 monsoon.
Northern Queensland experienced above-average soil moisture conditions due to high rainfall in February-March.
Soil protection by vegetation and leaf litter deteriorated across most of Australia and fell to levels not seen since 2000. Soil exposure was 10% greater than the previous year and 13% greater than the 2000–2018 average.
Extremely poor soil protection occurred in inland Australia; with the worst conditions since at least 2000 in most of NSW, southern Queensland and northwest Australia.
Exposed and dry soils caused several dust storms, in February in southeast Australia, April in SA, May in Victoria and November in NSW.
SOILS
Soil moisture reached extremely low values in the southeast, and poor soil conditions contributed to dust storms.
National average soil moisture content.
Soil moisture changes on the Southeast Coast compared to the previous year.
8 AUSTRALIA’S ENVIRONMENT IN 2019 SUMMARY REPORT
Satellite image of dust storms on 13 February 2019, also showing flooding in the Gulf of Carpentaria (source: Himawari-8)
Rank of soil exposure by Natural Resources Management region.

National vegetation condition was the poorest since 2002: 7% lower than the previous year and 10% below the 2000–2018 average.
Vegetation condition was poorest since at least 2000 in northeast NSW, southeast Queensland and across much of the arid interior.
Vegetation growth rates, estimated from weather and satellite data, were the lowest since 2002. Nationally, growth was 10% less than the previous year and 17% below the 2000–2018 average. Growth conditions were good in the northernmost parts of Northern Australia.
Farming conditions improved slightly compared to the previous year due to improved conditions in Victoria. However, vegetation productivity remained below average 2000–2018 levels in grazing (-32%), irrigation (-28%) and dryland cropping (-24%).
Growth was also below average in native and plantation forestry (-12%) and natural environments (-19%).
Drought and fire reduced tree cover across much of the country. Tree cover, the canopy fraction of vegetation >2 m tall, declined for a second year, falling 13% or 8 Mha from 2018, to 8% below the 2000–2018 average.
The largest tree cover losses occurred in the NSW-Queensland border region. Losses were greatest in natural environments (4.0 Mha) and on grazing land (3.3 Mha).
Bushfires affected large areas of closed forest in NSW. Vulnerable vegetation types affected by the fires in 2019 and January 2020 included 35% of all rainforests, 41% of wet sclerophyll forests and 53% of heathlands.
VEGETATION
Vegetation condition was poor for a second year, along with below-average farming conditions and tree cover.
National leaf area index
National vegetation carbon uptake
National woody vegetation cover faction
9
Change in tree cover percentage from previous year by bioregion.

Another 40 species were added to Threatened Species List, representing a 2% increase from the previous year and a 36% increase from 2000.
A total of 1890 species is now listed. Conservation advice has been issued for 97% and recovery plans for 41% of species.
Nine species were down-listed, 33 added, seven up-listed and two declared extinct: the Bramble Cay Melomys and the WA flower Myriocephalus nudus.
The total number of species declared extinct rose to 91. Half of the six species extinctions recognised since 2000 occurred in the last two years.
Arid zone bird species such as the Crimson Chat migrated
towards the Victorian coast in response to inland drought.
Spectacled flying foxes are an indicator of the condition of species vulnerable to heat stress. Populations declined 10% from previous year to around 47 thousand, down from an average 100 thousand before 2016.
Waterbird numbers showed a small increase from the previous year but remained lower than the long-term average. Breeding was concentrated at one site and species. Several significant wetlands in the Darling Basin were dry, including the Macquarie Marshes which was also impacted by fire.
Extensive bushfires in NSW in late 2019 and early 2020 impacted on biodiversity.
The bushfires killed an estimated 1 billion vertebrates and increased threat level for several species.
The fires burnt through more than 30% of the habitat of 191 species, among which many freshwater species.
Wet forest flora were especially impacted, but rare Wollemi pine and Nightcap Oak were spared.
BIODIVERSITY
Biodiversity continued to decline, with fire, drought and heat all impacting on ecosystems.
Bramble Cay Melomys, the first species declared extinct due to climate change
The last Wollemi pines in the wild survivedbushfires in the Blue Mountains Area
Crimson Chat, a nomadic desert species observed migrating from its arid inland range
10 AUSTRALIA’S ENVIRONMENT IN 2019 SUMMARY REPORT
Number of species on Threatened Species List (DAWE)
Number of spectacled flying foxes (CSIRO)
Types of species for which more than 30% of habitat was burnt (DAWE)
Blue Mountains Water Skink, one of many species severely impacted by the bushfires

11
The annual Australia’s Environment Reportsummarises a large amount of observations on thetrajectory of our natural resources and ecosystems.
On the website you can find a national summary report, as well as report cards for different types of administrative and geographical regions.
In the accompanying data explorer, the spatial data can be viewed as maps, accounts or charts by region and land use type, and downloaded for further use.
Acknowledgements
Australia's Environment Report is fully funded by The Australian National University.
Production was possible thanks to the National Computational Infrastructure (NCI) and data published by Geoscience Australia, Bureau of Meteorology, European Centre for Medium-Range Weather Forecasts, NASA, Japan Meteorological Agency, US National Oceanic and Atmospheric Administration, US National Snow and Ice Data Center, Australian Bureau of Statistics, Commonwealth Department of Environment and Energy, CSIRO, NSW Department of Planning, Industry and Environment, Atlas of Living Australia, Terrestrial Ecosystem Research Network, and Australian Bureau of Agricultural and Resource Economics.
About This Report About The Data
Measures of the condition of natural resources and ecosystems were derived from several spatial data sources.
Weather data was derived by combining station satellite and weather forecast model data. Data on land cover, inundation, fire, soil condition and vegetation leaf area were derived by automated interpretation of satellite imagery.
The other indicators were estimated by combining the weather and satellite data in ANU's environmental data assimilation system, OzWALD.
For further details on data and methods or to download any of the data shown here visit the web site (www.ausenv.online).
Images: Hanwood Rural Fire Brigade, Matt Herbert, SBS (front), NASA (p3), Getty Images (p4), NSW Rural Fire Service (p6), Cameron Parker (p7), Matt Herbert (p8), Cameron De Jong, David Tytherleigh, Stephen Mahoney, NSW Department of Planning, Industry and Environment (p10), Darcy Grant (p11)

C : prof. Albert Van Dijk
T : 02 612 52197
Centre for Water and Landscape DynamicsFenner School of Environment & Society
The Centre for Water and LandscapeDynamics develops new methods tomeasure, monitor and forecast climate,water availability and landscape conditions.Our solutions often combine large amountsof data from satellites and sensor networkswith field research, biophysical modellingand machine learning.
Our focus areas are extreme weather,bushfires, water resources, agriculture,forestry and our natural environment. Ouractivities span education and training,research, and developing practical solutions to help make decisions. Among others, we develop innovative web-based platforms to help you find, explore and interpret environmental information derived from satellites and on-ground networks.
About Us
For details on the environmentalcondition of any region within Australia,
visit www.ausenv.online