Embed Size (px)
Citation preview
SUMMARY REPORT
TRUST BOARD 1 March 2018 Agenda Number: 07
Title of Report Integrated Performance Report
Accountable Officer Executive Directors
Author(s) Jo Davis, Associate Director Commissioning & Performance
Richard Johnson, Head of Quality & Safety Compliance
Graeme Booth, Financial Planning Manager
Ruth Bardell, Deputy Director of HR & OD
Claire Florey, Access and Performance Manager
Judith Laity Strategy Programme Manager
Purpose of Report The objective of this report is to provide the Board with the Trust’s performance against key targets and draw attention to those areas under review by the Executive Team. The IPR includes performance against key national and local quality, operational, finance and workforce targets.
Recommendation The Board is recommended to:
Receive the report
Consultation Undertaken to Date
Nil.
Signed off by Executive Owner
Director of HR & OD, Director of Strategy & Business Development, Medical Director, Chief Operating Officer, Chief Nurse, Joint Chief Financial Officer
January 2018
Reviewed by Executive Team ‐ ‐
Reviewed by Board Committee (where applicable)
‐ ‐
Reviewed by Trust Board (where applicable)
The Trust Board receive the IPR at every meeting
Monthly
Date(s) at which previously discussed by Trust Board / Committee
Nil.
Next Steps The Board will continue to be updated on Trust performance via the monthly Integrated Performance Report.
Executive Summary
The Integrated Performance Report highlights the key performance issues related to:
Quality;
Key Operational Standards;
Finance;
2
Our People;
Partnerships.
The Executive Summary on page 2 of the report provides a summary of the data for January 2017 and commentary on the wider aspects of our performance for the year thus far.
Financial Risks The report summarises the financial risks for the Trust.
Key Risks The Integrated Performance Report sets out mitigating actions in respect of most principal risks in the Board Assurance Framework
Disclosure Statement Performance data is held by the Trust and is used to produce the Integrated Performance Report. Audits have not identified data quality issues.
Equality and
Diversity Statement
There are no performance metrics relating specifically to Equality and Diversity in this report.
SUMMARY INTEGRATED PERFORMANCE REPORT
January 2018
EXECUTIVE SUMMARY
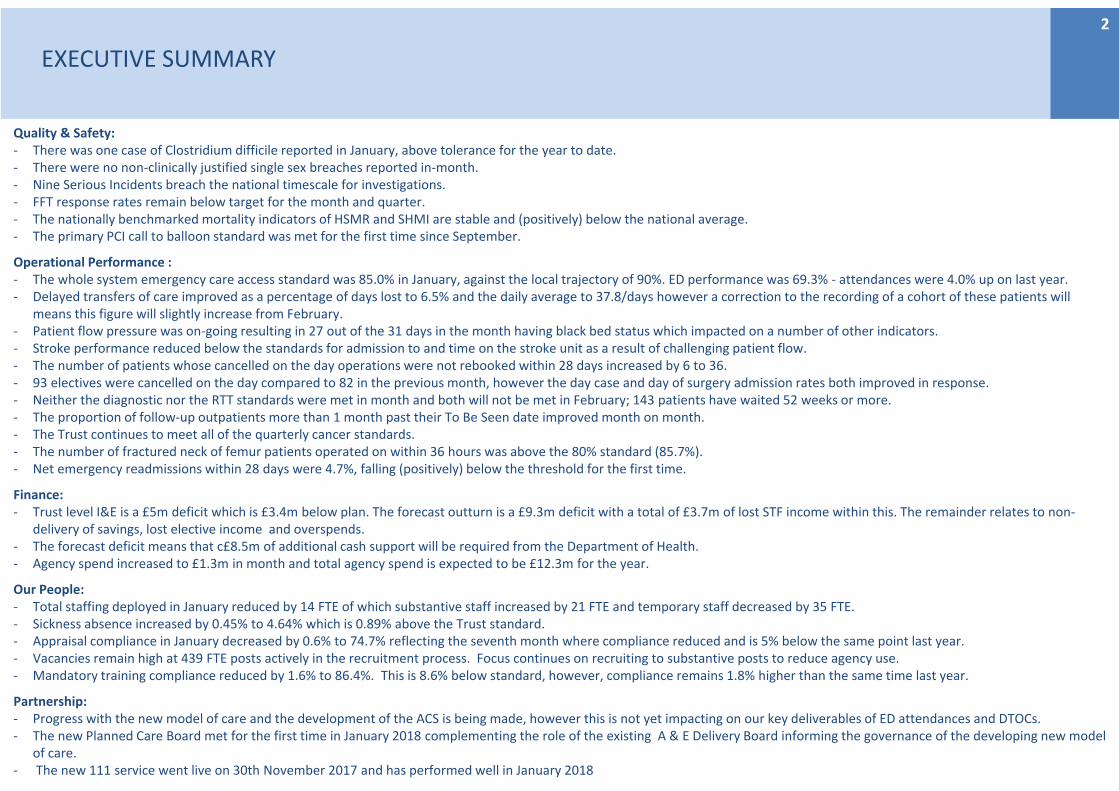
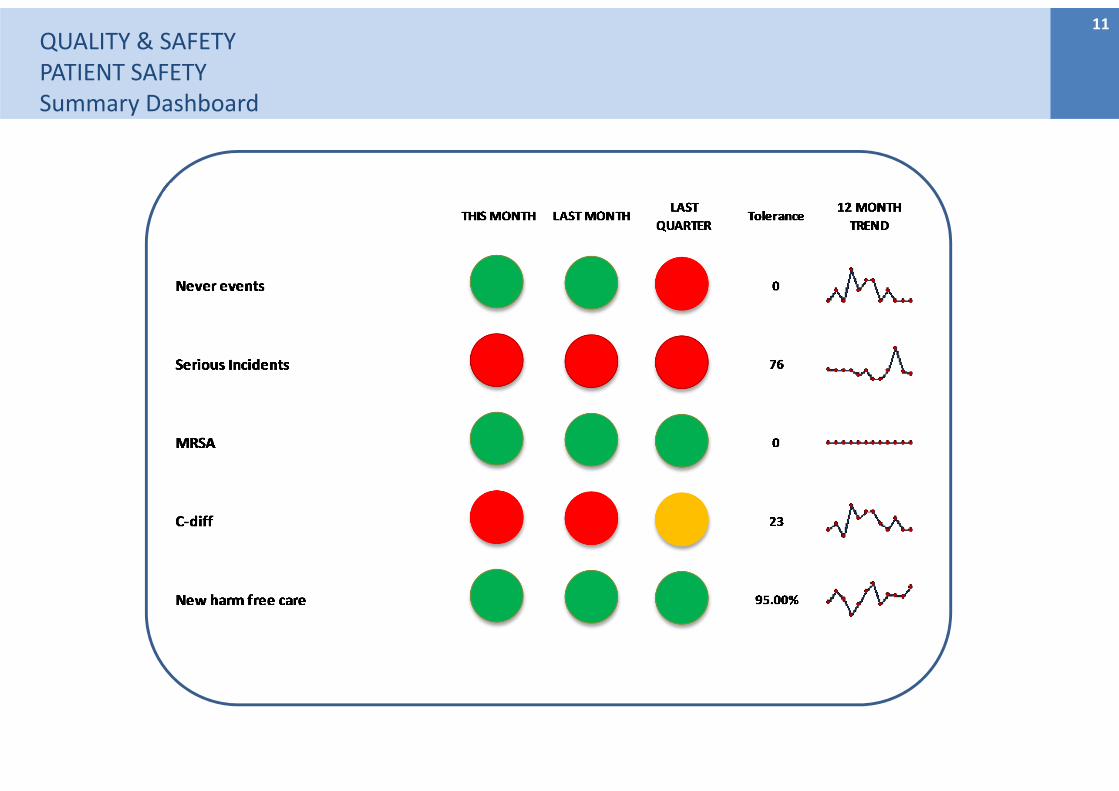
Quality & Safety:‐ There was one case of Clostridium difficile reported in January, above tolerance for the year to date. ‐ There were no non‐clinically justified single sex breaches reported in‐month.‐ Nine Serious Incidents breach the national timescale for investigations. ‐ FFT response rates remain below target for the month and quarter. ‐ The nationally benchmarked mortality indicators of HSMR and SHMI are stable and (positively) below the national average.‐ The primary PCI call to balloon standard was met for the first time since September.
Operational Performance : ‐ The whole system emergency care access standard was 85.0% in January, against the local trajectory of 90%. ED performance was 69.3% ‐ attendances were 4.0% up on last year.‐ Delayed transfers of care improved as a percentage of days lost to 6.5% and the daily average to 37.8/days however a correction to the recording of a cohort of these patients will
means this figure will slightly increase from February.‐ Patient flow pressure was on‐going resulting in 27 out of the 31 days in the month having black bed status which impacted on a number of other indicators.‐ Stroke performance reduced below the standards for admission to and time on the stroke unit as a result of challenging patient flow.‐ The number of patients whose cancelled on the day operations were not rebooked within 28 days increased by 6 to 36.‐ 93 electives were cancelled on the day compared to 82 in the previous month, however the day case and day of surgery admission rates both improved in response.‐ Neither the diagnostic nor the RTT standards were met in month and both will not be met in February; 143 patients have waited 52 weeks or more.‐ The proportion of follow‐up outpatients more than 1 month past their To Be Seen date improved month on month.‐ The Trust continues to meet all of the quarterly cancer standards.‐ The number of fractured neck of femur patients operated on within 36 hours was above the 80% standard (85.7%).‐ Net emergency readmissions within 28 days were 4.7%, falling (positively) below the threshold for the first time.
Finance: ‐ Trust level I&E is a £5m deficit which is £3.4m below plan. The forecast outturn is a £9.3m deficit with a total of £3.7m of lost STF income within this. The remainder relates to non‐
delivery of savings, lost elective income and overspends.‐ The forecast deficit means that c£8.5m of additional cash support will be required from the Department of Health.‐ Agency spend increased to £1.3m in month and total agency spend is expected to be £12.3m for the year.
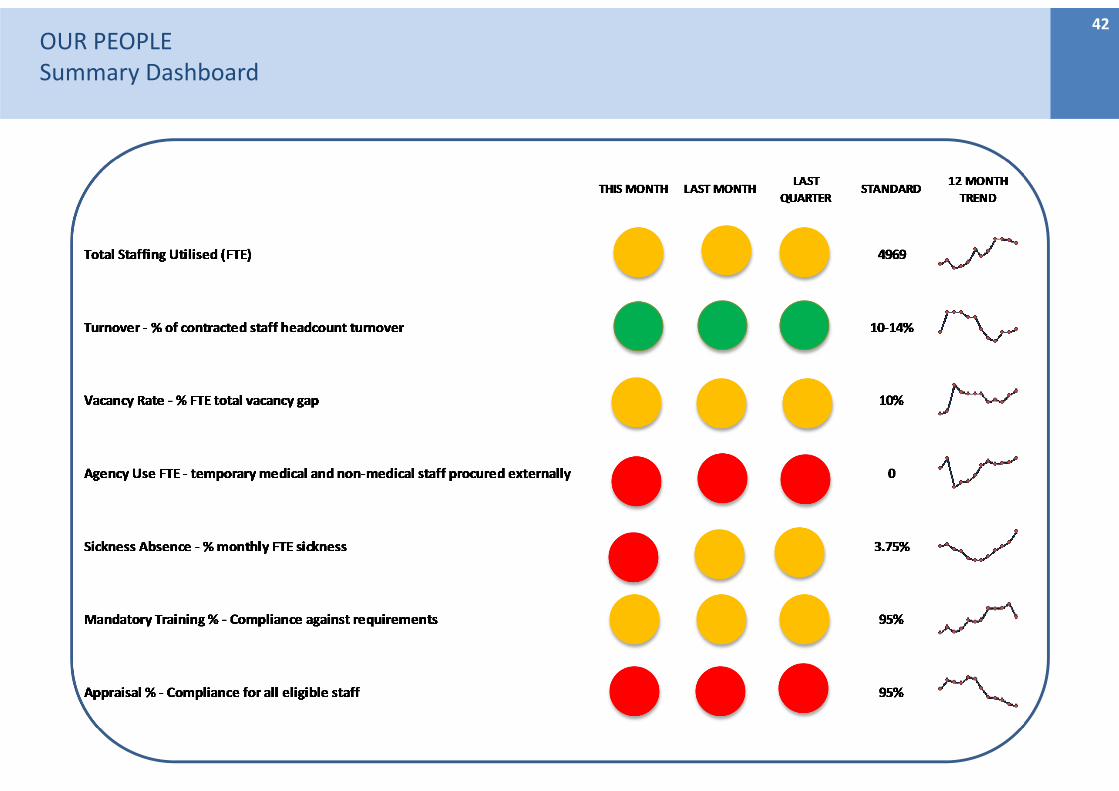
Our People: ‐ Total staffing deployed in January reduced by 14 FTE of which substantive staff increased by 21 FTE and temporary staff decreased by 35 FTE. ‐ Sickness absence increased by 0.45% to 4.64% which is 0.89% above the Trust standard. ‐ Appraisal compliance in January decreased by 0.6% to 74.7% reflecting the seventh month where compliance reduced and is 5% below the same point last year. ‐ Vacancies remain high at 439 FTE posts actively in the recruitment process. Focus continues on recruiting to substantive posts to reduce agency use.‐ Mandatory training compliance reduced by 1.6% to 86.4%. This is 8.6% below standard, however, compliance remains 1.8% higher than the same time last year.
Partnership: ‐ Progress with the new model of care and the development of the ACS is being made, however this is not yet impacting on our key deliverables of ED attendances and DTOCs.‐ The new Planned Care Board met for the first time in January 2018 complementing the role of the existing A & E Delivery Board informing the governance of the developing new model
of care.‐ The new 111 service went live on 30th November 2017 and has performed well in January 2018
2
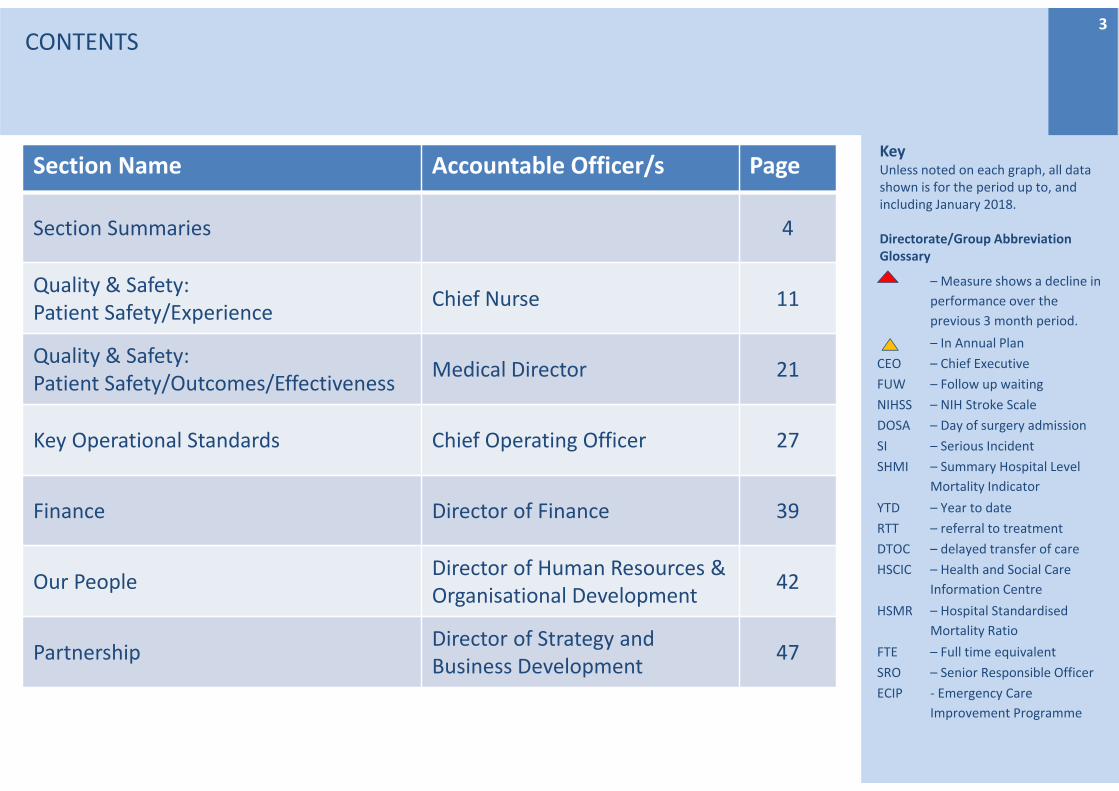
KeyUnless noted on each graph, all data shown is for the period up to, and including January 2018.
Directorate/Group Abbreviation Glossary
CONTENTS
Section Name Accountable Officer/s Page
Section Summaries 4
Quality & Safety:Patient Safety/Experience
Chief Nurse 11
Quality & Safety:Patient Safety/Outcomes/Effectiveness
Medical Director 21
Key Operational Standards Chief Operating Officer 27
Finance Director of Finance 39
Our PeopleDirector of Human Resources & Organisational Development
42
PartnershipDirector of Strategy and Business Development
47
3
– Measure shows a decline in
performance over the
previous 3 month period.
– In Annual Plan
CEO – Chief Executive
FUW – Follow up waiting
NIHSS – NIH Stroke Scale
DOSA – Day of surgery admission
SI – Serious Incident
SHMI – Summary Hospital Level
Mortality Indicator
YTD – Year to date
RTT – referral to treatment
DTOC – delayed transfer of care
HSCIC – Health and Social Care
Information Centre
HSMR – Hospital Standardised
Mortality Ratio
FTE – Full time equivalent
SRO – Senior Responsible Officer
ECIP ‐ Emergency Care
Improvement Programme
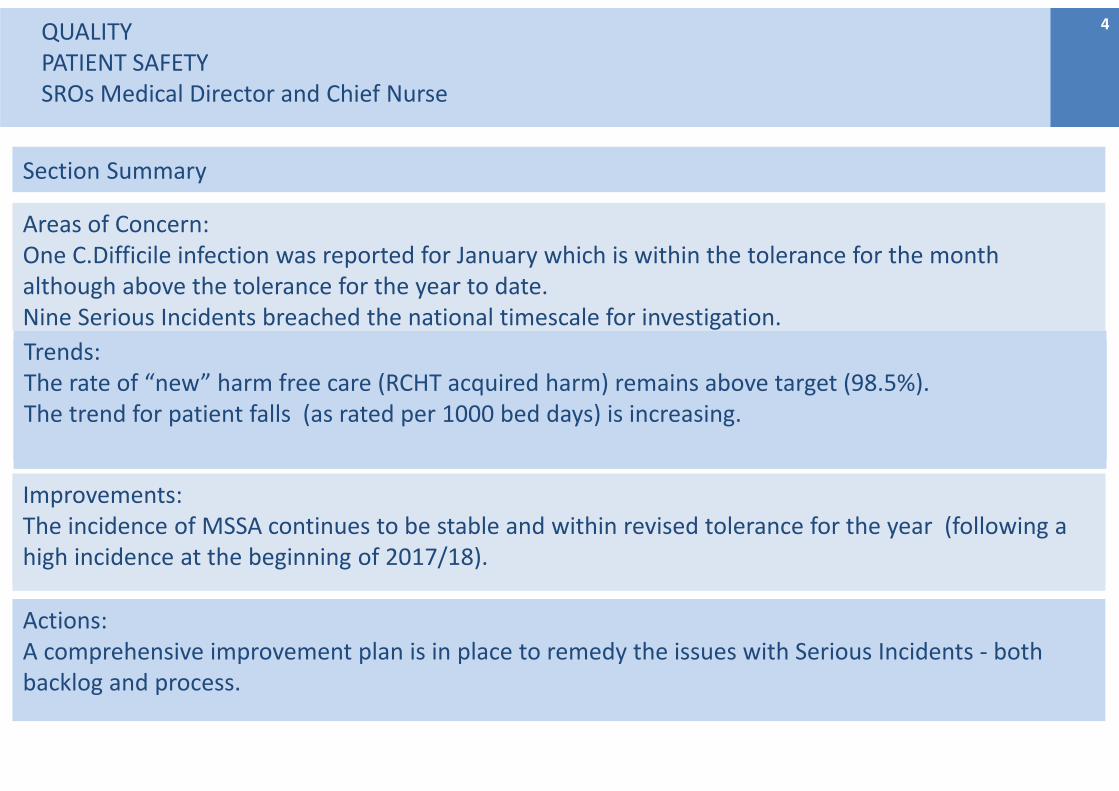
QUALITYPATIENT SAFETYSROs Medical Director and Chief Nurse
Section Summary
Areas of Concern:One C.Difficile infection was reported for January which is within the tolerance for the month although above the tolerance for the year to date. Nine Serious Incidents breached the national timescale for investigation.
Trends:The rate of “new” harm free care (RCHT acquired harm) remains above target (98.5%).The trend for patient falls (as rated per 1000 bed days) is increasing.
Improvements: The incidence of MSSA continues to be stable and within revised tolerance for the year (following a high incidence at the beginning of 2017/18).
Actions:A comprehensive improvement plan is in place to remedy the issues with Serious Incidents ‐ both backlog and process.
4
Trends:The rate of “new” harm free care (RCHT acquired harm) remains above target (98.5%).The trend for patient falls (as rated per 1000 bed days) is increasing.
Improvements: The incidence of MSSA continues to be stable and within revised tolerance for the year (following a high incidence at the beginning of 2017/18).
Section Summary
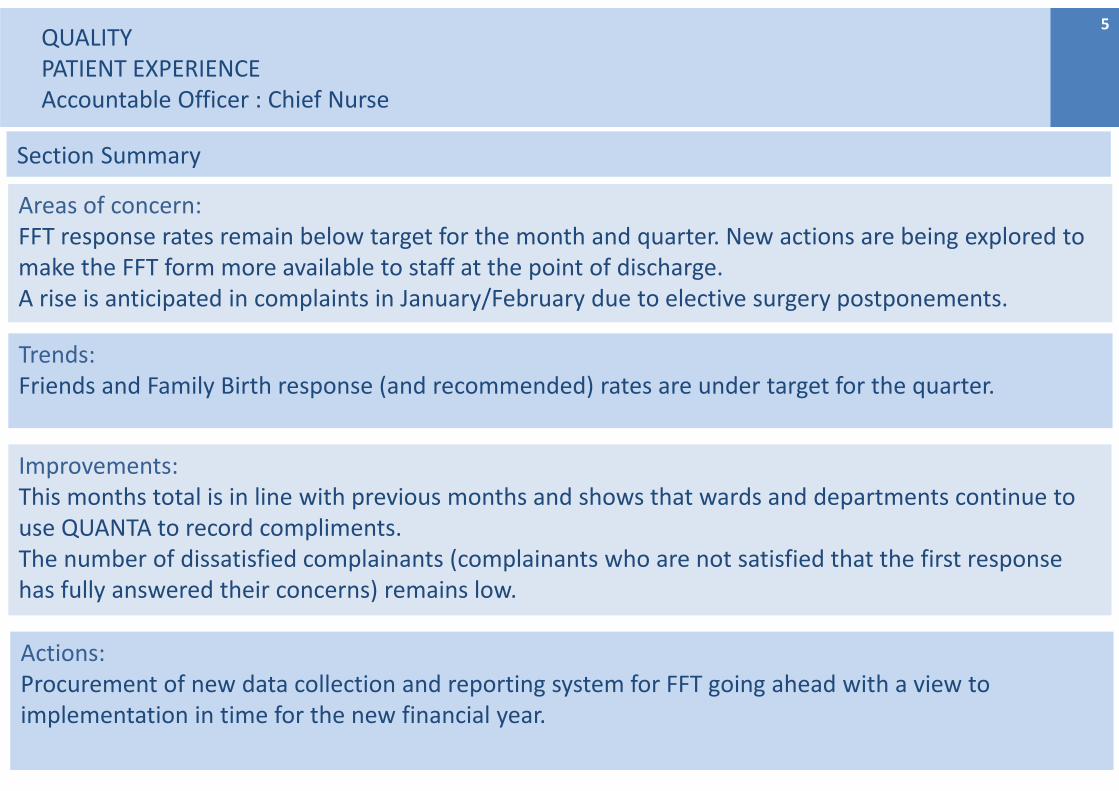
QUALITYPATIENT EXPERIENCEAccountable Officer : Chief Nurse
5
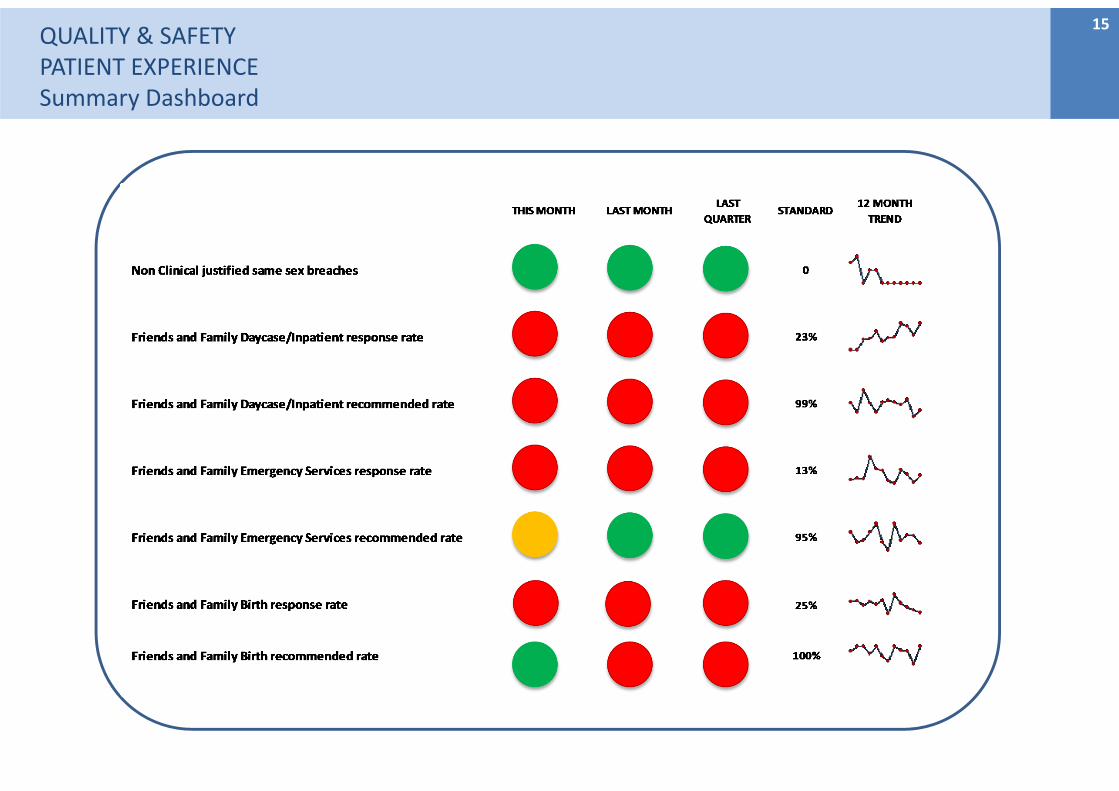
Areas of concern:FFT response rates remain below target for the month and quarter. New actions are being explored to make the FFT form more available to staff at the point of discharge. A rise is anticipated in complaints in January/February due to elective surgery postponements.
Trends: Friends and Family Birth response (and recommended) rates are under target for the quarter.
Improvements: This months total is in line with previous months and shows that wards and departments continue to use QUANTA to record compliments.The number of dissatisfied complainants (complainants who are not satisfied that the first response has fully answered their concerns) remains low.
Actions:Procurement of new data collection and reporting system for FFT going ahead with a view to implementation in time for the new financial year.
Section Summary
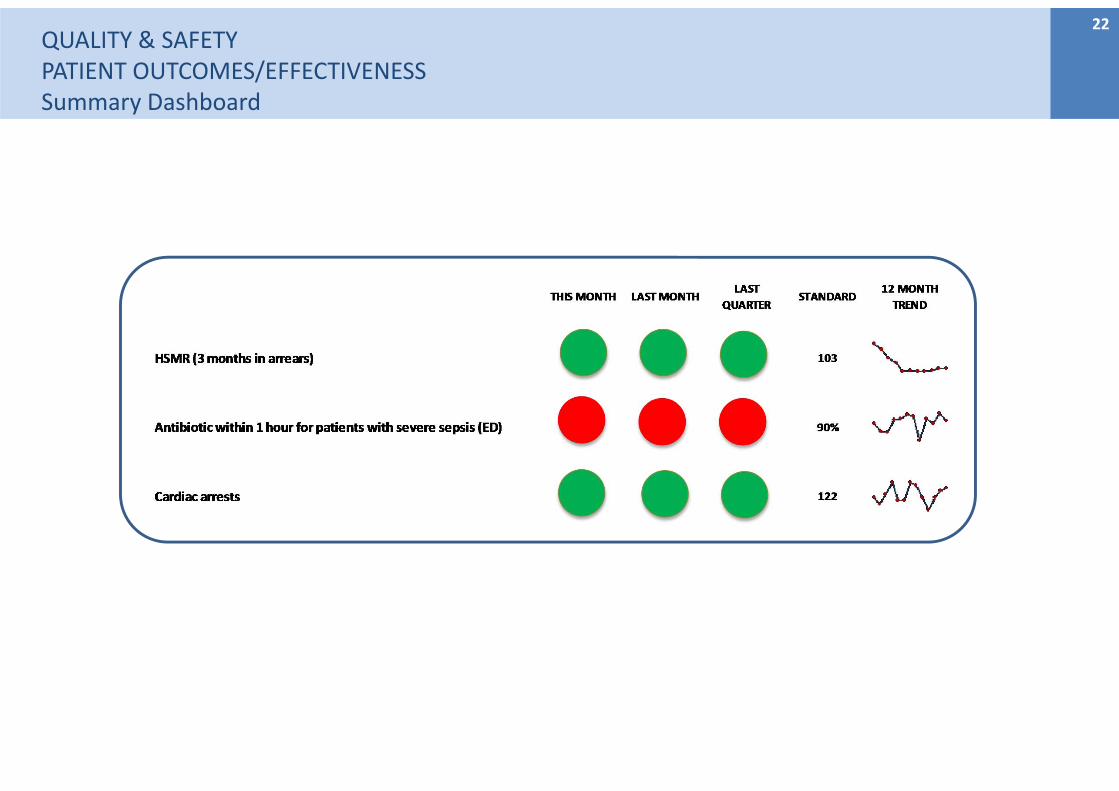
Areas of Concern:Regarding Sepsis, the CQUIN results in December showed a decrease to 65% in December from 82% in November for antibiotics being given within the hour.
Trends:Mortality rates for weekday and weekends are stable.
Improvements:The mortality rate for the Trust (HSMR) remains stable and is below the average for England. The level of screen for Sepsis remains at an excellent (compliant) position.The primary PCI call to balloon standard was achieved for the first time since September.
Actions:1. The Sepsis screening tool on Nervecentre will commence in February 2018 resulting in all patients
being screened for sepsis and staff alerted to make a decision on a possible diagnosis.2. Root cause analysis has been carried out on all pPCIs which did not meet the standard.
QUALITY ‐ PATIENT OUTCOMES/EFFECTIVENESSSRO Medical Director
6
KEY OPERATIONAL STANDARDSSRO Chief Operating Officer
Section Summary
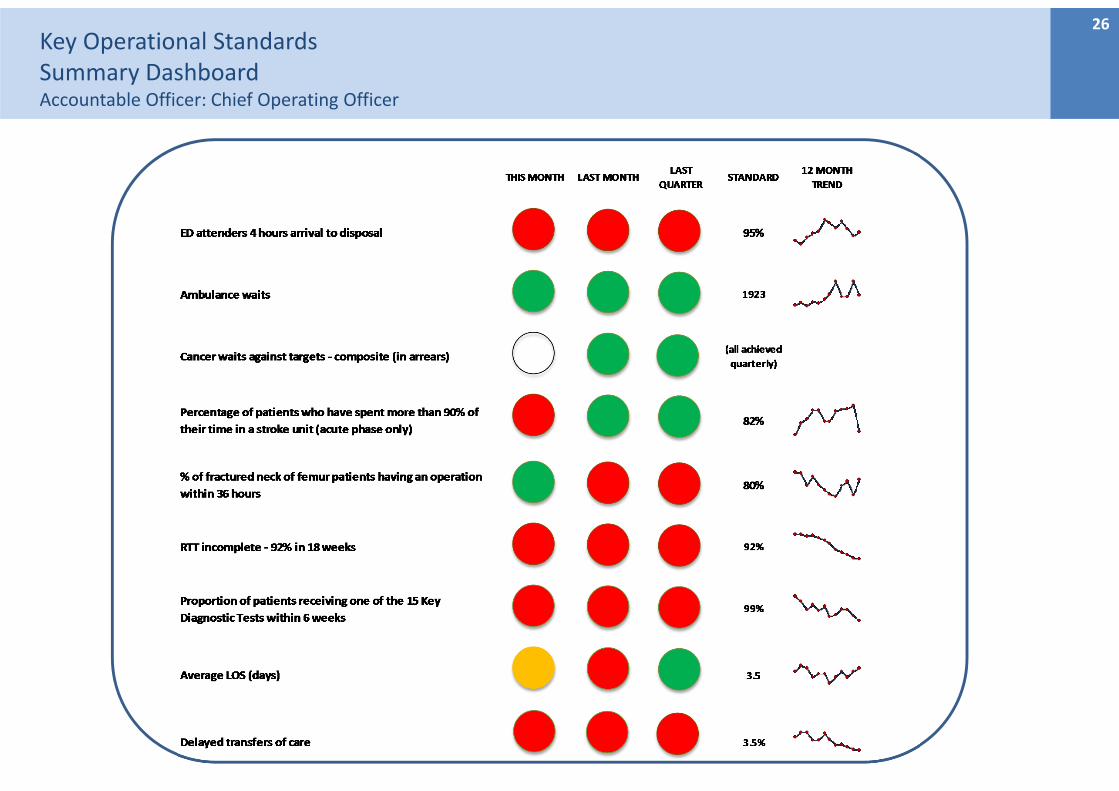
Areas of concern:Key concerns remain the emergency access 4 hour standard, RTT incompletes and 52 week waits, 6 week diagnostics, elective cancellations on the day and 28 day re‐booking standard, DTOCs and patients on the follow‐up pending list past their to be seen date. Stroke performance was also an emerging concern in January.
Trends:
Improvements:Fractured neck of femur patients operated on within 36 hours, daycase and DOSA rates and net emergency readmissions within 28 days all improved. In addition a number of ED indicators improved, particularly the number of ambulance delays over 30 minutes.
Actions:1. For patient flow – the successful series of Multi‐Agency Discharge Events (MADE) continue.2. A number of activities are underway to improve ED performance against the A&E quality indicators
as part of the Tackling Patient Delays workstream of the Quality Improvement Delivery Programme, this includes changes implemented to the medical model which move the medical take out of ED.
Patient flow pressure continues to impact on a number of measures. Failure to achieve both the RTT and diagnostic standards continued, whilst the number of incomplete pathways over 52 weeks is growing. Cancer standards performance continue to be sustained.
7
Section Summary
Areas of Concern: • Savings of £9.7m delivered to date which is £3.4m below plan. The full year forecast stands at
£14.1m compared to a plan of £17.3m. The shortfall is entirely in relation to schemes designed to reduce pay costs and the improvement in month is due to non‐recurrent savings expected in M12.
• Agency spend increased to £1.3 in month. • Elective income was £0.8m below plan in month and is expected to be lower than plan due to
operational pressures in February and March .• Significant investment is likely to be required in response to CQC findings / Quality Improvement.
Trends:• Two of the four clinical Divisions, plus Corporate departments, are operating below budget.• Surgical Services and Medical Services Divisions continue to overspend due to unidentified savings.
Improvements:• Corporate departments continue to underspend to help improve the financial position.
Actions:1. Focus on reduction in substantive pay costs through service redesign. Re‐prioritise funds to achieve
Quality Improvement priorities. Increase bank usage to reduce agency spend.
FINANCESRO Director of Finance
8
Section Summary
Areas of Concern:• Recruitment continues to be a focus. Active vacancies in the recruitment process total 439 FTE of
which 165 FTE are for registered nurses. • Agency use increased further during January by 10 FTE to 125 FTE and remains at an unsustainable
level and cost.
Trends:• Appraisal compliance continued a seventh consecutive month in decline and at 74.7% is 20.3%
below standard and 5% below this same point last year.• Sickness absence increased for the sixth month and at 4.64% is 0.89% above standard.
Improvements:• Success is being seen in recruitment. January reports a net increase of 21 FTE substantive staff and
an additional Saturday recruitment event saw offers made to 15 nurses and 22 healthcare assistants
Actions:• Work continues to recruit substantively to vacancies and to reduce agency use.• Business planning activity continues for 2018/19 with focus on improved recruitment, retention and
attendance to achieve more substantive staff in work and reduce temporary use.
OUR PEOPLESRO Director of HR and OD
9
Section Summary
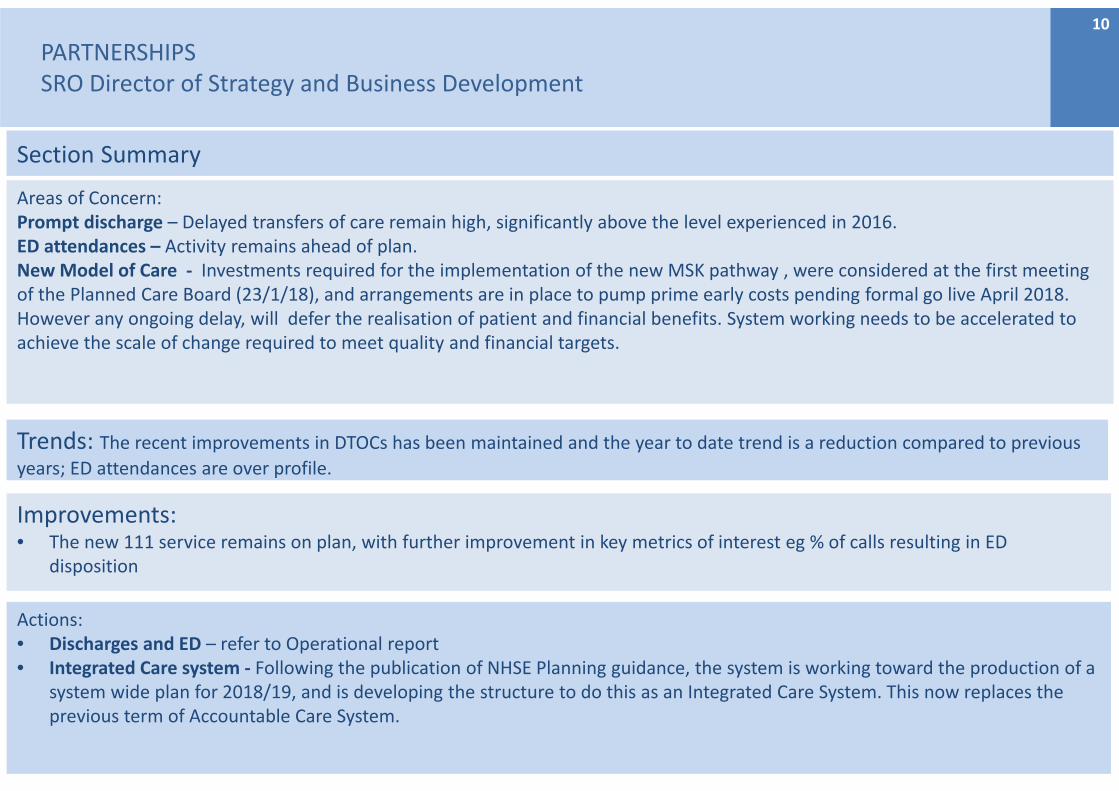
Areas of Concern:Prompt discharge – Delayed transfers of care remain high, significantly above the level experienced in 2016. ED attendances – Activity remains ahead of plan.New Model of Care ‐ Investments required for the implementation of the new MSK pathway , were considered at the first meeting of the Planned Care Board (23/1/18), and arrangements are in place to pump prime early costs pending formal go live April 2018. However any ongoing delay, will defer the realisation of patient and financial benefits. System working needs to be accelerated to achieve the scale of change required to meet quality and financial targets.
Trends: The recent improvements in DTOCs has been maintained and the year to date trend is a reduction compared to previous
years; ED attendances are over profile.
Improvements:• The new 111 service remains on plan, with further improvement in key metrics of interest eg % of calls resulting in ED
disposition
Actions:• Discharges and ED – refer to Operational report • Integrated Care system ‐ Following the publication of NHSE Planning guidance, the system is working toward the production of a
system wide plan for 2018/19, and is developing the structure to do this as an Integrated Care System. This now replaces the previous term of Accountable Care System.
PARTNERSHIPSSRO Director of Strategy and Business Development
10
QUALITY & SAFETYPATIENT SAFETYSummary Dashboard
11
QUALITYPatient SafetySafety ThermometerAccountable Officer: Chief Nurse
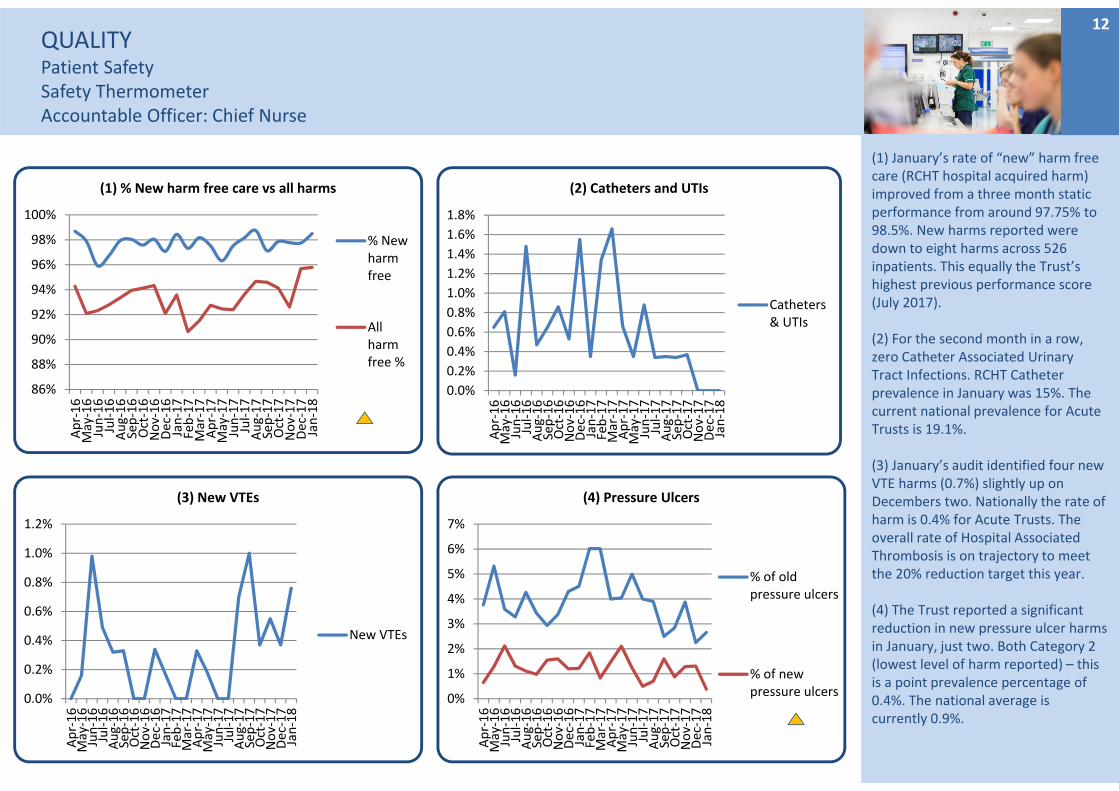
(1) January’s rate of “new” harm free care (RCHT hospital acquired harm) improved from a three month static performance from around 97.75% to 98.5%. New harms reported were down to eight harms across 526 inpatients. This equally the Trust’s highest previous performance score (July 2017).
(2) For the second month in a row, zero Catheter Associated Urinary Tract Infections. RCHT Catheter prevalence in January was 15%. The current national prevalence for Acute Trusts is 19.1%.
(3) January’s audit identified four new VTE harms (0.7%) slightly up on Decembers two. Nationally the rate of harm is 0.4% for Acute Trusts. The overall rate of Hospital Associated Thrombosis is on trajectory to meet the 20% reduction target this year.
(4) The Trust reported a significant reduction in new pressure ulcer harms in January, just two. Both Category 2 (lowest level of harm reported) – this is a point prevalence percentage of 0.4%. The national average is currently 0.9%.
12
86%
88%
90%
92%
94%
96%
98%
100%
Apr‐16
May‐16
Jun‐16
Jul‐16
Aug‐16
Sep‐16
Oct‐16
Nov‐16
Dec‐16
Jan‐17
Feb‐17
Mar‐17
Apr‐17
May‐17
Jun‐17
Jul‐17
Aug‐17
Sep‐17
Oct‐17
Nov‐17
Dec‐17
Jan‐18
(1) % New harm free care vs all harms
% Newharmfree
Allharmfree %
0.0%
0.2%
0.4%
0.6%
0.8%
1.0%
1.2%
1.4%
1.6%
1.8%
Apr‐16
May‐16
Jun‐16
Jul‐16
Aug‐16
Sep‐16
Oct‐16
Nov‐16
Dec‐16
Jan‐17
Feb‐17
Mar‐17
Apr‐17
May‐17
Jun‐17
Jul‐17
Aug‐17
Sep‐17
Oct‐17
Nov‐17
Dec‐17
Jan‐18
(2) Catheters and UTIs
Catheters& UTIs
0.0%
0.2%
0.4%
0.6%
0.8%
1.0%
1.2%
Apr‐16
May‐16
Jun‐16
Jul‐16
Aug‐16
Sep‐16
Oct‐16
Nov‐16
Dec‐16
Jan‐17
Feb‐17
Mar‐17
Apr‐17
May‐17
Jun‐17
Jul‐17
Aug‐17
Sep‐17
Oct‐17
Nov‐17
Dec‐17
Jan‐18
(3) New VTEs
New VTEs
0%
1%
2%
3%
4%
5%
6%
7%
Apr‐16
May‐16
Jun‐16
Jul‐16
Aug‐16
Sep‐16
Oct‐16
Nov‐16
Dec‐16
Jan‐17
Feb‐17
Mar‐17
Apr‐17
May‐17
Jun‐17
Jul‐17
Aug‐17
Sep‐17
Oct‐17
Nov‐17
Dec‐17
Jan‐18
(4) Pressure Ulcers
% of oldpressure ulcers
% of newpressure ulcers
QUALITYPatient SafetySafety ThermometerAccountable Officer: Chief Nurse
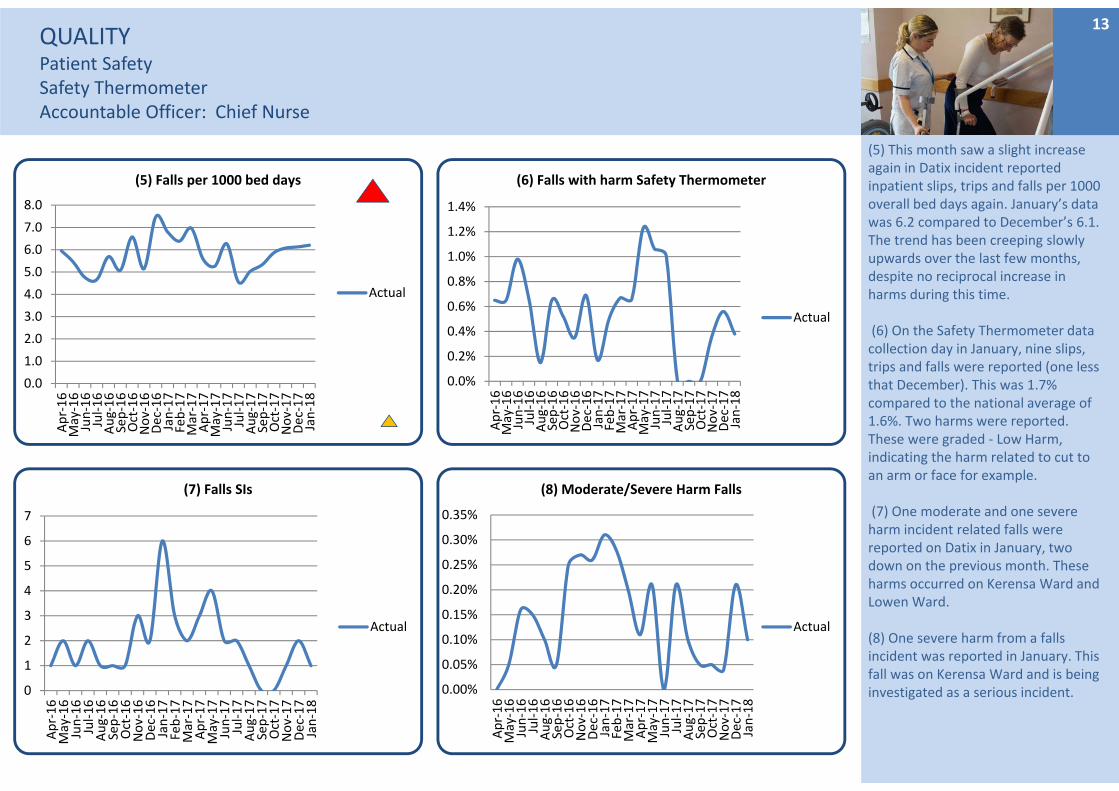
(5) This month saw a slight increase again in Datix incident reported inpatient slips, trips and falls per 1000 overall bed days again. January’s data was 6.2 compared to December’s 6.1. The trend has been creeping slowly upwards over the last few months, despite no reciprocal increase in harms during this time.
(6) On the Safety Thermometer data collection day in January, nine slips, trips and falls were reported (one less that December). This was 1.7% compared to the national average of 1.6%. Two harms were reported. These were graded ‐ Low Harm, indicating the harm related to cut to an arm or face for example.
(7) One moderate and one severe harm incident related falls were reported on Datix in January, two down on the previous month. These harms occurred on Kerensa Ward and Lowen Ward.
(8) One severe harm from a falls incident was reported in January. This fall was on Kerensa Ward and is being investigated as a serious incident.
13
0.0
1.0
2.0
3.0
4.0
5.0
6.0
7.0
8.0
Apr‐16
May‐16
Jun‐16
Jul‐16
Aug‐16
Sep‐16
Oct‐16
Nov‐16
Dec‐16
Jan‐17
Feb‐17
Mar‐17
Apr‐17
May‐17
Jun‐17
Jul‐17
Aug‐17
Sep‐17
Oct‐17
Nov‐17
Dec‐17
Jan‐18
(5) Falls per 1000 bed days
Actual
0.0%
0.2%
0.4%
0.6%
0.8%
1.0%
1.2%
1.4%
Apr‐16
May‐16
Jun‐16
Jul‐16
Aug‐16
Sep‐16
Oct‐16
Nov‐16
Dec‐16
Jan‐17
Feb‐17
Mar‐17
Apr‐17
May‐17
Jun‐17
Jul‐17
Aug‐17
Sep‐17
Oct‐17
Nov‐17
Dec‐17
Jan‐18
(6) Falls with harm Safety Thermometer
Actual
0
1
2
3
4
5
6
7
Apr‐16
May‐16
Jun‐16
Jul‐16
Aug‐16
Sep‐16
Oct‐16
Nov‐16
Dec‐16
Jan‐17
Feb‐17
Mar‐17
Apr‐17
May‐17
Jun‐17
Jul‐17
Aug‐17
Sep‐17
Oct‐17
Nov‐17
Dec‐17
Jan‐18
(7) Falls SIs
Actual
0.00%
0.05%
0.10%
0.15%
0.20%
0.25%
0.30%
0.35%Apr‐16
May‐16
Jun‐16
Jul‐16
Aug‐16
Sep‐16
Oct‐16
Nov‐16
Dec‐16
Jan‐17
Feb‐17
Mar‐17
Apr‐17
May‐17
Jun‐17
Jul‐17
Aug‐17
Sep‐17
Oct‐17
Nov‐17
Dec‐17
Jan‐18
(8) Moderate/Severe Harm Falls
Actual
QUALITYPatient SafetyInfection Control
Accountable Officer: Chief Nurse
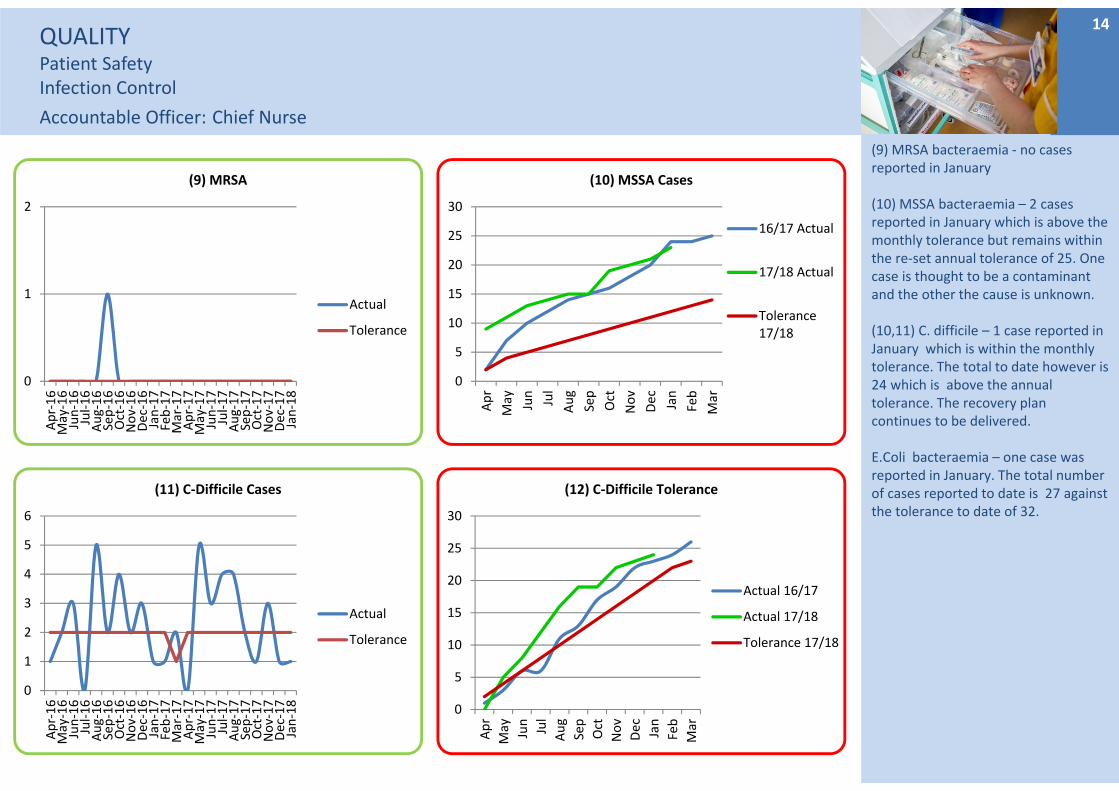
(9) MRSA bacteraemia ‐ no cases reported in January
(10) MSSA bacteraemia – 2 cases reported in January which is above the monthly tolerance but remains within the re‐set annual tolerance of 25. One case is thought to be a contaminant and the other the cause is unknown.
(10,11) C. difficile – 1 case reported in January which is within the monthly tolerance. The total to date however is 24 which is above the annual tolerance. The recovery plan continues to be delivered.
E.Coli bacteraemia – one case was reported in January. The total number of cases reported to date is 27 against the tolerance to date of 32.
14
0
1
2
Apr‐16
May‐16
Jun‐16
Jul‐16
Aug‐16
Sep‐16
Oct‐16
Nov‐16
Dec‐16
Jan‐17
Feb‐17
Mar‐17
Apr‐17
May‐17
Jun‐17
Jul‐17
Aug‐17
Sep‐17
Oct‐17
Nov‐17
Dec‐17
Jan‐18
(9) MRSA
Actual
Tolerance
0
5
10
15
20
25
30
Apr
May Jun
Jul
Aug
Sep
Oct
Nov
Dec Jan
Feb
Mar
(10) MSSA Cases
16/17 Actual
17/18 Actual
Tolerance17/18
0
1
2
3
4
5
6
Apr‐16
May‐16
Jun‐16
Jul‐16
Aug‐16
Sep‐16
Oct‐16
Nov‐16
Dec‐16
Jan‐17
Feb‐17
Mar‐17
Apr‐17
May‐17
Jun‐17
Jul‐17
Aug‐17
Sep‐17
Oct‐17
Nov‐17
Dec‐17
Jan‐18
(11) C‐Difficile Cases
Actual
Tolerance
0
5
10
15
20
25
30
Apr
May Jun
Jul
Aug
Sep
Oct
Nov
Dec Jan
Feb
Mar
(12) C‐Difficile Tolerance
Actual 16/17
Actual 17/18
Tolerance 17/18
QUALITY & SAFETYPATIENT EXPERIENCESummary Dashboard
15
QUALITYFriends & Family TestResponse ratesAccountable Officer: Chief Nurse
16
Not Recommended
Recommended
Response Rates
Inpatients and Daycases
20%
1%
96%
Outpatients
98% 0%
Maternity(Antenatal Care)
5%
95%
Emergency Departments
95%
10%
1%
Maternity (Postnatal Ward)
5%90%
Maternity (Birth)
0%
6%
Maternity(Postnatal Community)
0%
100%
100%
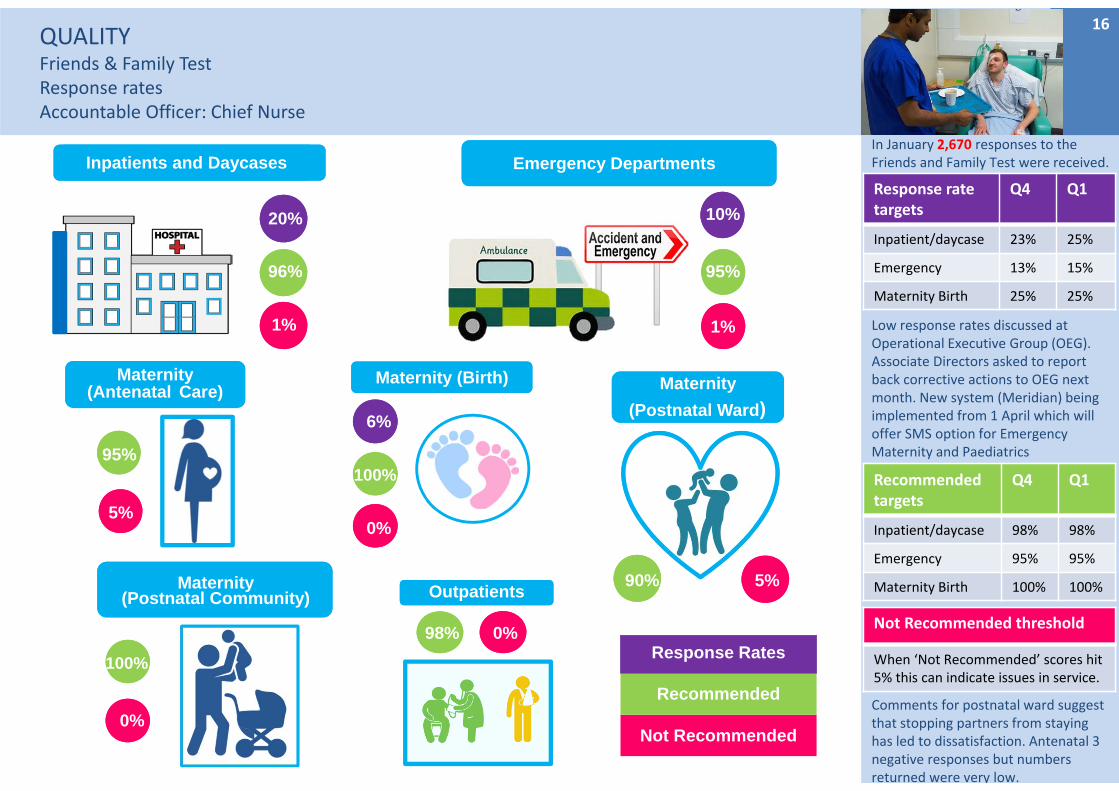
In January 2,670 responses to the Friends and Family Test were received.
Low response rates discussed at Operational Executive Group (OEG). Associate Directors asked to report back corrective actions to OEG next month. New system (Meridian) being implemented from 1 April which will offer SMS option for Emergency Maternity and Paediatrics
Comments for postnatal ward suggest that stopping partners from staying has led to dissatisfaction. Antenatal 3 negative responses but numbers returned were very low.
Response rate targets
Q4 Q1
Inpatient/daycase 23% 25%
Emergency 13% 15%
Maternity Birth 25% 25%
Recommendedtargets
Q4 Q1
Inpatient/daycase 98% 98%
Emergency 95% 95%
Maternity Birth 100% 100%
Not Recommended threshold
When ‘Not Recommended’ scores hit 5% this can indicate issues in service.

17QUALITYPatient ExperienceComplaintsAccountable Officer: Chief Nurse
(13, 14) The Trust received an average number of complaints in January.
(15) Complaints Regulations require that complaints are acknowledged within 3 working days of receipt. The new process of acknowledging complaints immediately when they are received by email or in person/by telephone is working well and to further improve performance the team will now acknowledge complaints received by letter as soon as the DATIX record is created (normally on date of receipt).
(16) In January, of all complaints closed, 42% were closed within the agreed target response time of either 25 or 45 working days. This target is now changing and from the start of Q4, the target response time will be 30 working days for all complaints unless agreed otherwise with the complainant.
The Team are currently trialling a function on DATIX which will automatically alert the IO when a complaint response is due to breach and this will hopefully show improvement in this area.
60%
65%
70%
75%
80%
85%
90%
95%
100%
Apr‐16
May‐16
Jun‐16
Jul‐16
Aug‐16
Sep‐16
Oct‐16
Nov‐16
Dec‐16
Jan‐17
Feb‐17
Mar‐17
Apr‐17
May‐17
Jun‐17
Jul‐17
Aug‐17
Sep‐17
Oct‐17
Nov‐17
Dec‐17
Jan‐18
(15) % complaints acknowledged in 3 working days
Actual
0
10
20
30
40
50
60
Apr‐16
May‐16
Jun‐16
Jul‐16
Aug‐16
Sep‐16
Oct‐16
Nov‐16
Dec‐16
Jan‐17
Feb‐17
Mar‐17
Apr‐17
May‐17
Jun‐17
Jul‐17
Aug‐17
Sep‐17
Oct‐17
Nov‐17
Dec‐17
Jan‐18
(13) Total number of formal complaints
Mean
UCL
LCL
Total inMonth
0
20
40
60
80
100
120
140
Apr‐16
May‐16
Jun‐16
Jul‐16
Aug‐16
Sep‐16
Oct‐16
Nov‐16
Dec‐16
Jan‐17
Feb‐17
Mar‐17
Apr‐17
May‐17
Jun‐17
Jul‐17
Aug‐17
Sep‐17
Oct‐17
Nov‐17
Dec‐17
Jan‐18
(14) Total number of informal complaints
Mean
UCL
LCL
Total
0%
20%
40%
60%
80%
100%
Jan‐18
(16) % Complaints responded to within agreed timescale
%respondedto withintimescale
Standard
QUALITY Patient ExperienceComplaintsAccountable Officer: Chief Nurse
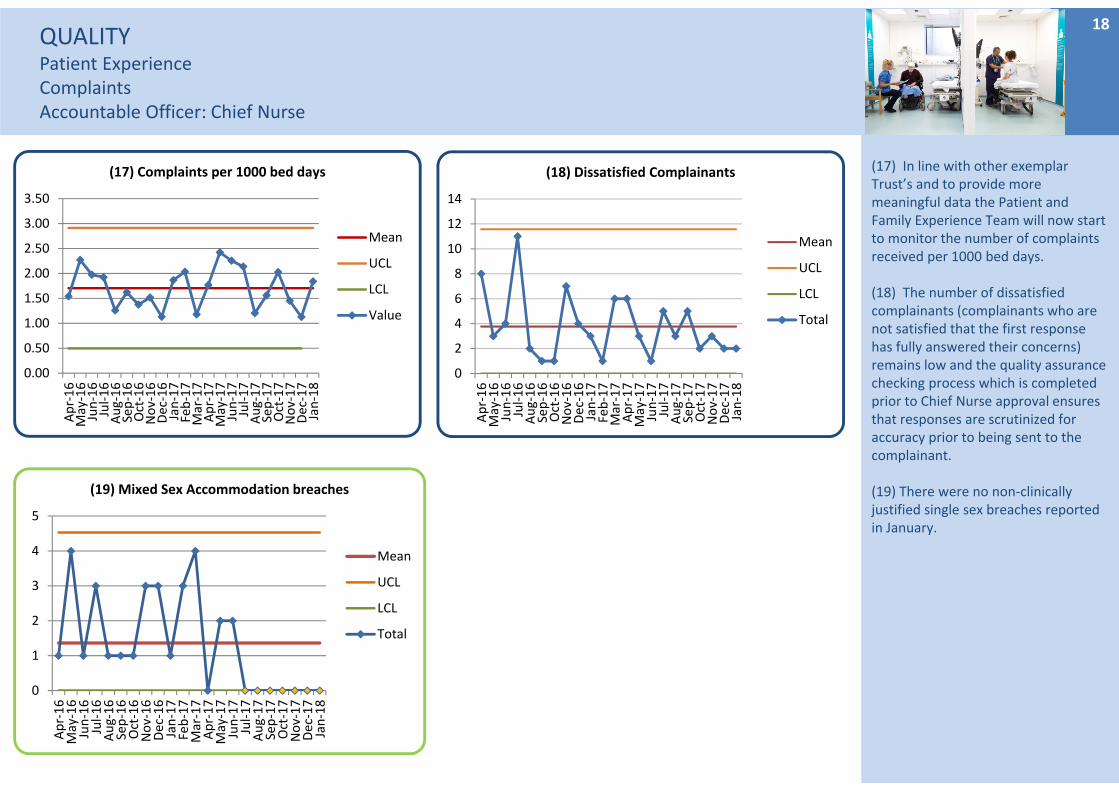
(17) In line with other exemplar Trust’s and to provide more meaningful data the Patient and Family Experience Team will now start to monitor the number of complaints received per 1000 bed days.
(18) The number of dissatisfied complainants (complainants who are not satisfied that the first response has fully answered their concerns) remains low and the quality assurance checking process which is completed prior to Chief Nurse approval ensures that responses are scrutinized for accuracy prior to being sent to the complainant.
(19) There were no non‐clinically justified single sex breaches reported in January.
18
0
1
2
3
4
5
Apr‐16
May‐16
Jun‐16
Jul‐16
Aug‐16
Sep‐16
Oct‐16
Nov‐16
Dec‐16
Jan‐17
Feb‐17
Mar‐17
Apr‐17
May‐17
Jun‐17
Jul‐17
Aug‐17
Sep‐17
Oct‐17
Nov‐17
Dec‐17
Jan‐18
(19) Mixed Sex Accommodation breaches
Mean
UCL
LCL
Total
0.00
0.50
1.00
1.50
2.00
2.50
3.00
3.50
Apr‐16
May‐16
Jun‐16
Jul‐16
Aug‐16
Sep‐16
Oct‐16
Nov‐16
Dec‐16
Jan‐17
Feb‐17
Mar‐17
Apr‐17
May‐17
Jun‐17
Jul‐17
Aug‐17
Sep‐17
Oct‐17
Nov‐17
Dec‐17
Jan‐18
(17) Complaints per 1000 bed days
Mean
UCL
LCL
Value
0
2
4
6
8
10
12
14
Apr‐16
May‐16
Jun‐16
Jul‐16
Aug‐16
Sep‐16
Oct‐16
Nov‐16
Dec‐16
Jan‐17
Feb‐17
Mar‐17
Apr‐17
May‐17
Jun‐17
Jul‐17
Aug‐17
Sep‐17
Oct‐17
Nov‐17
Dec‐17
Jan‐18
(18) Dissatisfied Complainants
Mean
UCL
LCL
Total
QUALITY Patient ExperienceCompliments & RatingsAccountable Officer: Chief Nurse
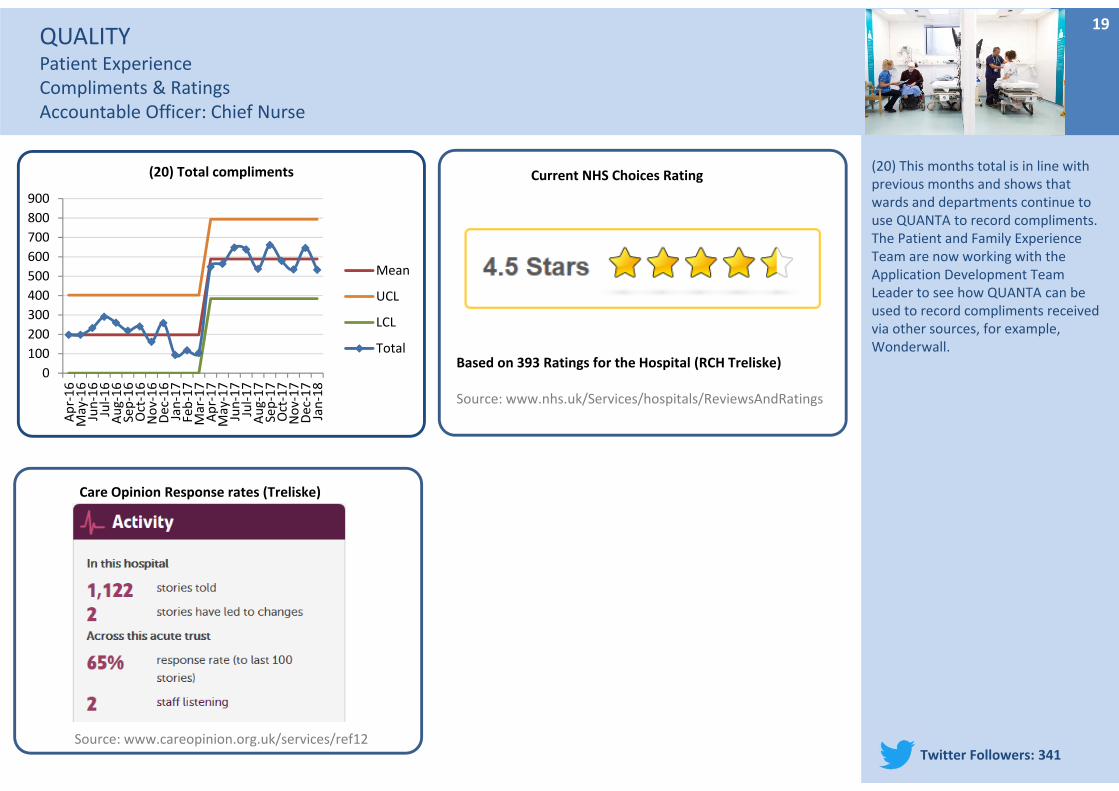
(20) This months total is in line with previous months and shows that wards and departments continue to use QUANTA to record compliments. The Patient and Family Experience Team are now working with the Application Development Team Leader to see how QUANTA can be used to record compliments received via other sources, for example, Wonderwall.
19
Current NHS Choices Rating
Based on 393 Ratings for the Hospital (RCH Treliske)
Source: www.nhs.uk/Services/hospitals/ReviewsAndRatings
Care Opinion Response rates (Treliske)
Source: www.careopinion.org.uk/services/ref12Twitter Followers: 341
0
100
200
300
400
500
600
700
800
900
Apr‐16
May‐16
Jun‐16
Jul‐16
Aug‐16
Sep‐16
Oct‐16
Nov‐16
Dec‐16
Jan‐17
Feb‐17
Mar‐17
Apr‐17
May‐17
Jun‐17
Jul‐17
Aug‐17
Sep‐17
Oct‐17
Nov‐17
Dec‐17
Jan‐18
(20) Total compliments
Mean
UCL
LCL
Total
SAFETY Patient SafetyNever Events & Serious IncidentsAccountable Officer: Medical Director
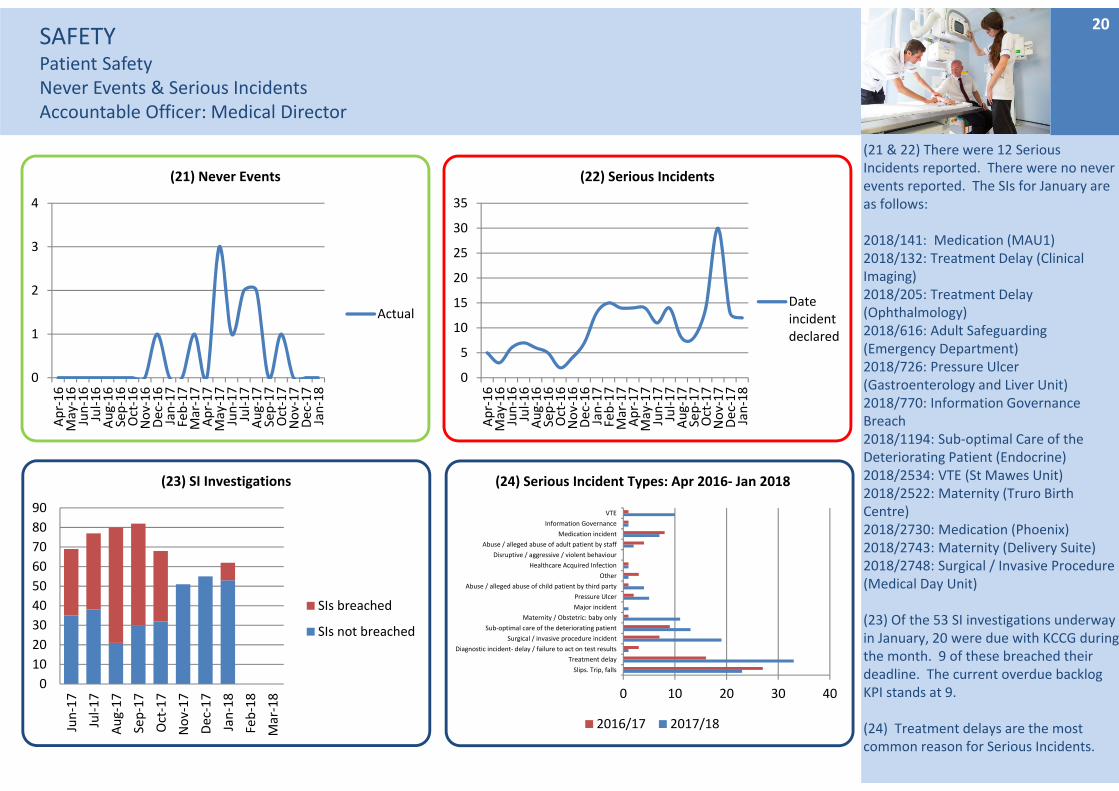
(21 & 22) There were 12 Serious Incidents reported. There were no never events reported. The SIs for January are as follows:
2018/141: Medication (MAU1)2018/132: Treatment Delay (Clinical Imaging)2018/205: Treatment Delay (Ophthalmology)2018/616: Adult Safeguarding (Emergency Department)2018/726: Pressure Ulcer (Gastroenterology and Liver Unit)2018/770: Information Governance Breach2018/1194: Sub‐optimal Care of the Deteriorating Patient (Endocrine)2018/2534: VTE (St Mawes Unit)2018/2522: Maternity (Truro Birth Centre)2018/2730: Medication (Phoenix)2018/2743: Maternity (Delivery Suite)2018/2748: Surgical / Invasive Procedure (Medical Day Unit)
(23) Of the 53 SI investigations underway in January, 20 were due with KCCG during the month. 9 of these breached their deadline. The current overdue backlog KPI stands at 9.
(24) Treatment delays are the most common reason for Serious Incidents.
20
0
1
2
3
4
Apr‐16
May‐16
Jun‐16
Jul‐16
Aug‐16
Sep‐16
Oct‐16
Nov‐16
Dec‐16
Jan‐17
Feb‐17
Mar‐17
Apr‐17
May‐17
Jun‐17
Jul‐17
Aug‐17
Sep‐17
Oct‐17
Nov‐17
Dec‐17
Jan‐18
(21) Never Events
Actual
0
5
10
15
20
25
30
35
Apr‐16
May‐16
Jun‐16
Jul‐16
Aug‐16
Sep‐16
Oct‐16
Nov‐16
Dec‐16
Jan‐17
Feb‐17
Mar‐17
Apr‐17
May‐17
Jun‐17
Jul‐17
Aug‐17
Sep‐17
Oct‐17
Nov‐17
Dec‐17
Jan‐18
(22) Serious Incidents
Dateincidentdeclared
0
10
20
30
40
50
60
70
80
90
Jun‐17
Jul‐17
Aug‐17
Sep‐17
Oct‐17
Nov‐17
Dec‐17
Jan‐18
Feb‐18
Mar‐18
(23) SI Investigations
SIs breached
SIs not breached
0 10 20 30 40
Slips. Trip, falls
Treatment delay
Diagnostic incident‐ delay / failure to act on test results
Surgical / invasive procedure incident
Sub‐optimal care of the deteriorating patient
Maternity / Obstetric: baby only
Major incident
Pressure Ulcer
Abuse / alleged abuse of child patient by third party
Other
Healthcare Acquired Infection
Disruptive / aggressive / violent behaviour
Abuse / alleged abuse of adult patient by staff
Medication incident
Information Governance
VTE
(24) Serious Incident Types: Apr 2016‐ Jan 2018
2016/17 2017/18

SAFETY– Patient SafetyMedicines ManagementMedicine Reconciliation Accountable Officer: Medical Director
(25) The accurate prescribing of medicines at the transfer of care is a high risk area and medicines reconciliation is a key control measure undertaken by the clinical pharmacy team.
Pharmacy undertakes >2,000 meds recs a month for >80% of patients (excluding <24hrs, paeds, Obs and SMH).
NICE guidance is to achieve 100% of patients within 24hrs. RCHT achieves approximately 65% within 24hrs and 86% overall.
Investment in a 7 day clinical ED service would be required to significantly improve our performance. This was discussed at TMG and will be taken forward within the division.
Current improvements in this metric are due to the implementation of a team “huddle” each morning which ensures the team are very aware of current operational pressures and performance.
21
40%45%50%55%60%65%70%75%80%85%90%
Apr‐16
May‐16
Jun‐16
Jul‐16
Aug‐16
Sep‐16
Oct‐16
Nov‐16
Dec‐16
Jan‐17
Feb‐17
Mar‐17
Apr‐17
May‐17
Jun‐17
Jul‐17
Aug‐17
Sep‐17
Oct‐17
Nov‐17
Dec‐17
Jan‐18
(25) Medicine Reconciliation
Actual
QUALITY & SAFETYPATIENT OUTCOMES/EFFECTIVENESSSummary Dashboard
22
QUALITY Patient Outcomes/EffectivenessMortalityAccountable Officer: Medical Director
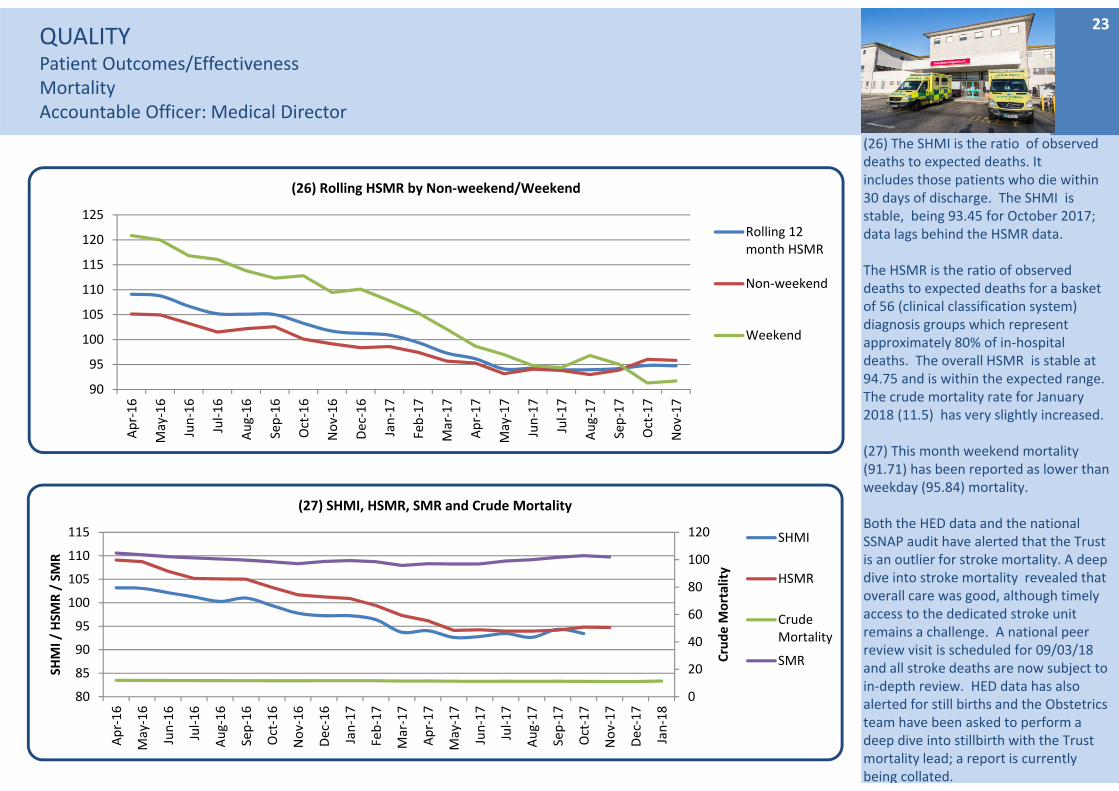
(26) The SHMI is the ratio of observed deaths to expected deaths. It includes those patients who die within 30 days of discharge. The SHMI is stable, being 93.45 for October 2017; data lags behind the HSMR data.
The HSMR is the ratio of observed deaths to expected deaths for a basket of 56 (clinical classification system) diagnosis groups which represent approximately 80% of in‐hospital deaths. The overall HSMR is stable at 94.75 and is within the expected range. The crude mortality rate for January 2018 (11.5) has very slightly increased.
(27) This month weekend mortality (91.71) has been reported as lower than weekday (95.84) mortality.
Both the HED data and the national SSNAP audit have alerted that the Trust is an outlier for stroke mortality. A deep dive into stroke mortality revealed that overall care was good, although timely access to the dedicated stroke unit remains a challenge. A national peer review visit is scheduled for 09/03/18 and all stroke deaths are now subject to in‐depth review. HED data has also alerted for still births and the Obstetrics team have been asked to perform a deep dive into stillbirth with the Trust mortality lead; a report is currently being collated.
23
0
20
40
60
80
100
120
80
85
90
95
100
105
110
115
Apr‐16
May‐16
Jun‐16
Jul‐16
Aug‐16
Sep‐16
Oct‐16
Nov‐16
Dec‐16
Jan‐17
Feb‐17
Mar‐17
Apr‐17
May‐17
Jun‐17
Jul‐17
Aug‐17
Sep‐17
Oct‐17
Nov‐17
Dec‐17
Jan‐18
Crude M
ortality
SHMI / HSM
R / SMR
(27) SHMI, HSMR, SMR and Crude Mortality
SHMI
HSMR
CrudeMortality
SMR
90
95
100
105
110
115
120
125
Apr‐16
May‐16
Jun‐16
Jul‐16
Aug‐16
Sep‐16
Oct‐16
Nov‐16
Dec‐16
Jan‐17
Feb‐17
Mar‐17
Apr‐17
May‐17
Jun‐17
Jul‐17
Aug‐17
Sep‐17
Oct‐17
Nov‐17
(26) Rolling HSMR by Non‐weekend/Weekend
Rolling 12month HSMR
Non‐weekend
Weekend

QUALITY Patient Outcomes/EffectivenessSepsisAccountable Officer: Medical Director
*When looking at the results on these graphs it should be noted that the information is derived from the CQUIN audit. This audit requires only 50 emergency admissions and 50 inpatients notes to be used as a data source.
(28) Sepsis screening continues to be at an excellent level
(29) The CQUIN results in Decembershowed a decrease to 65% in December from 82% in November for antibiotics being given within the hour.
(30) 100% of inpatients were screened.
(31) 100% of patients diagnosed with sepsis as an inpatient were given antibiotics within an hour. The plan was for the Sepsis screening tool on Nervecentre to commence in April 2018. When introduced, all patients will be screened for sepsis and staff alerted to make a decision on a possible diagnosis. For this to succeed all staff will need to ensure they are logged in throughout their working shift, or delays will occur.
24
30%
40%
50%
60%
70%
80%
90%
100%
Apr‐16
May‐16
Jun‐16
Jul‐16
Aug‐16
Sep‐16
Oct‐16
Nov‐16
Dec‐16
Jan‐17
Feb‐17
Mar‐17
Apr‐17
May‐17
Jun‐17
Jul‐17
Aug‐17
Sep‐17
Oct‐17
Nov‐17
Dec‐17
(28) Patients who met the criteria and were screened for sepsis ‐ ED & other admitting areas
Actual
Standard
0%
20%
40%
60%
80%
100%
Apr‐16
May‐16
Jun‐16
Jul‐16
Aug‐16
Sep‐16
Oct‐16
Nov‐16
Dec‐16
Jan‐17
Feb‐17
Mar‐17
Apr‐17
May‐17
Jun‐17
Jul‐17
Aug‐17
Sep‐17
Oct‐17
Nov‐17
Dec‐17
(29) IV antibiotics within 1 hour (severe sepsis) ‐ED & other admitting areas
Actual
Standard
0%
20%
40%
60%
80%
100%
Apr‐16
May‐16
Jun‐16
Jul‐16
Aug‐16
Sep‐16
Oct‐16
Nov‐16
Dec‐16
Jan‐17
Feb‐17
Mar‐17
Apr‐17
May‐17
Jun‐17
Jul‐17
Aug‐17
Sep‐17
Oct‐17
Nov‐17
Dec‐17
(30) Patients who met the criteria and were screened for sepsis ‐ Inpatients
Actual
Standard
0%
20%
40%
60%
80%
100%
Oct‐16
Nov‐16
Dec‐16
Jan‐17
Feb‐17
Mar‐17
Apr‐17
May‐17
Jun‐17
Jul‐17
Aug‐17
Sep‐17
Oct‐17
Nov‐17
Dec‐17
(31) IV antibiotics within 1 hour (severe sepsis) ‐Inpatients
Actual
Standard
QUALITY Patient Outcomes/EffectivenessCardiac and Peri ArrestsAccountable Officer: Medical Director
25
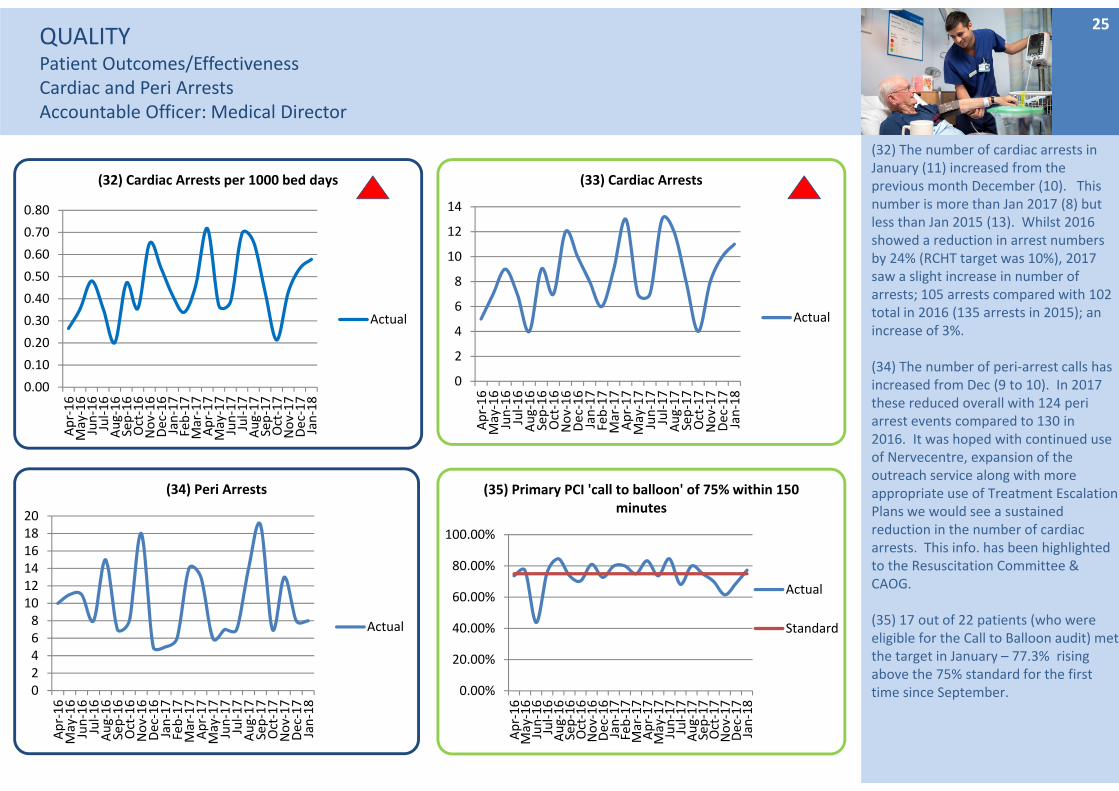
(32) The number of cardiac arrests in January (11) increased from the previous month December (10). This number is more than Jan 2017 (8) but less than Jan 2015 (13). Whilst 2016 showed a reduction in arrest numbers by 24% (RCHT target was 10%), 2017 saw a slight increase in number of arrests; 105 arrests compared with 102 total in 2016 (135 arrests in 2015); an increase of 3%.
(34) The number of peri‐arrest calls has increased from Dec (9 to 10). In 2017 these reduced overall with 124 peri arrest events compared to 130 in 2016. It was hoped with continued use of Nervecentre, expansion of the outreach service along with more appropriate use of Treatment Escalation Plans we would see a sustained reduction in the number of cardiac arrests. This info. has been highlighted to the Resuscitation Committee & CAOG.
(35) 17 out of 22 patients (who were eligible for the Call to Balloon audit) met the target in January – 77.3% rising above the 75% standard for the first time since September.0
2468101214161820
Apr‐16
May‐16
Jun‐16
Jul‐16
Aug‐16
Sep‐16
Oct‐16
Nov‐16
Dec‐16
Jan‐17
Feb‐17
Mar‐17
Apr‐17
May‐17
Jun‐17
Jul‐17
Aug‐17
Sep‐17
Oct‐17
Nov‐17
Dec‐17
Jan‐18
(34) Peri Arrests
Actual
0.00
0.10
0.20
0.30
0.40
0.50
0.60
0.70
0.80
Apr‐16
May‐16
Jun‐16
Jul‐16
Aug‐16
Sep‐16
Oct‐16
Nov‐16
Dec‐16
Jan‐17
Feb‐17
Mar‐17
Apr‐17
May‐17
Jun‐17
Jul‐17
Aug‐17
Sep‐17
Oct‐17
Nov‐17
Dec‐17
Jan‐18
(32) Cardiac Arrests per 1000 bed days
Actual
0
2
4
6
8
10
12
14
Apr‐16
May‐16
Jun‐16
Jul‐16
Aug‐16
Sep‐16
Oct‐16
Nov‐16
Dec‐16
Jan‐17
Feb‐17
Mar‐17
Apr‐17
May‐17
Jun‐17
Jul‐17
Aug‐17
Sep‐17
Oct‐17
Nov‐17
Dec‐17
Jan‐18
(33) Cardiac Arrests
Actual
0.00%
20.00%
40.00%
60.00%
80.00%
100.00%
Apr‐16
May‐16
Jun‐16
Jul‐16
Aug‐16
Sep‐16
Oct‐16
Nov‐16
Dec‐16
Jan‐17
Feb‐17
Mar‐17
Apr‐17
May‐17
Jun‐17
Jul‐17
Aug‐17
Sep‐17
Oct‐17
Nov‐17
Dec‐17
Jan‐18
(35) Primary PCI 'call to balloon' of 75% within 150 minutes
Actual
Standard
Key Operational Standards Summary DashboardAccountable Officer: Chief Operating Officer
26
Key Operational StandardsEmergency & Urgent CareAccountable Officer: Chief Operating Officer
27
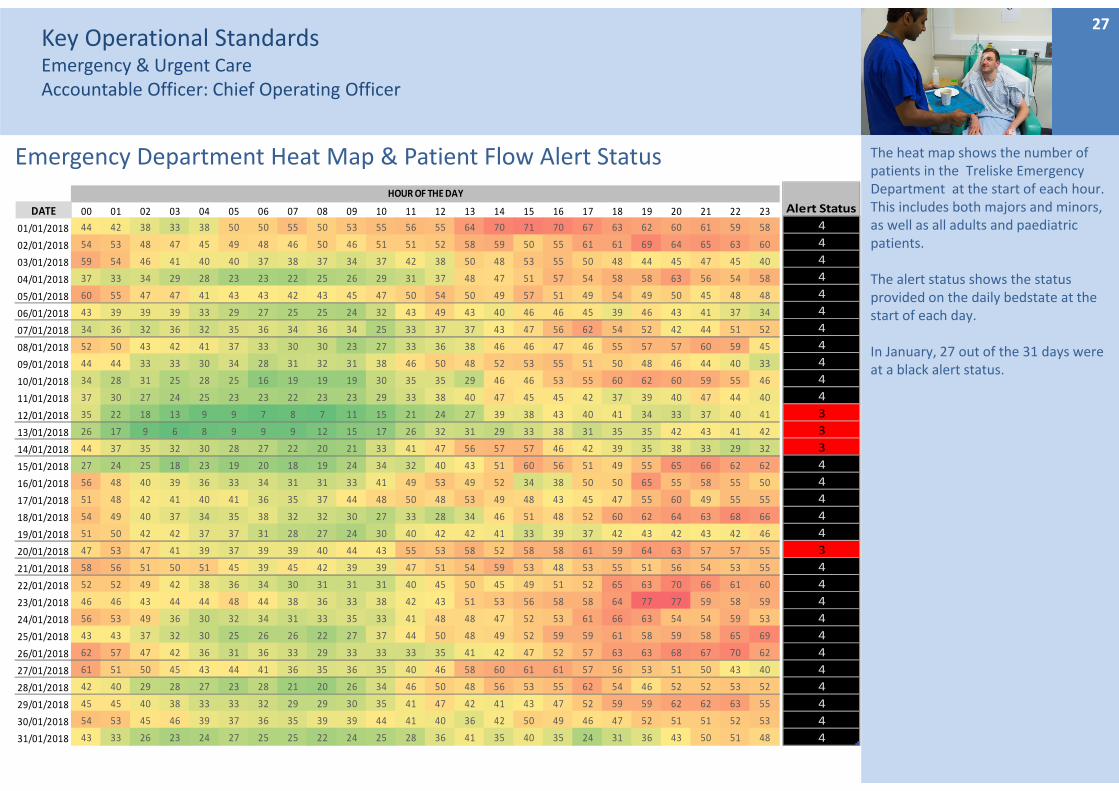
The heat map shows the number of patients in the Treliske Emergency Department at the start of each hour. This includes both majors and minors, as well as all adults and paediatric patients.
The alert status shows the status provided on the daily bedstate at the start of each day.
In January, 27 out of the 31 days were at a black alert status.
Emergency Department Heat Map & Patient Flow Alert Status
DATE 00 01 02 03 04 05 06 07 08 09 10 11 12 13 14 15 16 17 18 19 20 21 22 23
01/01/2018 44 42 38 33 38 50 50 55 50 53 55 56 55 64 70 71 70 67 63 62 60 61 59 58
02/01/2018 54 53 48 47 45 49 48 46 50 46 51 51 52 58 59 50 55 61 61 69 64 65 63 60
03/01/2018 59 54 46 41 40 40 37 38 37 34 37 42 38 50 48 53 55 50 48 44 45 47 45 40
04/01/2018 37 33 34 29 28 23 23 22 25 26 29 31 37 48 47 51 57 54 58 58 63 56 54 58
05/01/2018 60 55 47 47 41 43 43 42 43 45 47 50 54 50 49 57 51 49 54 49 50 45 48 48
06/01/2018 43 39 39 39 33 29 27 25 25 24 32 43 49 43 40 46 46 45 39 46 43 41 37 34
07/01/2018 34 36 32 36 32 35 36 34 36 34 25 33 37 37 43 47 56 62 54 52 42 44 51 52
08/01/2018 52 50 43 42 41 37 33 30 30 23 27 33 36 38 46 46 47 46 55 57 57 60 59 45
09/01/2018 44 44 33 33 30 34 28 31 32 31 38 46 50 48 52 53 55 51 50 48 46 44 40 33
10/01/2018 34 28 31 25 28 25 16 19 19 19 30 35 35 29 46 46 53 55 60 62 60 59 55 46
11/01/2018 37 30 27 24 25 23 23 22 23 23 29 33 38 40 47 45 45 42 37 39 40 47 44 40
12/01/2018 35 22 18 13 9 9 7 8 7 11 15 21 24 27 39 38 43 40 41 34 33 37 40 41
13/01/2018 26 17 9 6 8 9 9 9 12 15 17 26 32 31 29 33 38 31 35 35 42 43 41 42
14/01/2018 44 37 35 32 30 28 27 22 20 21 33 41 47 56 57 57 46 42 39 35 38 33 29 32
15/01/2018 27 24 25 18 23 19 20 18 19 24 34 32 40 43 51 60 56 51 49 55 65 66 62 62
16/01/2018 56 48 40 39 36 33 34 31 31 33 41 49 53 49 52 34 38 50 50 65 55 58 55 50
17/01/2018 51 48 42 41 40 41 36 35 37 44 48 50 48 53 49 48 43 45 47 55 60 49 55 55
18/01/2018 54 49 40 37 34 35 38 32 32 30 27 33 28 34 46 51 48 52 60 62 64 63 68 66
19/01/2018 51 50 42 42 37 37 31 28 27 24 30 40 42 42 41 33 39 37 42 43 42 43 42 46
20/01/2018 47 53 47 41 39 37 39 39 40 44 43 55 53 58 52 58 58 61 59 64 63 57 57 55
21/01/2018 58 56 51 50 51 45 39 45 42 39 39 47 51 54 59 53 48 53 55 51 56 54 53 55
22/01/2018 52 52 49 42 38 36 34 30 31 31 31 40 45 50 45 49 51 52 65 63 70 66 61 60
23/01/2018 46 46 43 44 44 48 44 38 36 33 38 42 43 51 53 56 58 58 64 77 77 59 58 59
24/01/2018 56 53 49 36 30 32 34 31 33 35 33 41 48 48 47 52 53 61 66 63 54 54 59 53
25/01/2018 43 43 37 32 30 25 26 26 22 27 37 44 50 48 49 52 59 59 61 58 59 58 65 69
26/01/2018 62 57 47 42 36 31 36 33 29 33 33 33 35 41 42 47 52 57 63 63 68 67 70 62
27/01/2018 61 51 50 45 43 44 41 36 35 36 35 40 46 58 60 61 61 57 56 53 51 50 43 40
28/01/2018 42 40 29 28 27 23 28 21 20 26 34 46 50 48 56 53 55 62 54 46 52 52 53 52
29/01/2018 45 45 40 38 33 33 32 29 29 30 35 41 47 42 41 43 47 52 59 59 62 62 63 55
30/01/2018 54 53 45 46 39 37 36 35 39 39 44 41 40 36 42 50 49 46 47 52 51 51 52 53
31/01/2018 43 33 26 23 24 27 25 25 22 24 25 28 36 41 35 40 35 24 31 36 43 50 51 48
HOUR OF THE DAY
Alert Status
4
4
4
4
4
4
4
4
4
4
4
3
3
3
4
4
4
4
4
3
4
4
4
4
4
4
4
4
4
4
4
Key Operational StandardsEmergency & Urgent CareAccountable Officer: Chief Operating Officer
28
Winter Pressures Dashboard
Key Operational StandardsEmergency & Urgent CareAccountable Officer: Chief Operating Officer
29
60%
65%
70%
75%
80%
85%
90%
95%
100%
Apr‐16
May‐16
Jun‐16
Jul‐16
Aug‐16
Sep‐16
Oct‐16
Nov‐16
Dec‐16
Jan‐17
Feb‐17
Mar‐17
Apr‐17
May‐17
Jun‐17
Jul‐17
Aug‐17
Sep‐17
Oct‐17
Nov‐17
Dec‐17
Jan‐18
(36) ED & MIU (from July17) attenders ‐ 4 hours arrival to discharge, admission or transfer
Actual
Standard
Localtrajectory
0%1%2%3%4%5%6%7%8%9%
Apr‐16
May‐16
Jun‐16
Jul‐16
Aug‐16
Sep‐16
Oct‐16
Nov‐16
Dec‐16
Jan‐17
Feb‐17
Mar‐17
Apr‐17
May‐17
Jun‐17
Jul‐17
Aug‐17
Sep‐17
Oct‐17
Nov‐17
Dec‐17
Jan‐18
(37) Unplanned reattendance at ED (% of total attenders)
Actual
Thresholdmin
Standard
0%
10%
20%
30%
40%
50%
60%
70%
Apr‐16
May‐16
Jun‐16
Jul‐16
Aug‐16
Sep‐16
Oct‐16
Nov‐16
Dec‐16
Jan‐17
Feb‐17
Mar‐17
Apr‐17
May‐17
Jun‐17
Jul‐17
Aug‐17
Sep‐17
Oct‐17
Nov‐17
Dec‐17
Jan‐18
(38) Ambulance Delays ‐% waiting over 15 minutes
Actual
Standard
0
50
100
150
200
250
300
Apr‐16
May‐16
Jun‐16
Jul‐16
Aug‐16
Sep‐16
Oct‐16
Nov‐16
Dec‐16
Jan‐17
Feb‐17
Mar‐17
Apr‐17
May‐17
Jun‐17
Jul‐17
Aug‐17
Sep‐17
Oct‐17
Nov‐17
Dec‐17
Jan‐18
(39) Ambulance Delays ‐ Numbers waiting over 30 minutes
Actual
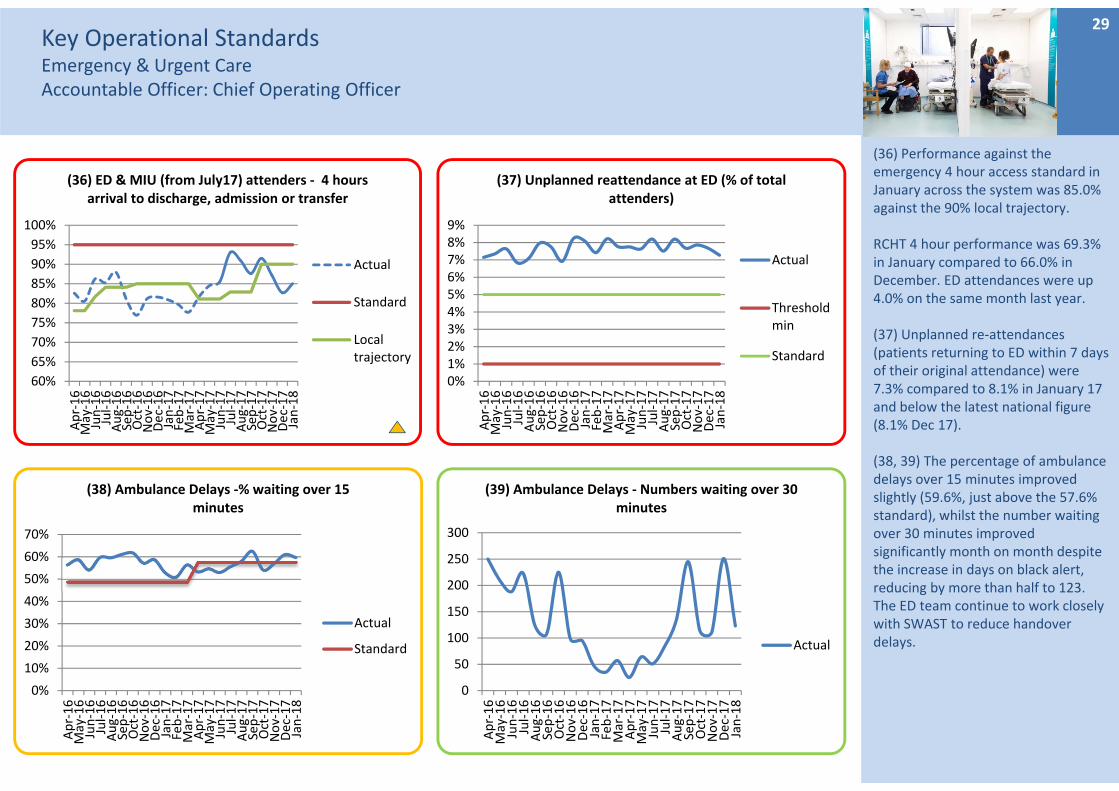
(36) Performance against the emergency 4 hour access standard in January across the system was 85.0% against the 90% local trajectory.
RCHT 4 hour performance was 69.3% in January compared to 66.0% in December. ED attendances were up 4.0% on the same month last year.
(37) Unplanned re‐attendances (patients returning to ED within 7 days of their original attendance) were 7.3% compared to 8.1% in January 17 and below the latest national figure (8.1% Dec 17).
(38, 39) The percentage of ambulance delays over 15 minutes improved slightly (59.6%, just above the 57.6% standard), whilst the number waiting over 30 minutes improved significantly month on month despite the increase in days on black alert, reducing by more than half to 123. The ED team continue to work closely with SWAST to reduce handover delays.
Key Operational StandardsEmergency & Urgent CareAccountable Officer: Chief Operating Officer
30
0%
1%
2%
3%
4%
5%
6%
Apr‐16
May‐16
Jun‐16
Jul‐16
Aug‐16
Sep‐16
Oct‐16
Nov‐16
Dec‐16
Jan‐17
Feb‐17
Mar‐17
Apr‐17
May‐17
Jun‐17
Jul‐17
Aug‐17
Sep‐17
Oct‐17
Nov‐17
Dec‐17
Jan‐18
(40) % of ED Attenders who left without being seen
Actual
Standard
0
1
2
Apr‐16
May‐16
Jun‐16
Jul‐16
Aug‐16
Sep‐16
Oct‐16
Nov‐16
Dec‐16
Jan‐17
Feb‐17
Mar‐17
Apr‐17
May‐17
Jun‐17
Jul‐17
Aug‐17
Sep‐17
Oct‐17
Nov‐17
Dec‐17
Jan‐18
(43) 12 hour trolley waits
Actual
051015202530354045
Apr‐16
May‐16
Jun‐16
Jul‐16
Aug‐16
Sep‐16
Oct‐16
Nov‐16
Dec‐16
Jan‐17
Feb‐17
Mar‐17
Apr‐17
May‐17
Jun‐17
Jul‐17
Aug‐17
Sep‐17
Oct‐17
Nov‐17
Dec‐17
Jan‐18
(41) 95th percentile, Time to Initial Assessment (mins)
Actual
Standard
0102030405060708090
Apr‐16
May‐16
Jun‐16
Jul‐16
Aug‐16
Sep‐16
Oct‐16
Nov‐16
Dec‐16
Jan‐17
Feb‐17
Mar‐17
Apr‐17
May‐17
Jun‐17
Jul‐17
Aug‐17
Sep‐17
Oct‐17
Nov‐17
Dec‐17
Jan‐18
(42) Median Time from Arrival to Treatment (mins)
Actual
Standard
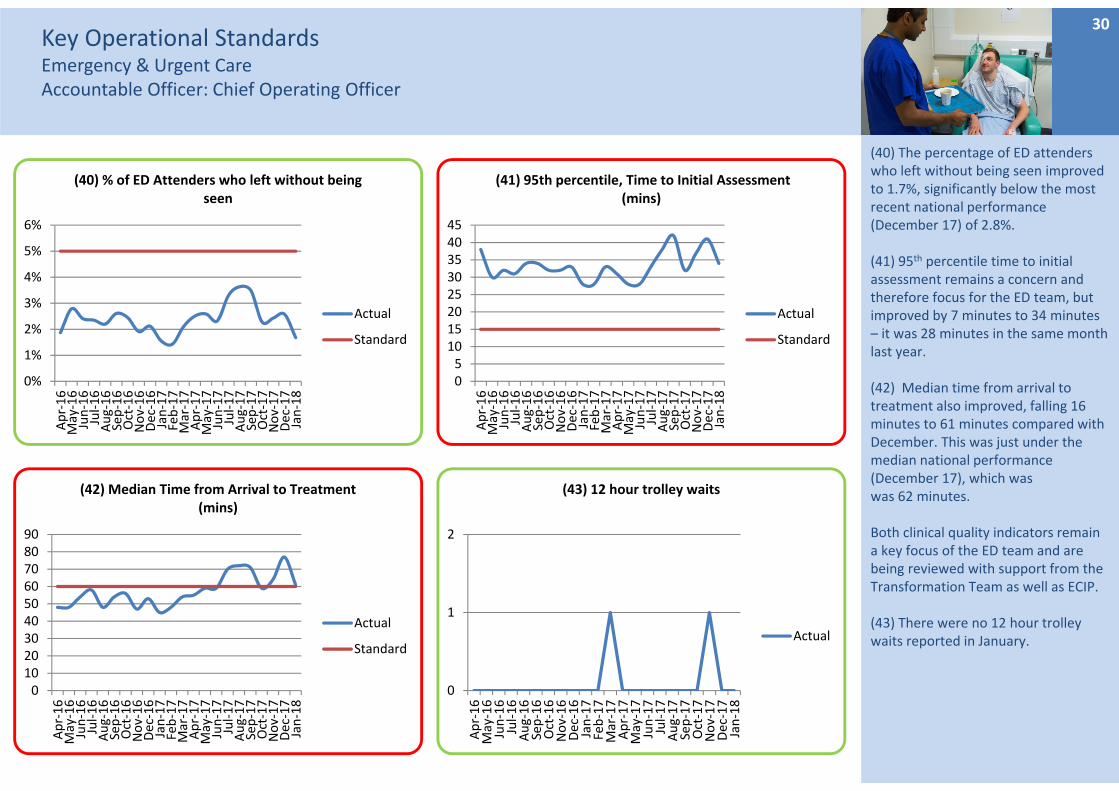
(40) The percentage of ED attenders who left without being seen improved to 1.7%, significantly below the most recent national performance (December 17) of 2.8%.
(41) 95th percentile time to initial assessment remains a concern and therefore focus for the ED team, but improved by 7 minutes to 34 minutes – it was 28 minutes in the same month last year.
(42) Median time from arrival to treatment also improved, falling 16 minutes to 61 minutes compared with December. This was just under the median national performance (December 17), which was was 62 minutes.
Both clinical quality indicators remain a key focus of the ED team and are being reviewed with support from the Transformation Team as well as ECIP.
(43) There were no 12 hour trolley waits reported in January.
Key Operational StandardsLength of StayAccountable Officer: Chief Operating Officer
31
0
10
20
30
40
50
60
Apr‐16
May‐16
Jun‐16
Jul‐16
Aug‐16
Sep‐16
Oct‐16
Nov‐16
Dec‐16
Jan‐17
Feb‐17
Mar‐17
Apr‐17
May‐17
Jun‐17
Jul‐17
Aug‐17
Sep‐17
Oct‐17
Nov‐17
Dec‐17
Jan‐18
(44) Total specialty outliers
Actual
Standard
0%
5%
10%
15%
20%
25%
30%
35%
40%
Apr‐16
May‐16
Jun‐16
Jul‐16
Aug‐16
Sep‐16
Oct‐16
Nov‐16
Dec‐16
Jan‐17
Feb‐17
Mar‐17
Apr‐17
May‐17
Jun‐17
Jul‐17
Aug‐17
Sep‐17
Oct‐17
Nov‐17
Dec‐17
Jan‐18
(45) Length of Stay over 10 days
Actual
Standard
0.00%
0.50%
1.00%
1.50%
2.00%
2.50%
3.00%
3.50%
4.00%
Apr‐16
May‐16
Jun‐16
Jul‐16
Aug‐16
Sep‐16
Oct‐16
Nov‐16
Dec‐16
Jan‐17
Feb‐17
Mar‐17
Apr‐17
May‐17
Jun‐17
Jul‐17
Aug‐17
Sep‐17
Oct‐17
Nov‐17
Dec‐17
Jan‐18
(46) % Discharges Between 6am and 10am
% Patientsdischargedbefore 10am
2
2.2
2.4
2.6
2.8
3
3.2
3.4
3.6
3.8
Apr‐16
May‐16
Jun‐16
Jul‐16
Aug‐16
Sep‐16
Oct‐16
Nov‐16
Dec‐16
Jan‐17
Feb‐17
Mar‐17
Apr‐17
May‐17
Jun‐17
Jul‐17
Aug‐17
Sep‐17
Oct‐17
Nov‐17
Dec‐17
Jan‐18
(47) Average LOS
Actual
Standard
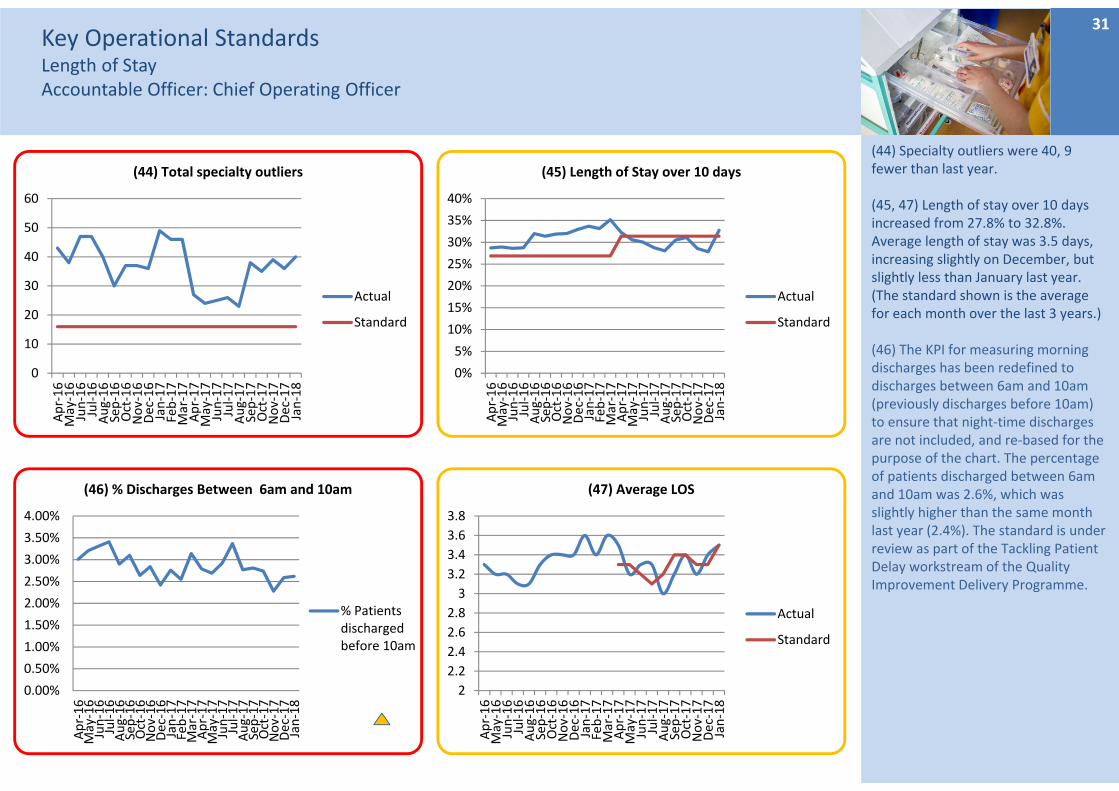
(44) Specialty outliers were 40, 9 fewer than last year.
(45, 47) Length of stay over 10 days increased from 27.8% to 32.8%. Average length of stay was 3.5 days, increasing slightly on December, but slightly less than January last year. (The standard shown is the average for each month over the last 3 years.)
(46) The KPI for measuring morning discharges has been redefined to discharges between 6am and 10am (previously discharges before 10am) to ensure that night‐time discharges are not included, and re‐based for the purpose of the chart. The percentage of patients discharged between 6am and 10am was 2.6%, which was slightly higher than the same month last year (2.4%). The standard is under review as part of the Tackling Patient Delay workstream of the Quality Improvement Delivery Programme.
Key Operational StandardsCancerAccountable Officer: Chief Operating Officer
32
90%
91%
92%
93%
94%
95%
96%
97%
98%
99%
Apr‐16
May‐16
Jun‐16
Jul‐16
Aug‐16
Sep‐16
Oct‐16
Nov‐16
Dec‐16
Jan‐17
Feb‐17
Mar‐17
Apr‐17
May‐17
Jun‐17
Jul‐17
Aug‐17
Sep‐17
Oct‐17
Nov‐17
Dec‐17
(48) Cancer 2 week wait
Actual
Standard
94%
95%
96%
97%
98%
99%
100%
Apr‐16
May‐16
Jun‐16
Jul‐16
Aug‐16
Sep‐16
Oct‐16
Nov‐16
Dec‐16
Jan‐17
Feb‐17
Mar‐17
Apr‐17
May‐17
Jun‐17
Jul‐17
Aug‐17
Sep‐17
Oct‐17
Nov‐17
Dec‐17
(49) Cancer treated within 31 Days Target
Actual
Standard
81%
82%
83%
84%
85%
86%
87%
88%
89%
90%
Apr‐16
May‐16
Jun‐16
Jul‐16
Aug‐16
Sep‐16
Oct‐16
Nov‐16
Dec‐16
Jan‐17
Feb‐17
Mar‐17
Apr‐17
May‐17
Jun‐17
Jul‐17
Aug‐17
Sep‐17
Oct‐17
Nov‐17
Dec‐17
(50) Cancer treated within 62 Days Target
Actual
Standard
60%65%70%75%80%85%90%95%100%
Apr‐16
May‐16
Jun‐16
Jul‐16
Aug‐16
Sep‐16
Oct‐16
Nov‐16
Dec‐16
Jan‐17
Feb‐17
Mar‐17
Apr‐17
May‐17
Jun‐17
Jul‐17
Aug‐17
Sep‐17
Oct‐17
Nov‐17
Dec‐17
(51) Percentage receiving first definitive treatment within 62 days of urgent referral from
national screening service
Actual
Standard
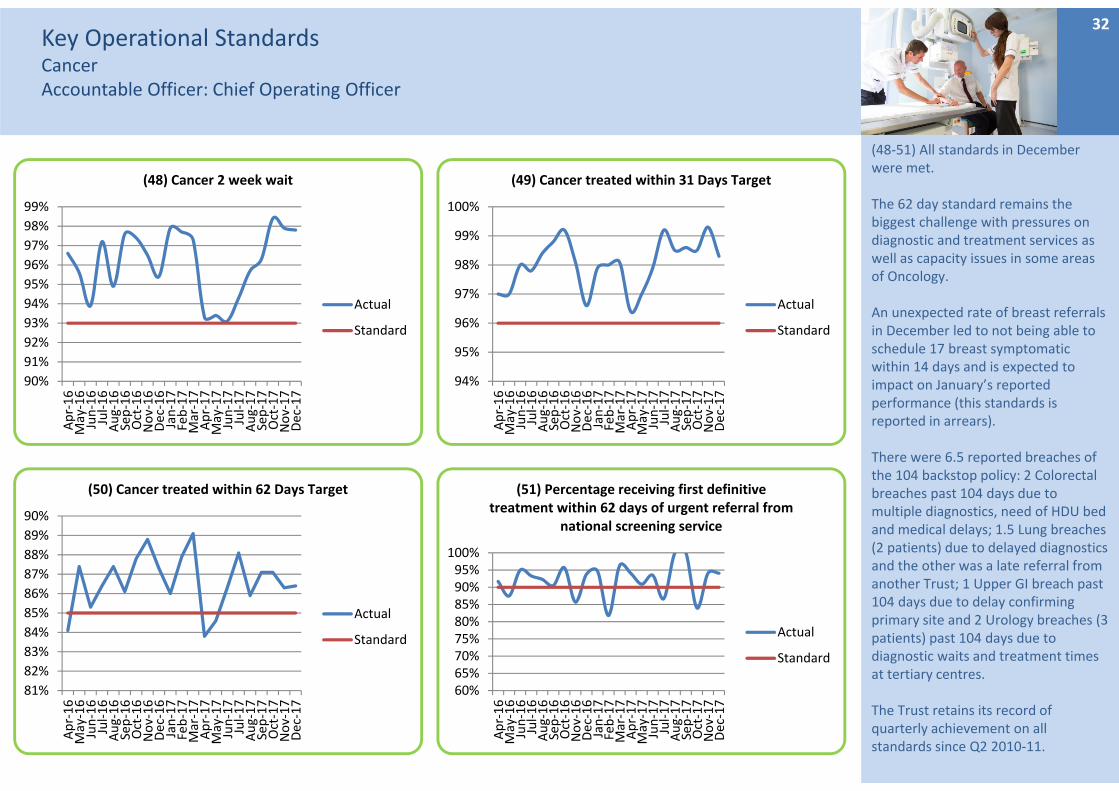
(48‐51) All standards in December were met.
The 62 day standard remains the biggest challenge with pressures on diagnostic and treatment services as well as capacity issues in some areas of Oncology.
An unexpected rate of breast referrals in December led to not being able to schedule 17 breast symptomatic within 14 days and is expected to impact on January’s reported performance (this standards is reported in arrears).
There were 6.5 reported breaches of the 104 backstop policy: 2 Colorectal breaches past 104 days due to multiple diagnostics, need of HDU bed and medical delays; 1.5 Lung breaches (2 patients) due to delayed diagnostics and the other was a late referral from another Trust; 1 Upper GI breach past 104 days due to delay confirming primary site and 2 Urology breaches (3patients) past 104 days due to diagnostic waits and treatment times at tertiary centres.
The Trust retains its record of quarterly achievement on all standards since Q2 2010‐11.
Key Operational StandardsReferral to treatmentAccountable Officer: Chief Operating Officer
33
76.0%
78.0%
80.0%
82.0%
84.0%
86.0%
88.0%
90.0%
92.0%
94.0%
Apr‐16
May‐16
Jun‐16
Jul‐16
Aug‐16
Sep‐16
Oct‐16
Nov‐16
Dec‐16
Jan‐17
Feb‐17
Mar‐17
Apr‐17
May‐17
Jun‐17
Jul‐17
Aug‐17
Sep‐17
Oct‐17
Nov‐17
Dec‐17
Jan‐18
(52) RTT Incomplete‐ % within 18 weeks
Actual
Standard
LocalTrajectory
0.00%
51.91%58.72%
65.35%71.19%
71.49%
71.80%
71.88%78.85%
79.78%
80.87%
82.61%
83.33%
86.75%
86.96%
88.24%
89.55%
89.57%
90.17%
90.84%
90.91%
90.91%
0%
20%
40%
60%
80%
100%
0
100
200
300
400
500
600
700
800
900
Paeds Urology
Colorectal surgery
Upper GI Surgery
Paeds Surgery
Dermatology
T & O
Cardiology
Vascular surgery
Urology
Gynaecology
Gen
eral surgery
Oral surgery
Paeds Gastro
ENT
Paeds neu
rology
Reh
abilitation
Ophthalmology
Orthodontics
Neu
rology
Resp M
edicine
Paeds Clinical…
Paeds Diabetic…
Incomplete %
Backlog (breaches)
(54) Specialties not achieving RTT standardADMITTED NON‐ADMITTED INCOMPLETE %
0
5000
10000
15000
20000
25000
30000
Apr‐16
May‐16
Jun‐16
Jul‐16
Aug‐16
Sep‐16
Oct‐16
Nov‐16
Dec‐16
Jan‐17
Feb‐17
Mar‐17
Apr‐17
May‐17
Jun‐17
Jul‐17
Aug‐17
Sep‐17
Oct‐17
Nov‐17
Dec‐17
Jan‐18
(53) Incomplete pathways
Actual
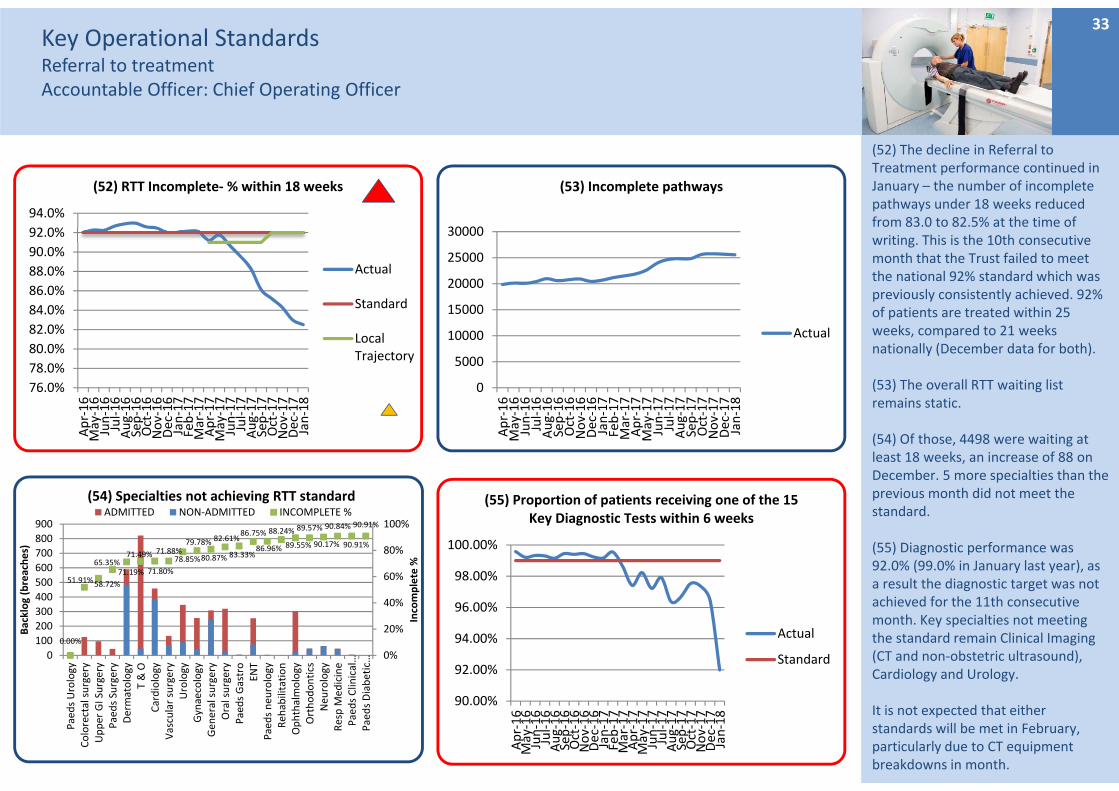
(52) The decline in Referral to Treatment performance continued in January – the number of incomplete pathways under 18 weeks reduced from 83.0 to 82.5% at the time of writing. This is the 10th consecutive month that the Trust failed to meet the national 92% standard which was previously consistently achieved. 92% of patients are treated within 25 weeks, compared to 21 weeks nationally (December data for both).
(53) The overall RTT waiting list remains static.
(54) Of those, 4498 were waiting at least 18 weeks, an increase of 88 on December. 5 more specialties than the previous month did not meet the standard.
(55) Diagnostic performance was 92.0% (99.0% in January last year), as a result the diagnostic target was not achieved for the 11th consecutive month. Key specialties not meeting the standard remain Clinical Imaging (CT and non‐obstetric ultrasound), Cardiology and Urology.
It is not expected that either standards will be met in February, particularly due to CT equipment breakdowns in month.
90.00%
92.00%
94.00%
96.00%
98.00%
100.00%
Apr‐16
May‐16
Jun‐16
Jul‐16
Aug‐16
Sep‐16
Oct‐16
Nov‐16
Dec‐16
Jan‐17
Feb‐17
Mar‐17
Apr‐17
May‐17
Jun‐17
Jul‐17
Aug‐17
Sep‐17
Oct‐17
Nov‐17
Dec‐17
Jan‐18
(55) Proportion of patients receiving one of the 15 Key Diagnostic Tests within 6 weeks
Actual
Standard
Key Operational StandardsCancelled OperationsAccountable Officer: Chief Operating Officer
34
0.0%
0.5%
1.0%
1.5%
2.0%
2.5%
3.0%
Apr‐16
May‐16
Jun‐16
Jul‐16
Aug‐16
Sep‐16
Oct‐16
Nov‐16
Dec‐16
Jan‐17
Feb‐17
Mar‐17
Apr‐17
May‐17
Jun‐17
Jul‐17
Aug‐17
Sep‐17
Oct‐17
Nov‐17
Dec‐17
Jan‐18
(57) Percentage Cancellations on same day
Actual
Standard
051015202530354045
Apr‐16
May‐16
Jun‐16
Jul‐16
Aug‐16
Sep‐16
Oct‐16
Nov‐16
Dec‐16
Jan‐17
Feb‐17
Mar‐17
Apr‐17
May‐17
Jun‐17
Jul‐17
Aug‐17
Sep‐17
Oct‐17
Nov‐17
Dec‐17
Jan‐18
(58) 28 day re‐booking breaches & urgent operations cancelled more than once
Breaches
Urgent Morethan Once
0%
1%
2%
3%
4%
5%
6%
7%
Apr‐16
May‐16
Jun‐16
Jul‐16
Aug‐16
Sep‐16
Oct‐16
Nov‐16
Dec‐16
Jan‐17
Feb‐17
Mar‐17
Apr‐17
May‐17
Jun‐17
Jul‐17
Aug‐17
Sep‐17
Oct‐17
Nov‐17
Dec‐17
Jan‐18
(59) Short notice OP Clinic cancellations
Actual
0
20
40
60
80
100
120
140
160
Apr‐16
May‐16
Jun‐16
Jul‐16
Aug‐16
Sep‐16
Oct‐16
Nov‐16
Dec‐16
Jan‐17
Feb‐17
Mar‐17
Apr‐17
May‐17
Jun‐17
Jul‐17
Aug‐17
Sep‐17
Oct‐17
Nov‐17
Dec‐17
Jan‐18
(56) RTT waits over 52 weeks for incomplete pathways
Actual
Standard
Trajectory
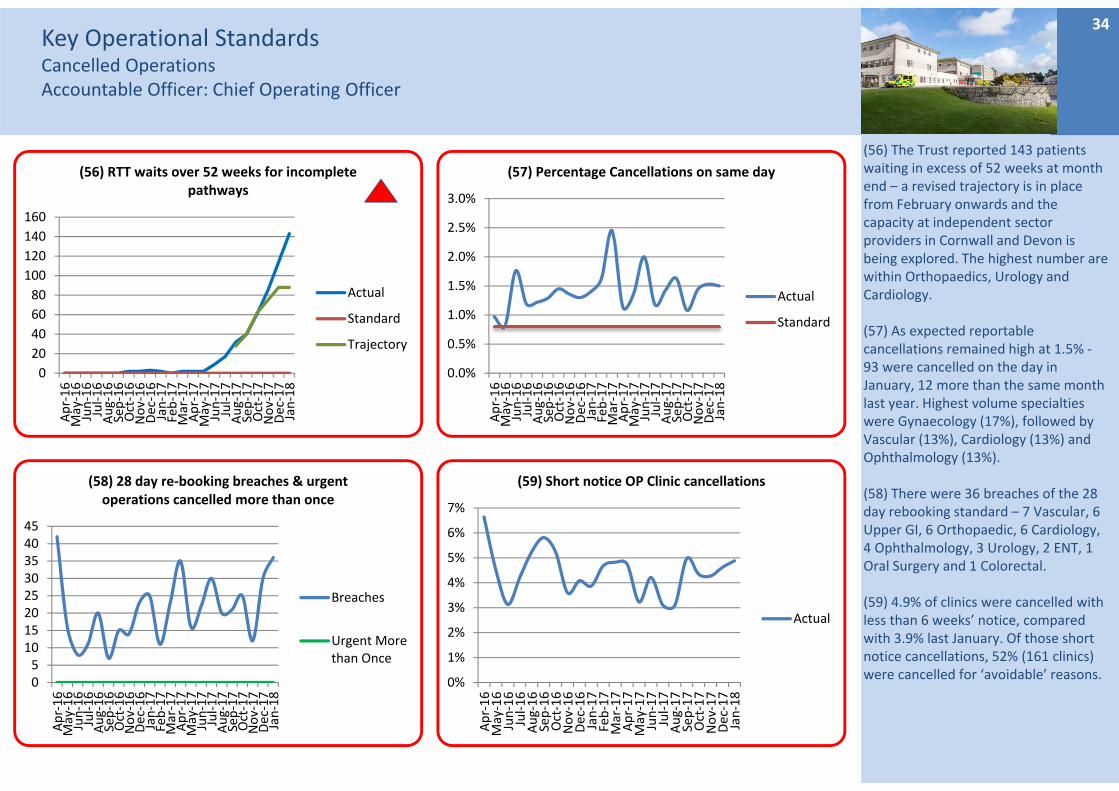
(56) The Trust reported 143 patients waiting in excess of 52 weeks at month end – a revised trajectory is in place from February onwards and the capacity at independent sector providers in Cornwall and Devon is being explored. The highest number are within Orthopaedics, Urology and Cardiology.
(57) As expected reportable cancellations remained high at 1.5% ‐93 were cancelled on the day in January, 12 more than the same month last year. Highest volume specialties were Gynaecology (17%), followed by Vascular (13%), Cardiology (13%) and Ophthalmology (13%).
(58) There were 36 breaches of the 28 day rebooking standard – 7 Vascular, 6 Upper GI, 6 Orthopaedic, 6 Cardiology, 4 Ophthalmology, 3 Urology, 2 ENT, 1 Oral Surgery and 1 Colorectal.
(59) 4.9% of clinics were cancelled with less than 6 weeks’ notice, compared with 3.9% last January. Of those short notice cancellations, 52% (161 clinics) were cancelled for ‘avoidable’ reasons.
Key Operational Standards Specialised PathwaysFractured Neck of Femur & Stroke IndicatorsAccountable Officer: Chief Operating Officer
35
0%10%20%30%40%50%60%70%80%90%100%
Apr‐16
May‐16
Jun‐16
Jul‐16
Aug‐16
Sep‐16
Oct‐16
Nov‐16
Dec‐16
Jan‐17
Feb‐17
Mar‐17
Apr‐17
May‐17
Jun‐17
Jul‐17
Aug‐17
Sep‐17
Oct‐17
Nov‐17
Dec‐17
Jan‐18
(60) NOF patients operated on within 36 hours
Actual
Standard
0%10%20%30%40%50%60%70%80%90%100%
Apr‐16
May‐16
Jun‐16
Jul‐16
Aug‐16
Sep‐16
Oct‐16
Nov‐16
Dec‐16
Jan‐17
Feb‐17
Mar‐17
Apr‐17
May‐17
Jun‐17
Jul‐17
Aug‐17
Sep‐17
Oct‐17
Nov‐17
Dec‐17
Jan‐18
(63) Stroke patients receiving CT scan within 12 hours
Actual
Standard
0%10%20%30%40%50%60%70%80%90%100%
Apr‐16
May‐16
Jun‐16
Jul‐16
Aug‐16
Sep‐16
Oct‐16
Nov‐16
Dec‐16
Jan‐17
Feb‐17
Mar‐17
Apr‐17
May‐17
Jun‐17
Jul‐17
Aug‐17
Sep‐17
Oct‐17
Nov‐17
Dec‐17
Jan‐18
(61) % Patients spending 90% of their time on stroke unit
Actual
Standard
0%10%20%30%40%50%60%70%80%90%100%
Apr‐16
May‐16
Jun‐16
Jul‐16
Aug‐16
Sep‐16
Oct‐16
Nov‐16
Dec‐16
Jan‐17
Feb‐17
Mar‐17
Apr‐17
May‐17
Jun‐17
Jul‐17
Aug‐17
Sep‐17
Oct‐17
Nov‐17
Dec‐17
Jan‐18
(62) Stroke unit within 4 hours
Actual
Standard
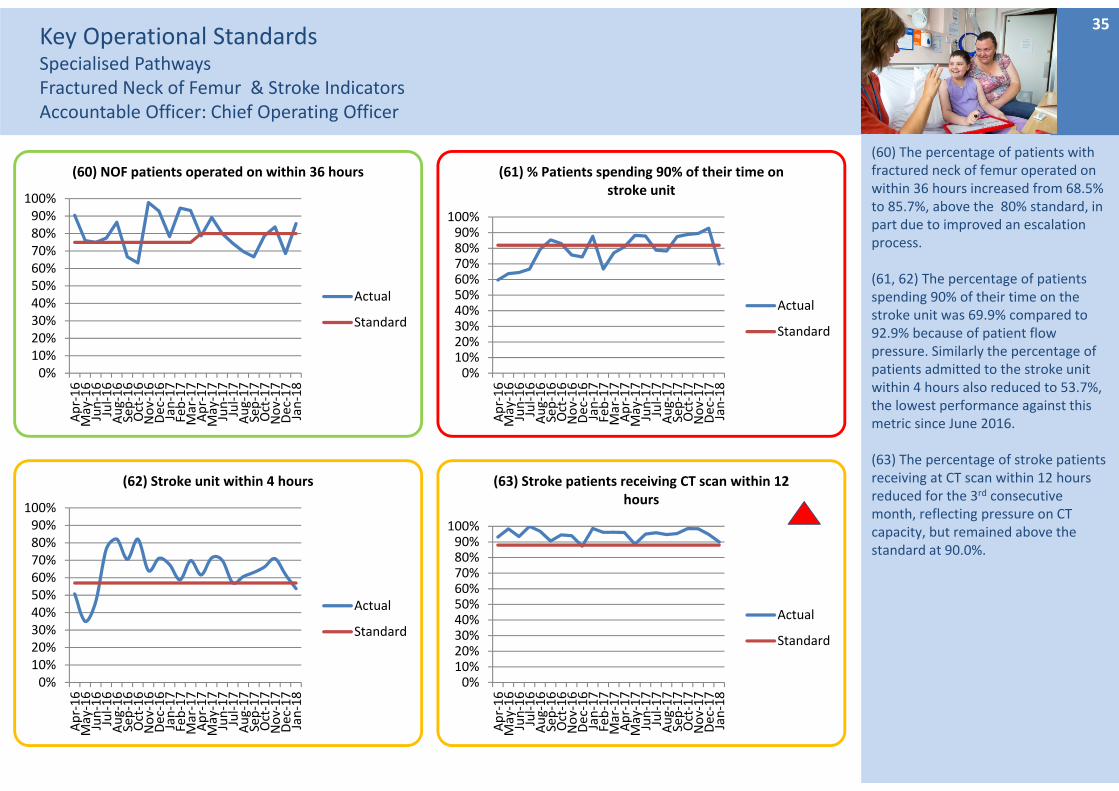
(60) The percentage of patients with fractured neck of femur operated on within 36 hours increased from 68.5% to 85.7%, above the 80% standard, in part due to improved an escalation process.
(61, 62) The percentage of patients spending 90% of their time on the stroke unit was 69.9% compared to 92.9% because of patient flow pressure. Similarly the percentage of patients admitted to the stroke unit within 4 hours also reduced to 53.7%, the lowest performance against this metric since June 2016.
(63) The percentage of stroke patients receiving at CT scan within 12 hours reduced for the 3rd consecutive month, reflecting pressure on CT capacity, but remained above the standard at 90.0%.
Key Operational Standards Specialised PathwaysStroke IndicatorsAccountable Officer: Chief Operating Officer
36
0%10%20%30%40%50%60%70%80%90%100%
Apr‐16
May‐16
Jun‐16
Jul‐16
Aug‐16
Sep‐16
Oct‐16
Nov‐16
Dec‐16
Jan‐17
Feb‐17
Mar‐17
Apr‐17
May‐17
Jun‐17
Jul‐17
Aug‐17
Sep‐17
Oct‐17
Nov‐17
Dec‐17
Jan‐18
(64) Scanning CT Urgent within 1 hour
Actual
Standard
0%10%20%30%40%50%60%70%80%90%100%
Apr‐16
May‐16
Jun‐16
Jul‐16
Aug‐16
Sep‐16
Oct‐16
Nov‐16
Dec‐16
Jan‐17
Feb‐17
Mar‐17
Apr‐17
May‐17
Jun‐17
Jul‐17
Aug‐17
Sep‐17
Oct‐17
Nov‐17
Dec‐17
Jan‐18
(65) Swallow screening within 4 hours
Actual
Standard
0%10%20%30%40%50%60%70%80%90%100%
Apr‐16
May‐16
Jun‐16
Jul‐16
Aug‐16
Sep‐16
Oct‐16
Nov‐16
Dec‐16
Jan‐17
Feb‐17
Mar‐17
Apr‐17
May‐17
Jun‐17
Jul‐17
Aug‐17
Sep‐17
Oct‐17
Nov‐17
Dec‐17
Jan‐18
(66) NIHSS Compliance
Actual
Standard
0%10%20%30%40%50%60%70%80%90%100%
Apr‐16
May‐16
Jun‐16
Jul‐16
Aug‐16
Sep‐16
Oct‐16
Nov‐16
Dec‐16
Jan‐17
Feb‐17
Mar‐17
Apr‐17
May‐17
Jun‐17
Jul‐17
Aug‐17
Sep‐17
Oct‐17
Nov‐17
Dec‐17
Jan‐18
(67) Swallow Assessment 72 hours
Actual
Standard
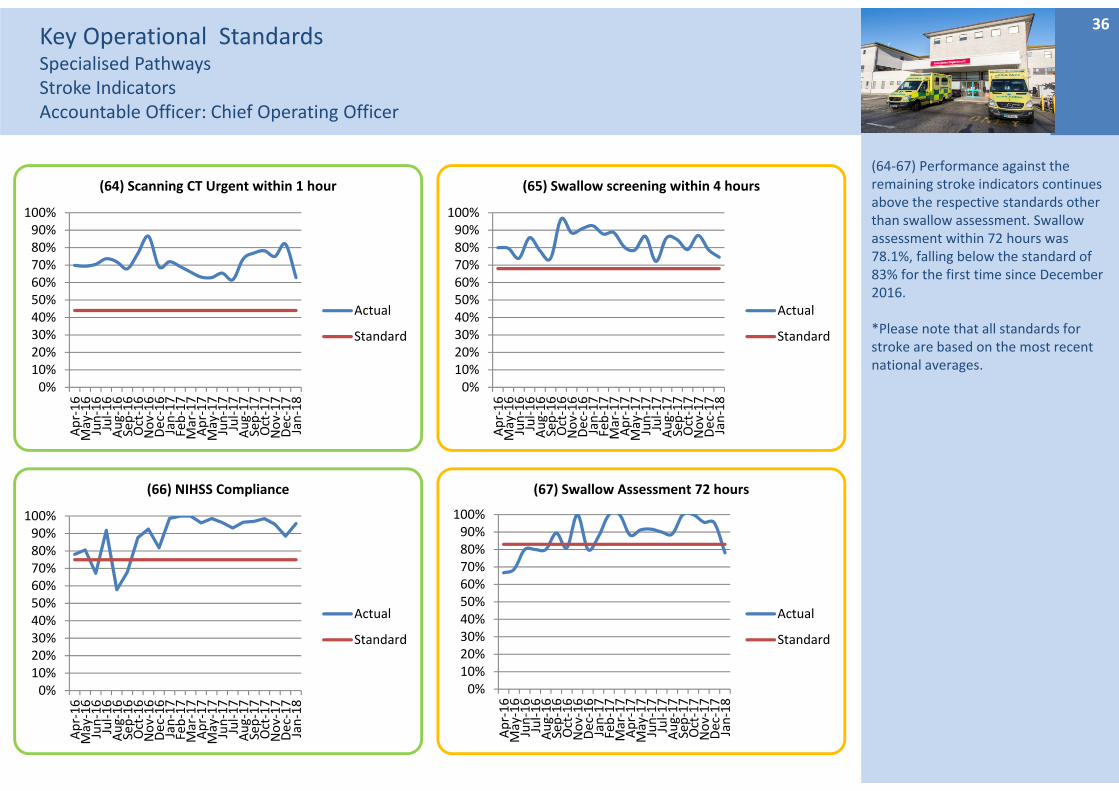
(64‐67) Performance against the remaining stroke indicators continues above the respective standards other than swallow assessment. Swallow assessment within 72 hours was 78.1%, falling below the standard of 83% for the first time since December 2016.
*Please note that all standards for stroke are based on the most recent national averages.
Key Operational StandardsProductivity and efficiency measuresAccountable Officer: Chief Operating Officer
37
85%
86%
87%
88%
89%
90%
91%
92%
93%
94%
Apr‐16
May‐16
Jun‐16
Jul‐16
Aug‐16
Sep‐16
Oct‐16
Nov‐16
Dec‐16
Jan‐17
Feb‐17
Mar‐17
Apr‐17
May‐17
Jun‐17
Jul‐17
Aug‐17
Sep‐17
Oct‐17
Nov‐17
Dec‐17
Jan‐18
(71) DOSA Rate
Actual
Standard
80%
81%
82%
83%
84%
85%
86%
87%
88%
Apr‐16
May‐16
Jun‐16
Jul‐16
Aug‐16
Sep‐16
Oct‐16
Nov‐16
Dec‐16
Jan‐17
Feb‐17
Mar‐17
Apr‐17
May‐17
Jun‐17
Jul‐17
Aug‐17
Sep‐17
Oct‐17
Nov‐17
Dec‐17
Jan‐18
(70) Daycase rate
Actual
Standard
0%
2%
4%
6%
8%
10%
12%
14%
Apr‐16
May‐16
Jun‐16
Jul‐16
Aug‐16
Sep‐16
Oct‐16
Nov‐16
Dec‐16
Jan‐17
Feb‐17
Mar‐17
Apr‐17
May‐17
Jun‐17
Jul‐17
Aug‐17
Sep‐17
Oct‐17
Nov‐17
Dec‐17
Jan‐18
(68) Delayed transfers of care (days lost %)
Actual
Standard
0
50
100
150
200
250
300
350
Apr‐16
May‐16
Jun‐16
Jul‐16
Aug‐16
Sep‐16
Oct‐16
Nov‐16
Dec‐16
Jan‐17
Feb‐17
Mar‐17
Apr‐17
May‐17
Jun‐17
Jul‐17
Aug‐17
Sep‐17
Oct‐17
Nov‐17
Dec‐17
Jan‐18
(69) Delayed transfers of care by reason
Public Funding
Residential Home
Patient or Family Choice
Nursing Home
Further non acute NHS care
Domiciliary Package
Completion of assessment
Community Equipment
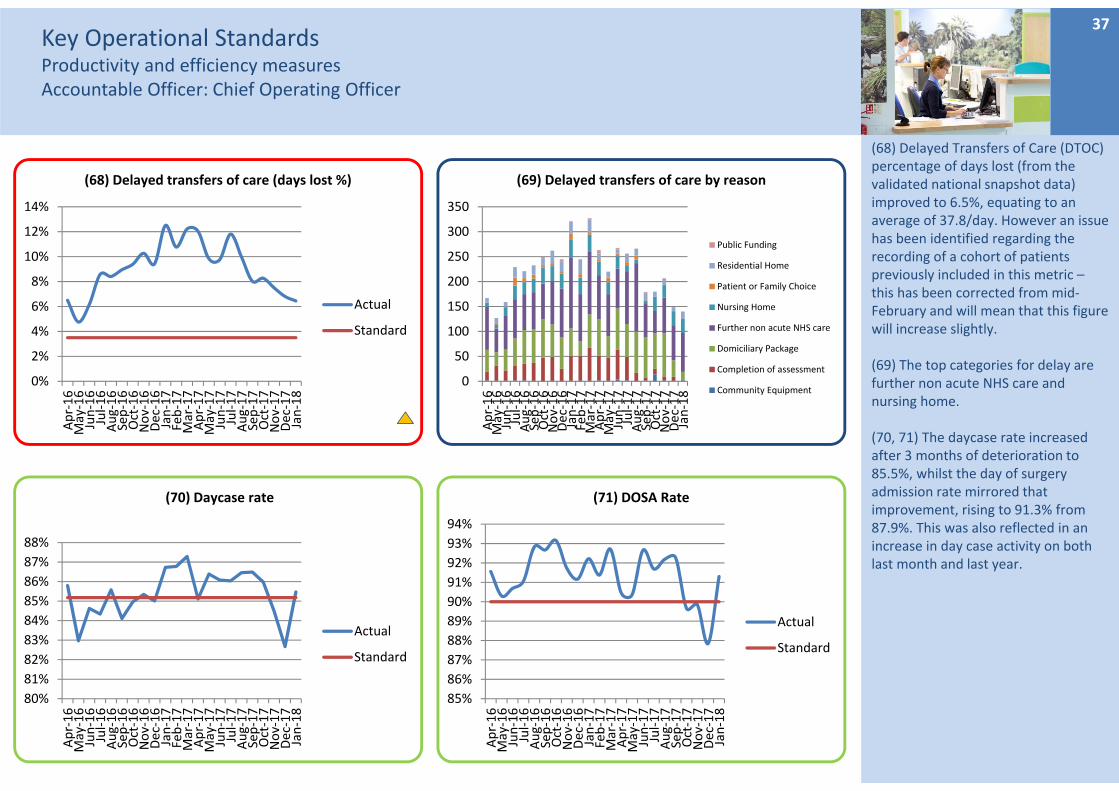
(68) Delayed Transfers of Care (DTOC) percentage of days lost (from the validated national snapshot data) improved to 6.5%, equating to an average of 37.8/day. However an issue has been identified regarding the recording of a cohort of patients previously included in this metric –this has been corrected from mid‐February and will mean that this figure will increase slightly.
(69) The top categories for delay are further non acute NHS care and nursing home.
(70, 71) The daycase rate increased after 3 months of deterioration to 85.5%, whilst the day of surgery admission rate mirrored that improvement, rising to 91.3% from 87.9%. This was also reflected in an increase in day case activity on both last month and last year.
Key Operational StandardsProductivity and efficiency measuresAccountable Officer: Chief Operating Officer
38
0%
1%
2%
3%
4%
5%
6%
7%
Apr‐16
May‐16
Jun‐16
Jul‐16
Aug‐16
Sep‐16
Oct‐16
Nov‐16
Dec‐16
Jan‐17
Feb‐17
Mar‐17
Apr‐17
May‐17
Jun‐17
Jul‐17
Aug‐17
Sep‐17
Oct‐17
Nov‐17
Dec‐17
Jan‐18
(72) Net Emergency Readmissions within 28 days
Actual
Standard
4.0%
4.5%
5.0%
5.5%
6.0%
6.5%
7.0%
7.5%
Apr‐16
May‐16
Jun‐16
Jul‐16
Aug‐16
Sep‐16
Oct‐16
Nov‐16
Dec‐16
Jan‐17
Feb‐17
Mar‐17
Apr‐17
May‐17
Jun‐17
Jul‐17
Aug‐17
Sep‐17
Oct‐17
Nov‐17
Dec‐17
Jan‐18
(73) All OP DNA Rate
Actual
Standard
9.8
10.0
10.2
10.4
10.6
10.8
11.0
11.2
Apr‐16
May‐16
Jun‐16
Jul‐16
Aug‐16
Sep‐16
Oct‐16
Nov‐16
Dec‐16
Jan‐17
Feb‐17
Mar‐17
Apr‐17
May‐17
Jun‐17
Jul‐17
Aug‐17
Sep‐17
Oct‐17
Nov‐17
Dec‐17
Jan‐18
(75) Average Points per Clinic
Actual
Standard
0%1%2%3%4%5%6%7%8%9%
Apr‐16
May‐16
Jun‐16
Jul‐16
Aug‐16
Sep‐16
Oct‐16
Nov‐16
Dec‐16
Jan‐17
Feb‐17
Mar‐17
Apr‐17
May‐17
Jun‐17
Jul‐17
Aug‐17
Sep‐17
Oct‐17
Nov‐17
Dec‐17
Jan‐18
(74) Patients on the FUWL 1 Month Past Their To Be Seen Date
Actual
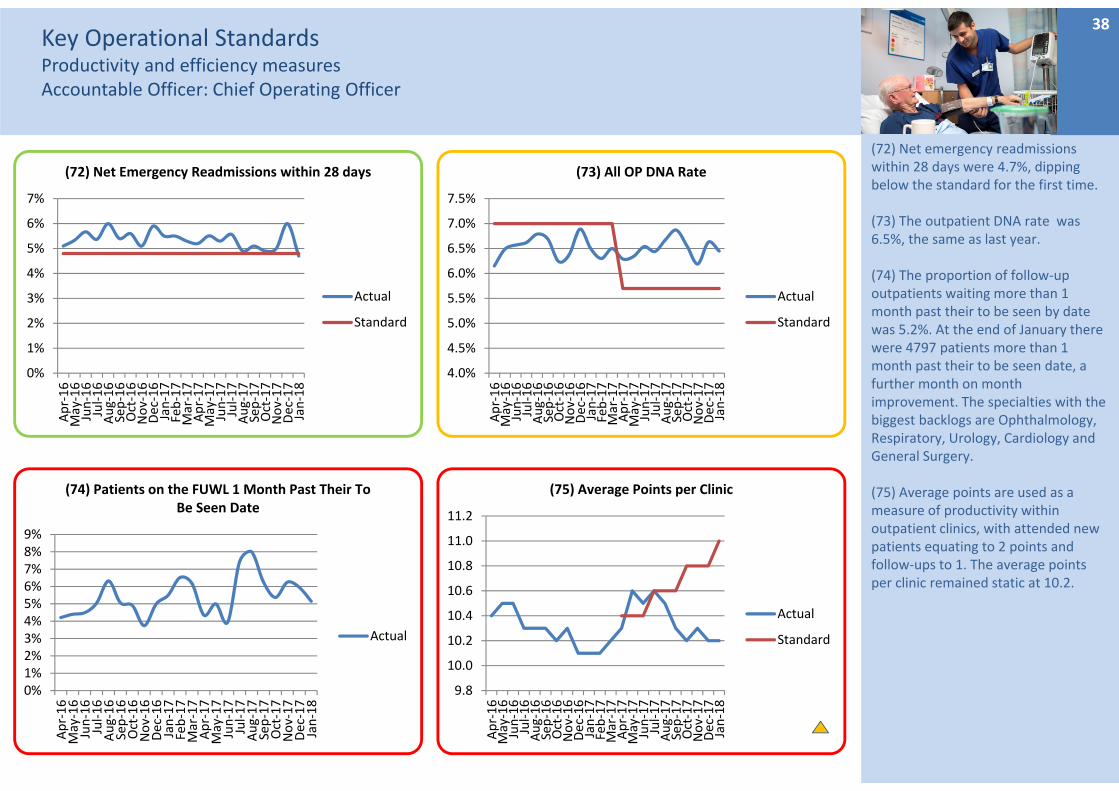
(72) Net emergency readmissions within 28 days were 4.7%, dipping below the standard for the first time.
(73) The outpatient DNA rate was 6.5%, the same as last year.
(74) The proportion of follow‐up outpatients waiting more than 1 month past their to be seen by date was 5.2%. At the end of January there were 4797 patients more than 1 month past their to be seen date, a further month on month improvement. The specialties with the biggest backlogs are Ophthalmology, Respiratory, Urology, Cardiology and General Surgery.
(75) Average points are used as a measure of productivity within outpatient clinics, with attended new patients equating to 2 points and follow‐ups to 1. The average points per clinic remained static at 10.2.
FINANCESummary Dashboard
39
FINANCEIncome, Expenditure and SavingsAccountable Officer: Director of Finance
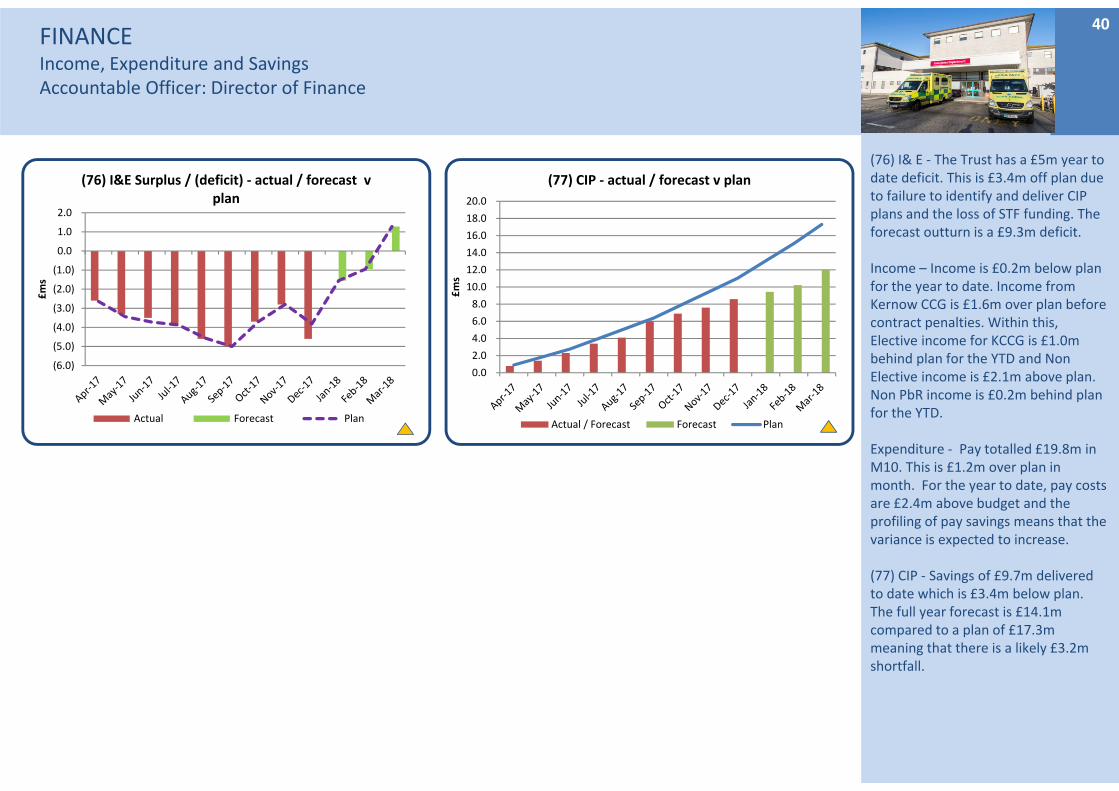
(76) I& E ‐ The Trust has a £5m year to date deficit. This is £3.4m off plan due to failure to identify and deliver CIP plans and the loss of STF funding. The forecast outturn is a £9.3m deficit.
Income – Income is £0.2m below plan for the year to date. Income from Kernow CCG is £1.6m over plan before contract penalties. Within this, Elective income for KCCG is £1.0m behind plan for the YTD and Non Elective income is £2.1m above plan. Non PbR income is £0.2m behind plan for the YTD.
Expenditure ‐ Pay totalled £19.8m in M10. This is £1.2m over plan in month. For the year to date, pay costs are £2.4m above budget and the profiling of pay savings means that the variance is expected to increase.
(77) CIP ‐ Savings of £9.7m delivered to date which is £3.4m below plan. The full year forecast is £14.1m compared to a plan of £17.3m meaning that there is a likely £3.2m shortfall.
40
(6.0)
(5.0)
(4.0)
(3.0)
(2.0)
(1.0)
0.0
1.0
2.0
£ms
(76) I&E Surplus / (deficit) ‐ actual / forecast v plan
Actual Forecast Plan
0.0
2.0
4.0
6.0
8.0
10.0
12.0
14.0
16.0
18.0
20.0
£ms
(77) CIP ‐ actual / forecast v plan
Actual / Forecast Forecast Plan
FINANCECash and CapitalAccountable Officer: Director of Finance
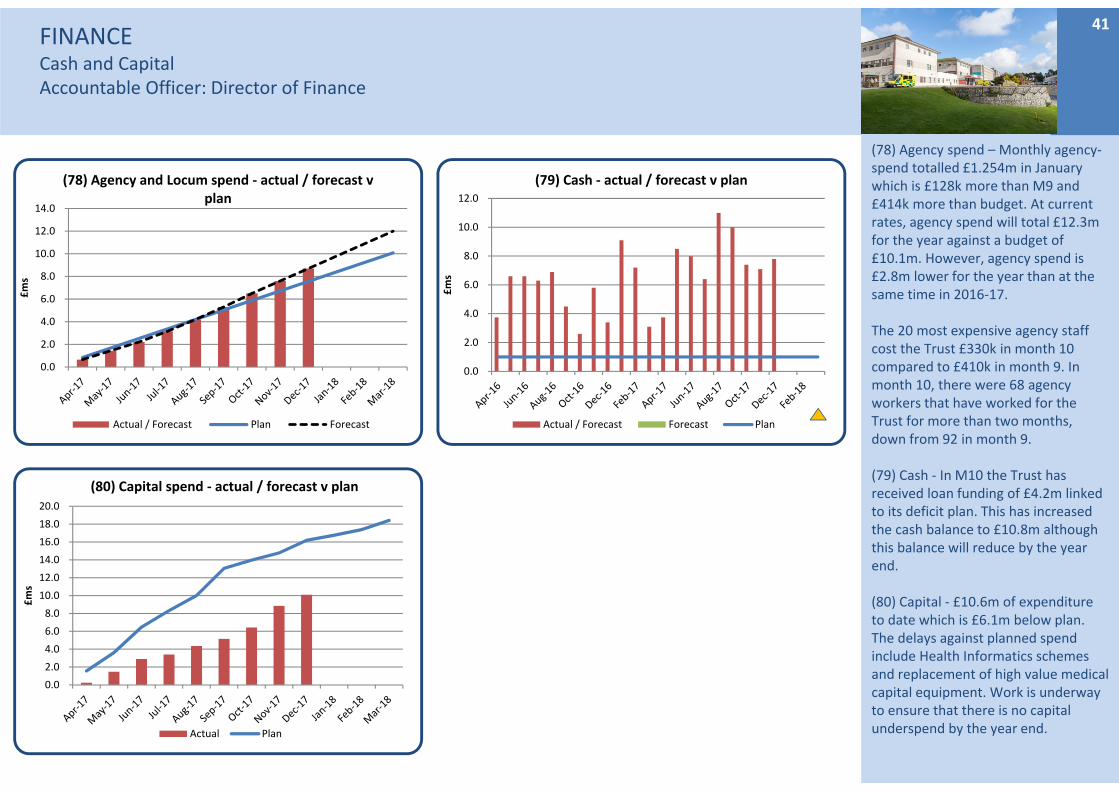
(78) Agency spend – Monthly agency‐spend totalled £1.254m in January which is £128k more than M9 and £414k more than budget. At current rates, agency spend will total £12.3m for the year against a budget of £10.1m. However, agency spend is £2.8m lower for the year than at the same time in 2016‐17.
The 20 most expensive agency staff cost the Trust £330k in month 10 compared to £410k in month 9. In month 10, there were 68 agency workers that have worked for the Trust for more than two months, down from 92 in month 9.
(79) Cash ‐ In M10 the Trust has received loan funding of £4.2m linked to its deficit plan. This has increased the cash balance to £10.8m although this balance will reduce by the year end.
(80) Capital ‐ £10.6m of expenditure to date which is £6.1m below plan. The delays against planned spend include Health Informatics schemes and replacement of high value medical capital equipment. Work is underway to ensure that there is no capital underspend by the year end.
41
0.0
2.0
4.0
6.0
8.0
10.0
12.0
14.0
£ms
(78) Agency and Locum spend ‐ actual / forecast v plan
Actual / Forecast Plan Forecast
0.0
2.0
4.0
6.0
8.0
10.0
12.0
£ms
(79) Cash ‐ actual / forecast v plan
Actual / Forecast Forecast Plan
0.0
2.0
4.0
6.0
8.0
10.0
12.0
14.0
16.0
18.0
20.0
£ms
(80) Capital spend ‐ actual / forecast v plan
Actual Plan
OUR PEOPLESummary Dashboard
42
OUR PEOPLEKey Workforce IndicatorsAccountable Officer: Director of HR & OD
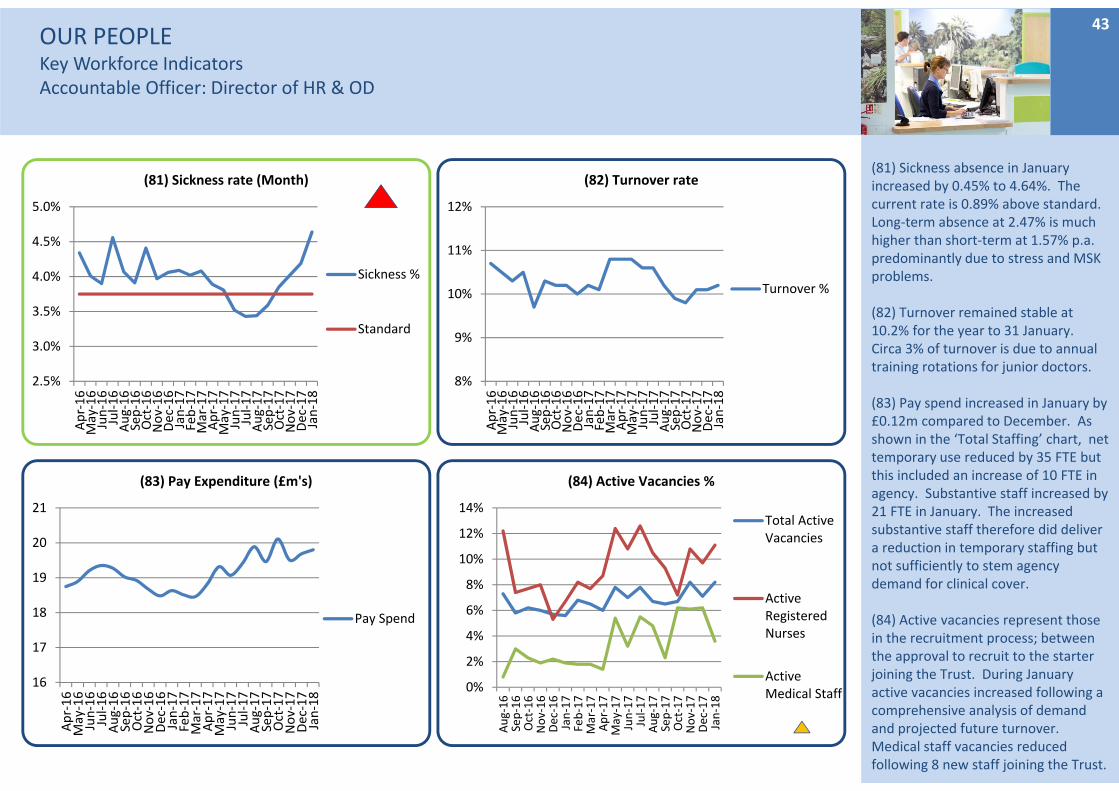
(81) Sickness absence in January increased by 0.45% to 4.64%. The current rate is 0.89% above standard. Long‐term absence at 2.47% is much higher than short‐term at 1.57% p.a. predominantly due to stress and MSK problems.
(82) Turnover remained stable at 10.2% for the year to 31 January. Circa 3% of turnover is due to annual training rotations for junior doctors.
(83) Pay spend increased in January by £0.12m compared to December. As shown in the ‘Total Staffing’ chart, net temporary use reduced by 35 FTE but this included an increase of 10 FTE in agency. Substantive staff increased by 21 FTE in January. The increased substantive staff therefore did deliver a reduction in temporary staffing but not sufficiently to stem agency demand for clinical cover.
(84) Active vacancies represent those in the recruitment process; between the approval to recruit to the starter joining the Trust. During January active vacancies increased following a comprehensive analysis of demand and projected future turnover. Medical staff vacancies reduced following 8 new staff joining the Trust.
43
2.5%
3.0%
3.5%
4.0%
4.5%
5.0%
Apr‐16
May‐16
Jun‐16
Jul‐16
Aug‐16
Sep‐16
Oct‐16
Nov‐16
Dec‐16
Jan‐17
Feb‐17
Mar‐17
Apr‐17
May‐17
Jun‐17
Jul‐17
Aug‐17
Sep‐17
Oct‐17
Nov‐17
Dec‐17
Jan‐18
(81) Sickness rate (Month)
Sickness %
Standard
8%
9%
10%
11%
12%
Apr‐16
May‐16
Jun‐16
Jul‐16
Aug‐16
Sep‐16
Oct‐16
Nov‐16
Dec‐16
Jan‐17
Feb‐17
Mar‐17
Apr‐17
May‐17
Jun‐17
Jul‐17
Aug‐17
Sep‐17
Oct‐17
Nov‐17
Dec‐17
Jan‐18
(82) Turnover rate
Turnover %
16
17
18
19
20
21
Apr‐16
May‐16
Jun‐16
Jul‐16
Aug‐16
Sep‐16
Oct‐16
Nov‐16
Dec‐16
Jan‐17
Feb‐17
Mar‐17
Apr‐17
May‐17
Jun‐17
Jul‐17
Aug‐17
Sep‐17
Oct‐17
Nov‐17
Dec‐17
Jan‐18
(83) Pay Expenditure (£m's)
Pay Spend
0%
2%
4%
6%
8%
10%
12%
14%Aug‐16
Sep‐16
Oct‐16
Nov‐16
Dec‐16
Jan‐17
Feb‐17
Mar‐17
Apr‐17
May‐17
Jun‐17
Jul‐17
Aug‐17
Sep‐17
Oct‐17
Nov‐17
Dec‐17
Jan‐18
(84) Active Vacancies %
Total ActiveVacancies
ActiveRegisteredNurses
ActiveMedical Staff
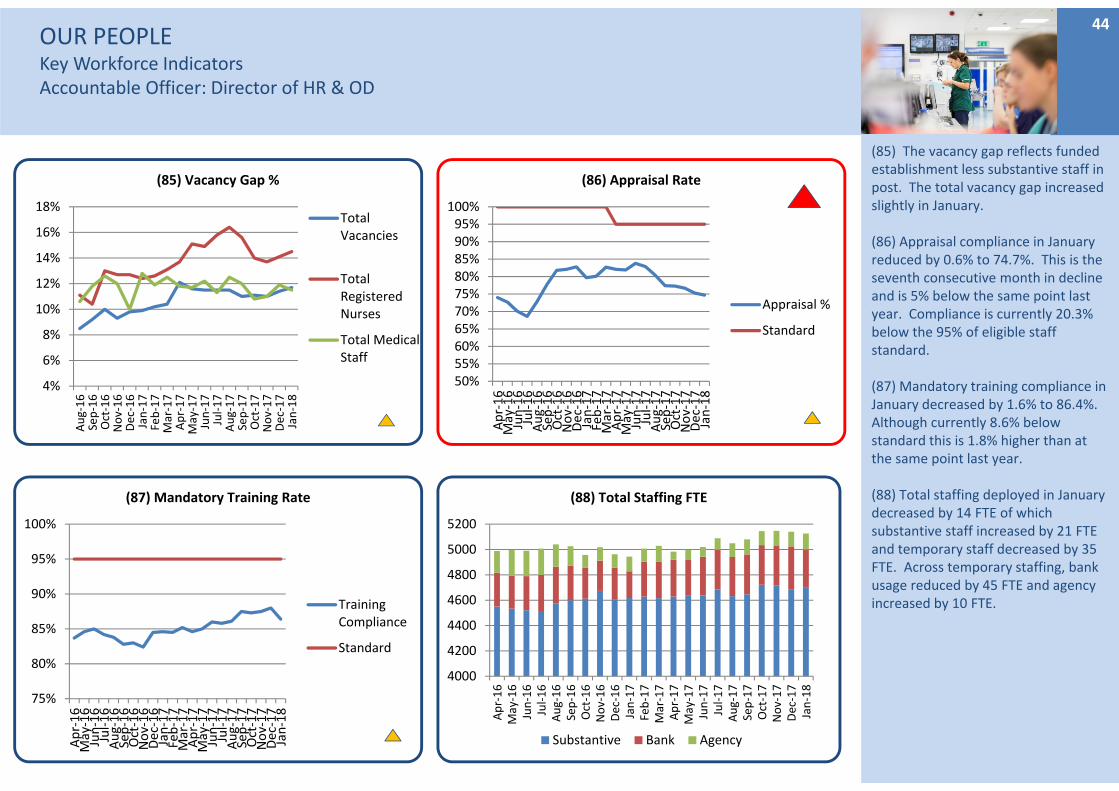
OUR PEOPLEKey Workforce IndicatorsAccountable Officer: Director of HR & OD
(85) The vacancy gap reflects funded establishment less substantive staff in post. The total vacancy gap increased slightly in January.
(86) Appraisal compliance in January reduced by 0.6% to 74.7%. This is the seventh consecutive month in decline and is 5% below the same point last year. Compliance is currently 20.3% below the 95% of eligible staff standard.
(87) Mandatory training compliance in January decreased by 1.6% to 86.4%. Although currently 8.6% below standard this is 1.8% higher than at the same point last year.
(88) Total staffing deployed in January decreased by 14 FTE of which substantive staff increased by 21 FTE and temporary staff decreased by 35 FTE. Across temporary staffing, bank usage reduced by 45 FTE and agency increased by 10 FTE.
44
4%
6%
8%
10%
12%
14%
16%
18%
Aug‐16
Sep‐16
Oct‐16
Nov‐16
Dec‐16
Jan‐17
Feb‐17
Mar‐17
Apr‐17
May‐17
Jun‐17
Jul‐17
Aug‐17
Sep‐17
Oct‐17
Nov‐17
Dec‐17
Jan‐18
(85) Vacancy Gap %
TotalVacancies
TotalRegisteredNurses
Total MedicalStaff
50%55%60%65%70%75%80%85%90%95%100%
Apr‐16
May‐16
Jun‐16
Jul‐16
Aug‐16
Sep‐16
Oct‐16
Nov‐16
Dec‐16
Jan‐17
Feb‐17
Mar‐17
Apr‐17
May‐17
Jun‐17
Jul‐17
Aug‐17
Sep‐17
Oct‐17
Nov‐17
Dec‐17
Jan‐18
(86) Appraisal Rate
Appraisal %
Standard
75%
80%
85%
90%
95%
100%
Apr‐16
May‐16
Jun‐16
Jul‐16
Aug‐16
Sep‐16
Oct‐16
Nov‐16
Dec‐16
Jan‐17
Feb‐17
Mar‐17
Apr‐17
May‐17
Jun‐17
Jul‐17
Aug‐17
Sep‐17
Oct‐17
Nov‐17
Dec‐17
Jan‐18
(87) Mandatory Training Rate
TrainingCompliance
Standard
4000
4200
4400
4600
4800
5000
5200
Apr‐16
May‐16
Jun‐16
Jul‐16
Aug‐16
Sep‐16
Oct‐16
Nov‐16
Dec‐16
Jan‐17
Feb‐17
Mar‐17
Apr‐17
May‐17
Jun‐17
Jul‐17
Aug‐17
Sep‐17
Oct‐17
Nov‐17
Dec‐17
Jan‐18
(88) Total Staffing FTE
Substantive Bank Agency
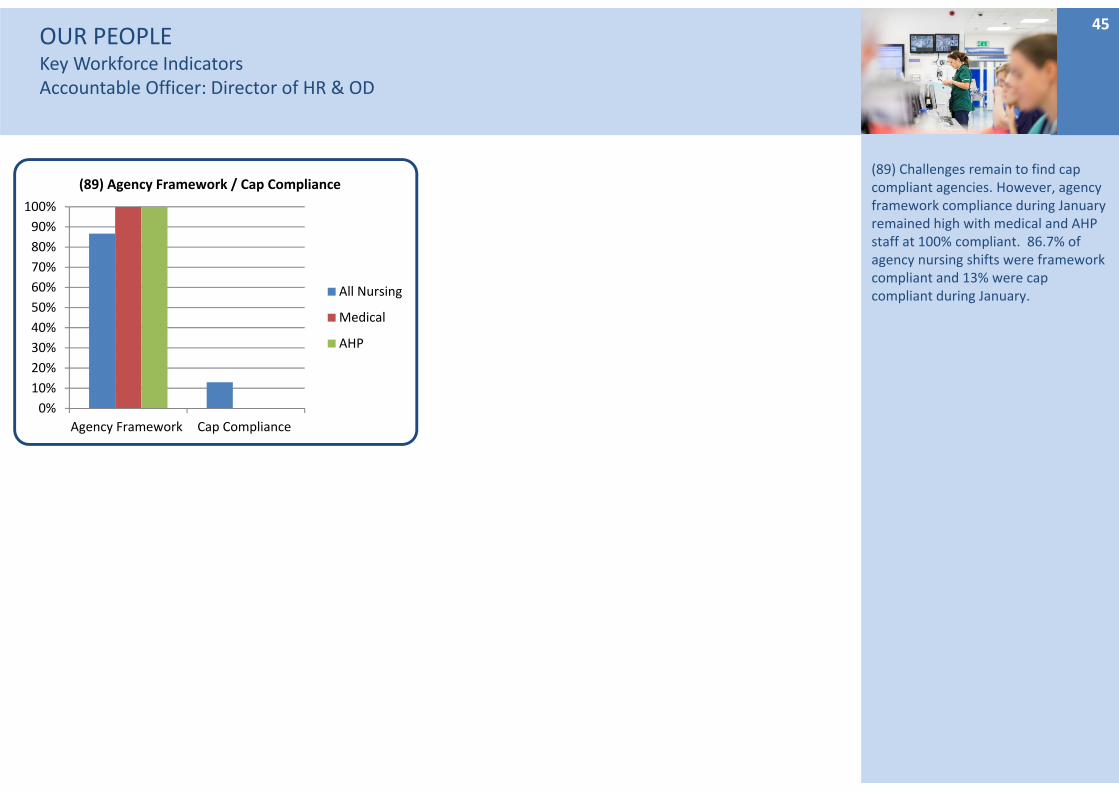
OUR PEOPLEKey Workforce IndicatorsAccountable Officer: Director of HR & OD
(89) Challenges remain to find cap compliant agencies. However, agency framework compliance during January remained high with medical and AHP staff at 100% compliant. 86.7% of agency nursing shifts were framework compliant and 13% were cap compliant during January.
45
0%
10%
20%
30%
40%
50%
60%
70%
80%
90%
100%
Agency Framework Cap Compliance
(89) Agency Framework / Cap Compliance
All Nursing
Medical
AHP
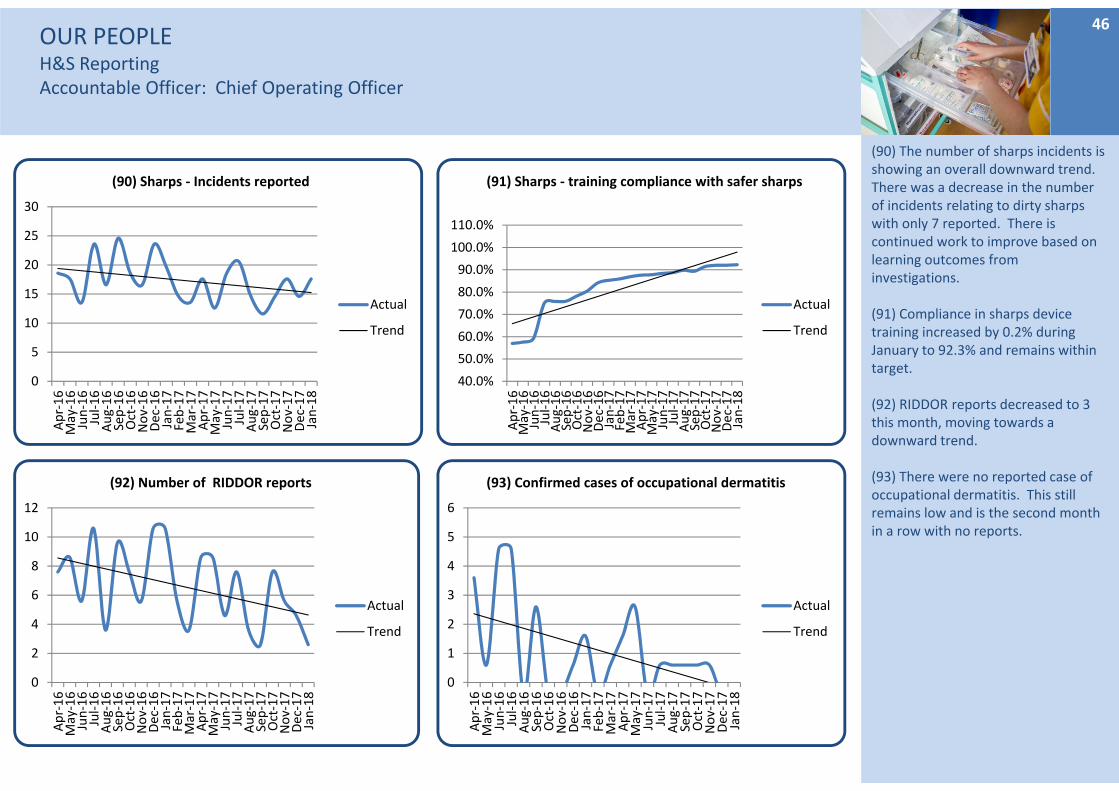
OUR PEOPLEH&S ReportingAccountable Officer: Chief Operating Officer
(90) The number of sharps incidents is showing an overall downward trend. There was a decrease in the number of incidents relating to dirty sharps with only 7 reported. There is continued work to improve based on learning outcomes from investigations.
(91) Compliance in sharps device training increased by 0.2% during January to 92.3% and remains within target.
(92) RIDDOR reports decreased to 3 this month, moving towards a downward trend.
(93) There were no reported case of occupational dermatitis. This still remains low and is the second month in a row with no reports.
46
0
5
10
15
20
25
30
Apr‐16
May‐16
Jun‐16
Jul‐16
Aug‐16
Sep‐16
Oct‐16
Nov‐16
Dec‐16
Jan‐17
Feb‐17
Mar‐17
Apr‐17
May‐17
Jun‐17
Jul‐17
Aug‐17
Sep‐17
Oct‐17
Nov‐17
Dec‐17
Jan‐18
(90) Sharps ‐ Incidents reported
Actual
Trend
40.0%
50.0%
60.0%
70.0%
80.0%
90.0%
100.0%
110.0%
Apr‐16
May‐16
Jun‐16
Jul‐16
Aug‐16
Sep‐16
Oct‐16
Nov‐16
Dec‐16
Jan‐17
Feb‐17
Mar‐17
Apr‐17
May‐17
Jun‐17
Jul‐17
Aug‐17
Sep‐17
Oct‐17
Nov‐17
Dec‐17
Jan‐18
(91) Sharps ‐ training compliance with safer sharps
Actual
Trend
0
2
4
6
8
10
12
Apr‐16
May‐16
Jun‐16
Jul‐16
Aug‐16
Sep‐16
Oct‐16
Nov‐16
Dec‐16
Jan‐17
Feb‐17
Mar‐17
Apr‐17
May‐17
Jun‐17
Jul‐17
Aug‐17
Sep‐17
Oct‐17
Nov‐17
Dec‐17
Jan‐18
(92) Number of RIDDOR reports
Actual
Trend
0
1
2
3
4
5
6
Apr‐16
May‐16
Jun‐16
Jul‐16
Aug‐16
Sep‐16
Oct‐16
Nov‐16
Dec‐16
Jan‐17
Feb‐17
Mar‐17
Apr‐17
May‐17
Jun‐17
Jul‐17
Aug‐17
Sep‐17
Oct‐17
Nov‐17
Dec‐17
Jan‐18
(93) Confirmed cases of occupational dermatitis
Actual
Trend
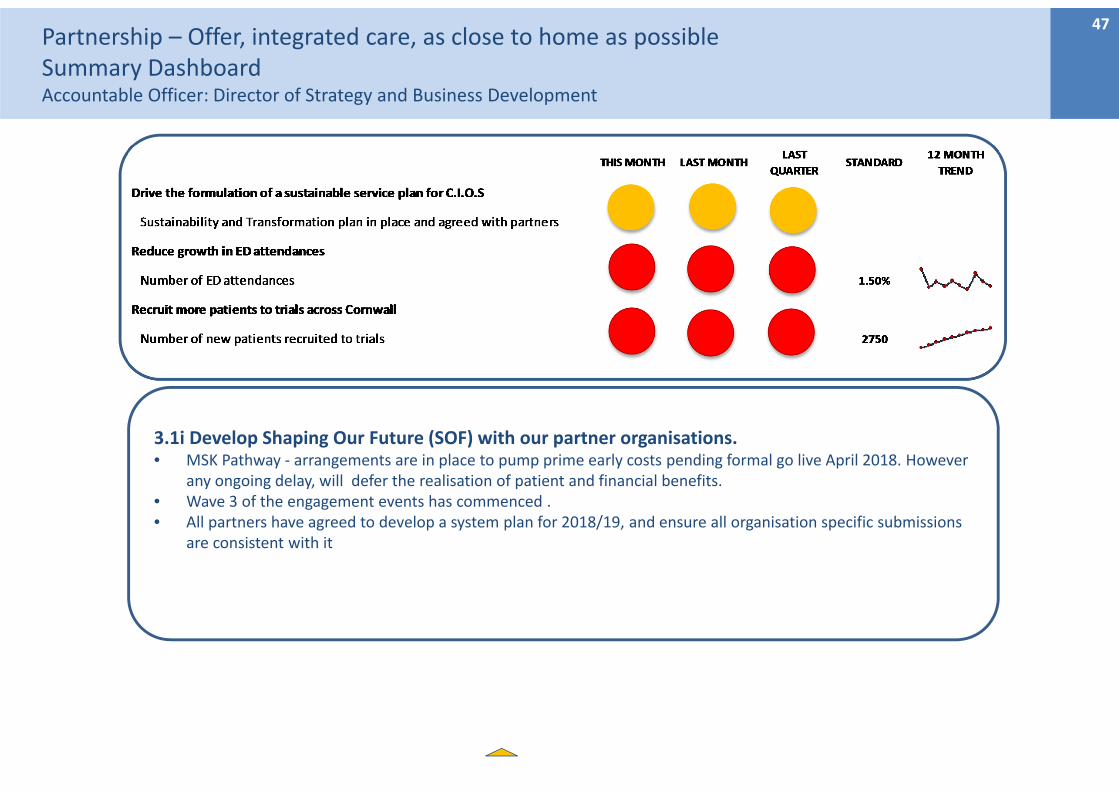
Partnership – Offer, integrated care, as close to home as possibleSummary DashboardAccountable Officer: Director of Strategy and Business Development
47
3.1i Develop Shaping Our Future (SOF) with our partner organisations. • MSK Pathway ‐ arrangements are in place to pump prime early costs pending formal go live April 2018. However
any ongoing delay, will defer the realisation of patient and financial benefits. • Wave 3 of the engagement events has commenced .• All partners have agreed to develop a system plan for 2018/19, and ensure all organisation specific submissions
are consistent with it
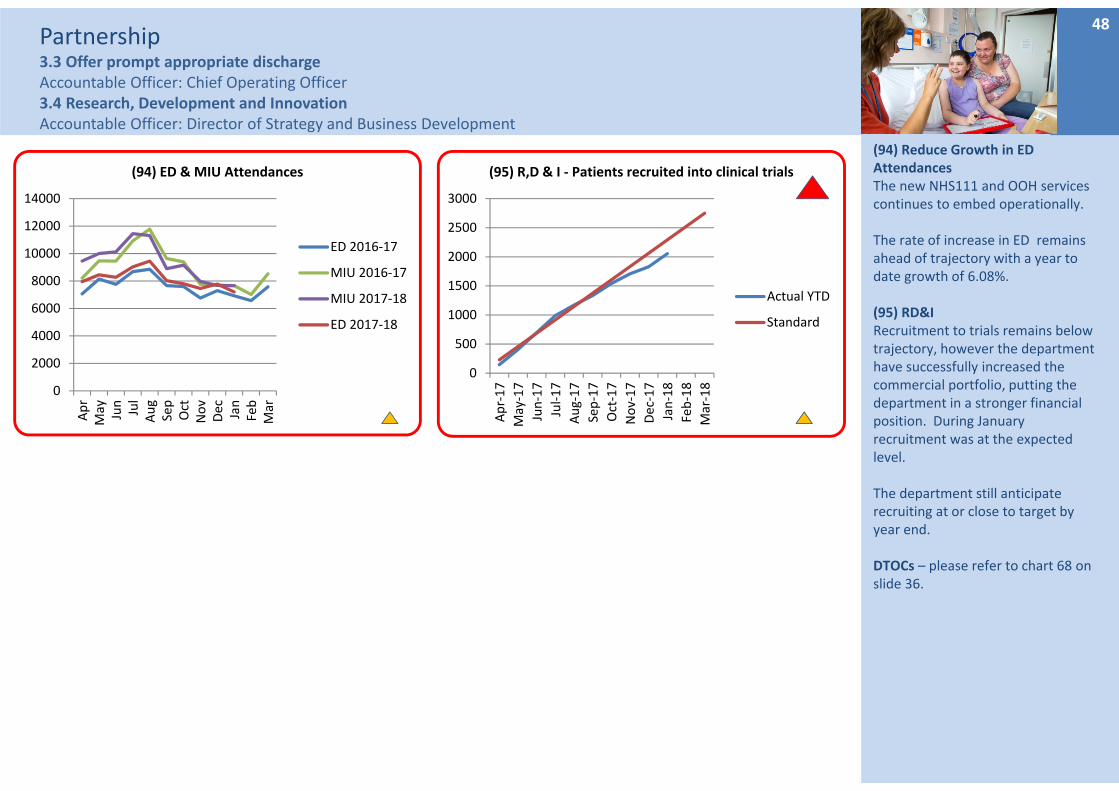
Partnership3.3 Offer prompt appropriate dischargeAccountable Officer: Chief Operating Officer3.4 Research, Development and InnovationAccountable Officer: Director of Strategy and Business Development
(94) Reduce Growth in ED AttendancesThe new NHS111 and OOH services continues to embed operationally.
The rate of increase in ED remains ahead of trajectory with a year to date growth of 6.08%.
(95) RD&I Recruitment to trials remains below trajectory, however the department have successfully increased the commercial portfolio, putting the department in a stronger financial position. During January recruitment was at the expected level.
The department still anticipate recruiting at or close to target by year end.
DTOCs – please refer to chart 68 on slide 36.
48
0
2000
4000
6000
8000
10000
12000
14000
Apr
May Jun
Jul
Aug
Sep
Oct
Nov
Dec Jan
Feb
Mar
(94) ED & MIU Attendances
ED 2016‐17
MIU 2016‐17
MIU 2017‐18
ED 2017‐18
0
500
1000
1500
2000
2500
3000
Apr‐17
May‐17
Jun‐17
Jul‐17
Aug‐17
Sep‐17
Oct‐17
Nov‐17
Dec‐17
Jan‐18
Feb‐18
Mar‐18
(95) R,D & I ‐ Patients recruited into clinical trials
Actual YTD
Standard


![Welcome [doclibrary-kccg.cornwall.nhs.uk]doclibrary-kccg.cornwall.nhs.uk/DocumentsLibrary/... · Three project stakeholder groups review. NHS Kernow senior management team review](https://img.pdfslide.us/doc/110x75/5fbfcdf9d7c4497eeb738032/welcome-doclibrary-kccg-doclibrary-kccg-three-project-stakeholder-groups-review.jpg)


![Welcome [doclibrary-kccg.cornwall.nhs.uk]doclibrary-kccg.cornwall.nhs.uk/DocumentsLibrary/... · 2019. 8. 28. · Saltash and St Barnabas Community Hospital Workshop 2 : About today](https://img.pdfslide.us/doc/110x75/6056aa68ef8c24337d1ddf9e/welcome-doclibrary-kccg-doclibrary-kccg-2019-8-28-saltash-and-st-barnabas.jpg)