Embed Size (px)
Citation preview
Crédit Du Maroc S.A.
SUMMARY OF THE PROSPECTUS
CAPITAL INCREASE PURSUANT TO THE 2014 STOCK
DIVIDEND OPTION PAYABLE IN NEW CDM SHARES
Maximum Number of Shares to be Issued: 405,066 shares
Issue Price per Share: DH 493
Par Value per Share: DH 100 Maximum Amount of the Transaction: DH 199,697,538
Option exercise period: From 17/08/2015 to 16/09/2015 inclusive
ISSUE RESTRICTED TO CREDIT DU MAROC SHAREHOLDERS (cum 2014 dividend)
Financial Adviser and Global Coordinator
Transfer Agent Centralising Agent
Approval of Conseil Déontologique des Valeurs Mobilières
The original prospectus was approved by the CDVM on 03/08/2015 under reference number VI/EM/022/2015, in accordance with the provisions of the CDVM's circular effective 1 April 2012, issued pursuant to article 14 of the Dahir enacting law No. 1-93-212 of 21 September 1993 on the CDVM and the disclosures required of listed companies, as amended and supplemented.
CDM Capital Increase 2
Important notice
On 03/08/2015, the CDVM approved a prospectus relating to a capital increase pursuant to
the 2014 stock dividend option payable in new Crédit du Maroc shares.
The prospectus approved by the CDVM is available for inspection at any time at Crédit du
Maroc's head office. It may also be obtained within a maximum of 48 hours from the order
collection agents.
The prospectus is available to the general public at the head office of the Casablanca Stock
Exchange and on its website www.casablanca-bourse.com. It is also available on the
CDVM's website www.cdvm.gov.ma.
DESCRIPTION OF THE TRANSACTION
I. Regulatory framework governing the transaction
At its meeting of 19 February 2015, the Executive Board of Crédit du Maroc ("CDM") resolved to ask the Supervisory Board to call an ordinary and extraordinary general meeting of the shareholders to vote on its recommendation to offer payment of the 2014 dividend in cash or shares or a combination of both.
At its meeting of 13 March 2015, CDM's Supervisory Board called a shareholders' meeting on 22 April 2015 to vote on its proposal to make a capital increase pursuant to the 2014 stock dividend option.
At the shareholders' meeting held on 22 April 2015, on the recommendation of the Executive Board, the shareholders passed an ordinary resolution offering payment of the 2014 dividend in cash or shares of the company or a combination of both, at the option of each individual shareholder.
Pursuant to that ordinary resolution, the shareholders subsequently passed an extraordinary resolution requiring payment for share subscriptions to be made by allocating an amount equal to 85% of the gross dividend approved by ordinary resolution, i.e. DH 18.7 per share.
The shareholders then passed a second extraordinary resolution giving the Executive Board authority to formalise and complete the capital increase.
Under this authority, the Executive Board may, either directly or by delegation to its Chairman or any other duly appointed person:
Set the opening and closing dates for the subscription period; Collect subscriptions and the corresponding payments; Open a blocked account labelled "Crédit du Maroc – Capital Increase"; Limit the final amount of the capital increase to the amount of subscriptions received at the end of
the subscription period; Complete, sign and file, or procure that any authorised person files, the subscription and payment
declaration, a subscription and payment schedule, the amending entry for the Companies Register and all other documents required by law, at the registry of the Casablanca Commercial Tribunal;
Officially record completion of the capital increase; Make the corresponding amendments to the articles of association; More generally, make all requisite declarations, filings and public announcements and fulfil all
requisite formalities.
CDM Capital Increase 3
II. Purpose of the transaction
The main purpose of the stock dividend option is to strengthen CDM's equity base in order to support its business development, particularly by increasing its lending capacity whilst complying with the solvency ratio set out in the Bank Al Maghrib directives.
III. Intentions of the major shareholders
To the best of Management's knowledge, CDM's main shareholder intends to participate at a level of 50% in the 2014 stock dividend option, the purpose of this prospectus.
a - List of main shareholders pre and post transaction
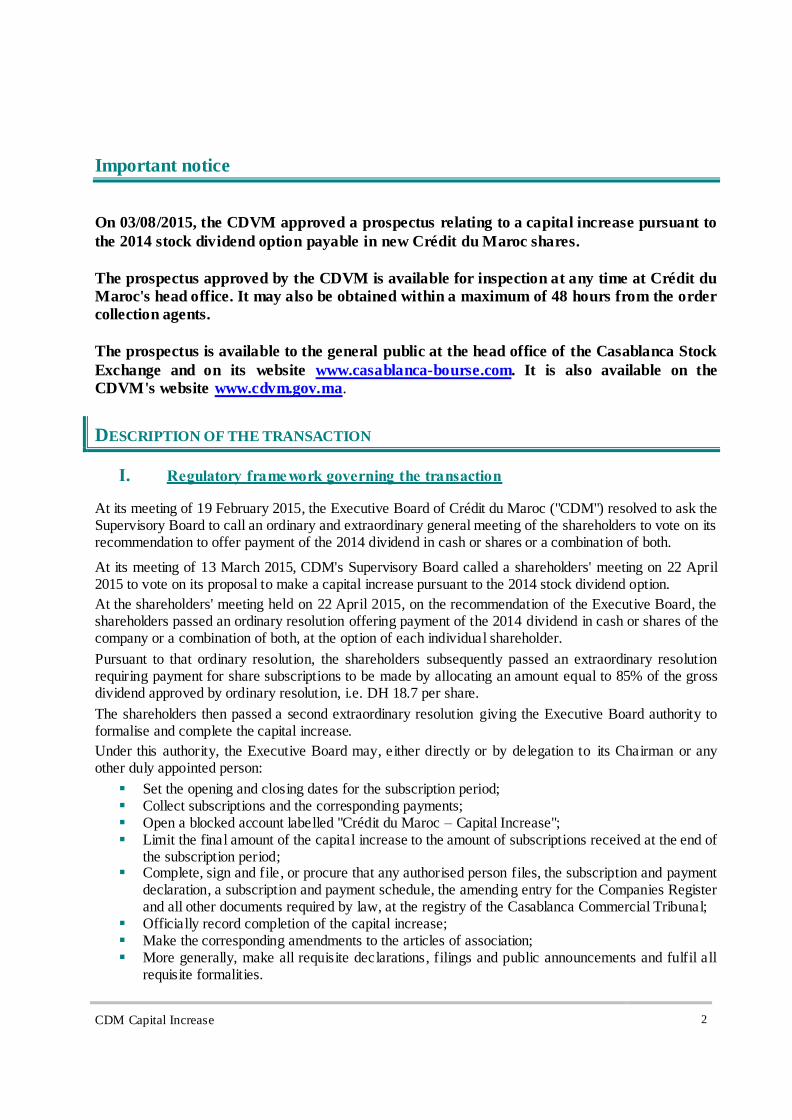
Based on the assumption that Crédit Agricole S.A. and Wafa Assurance holding represents only 50% of capital increase, the following table shows the impact of the capital increase on CDM's ownership structure:
Shareholder
Pre-transaction Post-transaction**
Number of shares % of share
capital*** Number of shares % of share capital
Crédit Agricole S.A. Group 8,404,076 78.70% 8,563,464 78.86%
Wafa Assurance 1,120,743 10.49% 1,141,998 10.52%
Other shareholders* 1,154,175 10.81% 1,154,175 10.63%
Total 10,678,994 100.00% 10,859,637 100.00% * To date, none of the "Other shareholders" holds more than 5% of Crédit du Maroc's share capital. ** CASA and Wafa Assurance holding representing 50% of capital increase
*** % of share capital = % of voting rights
Source: CDM
Based on the assumption that Crédit Agricole S.A. and Wafa Assurance holding represents 100% of capital increase. The following table shows the impact of the capital increase on CDM's ownership structure:
Shareholder Pre-transaction Post-transaction**
Number of shares % of share
capital*** Number of shares % of share capital
Crédit Agricole S.A. Group 8,404,076 78.70% 8,722,851 79.01%
Wafa Assurance 1,120,743 10.49% 1,163,254 10.54%
Other shareholders* 1,154,175 10.81% 1,154,175 10.45%
Total 10,678,994 100.00% 11,040,280 100.00% * To date, none of the "Other shareholders" holds more than 5% of Crédit du Maroc's share capital.
** CASA and Wafa Assurance holding representing 100% of capital increase *** % of share capital = % of voting rights
Source: CDM
Based on the assumption that Crédit Agricole S.A. and Wafa Assurance holding represents 50% of capital increase and “Other shareholders” holding represents 100% of capital increase. The following table shows the impact of the capital increase on CDM's ownership structure:
Shareholder
Pre-transaction Post-transaction**
Number of shares % of share
capital*** Number of shares % of share capital
Crédit Agricole S.A. Group 8,404,076 78.70% 8,563,464 78.54%
Wafa Assurance 1,120,743 10.49% 1,141,998 10.47%
Other shareholders* 1,154,175 10.81% 1,197,954 10.99%
Total 10,678,994 100.00% 10,903,416 100.00% * To date, none of the "Other shareholders" holds more than 5% of Crédit du Maroc's share capital. ** CASA and Wafa Assurance holding representing 50% of capital increase and “other shareholders” holding representing 100 % of capital increase. *** % of share capital = % of voting rights
Source: CDM
CDM Capital Increase 4
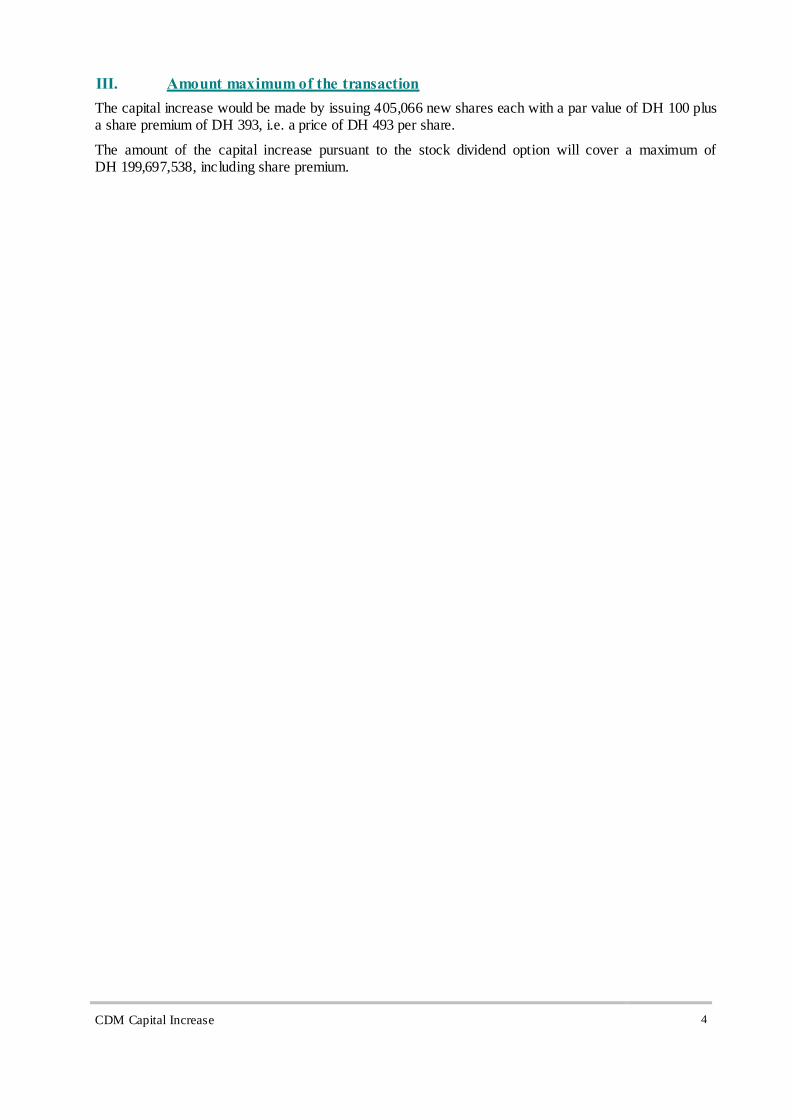
III. Amount maximum of the transaction
The capital increase would be made by issuing 405,066 new shares each with a par value of DH 100 plus a share premium of DH 393, i.e. a price of DH 493 per share.
The amount of the capital increase pursuant to the stock dividend option will cover a maximum of DH 199,697,538, including share premium.
CDM Capital Increase 5
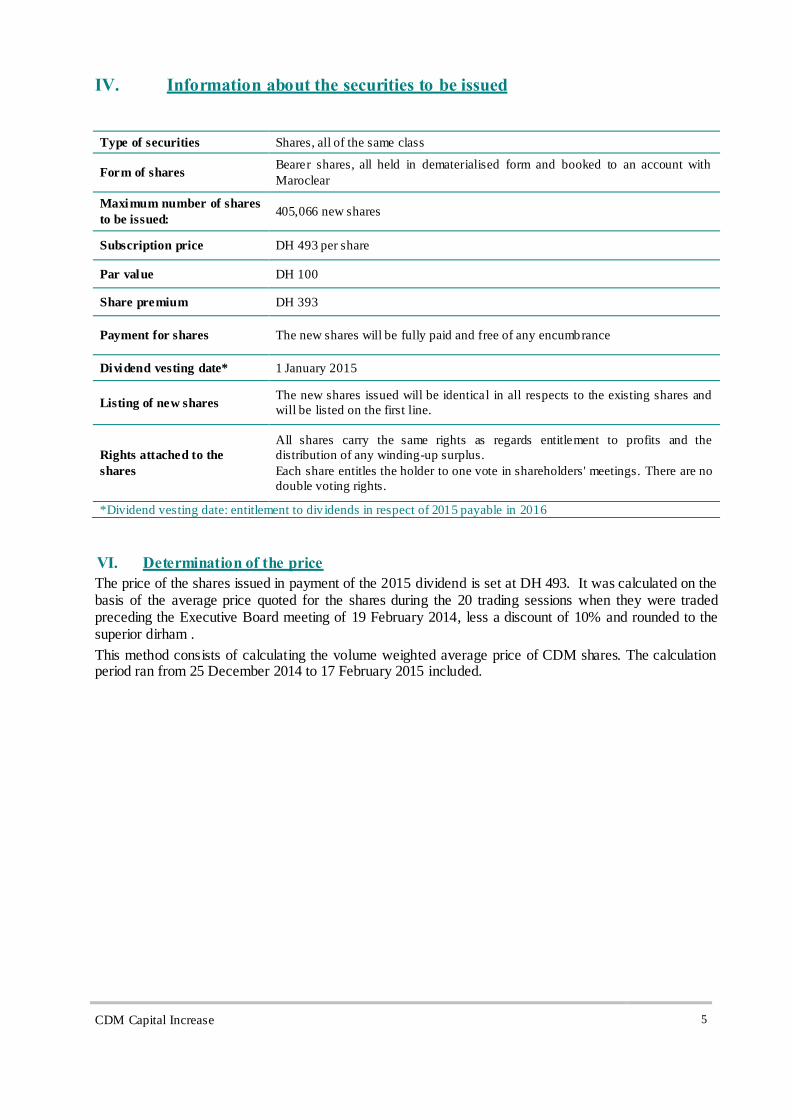
IV. Information about the securities to be issued
Type of securities Shares, all of the same class
Form of shares Bearer shares, all held in dematerialised form and booked to an account with
Maroclear
Maximum number of shares
to be issued: 405,066 new shares
Subscription price DH 493 per share
Par value DH 100
Share premium DH 393
Payment for shares The new shares will be fully paid and free of any encumbrance
Dividend vesting date* 1 January 2015
Listing of new shares The new shares issued will be identical in all respects to the existing shares and
will be listed on the first line.
Rights attached to the
shares
All shares carry the same rights as regards entitlement to profits and the
distribution of any winding-up surplus.
Each share entitles the holder to one vote in shareholders' meetings. There are no
double voting rights.
*Dividend vesting date: entitlement to div idends in respect of 2015 payable in 2016
VI. Determination of the price
The price of the shares issued in payment of the 2015 dividend is set at DH 493. It was calculated on the basis of the average price quoted for the shares during the 20 trading sessions when they were traded preceding the Executive Board meeting of 19 February 2014, less a discount of 10% and rounded to the superior dirham .
This method consists of calculating the volume weighted average price of CDM shares. The calculation period ran from 25 December 2014 to 17 February 2015 included.
CDM Capital Increase 6
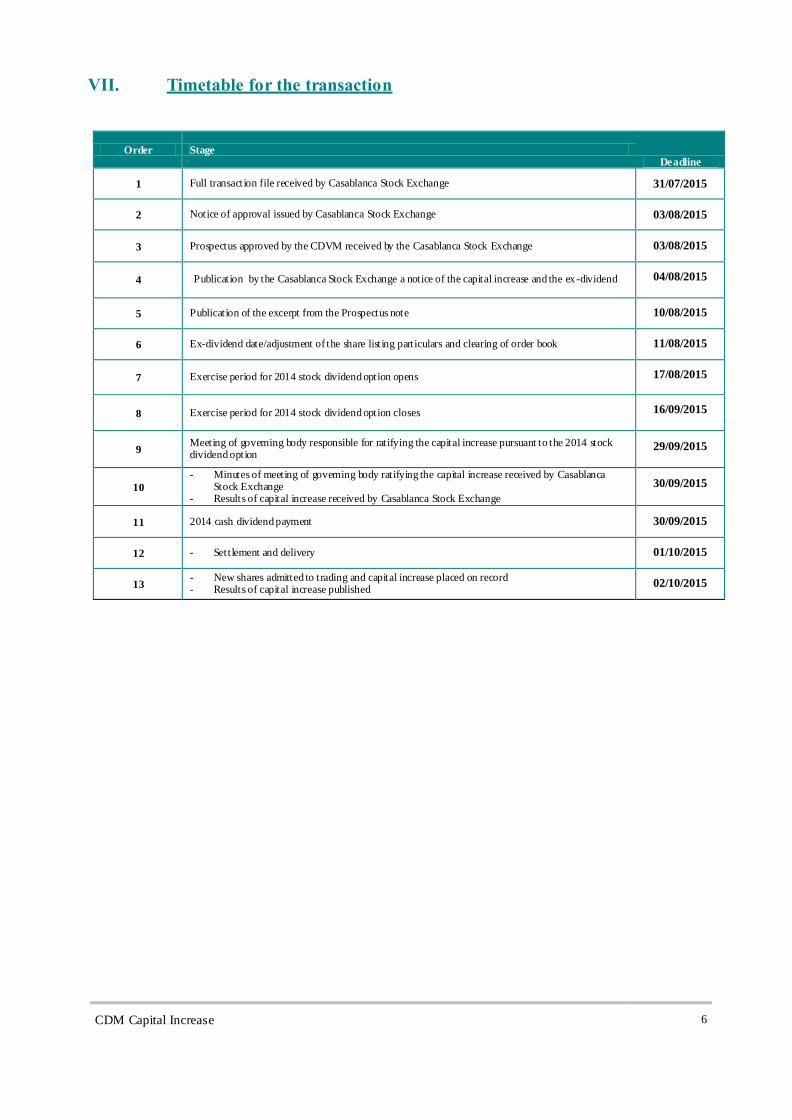
VII. Timetable for the transaction
Order Stage Deadline
1 Full transaction file received by Casablanca Stock Exchange 31/07/2015
2 Notice of approval issued by Casablanca Stock Exchange 03/08/2015
3 Prospectus approved by the CDVM received by the Casablanca Stock Exchange 03/08/2015
4 Publication by the Casablanca Stock Exchange a notice of the capital increase and the ex-dividend 04/08/2015
5 Publication of the excerpt from the Prospectus note 10/08/2015
6 Ex-dividend date/adjustment of the share listing particulars and clearing of order book 11/08/2015
7 Exercise period for 2014 stock dividend option opens 17/08/2015
8 Exercise period for 2014 stock dividend option closes 16/09/2015
9 Meeting of governing body responsible for ratifying the capital increase pursuant to the 2014 stock dividend option
29/09/2015
10
- Minutes of meeting of governing body ratifying the capital increase received by Casablanca Stock Exchange
- Results of capital increase received by Casablanca Stock Exchange
30/09/2015
11 2014 cash dividend payment 30/09/2015
12 - Settlement and delivery 01/10/2015
13 - New shares admitted to trading and capital increase placed on record - Results of capital increase published
02/10/2015
CDM Capital Increase 7
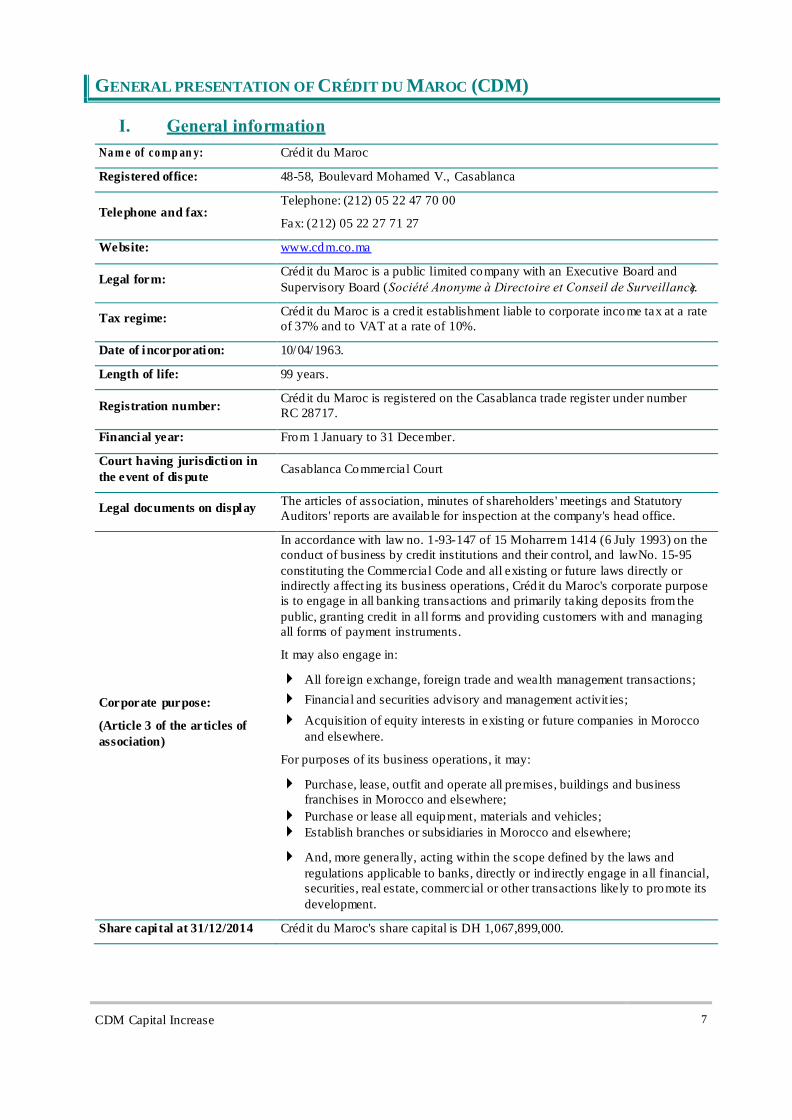
GENERAL PRESENTATION OF CRÉDIT DU MAROC (CDM)
I. General information
Na m e of co mp an y: Crédit du Maroc
Registered office: 48-58, Boulevard Mohamed V., Casablanca
Telephone and fax: Telephone: (212) 05 22 47 70 00
Fax: (212) 05 22 27 71 27
Website: www.cdm.co.ma
Legal form: Crédit du Maroc is a public limited company with an Executive Board and
Supervisory Board (Societe Anonyme a Directoire et Conseil de Surveillance).
Tax regime: Crédit du Maroc is a cred it establishment liable to corporate income tax at a rate
of 37% and to VAT at a rate of 10%.
Date of incorporation: 10/04/1963.
Length of life: 99 years.
Registration number: Crédit du Maroc is registered on the Casablanca trade register under number
RC 28717.
Financial year: From 1 January to 31 December.
Court having jurisdiction in
the event of dis pute Casablanca Commercial Court
Legal documents on display The articles of association, minutes of shareholders' meetings and Statutory
Auditors' reports are availab le for inspection at the company's head office.
Corporate purpose:
(Article 3 of the articles of
association)
In accordance with law no. 1-93-147 of 15 Moharrem 1414 (6 July 1993) on the
conduct of business by credit institutions and their control, and lawNo. 15-95
constituting the Commercial Code and all existing or future laws directly or
indirectly affect ing its business operations, Créd it du Maroc's corporate purpose
is to engage in all banking transactions and primarily taking deposits from the
public, granting credit in all forms and providing customers with and managing
all forms of payment instruments.
It may also engage in:
All foreign exchange, foreign trade and wealth management transactions;
Financial and securities advisory and management activit ies;
Acquisition of equity interests in existing or future companies in Morocco
and elsewhere.
For purposes of its business operations, it may:
Purchase, lease, outfit and operate all premises, buildings and business
franchises in Morocco and elsewhere;
Purchase or lease all equipment, materials and vehicles;
Establish branches or subsidiaries in Morocco and elsewhere;
And, more generally, acting within the scope defined by the laws and
regulations applicable to banks, directly or ind irectly engage in all financial,
securities, real estate, commercial or other transactions likely to promote its
development.
Share capital at 31/12/2014 Crédit du Maroc's share capital is DH 1,067,899,000.
CDM Capital Increase 8
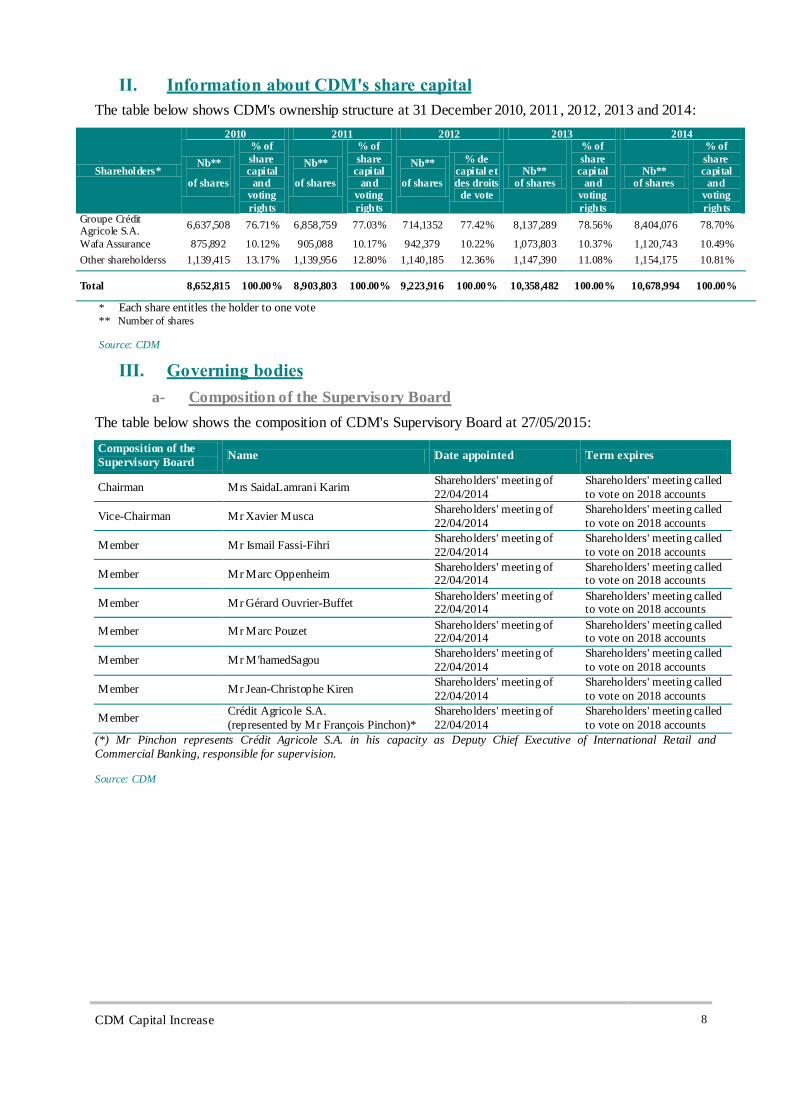
II. Information about CDM's share capital
The table below shows CDM's ownership structure at 31 December 2010, 2011, 2012, 2013 and 2014:
Shareholders*
2010 2011 2012 2013 2014
Nb**
of shares
% of
share capital
and voting
rights
Nb**
of shares
% of
share capital
and voting
rights
Nb**
of shares
% de capital et des droits
de vote
Nb** of shares
% of
share capital
and voting
rights
Nb** of shares
% of
share capital
and voting
rights Groupe Crédit Agricole S.A.
6,637,508 76.71% 6,858,759 77.03% 714,1352 77.42% 8,137,289 78.56% 8,404,076 78.70%
Wafa Assurance 875,892 10.12% 905,088 10.17% 942,379 10.22% 1,073,803 10.37% 1,120,743 10.49%
Other shareholderss 1,139,415 13.17% 1,139,956 12.80% 1,140,185 12.36% 1,147,390 11.08% 1,154,175 10.81%
Total 8,652,815 100.00% 8,903,803 100.00% 9,223,916 100.00% 10,358,482 100.00% 10,678,994 100.00%
* Each share entitles the holder to one vote
** Number of shares Source: CDM
III. Governing bodies
a- Composition of the Supervisory Board
The table below shows the composition of CDM's Supervisory Board at 27/05/2015:
Composition of the
Supervisory Board Name Date appointed Term expires
Chairman Mrs SaidaLamrani Karim Shareholders' meeting of
22/04/2014
Shareholders' meeting called
to vote on 2018 accounts
Vice-Chairman Mr Xavier Musca Shareholders' meeting of
22/04/2014
Shareholders' meeting called
to vote on 2018 accounts
Member Mr Ismail Fassi-Fihri Shareholders' meeting of
22/04/2014
Shareholders' meeting called
to vote on 2018 accounts
Member Mr Marc Oppenheim Shareholders' meeting of 22/04/2014
Shareholders' meeting called to vote on 2018 accounts
Member Mr Gérard Ouvrier-Buffet Shareholders' meeting of 22/04/2014
Shareholders' meeting called to vote on 2018 accounts
Member Mr Marc Pouzet Shareholders' meeting of 22/04/2014
Shareholders' meeting called to vote on 2018 accounts
Member Mr M'hamedSagou Shareholders' meeting of
22/04/2014
Shareholders' meeting called
to vote on 2018 accounts
Member Mr Jean-Christophe Kiren Shareholders' meeting of
22/04/2014
Shareholders' meeting called
to vote on 2018 accounts
Member Crédit Agricole S.A.
(represented by Mr François Pinchon)*
Shareholders' meeting of
22/04/2014
Shareholders' meeting called
to vote on 2018 accounts
(*) Mr Pinchon represents Crédit Agricole S.A. in his capacity as Deputy Chief Executive of International Retail and
Commercial Banking, responsible for supervision. Source: CDM
CDM Capital Increase 9
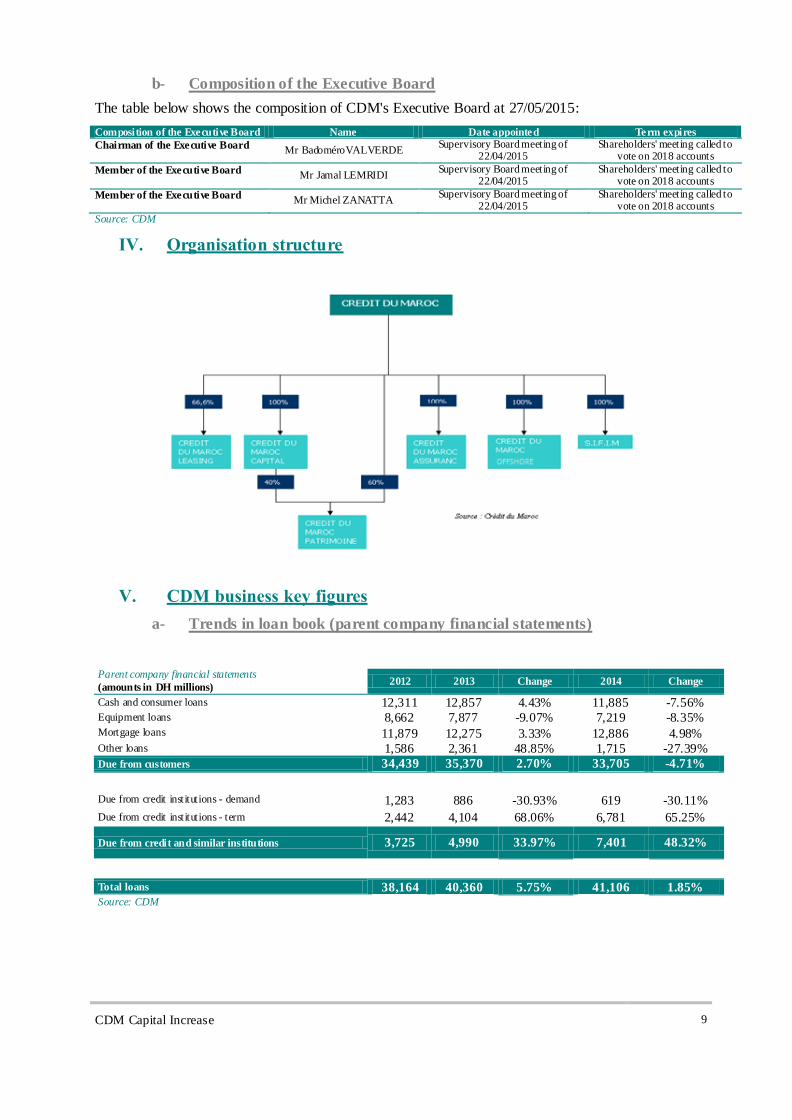
b- Composition of the Executive Board
The table below shows the composition of CDM's Executive Board at 27/05/2015:
Composition of the Executive Board Name Date appointed Term expires
Chairman of the Executive Board Mr BadoméroVALVERDE
Supervisory Board meeting of 22/04/2015
Shareholders' meeting called to vote on 2018 accounts
Member of the Executive Board Mr Jamal LEMRIDI
Supervisory Board meeting of 22/04/2015
Shareholders' meeting called to vote on 2018 accounts
Member of the Executive Board Mr Michel ZANATTA
Supervisory Board meeting of 22/04/2015
Shareholders' meeting called to vote on 2018 accounts
Source: CDM
IV. Organisation structure
V. CDM business key figures
a- Trends in loan book (parent company financial statements)
Parent company financial statements
(amounts in DH millions) 2012 2013 Change 2014 Change
Cash and consumer loans 12,311 12,857 4.43% 11,885 -7.56% Equipment loans 8,662 7,877 -9.07% 7,219 -8.35% Mortgage loans 11,879 12,275 3.33% 12,886 4.98% Other loans 1,586 2,361 48.85% 1,715 -27.39%
Due from customers 34,439 35,370 2.70% 33,705 -4.71%
Due from credit institutions - demand 1,283 886 -30.93% 619 -30.11%
Due from credit institutions - term 2,442 4,104 68.06% 6,781 65.25%
Due from credit and similar institutions 3,725 4,990 33.97% 7,401 48.32%
Total loans 38,164 40,360 5.75% 41,106 1.85% Source: CDM
CDM Capital Increase 10
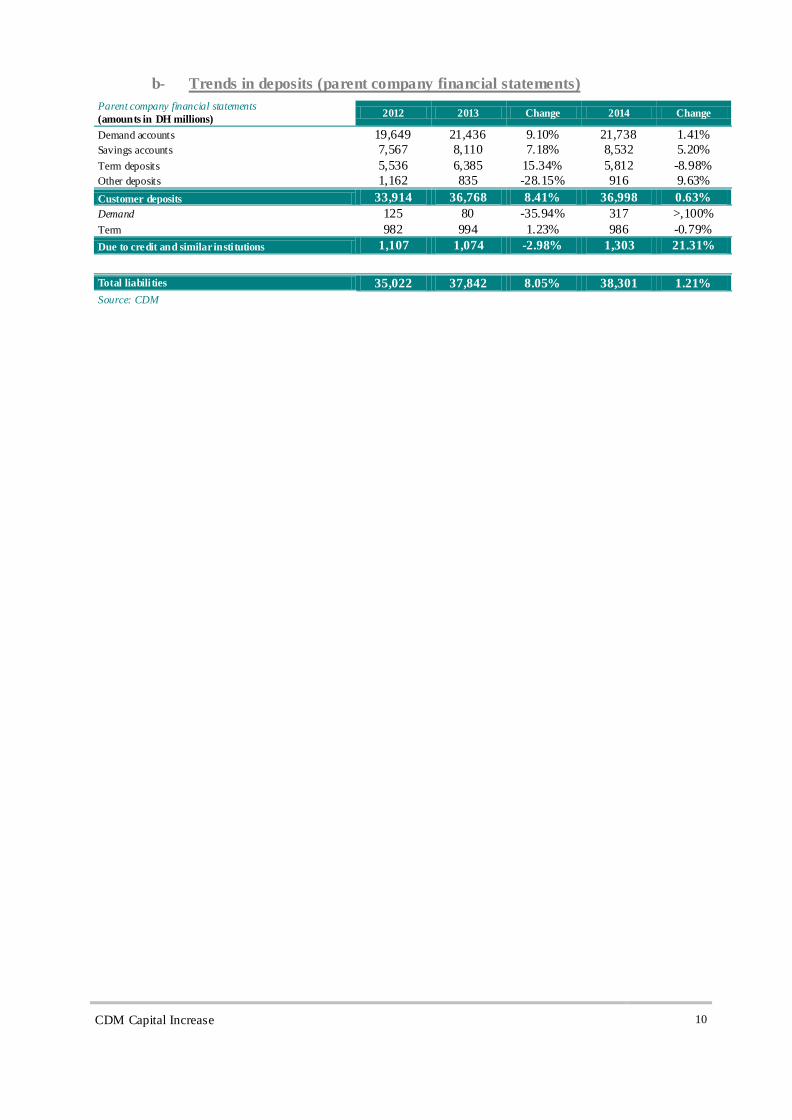
b- Trends in deposits (parent company financial statements)
Parent company financial statements
(amounts in DH millions) 2012 2013 Change 2014 Change
Demand accounts 19,649 21,436 9.10% 21,738 1.41%
Savings accounts 7,567 8,110 7.18% 8,532 5.20%
Term deposits 5,536 6,385 15.34% 5,812 -8.98%
Other deposits 1,162 835 -28.15% 916 9.63%
Customer deposits 33,914 36,768 8.41% 36,998 0.63%
Demand 125 80 -35.94% 317 >,100%
Term 982 994 1.23% 986 -0.79%
Due to credit and similar institutions 1,107 1,074 -2.98% 1,303 21.31%
Total liabilities 35,022 37,842 8.05% 38,301 1.21%
Source: CDM
CDM Capital Increase 11
RISK FACTORS
Risk management at Credit du Maroc is the responsibility of the Credit and Risk Management Department, which is in charge of supervision, control and measurement of the group's risk exposure.
I. Interest rate risk
The banking system is experiencing a secular downtrend in interest rates. Returns on loans coupled with the rising cost of funds have adversely affected intermediation margins. CDM, like all local banks, is exposed to a risk that future trends in interest rates will reduce its banking revenues. When hedging instruments are not used, interest rate risk is mitigated by optimising management of the bank's assets and liabilities through its strategy in deposits and lending. This involves matching its assets and liabilities in terms of maturity and interest rate type. CDM's ALM policy is, as far as possible, to match the interest rate structure of its liabilities (fixed and variable) with that of its assets. The ALM department monitors interest rate risk on an ongoing basis and is responsible for hedging any interest rate gaps within the limits set by the ALM Committee.
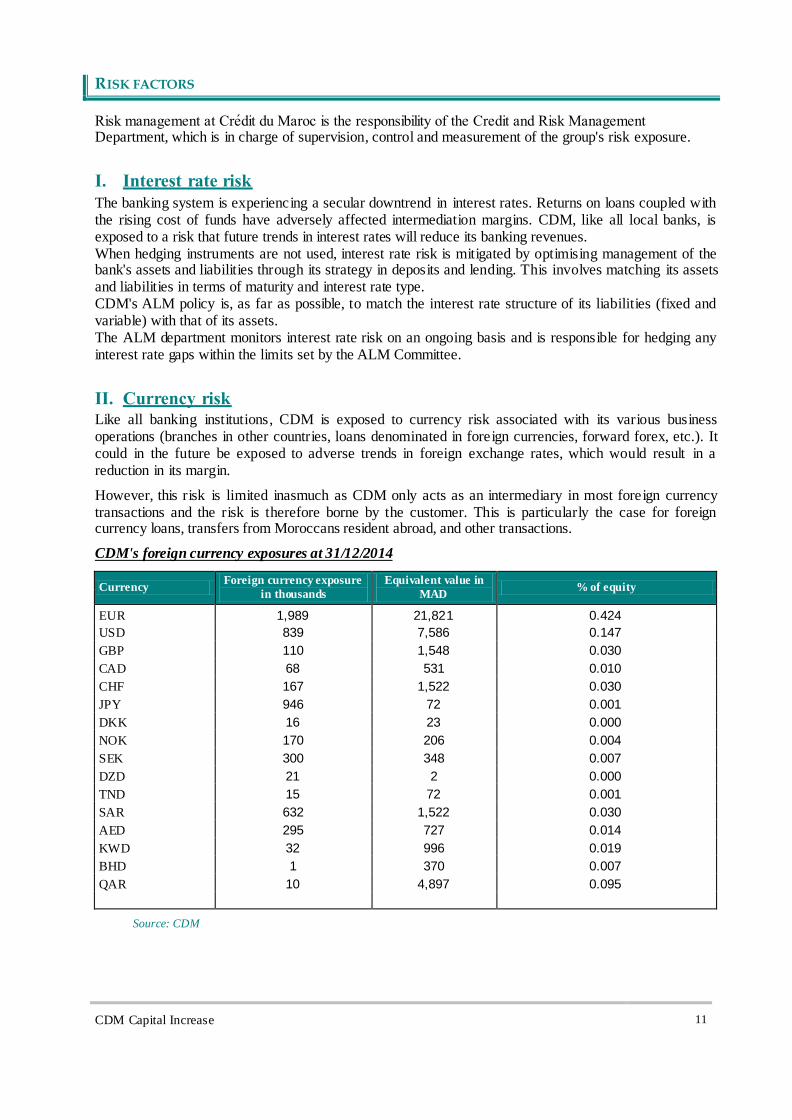
II. Currency risk Like all banking institutions, CDM is exposed to currency risk associated with its various business operations (branches in other countries, loans denominated in foreign currencies, forward forex, etc.). It could in the future be exposed to adverse trends in foreign exchange rates, which would result in a reduction in its margin.
However, this risk is limited inasmuch as CDM only acts as an intermediary in most foreign currency transactions and the risk is therefore borne by the customer. This is particularly the case for foreign currency loans, transfers from Moroccans resident abroad, and other transactions.
CDM's foreign currency exposures at 31/12/2014
Currency Foreign currency exposure
in thousands
Equivalent value in
MAD % of equity
EUR 1,989 21,821 0.424
USD 839 7,586 0.147
GBP 110 1,548 0.030
CAD 68 531 0.010
CHF 167 1,522 0.030
JPY 946 72 0.001
DKK 16 23 0.000
NOK 170 206 0.004
SEK 300 348 0.007
DZD 21 2 0.000
TND 15 72 0.001
SAR 632 1,522 0.030
AED 295 727 0.014
KWD 32 996 0.019
BHD 1 370 0.007
QAR 10 4,897 0.095
0
Source: CDM
CDM Capital Increase 12
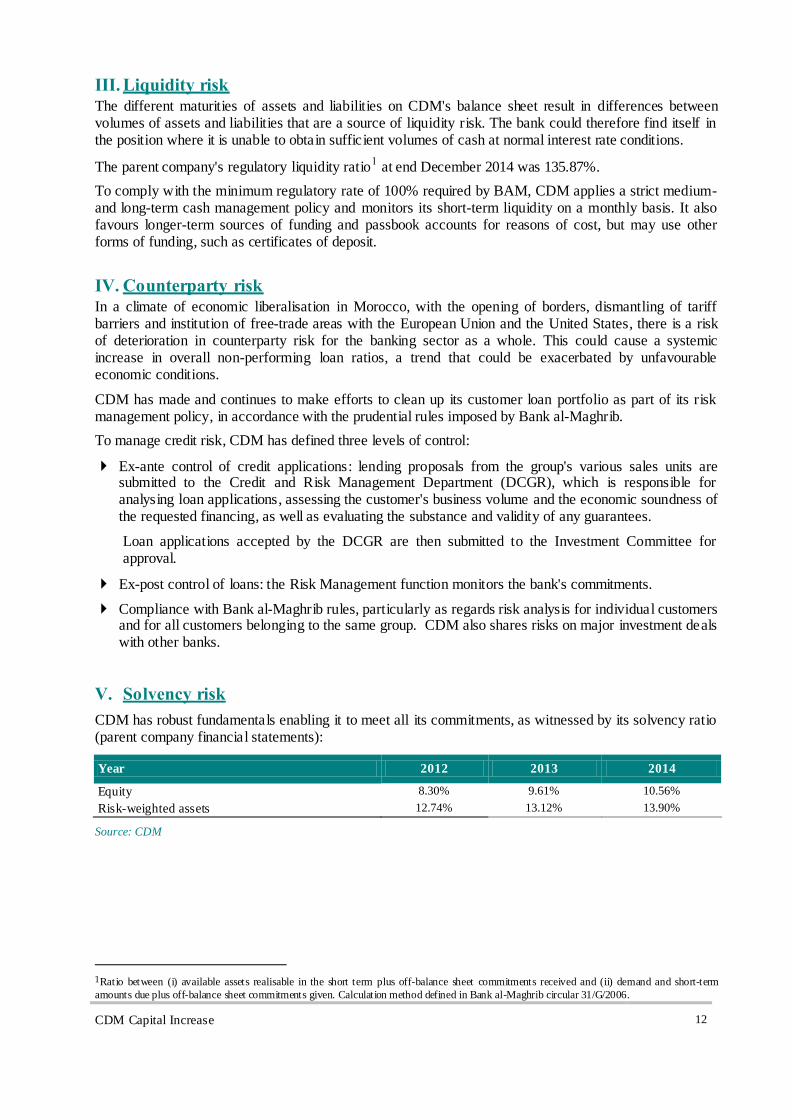
III. Liquidity risk The different maturities of assets and liabilities on CDM's balance sheet result in differences between volumes of assets and liabilities that are a source of liquidity risk. The bank could therefore find itself in the position where it is unable to obtain sufficient volumes of cash at normal interest rate conditions.
The parent company's regulatory liquidity ratio1 at end December 2014 was 135.87%.
To comply with the minimum regulatory rate of 100% required by BAM, CDM applies a strict medium- and long-term cash management policy and monitors its short-term liquidity on a monthly basis. It also favours longer-term sources of funding and passbook accounts for reasons of cost, but may use other forms of funding, such as certificates of deposit.
IV. Counterparty risk In a climate of economic liberalisation in Morocco, with the opening of borders, dismantling of tariff barriers and institution of free-trade areas with the European Union and the United States, there is a risk of deterioration in counterparty risk for the banking sector as a whole. This could cause a systemic increase in overall non-performing loan ratios, a trend that could be exacerbated by unfavourable economic conditions.
CDM has made and continues to make efforts to clean up its customer loan portfolio as part of its risk management policy, in accordance with the prudential rules imposed by Bank al-Maghrib.
To manage credit risk, CDM has defined three levels of control:
Ex-ante control of credit applications: lending proposals from the group's various sales units are submitted to the Credit and Risk Management Department (DCGR), which is responsible for analysing loan applications, assessing the customer's business volume and the economic soundness of the requested financing, as well as evaluating the substance and validity of any guarantees.
Loan applications accepted by the DCGR are then submitted to the Investment Committee for approval.
Ex-post control of loans: the Risk Management function monitors the bank's commitments.
Compliance with Bank al-Maghrib rules, particularly as regards risk analysis for individual customers and for all customers belonging to the same group. CDM also shares risks on major investment deals with other banks.
V. Solvency risk
CDM has robust fundamentals enabling it to meet all its commitments, as witnessed by its solvency ratio (parent company financial statements):
Year 2012 2013 2014
Equity 8.30% 9.61% 10.56%
Risk-weighted assets 12.74% 13.12% 13.90%
Source: CDM
1Ratio between (i) available assets realisable in the short term plus off-balance sheet commitments received and (ii) demand and short-term
amounts due plus off-balance sheet commitments given. Calculation method defined in Bank al-Maghrib circular 31/G/2006.
CDM Capital Increase 13
VI. Competition risk
CDM is a universal bank operating in all customer segments (personal and small business customers, small and medium-size companies, and large corporations) and all banking segments.
Its main competitors are Attijariwafa Bank , BCP, BMCE Bank, Societe Generale , BMCI and, more recently, CIH and CAM, which are developing commercial banking operations.
CDM's competitive positioning strategy is based on:
Quality of service and meeting commitments to customers (e.g.: "Your mortgage loan within 48 hours" campaign, consumer finance);
A corporate culture focusing on innovation for the customer's benefit (paying bills though ATMs, prepaid rechargeable DabaDaba card, e-banking, etc.);
Making the Group dimension a factor of differentiation for all customer segments (mobility offer for personal banking customers with the RIBAT range in partnership with Credit Lyonnais , Intermed and e -Ris with the Credit Agricole Regional Banks in France for small and medium -sized companies and a close relationship with the Group's Corporate and Investment Banking arm for corporate customers.)
VII. Operational risk
CDM has adopted the definition of operational risk recommended by Basel II. Operational risk is defined as the risk of loss resulting from inadequate or failed processes, people and systems or from external events. This definition includes legal risk.
CDM's operational risk management system CDM's operational risk management system aims to identify all sources of major risks with a view to preventing or mitigating them. These sources of risk include internal fraud, external fraud, employment and workplace safety practices, customer products and commercial practices, damage to property assets, business and systems disruption, settlement-delivery and process management.
1. Main issues
Control over the cost of operational risk,
Prevention of major risks,
Optimisation of risk prevention and mitigation,
Integration of the threefold regulatory impact, i.e. equity-based management, regulatory supervision and financial reporting.
2. Components of the system
CDM's operational risk management system has four components:
Organisational component
Oversight of operational risk is the responsibility of an entity reporting to permanent risk control, the body that oversees the bank's overall internal control system.
The internal audit function periodically ensures that the operational risk management system is implemented effectively throughout the bank.
The Executive Board monitors risk exposure on an ongoing basis through the Operational Risk Committee chaired by the Chairman of the Executive Board.
The Supervisory Board is informed of material risks via the Audit Committee and ensures that they are taken into account.
Qualitative component
This component serves to assess and prevent risks through operational risk mapping.
CDM Capital Increase 14
Quantitative component
This component measures and monitors the cost of risk and incidents through loss monitoring and a warning system.
Capital allocation component
As a precautionary measure, CDM has adopted a capital allocation system using the basic indicator approach and aimsto adopt the standardised approach in the near future.
3. Information systems security
Information systems security is assured through a security policy and a permanent control system. Intrusion detection tests and vulnerability scans, as well as information systems security assessments, are carried out on a regular basis.
4. Business Continuity Plan
To ensure the continuity of banking operations in the event of a major incident, CDM has implemented a Business Continuity Plan comprising:
a disaster recovery plan to protect critical information systems services; a user recovery site activation plan with relocation to a backup site in case of incident; a crisis management system; a special business continuity plan in case of influenza pandemic.
The business continuity plan is tested and improved regularly. Each year, the user recovery site activation plan is tested several times and the disaster recovery plan at least once.
CDM Capital Increase 15
FINANCIAL STATEMENTS
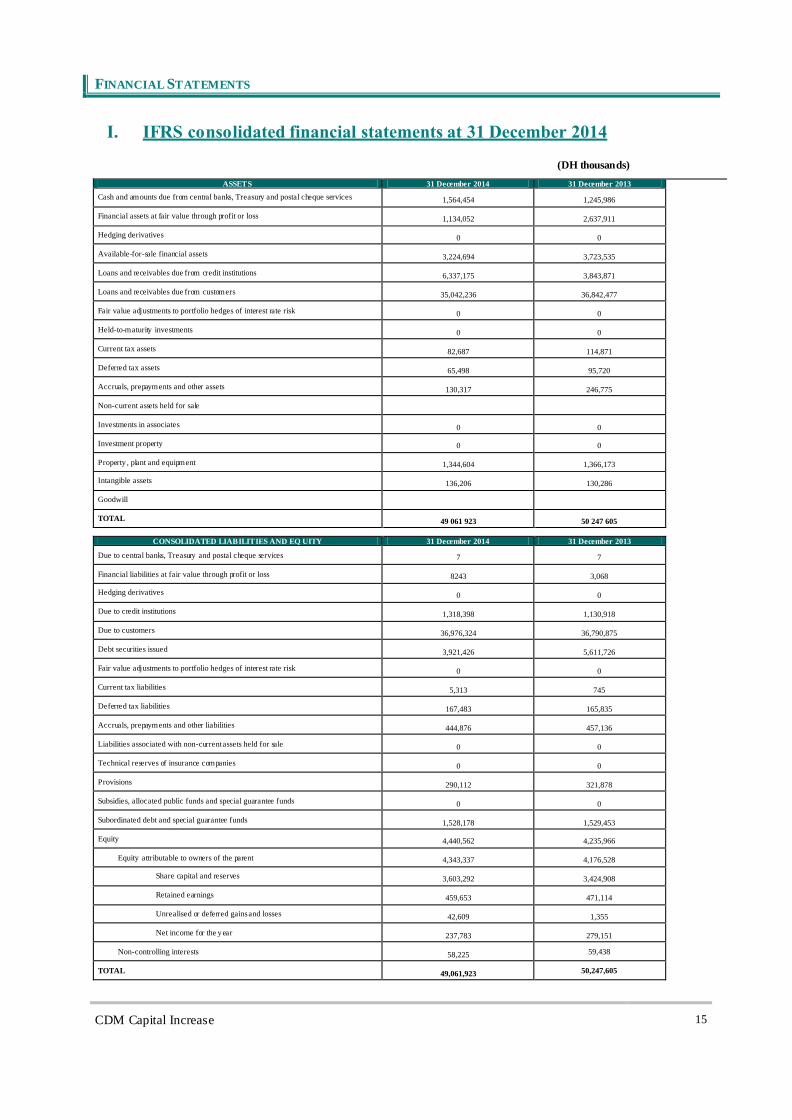
I. IFRS consolidated financial statements at 31 December 2014
(DH thousands)
ASSETS 31 December 2014 31 December 2013
Cash and amounts due from central banks, Treasury and postal cheque services 1,564,454 1,245,986
Financial assets at fair value through profit or loss 1,134,052 2,637,911
Hedging derivatives 0 0
Available-for-sale financial assets 3,224,694 3,723,535
Loans and receivables due from credit institutions 6,337,175 3,843,871
Loans and receivables due from customers 35,042,236 36,842,477
Fair value adjustments to portfolio hedges of interest rate risk 0 0
Held-to-maturity investments 0 0
Current tax assets 82,687 114,871
Deferred tax assets 65,498 95,720
Accruals, prepayments and other assets 130,317 246,775
Non-current assets held for sale
Investments in associates 0 0
Investment property 0 0
Property , plant and equipment 1,344,604 1,366,173
Intangible assets 136,206 130,286
Goodwill
TOTAL 49 061 923 50 247 605
CONSOLIDATED LIABILITIES AND EQ UITY 31 December 2014 31 December 2013
Due to central banks, Treasury and postal cheque services 7 7
Financial liabilities at fair value through profit or loss 8243 3,068
Hedging derivatives 0 0
Due to credit institutions 1,318,398 1,130,918
Due to customers 36,976,324 36,790,875
Debt securities issued 3,921,426 5,611,726
Fair value adjustments to portfolio hedges of interest rate risk 0 0
Current tax liabilities 5,313 745
Deferred tax liabilities 167,483 165,835
Accruals, prepayments and other liabilities 444,876 457,136
Liabilities associated with non-current assets held for sale 0 0
Technical reserves of insurance companies 0 0
Provisions 290,112 321,878
Subsidies, allocated public funds and special guarantee funds 0 0
Subordinated debt and special guarantee funds 1,528,178 1,529,453
Equity 4,440,562 4,235,966
Equity attributable to owners of the parent 4,343,337 4,176,528
Share capital and reserves 3,603,292 3,424,908
Retained earnings 459,653 471,114
Unrealised or deferred gains and losses 42,609 1,355
Net income for the year 237,783 279,151
Non-controlling interests 58,225 59,438
TOTAL 49,061,923 50,247,605
CDM Capital Increase 16
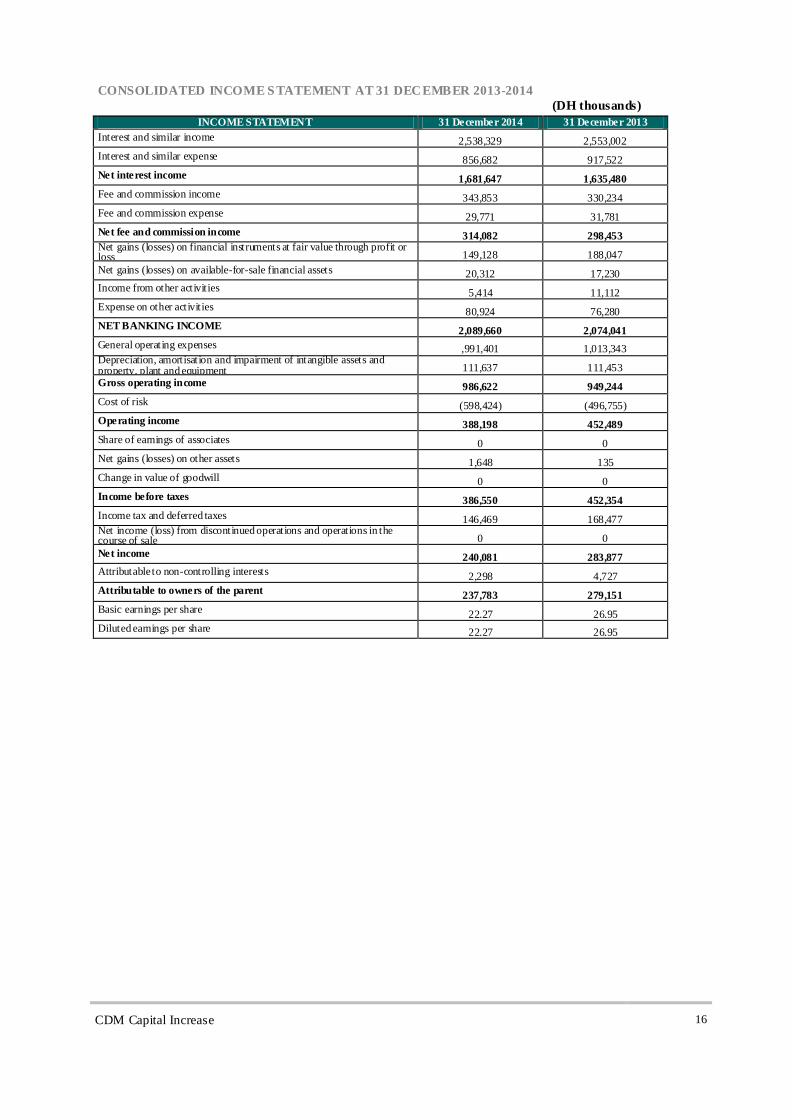
CONSOLIDATED INCOME S TATEMENT AT 31 DECEMBER 2013-2014
(DH thousands)
INCOME STATEMENT 31 December 2014 31 December 2013
Interest and similar income 2,538,329 2,553,002
Interest and similar expense 856,682 917,522
Net interest income 1,681,647 1,635,480
Fee and commission income 343,853 330,234
Fee and commission expense 29,771 31,781
Net fee and commission income 314,082 298,453 Net gains (losses) on financial instruments at fair value through profit or loss 149,128 188,047
Net gains (losses) on available-for-sale financial assets 20,312 17,230
Income from other activities 5,414 11,112
Expense on other activities 80,924 76,280
NET BANKING INCOME 2,089,660 2,074,041
General operating expenses ,991,401 1,013,343 Depreciation, amortisation and impairment of intangible assets and property, plant and equipment 111,637 111,453
Gross operating income 986,622 949,244
Cost of risk (598,424) (496,755)
Operating income 388,198 452,489
Share of earnings of associates 0 0
Net gains (losses) on other assets 1,648 135
Change in value of goodwill 0 0
Income before taxes 386,550 452,354
Income tax and deferred taxes 146,469 168,477 Net income (loss) from discontinued operations and operations in the course of sale 0 0
Net income 240,081 283,877
Attributable to non-controlling interests 2,298 4,727
Attributable to owners of the parent 237,783 279,151
Basic earnings per share 22.27 26.95
Diluted earnings per share 22.27 26.95
CDM Capital Increase 17
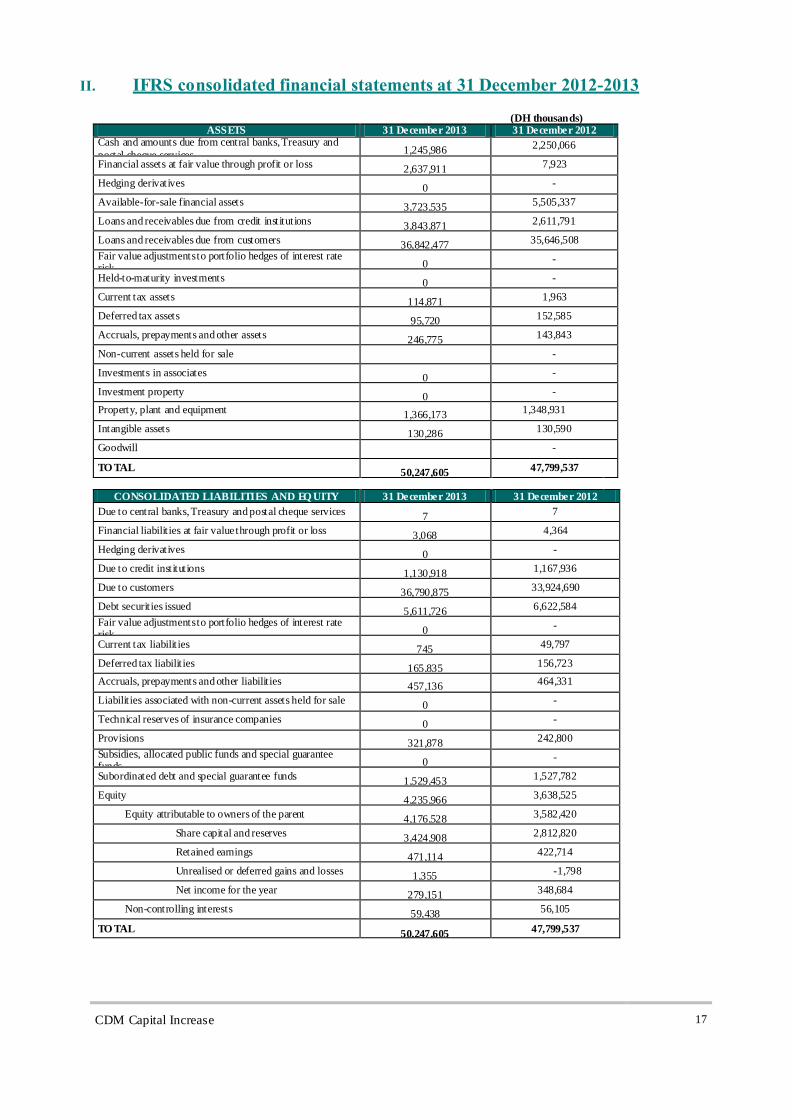
II. IFRS consolidated financial statements at 31 December 2012-2013
(DH thousands) ASSETS 31 December 2013 31 December 2012
Cash and amounts due from central banks, Treasury and
postal cheque services 1,245,986
2,250,066
Financial assets at fair value through profit or loss 2,637,911
7,923
Hedging derivatives 0
-
Available-for-sale financial assets 3,723,535
5,505,337
Loans and receivables due from credit institutions 3,843,871
2,611,791
Loans and receivables due from customers 36,842,477
35,646,508
Fair value adjustments to portfolio hedges of interest rate risk 0
-
Held-to-maturity investments 0
-
Current tax assets 114,871
1,963
Deferred tax assets 95,720
152,585
Accruals, prepayments and other assets 246,775
143,843
Non-current assets held for sale
-
Investments in associates 0
-
Investment property 0
-
Property, plant and equipment 1,366,173
1,348,931
Intangible assets 130,286
130,590
Goodwill
-
TO TAL 50,247,605
47,799,537
CONSOLIDATED LIABILITIES AND EQ UITY 31 December 2013 31 December 2012
Due to central banks, Treasury and postal cheque services 7
7
Financial liabilit ies at fair value through profit or loss 3,068
4,364
Hedging derivatives 0
-
Due to credit institutions 1,130,918
1,167,936
Due to customers 36,790,875
33,924,690
Debt securities issued 5,611,726
6,622,584
Fair value adjustments to portfolio hedges of interest rate risk 0
-
Current tax liabilit ies 745
49,797
Deferred tax liabilit ies 165,835
156,723
Accruals, prepayments and other liabilit ies 457,136
464,331
Liabilities associated with non-current assets held for sale 0
-
Technical reserves of insurance companies 0
-
Provisions 321,878
242,800
Subsidies, allocated public funds and special guarantee funds 0
-
Subordinated debt and special guarantee funds 1,529,453
1,527,782
Equity 4,235,966
3,638,525
Equity attributable to owners of the parent 4,176,528
3,582,420
Share capital and reserves 3,424,908
2,812,820
Retained earnings 471,114
422,714
Unrealised or deferred gains and losses 1,355
-1,798
Net income for the year 279,151
348,684
Non-controlling interests 59,438
56,105
TO TAL 50,247,605
47,799,537
CDM Capital Increase 18
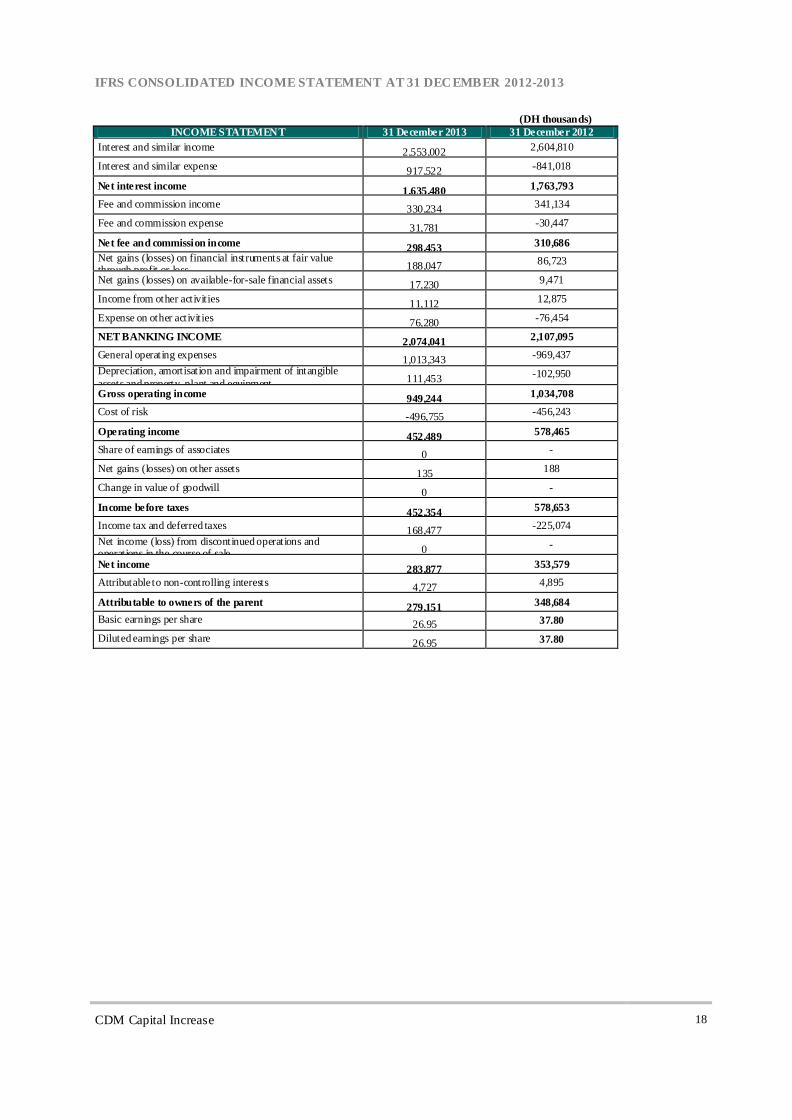
IFRS CONSOLIDATED INCOME STATEMENT AT 31 DECEMBER 2012-2013
(DH thousands)
INCOME STATEMENT 31 December 2013 31 December 2012
Interest and similar income 2,553,002
2,604,810
Interest and similar expense 917,522
-841,018
Net interest income 1,635,480
1,763,793
Fee and commission income 330,234
341,134
Fee and commission expense 31,781
-30,447
Net fee and commission income 298,453
310,686
Net gains (losses) on financial instruments at fair value through profit or loss 188,047
86,723
Net gains (losses) on available-for-sale financial assets 17,230
9,471
Income from other activities 11,112
12,875
Expense on other activities 76,280
-76,454
NET BANKING INCOME 2,074,041
2,107,095
General operating expenses 1,013,343
-969,437
Depreciation, amortisation and impairment of intangible
assets and property, plant and equipment 111,453
-102,950
Gross operating income 949,244
1,034,708
Cost of risk -496,755
-456,243
Operating income 452,489
578,465
Share of earnings of associates 0
-
Net gains (losses) on other assets 135
188
Change in value of goodwill 0
-
Income before taxes 452,354
578,653
Income tax and deferred taxes 168,477
-225,074
Net income (loss) from discontinued operations and operations in the course of sale 0
-
Net income 283,877
353,579
Attributable to non-controlling interests 4,727
4,895
Attributable to owners of the parent 279,151
348,684
Basic earnings per share 26.95 37.80
Diluted earnings per share 26.95 37.80
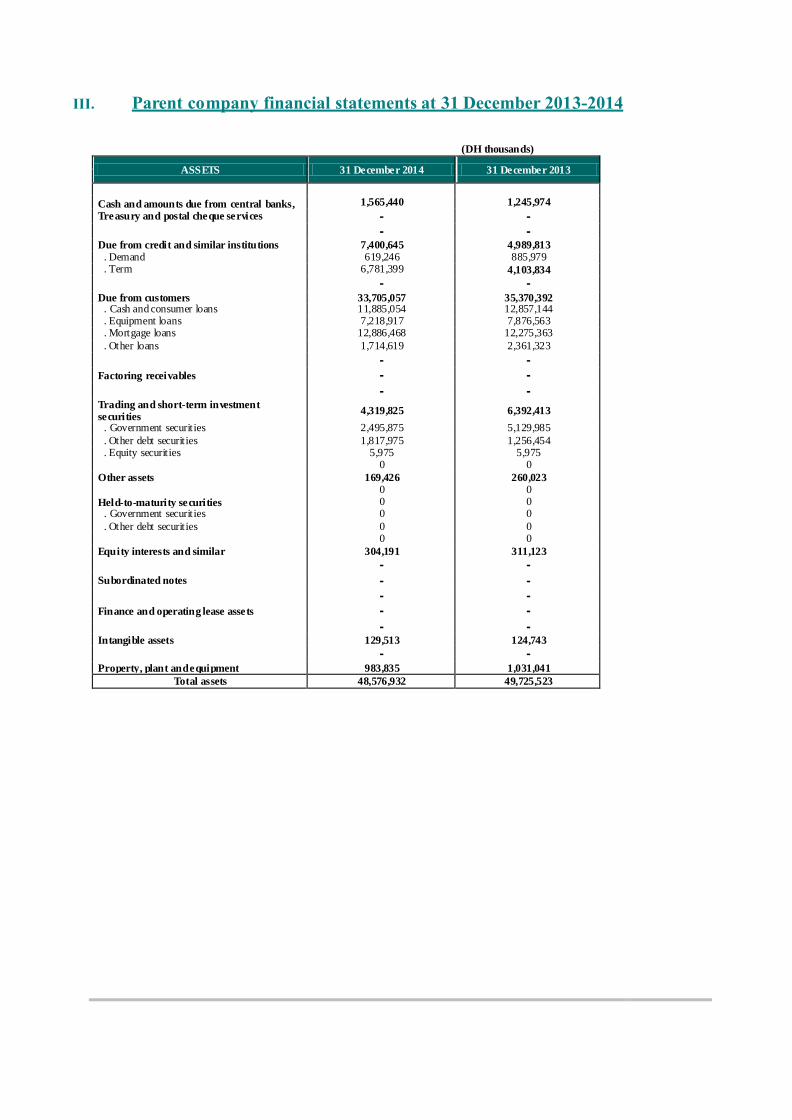
III. Parent company financial statements at 31 December 2013-2014
(DH thousands)
ASSETS 31 December 2014 31 December 2013
Cash and amounts due from central banks, Treasury and postal cheque services
1,565,440 1,245,974
- - - - Due from credit and similar institutions 7,400,645 4,989,813 . Demand 619,246 885,979 . Term 6,781,399 4,103,834
- - Due from customers 33,705,057 35,370,392 . Cash and consumer loans 11,885,054 12,857,144 . Equipment loans 7,218,917 7,876,563 . Mortgage loans 12,886,468 12,275,363
. Other loans 1,714,619 2,361,323
- - Factoring receivables - - - - Trading and short-term investment securities
4,319,825 6,392,413
. Government securities 2,495,875 5,129,985
. Other debt securities 1,817,975 1,256,454 . Equity securities 5,975 5,975 0 0
Other assets 169,426 260,023 0 0
Held-to-maturity securities 0 0 . Government securities 0 0
. Other debt securities 0 0 0 0
Equity interests and similar 304,191 311,123
- - Subordinated notes - - - - Finance and operating lease assets - - - - Intangible assets 129,513 124,743
- - Property, plant and equipment 983,835 1,031,041
Total assets 48,576,932 49,725,523

(DH thousands)
LIABILITIES AND EQUITY 31 December 2014 31 December 2013
Cash and amounts due from central banks, Treasury and postal cheque services
7 7
- -
Due to credit and similar institutions 1,303,240 1,074,283 . Demand 317,073 80,233 . Term 986,167 994,050
Customer deposits 36,997,849 36,767,639 . Demand accounts 21,737,748 21,436,427 . Savings accounts 8,532,005 8,110,429 . Term deposits 5,812,340 6,385,487
. Other deposits 915,756 835,296
Debt securities issued 3,921,426 5,611,726 . Negotiable debt securities 3,921,426 5,611,726
. Bonds - - . Other - -
Other liabilities 329,697 326,631
Provisions for contingencies and charges 400,860 446,802
- - Regulated provisions - - - - Subsidies, allocated public funds and special
guarantee funds - -
Subordinated debt 1,528,178 1,529,453
- - Revaluation reserves - -
Capital-related reserves and share premiums 2,541,259 2,393,696
Share capital 1,067,899 1,035,848
- - Shareholders. Unpaid capital (-) - -
Retained earnings (+/-) 248,414 243,055
- - Net income (loss) in course of appropriation (+/-)
- -
Net income for the year (+/-) 238,100 296,384
Total liabilities and equity 49,725,523 49,725,523
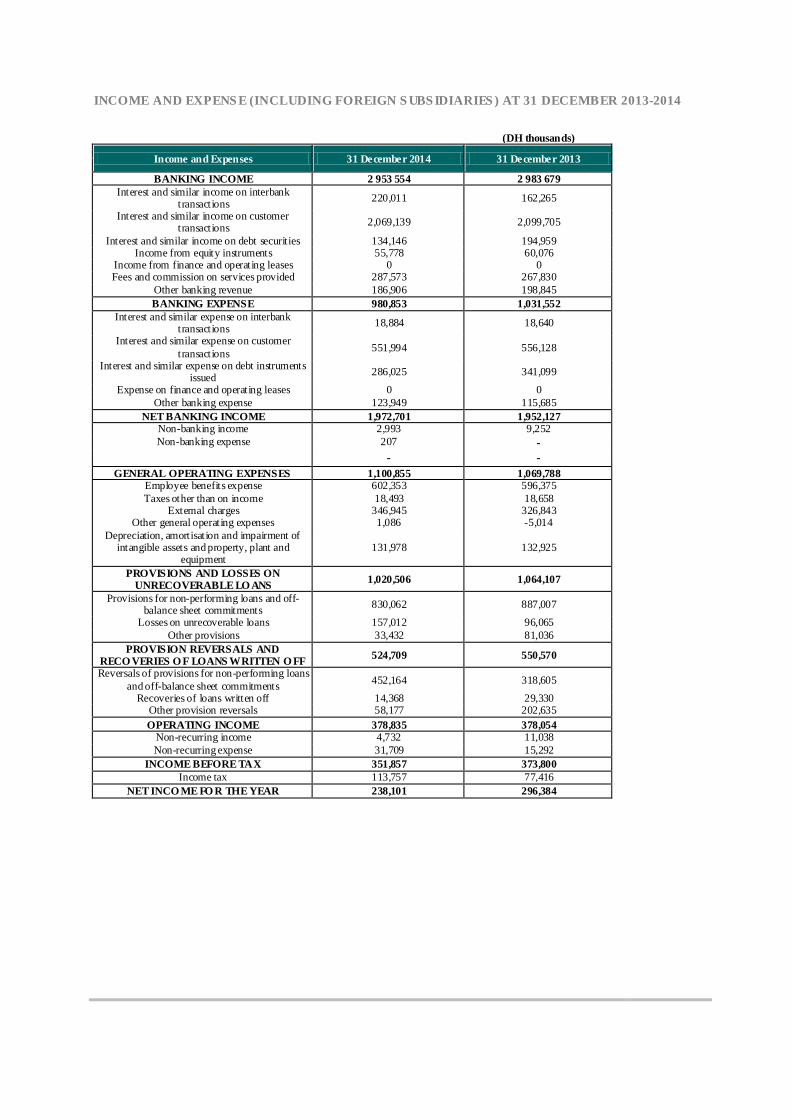
INCOME AND EXPENS E (INCLUDING FOREIGN S UBS IDIARIES ) AT 31 DECEMBER 2013-2014
(DH thousands)
Income and Expenses 31 December 2014 31 December 2013
BANKING INCOME 2 953 554 2 983 679
Interest and similar income on interbank transactions
220,011 162,265
Interest and similar income on customer transactions
2,069,139 2,099,705
Interest and similar income on debt securities 134,146 194,959 Income from equity instruments 55,778 60,076
Income from finance and operating leases 0 0 Fees and commission on services provided 287,573 267,830
Other banking revenue 186,906 198,845
BANKING EXPENSE 980,853 1,031,552
Interest and similar expense on interbank transactions
18,884 18,640
Interest and similar expense on customer
transactions 551,994 556,128
Interest and similar expense on debt instruments issued
286,025 341,099
Expense on finance and operating leases 0 0
Other banking expense 123,949 115,685
NET BANKING INCOME 1,972,701 1,952,127 Non-banking income 2,993 9,252 Non-banking expense 207 -
- - GENERAL OPERATING EXPENSES 1,100,855 1,069,788
Employee benefits expense 602,353 596,375
Taxes other than on income 18,493 18,658 External charges 346,945 326,843
Other general operating expenses 1,086 -5,014
Depreciation, amortisation and impairment of intangible assets and property, plant and
equipment 131,978 132,925
PROVISIONS AND LOSSES ON UNRECOVERABLE LO ANS
1,020,506 1,064,107
Provisions for non-performing loans and off-balance sheet commitments
830,062 887,007
Losses on unrecoverable loans 157,012 96,065
Other provisions 33,432 81,036
PROVISION REVERSALS AND RECO VERIES O F LOANS WRITTEN O FF
524,709 550,570
Reversals of provisions for non-performing loans
and off-balance sheet commitments 452,164 318,605
Recoveries of loans written off 14,368 29,330 Other provision reversals 58,177 202,635
OPERATING INCOME 378,835 378,054 Non-recurring income 4,732 11,038
Non-recurring expense 31,709 15,292
INCOME BEFORE TAX 351,857 373,800
Income tax 113,757 77,416 NET INCO ME FO R THE YEAR 238,101 296,384
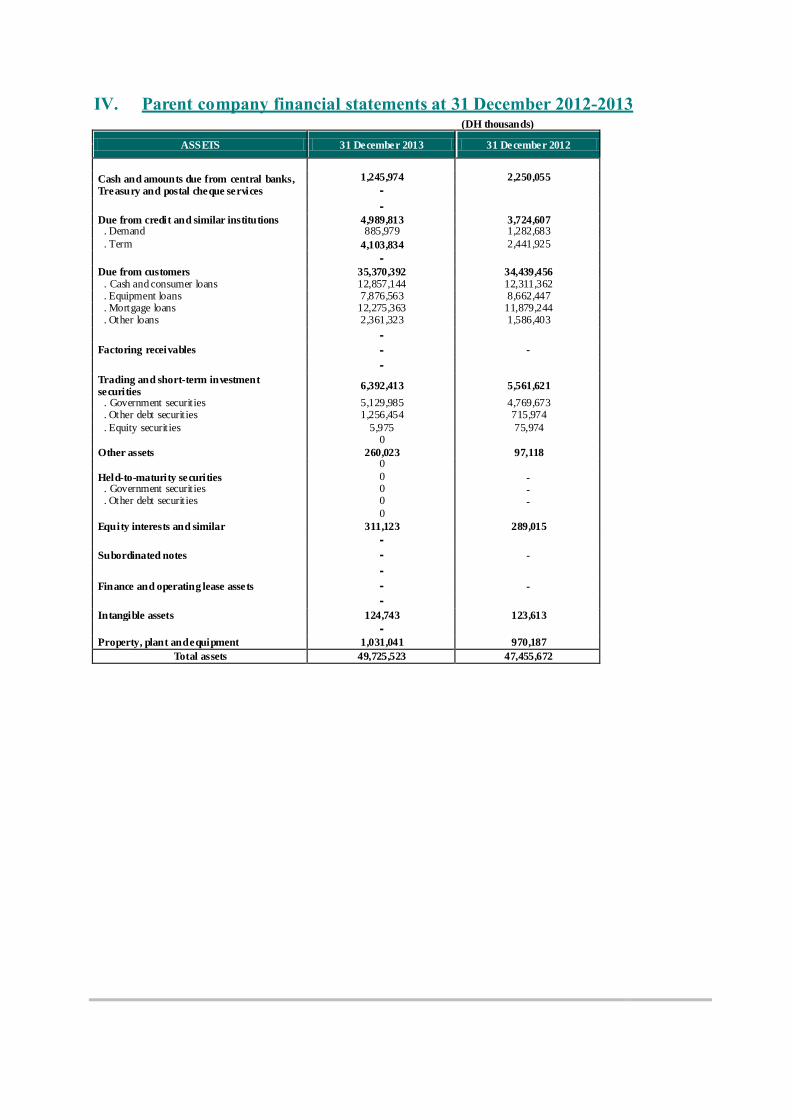
IV. Parent company financial statements at 31 December 2012-2013
(DH thousands)
ASSETS 31 December 2013 31 December 2012
Cash and amounts due from central banks, Treasury and postal cheque services
1,245,974 2,250,055
-
- Due from credit and similar institutions 4,989,813 3,724,607 . Demand 885,979 1,282,683
. Term 4,103,834 2,441,925
-
Due from customers 35,370,392 34,439,456 . Cash and consumer loans 12,857,144 12,311,362 . Equipment loans 7,876,563 8,662,447 . Mortgage loans 12,275,363 11,879,244 . Other loans 2,361,323 1,586,403
- Factoring receivables - -
-
Trading and short-term investment securities
6,392,413 5,561,621
. Government securities 5,129,985 4,769,673 . Other debt securities 1,256,454 715,974
. Equity securities 5,975 75,974 0
Other assets 260,023 97,118 0
Held-to-maturity securities 0 - . Government securities 0 - . Other debt securities 0 - 0
Equity interests and similar 311,123 289,015
-
Subordinated notes - -
- Finance and operating lease assets - -
-
Intangible assets 124,743 123,613
-
Property, plant and equipment 1,031,041 970,187
Total assets 49,725,523 47,455,672
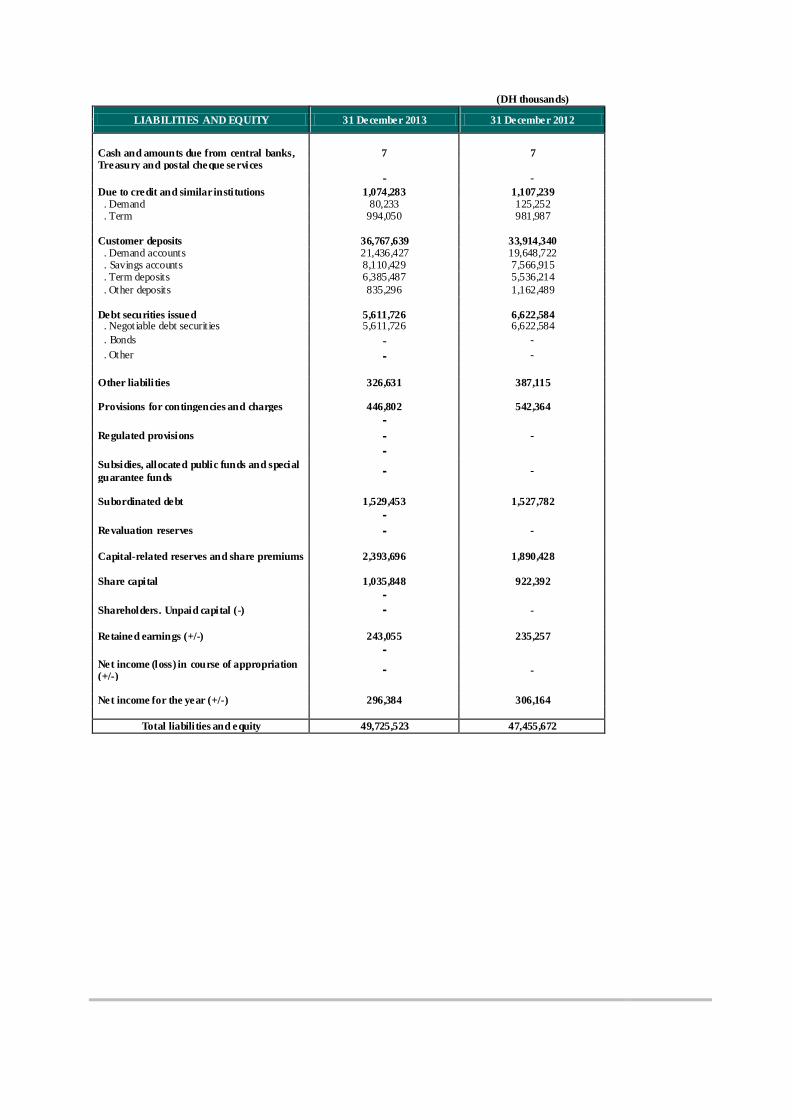
(DH thousands)
LIABILITIES AND EQUITY 31 December 2013 31 December 2012
Cash and amounts due from central banks, Treasury and postal cheque services
7 7
- -
Due to credit and similar institutions 1,074,283 1,107,239 . Demand 80,233 125,252 . Term 994,050 981,987
Customer deposits 36,767,639 33,914,340 . Demand accounts 21,436,427 19,648,722 . Savings accounts 8,110,429 7,566,915 . Term deposits 6,385,487 5,536,214
. Other deposits 835,296 1,162,489
Debt securities issued 5,611,726 6,622,584 . Negotiable debt securities 5,611,726 6,622,584
. Bonds - -
. Other - -
Other liabilities 326,631 387,115
Provisions for contingencies and charges 446,802 542,364
-
Regulated provisions - -
-
Subsidies, allocated public funds and special
guarantee funds - -
Subordinated debt 1,529,453 1,527,782
-
Revaluation reserves - -
Capital-related reserves and share premiums 2,393,696 1,890,428
Share capital 1,035,848 922,392
-
Shareholders. Unpaid capital (-) - -
Retained earnings (+/-) 243,055 235,257
-
Net income (loss) in course of appropriation (+/-)
- -
Net income for the year (+/-) 296,384 306,164
Total liabilities and equity 49,725,523 47,455,672
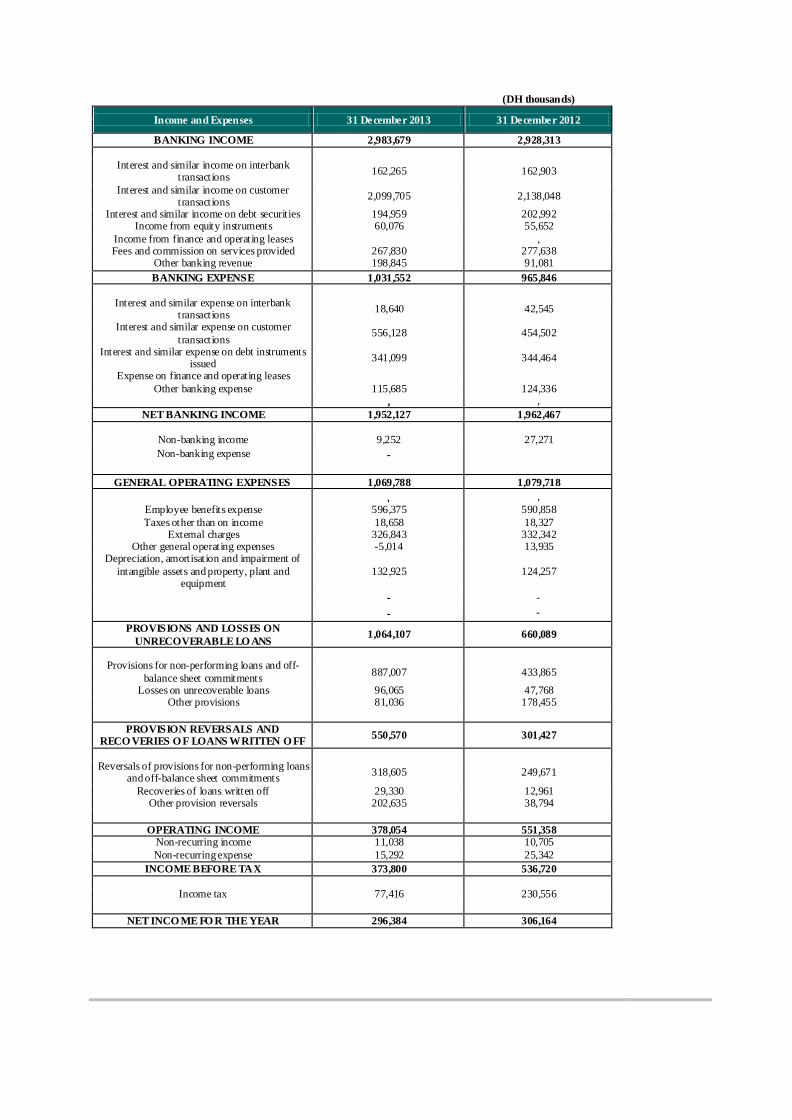
(DH thousands)
Income and Expenses 31 December 2013 31 December 2012
BANKING INCOME 2,983,679 2,928,313
Interest and similar income on interbank transactions
162,265 162,903
Interest and similar income on customer transactions
2,099,705 2,138,048
Interest and similar income on debt securities 194,959 202,992 Income from equity instruments 60,076 55,652
Income from finance and operating leases
, Fees and commission on services provided 267,830 277,638
Other banking revenue 198,845 91,081
BANKING EXPENSE 1,031,552 965,846
Interest and similar expense on interbank
transactions 18,640 42,545
Interest and similar expense on customer
transactions 556,128 454,502
Interest and similar expense on debt instruments issued
341,099 344,464
Expense on finance and operating leases
Other banking expense 115,685 124,336 , ,
NET BANKING INCOME 1,952,127 1,962,467
Non-banking income 9,252 27,271
Non-banking expense -
GENERAL OPERATING EXPENSES 1,069,788 1,079,718
, ,
Employee benefits expense 596,375 590,858
Taxes other than on income 18,658 18,327 External charges 326,843 332,342
Other general operating expenses -5,014 13,935 Depreciation, amortisation and impairment of
intangible assets and property, plant and equipment
132,925 124,257
- -
- -
PROVISIONS AND LOSSES ON
UNRECOVERABLE LO ANS 1,064,107 660,089
Provisions for non-performing loans and off-
balance sheet commitments 887,007 433,865
Losses on unrecoverable loans 96,065 47,768 Other provisions 81,036 178,455
PROVISION REVERSALS AND RECO VERIES O F LOANS WRITTEN O FF
550,570 301,427
Reversals of provisions for non-performing loans and off-balance sheet commitments
318,605 249,671
Recoveries of loans written off 29,330 12,961 Other provision reversals 202,635 38,794
OPERATING INCOME 378,054 551,358 Non-recurring income 11,038 10,705
Non-recurring expense 15,292 25,342
INCOME BEFORE TAX 373,800 536,720
Income tax 77,416 230,556
NET INCO ME FO R THE YEAR 296,384 306,164
IMPORTANT NOTICE
The information provided above is only a summary of the prospectus approved by the
CDVM on 03/08/2015 under reference number VI/EM/022/2015.
The CDVM recommends reading the full text of the prospectus, which is available to the
general public in French.