Embed Size (px)
Citation preview
SUMMARY OF THE ALSEK EARLY-WINTER 2008 MOOSE SURVEY
5-10, 12-13 NOVEMBER 2008
Prepared By:
Susan Westover, Shawn Taylor, Lorne LaRocque, & Rick Ward
July 21, 2009
Alsek Early-winter Moose Survey - November 2008 2
SUMMARY OF THE ALSEK EARLY-WINTER 2008 MOOSE SURVEY
5-10, 12-13 NOVEMBER 2008
Fish and Wildlife Branch
SR-09-03 Yukon Department of Environment
Acknowledgements The Yukon Fish and Wildlife Branch and Champagne and Aishihik First Nation provided staff to conduct the survey. We would like to thank Bill Karman (Kluane Helicopters) and Uli Koerner (Trans North) for providing rotary aircraft support during the 2008 survey period. We also thank Todd Heakes, Beat Hartmann, Brian Bell, Georgina Shumaker, and in particular Linaya Workman and Harry Smith for providing their time and local knowledge of the area as observers during the aerial survey flights.
© 2009 Yukon Department of Environment Copies available from: Yukon Department of Environment Fish and Wildlife Branch, V-5A Box 2703, Whitehorse, Yukon Y1A 2C6 Phone (867) 667-5721, Fax (867) 393-6263 Email: [email protected] Also available online at www.env.gov.yk.ca Suggested citation: WESTOVER, S., S. TAYLOR, L. LAROCQUE, & R. WARD. 2009. Summary of the Alsek Early-Winter
2008 Moose Survey 5-10, 12-13 November 2008. Yukon Fish and Wildlife Branch Report SR-09-03, Whitehorse, Yukon, Canada.
Table of Contents Acknowledgements......................................................................... Inside Cover Table of Contents ............................................................................................. i List of Tables................................................................................................... ii List of Figures ................................................................................................. ii SUMMARY ...................................................................................................... 1 INTRODUCTION.............................................................................................. 2
Previous Surveys .......................................................................................... 2 Community Involvement............................................................................... 6
STUDY AREA .................................................................................................. 7 METHODS ...................................................................................................... 8 WEATHER AND SNOW CONDITIONS ............................................................ 10 RESULTS AND DISCUSSION......................................................................... 10
Stratification (Identification of High and Low Moose Density Blocks) ........... 10 Coverage .................................................................................................... 12 Observations of Moose................................................................................ 14 Distribution and Abundance of Moose ........................................................ 14 Ages and Sexes of Moose ............................................................................ 16 Population Status and Trend: 1981 to 2008................................................ 17 Alsek Entire Comparable Survey Area......................................................... 17 Alsek North Comparable Survey Area ......................................................... 21 Discussion of Population Trend in Alsek Entire and Alsek North Comparable survey areas: 1998 to 2008 ........................................................................ 25 Kluane National Park – 2008 Auriol Range moose survey............................ 26 Harvest ...................................................................................................... 26 Other Wildlife Sightings.............................................................................. 32
CONCLUSIONS AND RECOMMENDATIONS.................................................. 33 LITERATURE CITED ..................................................................................... 34
Alsek Early-winter Moose Survey - November 2008 i
List of Tables Table 1. Summary of moose hunt regulation changes in the Alsek area: 1976
through 2008............................................................................................. 7 Table 2. Observations of moose during the November 2008 survey in the Alsek
survey area. ............................................................................................. 14 Table 3. Estimated abundance of moose in the Alsek survey area in November
2008........................................................................................................ 15 Table 4. Estimated composition of the moose population in the Alsek survey
area in November 2008. ........................................................................... 16 Table 5. Results of the 1981, 1982, 1998 and 2008 early-winter moose
population surveys of the Alsek Entire Comparable survey area. No sightability correction factors are included in results1. ............................. 20
Table 6. Results of the 1981 to 1984 early-winter moose population surveys of the Alsek North Comparable survey area. No sightability correction factor is included in results1.................................................................................. 23
Table 7. Results of the 1990, 1998, 2000 and 2008 early-winter moose population surveys of the Alsek North Comparable survey area. No sightability correction factor is included in results1. ................................. 24
Table 8. Average Annual Non-First Nation (2004-2008) and First Nation (2003-2007) Moose Harvest and Allowable Harvest Summary for the 2008 Alsek Moose Survey Area: by Moose Management Unit and Game Management Subzone (GMS) 6-12 to 6-13, 7-01 to 7-12 ............................................... 30
List of Figures Figure 1. Map 1 2008 Alsek Moose Survey Area .............................................. 3 Figure 2. Map 2 Previous Moose Population Surveys. ...................................... 4 Figure 3. Map 3 Previous Moose Population Surveys ....................................... 5 Figure 4. Map 4 Stratification Survey Results in the Alsek Moose Survey Area
................................................................................................................ 11 Figure 5. Map 5 Census Survey Results in the 2008 Alsek Moose Survey Area.
................................................................................................................ 13 Figure 6. Map 6 Alsek Entire Comparable Survey Area. ................................. 18 Figure 7. Map 7 Alsek North Comparable Survey Area................................... 19 Figure 8. Annual Reported Moose Harvest (1979-2008) in the Alsek Moose
Survey Area1 (Game Management Subzones: 6-12 to 6-13, 7-01 to 7-12).. 28 Figure 9. Map 8 Moose Management Units (MMUs) in 2008 Alsek Survey Area.
................................................................................................................ 31
Alsek Early-winter Moose Survey - November 2008 ii
Alsek Early-winter Moose Survey - November 2008 1
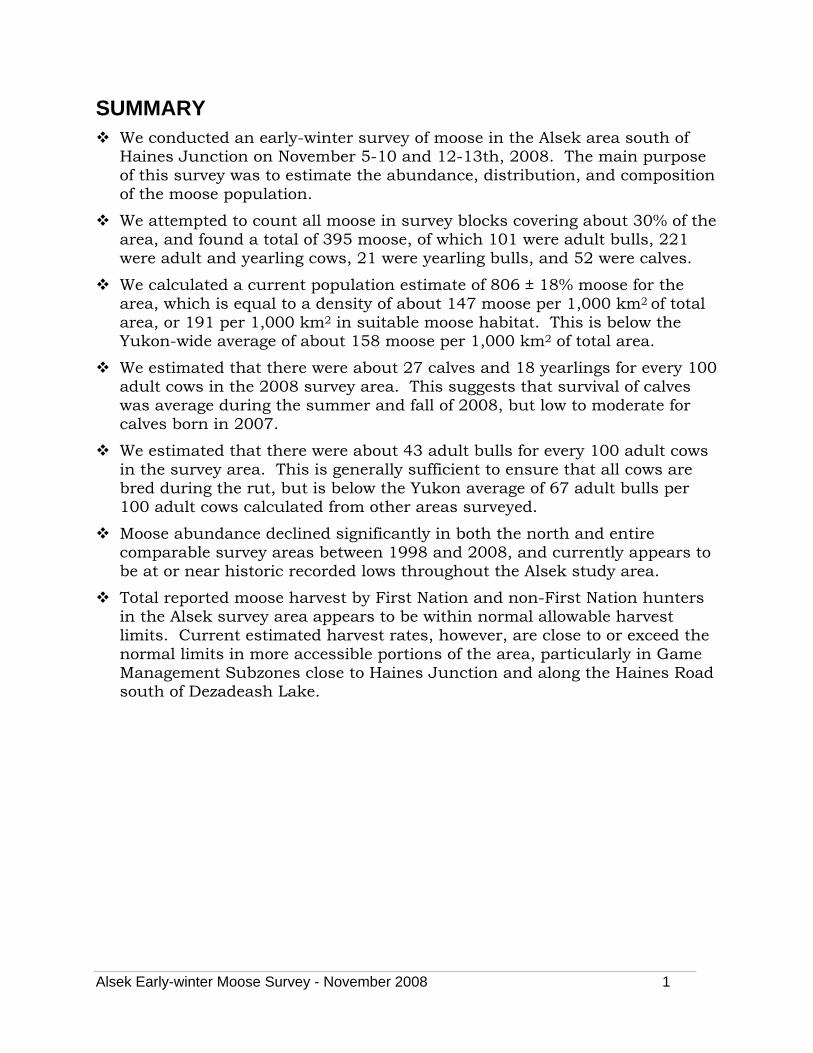
SUMMARY We conducted an early-winter survey of moose in the Alsek area south of
Haines Junction on November 5-10 and 12-13th, 2008. The main purpose of this survey was to estimate the abundance, distribution, and composition of the moose population.
We attempted to count all moose in survey blocks covering about 30% of the area, and found a total of 395 moose, of which 101 were adult bulls, 221 were adult and yearling cows, 21 were yearling bulls, and 52 were calves.
We calculated a current population estimate of 806 ± 18% moose for the area, which is equal to a density of about 147 moose per 1,000 km2 of total area, or 191 per 1,000 km2 in suitable moose habitat. This is below the Yukon-wide average of about 158 moose per 1,000 km2 of total area.
We estimated that there were about 27 calves and 18 yearlings for every 100 adult cows in the 2008 survey area. This suggests that survival of calves was average during the summer and fall of 2008, but low to moderate for calves born in 2007.
We estimated that there were about 43 adult bulls for every 100 adult cows in the survey area. This is generally sufficient to ensure that all cows are bred during the rut, but is below the Yukon average of 67 adult bulls per 100 adult cows calculated from other areas surveyed.
Moose abundance declined significantly in both the north and entire comparable survey areas between 1998 and 2008, and currently appears to be at or near historic recorded lows throughout the Alsek study area.
Total reported moose harvest by First Nation and non-First Nation hunters in the Alsek survey area appears to be within normal allowable harvest limits. Current estimated harvest rates, however, are close to or exceed the normal limits in more accessible portions of the area, particularly in Game Management Subzones close to Haines Junction and along the Haines Road south of Dezadeash Lake.
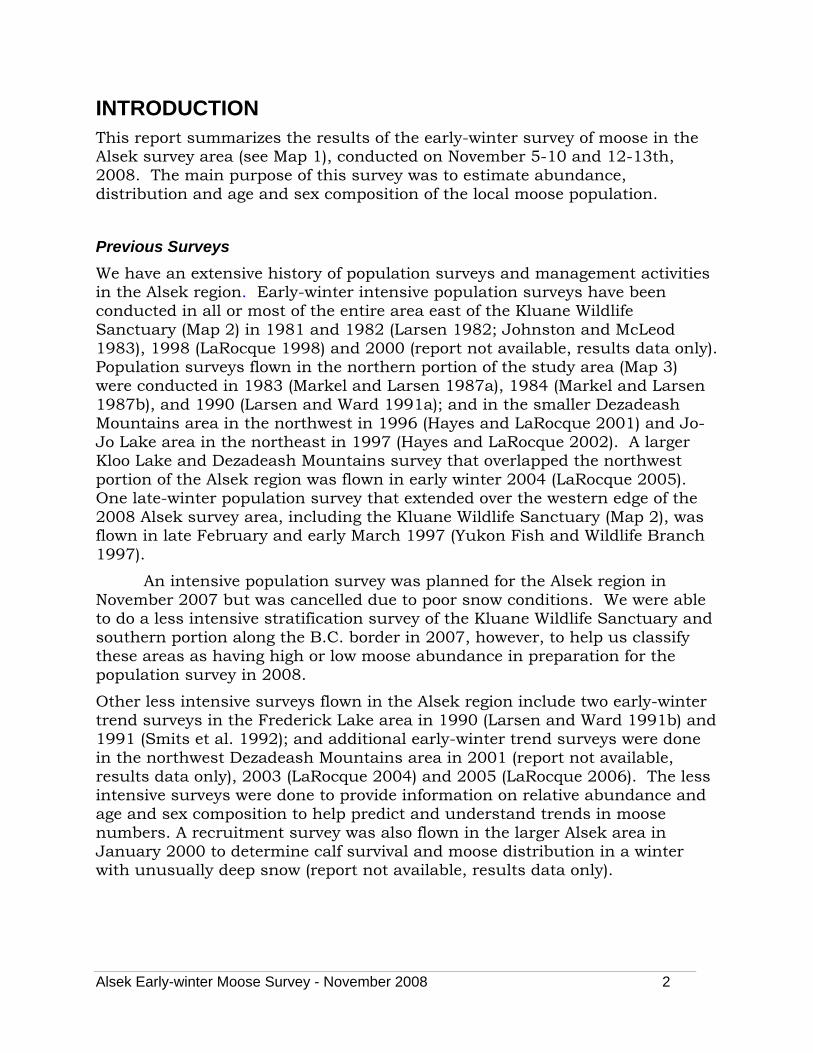
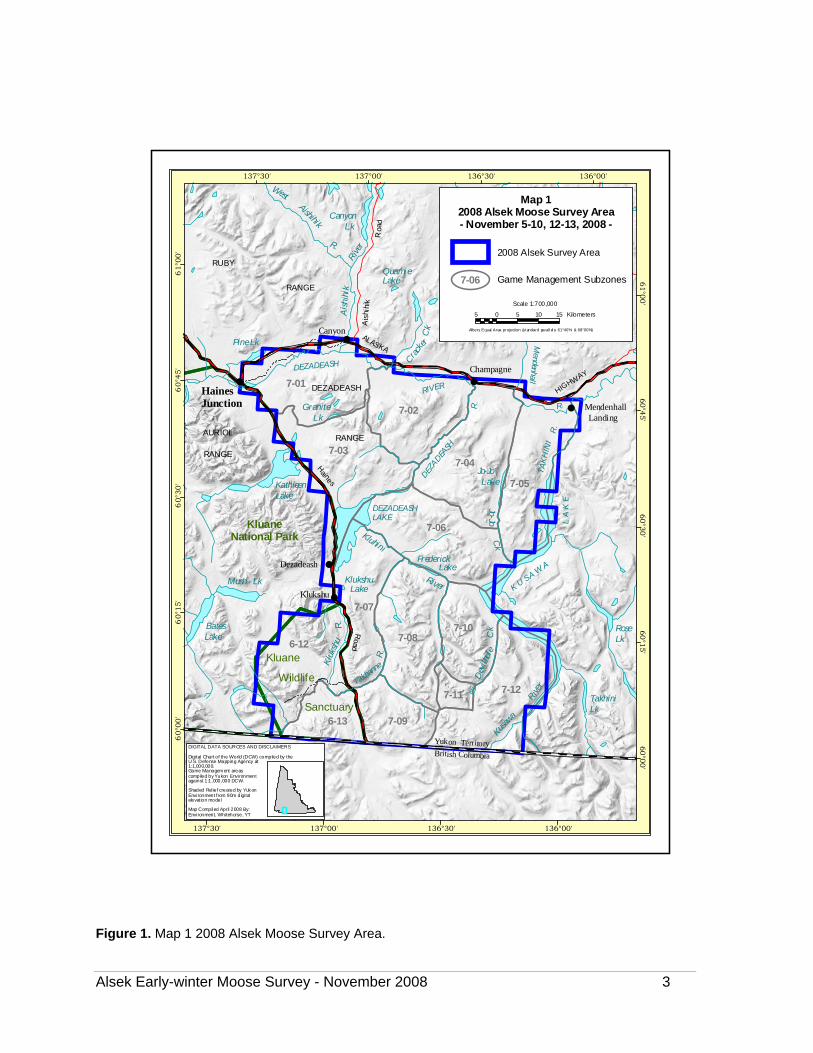
INTRODUCTION This report summarizes the results of the early-winter survey of moose in the Alsek survey area (see Map 1), conducted on November 5-10 and 12-13th, 2008. The main purpose of this survey was to estimate abundance, distribution and age and sex composition of the local moose population.
Previous Surveys
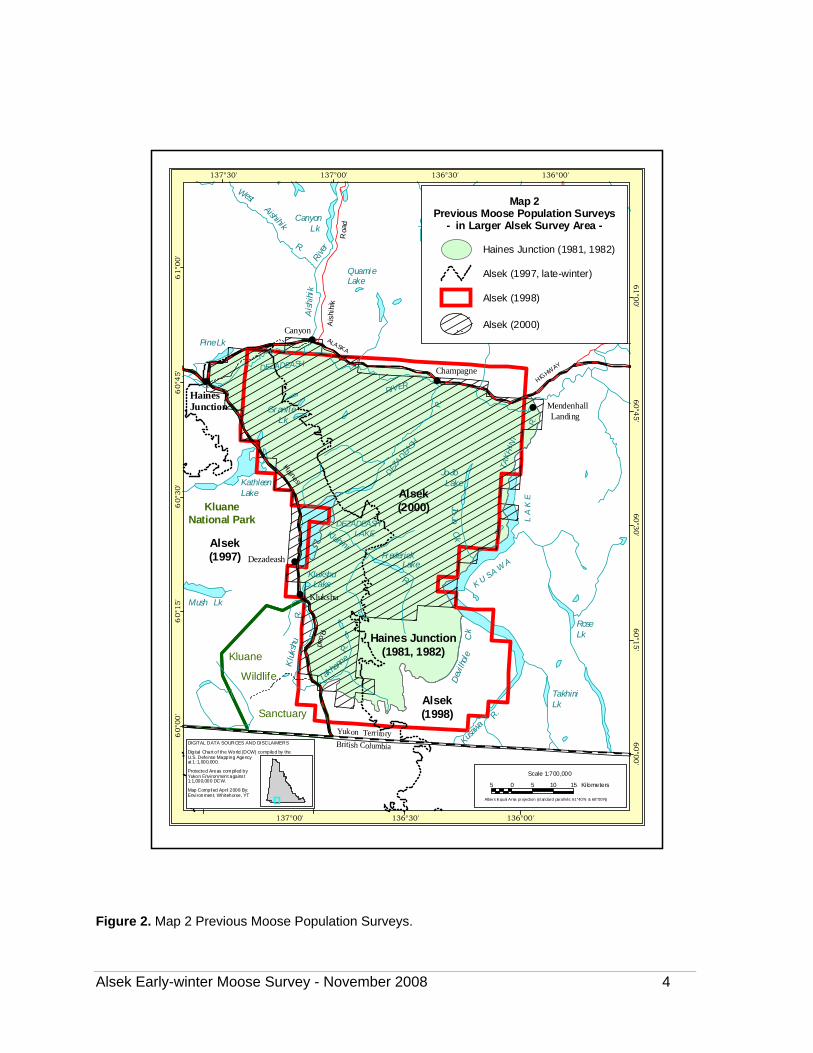
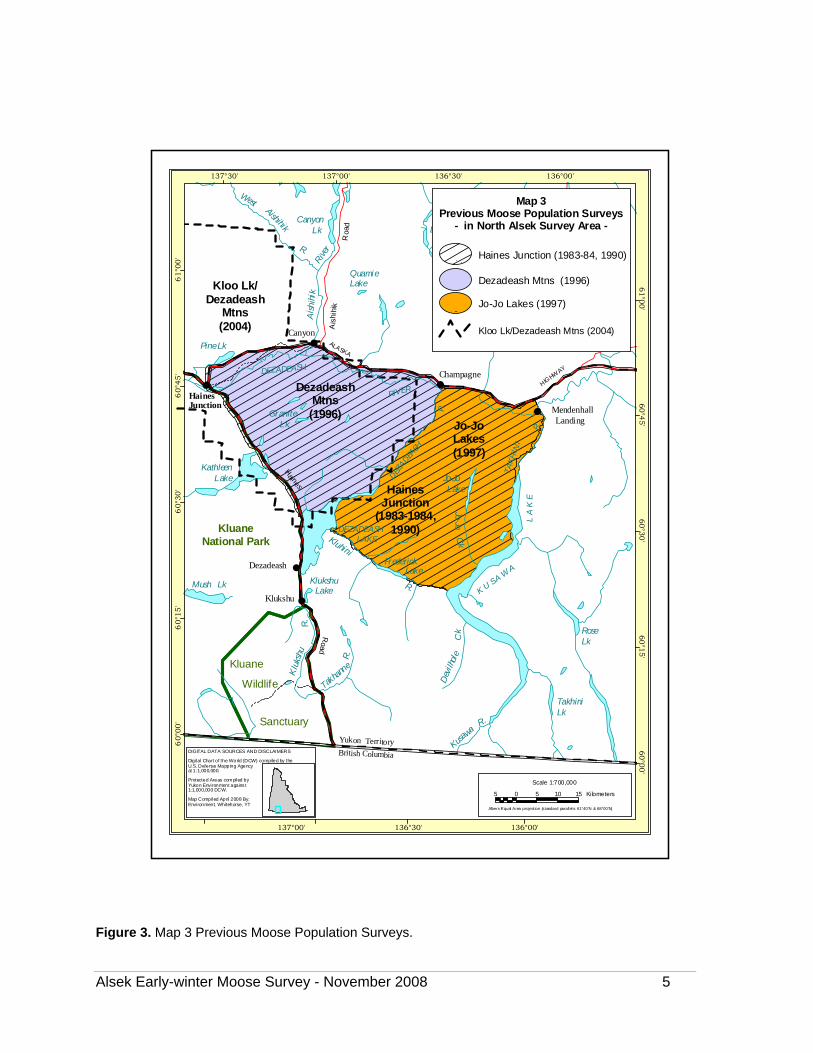
We have an extensive history of population surveys and management activities in the Alsek region. Early-winter intensive population surveys have been conducted in all or most of the entire area east of the Kluane Wildlife Sanctuary (Map 2) in 1981 and 1982 (Larsen 1982; Johnston and McLeod 1983), 1998 (LaRocque 1998) and 2000 (report not available, results data only). Population surveys flown in the northern portion of the study area (Map 3) were conducted in 1983 (Markel and Larsen 1987a), 1984 (Markel and Larsen 1987b), and 1990 (Larsen and Ward 1991a); and in the smaller Dezadeash Mountains area in the northwest in 1996 (Hayes and LaRocque 2001) and Jo-Jo Lake area in the northeast in 1997 (Hayes and LaRocque 2002). A larger Kloo Lake and Dezadeash Mountains survey that overlapped the northwest portion of the Alsek region was flown in early winter 2004 (LaRocque 2005). One late-winter population survey that extended over the western edge of the 2008 Alsek survey area, including the Kluane Wildlife Sanctuary (Map 2), was flown in late February and early March 1997 (Yukon Fish and Wildlife Branch 1997).
An intensive population survey was planned for the Alsek region in November 2007 but was cancelled due to poor snow conditions. We were able to do a less intensive stratification survey of the Kluane Wildlife Sanctuary and southern portion along the B.C. border in 2007, however, to help us classify these areas as having high or low moose abundance in preparation for the population survey in 2008.
Other less intensive surveys flown in the Alsek region include two early-winter trend surveys in the Frederick Lake area in 1990 (Larsen and Ward 1991b) and 1991 (Smits et al. 1992); and additional early-winter trend surveys were done in the northwest Dezadeash Mountains area in 2001 (report not available, results data only), 2003 (LaRocque 2004) and 2005 (LaRocque 2006). The less intensive surveys were done to provide information on relative abundance and age and sex composition to help predict and understand trends in moose numbers. A recruitment survey was also flown in the larger Alsek area in January 2000 to determine calf survival and moose distribution in a winter with unusually deep snow (report not available, results data only).
Alsek Early-winter Moose Survey - November 2008 2
##
#
WestAishihik
R.
Canyon Lk
Hutshi
Lakes
Sceptre Lake
DEZA
DEA
SH
R.
Kluhini
DEZADEASH
RIVER
R.
River
DEZADEASHLAKE
Frederick
Moraine
KlukshuLake
Lake
Ai s
h ihi
kRiv
er
TA
KH
INI
Pine Lk
TayeLake
K U S A W
AL
A K
E
Granite Lk
QuamieLake
Harr isonLake
KathleenLake
Mush Lk
V E
R
HIGHW
AY
Lake
Ck
Kusaw
a
River
TakhiniLk
RoseLk
ALASKA
Dev
i lhol
e
Yukon TerritoryBritish Columbia
HainesJunction
Kluane
Wildlife
KluaneNational Park
7-04
7-12
7-06
7-03
7-01
7-05
7-02
7-086-12
7-07
7-096-13
7-11
7-10
Ais
h ihi
k
Roa
d
AURIOL
Jo-Jo Lake
RANGE
RANGE
DEZADEASH
Road
Haines
Klu
kshu
R.
R.
Takhann
e
Dezadeash
Sanctuary
Champagne
Klukshu#
Mendenhall
Cra
cker
Ck
#Canyon
Mendenhall Landing
#
Jo-JoC
k
R.
BatesLake
RUBY
RANGE
60°0
0'
60°0
0'
60°1
5'
60°1
5'
60°3
0'
60°3
0'
60°4
5'
60°4
5'
61°0
0'
61°0
0'
137°30'
137°30'
137°00'
137°00'
136°30'
136°30'
136°00'
136°00'
DIGITAL DATA SOURCES AND DISCLAIMERS
Digital Chart of the World (DCW) compiled by the U.S. Defense Mapping Agency at1:1,000,000.Game Management areascompiled by Yukon Environmentagainst 1:1,000,000 DCW.
Shaded Rel ief created by Yuk onEnvi ronment from 90m digi talelevation model
Map Compiled April 2008 By:Envi ronment, Whitehorse, YT
Map 12008 Alsek Moose Survey Area- November 5-10, 12-13, 2008 -
Scale 1:700,000
5 0 5 10 15 Kilometers
Albers Equal Area project ion (standard parall el s: 61°40'N & 68°00'N)
Game Management Subzones7-06
2008 Alsek Survey Area
Figure 1. Map 1 2008 Alsek Moose Survey Area.
Alsek Early-winter Moose Survey - November 2008 3
Alsek Early-winter Moose Survey - November 2008 4
Figure 2. Map 2 Previous Moose Population Surveys.
##
#
Alsek(1997)
#
#
#
Aishihik
R.
Canyon Lk
Hutshi
Lakes
Sceptre Lake
DEZADEA
SH
R.
Kluhini
DEZADEASH
RIVER
R.
R.
DEZADEASH LAKE
Frederick
Moraine
KlukshuLake
Lake
Ai s
h ihi
kRiv
er
TAKH
I NI
Pine Lk
TayeLake
K U S A W
A
L A
K E
Granite Lk
QuamieLake
Harr isonLake
KathleenLake
Mush Lk
HIGHW
AY
Lake
Ck
Kusaw
a
R.
TakhiniLk
RoseLk
ALASKA
Dev
i lhol
e
Yukon TerritoryBritish Columbia
HainesJunction
Kluane
Wildlife
KluaneNational Park
Ais
h ihi
k
Roa
d
Jo-Jo Lake
Road
Haines
Klu
ksh u
R.
R.
Takha
nne
Dezadeash
Sanctuary
Champagne
Klukshu
Canyon
Mendenhall Landing
Jo-JoC
k
Haines Junction(1981, 1982)
Alsek(1998)
Alsek(2000)
West
60°0
0'
60°0
0'
60°1
5'
60°1
5'
60°3
0'
60°3
0'
60°4
5'
60°4
5'
61°0
0'
61°0
0'
137°30'
137°00'
137°00'
136°30'
136°30'
136°00'
136°00'
Scale 1:700,000
5 0 5 10 15 Kilometers
Albers Equal Area project ion (standard parall el s: 61°40'N & 68°00'N)
Map 2Previous Moose Population Surveys
- in Larger Alsek Survey Area -
Alsek (1997, late-winter)
Haines Junction (1981, 1982)
Alsek (2000)
Alsek (1998)
DIGITAL DATA SOURCES AND DISCLAIMERS
Digital Chart of the World (DCW) compiled by the U.S. Defense Mapping Agencyat 1:1,000,000.
Protected Areas compiled byYukon Environment agains t1:1,000,000 DCW.
Map Compiled April 2008 By:Environment, Whitehorse, YT
##
#
HainesJunction
(1983-1984,1990)
DezadeashMtns(1996)
Jo-JoLakes(1997)
Kloo Lk/Dezadeash
Mtns(2004)
#
#
#
Aishihik
R.
Canyon Lk
Hutshi
Lakes
Sceptre Lake
DEZ
ADEA
SH
R.
Kluhini
DEZADEASH
RIVER
R.
R.
DEZADEASH LAKE
Frederick
Moraine
KlukshuLake
Lake
Ai s
h ihi
kRiv
er
TA
KH
I NI
Pine Lk
TayeLake
K U S A W
A
L A
K E
Granite Lk
QuamieLake
Harr isonLake
KathleenLake
Mush Lk
HIGHW
AY
Lake
Ck
Kusawa
R.
TakhiniLk
RoseLk
ALASKA
Dev
i lhol
e
Yukon TerritoryBritish Columbia
Kluane
Wildlife
KluaneNational Park
Ais
h ihi
k
Roa
d
Jo-Jo Lake
Road
Haines
Klu
kshu
R.
R.
Takha
nne
Dezadeash
Sanctuary
Champagne
Klukshu
Canyon
Mendenhall Landing
Jo-JoC
k
West
HainesJunction
60°0
0'
60°0
0'
60°1
5'
60°1
5'
60°3
0'
60°3
0'
60°4
5'
60°4
5'
61°0
0'
61°0
0'
137°30'
137°00'
137°00'
136°30'
136°30'
136°00'
136°00'
Scale 1:700,000
5 0 5 10 15 Kilometers
Albers Equal Area projection (standard parall el s: 61°40'N & 68°00'N)
DIGITAL DATA SOURCES AND DISCLAIMERS
Digital Chart of the World (DCW) compiled by the U.S. Defense Mapping Agencyat 1:1,000,000.
Protected Areas compiled byYukon Environment agains t1:1,000,000 DCW.
Map Compiled April 2008 By:Envi ronment, Whitehorse, YT
Dezadeash Mtns (1996)
Jo-Jo Lakes (1997)
Kloo Lk/Dezadeash Mtns (2004)
Map 3Previous Moose Population Surveys
- in North Alsek Survey Area -
Haines Junction (1983-84, 1990)
Figure 3. Map 3 Previous Moose Population Surveys.
Alsek Early-winter Moose Survey - November 2008 5
More recently, two small late-winter habitat surveys were conducted near Haines Junction in March 2008 (LaRocque 2008) and March 2009 (Taylor and LaRocque 2009), to obtain late-winter and deep snow pack moose distribution and habitat use patterns to support land use planning and development impact assessment.
Kluane National Park has also been conducting annual early-winter trend surveys in moose concentration areas in the Auriol Range, just northwest of the Alsek survey area since 1974. The trend surveys are flown in early November in subalpine habitat where moose are known to aggregate after the rut, and are similar in timing to Yukon Government surveys. The purpose of these and other wildlife surveys that the park conducts is to monitor the health of the greater Kluane ecosystem. The moose population that summers in the Auriol Range migrates into the Alsek survey area in early winter, presumably in response to deep snow accumulations in the mountains. Although the Kluane National Park trend surveys do not provide estimates of moose density or total population within the Auriol range, information from the surveys help to provide a more complete regional picture of moose population trend and calf and yearling recruitment over time.
Community Involvement
The Haines Junction and Alsek district is an important moose harvesting area for Champagne and Aishihik hunters, and historically for non-First Nations hunters previous to the mid 1980s. As a result, the area has a long history of moose and harvest management. A summary of Alsek moose harvest regulation changes from 1976 to present is provided in Table 1. The following is a brief listing of community involvement in harvest regulations and moose management for this region.
1) The community was involved in the Alsek Moose Management Plan and is currently involved in the Champagne and Aishihik First Nation Traditional Territory (CAFN TT) Integrated Wildlife Plan. Moose management and population recovery figures prominently in these plans.
2) Champagne and Aishihik First Nation lands and resource staff are involved in moose surveys and management in the CAFN TT.
3) An extended hunt for licensed hunters was introduced in 1996 in response to the Alsek Renewable Resources Council request for more moose hunting opportunities in the Alsek area (Table 1).
4) Moose hunting by licensed hunters in the Alsek survey area is managed through a Permit Hunt Authorization (PHA) system. Nine permits are currently issued annually with the objective of harvesting a maximum of 5 moose per year. In years when less than 5 moose are harvested by resident non-First Nation hunters during the regular August 1 through October 31 season; an extended hunt is administered to provide licensed
Alsek Early-winter Moose Survey - November 2008 6
hunters with additional opportunities. The extended winter hunt continues until the annual allowable harvest of 5 moose has been taken and all eligible hunters have finished their two week hunt period, or March 31, whichever is reached first.
5) Harvest by non-residents is managed through outfitter quotas negotiated between the affected outfitter, Yukon Government and the Alsek Renewable Resource Council.
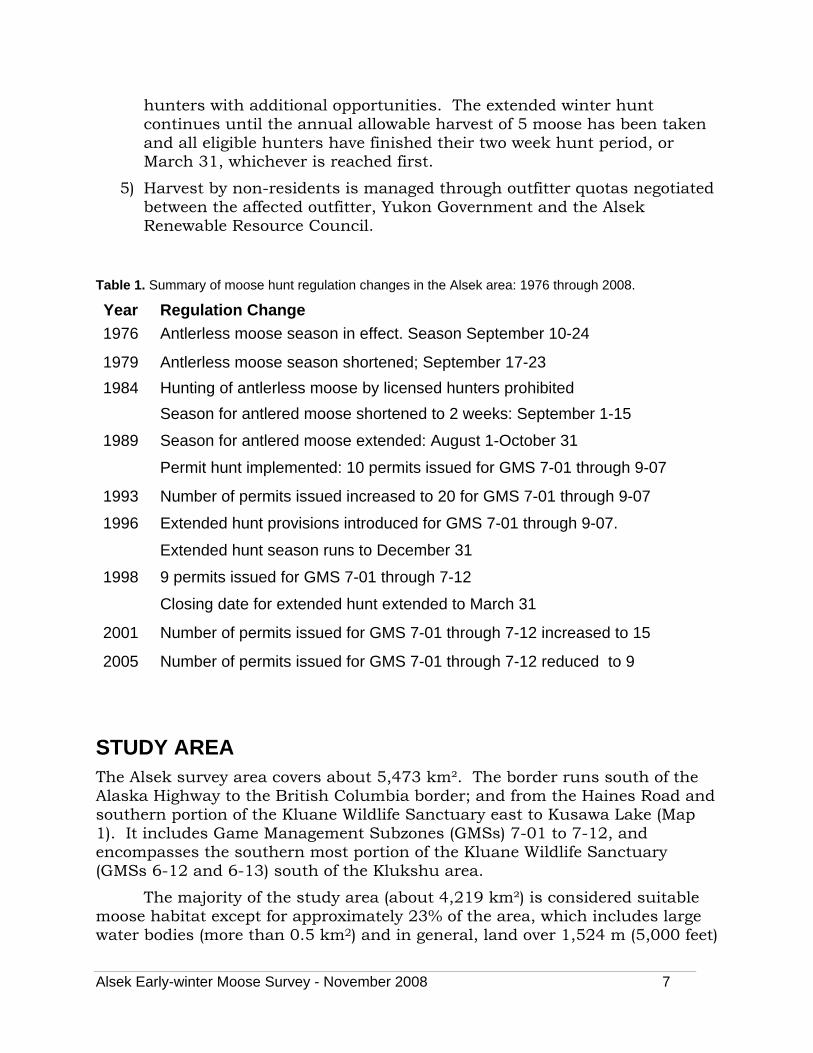
Table 1. Summary of moose hunt regulation changes in the Alsek area: 1976 through 2008.
Year Regulation Change
1976 Antlerless moose season in effect. Season September 10-24
1979 Antlerless moose season shortened; September 17-23
1984 Hunting of antlerless moose by licensed hunters prohibited
Season for antlered moose shortened to 2 weeks: September 1-15
1989 Season for antlered moose extended: August 1-October 31
Permit hunt implemented: 10 permits issued for GMS 7-01 through 9-07
1993 Number of permits issued increased to 20 for GMS 7-01 through 9-07
1996 Extended hunt provisions introduced for GMS 7-01 through 9-07.
Extended hunt season runs to December 31
1998 9 permits issued for GMS 7-01 through 7-12
Closing date for extended hunt extended to March 31
2001 Number of permits issued for GMS 7-01 through 7-12 increased to 15
2005 Number of permits issued for GMS 7-01 through 7-12 reduced to 9
STUDY AREA The Alsek survey area covers about 5,473 km². The border runs south of the Alaska Highway to the British Columbia border; and from the Haines Road and southern portion of the Kluane Wildlife Sanctuary east to Kusawa Lake (Map 1). It includes Game Management Subzones (GMSs) 7-01 to 7-12, and encompasses the southern most portion of the Kluane Wildlife Sanctuary (GMSs 6-12 and 6-13) south of the Klukshu area.
The majority of the study area (about 4,219 km²) is considered suitable moose habitat except for approximately 23% of the area, which includes large water bodies (more than 0.5 km2) and in general, land over 1,524 m (5,000 feet)
Alsek Early-winter Moose Survey - November 2008 7
in altitude, although some moose are observed at higher elevations. The survey region lies within the Boreal Cordillera ecozone and is comprised of three ecoregions (Yukon Ecoregions Working Group 2004). It is primarily a mix of dissected plateaus, rolling hills and broad valleys containing various lakes and rivers in the Yukon Southern Lakes ecoregion in the northern half; to the rugged mountain ranges, alpine glaciers and high snowfall of the south (Yukon-Stikine Highlands ecoregion). A small strip of the Ruby Ranges ecoregion occurs along the Haines road to south of Dezadeash Lake in the Shakwak Trench, which separates the rugged mountains to the west from the lower mountains and broad valleys of the east.
The climate is generally dry or arid, falling within the rain shadow of the St. Elias-Coast Mountains. The Yukon-Stikine Highlands ecoregion, however, is close enough to the Pacific Ocean to funnel moderate amounts of precipitation up the Haines Road and Kusawa Lake valley corridors. Open coniferous and mixed woodland boreal forest dominate valley bottoms, grading to shrub willow or birch in the subalpine and dwarf shrub and lichen tundra at elevations 1350 to 1400 m above sea level (Yukon Ecoregions Working Group 2004). Very few forest fires have been recorded in the study area. Most of these were relatively small older fires occurring primarily in the northeast between 1948 and 1951.
METHODS We have adapted a relatively new survey technique, developed by Jay Ver Hoef with the Alaska Department of Fish and Game (Kellie and DeLong 2006), to survey moose. Field sampling portions of this new geospatial technique are similar to those used in the stratified random block method (Gasaway et al. 1986) we used prior to 1999, except that we count moose in square rather than irregularly shaped survey blocks. This new technique offers the ability to employ more current population estimation procedures.
The technique involves six steps:
1. The survey area is divided into uniform rectangular blocks about 17 km² in size.
2. Observers in fixed-wing aircraft fly over all the blocks, and classify (or “stratify”) each block as having either high, medium, low, or very low expected moose abundance, based on local knowledge, number of moose seen, tracks, and habitat. This is called the “stratification” portion of the survey.
3. We combine these categories of blocks into high or low “strata”, and then randomly select a sample of blocks in each stratum for inclusion in the following steps.
Alsek Early-winter Moose Survey - November 2008 8
4. We try to count every moose within the selected blocks (the “census” part of the survey) using helicopters at a search intensity of about 2 minutes per km2. We classify all moose seen by age (adult, yearling, or calf) and sex. Yearling cows are often difficult to distinguish from adults, so we classify all cows as adults, and later estimate the number of yearling cows that were present among the older cows based on the number of yearling bulls we saw.
5. To estimate the number of moose that we missed during step 4, we include a step from the stratified random block technique where we re-fly a portion of some of our selected survey blocks at twice the search intensity (about 4 minutes per km2). This information is used to develop a “sightability correction factor” to be incorporated into our population estimate.
6. We use computer programs to estimate the total number of moose in each age and sex category in the entire survey area based on the numbers of moose counted in the blocks during the census. The “sightability correction factor” is applied to the total number to account for moose that we miss.
Generally, the more blocks that are searched during the census portion of the survey (step 4), the more precise and reliable the resulting population estimate.
The geospatial technique has the advantage of being easier operationally to fly, is flexible for small area estimation, and provides good population estimates, often with greater precision than the stratified random block method. The stratified random block technique, however, allows us to determine and apply a sightability correction factor to our estimated population data to allow for moose that are missed. The difference in precision of the population estimates developed using the two techniques, or if a sightability correction factor is calculated during the survey, will determine which population estimation technique is used and reported.
In the harvest section of this report, total moose abundance in each Game Management Subzone (see Table 7) is estimated by multiplying the average moose density in the high and low stratum blocks by the number of high and low stratum blocks per Game Management Subzone respectively. This is a change from past reports where survey area wide moose density was applied to each Game Management Subzone.
Alsek Early-winter Moose Survey - November 2008 9
WEATHER AND SNOW CONDITIONS Weather conditions were variable during the 2008 survey. Temperatures
were moderate, ranging from -20°C to -1°C, and winds were mainly calm or low, with a few days of strong winds at the midpoint and last few days of the survey period. We were able to fly on all but one day due to snow, although half of the survey days were cut short due to visibility problems related to low ceilings and valley fog, icing conditions or snow.
Snow accumulations were greater throughout the study area than they have been in the past few years. Snow depths were generally low (<15 cm) to intermediate (30 to 60 cm) in the north half of the region, and intermediate in the south. We generally had complete snow coverage for good tracking and sighting of moose, with the exception of about 28% of the blocks surveyed which were wind blown or had some brown slopes, primarily in the northeast portion of the study area.
RESULTS AND DISCUSSION Stratification (Identification of High and Low Moose Density Blocks)
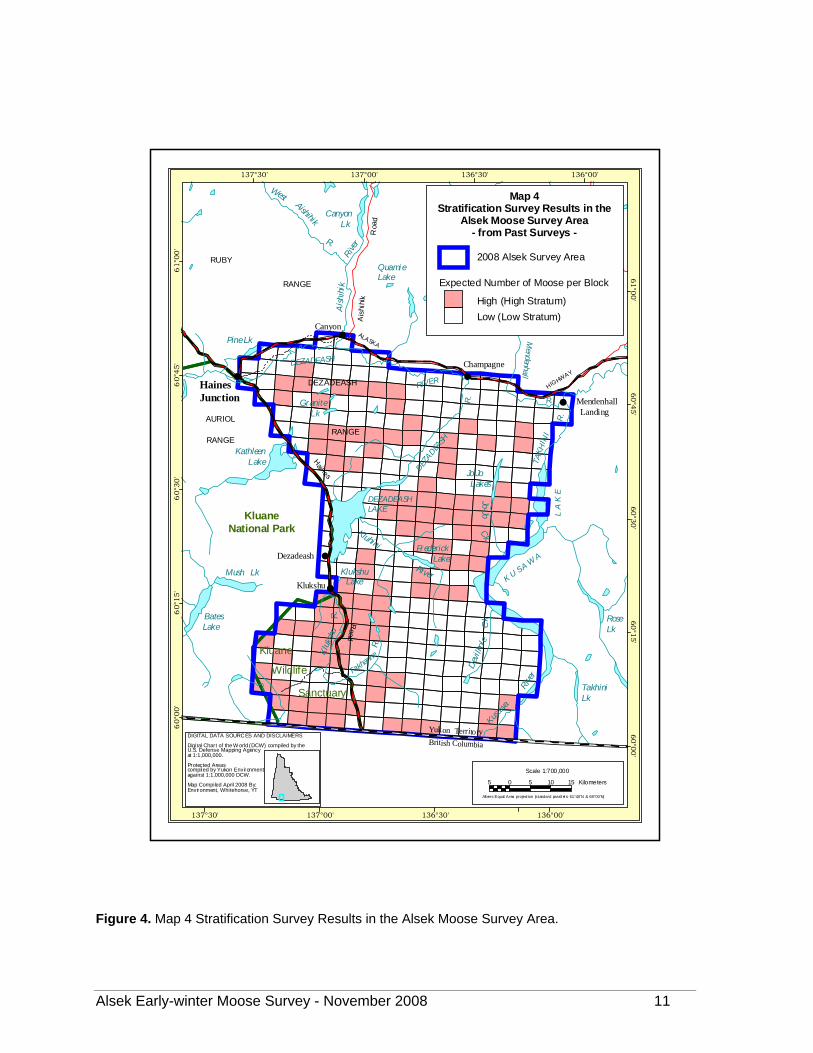
In 2008, we used the most current strata classification data from past population surveys (1981-1984, 1990, 1996-1997) to designate high and low strata blocks for most of the entire study area (see Map 4).
We then stratified the remainder of the area along the southern border and in the Kluane Wildlife Sanctuary portion of the study area, using a 4-seat Maule M7 aircraft with pilot and 1 observer, on November 6th, 2007.
We classified 107 (33%) of the 321 survey blocks as having high expected moose abundance and 214 (67%) as having low expected abundance of moose (Map 4). Most of the blocks with higher expected moose numbers were located in the subalpine areas in the Dezadeash Range, southwest of Jo-Jo Lake, Kluane Wildlife Sanctuary and Klukshu River areas. Subalpine areas east of the Takhanne River, however, were primarily classified as having low expected moose abundance due to the steep terrain and generally deeper snow levels.
Alsek Early-winter Moose Survey - November 2008 10
##
#
Takhan
ne
#
Aishihik
R.
Canyon Lk
Hutshi
Lakes
Sceptre Lake
DEZ
AD
EASH
R.
Kluhini
DEZADEASH
RIVER
R.
River
DEZADEASHLAKE
Frederick
Moraine
KlukshuLake
Lake
Ai s
h ihi
kRiv
er
TA
KH
I NI
Pine Lk
TayeLake
K U S A W
AL
A K
E
Granite Lk
QuamieLake
HarrisonLake
KathleenLake
Mush Lk
HIGHWAY
Lake
Ck
Kusaw
a
River
TakhiniLk
RoseLk
ALASKA
Dev
i lhol
e
Yukon TerritoryBritish Columbia
HainesJunction
Kluane
Wildlife
KluaneNational Park
Ais
h ihi
k
Roa
d
Jo-Jo Lakes
Road
Haines
Klu
kshu
R.
R.
Dezadeash
Sanctuary
Champagne
Klukshu
Mendenhall
Canyon
Mendenhall Landing
Jo-JoC
k
R.
BatesLake
#
#
#
West
RANGE
RUBY
DEZADEASH
RANGERANGE
AURIOL
60°0
0'
60°0
0'
60°1
5'
60°1
5'
60°3
0'
60°3
0'
60°4
5'
60°4
5'
61°0
0'
61°0
0'
137°30'
137°30'
137°00'
137°00'
136°30'
136°30'
136°00'
136°00'
DIGITAL DATA SOURCES AND DISCLAIMERS
Digital Chart of the W orld (DCW) compiled by the U.S. Defense Mapping Agencyat 1:1,000,000.
Protected Areascompiled by Yukon Environmentagainst 1:1,000,000 DCW.
Map Compiled April 2008 By:Environment, Whitehorse, YT
Map 4Stratification Survey Results in the
Alsek Moose Survey Area- from Past Surveys -
2008 Alsek Survey Area
Scale 1:700,000
5 0 5 10 15 Kilometers
Albers Equal Area project ion (standard parall el s: 61°40'N & 68°00'N)
Expected Number of Moose per Block
High (High Stratum)
Low (Low Stratum)
Figure 4. Map 4 Stratification Survey Results in the Alsek Moose Survey Area.
Alsek Early-winter Moose Survey - November 2008 11
Coverage
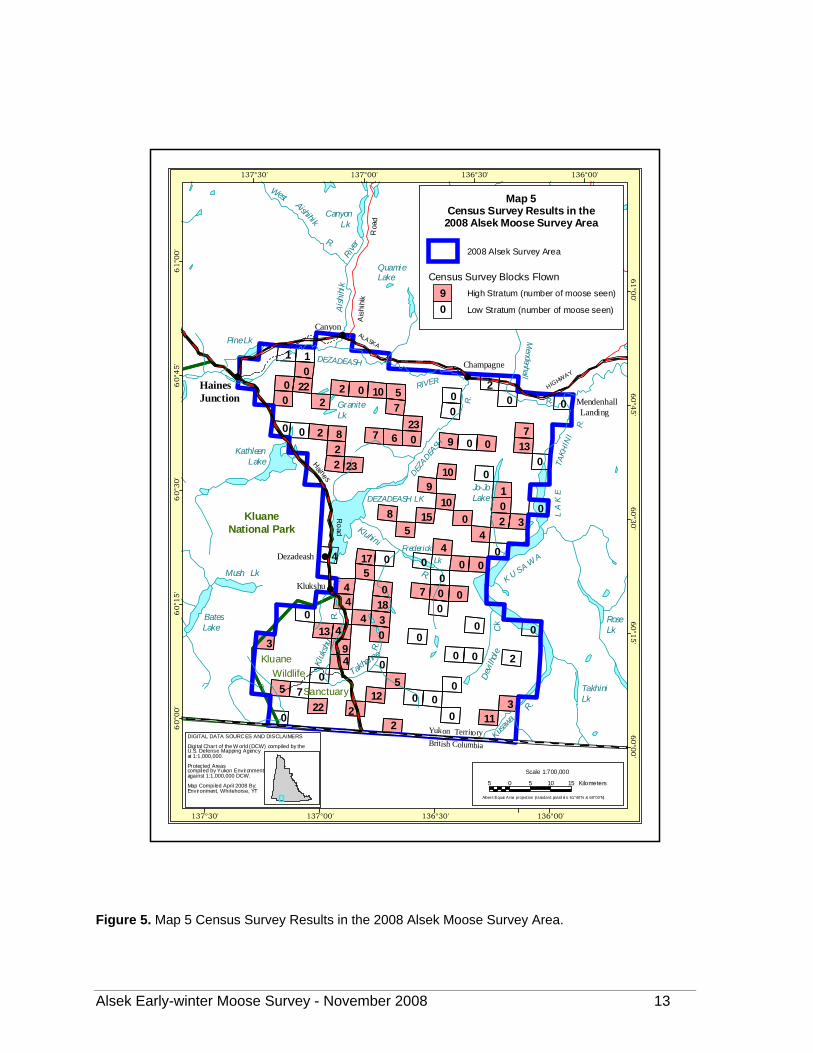
We counted moose in 97 of the 321 blocks, or about 30% of the total area (see Map 5). Our original intention was to count about 70 blocks, so we randomly selected 43 blocks from the High stratum, and 27 from the Low stratum. After completing the majority of the 70 blocks, however, the precision of our population estimate was still fairly poor, so we selected another 20 Highs and 7 Low-stratum blocks to get a more precise estimate.
It took about 37.6 hours to count moose in these blocks, for a total search intensity of about 1.37 minutes per km². Survey intensity was lower in the low-abundance blocks (1.18 minutes per km²) than in the high-abundance blocks (1.47 minutes per km²). Overall search intensity was somewhat lower than normal for population surveys (2 minutes per km²), but the relatively large proportion of non-habitable terrain in the study area required less coverage and lower search time overall. We used an additional 5.2 hours to recount survey blocks to calculate our sightability correction factor. Another 21.8 hours of helicopter time was used in ferrying between survey blocks; to remote fuel caches near the Dezadeash and Champagne communities; and back and forth to Haines Junction. Total flight time (survey and ferry time combined) was 64.6 hours. Survey costs are summarised in Appendix 1.
Alsek Early-winter Moose Survey - November 2008 12
##
#
Takhanne
Aishihik
R.
Canyon Lk
Hutshi
Lakes
Sceptre Lake
DEZ
AD
EASH
R.
Kluhini
DEZADEASH
RIVER
R.
R.
DEZADEASH LK
Frederick
Moraine
Lk
Ai s
h ihi
kRiv
er
TA
KH
I NI
Pine Lk
TayeLake
K U S A W
AL
A K
E
GraniteLk
QuamieLake
HarrisonLake
KathleenLake
Mush Lk
HIGHWAY
Lake
Ck
Kusaw
a
R.
TakhiniLk
RoseLk
ALASKA
Dev
i lhol
e
Yukon TerritoryBritish Columbia
HainesJunction
Kluane
Wildlife
KluaneNational Park
Ais
h ihi
k
Roa
d
Jo-JoLake
Ro
ad
Haines
Klu
kshu
R.
R.
Dezadeash
Sanctuary
Champagne
Klukshu
Mendenhall
Canyon
Mendenhall Landing
R.
BatesLake
#
#
West
02
2 0
70 0
5
3
00 5
4 00
3 90 2
00440
0 03
40
7 00045 0
00 0044 0
453208 00
9 1
02 02
720
08 6 0 9
00
7
207
0 0005020 20
1 1
1122
12
13
18
17
1510
2310
13
23
1022
60°0
0'
60°0
0'
60°1
5'
60°1
5'
60°3
0'
60°3
0'
60°4
5'
60°4
5'
61°0
0'
61°0
0'
137°30'
137°30'
137°00'
137°00'
136°30'
136°30'
136°00'
136°00'
DIGITAL DATA SOURCES AND DISCLAIMERS
Digital Chart of the W orld (DCW) compiled by the U.S. Defense Mapping Agencyat 1:1,000,000.
Protected Areascompiled by Yukon Environmentagainst 1:1,000,000 DCW.
Map Compiled April 2008 By:Environment, Whitehorse, YT
Map 5Census Survey Results in the
2008 Alsek Moose Survey Area
2008 Alsek Survey Area
Census Survey Blocks Flown
High Stratum (number of moose seen)
Low Stratum (number of moose seen)
Scale 1:700,000
5 0 5 10 15 Kilometers
Albers Equal Area project ion (standard parall el s: 61°40'N & 68°00'N)
9
0
Figure 5. Map 5 Census Survey Results in the 2008 Alsek Moose Survey Area.
Alsek Early-winter Moose Survey - November 2008 13
Alsek Early-winter Moose Survey - November 2008 14
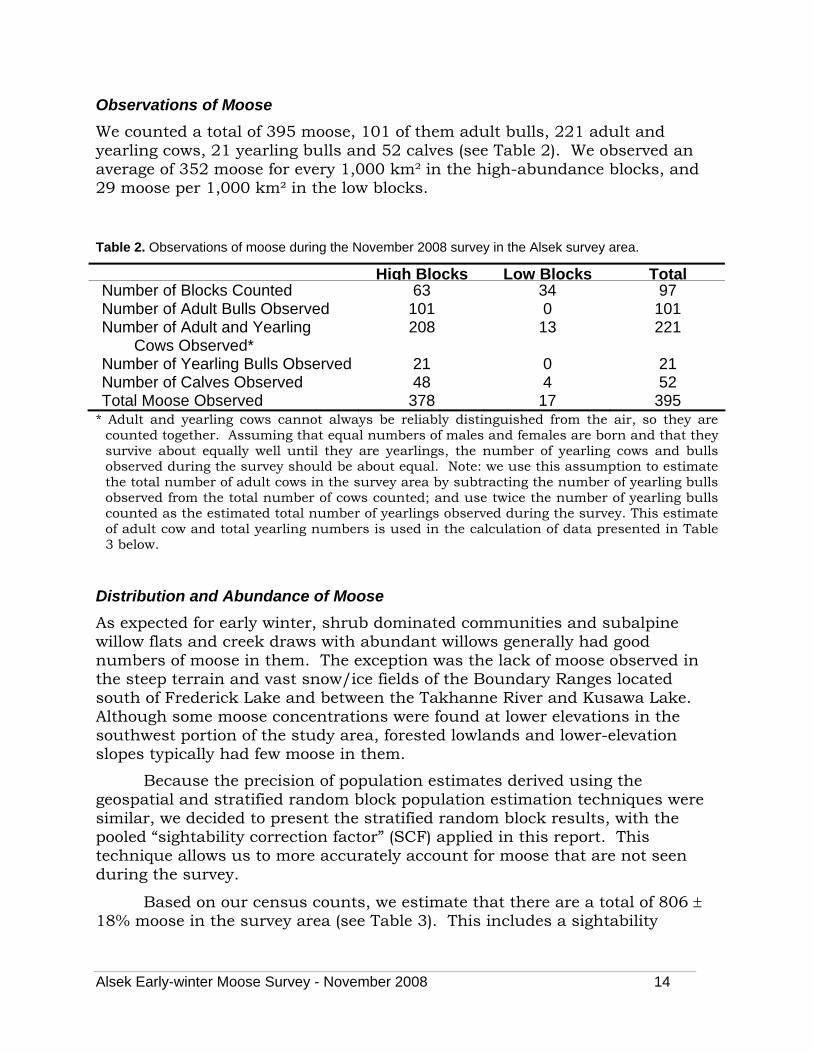
Observations of Moose
We counted a total of 395 moose, 101 of them adult bulls, 221 adult and yearling cows, 21 yearling bulls and 52 calves (see Table 2). We observed an average of 352 moose for every 1,000 km² in the high-abundance blocks, and 29 moose per 1,000 km² in the low blocks.
Table 2. Observations of moose during the November 2008 survey in the Alsek survey area.
High Blocks Low Blocks TotalNumber of Blocks Counted 63 34 97 Number of Adult Bulls Observed 101 0 101 Number of Adult and Yearling
Cows Observed* 208 13 221
Number of Yearling Bulls Observed 21 0 21 Number of Calves Observed 48 4 52 Total Moose Observed 378 17 395
* Adult and yearling cows cannot always be reliably distinguished from the air, so they are counted together. Assuming that equal numbers of males and females are born and that they survive about equally well until they are yearlings, the number of yearling cows and bulls observed during the survey should be about equal. Note: we use this assumption to estimate the total number of adult cows in the survey area by subtracting the number of yearling bulls observed from the total number of cows counted; and use twice the number of yearling bulls counted as the estimated total number of yearlings observed during the survey. This estimate of adult cow and total yearling numbers is used in the calculation of data presented in Table 3 below.
Distribution and Abundance of Moose
As expected for early winter, shrub dominated communities and subalpine willow flats and creek draws with abundant willows generally had good numbers of moose in them. The exception was the lack of moose observed in the steep terrain and vast snow/ice fields of the Boundary Ranges located south of Frederick Lake and between the Takhanne River and Kusawa Lake. Although some moose concentrations were found at lower elevations in the southwest portion of the study area, forested lowlands and lower-elevation slopes typically had few moose in them.
Because the precision of population estimates derived using the geospatial and stratified random block population estimation techniques were similar, we decided to present the stratified random block results, with the pooled “sightability correction factor” (SCF) applied in this report. This technique allows us to more accurately account for moose that are not seen during the survey.
Based on our census counts, we estimate that there are a total of 806 18% moose in the survey area (see Table 3). This includes a sightability
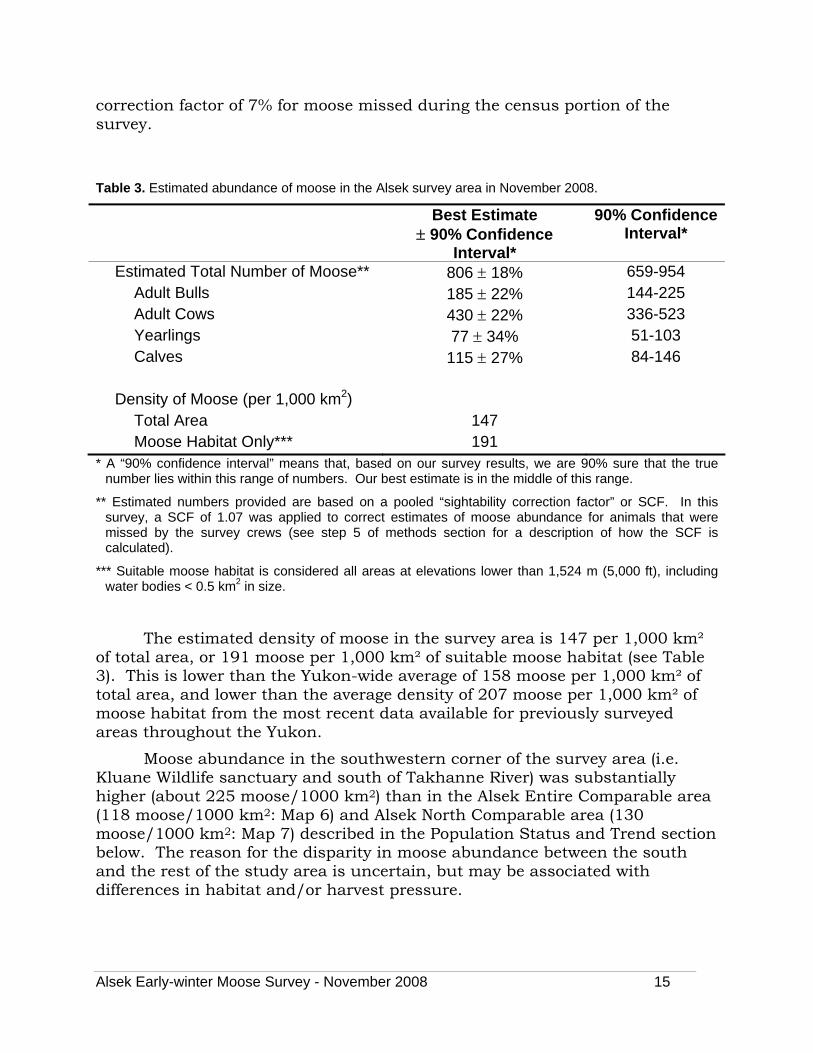
correction factor of 7% for moose missed during the census portion of the survey.
Table 3. Estimated abundance of moose in the Alsek survey area in November 2008.
Best Estimate 90% Confidence
Interval*
90% Confidence Interval*
Estimated Total Number of Moose** 806 18% 659-954 Adult Bulls 185 22% 144-225 Adult Cows 430 22% 336-523 Yearlings 77 34% 51-103 Calves 115 27% 84-146
Density of Moose (per 1,000 km2)
Total Area 147 Moose Habitat Only*** 191
* A “90% confidence interval” means that, based on our survey results, we are 90% sure that the true number lies within this range of numbers. Our best estimate is in the middle of this range.
** Estimated numbers provided are based on a pooled “sightability correction factor” or SCF. In this survey, a SCF of 1.07 was applied to correct estimates of moose abundance for animals that were missed by the survey crews (see step 5 of methods section for a description of how the SCF is calculated).
*** Suitable moose habitat is considered all areas at elevations lower than 1,524 m (5,000 ft), including water bodies < 0.5 km2 in size.
The estimated density of moose in the survey area is 147 per 1,000 km² of total area, or 191 moose per 1,000 km² of suitable moose habitat (see Table 3). This is lower than the Yukon-wide average of 158 moose per 1,000 km² of total area, and lower than the average density of 207 moose per 1,000 km² of moose habitat from the most recent data available for previously surveyed areas throughout the Yukon.
Moose abundance in the southwestern corner of the survey area (i.e. Kluane Wildlife sanctuary and south of Takhanne River) was substantially higher (about 225 moose/1000 km2) than in the Alsek Entire Comparable area (118 moose/1000 km2: Map 6) and Alsek North Comparable area (130 moose/1000 km2: Map 7) described in the Population Status and Trend section below. The reason for the disparity in moose abundance between the south and the rest of the study area is uncertain, but may be associated with differences in habitat and/or harvest pressure.
Alsek Early-winter Moose Survey - November 2008 15
Ages and Sexes of Moose
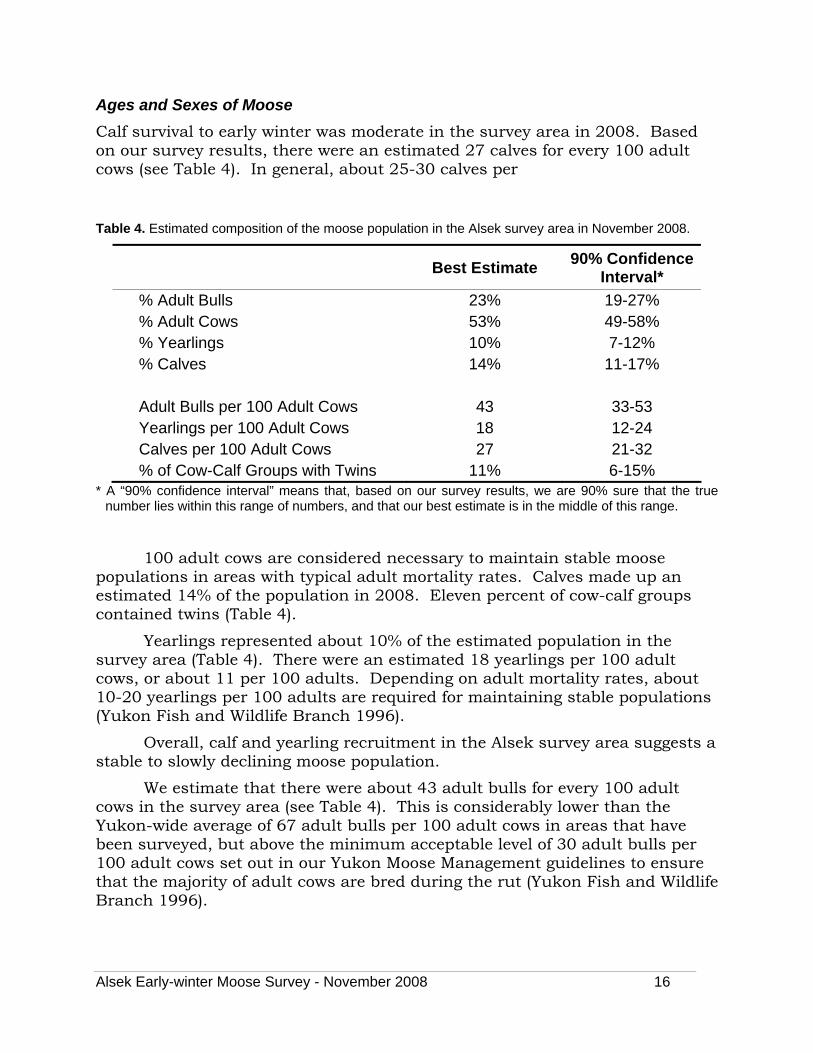
Calf survival to early winter was moderate in the survey area in 2008. Based on our survey results, there were an estimated 27 calves for every 100 adult cows (see Table 4). In general, about 25-30 calves per
Table 4. Estimated composition of the moose population in the Alsek survey area in November 2008.
Best Estimate 90% Confidence
Interval*
% Adult Bulls 23% 19-27% % Adult Cows 53% 49-58% % Yearlings 10% 7-12% % Calves 14% 11-17% Adult Bulls per 100 Adult Cows 43 33-53 Yearlings per 100 Adult Cows 18 12-24 Calves per 100 Adult Cows 27 21-32 % of Cow-Calf Groups with Twins 11% 6-15%
* A “90% confidence interval” means that, based on our survey results, we are 90% sure that the true number lies within this range of numbers, and that our best estimate is in the middle of this range.
100 adult cows are considered necessary to maintain stable moose populations in areas with typical adult mortality rates. Calves made up an estimated 14% of the population in 2008. Eleven percent of cow-calf groups contained twins (Table 4).
Yearlings represented about 10% of the estimated population in the survey area (Table 4). There were an estimated 18 yearlings per 100 adult cows, or about 11 per 100 adults. Depending on adult mortality rates, about 10-20 yearlings per 100 adults are required for maintaining stable populations (Yukon Fish and Wildlife Branch 1996).
Overall, calf and yearling recruitment in the Alsek survey area suggests a stable to slowly declining moose population.
We estimate that there were about 43 adult bulls for every 100 adult cows in the survey area (see Table 4). This is considerably lower than the Yukon-wide average of 67 adult bulls per 100 adult cows in areas that have been surveyed, but above the minimum acceptable level of 30 adult bulls per 100 adult cows set out in our Yukon Moose Management guidelines to ensure that the majority of adult cows are bred during the rut (Yukon Fish and Wildlife Branch 1996).
Alsek Early-winter Moose Survey - November 2008 16
Population Status and Trend: 1981 to 2008
Early-winter population surveys were flown in varying portions of the 2008 Alsek survey area in 1981 to 1984, 1990, 1996 to 1998, 2000 and 2004 (Map 2 and Map 3). In order to effectively assess population trends between 1981 and 2008, we focused our comparison of moose abundance to two areas that have been repeatedly surveyed over time. The Alsek Entire Comparable area (see Map 6) encompasses a large portion of the 2008 study area and was previously surveyed in 1981, 1982, and 1998. A smaller subset of the 2008 survey area, called the Alsek North Comparable area (see Map 7) was surveyed annually between1981 and 1984, in 1990, 1998, 2000 and 2008. Discussions of long term moose population trends and current status in these areas are presented in the following sections.
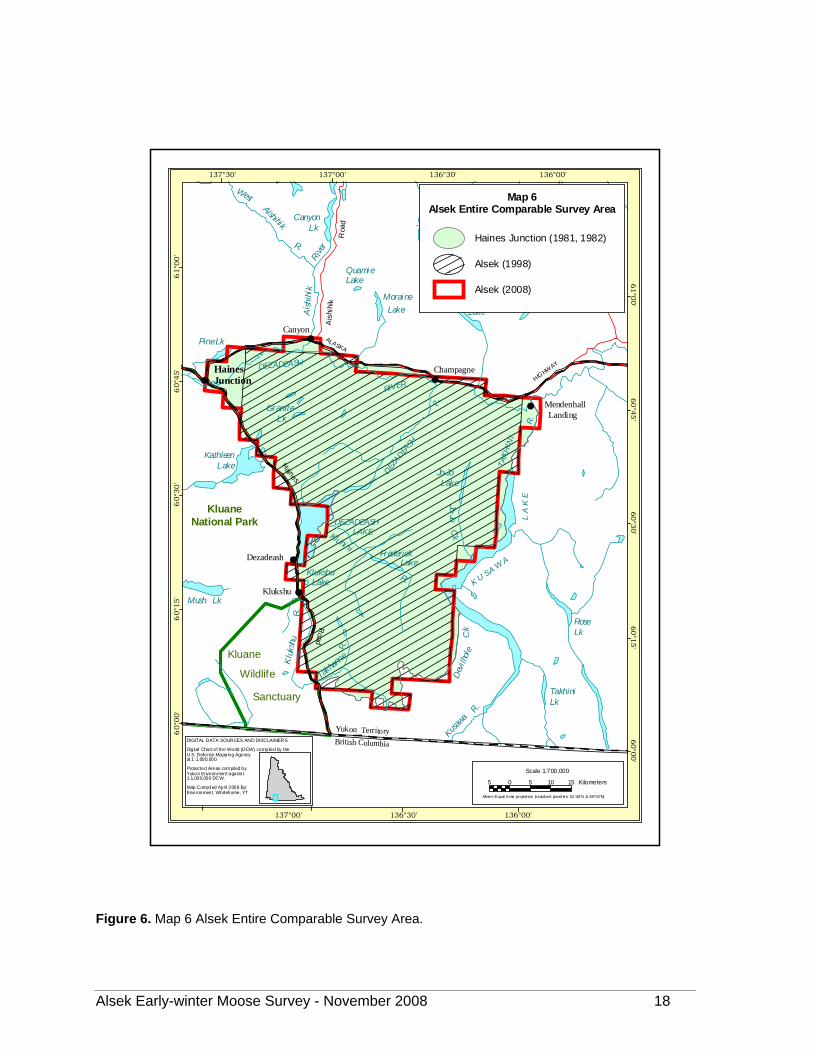
Alsek Entire Comparable Survey Area
The majority of the 2008 Alsek survey area (Map 6) was previously surveyed in early winter 1981, 1982 and 1998. Results spanning 28 years for this smaller comparable subset of the entire 2008 survey area are given in Table 5. The estimated population declined significantly between 1981 and 1982 (793 to 643 moose) due to poor calf and yearling recruitment and to a lesser extent, by high mortality of adult bulls (see results in Johnston and McLeod 1983). A study was initiated in 1983 to determine the factors limiting moose population growth in southwestern Yukon. The results of the study found that predation by grizzly bears and wolves were the major cause of calf and adult mortality in this region (Larsen et al. 1989). In response to the decline, a wolf control program and harvest restrictions were implemented in the mid 1980s. Moose numbers appeared to increase between 1982 and 1998 (P>0.1, 2 tailed t Test) to a peak of 841 moose. This was followed by a sharp decline in moose abundance between 1998 and 2008 (significant decline from 841 to 472 moose; P<0.005; 2 tailed t Test; Table 5). This represents a 44% decrease in abundance and a drop in average density from 221 moose per 1000 km2 observed in 1998, to 118 moose per 1000 km2 in 2008 over the total area (Table 5).
The proportion of adult bulls in the population in 1981 and 1982 (35 and 32 adult bulls per 100 adult cows respectively) was very low and near to the minimum 30 adult bulls per 100 adult cows needed to ensure successful reproduction (Table 5). The adult bull ratio increased to above the Yukon average in 1998 (72 adult bulls per 100 adult cows), but dropped to 53 adult bulls/100 adult cows by 2008. This is a lower but sufficient ratio to ensure that all cows are bred during the rut (Yukon Fish and Wildlife Branch 1996).
Alsek Early-winter Moose Survey - November 2008 17
##
#
#
#
#
Aishihik
R.
Canyon Lk
Hutshi
Lakes
Sceptre Lake
DEZ
AD
EASH
R.
Kluhini
DEZADEASH
RIVER
R.
R.
DEZADEASH LAKE
Frederick
Moraine
KlukshuLake
Lake
Ai s
h ihi
kRiv
er
TA
KH
I NI
Pine Lk
TayeLake
K U S A W
A
L A
K E
Granite Lk
QuamieLake
HarrisonLake
KathleenLake
Mush Lk
HIGHW
AY
Lake
Ck
Kusaw
a
R.
TakhiniLk
RoseLk
ALASKA
Dev
i lhol
e
Yukon TerritoryBritish Columbia
Kluane
Wildlife
KluaneNational Park
Ais
h ihi
k
Roa
d
Jo-Jo Lake
Road
Haines
Kl u
ksh u
R.
R.
Takha
nne
Dezadeash
Sanctuary
Champagne
Klukshu
Canyon
Mendenhall Landing
Jo-JoC
k
West
HainesJunction
60°0
0'
60°0
0'
60°1
5'
60°1
5'
60°3
0'
60°3
0'
60°4
5'
60°4
5'
61°0
0'
61°0
0'
137°30'
137°00'
137°00'
136°30'
136°30'
136°00'
136°00'
Scale 1:700,000
5 0 5 10 15 Kilometers
Albers Equal Area project ion (standard parall el s: 61°40'N & 68°00'N)
DIGITAL DATA SOURCES AND DISCLAIMERS
Digital Chart of the World (DCW) compiled by the U.S. Defense Mapping Agencyat 1:1,000,000.
Protected Areas compiled byYukon Environment agains t1:1,000,000 DCW.
Map Compiled April 2008 By:Environment, Whitehorse, YT
Alsek (1998)
Haines Junction (1981, 1982)
Alsek (2008)
Map 6Alsek Entire Comparable Survey Area
Figure 6. Map 6 Alsek Entire Comparable Survey Area.
Alsek Early-winter Moose Survey - November 2008 18
##
#
#
#
#
Aishihik
R.
Canyon Lk
Hutshi
Lakes
Sceptre Lake
DEZAD
EASH
R.
Kluhini
DEZADEASH
RIVER
R.
R.
DEZADEASH LAKE
Frederick
Moraine
KlukshuLake
Lake
Ai s
h ihi
kRiv
er
TA
KHI N
I
Pine Lk
TayeLake
K U S A W
AL
A K
E
Granite Lk
QuamieLake
Harr isonLake
KathleenLake
Mush Lk
HIGHW
AY
Lake
Ck
Kusaw
a
R.
TakhiniLk
RoseLk
ALASKA
Dev
i lhol
e
Yukon TerritoryBritish Columbia
Kluane
Wildlife
KluaneNational Park
Ais
h ihi
k
Roa
d
Jo-Jo Lake
Road
Haines
Klu
ksh u
R.
R.
Takha
nne
Dezadeash
Sanctuary
Champagne
Klukshu
Canyon
Mendenhall Landing
Jo-JoC
k
BatesLake
West
HainesJunction
60°0
0'
60°0
0'
60°1
5'
60°1
5'
60°3
0'
60°3
0'
60°4
5'
60°4
5'
61°0
0'
61°0
0'
137°30'
137°30'
137°00'
137°00'
136°30'
136°30'
136°00'
136°00'
DIGITAL DATA SOURCES AND DISCLAIMERS
Digital Chart of the World (DCW) compiled by the U.S. Defense Mapping Agencyat 1:1,000,000.
Protected Areas compiled byYukon Environment agains t1:1,000,000 DCW.
Map Compiled April 2008 By:Environment, Whitehorse, YT
Scale 1:700,000
5 0 5 10 15 Kilometers
Albers Equal Area project ion (standard parall el s: 61°40'N & 68°00'N)
Alsek (1998)
Map 7Alsek North Comparable Survey Area
Haines Junction (1981-84, 1990)
Alsek (2000, 2008)
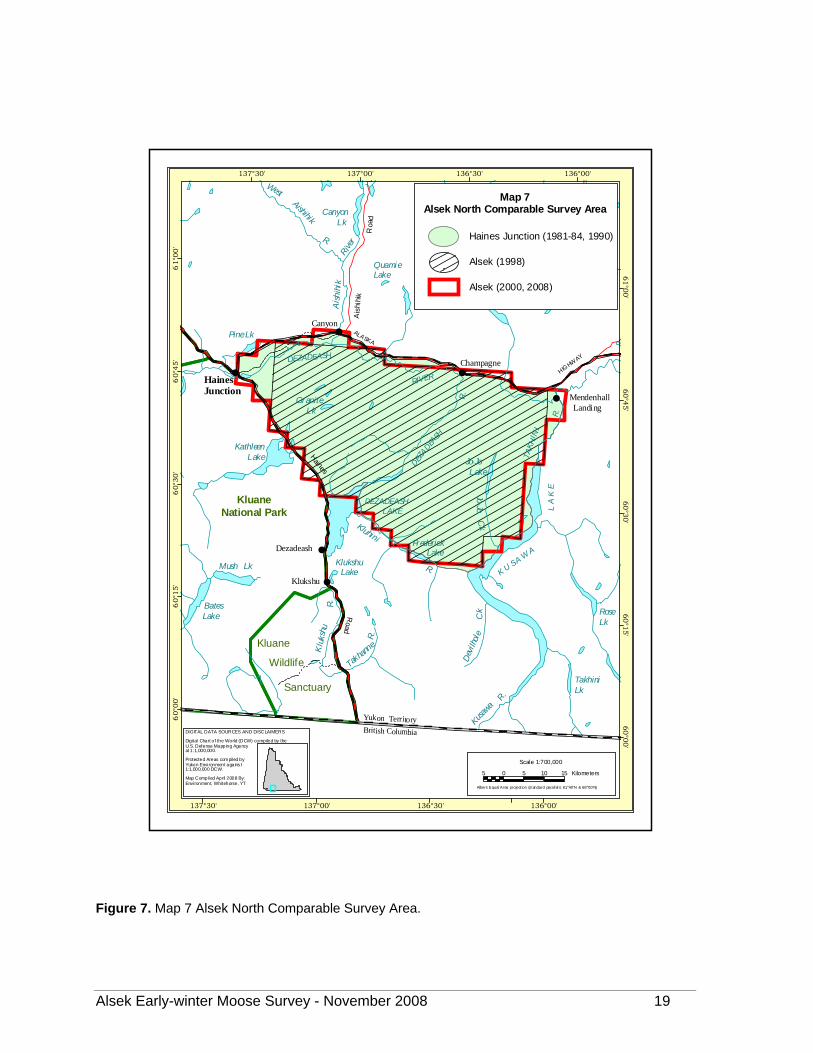
Figure 7. Map 7 Alsek North Comparable Survey Area.
Alsek Early-winter Moose Survey - November 2008 19
Entire Comparison Area
Survey Year 1981 1982 1998 2008
Estimated Abundance1
(90% Confidence Range)2
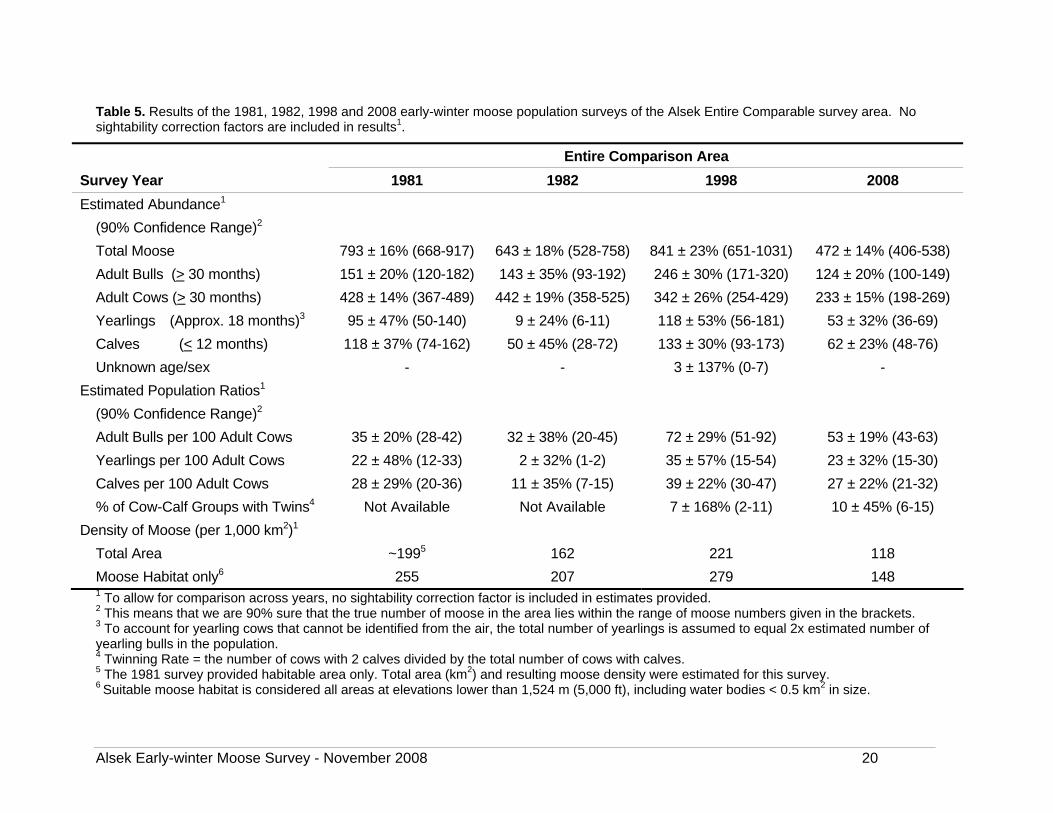
Total Moose 793 ± 16% (668-917) 643 ± 18% (528-758) 841 ± 23% (651-1031) 472 ± 14% (406-538)
Adult Bulls (> 30 months) 151 ± 20% (120-182) 143 ± 35% (93-192) 246 ± 30% (171-320) 124 ± 20% (100-149)
Adult Cows (> 30 months) 428 ± 14% (367-489) 442 ± 19% (358-525) 342 ± 26% (254-429) 233 ± 15% (198-269)
Yearlings (Approx. 18 months)3 95 ± 47% (50-140) 9 ± 24% (6-11) 118 ± 53% (56-181) 53 ± 32% (36-69)
Calves (< 12 months) 118 ± 37% (74-162) 50 ± 45% (28-72) 133 ± 30% (93-173) 62 ± 23% (48-76)
Unknown age/sex - - 3 ± 137% (0-7) -
Estimated Population Ratios1
(90% Confidence Range)2
Adult Bulls per 100 Adult Cows 35 ± 20% (28-42) 32 ± 38% (20-45) 72 ± 29% (51-92) 53 ± 19% (43-63)
Yearlings per 100 Adult Cows 22 ± 48% (12-33) 2 ± 32% (1-2) 35 ± 57% (15-54) 23 ± 32% (15-30)
Calves per 100 Adult Cows 28 ± 29% (20-36) 11 ± 35% (7-15) 39 ± 22% (30-47) 27 ± 22% (21-32)
% of Cow-Calf Groups with Twins4 Not Available Not Available 7 ± 168% (2-11) 10 ± 45% (6-15)
Density of Moose (per 1,000 km2)1
Total Area ~1995 162 221 118
Moose Habitat only6 255 207 279 148
November 2008 20
Table 5.sightability correcti
Results of the 1981, 1982, 1998 and 2008 early-winter moose population surveys of the Alsek Entire Comparable survey area. No on factors are included in results1.
1
2
3
yearling b4
5
6
To allow for comparison across years, no sightability correction factor is included in estimates provided. This means that we are 90% sure that the true number of moose in the area lies within the range of moose numbers given in the brackets. To account for yearling cows that cannot be identified from the air, the total number of yearlings is assumed to equal 2x estimated number of
ulls in the population. Twinning Rate = the number of cows with 2 calves divided by the total number of cows with calves. The 1981 survey provided habitable area only. Total area (km2) and resulting moose density were estimated for this survey. Suitable moose habitat is considered all areas at elevations lower than 1,524 m (5,000 ft), including water bodies < 0.5 km2 in size.
Alsek Early-winter Moose Survey -
Alsek Early-winter Moose Survey - November 2008 21
As indicated above, the calf and yearling to adult cow ratio declined
ver the Alsek Entire Comparable survey area.
sharply between 1981 and 1982 (28 to 11 calves and 22 to 2 yearlings), but increased substantially in 1998 to more than the 25-30 calves and yearlings per 100 adult cows normally associated with stable to increasing moose populations (Table 5). Calf and yearling recruitment declined to a moderate level by 2008 (27 calves and 23 yearlings per 100 adult cows), similar to that observed in 1981. The estimated proportion of cows with calves that had twins, however, was slightly higher in 2008 (10%) than in 1998 (7%); and in conjunction with the current recruitment ratios suggests a stable population o
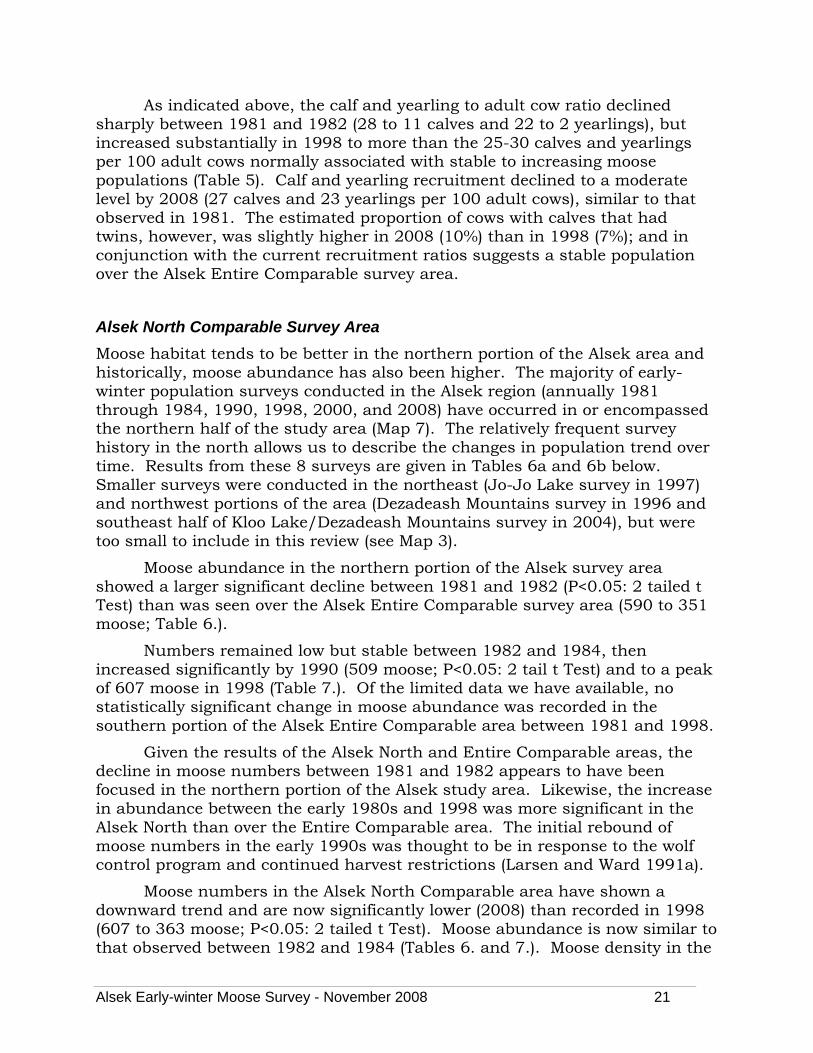
Alsek North Comparable Survey Area
Mhistorically, moose abundance has also been higher. Twinter population surveys conducted in the Alsek region (annually 1981 through 1984, 1990, 1998, 2000, and 2008) have occurred in or encompassed the northern half of the study area (Map 7). Thistory in the north allows us to describe the changes in population trend over time. Results from these 8 surveys are given in Tables 6a and 6b below. Smaller surveys were conducted in the northeast (Jo-Jo Lake survey in 1997) and northwest portions of the area (Dezadeash Mountains survey in 1996 and southeast half of Kloo Lake/Dezadeash Mountains survey in 2004), but were t
showed a larger significant decline between 1981 and 1982 (P<0.05: 2 tailed t Tm
increased significantly by 1990 (509 moose; P<0.05: 2 tail t Tof 607 moose in 1998 (Tstatistically significant change in moose abundance was recorded in the s
decline in moose numbers between 1981 and 1982 appears to have been focused in the northern portion of the Alsek study area. Likewise, the increase in abundance between the early 1980s and 1998 was more significant in the Alsek North than over the Entire Comparable area. Tmoose numbers in the early 1990s was thought to be in response to the wolf c
downward trend and are now significantly lower (2008) than recorded in 1998 (607 to 363 moose; P<0.05: 2 tailed t Tet
oose habitat tends to be better in the northern portion of the Alsek area and he majority of early-
he relatively frequent survey
oo small to include in this review (see Map 3).
Moose abundance in the northern portion of the Alsek survey area
est) than was seen over the Alsek Entire Comparable survey area (590 to 351 oose; Table 6.).
Numbers remained low but stable between 1982 and 1984, then est) and to a peak
able 7.). Of the limited data we have available, no
outhern portion of the Alsek Entire Comparable area between 1981 and 1998.
Given the results of the Alsek North and Entire Comparable areas, the
he initial rebound of
ontrol program and continued harvest restrictions (Larsen and Ward 1991a).
Moose numbers in the Alsek North Comparable area have shown a
st). Moose abundance is now similar to hat observed between 1982 and 1984 (Tables 6. and 7.). Moose density in the
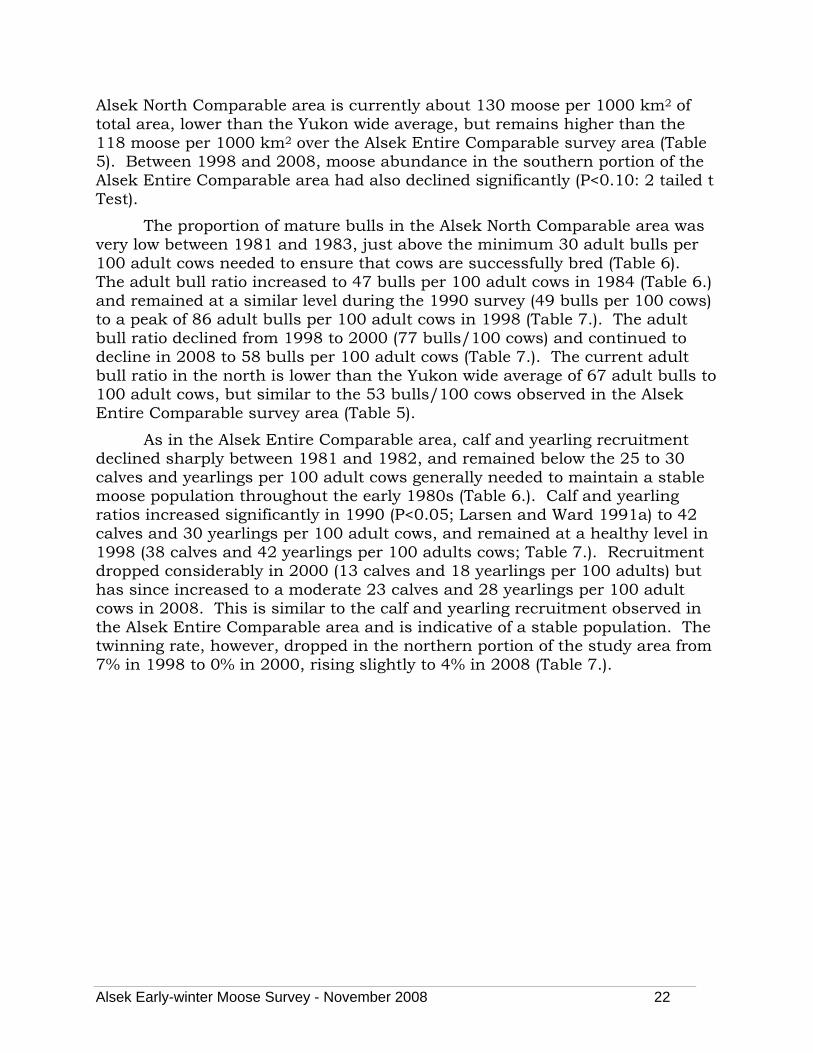
Alsek North Comparable area is currently about 130 moose per 1000 km2 of total area, lower than the Yukon wide average, but remains higher than the 118 moose per 1000 km2 over the Alsek Entire Comparable survey area (Table 5). Between 1998 and 2008, moose abundance in the southern portion of the Alsek Entire Comparable area had also declined significantly (P<0.10: 2 tailed t Test).
The proportion of mature bulls in the Alsek North Comparable area was very low between 1981 and 1983, just above the minimum 30 adult bulls per 100 adult cows needed to ensure that cows are successfully bred (Table 6). The adult bull ratio increased to 47 bulls per 100 adult cows in 1984 (Table 6.) and remained at a similar level during the 1990 survey (49 bulls per 100 cows) to a peak of 86 adult bulls per 100 adult cows in 1998 (Table 7.). The adult bull ratio declined from 1998 to 2000 (77 bulls/100 cows) and continued to decline in 2008 to 58 bulls per 100 adult cows (Table 7.). The current adult bull ratio in the north is lower than the Yukon wide average of 67 adult bulls to 100 adult cows, but similar to the 53 bulls/100 cows observed in the Alsek Entire Comparable survey area (Table 5).
As in the Alsek Entire Comparable area, calf and yearling recruitment declined sharply between 1981 and 1982, and remained below the 25 to 30 calves and yearlings per 100 adult cows generally needed to maintain a stable moose population throughout the early 1980s (Table 6.). Calf and yearling ratios increased significantly in 1990 (P<0.05; Larsen and Ward 1991a) to 42 calves and 30 yearlings per 100 adult cows, and remained at a healthy level in 1998 (38 calves and 42 yearlings per 100 adults cows; Table 7.). Recruitment dropped considerably in 2000 (13 calves and 18 yearlings per 100 adults) but has since increased to a moderate 23 calves and 28 yearlings per 100 adult cows in 2008. This is similar to the calf and yearling recruitment observed in the Alsek Entire Comparable area and is indicative of a stable population. The twinning rate, however, dropped in the northern portion of the study area from 7% in 1998 to 0% in 2000, rising slightly to 4% in 2008 (Table 7.).
Alsek Early-winter Moose Survey - November 2008 22
Alsek Early-winter Moose Survey - November 2008 23
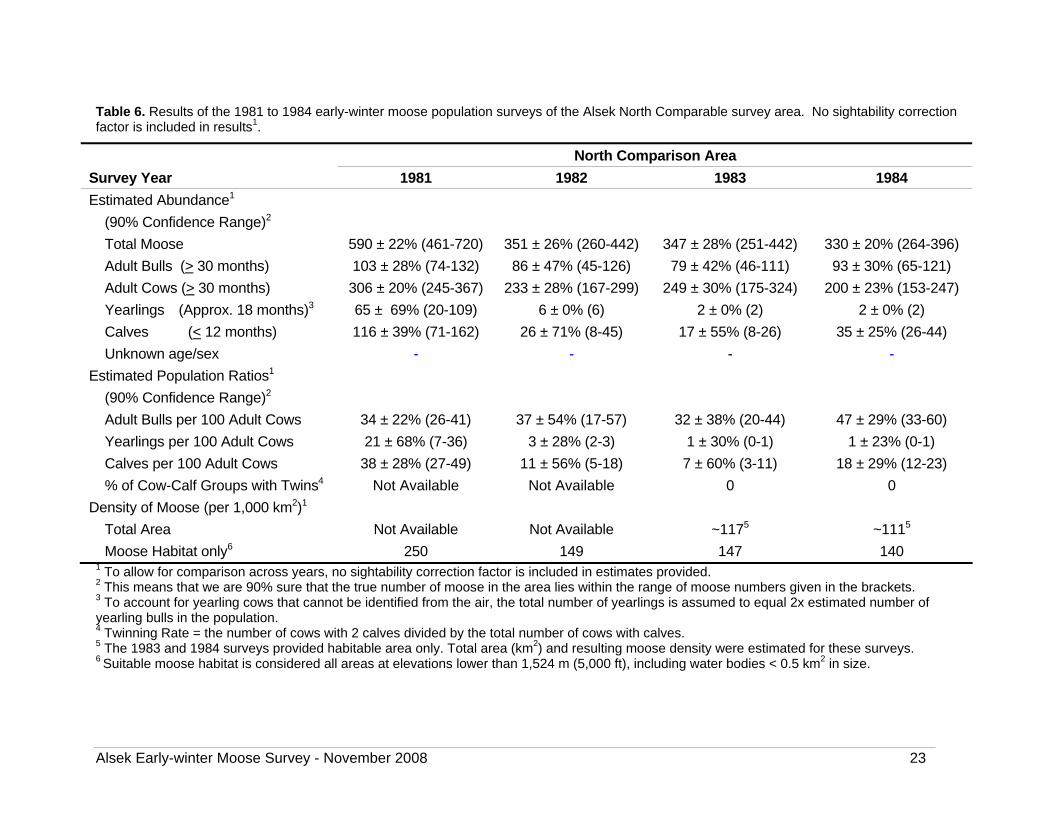
Table 6. Results of the 1981 to 1984 early-winter moose population surveys of the Alsek North Comparable survey area. No sightability correction factor is included in results1.
North Comparison Area
Survey Year 1981 1982 1983 1984
Estimated Abundance1
(90% Confidence Range)2
Total Moose 590 ± 22% (461-720) 351 ± 26% (260-442) 347 ± 28% (251-442) 330 ± 20% (264-396)
Adult Bulls (> 30 months) 103 ± 28% (74-132) 86 ± 47% (45-126) 79 ± 42% (46-111) 93 ± 30% (65-121)
Adult Cows (> 30 months) 306 ± 20% (245-367) 233 ± 28% (167-299) 249 ± 30% (175-324) 200 ± 23% (153-247)
Yearlings (Approx. 18 months)3 65 ± 69% (20-109) 6 ± 0% (6) 2 ± 0% (2) 2 ± 0% (2)
Calves (< 12 months) 116 ± 39% (71-162) 26 ± 71% (8-45) 17 ± 55% (8-26) 35 ± 25% (26-44)
Unknown age/sex - - - -
Estimated Population Ratios1
(90% Confidence Range)2
Adult Bulls per 100 Adult Cows 34 ± 22% (26-41) 37 ± 54% (17-57) 32 ± 38% (20-44) 47 ± 29% (33-60)
Yearlings per 100 Adult Cows 21 ± 68% (7-36) 3 ± 28% (2-3) 1 ± 30% (0-1) 1 ± 23% (0-1)
Calves per 100 Adult Cows 38 ± 28% (27-49) 11 ± 56% (5-18) 7 ± 60% (3-11) 18 ± 29% (12-23)
% of Cow-Calf Groups with Twins4 Not Available Not Available 0 0
Density of Moose (per 1,000 km2)1
Total Area Not Available Not Available ~1175 ~1115
Moose Habitat only6 250 149 147 140 1 To allow for comparison across years, no sightability correction factor is included in estimates provided. 2 This means that we are 90% sure that the true number of moose in the area lies within the range of moose numbers given in the brackets. 3 To account for yearling cows that cannot be identified from the air, the total number of yearlings is assumed to equal 2x estimated number of yearling bulls in the population. 4 Twinning Rate = the number of cows with 2 calves divided by the total number of cows with calves. 5 The 1983 and 1984 surveys provided habitable area only. Total area (km2) and resulting moose density were estimated for these surveys. 6 Suitable moose habitat is considered all areas at elevations lower than 1,524 m (5,000 ft), including water bodies < 0.5 km2 in size.
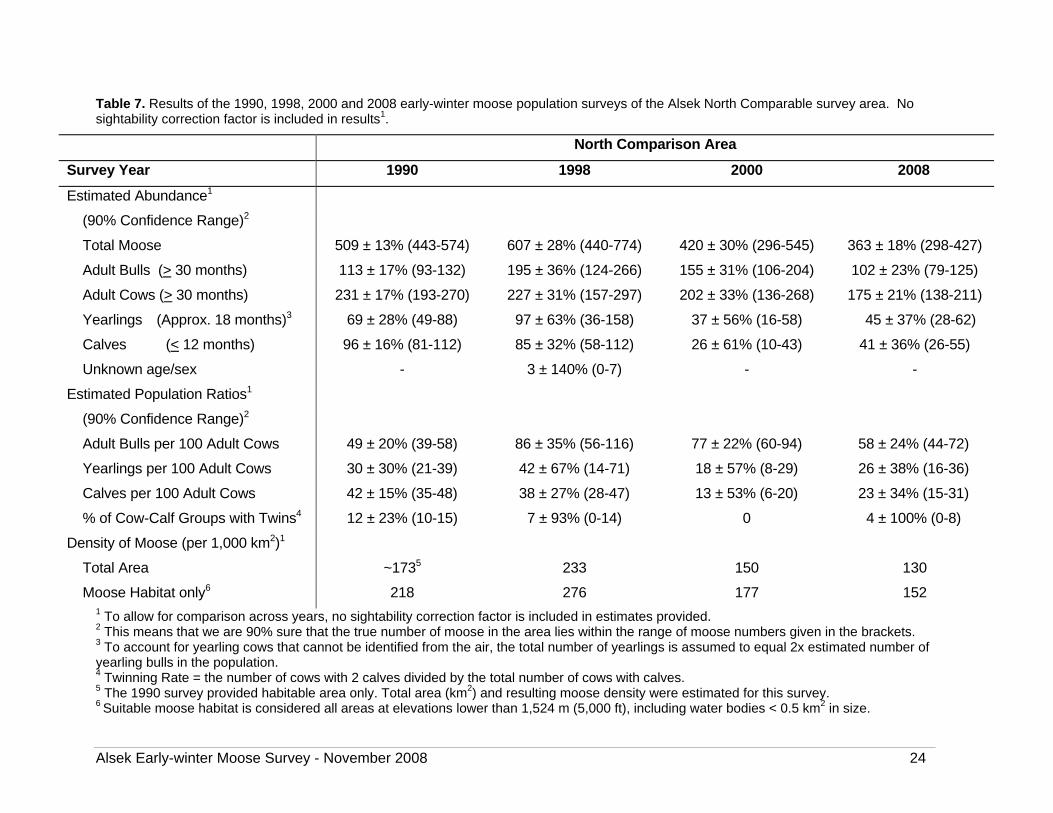
Table 7. Results of the 1990, 1998, 2000 and 2008 early-winter moose population surveys of the Alsek North Comparable survey area. No sightability correction factor is included in results1.
North Comparison Area
Survey Year 1990 1998 2000 2008
Estimated Abundance1
(90% Confidence Range)2
Total Moose 509 ± 13% (443-574) 607 ± 28% (440-774) 420 ± 30% (296-545) 363 ± 18% (298-427)
Adult Bulls (> 30 months) 113 ± 17% (93-132) 195 ± 36% (124-266) 155 ± 31% (106-204) 102 ± 23% (79-125)
Adult Cows (> 30 months) 231 ± 17% (193-270) 227 ± 31% (157-297) 202 ± 33% (136-268) 175 ± 21% (138-211)
Yearlings (Approx. 18 months)3 69 ± 28% (49-88) 97 ± 63% (36-158) 37 ± 56% (16-58) 45 ± 37% (28-62)
Calves (< 12 months) 96 ± 16% (81-112) 85 ± 32% (58-112) 26 ± 61% (10-43) 41 ± 36% (26-55)
Unknown age/sex - 3 ± 140% (0-7) - -
Estimated Population Ratios1
(90% Confidence Range)2
Adult Bulls per 100 Adult Cows 49 ± 20% (39-58) 86 ± 35% (56-116) 77 ± 22% (60-94) 58 ± 24% (44-72)
Yearlings per 100 Adult Cows 30 ± 30% (21-39) 42 ± 67% (14-71) 18 ± 57% (8-29) 26 ± 38% (16-36)
Calves per 100 Adult Cows 42 ± 15% (35-48) 38 ± 27% (28-47) 13 ± 53% (6-20) 23 ± 34% (15-31)
% of Cow-Calf Groups with Twins4 12 ± 23% (10-15) 7 ± 93% (0-14) 0 4 ± 100% (0-8)
Density of Moose (per 1,000 km2)1
Total Area ~1735 233 150 130
Moose Habitat only6 218 276 177 152 1 To allow for comparison across years, no sightability correction factor is included in estimates provided. 2 This means that we are 90% sure that the true number of moose in the area lies within the range of moose numbers given in the brackets. 3 To account for yearling cows that cannot be identified from the air, the total number of yearlings is assumed to equal 2x estimated number of yearling bulls in the population. 4 Twinning Rate = the number of cows with 2 calves divided by the total number of cows with calves. 5 The 1990 survey provided habitable area only. Total area (km2) and resulting moose density were estimated for this survey. 6 Suitable moose habitat is considered all areas at elevations lower than 1,524 m (5,000 ft), including water bodies < 0.5 km2 in size.
Alsek Early-winter Moose Survey - November 2008 24
Alsek Early-winter Moose Survey - November 2008 25
Discussion of Population Trend in Alsek Entire and Alsek North Comparable survey areas: 1998 to 2008
Moose abundance declined significantly in both the Alsek Entire and Alsek North Comparable areas between 1998 and 2008, and currently appears to be at or near historic recorded lows throughout the Alsek study area. The current population decline may be the result of a combination of higher hunting pressure, particularly on bulls, and a decline in calf and yearling recruitment.
The estimated proportion of adult bulls to adult cows in the Alsek North and Alsek Entire Comparable areas decreased significantly from 1998 to 2008 (Table 5 and 7). The 2008 adult bull ratio for both areas (58 and 53 adult bulls per 100 adult cows in the Alsek North and Entire Comparable areas respectively) are lower than the Yukon-wide average, but above the minimum level considered sufficient to ensure that all cows are bred during the rut. Although the overall low bull ratio estimated in 2008 is not of immediate concern, it does highlight the need for ongoing monitoring.
Low bull numbers can be an indicator of a declining and/or heavily hunted moose population. One possible explanation is high harvest levels related to access. The Alaska Highway and the Haines Road provide easy year-round access to moose. In 1981 a mining road was built into the Dezadeash Range to access Granite Creek. This road provides access to important subalpine moose aggregation areas and was heavily hunted before restrictions were implemented. Other access routes for hunting in the Alsek survey area include the original Alaska Highway near Haines Junction; Quill Creek exploration trails and roads; Dezadeash Lake to Six Mile River and Red Squirrel Creek trail; Frederick Lake trails; and the Gopher Mountain trail south of Dezadeash. The Dalton Post road in the southwest portion of the study area is also hunted. These roads provide relatively easy access to important seasonal habitats and aggregation areas throughout the Alsek survey area.
Calf and yearling recruitment has also declined in the Alsek survey area since 1998 (Table 5 and 7). A sharp drop in recruitment ratios were noted during the 2000 survey in the Alsek North Comparable area (Table 7.). Calf and yearling ratios observed during early-winter trend surveys in the Dezadeash Range in the northwest corner of the survey area were also low to moderate in 2001 (19 calves and 28 yearlings per 100 adult cows; report not available, results data only) and 2003 (18 calves and 32 yearlings per 100 adult cows; LaRocque 2004), but increased to a relatively healthy level in 2005 (25 calves and 48 yearlings per 100 adult cows; LaRocque 2006). Recruitment has since decreased to a uniform low to moderate level throughout the study area. The proportion of cows with calves that had twins was about 7% in the Alsek North and Entire comparable areas in 1998, which increased over the Alsek Entire Comparable area (10%) but dropped in the North (4%) by 2008 (Table 5 and 7).
Lower overall recruitment rates could, in part, be a result of predation by increasing wolf or bear numbers since 1998. Information from Alsek Renewable Resource Council meetings (Lorne LaRocque personal communication) suggest there has been low trapping pressure on wolves and little hunting of bears; and many residents and Champagne and Aishihik First Nation members believe bear numbers have increased substantially in the area. Testing for wolf predation effects on calves in the Dezadeash Range during 2000 and 2001, however, seemed to show that weather and not wolf predation was the limiting factor during these two years (LaRocque 2005). Poor winters, starting with the very deep snow in early winter of 1999 and 2000 may have initiated a decline in recruitment. The following cold late springs of 2000, 2001 and 2002 may have kept calf and yearling numbers low, resulting in the lower recruitment level observed in 2008.
Access into moose aggregation areas in fall and winter with the resulting potential for increasing hunting pressure; combined with poor to modest recruitment and predation, are all likely contributing factors to low bull numbers and an overall declining moose population in the Alsek area.
Kluane National Park – 2008 Auriol Range moose survey
Kluane National Park (KNP) has flown moose surveys in the Auriol Range, northwest of the Alsek study area, since 1974. These annual trend surveys are done in November and focus on important post rut aggregation areas in KNP between Haines Junction and the Mush Lake Road.
In contrast to the significant decline in moose abundance observed in the Alsek survey area since 1998, moose abundance has continued to increase in the Auriol Range. In 2008, Kluane National Park recorded the highest total number of moose (301) seen on this survey (McKinnon draft report). Other population indicators from the 2008 Kluane National Park survey, however, are similar to the Alsek survey. Adult bull ratios were 48 per 100 adult cows, the calf ratio was 24 calves/100 adult cows and yearlings were at 18/100 adult cows.
Harvest
The Alsek region (Game Management Subzones 6-12 to 6-13, 7-01 to 7-12; see Map 1) was and remains an important moose hunting area for southwest Yukon hunters, and despite increased hunting restrictions remains so today. In 1979 over 80 moose were reported harvested in the area, and between 1979 and 1983 the average reported harvest was about 58 moose per year (see Figure 8). This represents 7% of the total estimated moose population in 1981 and 9% of the estimated 1982 moose population. These numbers do not include the harvest by First Nation members. Annual harvest rates in excess
Alsek Early-winter Moose Survey - November 2008 26
of 5% of the total estimated moose population have been shown to carry a high risk of initiating a population decline (Gasaway et al 1992).
Moose surveys and traditional and local knowledge both indicate that moose abundance declined significantly in the area in the late 1970s and early 1980s (Table 5 and 6). This decline was the impetus for a wolf control program during the mid 1980s (Larsen et al. 1989) and the imposition of hunting restrictions on resident and non-resident hunters beginning in 1984 (see Table 1).
In response to declining moose numbers and increased hunting restrictions, the reported harvest dropped to an average of about 15 moose per year between 1984 to 1988 and has remained low, ranging from 1 to 11 moose per year since 1989 (Figure 8).
Alsek Early-winter Moose Survey - November 2008 27
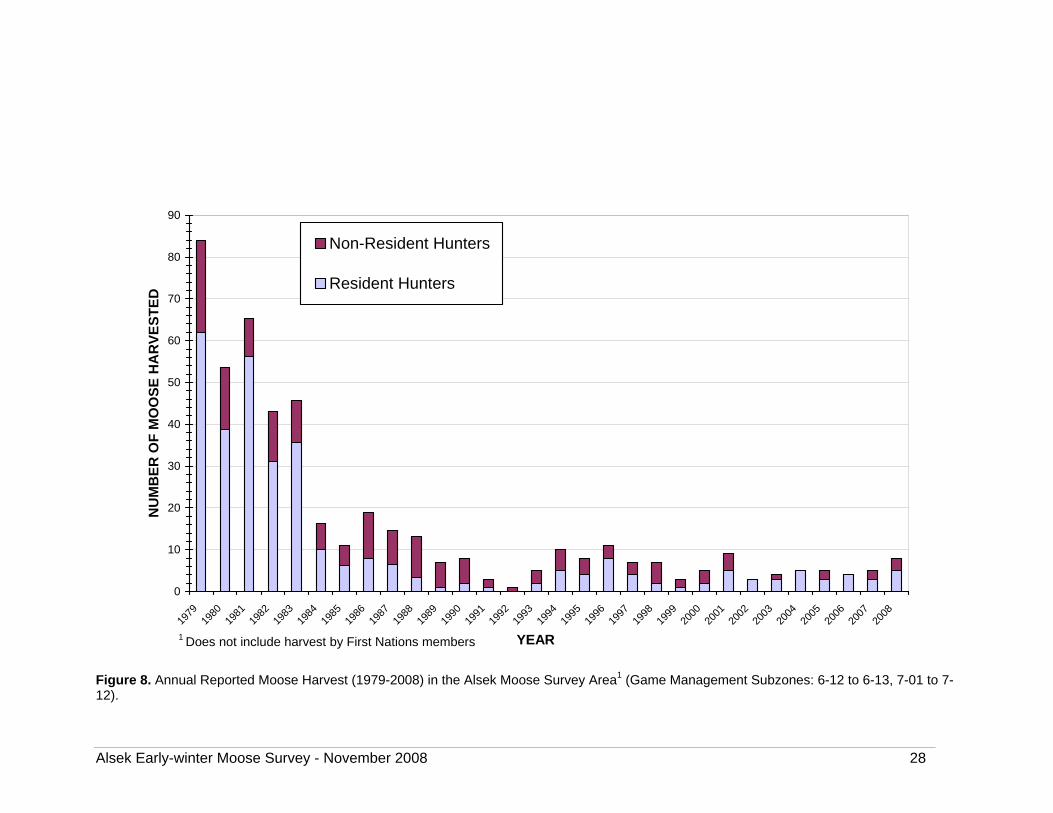
Figure 8. Annual Reported Moose Harvest (1979-2008) in the Alsek Moose Survey Area1 (Game Management Subzones: 6-12 to 6-13, 7-01 to 7-
Alsek Early-winter Moose Survey - November 2008 28
0
10
20
30
40
50
60
70
80
90
1979
1980
1981
1982
1983
1984
1985
1986
1987
1988
1989
1990
1991
1992
1993
1994
1995
1996
1997
1998
1999
2000
2001
2002
2003
2004
2005
2006
2007
2008
YEAR
NU
MB
ER
OF
MO
OS
E H
AR
VE
ST
ED
Non-Resident Hunters
Resident Hunters
1 Does not include harvest by First Nations members
12).
Alsek Early-winter Moose Survey - November 2008 29
Harvest by resident and non-resident (or outfitted) licensed hunters is
utfitters allows for the harvest of a maximum of 6 moose over three years.
restricted through a combination of a permit hunt authorization (PHA) system and outfitter quotas respectively. Nine PHAs are issued annually to resident non-First Nation hunters. The current outfitter quota agreement for Devil Hole O
Alsek study area by allocating permits to specific Moose Management Units (MMUs; see Map 8).the risk of over harvest in areas of easy access to moose. The distribution of ta
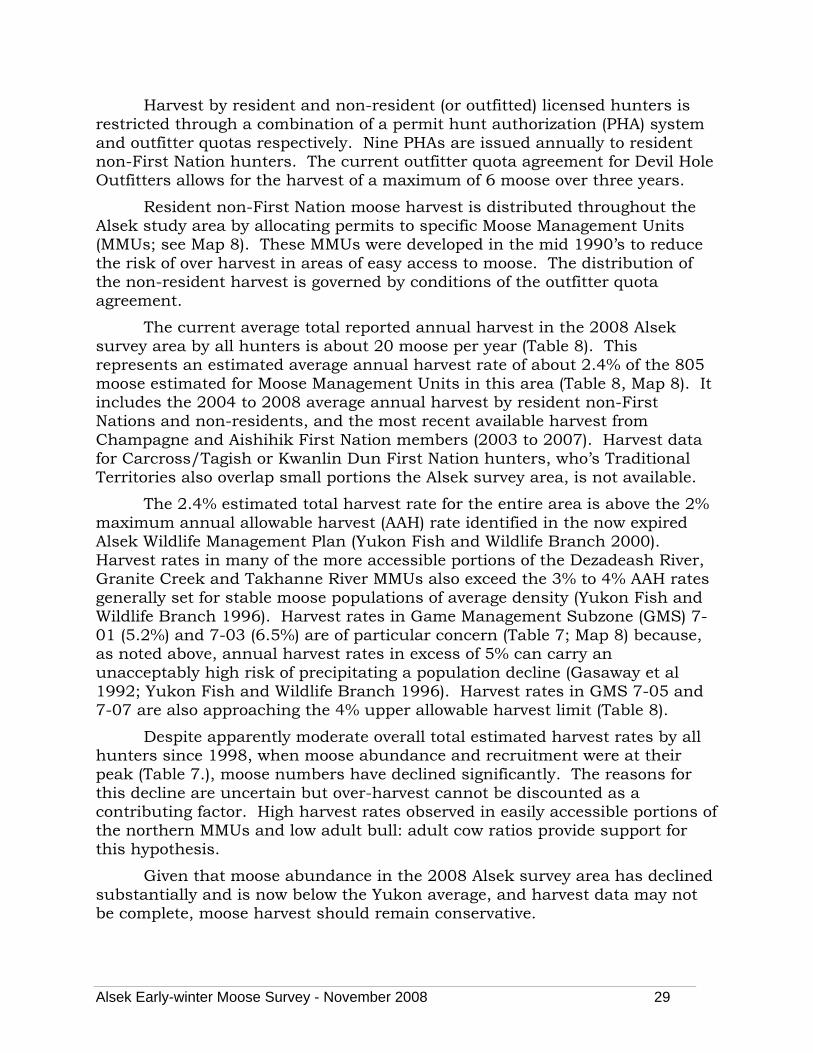
survey area by all hunters is about 20 moose per year (Table 8). Thirepresents an estimated average annual harvest rate of about 2.4% of the 805 moose estimated for Moose Management Units in this area (Tincludes the 2004 to 2008 average annual harvest by resident non-First Nations and non-residents, and the most recent available harvest from Champagne and Aishihik First Nation members (2003 to 2007). Harvest data for Carcross/Tagish or Kwanlin Dun First Nation hunters, who’s TraT
maximum annual allowable harvest (AAH) rate identified in the now expired Alsek Wildlife Management Plan (Yukon Fish and Wildlife Branch 2000). Harvest rates in many of the more accessible portions of the Dezadeash River, Granite Creek and Tgenerally set for stable moose populations of average density (Yukon Fish and Wildlife Branch 1996). Harvest rates in Game Management Subzone (GMS) 7-01 (5.2%) and 7-03 (6.5%) are of particular concern (Table 7; Map 8) because, as noted above, annual harvest rates in excess of 5% can carry an unacceptably high risk of precipitating a population decline (Gasaway et al 1992; Yukon Fish and Wildlife Branch 1996). Harvest rates in GMS 7-05 and 7
hunters since 1998, when moose abundance and recruitment were at their peak (Tthis decline are uncertain but over-harvest cannot be discounted as a contributing factor. High harvest rates observed in easily accessible portions of tt
substantially and is now below the Yukon average, and harvest data may not b
Resident non-First Nation moose harvest is distributed throughout the
These MMUs were developed in the mid 1990’s to reduce
he non-resident harvest is governed by conditions of the outfitter quota greement.
The current average total reported annual harvest in the 2008 Alsek s
able 8, Map 8). It
ditional erritories also overlap small portions the Alsek survey area, is not available.
The 2.4% estimated total harvest rate for the entire area is above the 2%
akhanne River MMUs also exceed the 3% to 4% AAH rates
-07 are also approaching the 4% upper allowable harvest limit (Table 8).
Despite apparently moderate overall total estimated harvest rates by all
able 7.), moose numbers have declined significantly. The reasons for
he northern MMUs and low adult bull: adult cow ratios provide support for his hypothesis.
Given that moose abundance in the 2008 Alsek survey area has declined
e complete, moose harvest should remain conservative.
Game Management
Area (GMA)
Moose Management Area (MMU)
Estimated Area of GMA (km2)
Moose Density1
per 1000 km2
Total Estimated
Moose in GMA
Average Resident Harvest (2004 to
2008)
Average Non-
Resident Harvest (2004 to
2008)
Average Non-
Resident (Special Guided) Harvest
Average First
Nation (CAFN) Harvest (2003 to 2007)2,3
Average Total
Harvest4
Current Harvest
Rate (% of total
population)
2% Allowable
Annual Harvest
3% Allowable
Annual Harvest
4% Allowable
Annual Harvest
612 Tatshenshini R. 401.3 220 88.3 0.0 0.0 0.0 1.8 1.8 2.0 1.8 2.6 3.5 613 Tatshenshini R. 182.0 240 43.7 0.0 0.0 0.0 0.6 0.6 1.4 0.9 1.3 1.7 701 Dezadeash R. 469.2 115 54.0 1.0 0.0 0.0 1.8 2.8 5.2 1.1 1.6 2.2 702 Dezadeash R. 429.0 120 51.5 0.2 0.0 0.0 1.0 1.2 2.3 1.0 1.5 2.1 703 Granite Cr. 520.6 125 65.1 1.0 0.0 0.0 3.2 4.2 6.5 1.3 2.0 2.6 704 Dezadeash R. 519.0 125 64.9 0.2 0.2 0.0 1.6 2.0 3.1 1.3 1.9 2.6 705 Dezadeash R. 446.9 125 55.9 0.2 0.6 0.0 1.2 2.0 3.6 1.1 1.7 2.2 706 Takhanne R. 506.8 260 131.8 0.2 0.0 0.0 1.2 1.4 1.1 2.6 4.0 5.3 707 Takhanne R. 390.3 215 83.9 1.2 0.6 0.0 1.2 3.0 3.6 1.7 2.5 3.4 708 Takhanne R. 453.0 130 58.9 0.0 0.0 0.0 0.2 0.2 0.3 1.2 1.8 2.4 709 Takhanne R. 234.6 165 38.7 0.0 0.0 0.0 0.2 0.2 0.5 0.8 1.2 1.5 710 Takhanne R. 285.4 70 20.0 0.0 0.0 0.0 0.2 0.2 1.0 0.4 0.6 0.8 711 Takhanne R. 65.4 30 2.0 0.0 0.0 0.0 0.0 0.0 0.0 0.0 0.1 0.1 712 Takhanne R. 510.0 90 45.9 0.0 0.0 0.0 0.0 0.0 0.0 0.9 1.4 1.8
Grand Total5 5413.5 145.0 804.6 4.0 1.4 0.0 14.2 19.6 2.4 16.1 24.1 32.2
November 2008 30
Table 8. 2008 Alsek M
Average Annual Non-First Nation (2004-2008) and First Nation (2003-2007) Moose Harvest and Allowable Harvest Summary for the oose Survey Area: by Moose Management Unit and Game Management Subzone (GMS) 6-12 to 6-13, 7-01 to 7-12
1
2
3
4
to 2007) 5
Moose Density values based on 2008 Alsek moose survey results. 2008 Champagne and Aishihik First Nation (CAFN) harvest data was not available. Most current 5-year average CAFN harvest is based on 2003 to 2007 data. Average First Nation Harvest from Carcross/Tagish or Kwanlin Dun hunters, who’s Traditional Territories overlap a small portion of the Alsek area, is not
available. Includes non-First Nation Resident and Non-Resident reported harvest (2004 to 2008) and most recent Champagne and Aishihik First Nation harvest data (2003
Small differences in total area, average moose density, and total number of moose presented in the report for the Alsek survey area, versus Table 7, are due to slight differences in game management subzone and survey area boundaries (see Map 1).
Alsek Early-winter Moose Survey -
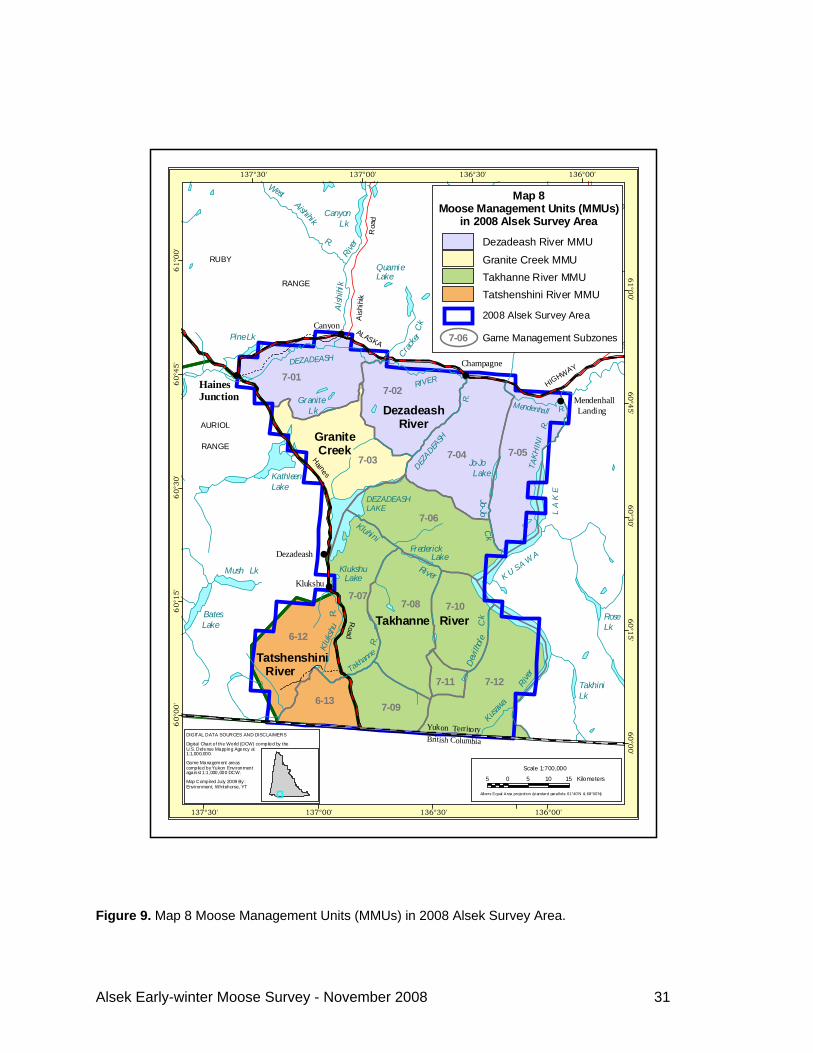
Figure 9.
Alsek Early-winter Moose Survey -
##
#
Map 8 Moose Management Units (MMUs) in 2008 Alsek Survey Area.
WestAishihik
R.
Canyon Lk
Hutshi
Lakes
Sceptre Lake
Moraine
Ai s
h ihi
kRiv
er
Pine Lk
TayeLake
QuamieLake
Harr isonLakeLake
ALASK
Ais
h ihi
k
Roa
d
erC
k
#Canyon
RUBY
RANGE
DEZ
AD
EASH
R.
Kluhini
DEZADEASH
RIVER
R.
River
DEZADEASHLAKE
Frederick
KlukshuLake
Lake
TA
KH
INI
K U S A W
AL
A K
E
Granite Lk
KathleenLake
Mush Lk
HIGHW
AY
Ck
Kusaw
a
River
TakhiniLk
RoseLk
A
Dev
i lhol
e
Yukon TerritoryBritish Columbia
HainesJunction
7-04
7-12
7-06
7-03
7-01
7-05
7-02
7-08
6-12
7-07
7-096-13
7-11
7-10
AURIOL
Jo-Jo Lake
RANGE
Road
Haines
Klu
kshu
R.
R.
Takhann
e
Dezadeash
Champagne
Klukshu#
Mendenhall
Cra
ckMendenhall Landing
#
Jo-JoC
k
R.
BatesLake Takhanne River
DezadeashRiver
GraniteCreek
Tatshenshini River
60°0
0'
60°0
0'
60°1
5'
60°1
5'
60°3
0'
60°3
0'
60°4
5'
60°4
5'
61°0
0'
137°30' 137°00' 136°30' 136°00'
November 2008 31
61°0
0'
137°30' 137°00' 136°30' 136°00'
Scale 1:700,000
5 0 5 10 15 Kilometers
Albers Equal Area project ion (standard parall el s: 61°40'N & 68°00'N)
Map 8Moose Management Units (MMUs)
in 2008 Alsek Survey Area
Game Management Subzones7-06
2008 Alsek Survey Area
Granite Creek MMU
Takhanne River MMU
Tatshenshini River MMU
Dezadeash River MMU
DIGITAL DATA SOURCES AND DISCLAIMERS
Digital Chart of the World (DCW) compiled by the U.S. Defense Mapping Agency at1:1,000,000.
Game Management areascompiled by Yukon Environmentagainst 1:1,000,000 DCW.
Map Compiled July 2009 By :Environment, Whitehorse, YT
Other Wildlife Sightings
In addition to the 395 moose we counted during the 2008 survey, we also observed 25 moose outside of the sample units that were surveyed, or just outside of the survey boundary. The total number observed during the entire survey period was 420 moose.
Other ungulates recorded during the survey included a total of 36 bison; 21 near the west end of the Mendenhall River, 14 just north of the Alaska Highway east of Cracker Creek and 1 south of the Dezadeash River southwest of the Canyon community. One elk was located southwest of Mendenhall Landing, and 1 Mule deer was also seen on the hills southwest of the mouth of Jo-Jo Creek. A total of 109 Dall sheep were observed in the study area, primarily in the high ground between the east arm of the Dezadeash River and Kusawa Lake (75 sheep) and the northeast and northwest edges of the Dezadeash Range (17 sheep). Another 17 sheep were scattered at high elevation in the south end of the survey area, mainly south of Frederick Lake and the Klukshu area. Three Mountain goats were also observed in the hills west of Klukshu.
Other species observed included two wolves spotted southeast of Champagne and 1 grizzly bear located southeast of Klukshu. One lynx was seen east of Mendenhall Landing on the east bank of the Takhini River, and 6 swans (2 adults + 4 young) were also located on the same river just north of the landing.
Alsek Early-winter Moose Survey - November 2008 32
CONCLUSIONS AND RECOMMENDATIONS We estimate that there are about 806 moose in the 2008 Alsek survey area
for an average density of about 147 moose per 1,000 km2 of total area. This is lower than the Yukon-wide average. Moose abundance in a previously surveyed portion of the entire area was considerably lower in 2008 than in 1981, 1982 and 1998.
Moose numbers declined significantly (44%) between 1998 and 2008, and now appears to be at or near historic recorded lows throughout all portions of the Alsek survey area.
Survival of calves appears to have been moderate in the survey area during the summer and fall of 2008, and low for calves born in 2007. Overall calf and yearling recruitment in the 2008 Alsek survey area suggests a stable to slowly declining moose population.
The ratio of adult bulls to adult cows in the 2008 survey area was well below the estimated Yukon-wide average but remains above the minimum number generally considered sufficient to ensure that adult cows are bred during the rut. The reason for the significantly lower proportion of bulls observed in 2008 is unclear, but it does highlight the need for ongoing monitoring.
The current total reported moose harvest by First Nation and non-First Nation hunters in the 2008 Alsek survey area is within the normal annual allowable limit (less than 3% to 4% of the total estimated moose population).
There is a concern, however, that total harvest in the more accessible portions of the Alsek survey area may exceed sustainable limits, and careful monitoring of moose abundance and harvest will be needed to ensure the long term welfare of the local moose population.
The Yukon Government, Champagne and Aishihik First Nation and Alsek Renewable Resource Council should meet to discuss ways to ensure moose harvest rates do not exceed sustainable levels, and to develop plans to address the current population decline.
Alsek Early-winter Moose Survey - November 2008 33
LITERATURE CITED GASAWAY, W.C., S.D. DUBOIS, D.J. REED, AND S.J. HARBO. 1986. Estimating
moose population parameters from aerial surveys. University of Alaska, Institute of Arctic Biology, Biological Paper No. 22. 108pp
GASAWAY, W.C. R.D. BOERTJE, D.V. GRANGAARD, D.G. KELLYHOUSE, R.O. STEPHENSON, AND D.G. LARSEN. 1992. The role of predation in limiting moose at low densities in Alaska and Yukon and implications for conservation. Wildlife Society Monograph No. 120. 59 pp.
HAYES, R.D., AND L.L. LAROCQUE. 2001. Alsek Moose Management Area: Moose count in the Dezadeash Mountains, November 21-25, 1996. Yukon Regional Management Branch, Yukon Department of Environment, Haines Junction, Yukon. File Report. 12pp.
HAYES, R.D., AND L.L. LAROCQUE. 2002. Alsek Moose Management Area: Moose count in the Jo-Jo Lake area, November 1997. Yukon Regional Management Branch, Yukon Department of Environment, Haines Junction, Yukon. File Report. 11pp.
JOHNSTON, G.W., AND H.A. MCLEOD. 1983. Population Dynamics and early winter habitat utilization by moose (Alces alces) in the South-West Yukon Territory. Prepared by Northern Biomes Ltd. Environmental Services for Yukon Territorial Government, Resource Planning Division, Whitehorse, Yukon. Progress Report. 53pp.
KELLIE, K.A. AND R.A. DELONG. 2006. Geospatial Survey Operations Manual. Division of Wildlife Conservation, Alaska Department of Fish and Game. Fairbanks, Alaska, USA. 55 pp.
LAROCQUE, L.L. 1998. 1998 Fall Moose Surveys in Kluane Region. Yukon Regional Management Branch, Yukon Department of Environment, Haines Junction, Yukon. File Report. 1pp.
LAROCQUE, L.L. 2004. Aishihik and Alsek Moose Surveys; November 2003. Yukon Regional Management Branch, Yukon Department of Environment, Haines Junction, Yukon. File Report. 1pp.
LAROCQUE, L.L. 2005. 2004 Kloo Lake/Dezadeash Mtns Moose Survey Draft File Report. Yukon Regional Management Branch, Yukon Department of Environment, Haines Junction, Yukon. File Report. 1pp.
LAROCQUE, L.L. 2006. Moose monitoring in the Dezadeash Range, fall 2005. Yukon Regional Management Branch, Yukon Department of Environment, Haines Junction, Yukon. File Report. 5pp.
LAROCQUE, L.L. 2008. HAINES Junction Late Winter Moose Monitoring. Yukon Regional Management Branch, Yukon Department of Environment, Haines Junction, Yukon. File Report. 3pp.
Alsek Early-winter Moose Survey - November 2008 34
LARSEN, D.G. 1982. MOOSE Inventory in the southwest Yukon. Yukon Fish and Wildlife Branch, Yukon Renewable Resources, Whitehorse, Yukon. Survey Report. ~26pp.
LARSEN, D.G., D.A. GAUTHIER, R.L. MARKEL AND R.D. HAYES. 1989. Limiting Factors on Moose Population Growth in the Southwest Yukon. Yukon Fish and Wildlife Branch, Yukon Renewable Resources, Whitehorse, Yukon. Survey Report. 105pp.
LARSEN, D.G., AND R.M.P. WARD. 1991a. Moose population characteristics in the Haines Junction and Aishihik Lake area. Yukon Fish and Wildlife Branch, Yukon Renewable Resources, Whitehorse, Yukon. Survey Report SR-91-4. 35pp.
LARSEN, D.G., AND R.M.P. WARD. 1991b. Moose Population Research and Management Studies in Yukon: Summary of Moose Trend Survey Results 1990. Yukon Fish and Wildlife Branch, Yukon Renewable Resources, Whitehorse, Yukon. Survey Report SR-91-5. 35pp.
MARKEL, R.L., AND D.G. LARSEN. 1987a. Southwest Yukon Moose Survey Results, November – December 1983: Summary of 1983 moose surveys in the Kluane, Haines Junction, Whitehorse South, Teslin Burn and Mt. Lorne areas. Yukon Fish and Wildlife Branch, Yukon Renewable Resources, Whitehorse, Yukon. Progress Report PR-87-5. 22pp.
MARKEL, R.L., AND D.G. LARSEN. 1987b. Southwest Yukon Moose Survey Results, November – December 1984: Summary of 1984 moose surveys in the Haines Junction and Teslin areas. Yukon Fish and Wildlife Branch, Yukon Renewable Resources, Whitehorse, Yukon. Progress Report PR-87-4. 13pp.
MCKINNON, C. Draft report. 2008 Auriol Moose Survey, November 4, 2008, Kluane National Park and Reserve. Kluane National Park and Reserve, Haines Junction, Yukon. File Report. 8pp.
SMITS, C., T. HUNTER, AND D. BAKICA. 1992. Moose Population Research and Management Studies in the Yukon: Summary of Aerial Trend Surveys for Moose in 1991. Yukon Fish and Wildlife Branch, Yukon Renewable Resources, Whitehorse, Yukon. Progress Report PR-92-3. 21pp.
TAYLOR, S., AND L.L. LAROCQUE. 2009. Haines Junction Late Winter Moose Habitat Survey, 2009. Yukon Regional Management Branch, Yukon Department of Environment, Haines Junction, Yukon. File Report. 4pp.
YUKON ECOREGIONS WORKING GROUP. 2004. Pelly Mountains Ecoregion. In: Ecoregions of the Yukon Territory: Biophysical properties of Yukon Landscapes, C.A.S. Smith, J.C. Meikle and C.F. Roots (eds.), Agriculture and Agri-Food Canada, PARC Technical Bulletin No. 04-01, Summerland, British Columbia, p. 219-226.
Alsek Early-winter Moose Survey - November 2008 35
Alsek Early-winter Moose Survey - November 2008 36
YUKON FISH AND WILDLIFE BRANCH. 1996. Moose management guidelines. Yukon Fish and Wildlife Branch, Yukon Renewable Resources, Whitehorse, Yukon. 12pp.
YUKON FISH AND WILDLIFE BRANCH. 1997. Summary of 1997 late winter Alsek Moose Survey Results. Yukon Fish and Wildlife Branch, Department of Environment, Whitehorse, Yukon. File Report. 3pp.
YUKON FISH AND WILDLIFE BRANCH. 2000. Aishihik Integrated Wildlife Management Plan. Yukon Fish and Wildlife Branch, Government of Yukon, Renewable Resources, Whitehorse, Yukon. 32pp.