Embed Size (px)
Citation preview

Distribution of Assets: Other Important Facts:
Equity Total Portfolio $54,430,930
Large Cap Value $12,288,820 Total Gain or (Loss) - Gross $3,301,164
Large Cap Growth $12,908,343 Total Gain or (Loss) - Net $3,243,067
Small/Mid Cap Value $3,344,923 Total Fees ($58,097)
Small/Mid Cap Growth $3,321,427
International Value $3,407,682 HGK (Large Cap Value) FIERA (Formerly APEX) (Small/Mid Cap Growth)
International Growth $3,125,973 Total Assets 100.00% $12,288,820 Total Assets 100.00% $3,321,427
Total Equity $38,397,168 Equity 96.98% $11,917,099 Equity 94.86% $3,150,651
Fixed Income $15,971,314 Cash 3.02% $371,720 Cash 5.14% $170,776
Cash (R&D Account) $62,448 Fees ($10,754) Fees ($4,467)
Total Portfolio $54,430,930 Gain or (Loss) $984,906 Gain or (Loss) $348,014
Distribution by Percentages: Policy Current SAWGRASS (Large Cap Growth) DELAWARE (International Value)
Equity Total Assets 100.00% $6,449,380 Total Assets 100.00% $3,407,682
Large Cap Value 22.50% 22.58% Equity 98.71% $6,365,962 Equity 98.58% $3,359,129
Large Cap Growth 22.50% 23.72% Cash 1.29% $83,418 Cash 1.42% $48,554
Small/Mid Cap Value 5.00% 6.15% Fees ($8,279) Fees ($5,856)
Small/Mid Cap Growth 5.00% 6.10% Gain or (Loss) $513,634 Gain or (Loss) $285,948
International Value 5.00% 6.26%
International Growth 5.00% 5.74% POLEN (Large Cap Growth) RENAISSANCE (International Growth)
Total Equity 65.00% 70.54% Total Assets 100.00% $6,458,963 Total Assets 100.00% $3,125,973
Fixed Income 35.00% 29.34% Equity 98.19% $6,342,351 Equity 97.52% $3,048,532
Cash (R&D Account) 0.00% 0.11% Cash 1.81% $116,612 Cash 2.48% $77,441
Total 100.00% 100.00% Fees ($9,007) Fees ($4,749)
Gain or (Loss) $629,151 Gain or (Loss) $232,391
RECEIPTS & DISBURSEMENT CAMBIAR (Small/Mid Cap Value) GARCIA HAMILTON (Fixed Income)
Total Assets (Cash) $62,448 Total Assets 100.00% $3,344,923 Total Assets 100.00% $15,971,314
Gain or (Loss) $903 Equity 92.21% $3,084,229 Fixed Income 95.16% $15,198,172
Cash 7.79% $260,694 Cash 4.84% $773,142
Fees ($5,028) Fees ($9,957)
Gain or (Loss) $255,478 Gain or (Loss) $50,740
SUMMARY OF RELEVANT FACTS
City of Ormond Beach General Employees' Pension Plan
As of December 31, 2019
Page 1

BREAKDOWN OF RETURNS
City of Ormond Beach General Employees' Pension Plan
As of December 31, 2019
Actuarial Rate of Return = 6.75%
EQUITY Your Returns Your Returns
HGK (Gross-of-Fees) (Net-of-Fees) Russ 1000 Value PSN Money Mgrs. S&P 500
Quarter 8.71 8.61 7.41 7.16 9.071 Year 26.18 25.71 26.54 27.00 31.493 Year 9.55 9.14 9.68 11.04 15.275 Year 6.67 6.27 8.29 9.39 11.70
Since 4/30/2009 12.21 11.80 13.78 NA 15.44 Sawgrass Russ 1000 Growth PSN Money Mgrs. S&P 500
Quarter 8.50 8.36 10.62 8.54 9.071 Year 31.15 30.47 36.39 32.99 31.49 3 Year 18.64 18.01 20.49 17.63 15.275 Year 12.69 12.09 14.63 12.34 11.70
Since 4/30/2012 14.66 14.02 15.44 NA 13.90Saw/Ren - Since 7/31/2007 9.23 8.64 11.01 NA 8.93
Polen Russ 1000 Growth PSN Money Mgrs. S&P 500
Quarter 10.64 10.48 10.62 8.54 9.071 Year 39.20 38.39 36.39 32.99 31.493 Year 24.88 24.14 20.49 17.63 15.275 Year 18.10 17.40 14.63 12.34 11.70
Since 4/30/2012 16.89 16.22 15.44 NA 13.90 Cambiar Russ 2500 Value PSN Money Mgrs.
Quarter 8.26 8.09 7.07 7.261 Year 32.08 31.26 23.57 26.07 3 Year 13.46 12.74 6.12 8.37
Since 6/30/2016 16.79 16.09 9.81 10.61Cambiar/ GW Capital - 5 Year 10.06 9.35 7.18 8.19
Cambiar/ GW Capital - Since 10/31/2008 14.69 13.91 11.90 NA Fiera (Formerly APEX) Russ 2500 Growth PSN Money Mgrs.
Quarter 11.69 11.54 10.57 8.57 1 Year 32.58 31.82 32.65 30.723 Year 15.69 15.01 15.17 15.76
Since 1/31/2015 10.35 9.72 11.39 NAFiera/ETF/Perimeter- 5 Year 9.80 9.18 10.84 11.21
Fiera/ETF/Perimeter- Since 4/30/2009 14.45 13.74 15.99 NA Delaware MSCI EAFE (Net) MSCI EAFE Val
Quarter 9.15 8.96 8.17 7.821 Year 20.34 19.45 22.01 16.093 Year 9.06 8.27 9.56 6.315 Year 5.92 5.15 5.67 3.54
Since 7/31/2005 5.55 4.76 4.91 3.76Page 2

Renaissance MSCI AC Wd x US MSCI EAFE Grth
Quarter 8.03 7.85 8.92 8.451 Year 19.85 19.09 21.51 27.893 Year 7.29 6.62 9.87 12.845 Year 4.23 3.57 5.51 7.71
Since 4/30/2009 8.69 8.02 7.96 9.61FIXED INCOME
Garcia Hamilton BC Int. Govt/Credit BC Int. Aggregate 90-Day T-Bill
Quarter 0.32 0.26 0.37 0.47 0.461 Year 6.04 5.77 6.80 6.67 2.253 Year 3.10 2.89 3.24 3.26 1.655 Year 2.76 2.54 2.57 2.59 1.05
Since 9/30/2003 4.67 4.40 3.50 3.72 1.31TOTAL RETURN
Time-Weighted Return Policy Index
Quarter 6.44 6.32 5.88 1 Year 21.52 20.99 21.31 3 Year 10.67 10.19 10.05 5 Year 7.69 7.21 7.69
Since 3/31/2001 6.78 6.29 6.58 TOTAL RETURN
Dollar-Weighted Net Actuarial Rate CPI +4
Quarter 6.32 1.65 1.591 Year 21.06 6.75 6.173 Year 10.17 6.75 6.025 Year 7.11 6.75 5.83
Since 3/31/2001 6.12 6.75 6.10Policy Index = 30% Russell 1000 Value + 30% Russell 1000 Growth + 20% BC Aggregate + 20% BC Intermediate Gov't/Credit Bonds for periods prior to June 30, 2005;
27.5% Russell 1000 Value + 27.5% Russell 1000 Growth + 10% MSCI EAFE (Net) + 17.5% BC Aggregate + 17.5% BC Intermediate Gov't/Credit Bonds for
periods from June 30, 2005 to October 31, 2008; 25% Russell 1000 Value + 25% Russell 1000 Growth + 5% Russell 2500 Value + 10% MSCI EAFE (Net)
+ 17.5% BC Aggregate + 17.5 BC Intermediate Gov't/Credit Bonds for periods October 31, 2008 to April 30, 2009; & 22.5% Russell 1000 Value + 22.5%
Russell 1000 Growth + 5% Russell 2500 Value + 5% Russell 2500 Growth + 5% MSCI EAFE (Net) + 5% MSCI AC World ex US + 35% BC Intermediate
Gov't/Credit Bonds for periods since April 30, 2009
Page 3

Risk/Return Analysis - Since Inception
Zephyr StyleADVISORZephyr StyleADVISOR: MSSB - Tampa, FL
Manager PerformanceApril 2001 - December 2019 (Single Computation)
50
100
150
200
250
300
350
Ormond Beach General - Total FundOrmond Beach General - Policy Index
0%
5%
10%
15%
Q1 2001 Q4 2003 Q4 2005 Q4 2007 Q4 2009 Q4 2011 Q4 2013 Q4 2015 Q4 2017 Q4 2019
Cumulative Excess Returnvs. Market Benchmark
Risk / ReturnApril 2001 - December 2019 (Single Computation)
Retu
rn
0%
1%
2%
3%
4%
5%
6%
7%
Standard Deviation
0% 2% 4% 6% 8% 10%
Ormond Beach General - Total Fund
Market Benchmark:Ormond Beach General - Policy Index
Cash Equivalent:Citigroup 3-month T-bill
Return & Risk AnalysisApril 2001 - December 2019: Summary Statistics
Ormond Beach General - Total Fund
Ormond Beach General - Policy Index
ReturnExcess Return
vs. Market
StandardDeviation
Betavs.
Market
MaximumDrawdown
UpCapture
vs.Market
DownCapture
vs.Market
Alphavs.
Market
SharpeRatio
R-Squaredvs.
Market
6.77% 0.19% 9.94% 0.96 -28.93% 99.17% 95.46% 0.41% 0.54 97.59%
6.58% 0.00% 10.20% 1.00 -31.33% 100.00% 100.00% 0.00% 0.51 100.00%
Page 4

GUIDELINES In Compliance
Equity Portfolio
Listed on recognized exchange Yes
Single issue not to exceed 10% at market value for Yes
each equity separately managed portfolio
Each equity portfolio < 70% & > 60% of total fund at No (70.54%)
market value
Fixed Income Portfolio
U.S. Government / Agency or U.S. Corporations Yes
Fixed Income Portfolio < 40% & > 30% No (29.34%)
Corporate Bonds rated "A" or better Yes*
CMOs < 15% of fixed Income portfolio at market Yes
Single corporate issuer not exceed 5% of bond portfolio Yes
Single corporate issuer not exceed 5% of total fund Yes
* A couple of securities contain "A" or better rating by another major rating service
City of Ormond Beach General Employees' Pension PlanCompliance Checklist
as of December 31, 2019
Page 5

OBJECTIVES Met
Total Portfolio
Exceed Target Index - Since 3/31/2001 Yes
Exceed actuarial assumption (6.75%) - Since 3/31/2001 No
HGK
Equities > Russell 1000 Value - Since 4/30/2009 No
Rank in the Top 50% - Since 4/30/2009 No
Sawgrass
Equities > Russell 1000 Growth - Since 4/30/2012 No
Rank in the Top 50% - Since 4/30/2012 No
Polen
Equities > Russell 1000 Growth - Since 4/30/2012 Yes
Rank in the Top 50% - Since 4/30/2012 Yes
Cambiar
Equities > Russell 2500 Value - Since 6/30/2016 Yes
Rank in the Top 50% - Since 6/30/2016 Yes
Fiera (Formerly APEX)
Equities > Russell 2500 Growth - Since 1/31/2015 No
Rank in the Top 50% - Since 1/31/2015 No
Delaware
Equities > MSCI EAFE (Net) - Since 7/31/2005 Yes
Renaissance
Equities > MSCI AC World ex US - Since 4/30/2009 Yes
Garcia Hamilton & Associates
Bonds > BC Intermediate Gov't/Credit - Since 3/31/2001 Yes
as of December 31, 2019
City of Ormond Beach General Employees' Pension PlanReturns Review
Page 6

City of Ormond Beach
General Employees’ Pension Plan
QUARTERLY PERFORMANCE
EVALUATION
Prepared for:
Scott Owens, CFA®, CIMA®
Sr. Vice President
Institutional Consulting Director100 North Tampa Street, Suite 3000
Tampa, FL 33602
800-282-0655, ext. 2061 / 813-227-2061
Graystone Consulting Tampa
Andrew McIlvaine
Institutional Consultant
As of December 31, 2019

Table of Contents
Performance Evaluation
Capital Markets Overview Tab 1
Performance Reports Tab 2
Total Fund Reports
HGK – Large Cap Value Equity Reports
Sawgrass – Large Cap Growth Equity Reports
Polen – Large Cap Growth Equity Reports
Cambiar – Small/Mid Cap Value Equity Reports
Fiera Capital (Formerly Apex) – Small/Mid Cap Growth Equity Reports
Delaware – International Value Equity Reports
Renaissance – International Growth Equity Reports
Garcia Hamilton– Fixed Income Reports
Past performance is no guarantee of future results. Estimates of future performance are based on assumptions that may not be realized. This material is not a solicitation of any offer to buy or sell any security or other financial instrument or to participate in any trading strategy. Please refer to important information, disclosures and qualifications at the end of this material. This slide sourced from Market Performance section.
WEALTH MANAGEMENT INVESTMENT RESOURCES | CHARTBOOK | MARKET PERFORMANCE
Capital Markets Overview: 4Q 2019 Introduction
Quarterly Update as of December 31, 2019 and Forecasts as of November 29, 2019
Source: FactSet, Bloomberg, Morgan Stanley & Co. Research, Morgan Stanley Wealth Management GIC
• The S&P 500 capped off an historic year for returns in the fourth quarter with its strongest finish since 2013. Equities were up 9.07% on the
quarter and gained 32.6% in 2019. International markets underperformed the US slightly, though still performed nicely. MS & Co.’s CIO and
Chief US Equity Strategist, Mike Wilson, has raised his price target to 3,000 for the S&P 500 into 2020 and expects range-bound trading over the
next year, as unrealistic expectations for corporate earnings and already stretched valuations may pressure equity returns.
• US equities rose in the fourth quarter, as the S&P 500 gained 9.07% and 10 of 11 sectors finished in the black. Tech led, gaining 14.40%. Other
outperformers included Health Care and Financials, which were up 14.37% and 10.44%, respectively. Real Estate was the only money loser,
falling 0.54%. Utilities trailed as well, up only 0.80%. Other major US indices were positive on the quarter; the Dow Jones added 6.67% and the
NASDAQ gained 12.49%.
• International underperformed slightly in the fourth quarter, as the US continued its market leadership. International markets rose on positive
trade news and incremental improvement in European economic data. The MSCI EAFE Index (a benchmark for international developed
markets) added 8.21% for US-currency investors.
• The bond market was flat in the fourth quarter as the Fed meeting expectations and improving sentiment surrounding global growth kept bond
yields steady to slightly higher across the curve. The Bloomberg Barclays US Aggregate Bond Index, a general measure of the bond market,
rose 0.18%.
• Morgan Stanley & Co. economists expect US real GDP will be 1.7% in Q4 2019 amid an environment of 2.9% global GDP growth; they expect
that pace to accelerate in the US and globally for 2020 to 1.8% and 3.2%, respectively.
• Commodities were up in the fourth quarter; the Bloomberg Commodity Index gained 4.0%.

Past performance is no guarantee of future results. Estimates of future performance are based on assumptions that may not be realized. This material is not a solicitation of any offer to buy or sell any security or other financial instrument or to participate in any trading strategy. Please refer to important information, disclosures and qualifications at the end of this material. This slide sourced from Market Performance section.
WEALTH MANAGEMENT INVESTMENT RESOURCES | CHARTBOOK | MARKET PERFORMANCE
Capital Markets Overview: 4Q 2019
Source: FactSet, Bloomberg, Morgan Stanley & Co. Research, Federal Reserve Bank of St. Louis, Morgan Stanley Wealth Management GIC
The Bureau of Economic Analysis estimated that real Gross Domestic Product increased at an annualized rate of 2.1% in 3Q19, in comparison to a
2.0% increase in 2Q19. Morgan Stanley & Co. economists forecast US Real GDP growth will be 1.7% in Q4 2019 and 1.8% in 2020.
The seasonally adjusted unemployment rate for November 2019 was 3.5%, the cycle low. The number of unemployed was 5.8 million in November,
down from 6.0 million in August. The number of long-term unemployed (those jobless for 27 weeks or more) was 1.2 million, unchanged from
August 2019’s 1.2. These individuals accounted for 21.1% of the unemployed vs. 20.6% at the end of August 2019.
According to the most recent data from the Federal Reserve Bank of St. Louis, corporate profits rose 0.6% quarter over quarter and fell 0.3% year
over year as of Q3 2019.
Inflation was accelerated slightly in the US, according to the Bureau of Labor Statistics. The year-over-year Consumer Price Index was 2.1% in
November, up from 1.8% in October. Morgan Stanley & Co. economists forecast a 2.0% annual inflation rate for Q4 2019 and 2.4% for 2020.
The Census Bureau reported that the number of new private-sector housing starts in November was at a seasonally adjusted annual rate of
1,365,000—13.6% above housing starts in November of last year.
The Census Bureau also reported that seasonally adjusted retail and food services sales increased at 3.3% year over year in November. Consumer
confidence was steady in 4Q19, with Conference Board Consumer Confidence reading 126.5 in December, compared to 126.3 in September, though
confidence is still below July’s peak of 135.8.
In November, the Institute for Supply Management’s (ISM) Purchasing Managers Index (PMI), a manufacturing sector index, remains in contraction
at 48.1, though is up from September’s reading of 47.8, which had been the lowest since 2016. Generally speaking, a PMI or NMI (ISM Non-
Manufacturing Index) over 50 indicates that the sector is expanding, and a PMI below 50 but over 43 indicates that the sector is shrinking but the
overall economy is expanding. August’s reading was the first PMI below 50 since August 2016. Overall, PMI has been above 43 for 126 consecutive
months, indicating overall economic recovery and expansion since May 2009.
The ISM’s Non-Manufacturing Index (NMI) for November was 53.9—down from October’s 54.7. The index has now been above 50 for 118
consecutive months, indicating non-manufacturing expansion since February 2010.
The US Economy
Quarterly Update as of December 31, 2019 and Forecasts as of November 29, 2019
Past performance is no guarantee of future results. Estimates of future performance are based on assumptions that may not be realized. This material is not a solicitation of any offer to buy or sell any security or other financial instrument or to participate in any trading strategy. Please refer to important information, disclosures and qualifications at the end of this material. This slide sourced from Market Performance section.
WEALTH MANAGEMENT INVESTMENT RESOURCES | CHARTBOOK | MARKET PERFORMANCE
Capital Markets Overview: 4Q 2019
Source: FactSet, Bloomberg, Morgan Stanley Wealth Management GIC
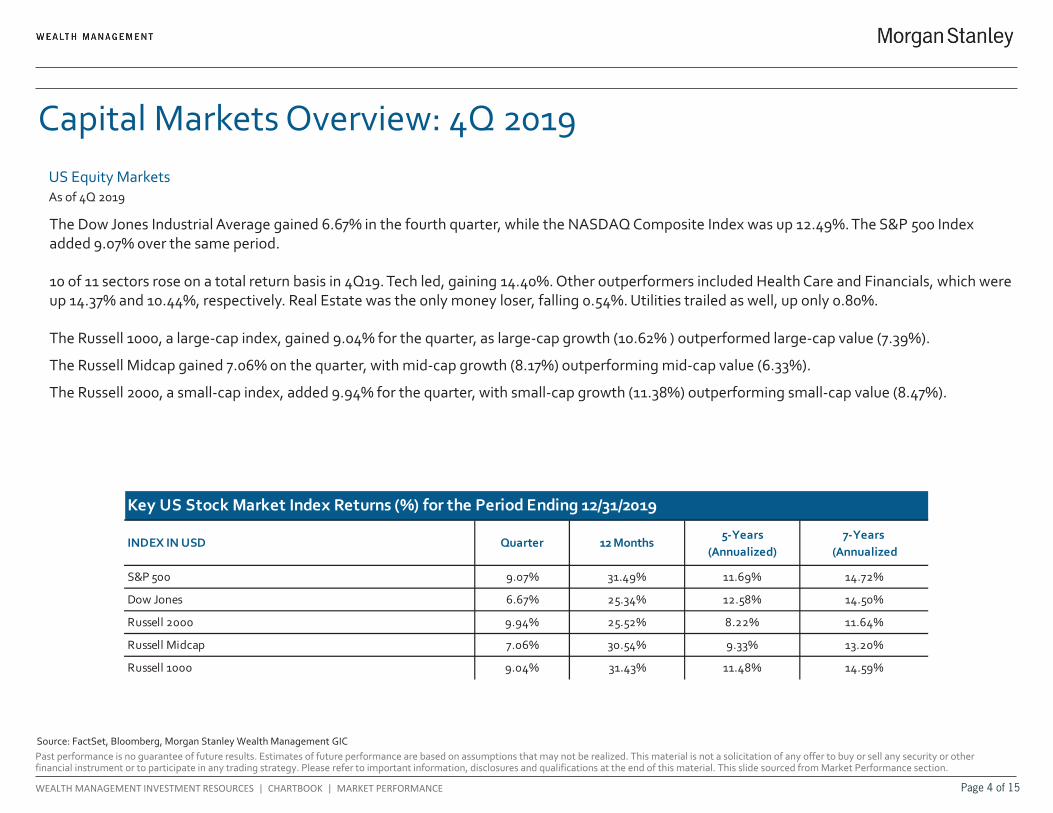
INDEX IN USD Quarter 12 Months5-Years
(Annualized)
7-Years
(Annualized
S&P 500 9.07% 31.49% 11.69% 14.72%
Dow Jones 6.67% 25.34% 12.58% 14.50%
Russell 2000 9.94% 25.52% 8.22% 11.64%
Russell Midcap 7.06% 30.54% 9.33% 13.20%
Russell 1000 9.04% 31.43% 11.48% 14.59%
Key US Stock Market Index Returns (%) for the Period Ending 12/31/2019
US Equity Markets
As of 4Q 2019
The Dow Jones Industrial Average gained 6.67% in the fourth quarter, while the NASDAQ Composite Index was up 12.49%. The S&P 500 Index
added 9.07% over the same period.
10 of 11 sectors rose on a total return basis in 4Q19. Tech led, gaining 14.40%. Other outperformers included Health Care and Financials, which were
up 14.37% and 10.44%, respectively. Real Estate was the only money loser, falling 0.54%. Utilities trailed as well, up only 0.80%.
The Russell 1000, a large-cap index, gained 9.04% for the quarter, as large-cap growth (10.62% ) outperformed large-cap value (7.39%).
The Russell Midcap gained 7.06% on the quarter, with mid-cap growth (8.17%) outperforming mid-cap value (6.33%).
The Russell 2000, a small-cap index, added 9.94% for the quarter, with small-cap growth (11.38%) outperforming small-cap value (8.47%).

Past performance is no guarantee of future results. Estimates of future performance are based on assumptions that may not be realized. This material is not a solicitation of any offer to buy or sell any security or other financial instrument or to participate in any trading strategy. Please refer to important information, disclosures and qualifications at the end of this material. This slide sourced from Market Performance section.
WEALTH MANAGEMENT INVESTMENT RESOURCES | CHARTBOOK | MARKET PERFORMANCE
S&P 500 Sectors
Source: Bloomberg
YTD 2019 Total Return As of December 31, 2019
50.3%
32.7%
32.1%
29.3%
29.0%
27.9%
27.6%
26.4%
24.6%
20.8%
11.8%
0% 10% 20% 30% 40% 50% 60%
Technology
Communication Services
Financials
Industrials
Real Estate
Discretionary
Staples
Utilities
Materials
Health Care
Energy

Past performance is no guarantee of future results. Estimates of future performance are based on assumptions that may not be realized. This material is not a solicitation of any offer to buy or sell any security or other financial instrument or to participate in any trading strategy. Please refer to important information, disclosures and qualifications at the end of this material. This slide sourced from Market Performance section.
WEALTH MANAGEMENT INVESTMENT RESOURCES | CHARTBOOK | MARKET PERFORMANCE
Capital Markets Overview: 4Q 2019
Source: FactSet, Bloomberg, Morgan Stanley Wealth Management GIC
INDEX IN USD Quarter 12 Months5-Years
(Annualized)
7-Years
(Annualized)
MSCI EAFE 8.21% 22.66% 6.18% 6.84%
MSCI EAFE Growth 8.48% 28.43% 8.13% 8.26%
MSCI EAFE Value 7.87% 16.83% 4.15% 5.34%
MSCI Europe 8.89% 24.59% 5.69% 6.62%
MSCI Japan 7.51% 20.59% 7.95% 8.73%
S&P 500 9.07% 31.49% 11.69% 14.72%
MSCI Emerging Markets 11.93% 18.88% 6.00% 3.64%
Key Global Stock Market Index Returns (%) for the Period Ending 12/31/2019
International underperformed slightly in the fourth quarter, as the US continued its market leadership. International markets rose on positive trade
news and incremental improvement in European economic data. The MSCI EAFE Index (a benchmark for international developed markets) added
8.21% for US-currency investors.
In the fourth quarter, the MSCI Emerging Markets Index rose 11.93% for US-currency investors as a weakening US dollar provided a tailwind to
improving sentiment surrounding global growth and trade. The MSCI Europe Index gained 8.89% for US-currency investors, while the MSCI Japan
added 7.51%.
The S&P 500 Index gained 9.07% for the quarter.
Emerging economy equity market indices were up in the fourth quarter. The MSCI BRIC (Brazil, Russia, India and China) Index rose 13.18% in US
dollar terms, while the MSCI EM Asia Index gained 12.33%.
Global Equity Markets
As of 4Q 2019

Past performance is no guarantee of future results. Estimates of future performance are based on assumptions that may not be realized. This material is not a solicitation of any offer to buy or sell any security or other financial instrument or to participate in any trading strategy. Please refer to important information, disclosures and qualifications at the end of this material. This slide sourced from Market Performance section.
WEALTH MANAGEMENT INVESTMENT RESOURCES | CHARTBOOK | MARKET PERFORMANCE
Capital Markets Overview: 4Q 2019
INDEX IN USD Quarter 12 Months5-Years
(Annualized)
7-Years
(Annualized)
Bloomberg Barclays Capital US Aggregate 0.18% 8.72% 3.06% 2.72%
Bloomberg Barclays Capital High Yield 2.61% 14.32% 6.13% 5.78%
Bloomberg Barclays Capital Government/Credit -0.03% 9.70% 3.24% 2.80%
Bloomberg Barclays Capital Government -0.79% 6.86% 2.37% 1.99%
Bloomberg Barclays Capital Intermediate Govt/Credit 0.37% 6.82% 2.59% 2.16%
Bloomberg Barclays Capital Long Govt/Credit -1.12% 19.59% 5.43% 5.09%
Bloomberg Barclays Capital Mortgage Backed Securities 0.71% 6.35% 2.60% 2.48%
Bloomberg Barclays Capital Muni 0.74% 7.54% 3.54% 3.40%
Key US Bond Market Index Returns (%) for the Period Ending 12/31/2019
The bond market was flat in the fourth quarter as the Fed meeting expectations and improving sentiment surrounding global growth kept bond
yields steady to slightly higher across the curve. The Bloomberg Barclays US Aggregate Bond Index, a general measure of the bond market, rose
0.18%.
Interest rates rose during the fourth quarter, as the yield on the 10-year US Treasury note rose to a quarter-end 1.91% from 1.66% at the end of
September. The shortest end of the curve fell as the Fed cut their Fed funds target rate, with the yield on 3-month Treasury bills falling to 1.54%
from 1.81%, re-steepening the yield curve as measured by the 10-year and the 3-month tenors.
Riskier parts of the bond market such as US high yield debt rose in the fourth quarter, buoyed by the market’s risk-on sentiment. The Bloomberg
Barclays Capital High Yield Index, a measure of lower-rated corporate bonds, gained 2.61%.
Mortgage-backed continued to show modest gains in the fourth quarter. The Bloomberg Barclays Capital Mortgage-Backed Securities Index rose
0.71%. Municipal bonds were also up; the Bloomberg Barclays Capital Muni Index saw gains of 0.74%.
The US Bond Market
As of 4Q 2019
Source: FactSet, Bloomberg, Morgan Stanley & Co. Research, Morgan Stanley Wealth Management GIC

!"#$%&'($%)*+&,*$)(-& $%$#*.*%(&/0&(-*&("$1*&%$.*&!2& !"#$%&'($%)*+&'./(-&3$"%*+&4456&$&"*#/0(*"*1&7"!8*"91*$)*"&/%&(-*&:%/(*1&'($(*0;
!"# $%&# '()'%$# %* +",$ -.+#),.& ,$ +% ,/*%)-0 ./1 ,+ ,/ /% 2.3 ,$ ,/+#/1#1 +% 4# ./ %5#) %) $%&,6,+.+,%/ +% '()6".$# %) $#&& ./3 $#6(),+30 %+"#) ,/7#$+-#/+ %) $#)7,6#0 %) +% .++).6+ ./3 *(/1$ %) 1#'%$,+$8
9/7#$+-#/+$ -#/+,%/#1 -.3 /%+ 4# $(,+.4&# *%) .&& 6&,#/+$8 :/3 ')%1(6+ 1,$6($$#1 "#)#,/ -.3 4# '()6".$#1 %/&3 .*+#) . 6&,#/+ ".$ 6.)#*(&&3 )#7,#2#1 +"# %5#),/; -#-%)./1(- ./1 #<#6(+#1 +"#
$(4$6),'+,%/ 1%6(-#/+$8 =%);./ >+./ ?#.&+" =./.;#-#/+ ".$ /%+ 6%/$,1#)#1 +"# .6+(.& %) 1#$,)#1 ,/7#$+-#/+ %4@#6+,7#$0 ;%.&$0 $+).+#;,#$0 ;(,1#&,/#$0 %) *.6+(.& 6,)6(-$+./6#$ %* ./3 ,/7#$+%) ,/
./3 *(/1A$B8 C#*%)# -.D,/; ./3 ,/7#$+-#/+0 #.6" ,/7#$+%) $"%(&1 6.)#*(&&3 6%/$,1#) +"# ),$D$ .$$%6,.+#1 2,+" +"# ,/7#$+-#/+0 .$ 1,$6($$#1 ,/ +"# .''&,6.4&# %5#),/; -#-%)./1(-0 ./1 -.D# .
1#+#)-,/.+,%/ 4.$#1 ('%/ +"#,) %2/ '.)+,6(&.) 6,)6(-$+./6#$0 +".+ +"# ,/7#$+-#/+ ,$ 6%/$,$+#/+ 2,+" +"#,) ,/7#$+-#/+ %4@#6+,7#$ ./1 ),$D +%&#)./6#8 =%);./ >+./ >-,+" C.)/#3 EEF %5#)$
,/7#$+-#/+ ')%;).- $#)7,6#$ +")%(;" . 7.),#+3 %* ,/7#$+-#/+ ')%;).-$0 2",6" .)# %'#/#1 '()$(./+ +% 2),++#/ 6&,#/+ .;)##-#/+$8 G.6" ')%;).- %5#)$ ,/7#$+-#/+ -./.;#)$0 *(/1$ ./1 *#.+()#$ +".+
.)# /%+ .7.,&.4&# ,/ %+"#) ')%;).-$H 6%/7#)$#&30 $%-# ,/7#$+-#/+ -./.;#)$0 *(/1$ %) ,/7#$+-#/+ $+).+#;,#$ -.3 4# .7.,&.4&# ,/ -%)# +"./ %/# ')%;).-8
=%);./ >+./I$ ,/7#$+-#/+ .17,$%)3 ')%;).-$ -.3 )#J(,)# . -,/,-(- .$$#+ #& ./10 1#'#/1,/; %/ 3%() $'#6,K6 ,/7#$+-#/+ %4@#6+,7#$ ./1 K/./6,.& '%$,+,%/0 -.3 /%+ 4# $(,+.4&# *%) 3%(8 L&#.$#
$## +"# =%);./ >+./ >-,+" C.)/#3 EEF ')%;).- 1,$6&%$()# 4)%6"()# A+"# M=%);./ >+./ :NOPB *%) -%)# ,/*%)-.+,%/ ,/ +"# ,/7#$+-#/+ .17,$%)3 ')%;).-$ .7.,&.4 !"# =%);./ >+./ :NO ,$
.7.,&.4&# .+ 2228-%);./$+./Ƃ%-Q:NO8 '!<"=*0&!2&>$($; 9/*%)-.+,%/ ,/ +",$ -.+#),.& ,/ +",$ )#'%)+ ".$ 4##/ %4+.,/#1 *)%- $%()6#$ +".+ 2# 4#&,#7# +% 4# )#&,.4� 4(+ 2# 1% /%+ ;(.)./+## ,+$
.66().630 6%-'&#+#/#$$ %) +,-#&,/#$$8 !",)1R'.)+3 1.+. ')%7,1#)$ -.D# /% 2.))./+,#$ %) )#')#$#/+.+,%/$ )#&.+,/; +% +"# .66().630 6%-'&#+#/#$$ %) +,-#&,/#$$ %* +"# 1.+. +"#3 ')%7,1# ./1 .)# /%+ &,.4&#
*%) ./3 1.-.;#$ )#&.+,/; +% +",$ 1.+.8 :&& %',/,%/$ ,/6&(1#1 ,/ +",$ -.+#),.& 6%/$+,+(+# +"# S,)-I$ @(1;-#/+ .$ %* +"# 1.+# %* +",$ -.+#),.& ./1 .)# $(4@#6+ +% 6"./;# 2,+"%(+ /%+,6# 8 !",$ -.+#),.& 2.$ /%+
')#'.)#1 43 +"# )#$#.)6" 1#'.)+-#/+$ %* =%);./ >+./ T F%8 EEF %) =%);./ >+./ >-,+" C.)/#3 EEF8 >%-# ",$+%),6.& K;()#$ -.3 4# )#7,$#1 1(# +% /#2&3 ,1#/+,K#1 ')%;).-$0 K)- )#$+.+#-#/+$0
#+68
?)!7$)&@%A*0(.*%(& $%$#*"&B%$)+0/0&C?@ BD&E!=<0&4/0(6&BFF"!A*1&4/0(&$%1&G$=(/=$)&HFF!"(<%/(/*0&4/0(I&,$(=-&J!)/=+; U9=: ($#$ +2% -#+"%1$ +% #7.&(.+# ,/7#$+-#/+ ')%1(6+$ ,/ .''&,6.4&#
.17,$%)3 ')%;).-$V E!=<0 A./1 ,/7#$+-#/+ ')%1(6+$ -##+,/; +",$ $+./1.)1 .)# 1#$6),4#1 .$ 4#,/; %/ +"# S%6($ E,$+B ./1 BFF"!A*1 A./1 ,/7#$+-#/+ ')%1(6+$ -##+,/; +",$ $+./1.)1 .)# 1#$6),4#1 .$
4#,/; %/ +"# :'')%7#1 E,$+B8 9/ ;#/#).&0 S%6($ #/+.,&$ . -%)# +"%)%(;" #7.&(.+,%/ %* ./ ,/7#$+-#/+ ')%1(6+ +"./ :'')%7#18 >%-#+,-#$ ./ ,/7#$+-#/+ ')%1(6+ -.3 4# #7.&(.+#1 ($,/; +"# S%6($ E,$+
')%6#$$ 4(+ +"#/ '&.6#1 %/ +"# :'')%7#1 E,$+ ,/$+#.1 %* +"# S%6($ E,$+8 9/7#$+-#/+ ')%1(6+$ -.3 -%7# *)%- +"# S%6($ E,$+ +% +"# :'')%7#1 E,$+0 %) 7,6# 7#)$.8 U9=: -.3 .&$% 1#+#)-,/# +".+ ./
,/7#$+-#/+ ')%1(6+ /% &%/;#) -##+$ +"# 6),+#),. (/1#) #,+"#) ')%6#$$ ./1 2,&& /% &%/;#) 4# )#6%--#/1#1 ,/ ,/7#$+-#/+ .17,$%)3 ')%;).-$ A,/ 2",6" 6.$# +"# ,/7#$+-#/+ ')%1(6+ ,$ ;,7#/ . MW%+
:'')%7#1P $+.+($B8 U9=: ".$ . X,$(=-P '%&,63 ./1 -.3 1#$6),4# . S%6($ E,$+ %) :'')%7#1 E,$+ ,/7#$+-#/+ ')%1(6+ .$ 4#,/; %/ M?.+6"P ,* U9=: ,1#/+,K#$ $'#6,K6 .)#.$ +".+ A.B -#),+ *()+"#) #7.&(.+,%/
43 U9=: ./1 A4B -.30 4(+ .)# /%+ 6#)+.,/ +%0 )#$(&+ ,/ +"# ,/7#$+-#/+ ')%1(6+ 4#6%-,/; MW%+ :'')%7#18P !"# ?.+6" '#),%1 1#'#/1$ %/ +"# &#/;+" %* +,-# /##1#1 *%) U9=: +% 6%/1(6+ ,+$ #7.&(.+,%/
./1 *%) +"# ,/7#$+-#/+ -./.;#) %) *(/1 +% .11)#$$ ./3 6%/6#)/$8 F#)+.,/ ,/7#$+-#/+ ')%1(6+$ %/ #,+"#) +"# S%6($ E,$+ %) :'')%7#1 E,$+ -.3 .&$% 4# )#6%--#/1#1 *%) +"# G$=(/=$)&HFF!"(<%/(/*0&4/0(
4.$#1 ,/ '.)+ %/ +.6+,6.& %''%)+(/,+,#$ #<,$+,/; .+ . ;,7#/ +,-#8 !"# ,/7#$+-#/+ ')%1(6+$ %/ +"# !.6+,6.& Y''%)+(/,+,#$ E,$+ 6"./;# %7#) +,-#8 S%) -%)# ,/*%)-.+,%/ %/ +"# S%6($ E,$+0 :'')%7#1 E,$+0
!.6+,6.& Y''%)+(/,+,#$ E,$+ ./1 ?.+6" ')%6#$$#$0 '&#.$# $## +"# .''&,6.4&# S%)- :NO N,$6&%$()# N%6(-#/+ *%) =%);./ >+./ ?#.&+" =./.;#-#/+8 Z%() S,/./6,.& :17,$%) %) L),7.+# ?#.&+" :17,$%)
6./ .&$% ')%7,1# ('%/ )#J(#$+ . 6%'3 %* . '(4&,6.+,%/ #/+,+ M=./.;#) >#+,%/ L)%6#$$8P
!"# ?)!7$)&@%A*0(.*%(&5!../((** ,$ . ;)%(' %* $#.$%/#1 ,/7#$+-#/+ ')%*#$$,%/.&$ 2"% -##+ )#;(&.)&3 +% 1,$6($$ +"# ;&%4.& #6%/%-3 ./1 -.)D#+$8 !"# 6%--,++## 1#+#)-,/#$ +"# ,/7#$+-#/+
%(+&%%D +".+ ;(,1#$ %() .17,6# +% 6&,#/+$8 !"#3 6%/+,/(.&&3 -%/,+%) 1#7#&%',/; #6%/%-,6 ./1 -.)D#+ 6%/1,+,%/$0 )#7,#2 +.6+,6.& %(+&%%D$ ./1 )#6%--#/1 -%1#& '%)+*%&,% 2#,;"+,/;$0 .$ 2#&& .$
')%1(6# . $(,+# %* $+).+#;30 ./.&3$,$0 6%--#/+.)30 '%)+*%&,% '%$,+,%/,/; $(;;#$+,%/$ ./1 %+"#) )#'%)+$ ./1 4)%.16.$+$8
!"# U9F :$$#+ :&&%6.+,%/ =%1#&$ .)# /%+ .7.,&.4&# +% 4# 1,)#6+&3 ,-'&#-#/+#1 .$ '.)+ %* ./ ,/7#$+-#/+ .17,$%)3 $#)7,6# ./1 $"%(&1 /%+ 4# )#;.)1#1 .$ . )#6%--#/1.+,%/ %* ./3 =%);./ >+./
,/7#$+-#/+ .17,$%)3 $#)7,6#8 !"# U9F :$$#+ :&&%6.+,%/ =%1#&$ 1% /%+ )#')#$#/+ .6+(.& +).1,/; %) ./3 +3'# %* .66%(/+ %) ./3 +3'# %* ,/7#$+-#/+ $+).+#;,#$ ./1 /%/# %* +"# *##$ %) %+"#) #<'#/$#$ A# 8;8
6%--,$$,%/$0 -.)DR('$0 -.)DR1%2/$0 .17,$%)3 *##$0 *(/1 #<'#/$#$B .$$%6,.+#1 2,+" .6+(.& +).1,/; %) .66%(/+$ .)# )#[#6+#1 ,/ +"# U9F :$$#+ :&&%6.+,%/ =%1#&$ 2",6"0 2"#/ 6%-'%(/1#1 %7#) . '#),%1
%* 3#.)$0 2%(&1 1#6)#.$# )#+()/$8
B1A*"0*&B=(/A*&B)F-$&CBBBD ,$ . '.+#/+#1 $6)##/,/; ./1 $6%),/; ')%6#$$ 1#$,;/#1 +% "#&' ,1#/+,*3 ",;"RJ(.&,+3 #J(,+3 ./1 K<#1 ,/6%-# -./.;#)$ 2,+" 6".).6+#),$+,6$ +".+ -.3 &#.1 +% *(+()#
%(+'#)*%)-./6# )#&.+,7# +% ,/1#< ./1 '##)$8 ?",&# ",;"&3 )./D#1 -./.;#)$ '#)*%)-#1 2#&& .$ . ;)%(' ,/ %() :17#)$# :6+,7# :&'". -%1#& 4.6D +#$+$0 /%+ .&& %* +"# -./.;#)$ 2,&& %(+'#)*%)-8 L&#.$# /%+#
+".+ +",$ 1.+. -.3 4# 1#),7#1 *)%- 4.6DR+#$+,/;0 2",6" ".$ +"# 4#/#K+ %* ",/1$,;"+8 9/ .11,+,%/0 ",;"&3 )./D#1 -./.;#)$ 6./ ".7# 1,5#),/; ),$D ')%K&#$ +".+ -,;"+ /%+ 4# $(,+.4&# *%) .&& ,/7#$+%)$8 Y()
7,#2 ,$ +".+ :17#)$# :6+,7# :&'". ,$ . ;%%1 $+.)+,/; '%,/+ ./1 $"%(&1 4# ($#1 ,/ 6%/@(/6+,%/ 2,+" %+"#) ,/*%)-.+,%/ 8 =%);./ >+./ ?#.&+" =./.;#-#/+I$ J(.&,+.+,7# ./1 J(./+,+.+,7# ,/7#$+-#/+
-./.;#) 1(# 1,&,;#/6# ')%6#$$ .)# #J(.&&3 ,-'%)+./+ *.6+%)$ *%) ,/7#$+%)$ 2"#/ 6%/$,1#),/; -./.;#)$ *%) ($# +")%(;" ./ ,/7#$+-#/+ .17,$%)3 ')%;).-8 S.6+%)$ ,/6&(1,/;0 4(+ /%+ &,-,+#1 +%0 -./.;#)
+()/%7#) ./1 6"./;#$ +% ,/7#$+-#/+ ')%6#$$ 6./ '.)+,.&&3 %) *(&&3 /#;.+# . '%$,+,7# :17#)$# :6+,7# :&'". )./D,/;8 :11,+,%/.&&30 ",;"&3 )./D#1 -./.;#)$ 6./ ".7# 1,5#),/; ),$D ')%K&#$ +".+ -,;"+ /%+ 4#
!"#$%"&'("

$(,+.4&# *%) .&& ,/7#$+%)$8 S%) -%)# ,/*%)-.+,%/ %/ :::0 '&#.$# $## +"# :17#)$# :6+,7# :&'". \./D,/; =%1#& ./1 >#+,/; =./.;#)$ 2,+" :17#)$# :6+,7# :&'". 2",+#'.'#)$8 !"# 2",+#'.'#) .)#
.7.,&.4&# *)%- 3%() S,/./6,.& :17,$%) %) L),7.+# ?#.&+" :17,$%)8 :NOG\>G :F!9OG :EL]: ,$ . )#;,$+#)#1 $#)7,6# -.)D %* =%);./ >+./ ./1Q%) ,+$ .^&,.+#$8 _8>8 L.+8 W%8 `0abc0de` .''&,#$ +% +"#
:17#)$# :6+,7# :&'". $3$+#- ./1Q%) -#+"%1%&%;38
G-*&?)!7$)&@%A*0(.*%(& $%$#*"&B%$)+0/0&C?@ BD&'*"A/=*0&H%)+&BFF)+&(!&5*"($/%&@%A*0(.*%(&B1A/0!"+&J"!#"$.0 U9=: #7.&(.+#$ 6#)+.,/ ,/7#$+-#/+ ')%1(6+$ *%) +"# '()'%$#$ %* $%-# f 4(+ /%+ .&&
f %* =%);./ >+./ >-,+" C.)/#3 EEFI$ ,/7#$+-#/+ .17,$%)3 ')%;).-$ A.$ 1#$6),4#1 ,/ -%)# 1#+.,& ,/ +"# .''&,6.4&# S%)- :NO N,$6&%$()# N%6(-#/+ *%) =%);./ >+./ ?#.&+" =./.;#-#/+B8 9* 3%(
1% /%+ ,/7#$+ +")%(;" %/# %* +"#$# ,/7#$+-#/+ .17,$%)3 ')%;).-$0 =%);./ >+./ ?#.&+" =./.;#-#/+ ,$ /%+ %4&,;.+#1 +% ')%7,1# 3%( /%+,6# %* ./3 U9=: >+.+($ 6"./;#$ #7#/ +"%(;" ,+ -.3 ;,7#
/%+,6# +% 6&,#/+$ ,/ %+"#) ')%;).-$8
'("$(*#+& $+&3*&BA$/)$7)*&$0&$&'*F$"$(*)+& $%$#*1&B==!<%(&!"& <(<$)&E<%1 >+).+#;,#$ .)# $%-#+,-#$ .7.,&.4&# ,/ =%);./ >+./ ?#.&+" =./.;#-#/+ ,/7#$+-#/+ .17,$%)3 ')%;).-$ 4%+" ,/ +"#
*%)- %* . $#'.).+#&3 -./.;#1 .66%(/+ AM>=:PB ./1 . -(+(.& *(/18 !"#$# -.3 ".7# 1,5#)#/+ #<'#/$#$ ./1 ,/7#$+-#/+ -,/,-(-$8 Z%() S,/./6,.& :17,$%) %) L),7.+# ?#.&+" :17,$%) 6./ ')%7,1# -%)#
,/*%)-.+,%/ %/ 2"#+"#) ./3 '.)+,6(&.) $+).+#;3 ,$ .7.,&.4&# ,/ -%)# +"./ %/# *%)- ,/ . '.)+,6(&.) ,/7#$+-#/+ .17,$%)3 ')%;).-8 9/ -%$+ =%);./ >+./ ?#.&+" =./.;#-#/+ ,/7#$+-#/+ .17,$%)3
.66%(/+$0 *##$ .)# 1#1(6+#1 J(.)+#)&3 ./1 ".7# . 6%-'%(/1,/; #5#6+ %/ '#)*%)-./6#8 S%) #<.-'� %/ ./ .17,$%)3 .66%(/+ 2,+" . gh .//(.& *##0 ,* +"# ;)%$$ .//(.& '#)*%)-./6# ,$ c8ddh0 +"#
6%-'%(/1,/; #5#6+ %* +"# *##$ 2,&& )#$(&+ ,/ . /#+ '#)*%)-./6# %* .'')%<,-.+#&3 g8egh .*+#) %/# 3#.)0 i .*+#) +")## 3#.)$0 ./1 ji8jgh .*+#) K7# 3#.)$8 5!%K/=(0&!2&@%(*"*0(L U9=:I$ ;%.& ,$ +% ')%7,1#
')%*#$$,%/.&0 %4@#6+,7# #7.&(.+,%/$ ,/ $(''%)+ %* +"# =%);./ >+./ ?#.&+" =./.;#-#/+ ,/7#$+-#/+ .17,$%)3 ')%;).-$8 ?# ".7# '%&,6,#$ ./1 ')%6#1()#$ +% "#&' ($ -##+ +",$ ;%.&8 ]%2#7#)0 %()
4($,/#$$ ,$ $(4@#6+ +% 7.),%($ 6%/[,6+$ %* ,/+#)#$+8 S%) #<.-'� ,1#.$ ./1 $(;;#$+,%/$ *%) 2",6" ,/7#$+-#/+ ')%1(6+$ $"%(&1 4# #7.&(.+#1 43 U9=: 6%-# *)%- . 7.),#+3 %* $%()6#$0 ,/6&(1,/; %() =%);./
>+./ ?#.&+" =./.;#-#/+ S,/./6,.& :17,$%)$ ./1 +"#,) 1,)#6+ %) ,/1,)#6+ -./.;#)$0 ./1 %+"#) 4($,/#$$ '#)$%/$ 2,+",/ =%);./ >+./ ?#.&+" =./.;#-#/+ %) ,+$ .^&,.+#$8 >(6" '#)$%/$ -.3 ".7# ./
%/;%,/; 4($,/#$$ )#&.+,%/$",' 2,+" 6#)+.,/ ,/7#$+-#/+ -./.;#)$ %) -(+(.& *(/1 6%-'./,#$ 2"#)#43 +"#30 =%);./ >+./ ?#.&+" =./.;#-#/+ %) ,+$ .^&,.+#$ )#6#,7# 6%-'#/$.+,%/ *)%-0 %)
%+"#)2,$# )#&.+#1 +%0 +"%$# ,/7#$+-#/+ -./.;#)$ %) -(+(.& *(/1$8 S%) #<.-'� . S,/./6,.& :17,$%) -.3 $(;;#$+ +".+ U9=: #7.&(.+#$ ./ ,/7#$+-#/+ -./.;#) %) *(/1 ,/ 2",6" . '%)+,%/ %* ",$ %) "#)
6&,#/+$I .$$#+$ .)# .&)#.13 ,/7#$+#18 ?",&# $(6" . )#6%--#/1.+,%/ ,$ '#)-,$$,4� U9=: ,$ )#$'%/$,4&# *%) +"# %',/,%/$ #<')#$$#1 43 U9=:8 >## +"# 6%/[,6+$ %* ,/+#)#$+ $#6+,%/ ,/ +"# .''&,6.4&# S%)-
:NO N,$6&%$()# N%6(-#/+ *%) =%);./ >+./ ?#.&+" =./.;#-#/+ *%) . 1,$6($$,%/ %* %+"#) +3'#$ %* 6%/[,6+$ +".+ -.3 4# )#./+ +% U9=:I$ #7.&(.+,%/ %* -./.;#)$ ./1 *(/1$8 9/ .11,+,%/0 =%);./
>+./ ?#.&+" =./.;#-#/+0 => T F%80 -./.;#)$ ./1 +"#,) .^&,.+#$ ')%7,1# . 7.),#+3 %* $#)7,6#$ A,/6&(1,/; )#$#.)6"0 4)%D#).;#0 .$$#+ -./.;#-#/+0 +).1,/;0 &#/1,/; ./1 ,/7#$+-#/+ 4./D,/; $#)7,6#$B
*%) #.6" %+"#) ./1 *%) 7.),%($ 6&,#/+$0 ,/6&(1,/; ,$$(#)$ %* $#6(),+,#$ +".+ -.3 4# )#6%--#/1#1 *%) '()6".$# %) $.&# 43 6&,#/+$ %) .)# %+"#)2,$# "#&1 ,/ 6&,#/+ .66%(/+$0 ./1 -./.;#)$ ,/ 7.),%($ .17,$%)3
')%;).-$8 =%);./ >+./ ?#.&+" =./.;#-#/+0 -./.;#)$0 => T F%80 ./1 +"#,) .^&,.+#$ )#6#,7# 6%-'#/$.+,%/ ./1 *##$ ,/ 6%//#6+,%/ 2,+" +"#$# $#)7,6#$8 =%);./ >+./ ?#.&+" =./.;#-#/+
4#&,#7#$ +".+ +"# /.+()# ./1 )./;# %* 6&,#/+$ +% 2",6" $(6" $#)7,6#$ .)# )#/1#)#1 ,$ $(6" +".+ ,+ 2%(&1 4# ,/.17,$.4&# +% #<6&(1# 6.+#;%),6.&&3 .&& %* +"#$# 6%-'./,#$ *)%- ./ .66%(/+ 8
=%);./ >+./ 6".);#$ #.6" *(/1 *.-,&3 2# %5#) . -(+(.& *(/1 $(''%)+ *##0 .&$% 6.& . M)#7#/(#R$".),/; '.3-#/+0P %/ 6&,#/+ .66%(/+ "%&1,/;$ ,/ *(/1 *.-,&,#$ .66%)1,/; +% . +,#)#1 ).+# +".+
,/6)#.$#$ .&%/; 2,+" +"# -./.;#-#/+ *## %* +"# *(/1 $% +".+ &%2#) -./.;#-#/+ *## *(/1$ '.3 &%2#) ).+#$ +"./ +"%$# 2,+" ",;"#) -./.;#-#/+ *##$8
5!%0/1*"&M!<"&HN%&@%A*0(.*%(&O**10L !"# -%1#& '%)+*%&,%$ ./1 $+).+#;,#$ 1,$6($$#1 ,/ +"# -.+#),.& .)# *%)-(&.+#1 4.$#1 %/ ;#/#).& 6&,#/+ 6".).6+#),$+,6$ ,/6&(1,/; ),$D +%&#)./6# 8 !",$ -.+#),.& ,$ /%+
,/+#/1#1 +% 4# . 6&,#/+R$'#6,K6 $(,+.4,&,+3 ./.&3$,$ %) )#6%--#/1.+,%/0 %) %5#) +% '.)+,6,'.+# ,/ ./3 ,/7#$+-#/+8 !"#)#*%)#0 6&,#/+$ $"%(&1 /%+ ($# +",$ ')%K&# .$ +"# $%&# 4.$,$ *%) ,/7#$+-#/+ 1#6,$,%/$8
!"#3 $"%(&1 6%/$,1#) .&& )#./+ ,/*%)-.+,%/0 ,/6&(1,/; +"#,) #<,$+,/; '%)+*%&,%0 ,/7#$+-#/+ %4@#6+,7#$0 ),$D +%&#)./6#0 &,J(,1,+3 /##1$ ./1 ,/7#$+-#/+ +,-# "%),k%/8 >(6" . $(,+.4,&,+3 1#+#)-,/.+,%/ -.3
&#.1 +% .$$#+ .&&%6.+,%/ )#$(&+$ +".+ .)# -.+#),.&&3 1,5#)#/+ *)%- +"# .$$#+ .&&%6.+,%/ $"%2/ ,/ +",$ ')%K !.&D +% 3%() S,/./6,.& :17,$%) .4%(+ 2".+ 2%(&1 4# . $(,+.4&# .$$#+ .&&%6.+,%/ *%) 3%(0 2"#+"#)
FUF= ,$ . $(,+.4&# ')%;).- *%) 3%(8
O!&!7)/#$(/!%&(!&%!(/2+ f =%);./ >+./ ?#.&+" =./.;#-#/+ ".$ /% %4&,;.+,%/ +% /%+,*3 3%( 2"#/ +"# -%1#& '%)+*%&,%$0 $+).+#;,#$0 %) ./3 %+"#) ,/*%)-.+,%/0 ,/ +",$ -.+#),.& 6"./;#$8
J)*$0*&=!%0/1*"&(-*&/%A*0(.*%(&!7P*=(/A*06&"/0806&2**06&$%1&=-$"#*0&$%1&*QF*%0*0&!2&.<(<$)&2<%106&RGE06&=)!0*1&*%1&2<%106&<%/(&/%A*0(.*%(&("<0(06&$%1&A$"/$7)*&/%0<"$%=*&F"!1<=(0&=$"*2<))+&
7*2!"*&/%A*0(/%#;&G-*&F"!0F*=(<0&=!%($/%0&(-/0&$%1&!(-*"&/%2!".$(/!%&$7!<(&*$=-&2<%1;&G!&!7($/%&$&F"!0F*=(<06&=!%($=(&+!<"&E/%$%=/$)&B1A/0!"&!"&J"/A$(*&,*$)(-&B1A/0!"&!"&A/0/(&(-*& !"#$%&
'($%)*+&N*70/(*&$( 2228-%);./$+./Ƃ%-;&J)*$0*&"*$1&/(&=$"*2<))+&7*2!"*&/%A*0(/%#;
!"#!$%&'(%!'"#!")"(*!%+"(),-%'"./!0"#&"!*'"#!&/,%0"*,"1/),)!'%%0"2+"'3%"4%0%,)5"6%7*&#'"8!&/,)!9%":*,7*,)'#*!"*,")!+"*'3%,"1*$%,!(%!'")1%!9+;" 5'3*/13"'3%"4/!0"&%%-&"'*"7,%&%,$%"'3%"$)5/%"*."
+*/,"#!$%&'(%!'")'"<=;>>"7%,"&3),%?"#'"#&"7*&%"'*"5*&%"(*!%+"2+"#!$%&'#!1"#!"'3%"./!0;
!"# +3'# %* -(+(.& *(/1$ ./1 G!S$ 1,$6($$#1 ,/ +",$ ')#$#/+.+,%/ (+,&,k#$ /%/+).1,+,%/.& %) 6%-'&#< ,/7#$+-#/+ $+).+#;,#$ ./1 Q%) 1#),7.+,7#$8 G<.-'&#$ %* +"#$# +3'#$ %* *(/1$ ,/6&(1# +"%$# +".+ (+,&,k#
!"#$%"&'("
%/# %) -%)# %* +"# 4#&%2 /%+#1 ,/7#$+-#/+ $+).+#;,#$ %) 6.+#;%),#$ %) 2",6" $##D #<'%$()# +% +"# *%&&%2,/; -.)D#+$V AiB 6%--%1,+,#$ A# 8;80 .;),6(&+().&0 #/#);3 ./1 -#+.&$B0 6())#/630 ')#6,%($ -#+.&$H
AjB -./.;#1 *(+()#$H AgB #).;#10 ,/7#)$# %) ,/7#)$# #).;#1H AlB 4#.) -.)D#+0 "#1;,/;0 &%/;R$"%)+ #J(,+30 -.)D#+ /#(+).&H AbB )#.& #$+.+#H AcB 7%&.+,&,+3 A$##D,/; #<'%$()# +% +"# FCYG O9m 9/1#<B8
9/7#$+%)$ $"%(&1 D##' ,/ -,/1 +".+ 2",&# -(+(.& *(/1$ ./1 G!S$ -.30 .+ +,-#$0 (+,&,k# /%/+).1,+,%/.& ,/7#$+-#/+ %'+,%/$ ./1 $+).+#;,#$0 +"#3 $"%(&1 /%+ 4# #J(.+#1 2,+" (/)#;,$+#)#1 '),7.+#&3 %5#)#1
.&+#)/.+,7# ,/7#$+-#/+$8 C#6.($# %* )#;(&.+%)3 &,-,+.+,%/$0 -(+(.& *(/1$ ./1 G!S$ +".+ $##D .&+#)/.+,7#R&,D# ,/7#$+-#/+ #<'%$()# -($+ (+,&,k# . -%)# &,-,+#1 ,/7#$+-#/+ (/,7#)$#8 :$ . )#$(&+0
,/7#$+-#/+ )#+()/$ ./1 '%)+*%&,% 6".).6+#),$+,6$ %* .&+#)/.+,7# -(+(.& *(/1$ ./1 G!S$ -.3 7.)3 *)%- +).1,+,%/.& "#1;# *(/1$ '()$(,/; $,-,&.) ,/7#$+-#/+ %4@#6+,7#$8 =%)#%7#)0 +).1,+,%/.& "#1;# *(/1$
".7# &,-,+#1 &,J(,1,+3 2,+" &%/; M&%6DR('P '#),%1$ .&&%2,/; +"#- +% '()$(# ,/7#$+-#/+ $+).+#;,#$ 2,+"%(+ ".7,/; +% *.6+%) ,/ +"# /##1 +% -##+ 6&,#/+ )#1#-'+,%/$ ./1 G!S$ +).1# %/ ./ #<6"./;# 8 Y/ +"#
%+"#) "./10 -(+(.& *(/1$ +3',6.&&3 -($+ -##+ 1.,&3 6&,#/+ )#1#-'+,%/$8 !",$ 1,5#),/; &,J(,1,+3 ')%K&# 6./ ".7# . -.+#),.& ,-'.6+ %/ +"# ,/7#$+-#/+ )#+()/$ ;#/#).+#1 43 . -(+(.& %) G!S '()$(,/; ./
.&+#)/.+,7# ,/7#$+,/; $+).+#;3 6%-'.)#1 2,+" . +).1,+,%/.& "#1;# *(/1 '()$(,/; +"# $.-# $+).+#;38
W%/+).1,+,%/.& ,/7#$+-#/+ %'+,%/$ ./1 $+).+#;,#$ .)# %*+#/ #-'&%3#1 43 . '%)+*%&,% -./.;#) +% *()+"#) . *(/1I$ ,/7#$+-#/+ %4@#6+,7# ./1 +% "#&' %5$#+ -.)D#+ ),$D$ 8 ]%2#7#)0 +"#$# *#.+()#$ -.3 4#
6%-'&#<0 -.D,/; ,+ -%)# 1,^6(&+ +% (/1#)$+./1 +"# *(/1I$ #$$#/+,.& 6".).6+#),$+,6$ ./1 ),$D$0 ./1 "%2 ,+ 2,&& '#)*%)- ,/ 1,5#)#/+ -.)D#+ #/7,)%/-#/+$ ./1 %7#) 7.),%($ '#),%1$ %* +,-#8 !"#3 -.3 .&$%
#<'%$# +"# *(/1 +% ,/6)#.$#1 7%&.+,&,+3 ./1 (/./+,6,'.+#1 ),$D$ '.)+,6(&.)&3 2"#/ ($#1 ,/ 6%-'&#< 6%-4,/.+,%/$ ./1Q%) .66%-'./,#1 43 +"# ($# %* 4%))%2,/; %) M#).;#8P
SRM&B''RG&54B''&5HO'@>RTBG@HO'&BO>&HGURT&T@'S'
9/7#$+,/; ,/ +"# -.)D#+$ #/+.,&$ +"# ),$D %* -.)D#+ 7%&.+,&,+38 !"# 7.&(# %* .&& +3'#$ %* ,/7#$+-#/+$0 ,/6&(1,/; $+%6D$0 -(+(.& *(/1$0 #<6"./;#R+).1#1 *(/1$ AMG!S$PB0 6&%$#1R#/1 *(/1$0 ./1 (/,+
,/7#$+-#/+ +)($+$0 -.3 ,/6)#.$# %) 1#6)#.$# %7#) 7.)3,/; +,-# '#),%1$8 !% +"# #<+#/+ +"# ,/7#$+-#/+$ 1#',6+#1 "#)#,/ )#')#$#/+ /%(*"%$(/!%$)&0*=<"/(/*00 3%( $"%(&1 4# .2.)# +".+ +"#)# -.3 4#
.11,+,%/.& ),$D$ .$$%6,.+#1 2,+" ,/+#)/.+,%/.& ,/7#$+,/;0 ,/6&(1,/; *%)#,;/ #6%/%-,60 '%&,+,6.&0 -%/#+.)3 ./1Q%) &#;.& *.6+%)$0 6"./;,/; 6())#/63 #<6"./;# ).+#$0 *%)#,;/ +.<#$0 ./1 1,5#)#/6#$ ,/
K/./6,.& ./1 .66%(/+,/; $+./1.)1$8 !"#$# ),$D$ -.3 4# -.;/,K#1 ,/ *.*"#/%#&.$"8*(0&$%1&2"!%(/*"&.$"8*(08 '.$))9&$%1&./19=$F/($)/V$(/!%&=!.F$%/*0 -.3 &.6D +"# K/./6,.& )#$%()6#$0 ')%1(6+
1,7#)$,K6.+,%/ ./1 6%-'#+,+,7# $+)#/;+"$ %* &.);#) 6%-'./,#$8 9/ .11,+,%/0 +"# $#6(),+,#$ %* $-.&&R ./1 -,1R6.',+.&,k.+,%/ 6%-'./,#$ -.3 /%+ +).1# .$ )#.1,&3 .$0 ./1 4# $(4@#6+ +% ",;"#) 7%&.+,&,+3 +"./0
+"%$# %* &.);#)0 -%)# #$+.4&,$"#1 6%-'./,#$8 !"# 7.&(# %* WQ*1&/%=!.*&0*=<"/(/*0 2,&& [(6+(.+# ./10 ('%/ . $.� -.3 4# 2%)+" -%)# %) &#$$ +"./ +"#,) %),;,/.& 6%$+ %) -.+(),+3 7.&(#8 C%/1$ .)# $(4@#6+
+% ,/+#)#$+ ).+# ),$D0 6.&& ),$D0 )#,/7#$+-#/+ ),$D0 &,J(,1,+3 ),$D0 ./1 6)#1,+ ),$D %* +"# ,$$(#)8 U/#-&+/*)1&7!%10 .)# $(4@#6+ +% .11,+,%/.& ),$D$ $(6" .$ ,/6)#.$#1 ),$D %* 1#*.(&+ ./1 ;)#.+#) 7%&.+,&,+3 4#6.($#
%* +"# &%2#) 6)#1,+ J(.&,+3 %* +"# ,$$(#$8 9/ +"# 6.$# %* .<%/=/F$)&7!%100 ,/6%-# ,$ ;#/#).&&3 #<#-'+ *)%- *#1#).& ,/6%-# +.<#$8 >%-# ,/6%-# -.3 4# $(4@#6+ +% $+.+# ./1 &%6.& +.<#$ ./1 +% +"# *#1#).&
.&+#)/.+,7# -,/,-(- +.<8 F.',+.& ;.,/$0 ,* ./30 .)# $(4@#6+ +% +.<8 G"*$0<"+&@%K$(/!%&J"!(*=(/!%&'*=<"/(/*0X&CG@J'D 6%('%/ '.3-#/+$ ./1 (/1#)&3,/; '),/6,'.& .)# .(+%-.+,6.&&3 ,/6)#.$#1 +%
6%-'#/$.+# *%) ,/[.+,%/ 43 +).6D,/; +"# 6%/$(-#) '),6# ,/1#< AFL9B8 ?",&# +"# )#.& ).+# %* )#+()/ ,$ ;(.)./+##10 !9L> +#/1 +% %5#) . &%2 )#+()/8 C#6.($# +"# )#+()/ %* !9L> ,$ &,/D#1 +% ,/[.+,%/0 !9L>
-.3 $,;/,K6./+&3 (/1#)'#)*%)- 7#)$($ 6%/7#/+,%/.& _8>8 !)#.$(),#$ ,/ +,-#$ %* &%2 ,/[.+,%/8 !"#)# ,$ /% ;(.)./+## +".+ ,/7#$+%)$ 2,&& )#6#,7# '.) ,* !9L> .)# $%&1 '),%) +% -.+(),+38 !"# )#+()/$ %/ .
'%)+*%&,% 6%/$,$+,/; '),-.),&3 %* *%A/"!%.*%($)6&0!=/$)6&$%1&#!A*"%$%=*9$N$"*&/%A*0(.*%(0&CYR'?ZD -.3 4# &%2#) %) ",;"#) +"./ . '%)+*%&,% +".+ ,$ -%)# 1,7#)$,K#1 %) 2"#)# 1#6,$,%/$ .)# 4.$#1
$%&#&3 %/ ,/7#$+-#/+ 6%/$,1#).+,%/$8 C#6.($# G>U 6),+#),. #<6&(1# $%-# ,/7#$+-#/+$0 ,/7#$+%)$ -.3 /%+ 4# .4&# +% +.D# .17./+.;# %* +"# $.-# %''%)+(/,+,#$ %) -.)D#+ +)#/1$ .$ ,/7#$+%)$ +".+ 1% /%+
($# $(6" 6),+#),.8 !"# 6%-'./,#$ ,1#/+,K#1 ./1 ,/7#$+-#/+ #<.-'&#$ .)# *%) ,&&($+).+,7# '()'%$#$ %/&3 ./1 $"%(&1 /%+ 4# 1##-#1 . )#6%--#/1.+,%/ +% '()6".$# 0 "%&1 %) $#&& ./3 $#6(),+,#$ %)
,/7#$+-#/+ ')%1(6+$8 !"#3 .)# ,/+#/1#1 +% 1#-%/$+).+# +"# .'')%.6"#$ +.D#/ 43 -./.;#)$ 2"% *%6($ %/ G>U 6),+#),. ,/ +"#,) ,/7#$+-#/+ $+).+#;38 !"#)# 6./ 4# /% ;(.)./+## +".+ . 6&,#/+n$ .66%(/+
2,&& 4# -./.;#1 .$ 1#$6),4#1 "#)#,/8 HF(/!%0 ./1 -.);,/ +).1,/; ,/7%&7# $(4$+./+,.& ),$D ./1 .)# /%+ $(,+.4&# *%) .&& ,/7#$+%)$8 C#$,1#$ +"# ;#/#).& ,/7#$+-#/+ ),$D %* "%&1,/; $#6(),+,#$ +".+ -.3 1#6&,/#
,/ 7.&(# ./1 +"# '%$$,4&# &%$$ %* '),/6,'.& ,/7#$+#10 =)!0*19*%1&2<%10 -.3 ".7# .11,+,%/.& ),$D$ )#&.+#1 +% 1#6&,/,/; -.)D#+ '),6#$ )#&.+,7# +% /#+ .$$#+ 7.&(#$ AW:O$B0 .6+,7# -./.;#) (/1#)'#)*%)-./6#
./1 '%+#/+,.& #).;#8 F&%$#1R#/1 *(/1$0 (/&,D# %'#/R#/1 *(/1$0 .)# /%+ 6%/+,/(%($&3 %5#)#18 !"#)# ,$ . %/#R+,-# '(4&,6 %5#),/; ./1 %/6# ,$$(#10 $".)#$ %* 6&%$#1R#/1 *(/1$ .)# $%&1 ,/ +"# %'#/
-.)D#+ +")%(;" . $+%6D #<6"./;#8 W:O ,$ +%+.& .$$#+$ &#$$ +%+.& &,.4,&,+,#$ 1,7,1#1 43 +"# /(-4#) %* $".)#$ %(+$+./1,/;8 :+ +"# +,-# ./ ,/7#$+%) '()6".$#$ $".)#$ %* . 6&%$#1R#/1 *(/10 $".)#$ -.3 ".7# .
-.)D#+ '),6# +".+ ,$ .4%7# %) 4#&%2 W:O8 L%)+*%&,%$ +".+ ,/7#$+ . &.);# '#)6#/+.;# %* .$$#+$ ,/ %/&3 %/# ,/1($+)3 0*=(!" A%) ,/ %/&3 . *#2 $#6+%)$B .)# -%)# 7(&/#).4&# +% '),6# [(6+(.+,%/ +"./ +"%$# +".+
1,7#)$,*3 .-%/; . 4)%.1 )./;# %* $#6+%)$8
B)(*"%$(/A*&/%A*0(.*%(0 %*+#/ .)# $'#6(&.+,7# ./1 ,/6&(1# . ",;" 1#;)## %* ),$D8 9/7#$+%)$ 6%(&1 &%$# .&& %) . $(4$+./+,.& .-%(/+ %* +"#,) ,/7#$+-#/+8 :&+#)/.+,7# ,/7#$+-#/+$ .)# $(,+.4&# %/&3 *%)
#&,;,4� &%/;R+#)- ,/7#$+%)$ 2"% .)# 2,&&,/; +% *%);% &,J(,1,+3 ./1 '(+ 6.',+.& .+ ),$D *%) ./ ,/1#K/,+# '#),%1 %* +,-#8 !"#3 -.3 4# ",;"&3 ,&&,J(,1 ./1 6./ #/;.;# ,/ #).;# ./1 %+"#) $'#6(&.+,7#
').6+,6#$ +".+ -.3 ,/6)#.$# +"# 7%&.+,&,+3 ./1 ),$D %* &%$$8 :&+#)/.+,7# 9/7#$+-#/+$ +3',6.&&3 ".7# ",;"#) *##$ +"./ +).1,+,%/.& ,/7#$+-#/+$8 9/7#$+%)$ $"%(&1 6.)#*(&&3 )#7,#2 ./1 6%/$,1#) '%+#/+,.& ),$D$
4#*%)# ,/7#$+,/;8 F#)+.,/ %* +"#$# ),$D$ -.3 ,/6&(1# 4(+ .)# /%+ &,-,+#1 +%V E%$$ %* .&& %) . $(4$+./+,.& '%)+,%/ %* +"# ,/7#$+-#/+ 1(# +% #).;,/;0 $"%)+R$#&&,/;0 %) %+"#) $'#6(&.+,7# ').6+,6#$H E.6D %*
&,J(,1,+3 ,/ +".+ +"#)# -.3 4# /% $#6%/1.)3 -.)D#+ *%) . *(/1H O%&.+,&,+3 %* )#+()/$H \#$+),6+,%/$ %/ +)./$*#)),/; ,/+#)#$+$ ,/ . *(/1H L%+#/+,.& &.6D %* 1,7#)$,K6.+,%/ ./1 )#$(&+,/; ",;"#) ),$D 1(# +%
6%/6#/+).+,%/ %* +).1,/; .(+"%),+3 2"#/ . $,/;&# .17,$%) ,$ (+,&,k#1H :4$#/6# %* ,/*%)-.+,%/ )#;.)1,/; 7.&(.+,%/$ ./1 '),6,/;H F%-'&#< +.< $+)(6+()#$ ./1 1#&.3$ ,/ +.< )#'%)+,/;H E#$$ )#;(&.+,%/ ./1
",;"#) *##$ +"./ -(+(.& *(/1$H \,$D$ .$$%6,.+#1 2,+" +"# %'#).+,%/$0 '#)$%//#&0 ./1 ')%6#$$#$ %* +"# -./.;#)H ./1 \,$D$ .$$%6,.+#1 2,+" 634#)$#6(),+38 :$ . 1,7#)$,K#1 ;&%4.& K/./6,.& $#)7,6#$ K)-0
=%);./ >+./ ?#.&+" =./.;#-#/+ #/;.;#$ ,/ . 4)%.1 $'#6+)(- %* .6+,7,+,#$ ,/6&(1,/; K/./6,.& .17,$%)3 $#)7,6#$0 ,/7#$+-#/+ -./.;#-#/+ .6+,7,+,#$0 $'%/$%),/; ./1 -./.;,/; '),7.+# ,/7#$+-#/+
!"#$%"&'("

*(/1$0 #/;.;,/; ,/ 4)%D#)R1#.&#) +)./$.6+,%/$ ./1 '),/6,'.& $#6(),+,#$0 6%--%1,+,#$ ./1 *%)#,;/ #<6"./;# +)./$.6+,%/$0 )#$#.)6" '(4&,6.+,%/0 ./1 %+"#) .6+,7,+,#$8 9/ +"# %)1,/.)3 6%()$# %* ,+$ 4($,/#$$0
=%);./ >+./ ?#.&+" =./.;#-#/+ +"#)#*%)# #/;.;#$ ,/ .6+,7,+,#$ 2"#)# =%);./ >+./ ?#.&+" =./.;#-#/+I$ ,/+#)#$+$ -.3 6%/[,6+ 2,+" +"# ,/+#)#$+$ %* ,+$ 6&,#/+$ 0 ,/6&(1,/; +"# '),7.+#
,/7#$+-#/+ *(/1$ ,+ -./.;#$8 =%);./ >+./ ?#.&+" =./.;#-#/+ 6./ ;,7# /% .$$()./6# +".+ 6%/[,6+$ %* ,/+#)#$+ 2,&& 4# )#$%&7#1 ,/ *.7%) %* ,+$ 6&,#/+$ %) ./3 $(6" *(/18 :&& #<')#$$,%/$ %* %',/,%/ .)#
$(4@#6+ +% 6"./;# 2,+"%(+ /%+,6# ./1 .)# /%+ ,/+#/1#1 +% 4# . *%)#6.$+ %* *(+()# #7#/+$ %) )#$(&+$8 S()+"#)0 %',/,%/$ #<')#$$#1 "#)#,/ -.3 1,5#) *)%- +"# %',/,%/$ #<')#$$#1 43 =%);./ >+./ ?#.&+"
=./.;#-#/+ ./1Q%) %+"#) 4($,/#$$#$Q.^&,.+#$ %* =%);./ >+./ ?#.&+" =./.;#-#/+8 !",$ ,$ /%+ . o)#$#.)6" )#'%)+o .$ 1#K/#1 43 S9W\: \(&# jjli %) . o1#4+ )#$#.)6" )#'%)+o .$ 1#K/#1 43 S9W\:
\(&# jjlj ./1 2.$ /%+ ')#'.)#1 43 +"# \#$#.)6" N#'.)+-#/+$ %* =%);./ >+./ >-,+" C.)/#3 EEF %) =%);./ >+./ T F%8 EEF %) ,+$ .^&,.+#$8 F#)+.,/ ,/*%)-.+,%/ 6%/+.,/#1 "#)#,/ -.3 6%/$+,+(+#
*%)2.)1R&%%D,/; $+.+#-#/+$8 N(# +% 7.),%($ ),$D$ ./1 (/6#)+.,/+,#$0 .6+(.& #7#/+$0 )#$(&+$ %) +"# '#)*%)-./6# %* . *(/1 -.3 1,5#) -.+#),.&&3 *)%- +"%$# )#[#6+#1 %) 6%/+#-'&.+#1 ,/ $(6"
*%)2.)1R&%%D,/; $+.+#-#/+$8 F&,#/+$ $"%(&1 6.)#*(&&3 6%/$,1#) +"# ,/7#$+-#/+ %4@#6+,7#$0 ),$D$0 6".);#$0 ./1 #<'#/$#$ %* . *(/1 4#*%)# ,/7#$+,/;8 ?",&# +"# ]S\9 ,/1,6#$ .)# *)#J(#/+&3 ($#10 +"#3 ".7#
&,-,+.+,%/$ A$%-# %* 2",6" .)# +3',6.& %* %+"#) 2,1#&3 ($#1 ,/1,6#$B8 !"#$# &,-,+.+,%/$ ,/6&(1# $()7,7%)$",' 4,.$ A+"# )#+()/$ %* +"# ,/1,6#$ -.3 /%+ 4# )#')#$#/+.+,7# %* .&& +"# "#1;# *(/1$ ,/ +"# (/,7#)$#
4#6.($# %* +"# +#/1#/63 %* &%2#) '#)*%)-,/; *(/1$ +% &#.7# +"# ,/1#<BH "#+#)%;#/#,+3 A/%+ .&& "#1;# *(/1$ .)# .&,D# %) 6%-'.).4&# +% %/# ./%+"#)0 ./1 +"# ,/1#< -.3 /%+ .66().+#&3 )#[#6+ +"#
'#)*%)-./6# %* . 1#$6),4#1 $+3&#BH ./1 &,-,+#1 1.+. A-./3 "#1;# *(/1$ 1% /%+ )#'%)+ +% ,/1,6#$0 ./1 +"# ,/1#< -.3 %-,+ *(/1$0 +"# ,/6&($,%/ %* 2",6" -,;"+ $,;/,K6./+&3 .5#6+ +"# '#)*%)-./6# $"%2/8
!"# ]S\9 ,/1,6#$ .)# 4.$#1 %/ ,/*%)-.+,%/ $#&*R)#'%)+#1 43 "#1;# *(/1 -./.;#)$ +".+ 1#6,1# %/ +"#,) %2/0 .+ ./3 +,-#0 2"#+"#) %) /%+ +"#3 2./+ +% ')%7,1#0 %) 6%/+,/(# +% ')%7,1#0 ,/*%)-.+,%/ +% ]S\
:$$#+ =./.;#-#/+0 E8E8F8 \#$(&+$ *%) *(/1$ +".+ ;% %(+ %* 4($,/#$$ .)# ,/6&(1#1 ,/ +"# ,/1#< (/+,& +"# 1.+# +".+ +"#3 6#.$# %'#).+,%/$ 8 !"#)#*%)#0 +"#$# ,/1,6#$ -.3 /%+ 4# 6%-'&#+# %) .66().+#
)#')#$#/+.+,%/$ %* +"# "#1;# *(/1 (/,7#)$#0 ./1 -.3 4# 4,.$#1 ,/ $#7#).& 2.3$8 F%-'%$,+# ,/1#< )#$(&+$ .)# $"%2/ *%) ,&&($+).+,7# '()'%$#$ ./1 1% /%+ )#')#$#/+ +"# '#)*%)-./6# %* . $'#6,K6
,/7#$+-#/+8 9/1,7,1(.& *(/1$ ".7# $'#6,K6 +.< ),$D$ )#&.+#1 +% +"#,) ,/7#$+-#/+ ')%;).-$ +".+ 2,&& 7.)3 *)%- *(/1 +% *(/18 F&,#/+$ $"%(&1 6%/$(&+ +"#,) %2/ +.< ./1 &#;.& .17,$%)$ .$ =%);./ >+./
?#.&+" =./.;#-#/+ 1%#$ /%+ ')%7,1# +.< %) &#;.& .17,6#8 9/+#)#$+$ ,/ .&+#)/.+,7# ,/7#$+-#/+ ')%1(6+$ .)# %5#)#1 '()$(./+ +% +"# +#)-$ %* +"# .''&,6.4&# %5#),/; -#-%)./1(-0 .)# 1,$+),4(+#1 43
=%);./ >+./ ?#.&+" =./.;#-#/+ ./1 6#)+.,/ %* ,+$ .^&,.+#$0 ./1 AiB .)# /%+ SN9FR,/$()#10 AjB .)# /%+ 1#'%$,+$ %) %+"#) %4&,;.+,%/$ %* =%);./ >+./ ?#.&+" =./.;#-#/+ %) ./3 %* ,+$ .^&,.+#$0 AgB
.)# /%+ ;(.)./+##1 43 =%);./ >+./ ?#.&+" =./.;#-#/+ ./1 ,+$ .^&,.+#$0 ./1 AlB ,/7%&7# ,/7#$+-#/+ ),$D$0 ,/6&(1,/; '%$$,4&# &%$$ %* '),/6,'.&8 =%);./ >+./ ?#.&+" =./.;#-#/+ ,$ . )#;,$+#)#1
4)%D#)R1#.&#)0 /%+ . 4./D8 !",$ -.+#),.& ,$ /%+ +% 4# )#')%1(6#1 %) 1,$+),4(+#1 +% ./3 %+"#) '#)$%/$ A%+"#) +"./ ')%*#$$,%/.& .17,$%)$ %* +"# ,/7#$+%)$ %) ')%$'#6+,7# ,/7#$+%)$ 0 .$ .''&,6.4� )#6#,7,/;
+",$ -.+#),.&B ./1 ,$ ,/+#/1#1 $%&#&3 *%) +"# ($# %* +"# '#)$%/$ +% 2"%- ,+ ".$ 4##/ 1#&,7#)#18 !",$ -.+#),.& ,$ /%+ *%) 1,$+),4(+,%/ +% +"# ;#/#).& '(4&,68 L.$+ '#)*%)-./6# ,$ /% ;(.)./+## %* *(+()#
)#$(&+$8 :6+(.& )#$(&+$ -.3 7.)38 >9LF ,/$()./6# 1%#$ /%+ .''&3 +% ')#6,%($ -#+.&$0 %+"#) 6%--%1,+,#$0 %) +).1,+,%/.& .&+#)/.+,7# ,/7#$+-#/+$8 9/ F%/$(&+,/; U)%('I$ .17,$%)3 ')%;).-$0 .&+#)/.+,7#
,/7#$+-#/+$ .)# &,-,+#1 +% _>R)#;,$+#)#1 -(+(.& *(/1$0 $#'.).+# .66%(/+ $+).+#;,#$ ./1 #<6"./;#R+).1#1 *(/1$ AG!S$B +".+ $##D +% '()$(# .&+#)/.+,7# ,/7#$+-#/+ $+).+#;,#$ %) )#+()/$ (+,&,k,/; '(4&,6&3
+).1#1 $#6(),+,#$8 9/7#$+-#/+ ')%1(6+$ ,/ +",$ 6.+#;%)3 -.3 #-'&%3 7.),%($ ,/7#$+-#/+ $+).+#;,#$ ./1 +#6"/,J(#$ *%) 4%+" "#1;,/; ./1 -%)# $'#6(&.+,7# '()'%$#$ $(6" .$ $"%)+ R$#&&,/;0 #).;#0
1#),7.+,7#$ ./1 %'+,%/$0 2",6" 6./ ,/6)#.$# 7%&.+,&,+3 ./1 +"# ),$D %* ,/7#$+-#/+ &%$$8 :&+#)/.+,7# ,/7#$+-#/+$ .)# /%+ $(,+.4&# *%) .&& ,/7#$+%)$8 :$ . 1,7#)$,K#1 ;&%4.& K/./6,.& $#)7,6#$ K)-0 =%);./
>+./ ?#.&+" =./.;#-#/+ #/;.;#$ ,/ . 4)%.1 $'#6+)(- %* .6+,7,+,#$ ,/6&(1,/; K/./6,.& .17,$%)3 $#)7,6#$0 ,/7#$+-#/+ -./.;#-#/+ .6+,7,+,#$0 $'%/$%),/; ./1 -./.;,/; '),7.+# ,/7#$+-#/+ *(/1$0
#/;.;,/; ,/ 4)%D#)R1#.&#) +)./$.6+,%/$ ./1 '),/6,'.& $#6(),+,#$0 6%--%1,+,#$ ./1 *%)#,;/ #<6"./;# +)./$.6+,%/$0 )#$#.)6" '(4&,6.+,%/0 ./1 %+"#) .6+,7,+,#$8 9/ +"# %)1,/.)3 6%()$# %* ,+$ 4($,/#$$0 =%);./
>+./ ?#.&+" =./.;#-#/+ +"#)#*%)# #/;.;#$ ,/ .6+,7,+,#$ 2"#)# =%);./ >+./ ?#.&+" =./.;#-#/+I$ ,/+#)#$+$ -.3 6%/[,6+ 2,+" +"# ,/+#)#$+$ %* ,+$ 6&,#/+$ 0 ,/6&(1,/; +"# '),7.+# ,/7#$+-#/+ *(/1$
,+ -./.;#$8 =%);./ >+./ ?#.&+" =./.;#-#/+ 6./ ;,7# /% .$$()./6# +".+ 6%/[,6+$ %* ,/+#)#$+ 2,&& 4# )#$%&7#1 ,/ *.7%) %* ,+$ 6&,#/+$ %) ./3 $(6" *(/18 :&+#)/.+,7# ,/7#$+-#/+$ ,/7%&7# 6%-'&#< +.<
$+)(6+()#$0 +.< ,/#^6,#/+ ,/7#$+,/;0 ./1 1#&.3$ ,/ 1,$+),4(+,/; ,-'%)+./+ +.< ,/*%)-.+,%/8 9/1,7,1(.& *(/1$ ".7# $'#6,K6 ),$D$ )#&.+#1 +% +"#,) ,/7#$+-#/+ ')%;).-$ +".+ 2,&& 7.)3 *)%- *(/1 +% *(/18
F&,#/+$ $"%(&1 6%/$(&+ +"#,) %2/ +.< ./1 &#;.& .17,$%)$ .$ =%);./ >+./ ?#.&+" =./.;#-#/+ 1%#$ /%+ ')%7,1# +.< %) &#;.& .17,6#8
: -.@%),+3 %* :&+#)/.+,7# 9/7#$+-#/+ -./.;#)$ )#7,#2#1 ./1 $#+#1 43 U9=: '.3 %) 6.($# +% 4# '.,1 ./ %/;%,/; *## *%) 1,$+),4(+,%/ *)%- +"#,) -./.;#-#/+ *##$ +% =%);./ >+./ ?#.&+"
=./.;#-#/+ ,/ 6%//#6+,%/ 2,+" =%);./ >+./ ?#.&+" =./.;#-#/+ 6&,#/+$ +".+ '()6".$# ./ ,/+#)#$+ ,/ ./ :&+#)/.+,7# 9/7#$+-#/+ ./1 ,/ $%-# ,/$+./6#$ '.3 +"#$# *##$ %/ +"# ,/7#$+-#/+$ "#&1 43
.17,$%)3 6&,#/+$8 =%);./ >+./ ?#.&+" =./.;#-#/+ )#4.+#$ $(6" *##$ +".+ .)# )#6#,7#1 ./1 .++),4(+.4&# +% ./ ,/7#$+-#/+ "#&1 43 ./ .17,$%)3 6&,#/+ ./1 )#+.,/$ +"# *##$ '.,1 ,/ 6%//#6+,%/ 2,+"
,/7#$+-#/+$ "#&1 43 4)%D#).;# 6&,#/+$8 =%);./ >+./ ?#.&+" =./.;#-#/+ ".$ . 6%/[,6+ %* ,/+#)#$+ ,/ %5#),/; .&+#)/.+,7# ,/7#$+-#/+$ 4#6.($# =%);./ >+./ ?#.&+" =./.;#-#/+ %) %() .^&,.+#$ 0
,/ -%$+ ,/$+./6#$0 #.)/ -%)# -%/#3 ,/ 3%() .66%(/+ *)%- 3%() ,/7#$+-#/+$ ,/ .&+#)/.+,7# ,/7#$+-#/+$ +"./ *)%- %+"#) ,/7#$+-#/+ %'+,%/$8
9+ $"%(&1 4# /%+#1 +".+ +"# -.@%),+3 %* "#1;# *(/1 ,/1#<#$ .)# 6%-'),$#1 %* "#1;# *(/1 -./.;#) )#+()/$8 !",$ ,$ ,/ 6%/+).$+ +% +).1,+,%/.& ,/1#<#$0 2",6" .)# 6%-'),$#1 %* ,/1,7,1(.& $#6(),+,#$ ,/ +"#
7.),%($ -.)D#+ $#;-#/+$ +"#3 )#')#$#/+ ./1 %5#) 6%-'&#+# +)./$'.)#/63 .$ +% -#-4#)$",' ./1 6%/$+)(6+,%/ -#+"%1%&%;38 :$ $(6"0 $%-# 4#&,#7# +".+ "#1;# *(/1 ,/1#< )#+()/$ ".7# 6#)+.,/ 4,.$#$
+".+ .)# /%+ ')#$#/+ ,/ +).1,+,%/.& ,/1#<#$8 >%-# %* +"#$# 4,.$#$ ,/[.+# ,/1#< '#)*%)-./6#0 2",&# %+"#)$ -.3 $D#2 '#)*%)-./6# /#;.+,7#&38 ]%2#7#)0 -./3 $+(1,#$ ,/1,6.+# +".+ %7#).&& "#1;# *(/1
,/1#< '#)*%)-./6# ".$ 4##/ 4,.$#1 +% +"# ('$,1#8 >%-# $+(1,#$ $(;;#$+ '#)*%)-./6# ".$ 4##/ ,/[.+#1 43 (' +% jcd 4.$,$ '%,/+$ %) -%)# .//(.&&3 1#'#/1,/; %/ +"# +3'#$ %* 4,.$#$ ,/6&(1#1 ./1 +"#
+,-# '#),%1 $+(1,#18 :&+"%(;" +"#)# .)# /(-#)%($ '%+#/+,.& 4,.$#$ +".+ 6%(&1 .5#6+ "#1;# *(/1 )#+()/$0 2# ,1#/+,*3 $%-# %* +"# -%)# 6%--%/ %/#$ +")%(;"%(+ +",$ '.'#)8
>#&*R$#+,%/ 4,.$ )#$(&+$ 2"#/ 6#)+.,/ -./.;#) )#+()/$ .)# /%+ ,/6&(1#1 ,/ +"# ,/1#< )#+()/$ ./1 -.3 )#$(&+ ,/ '#)*%)-./6# 4#,/; $D#2#1 (' %) 1%2/ 8 C#6.($# "#1;# *(/1$ .)# '),7.+# '&.6#-#/+$0
"#1;# *(/1 -./.;#)$ .)# .4&# +% 1#6,1# 2",6" *(/1 )#+()/$ +"#3 2./+ +% )#'%)+ ./1 .)# .4&# +% %'+ %(+ %* )#'%)+,/; +% +"# 7.),%($ 1.+.4.$#$ 8 F#)+.,/ "#1;# *(/1 -./.;#)$ -.3 6"%%$# %/&3 +% )#'%)+
!"#$%"&'("
)#+()/$ *%) *(/1$ 2,+" $+)%/; )#+()/$ ./1 %'+ %(+ %* )#'%)+,/; )#+()/$ *%) 2#.D '#)*%)-#)$8 Y+"#) "#1;# *(/1$ +".+ 6&%$# -.3 1#6,1# +% $+%' )#'%)+,/; ,/ %)1#) +% )#+.,/ $#6)#630 2",6" -.3 6.($# .
1%2/2.)1 4,.$ ,/ )#+()/$8
>()7,7%)$",' 4,.$ )#$(&+$ 2"#/ 6#)+.,/ 6%/$+,+(#/+$ .)# )#-%7#1 *)%- ./ ,/1#<8 !",$ %*+#/ )#$(&+$ *)%- +"# 6&%$()# %* *(/1$ 1(# +% '%%) '#)*%)-./6#0 M4&%2 ('$0P %) %+"#) $(6" #7#/+$8 :$ $(6"0 +",$ 4,.$
+3',6.&&3 )#$(&+$ ,/ '#)*%)-./6# 4#,/; $D#2#1 ",;"#)8 :$ /%+#10 "#1;# *(/1 ,/1#< '#)*%)-./6# 4,.$#$ 6./ )#$(&+ ,/ '%$,+,7# %) /#;.+,7# $D#28 ]%2#7#)0 ,+ 2%(&1 .''#.) +".+ +"# $D#2 ,$ -%)# %*+#/
'%$,+,7#8 ?",&# ,+ ,$ 1,^6(&+ +% J(./+,*3 +"# #5#6+$ ')#6,$#&30 ,/7#$+%)$ $"%(&1 4# .2.)# +".+ ,1,%$3/6).+,6 *.6+%)$ -.3 4# ;,7,/; "#1;# *(/1 ,/1#< )#+()/$ ./ .)+,K6,.& M&,*+P %) ('2.)1$ 4,.$8
U*1#*&E<%10&!2&E<%10 ./1 -./3 *(/1$ %* *(/1$ .)# '),7.+# ,/7#$+-#/+ 7#",6&#$ )#$+),6+#1 +% 6#)+.,/ J(.&,K#1 '),7.+# ./1 ,/$+,+(+,%/.& ,/7#$+%)$8 !"#3 .)# %*+#/ $'#6(&.+,7# ./1 ,/6&(1# . ",;" 1#;)## %*
),$D8 9/7#$+%)$ 6./ &%$# .&& %) . $(4$+./+,.& .-%(/+ %* +"#,) ,/7#$+-#/+8 !"#3 -.3 4# ",;"&3 ,&&,J(,10 6./ #/;.;# ,/ #).;# ./1 %+"#) $'#6(&.+,7# ').6+,6#$ +".+ -.3 ,/6)#.$# 7%&.+,&,+3 ./1 +"# ),$D %* &%$$0
./1 -.3 4# $(4@#6+ +% &.);# ,/7#$+-#/+ -,/,-(-$ ./1 ,/,+,.& &%6D('$8 !"#3 ,/7%&7# 6%-'&#< +.< $+)(6+()#$0 +.<R,/#^6,#/+ ,/7#$+,/; ./1 1#&.3$ ,/ 1,$+),4(+,/; ,-'%)+./+ +.< ,/*%)-.+,%/8 F.+#;%),6.&&30
"#1;# *(/1$ ./1 *(/1$ %* *(/1$ ".7# ",;"#) *##$ ./1 #<'#/$#$ +"./ +).1,+,%/.& ,/7#$+-#/+$0 ./1 $(6" *##$ ./1 #<'#/$#$ 6./ &%2#) +"# )#+()/$ .6",#7#1 43 ,/7#$+%)$8 S(/1$ %* *(/1$ ".7# ./ .11,+,%/.&
&.3#) %* *##$ %7#) ./1 .4%7# "#1;# *(/1 *##$ +".+ 2,&& %5$#+ )#+()/$8 :/ ,/7#$+-#/+ ,/ ./ *Q=-$%#*9("$1*1&2<%1 ,/7%&7#$ ),$D$ $,-,&.) +% +"%$# %* ,/7#$+,/; ,/ . 4)%.1&3 4.$#1 '%)+*%&,% %* #J(,+3
$#6(),+,#$ +).1#1 %/ ./ #<6"./;# ,/ +"# )#./+ $#6(),+,#$ -.)D#+0 $(6" .$ -.)D#+ [(6+(.+,%/$ 6.($#1 43 $(6" *.6+%)$ .$ #6%/%-,6 ./1 '%&,+,6.& 1#7#&%'-#/+$0 6"./;#$ ,/ ,/+#)#$+ ).+#$ ./1 '#)6#,7#1
+)#/1$ ,/ $+%6D ./1 4%/1 '),6#$8 :/ ,/7#$+-#/+ ,/ . ($"#*(&1$(*&F!"(2!)/! ,$ $(4@#6+ +% +"# ),$D$ .++#/1./+ +% +"# (/1#)&3,/; *(/1$ ,/ 2",6" ,+ ,/7#$+$0 ,/ +"#$# '%)+*%&,%$ +"# *(/1$ .)# +"# F%/$(&+,/;
U)%(' F.',+.& =.)D#+ *(/1$8 : +.);#+ 1.+# '%)+*%&,% ,$ ;#.)#1 +% ,/7#$+%)$ 2"% 2,&& )#+,)# ./1Q%) )#J(,)# ,/6%-# .+ ./ .'')%<,-.+# 3#.)8 !"# '%)+*%&,% ,$ -./.;#1 +% -##+ +"# ,/7#$+%)I$ ;%.&$ 43 +"#
')#R#$+.4&,$"#1 3#.) %) M+.);#+ 1.+#8P : +.);#+ 1.+# '%)+*%&,% 2,&& +)./$,+,%/ ,+$ ,/7#$+#1 .$$#+$ *)%- . -%)# .;;)#$$,7# '%)+*%&,% +% . -%)# 6%/$#)7.+,7# '%)+*%&,% .$ +"# +.);#+ 1.+# 1).2$ 6&%$#) 8 :/
,/7#$+-#/+ ,/ +"# +.);#+ 1.+# '%)+*%&,% ,$ /%+ ;(.)./+##1 .+ ./3 +,-#0 ,/6&(1,/;0 4#*%)# %) .*+#) +"# +.);#+ 1.+# ,$ )#.6"#18 $%$#*1&2<(<"*0 ,/7#$+-#/+$ .)# $'#6(&.+,7#0 ,/7%&7# . ",;" 1#;)## %* ),$D0
($# $,;/,K6./+ #).;#0 .)# ;#/#).&&3 ,&&,J(,10 ".7# $(4$+./+,.& 6".);#$0 $(4@#6+ ,/7#$+%)$ +% 6%/[,6+$ %* ,/+#)#$+0 ./1 .)# $(,+.4&# %/&3 *%) +"# ),$D 6.',+.& '%)+,%/ %* ./ ,/7#$+%)I$ '%)+*%&,%8 =./.;#1
*(+()#$ ,/7#$+-#/+$ 1% /%+ )#'&.6# #J(,+,#$ %) 4%/1$ 4(+ ).+"#) -.3 .6+ .$ . 6%-'&#-#/+ ,/ . 2#&& 1,7#)$,K#1 '%)+*%&,%8 =./.;#1 S(+()#$ .)# 6%-'&#< ./1 /%+ .'')%'),.+# *%) .&& ,/7#$+%)$8 T*7$)$%=/%#
1%#$ /%+ ')%+#6+ .;.,/$+ . &%$$ ,/ 1#6&,/,/; K/./6,.& -.)D#+$8 !"#)# -.3 4# . '%+#/+,.& +.< ,-'&,6.+,%/ 2,+" . )#4.&./6,/; $+).+#;38
B00*(&$))!=$(/!%&$%1&1/A*"0/W=$(/!% 1% /%+ .$$()# . ')%K+ %) ')%+#6+ .;.,/$+ &%$$ ,/ 1#6&,/,/; K/./6,.& -.)D#+$8 L.$+ '#)*%)-./6# ,$ /% ;(.)./+## %* *(+()# )#$(&+$8 :6+(.& )#$(&+$ -.3 7.)38
G$Q&)$N0&$"*&=!.F)*Q&$%1&0<7P*=(&(!&=-$%#*;& !"#$%&'($%)*+&'./(-&3$"%*+&445&CY !"#$%&'($%)*+ZD6&/(0&$[)/$(*0&$%1& !"#$%&'($%)*+&E/%$%=/$)&B1A/0!"0&$%1&J"/A$(*&,*$)(-&B1A/0!"0&1!&%!(&
F"!A/1*&($Q&!"&)*#$)&$1A/=*&$%1&$"*&%!(&YW1<=/$"/*0Z&C<%1*"&RT@'B6&(-*&@%(*"%$)&T*A*%<*&5!1*&!"&!(-*"N/0*D&N/(-&"*0F*=(&(!&(-*&0*"A/=*0&!"&$=(/A/(/*0&1*0="/7*1&-*"*/%&*Q=*F(&$0&!(-*"N/0*&
F"!A/1*1&/%&N"/(/%#&7+& !"#$%&'($%)*+&$%1\!"&$0&1*0="/7*1&$(&NNN;.!"#$%0($%)*+;=!.\1/0=)!0<"*0\1!);&@%1/A/1<$)0&$"*&*%=!<"$#*1&(!&=!%0<)(&(-*/"&($Q&$%1&)*#$)&$1A/0!"0&C$D&7*2!"*&
*0($7)/0-/%#&$&"*(/"*.*%(&F)$%&!"&$==!<%(6&$%1&C7D&"*#$"1/%#&$%+&F!(*%(/$)&($Q6&RT@'B&$%1&"*)$(*1&=!%0*]<*%=*0&!2&$%+&/%A*0(.*%(0&.$1*&<%1*"&0<=-&F)$%&!"&$==!<%(;
://(,+,#$ ./1 ,/$()./6# ')%1(6+$ .)# %5#)#1 ,/ 6%/@(/6+,%/ 2,+" =%);./ >+./ >-,+" C.)/#3 EEFI$ &,6#/$#1 ,/$()./6# .;#/63 .^&,.+#$8
9/1,6#$ .)# (/-./.;#1 ./1 ,/7#$+%)$ 6.//%+ 1,)#6+&3 ,/7#$+ ,/ +"#-8 !"#3 .)# /%+ $(4@#6+ +% #<'#/$#$ %) *##$ ./1 .)# %*+#/ 6%-'),$#1 %* $#6(),+,#$ ./1 %+"#) ,/7#$+-#/+ ,/$+)(-#/+$ +"# &,J(,1,+3 %*
2",6" ,$ /%+ )#$+),6+#18 : '.)+,6(&.) ,/7#$+-#/+ ')%1(6+ -.3 6%/$,$+ %* $#6(),+,#$ $,;/,K6./+&3 1,5#)#/+ +"./ +"%$# ,/ ./3 ,/1#< )#*#))#1 +% "#)#,/ 8 F%-'%$,+# ,/1#< )#$(&+$ .)# $"%2/ *%) ,&&($+).+,7#
'()'%$#$ %/&30 ;#/#).&&3 1% /%+ )#')#$#/+ +"# '#)*%)-./6# %* . $'#6,K6 ,/7#$+-#/+0 -.3 /%+0 *%) . 7.),#+3 %* )#.$%/$0 4# . $(,+.4&# 6%-'.),$%/ %) 4#/6"-.)D *%) . '.)+,6(&.) ,/7#$+-#/+ ./1 -.3 /%+
/#6#$$.),&3 )#[#6+ +"# .6+(.& ,/7#$+-#/+ $+).+#;3 %) %4@#6+,7# %* . '.)+,6(&.) ,/7#$+-#/+8 F%/$#J(#/+&30 6%-'.),/; ./ ,/7#$+-#/+ +% . '.)+,6(&.) ,/1#< -.3 4# %* &,-,+#1 ($#8
!",$ -.+#),.& ,$ /%+ . K/./6,.& '&./ ./1 1%#$ /%+ 6)#.+# ./ ,/7#$+-#/+ .17,$%)3 )#&.+,%/$",' 4#+2##/ 3%( ./1 3%() =%);./ >+./ S,/./6,.& :17,$%)8 ?# .)# /%+ 3%() K1(6,.)3 #,+"#) (/1#) +"#
G-'&%3## \#+,)#-#/+ 9/6%-# >#6(),+3 :6+ %* ieal AG\9>:B %) +"# 9/+#)/.& \#7#/(# F%1# %* ie`c0 ./1 ./3 ,/*%)-.+,%/ ,/ +",$ )#'%)+ ,$ /%+ ,/+#/1#1 +% *%)- +"# '),-.)3 4.$,$ *%) ./3 ,/7#$+-#/+ 1#6,$,%/
43 3%(0 %) ./ ,/7#$+-#/+ .17,6# %) )#6%--#/1.+,%/ *%) #,+"#) G\9>: %) 9/+#)/.& \#7#/(# F%1# '()'%$#$8 =%);./ >+./ L),7.+# ?#.&+" =./.;#-#/+ 2,&& %/&3 ')#'.)# . K/./6,.& '&./ .+ 3%() $'#6,K6
)#J(#$+ ($,/; L),7.+# ?#.&+" =./.;#-#/+ .'')%7#1 K/./6,.& '&.//,/; $,;/.+()#8
?# -.3 .6+ ,/ +"# 6.'.6,+3 %* . 4)%D#) %) +".+ %* ./ .17,$%)8 :$ 3%() 4)%D#)0 2# .)# /%+ 3%() K1(6,.)3 ./1 %() ,/+#)#$+$ -.3 /%+ .&2.3$ 4# ,1#/+,6.& +% 3%()$8 L&#.$# 6%/$(&+ 2,+" 3%() L),7.+# ?#.&+"
:17,$%) +% 1,$6($$ %() %4&,;.+,%/$ +% 1,$6&%$# +% 3%( ./3 6%/[,6+$ 2# -.3 *)%- +,-# +% +,-# ".7# ./1 %() 1(+3 +% .6+ ,/ 3%() 4#$+ ,/+#)#$+8 ?# -.3 4# '.,1 4%+" 43 3%( ./1 43 %+"#)$ 2"% 6%-'#/$.+#
($ 4.$#1 %/ 2".+ 3%( 4(38 Y() 6%-'#/$.+,%/0 ,/6&(1,/; +".+ %* 3%() L),7.+# ?#.&+" :17,$%)0 -.3 7.)3 43 ')%1(6+ ./1 %7#) +,-#8
9/7#$+-#/+ ./1 $#)7,6#$ %5#)#1 +")%(;" =%);./ >+./ L),7.+# ?#.&+" =./.;#-#/+0 . 1,7,$,%/ %* =%);./ >+./ >-,+" C.)/#3 EEF0 =#-4#) >9LF8
!"#$%"&'("

@%A*0(.*%(6&/%0<"$%=*&$%1&$%%</(+&F"!1<=(0&!^*"*1&(-"!<#-& !"#$%&'($%)*+&'./(-&3$"%*+&445&$"*L&OHG&E>@5&@O':TR>&_& BM&4H'R&̀ B4:R&_&OHG&3BOS&?:BTBOGRR>&_&OHG&B&3BOS&
>RJH'@G&_&OHG&@O':TR>&3M&BOM&ER>RTB4&?H`RTO ROG&B?RO5M
!"#$%&'($%)*+&'./(-&3$"%*+&445&/0 . )#;,$+#)#1 C)%D#)QN#.&#)0 =#-4#) >9LF0 ./1 /%+ . 4./D8 ?"#)# .'')%'),.+#0 =%);./ >+./ >-,+" C.)/#3 EEF ".$ #/+#)#1 ,/+% .))./;#-#/+$ 2,+" 4./D$ ./1
%+"#) +",)1 '.)+,#$ +% .$$,$+ ,/ %5#),/; 6#)+.,/ 4./D,/; )#&.+#1 ')%1(6+$ ./1 $#)7,6#$8
4*,"#!0%@?"#!0#9)'*,")!0"&/,$%+"0%A!#'#*!&",%.%,%!9%0"#!"'3#&",%7*,'"75%)&%"$#&#'"'3%".*55*B#!1C"3''7&CDDBBB;(*,1)!&')!5%+;9*(DB%)5'3E#!$%&'(%!'&*5/'#*!&DB(#,E0%A!#'#*!&
?4H3B4&@O`R'G ROG&5H @GGRR&C?@5D&B''RG&B44H5BG@HO& H>R4'L !"# :$$#+ :&&%6.+,%/ =%1#&$ .)# 6)#.+#1 43 =%);./ >+./ ?#.&+" =./.;#-#/+I$ U9F8
UMJHGURG@5B4& H>R4&JRTEHT BO5R&C?TH''DL ]3'%+"#+,6.& -%1#& '#)*%)-./6# )#$(&+$ 1% /%+ )#[#6+ +"# ,/7#$+-#/+ %) '#)*%)-./6# %* ./ .6+(.& '%)+*%&,% *%&&%2,/; . U9F >+).+#;30 4(+ $,-'&3
)#[#6+ .6+(.& ",$+%),6.& '#)*%)-./6# %* $#+#1 ,/1,6#$ %/ . )#.&R+,-# 4.$,$ %7#) +"# $'#6,K#1 '#),%1 %* +,-# )#')#$#/+,/; +"# U9FI$ $+).+#;,6 ./1 +.6+,6.& .&&%6.+,%/$ .$ %* +"# 1.+# %* +",$ )#'%)+ 8 !"#
'.$+ '#)*%)-./6# $"%2/ "#)# ,$ $,-(&.+#1 '#)*%)-./6# 4.$#1 %/ 4#/6"-.)D ,/1,6#$0 /%+ ,/7#$+-#/+ )#$(&+$ *)%- ./ .6+(.& '%)+*%&,% %) .6+(.& +).1,/;8 !"#)# 6./ 4# &.);# 1,5#)#/6#$ 4#+2##/
"3'%+"#+,6.& ./1 .6+(.& '#)*%)-./6# )#$(&+$ .6",#7#1 43 . '.)+,6(&.) .$$#+ .&&%6.+,%/ %) +).1,/; $+).+#;38 ]3'%+"#+,6.& '#)*%)-./6# )#$(&+$ 1% /%+ )#')#$#/+ .6+(.& +).1,/; ./1 .)# ;#/#).&&3 1#$,;/#1
2,+" +"# 4#/#K+ %* ",/1$,;"+8 :6+(.& '#)*%)-./6# )#$(&+$ %* .66%(/+$ 7.)3 1(# +%0 *%) #<.-'� -.)D#+ *.6+%)$ A$(6" .$ &,J(,1,+3B ./1 6&,#/+R$'#6,K6 *.6+%)$ A$(6" .$ ,/7#$+-#/+ 7#",6&# $#+,%/0 +,-,/;
%* 6%/+),4(+,%/$ ./1 2,+"1).2.&$0 )#$+),6+,%/$ ./1 )#4.&./6,/; $6"#1(&#$B8 F&,#/+$ 2%(&1 /%+ /#6#$$.),&3 ".7# %4+.,/#1 +"# '#)*%)-./6# )#$(&+$ $"%2/ "#)# ,* +"#3 ".1 ,/7#$+#1 ,/ .66%)1./6# 2,+" ./3
U9F :$$#+ :&&%6.+,%/ =%1#& *%) +"# '#),%1$ ,/1,6.+#18 N#$',+# +"# &,-,+.+,%/$ %* "3'%+"#+,6.& '#)*%)-./6#0 +"#$# "3'%+"#+,6.& '#)*%)-./6# )#$(&+$ .&&%2 6&,#/+$ ./1 S,/./6,.& :17,$%)$ +% %4+.,/ . $#/$#
%* +"# ),$DQ)#+()/ +).1#R%5 %* 1,5#)#/+ .$$#+ .&&%6.+,%/ 6%/$+)(6+$8 !"# "3'%+"#+,6.& '#)*%)-./6# )#$(&+$ ,/ +",$ )#'%)+ .)# 6.&6(&.+#1 ($,/; +"# )#+()/$ %* 4#/6"-.)D ,/1,6#$ *%) +"# .$$#+ 6&.$$#$ 0 ./1
/%+ +"# )#+()/$ %* $#6(),+,#$0 *(/1 %) %+"#) ,/7#$+-#/+ ')%1(6+$8 =%1#&$ -.3 6%/+.,/ .&&%6.+,%/$ +% ]#1;# S(/1$0 L),7.+# GJ(,+3 ./1 L),7.+# \#.& G$+.+#8 !"# 4#/6"-.)D ,/1,6#$ *%) +"#$# .$$#+ 6&.$$#$
.)# /%+ ,$$(#1 %/ . 1.,&3 4.$,$8 ?"#/ 6.&6(&.+,/; -%1#& '#)*%)-./6# %/ . 1.3 *%) 2",6" /% 4#/6"-.)D ,/1#< 1.+. ,$ ,$$(#10 2# ".7# .$$(-#1 $+).,;"+ &,/# ;)%2+" 4#+2##/ +"# ,/1#< #&$ ,$$(#1 4#*%)#
./1 .*+#) +".+ 1.+#8
ERR'&TR>:5R&GUR&JRTEHT BO5R&HE&B5G:B4&B55H:OG'L W%/# %* +"# *##$ %) %+"#) #<'#/$#$ A#8;8 6%--,$$,%/$0 -.)DR('$0 -.)DR1%2/$0 *##$B .$$%6,.+#1 2,+" .6+(.& +).1,/; %) .66%(/+$ .)#
)#[#6+#1 ,/ +"# U9F :$$#+ :&&%6.+,%/ =%1#&$8 !"# U9F :$$#+ :&&%6.+,%/ =%1#&$ ./1 ./3 -%1#& '#)*%)-./6# ,/6&(1#1 ,/ +",$ ')#$#/+.+,%/ .)# ,/+#/1#1 .$ #1(6.+,%/.& -.+#),.&$ 8 ?#)# . 6&,#/+ +% ($# +"#$#
-%1#&$ ,/ 6%//#6+,%/ 2,+" ,/7#$+,/;0 ./3 ,/7#$+-#/+ 1#6,$,%/$ -.1# 2%(&1 4# $(4@#6+ +% +)./$.6+,%/ ./1 %+"#) 6%$+$ 2",6"0 2"#/ 6%-'%(/1#1 %7#) . '#),%1 %* 3#.)$0 2%(&1 1#6)#.$# )#+()/$8
9/*%)-.+,%/ )#;.)1,/; =%);./ >+./I$ $+./1.)1 .17,$%)3 *##$ ,$ .7.,&.4&# ,/ +"# S%)- :NO L.)+ j0 2",6" ,$ .7.,&.4&# .+ 2228-%);./$+./Ƃ%-Q.178 !"# *%&&%2,/; "3'%+"#+,6.& ,&&($+).+#$ +"#
6%-'%(/1 #5#6+ *##$ ".7# %/ ,/7#$+-#/+ )#+()/$V S%) #<.-'� ,* . '%)+*%&,%I$ .//(.& ).+# %* )#+()/ ,$ ibh *%) b 3#.)$ ./1 +"# .66%(/+ '.3$ bd 4.$,$ '%,/+$ ,/ *##$ '#) .//(-0 +"# ;)%$$ 6(-(&.+,7#
K7#R3#.) )#+()/ 2%(&1 4# idi8ih ./1 +"# K7#R3#.) )#+()/ /#+ %* *##$ 2%(&1 4# ec8`h8 S##$ ./1Q%) #<'#/$#$ 2%(&1 .''&3 +% 6&,#/+$ 2"% ,/7#$+ ,/ ,/7#$+-#/+$ ,/ ./ .66%(/+ 4.$#1 %/ +"#$# .$$#+
.&&%6.+,%/$0 ./1 2%(&1 )#1(6# 6&,#/+$I )#+()/$8 !"# ,-'.6+ %* *##$ ./1Q%) #<'#/$#$ 6./ 4# -.+#),.&8
`$"/$7)*&$%%</(/*0 .)# &%/;R+#)- ,/7#$+-#/+$ 1#$,;/#1 *%) )#+,)#-#/+ '()'%$#$ ./1 -.3 4# $(4@#6+ +% -.)D#+ [(6+(.+,%/$0 ,/7#$+-#/+ ),$D0 ./1 '%$$,4&# &%$$ %* '),/6,'.&8 :&& ;(.)./+##$0 ,/6&(1,/;
%'+,%/.& 4#/#K+$0 .)# 4.$#1 %/ +"# K/./6,.& $+)#/;+" ./1 6&.,-$R'.3,/; .4,&,+3 %* +"# ,$$(,/; ,/$()./6# 6%-'./3 ./1 1% /%+ .''&3 +% +"# (/1#)&3,/; ,/7#$+-#/+ %'+,%/$8 Y'+,%/.& ),1#)$ -.3 /%+ 4# .4&#
+% 4# '()6".$#1 ,/ 6%-4,/.+,%/ ./1 .)# .7.,&.4&# .+ ./ .11,+,%/.& 6%$+8 >%-# %'+,%/.& ),1#)$ -($+ 4# #+#1 .+ +,-# %* '()6".$#8 Y'+,%/.& ),1#)$ -.3 4# $(4@#6+ +% $'#6,K6 &,-,+.+,%/$0 )#$+),6+,%/$0
"%&1,/; '#),%1$0 6%$+$0 ./1 #<'#/$#$ .$ $'#6,K#1 43 +"# ,/$()./6# 6%-'./3 ,/ +"# .//(,+3 6%/+).6+8 9* 3%( .)# ,/7#$+,/; ,/ . A$"/$7)*&$%%</(+ +")%(;" . +.<R.17./+.;#1 )#+,)#-#/+ '&./ $(6" .$ ./ 9\:0
3%( 2,&& ;#+ /% .11,+,%/.& +.< .17./+.;# *)%- +"# 7.),.4&# .//(,+38 _/1#) +"#$# 6,)6(-$+./6#$0 3%( $"%(&1 %/&3 6%/$,1#) 4(3,/; . 7.),.4&# .//(,+3 4#6.($# %* ,+$ %+"#) *#.+()#$0 $(6" .$ &,*#+,-# ,/6%-#
'.3-#/+$ ./1 1#.+" 4#/#K+$ ')%+#6+,%/8 !.<.4&# 1,$+),4(+,%/$ A./1 6#)+.,/ 1##-#1 1,$+),4(+,%/$B .)# $(4@#6+ +% %)1,/.)3 ,/6%-# +.< ./10 ,* +.D#/ '),%) +% .;# bep0 -.3 4# $(4@#6+ +% . idh *#1#).&
,/6%-# +.< '#/.&+38 G.)&3 2,+"1).2.&$ 2,&& )#1(6# +"# 1#.+" 4#/#K+ ./1 6.$" $())#/1#) 7.&(#8
R]</(+&0*=<"/(/*0 -.3 [(6+(.+# ,/ )#$'%/$# +% /#2$ %/ 6%-'./,#$0 ,/1($+),#$0 -.)D#+ 6%/1,+,%/$ ./1 ;#/#).& #6%/%-,6 #/7,)%/-#/+8 :)("$0-!"(9(*".&WQ*1&/%=!.* .$$#+ 6&.$$ ,$ 6%-'),$#1 %* K<#1
,/6%-# $#6(),+,#$ 2,+" ",;" J(.&,+30 7#)3 $"%)+ -.+(),+,#$8 !"#3 .)# +"#)#*%)# $(4@#6+ +% +"# ),$D$ .$$%6,.+#1 2,+" 1#4+ $#6(),+,#$ $(6" .$ 6)#1,+ ./1 ,/+#)#$+ ).+# ),$D 8
$0(*"&4/./(*1&J$"(%*"0-/F0&C 4J0D .)# &,-,+#1 '.)+/#)$",'$ %) &,-,+#1 &,.4,&,+3 6%-'./,#$ +".+ .)# +.<#1 .$ '.)+/#)$",'$ ./1 2"%$# ,/+#)#$+$ A&,-,+#1 '.)+/#)$",' (/,+$ %) &,-,+#1 &,.4,&,+3 6%-'./3
(/,+$B .)# +).1#1 %/ $#6(),+,#$ #<6"./;#$ &,D# $".)#$ %* 6%--%/ $+%6D8 F())#/+&30 -%$+ =EL$ %'#).+# ,/ +"# #/#);30 /.+().& )#$%()6#$ %) )#.& #$+.+# $#6+%)$8 9/7#$+-#/+$ ,/ =EL ,/+#)#$+$ .)# $(4@#6+ +%
+"# ),$D$ ;#/#).&&3 .''&,6.4&# +% 6%-'./,#$ ,/ +"# #/#);3 ./1 /.+().& )#$%()6#$ $#6+%)$0 ,/6&(1,/; 6%--%1,+3 '),6,/; ),$D0 $(''&3 ./1 1#-./1 ),$D0 1#'&#+,%/ ),$D ./1 #<'&%).+,%/ ),$D8 9/1,7,1(.& =EL$
!"#$%"&'("

.)# '(4&,6&3 +).1#1 '.)+/#)$",'$ +".+ ".7# (/,J(# ),$D$ )#&.+#1 +% +"#,) $+)(6+()#8 !"#$# ,/6&(1#0 4(+ .)# /%+ &,-,+#1 +%0 +"#,) )#&,./6# %/ +"# 6.',+.& -.)D#+$ +% *(/1 ;)%2+"0 .17#)$# )(&,/; %/ +"# 6())#/+
+.< +)#.+-#/+ %* 1,$+),4(+,%/$ A+3',6.&&3 -%$+&3 +.< 1#*#))#1B0 ./1 6%--%1,+3 7%&(-# ),$D8 !"# '%+#/+,.& +.< 4#/#K+$ *)%- ,/7#$+,/; ,/ =EL$ 1#'#/1 %/ +"#,) 4#,/; +)#.+#1 .$ '.)+/#)$",'$ *%) *#1#).&
,/6%-# +.< '()'%$#$ ./10 ,* +"# =EL ,$ 1##-#1 +% 4# . 6%)'%).+,%/0 +"#/ ,+$ ,/6%-# 2%(&1 4# $(4@#6+ +% *#1#).& +.<.+,%/ .+ +"# #/+,+3 #&0 )#1(6,/; +"# .-%(/+ %* 6.$" .7.,&.4&# *%) 1,$+),4(+,%/ +% +"#
*(/1 2",6" 6%(&1 )#$(&+ ,/ . )#1(6+,%/ %* +"# *(/1I$ 7.&(#8 =EL$ 6.))3 ,/+#)#$+ ).+# ),$D ./1 -.3 (/1#)'#)*%)- ,/ . ),$,/; ,/+#)#$+ ).+# #/7,)%/-#/+8 =EL *(/1$ .66)(# 1#*#))#1 ,/6%-# +.<#$ *%) *(+()#
+.< &,.4,&,+,#$ .$$%6,.+#1 2,+" +"# '%)+,%/ %* =EL 1,$+),4(+,%/$ 6%/$,1#)#1 +% 4# . +.< R1#*#))#1 )#+()/ %* 6.',+.& ./1 *%) ./3 /#+ %'#).+,/; ;.,/$ .$ 2#&& .$ 6.',+.& .'')#6,.+,%/ %* ,+$ ,/7#$+-#/+$H +",$
1#*#))#1 +.< &,.4,&,+3 ,$ )#[#6+#1 ,/ +"# 1.,&3 W:O0 ./10 .$ . )#$(&+0 +"# =EL *(/1I$ .*+#)R+.< '#)*%)-./6# 6%(&1 1,5#) $,;/,K6./+&3 *)%- +"# (/1#)&3,/; .$$#+$ #7#/ ,* +"# ')#R+.< '#)*%)-./6# ,$ 6&%$#&3
+).6D#18
@%A*0(/%#&/%&=!..!1/(/*0 #/+.,&$ $,;/,K6./+ ),$D$8 F%--%1,+3 '),6#$ -.3 4# .5#6+#1 43 . 7.),#+3 %* *.6+%)$ .+ ./3 +,-#0 ,/6&(1,/; 4(+ /%+ &,-,+#1 +%0 A,B 6"./;#$ ,/ $(''&3 ./1 1#-./1 )#&.+,%/$",'$0 A,,B
;%7#)/-#/+.& ')%;).-$ ./1 '%&,6,#$0 A,,,B /.+,%/.& ./1 ,/+#)/.+,%/.& '%&,+,6.& ./1 #6%/%-,6 #7#/+$0 2.) ./1 +#))%),$+ #7#/+$0 A,7B 6"./;#$ ,/ ,/+#)#$+ ./1 #<6"./;# ).+#$0 A7B +).1,/; .6+,7,+,#$ ,/
6%--%1,+,#$ ./1 )#&.+#1 6%/+).6+$0 A7,B '#$+,&#/6#0 +#6"/%&%;,6.& 6"./;# ./1 2#.+"#)0 ./1 A7,,B +"# '),6# 7%&.+,&,+3 %* . 6%--%1,+38 9/ .11,+,%/0 +"# 6%--%1,+,#$ -.)D#+$ .)# $(4@#6+ +% +#-'%).)3
1,$+%)+,%/$ %) %+"#) 1,$)('+,%/$ 1(# +% 7.),%($ *.6+%)$0 ,/6&(1,/; &.6D %* &,J(,1,+30 '.)+,6,'.+,%/ %* $'#6(&.+%)$ ./1 ;%7#)/-#/+ ,/+#)7#/+,%/8 J-+0/=$)&F"*=/!<0&.*($)0 .)# /%/R)#;(&.+#1 ')%1(6+$8
L)#6,%($ -#+.&$ .)# $'#6(&.+,7# ,/7#$+-#/+$0 2",6" -.3 #<'#),#/6# $"%)+R+#)- ./1 &%/; +#)- '),6# 7%&.+,&,+38 !"# 7.&(# %* ')#6,%($ -#+.&$ ,/7#$+-#/+$ -.3 [(6+(.+# ./1 -.3 .'')#6,.+# %) 1#6&,/#0
1#'#/1,/; %/ -.)D#+ 6%/1,+,%/$8 _/&,D# 4%/1$ ./1 $+%6D$0 ')#6,%($ -#+.&$ 1% /%+ -.D# ,/+#)#$+ %) 1,7,1#/1 '.3-#/+$8 !"#)#*%)#0 ')#6,%($ -#+.&$ -.3 /%+ 4# $(,+.4&# *%) ,/7#$+%)$ 2"% )#J(,)# 6())#/+
,/6%-#8 L)#6,%($ -#+.&$ .)# 6%--%1,+,#$ +".+ $"%(&1 4# $.*#&3 $+%)#10 2",6" -.3 ,-'%$# .11,+,%/.& 6%$+$ %/ +"# ,/7#$+%)8
TR@G0 ,/7#$+,/; ),$D$ .)# $,-,&.) +% +"%$# .$$%6,.+#1 2,+" 1,)#6+ ,/7#$+-#/+$ ,/ )#.& #$+.+#V ')%'#)+3 7.&(# [(6+(.+,%/$0 &.6D %* &,J(,1,+30 &,-,+#1 1,7#)$,K6.+,%/ ./1 $#/$,+,7,+3 +% #6%/%-,6 *.6+%)$ $(6" .$
,/+#)#$+ ).+# 6"./;#$ ./1 -.)D#+ )#6#$$,%/$8 \,$D$ %* F"/A$(*&"*$)&*0($(* ,/6&(1#V ,&&,J(,1,+3H . &%/;R+#)- ,/7#$+-#/+ "%),k%/ 2,+" . &,-,+#1 %) /%/#<,$+#/+ $#6%/1.)3 -.)D#+H &.6D %* +)./$'.)#/63H
7%&.+,&,+3 A),$D %* &%$$BH ./1 #).;#8 L),/6,'.& ,$ )#+()/#1 %/ . -%/+"&3 4.$,$ %7#) +"# &,*# %* . .!"(#$#*97$=8*1&0*=<"/(+; L),/6,'.& ')#'.3-#/+ 6./ $,;/,K6./+&3 .5#6+ +"# -%/+"&3 ,/6%-# $+)#.- ./1
+"# -.+(),+3 %* ./3 +3'# %* =C>0 ,/6&(1,/; $+./1.)1 =C>0 F=Y$ ./1 E%++#)3 C%/1$8 B00*(97$=8*1&0*=<"/(/*0 ;#/#).&&3 1#6)#.$# ,/ 7.&(# .$ . )#$(&+ %* ,/+#)#$+ ).+# ,/6)#.$#$0 4(+ -.3 4#/#K+ &#$$ +"./
%+"#) K<#1R,/6%-# $#6(),+,#$ *)%- 1#6&,/,/; ,/+#)#$+ ).+#$0 '),/6,'.&&3 4#6.($# %* ')#'.3-#/+$8
M/*)10 .)# $(4@#6+ +% 6"./;# 2,+" #6%/%-,6 6%/1,+,%/$8 Z,#&1 ,$ %/&3 %/# *.6+%) +".+ $"%(&1 4# 6%/$,1#)#1 2"#/ -.D,/; ./ ,/7#$+-#/+ 1#6,$,%/8 5"*1/(&"$(/%#0 .)# $(4@#6+ +% 6"./;#8 ><"$(/!%0 +"#
-%$+ 6%--%/&3 ($#1 -#.$()# %* 4%/1 ),$D0 J(./+,K#$ +"# #5#6+ %* 6"./;#$ ,/ ,/+#)#$+ ).+#$ %/ +"# '),6# %* . 4%/1 %) 4%/1 '%)+*%&,%8 !"# &%/;#) +"# 1().+,%/0 +"# -%)# $#/$,+,7# +"# 4%/1 %) '%)+*%&,%
2%(&1 4# +% 6"./;#$ ,/ ,/+#)#$+ ).+#$8 !"# -.@%),+3 %* qjb ./1 qiddd '.) F"*2*""*1&0*=<"/(/*0 .)# M6.&&.4&#P -#./,/; +".+ +"# ,$$(#) -.3 )#+,)# +"# $#6(),+,#$ .+ $'#6,K6 '),6#$ ./1 1.+#$ '),%) +%
-.+(),+38 9/+#)#$+Q1,7,1#/1 '.3-#/+$ %/ 6#)+.,/ ')#*#))#1 ,$$(#$ -.3 4# 1#*#))#1 43 +"# ,$$(#) *%) '#),%1$ %* (' +% b +% id 3#.)$0 1#'#/1,/; %/ +"# '.)+,6(&.) ,$$(#8 !"# ,/7#$+%) 2%(&1 $+,&& ".7# ,/6%-#
+.< &,.4,&,+3 #7#/ +"%(;" '.3-#/+$ 2%(&1 /%+ ".7# 4##/ )#6#,7#18 L),6# J(%+#1 ,$ '#) qjb %) qi0ddd $".)#0 (/&#$$ %+"#)2,$# $'#6,K#18 F())#/+ 3,#&1 ,$ 6.&6(&.+#1 43 -(&+,'&3,/; +"# 6%('%/ 43 '.) 7.&(#
1,7,1#1 43 +"# -.)D#+ '),6#8 !"# ,/,+,.& ,/+#)#$+ ).+# %/ . K!$(/%#9"$(*&0*=<"/(+ -.3 4# &%2#) +"./ +".+ %* . K<#1R).+# $#6(),+3 %* +"# $.-# -.+(),+3 4#6.($# ,/7#$+%)$ #<'#6+ +% )#6#,7# .11,+,%/.&
,/6%-# 1(# +% *(+()# ,/6)#.$#$ ,/ +"# [%.+,/; $#6(),+3I$ (/1#)&3,/; )#*#)#/6# ).+#8 !"# )#*#)#/6# ).+# 6%(&1 4# ./ ,/1#< %) ./ ,/+#)#$+ ).+#8 ]%2#7#)0 +"#)# 6./ 4# /% .$$()./6# +".+ +"# )#*#)#/6# ).+#
2,&& ,/6)#.$#8 >%-# [%.+,/;R).+# $#6(),+,#$ -.3 4# $(4@#6+ +% 6.&& ),$D8 !"# -.)D#+ 7.&(# %* =!%A*"(/7)*&7!%10 ./1 +"# (/1#)&3,/; 6%--%/ $+%6DA$B 2,&& [(6+(.+# ./1 .*+#) '()6".$# -.3 4# 2%)+" -%)#
%) &#$$ +"./ %),;,/.& 6%$+8 9* $%&1 '),%) +% -.+(),+30 ,/7#$+%)$ -.3 )#6#,7# -%)# %) &#$$ +"./ +"#,) %),;,/.& '()6".$# '),6# %) -.+(),+3 7.&(#0 1#'#/1,/; %/ -.)D#+ 6%/1,+,%/$8 F.&&.4&# 4%/1$ -.3 4#
)#1##-#1 43 +"# ,$$(#) '),%) +% -.+(),+38 :11,+,%/.& 6.&& *#.+()#$ -.3 #<,$+ +".+ 6%(&1 .5#6+ 3,#&18 >%-# qjb %) qiddd F$"&F"*2*""*1&0*=<"/(/*0 .)# rN9 Ar(.&,K#1 N,7,1#/1 9/6%-#B #&,;,4 9/*%)-.+,%/
%/ rN9 #&,;,4,&,+3 ,$ %4+.,/#1 *)%- +",)1 '.)+3 $%()6#$8 !"# 1,7,1#/1 ,/6%-# %/ rN9 #&,;,4&# ')#*#))#1$ J(.&,K#$ *%) . )#1(6#1 +.< ).+#8 =./3 +).1,+,%/.& X1,7,1#/1 '.3,/;I '#)'#+(.& ')#*#))#1 $#6(),+,#$
A+).1,+,%/.& ')#*#))#1$ 2,+" /% -.+(),+3 1.+#B .)# rN9 #&,;,4 9/ %)1#) +% J(.&,*3 *%) +"# ')#*#)#/+,.& +.< +)#.+-#/+ .&& J(.&,*3,/; ')#*#))#1 $#6(),+,#$ -($+ 4# "#&1 43 ,/7#$+%)$ *%) . -,/,-(- '#),%1 f ei
1.3$ 1(),/; . i`d 1.3 2,/1%2 '#),%10 4#;,//,/; ed 1.3$ 4#*%)# +"# #<R1,7,1#/1 1.+#8
F%-'./,#$ '.3,/; 1/A/1*%10 6./ )#1(6# %) 6(+ '.3%(+$ .+ ./3 +,-#8
O!%1/A*"0/W=$(/!%L S%) . '%)+*%&,% +".+ "%&1$ . 6%/6#/+).+#1 %) &,-,+#1 /(-4#) %* $#6(),+,#$0 . 1#6&,/# ,/ +"# 7.&(# %* +"#$# ,/7#$+-#/+$ 2%(&1 6.($# +"# '%)+*%&,%I$ %7#).&& 7.&(# +% 1#6&,/# +% . ;)#.+#)
1#;)## +"./ . &#$$ 6%/6#/+).+#1 '%)+*%&,%8 !"# /%1/=*0&0*)*=(*1&7+& !"#$%&'($%)*+&,*$)(-& $%$#*.*%( +% -#.$()# '#)*%)-./6# .)# )#')#$#/+.+,7# %* 4)%.1 .$$#+ 6&.$$#$8 =%);./ >+./ ?#.&+"
=./.;#-#/+ )#+.,/$ +"# ),;"+ +% 6"./;# )#')#$#/+.+,7# ,/1,6#$ .+ ./3 +,-#8 C#6.($# %* +"#,) /.))%2 *%6($0 0*=(!"&/%A*0(.*%(0 +#/1 +% 4# -%)# 7%&.+,&# +"./ ,/7#$+-#/+$ +".+ 1,7#)$,*3 .6)%$$ -./3
$#6+%)$ ./1 6%-'./,#$8
?"!N(-&/%A*0(/%# 1%#$ /%+ ;(.)./+## . ')%K+ %) #&,-,/.+# ),$D8 !"# $+%6D$ %* +"#$# 6%-'./,#$ 6./ ".7# )#&.+,7#&3 ",;" 7.&(.+,%/$8 C#6.($# %* +"#$# ",;" 7.&(.+,%/$0 ./ ,/7#$+-#/+ ,/ . ;)%2+" $+%6D
6./ 4# -%)# ),$D3 +"./ ./ ,/7#$+-#/+ ,/ . 6%-'./3 2,+" -%)# -%1#$+ ;)%2+" #<'#6+.+,%/$8 `$)<*&/%A*0(/%# 1%#$ /%+ ;(.)./+## . ')%K+ %) #&,-,/.+# ),$D8 W%+ .&& 6%-'./,#$ 2"%$# $+%6D$ .)#
!"#$%"&'("

6%/$,1#)#1 +% 4# 7.&(# $+%6D$ .)# .4&# +% +()/ +"#,) 4($,/#$$ .)%(/1 %) $(66#$$*(&&3 #-'&%3 6%))#6+,7# $+).+#;,#$ 2",6" 2%(&1 )#$(&+ ,/ $+%6D '),6#$ +".+ 1% /%+ ),$# .$ ,/,+,.&&3 #<'#6+#1 8
:/3 +3'# %* =!%(/%<!<0&!"&F*"/!1/=&/%A*0(.*%(&F)$% 1%#$ /%+ .$$()# . ')%K+ ./1 1%#$ /%+ ')%+#6+ .;.,/$+ &%$$ ,/ 1#6&,/,/; -.)D#+$8 >,/6# $(6" . '&./ ,/7%&7#$ 6%/+,/(%($ ,/7#$+-#/+ ,/ $#6(),+,#$
)#;.)1&#$$ %* [(6+(.+,/; '),6# #&$ %* $(6" $#6(),+,#$0 +"# ,/7#$+%) $"%(&1 6%/$,1#) ",$ K/./6,.& .4,&,+3 +% 6%/+,/(# ",$ '()6".$#$ +")%(;" '#),%1$ %* &%2 '),6# #&$ 8
!",$ -.+#),.& ,$ 1,$$#-,/.+#1 ,/ +"# _/,+#1 >+.+#$ %* :-#),6. 43 =%);./ >+./ >-,+" C.)/#3 EEF8 =%);./ >+./ ?#.&+" =./.;#-#/+ ,$ /%+ .6+,/; .$ . -(/,6,'.& .17,$%) +% ./3 -(/,6,'.& #/+,+3 %)
%4&,;.+#1 '#)$%/ 2,+",/ +"# -#./,/; %* >#6+,%/ ibC %* +"# >#6(),+,#$ G<6"./;# :6+ A+"# M=(/,6,'.& :17,$%) \(&#PB ./1 +"# %',/,%/$ %) 7,#2$ 6%/+.,/#1 "#)#,/ .)# /%+ ,/+#/1#1 +% 4# 0 ./1 1% /%+
6%/$+,+(+#0 .17,6# 2,+",/ +"# -#./,/; %* +"# =(/,6,'.& :17,$%) \( !",$ -.+#),.&0 %) ./3 '%)+,%/ +"#)#%*0 -.3 /%+ 4# )#'),/+#10 $%&1 %) )#1,$+),4(+#1 2,+"%(+ +"# 2),++#/ 6%/$#/+ %* =%);./ >+./
>-,+" C.)/#3 EEF8
s jdjd =%);./ >+./ >-,+" C.)/#3 EEF8 =#-4#) >9LF8
!"#$%"&'("

Allocation
MarketValue
($)%
Performance(%)
CurrentQuarter
FiscalYTD
1Year
3Years
5Years
7Years
10Years
SinceInception
InceptionDate
Ormond Beach General 54,430,930 100.00 6.44 6.44 21.52 10.67 7.69 9.65 9.23 6.78 04/01/2001
Ormond Beach Policy Index 5.88 5.88 21.31 10.05 7.69 9.21 9.12 6.58
Domestic Equity
HGK - Large Cap Value 12,288,820 22.58 8.71 8.71 26.18 9.55 6.67 10.86 10.54 12.21 05/01/2009
Russell 1000 VL 7.41 7.41 26.54 9.68 8.29 12.20 11.80 13.76
Sawgrass - Large Cap Growth 6,449,380 11.85 8.50 8.50 31.15 18.64 12.69 15.92 N/A 14.66 05/01/2012
Russell 1000 Gr 10.62 10.62 36.39 20.49 14.63 16.92 N/A 15.42
Polen - Large Cap Growth 6,458,963 11.87 10.64 10.64 39.20 24.88 18.10 18.84 N/A 16.89 05/01/2012
Russell 1000 Gr 10.62 10.62 36.39 20.49 14.63 16.92 N/A 15.42
Cambiar - Small/Mid Cap Value 3,344,923 6.15 8.26 8.26 32.08 13.46 N/A N/A N/A 16.79 07/01/2016
Russell 2500 VL 7.07 7.07 23.57 6.12 N/A N/A N/A 9.80
Fiera - Small/Mid Cap Growth 3,321,427 6.10 11.69 11.69 32.58 15.69 N/A N/A N/A 10.35 02/01/2015
Russell 2500 GR 10.57 10.57 32.65 15.17 N/A N/A N/A 11.38
International Equity
Delaware - International Value 3,407,682 6.26 9.15 9.15 20.34 9.06 5.92 7.35 5.97 5.55 08/01/2005
MSCI EAFE Net 8.17 8.17 22.01 9.56 5.67 6.35 5.50 4.90
Renaissance - International Growth 3,125,973 5.74 8.03 8.03 19.85 7.29 4.23 6.66 5.62 8.69 05/01/2009
MSCI AC World ex US Net 8.92 8.92 21.51 9.87 5.51 5.44 4.97 7.95
Fixed Income
Garcia Hamilton - Fixed Income 15,971,314 29.34 0.32 0.32 6.04 3.10 2.76 2.80 3.98 4.67 10/01/2003
BC Gov/Cr Intm 0.37 0.37 6.80 3.24 2.57 2.15 3.05 3.50
City of Ormond BeachAsset Allocation & Time Weighted Performance
as of December 31, 2019
The prices, quotes, or statistics contained herein have been obtained from sources believed to be reliable, however, its accuracy cannot be guaranteed. Past performance is not aguarantee of future results.
Page 1

%CurrentQuarter
FiscalYTD
1Year
3Years
5Years
7Years
10Years
SinceInception
InceptionDate
Ormond Beach General 100.00 6.32 6.32 21.06 10.17 7.11 9.14 8.71 6.12 03/31/2001
Domestic Equity
HGK - Large Cap Value 22.58 8.61 8.61 25.69 9.16 6.15 10.86 10.36 12.32 04/30/2009
Sawgrass - Large Cap Growth 11.85 8.36 8.36 30.57 18.20 11.65 15.59 N/A 14.03 04/30/2012
Polen - Large Cap Growth 11.87 10.49 10.49 39.52 24.80 16.68 17.75 N/A 15.62 04/30/2012
Cambiar - Small/Mid Cap Value 6.15 8.09 8.09 31.28 12.70 N/A N/A N/A 16.09 06/30/2016
Fiera - Small/Mid Cap Growth 6.10 11.54 11.54 31.82 15.24 N/A N/A N/A 9.71 01/31/2015
International Equity
Delaware - International Value 6.26 8.96 8.96 19.44 6.69 4.58 5.96 4.86 4.11 07/31/2005
Renaissance - International Growth 5.74 7.85 7.85 19.09 4.06 2.36 4.78 4.17 7.31 04/30/2009
Fixed Income
Garcia Hamilton - Fixed Income 29.34 0.26 0.26 5.77 3.05 2.64 2.65 3.67 4.27 09/30/2003
City of Ormond BeachAsset Allocation & Net Dollar Weighted Performance (IRR)
as of December 31, 2019
The prices, quotes, or statistics contained herein have been obtained from sources believed to be reliable, however, its accuracy cannot be guaranteed. Past performance is not aguarantee of future results.
Page 2

Manager Performance Chart Manager Risk & Return
Historic Asset Growth
Manager Annualized Performance
0.0
8.0
16.0
24.0
32.0
Re
turn
Current
Quarter
2019 1
Year
3
Years
5
Years
7
Years
10
Years
Since
Inception
Ormond Beach General Ormond Beach Policy Index
90-Day T-Bills
-1.5
0.0
1.5
3.0
4.5
6.0
7.5
9.0
Re
turn
(%)
-4.0 -2.0 0.0 2.0 4.0 6.0 8.0 10.0 12.0 14.0
Risk (Standard Deviation %)
CurrentQuarter
FiscalYTD
1Year
3Years
5Years
7Years
10Years
Inception04/01/2001
Ormond Beach General 6.44 6.44 21.52 10.67 7.69 9.65 9.23 6.78
Ormond Beach Policy Index 5.88 5.88 21.31 10.05 7.69 9.21 9.12 6.58
Differences 0.56 0.56 0.21 0.62 0.00 0.44 0.11 0.20
CurrentQuarter
YTD1
Year3
Years5
Years7
Years10
YearsInception
04/01/2001
Ormond Beach General
Beginning Market Value 51,496 46,465 46,465 43,773 42,493 32,439 27,638 21,941
Net Contributions -308 -1,644 -1,644 -3,605 -4,758 -4,627 -6,500 -8,318
Fees/Expenses -58 -225 -225 -644 -1,011 -1,364 -1,757 -2,772
Income 620 1,471 1,471 3,423 5,429 7,371 10,090 16,968
Gain/Loss 2,681 8,364 8,364 11,484 12,278 20,612 24,960 26,612
Ending Market Value 54,431 54,431 54,431 54,431 54,431 54,431 54,431 54,431
as of December 31, 2019
Total Fund - Executive Summary
City of Ormond Beach
The prices, quotes, or statistics contained herein have been obtained from sources believed to be reliable, however, its accuracy cannot be guaranteed. Past performance is not aguarantee of future results.
Page 3

������������ ���������������� ������������������������� ���������� �� ��������������� �������������� ����������������������� ����������������
Zephyr StyleADVISORZephyr StyleADVISOR: MSSB - Tampa, FL
Manager PerformanceApril 2001 - December 2019 (Single Computation)
50
100
150
200
250
300
350
Ormond Beach General - Total FundOrmond Beach General - Policy Index
0%
5%
10%
15%
Q1 2001 Q4 2003 Q4 2005 Q4 2007 Q4 2009 Q4 2011 Q4 2013 Q4 2015 Q4 2017 Q4 2019
Cumulative Excess Returnvs. Market Benchmark
Risk / ReturnApril 2001 - December 2019 (Single Computation)
Retu
rn
0%
1%
2%
3%
4%
5%
6%
7%
Standard Deviation
0% 2% 4% 6% 8% 10%
Ormond Beach General - Total Fund
Market Benchmark:Ormond Beach General - Policy Index
Cash Equivalent:Citigroup 3-month T-bill
Return & Risk AnalysisApril 2001 - December 2019: Summary Statistics
Ormond Beach General - Total Fund
Ormond Beach General - Policy Index
ReturnExcess Return
vs. Market
StandardDeviation
Betavs.
Market
MaximumDrawdown
UpCapture
vs.Market
DownCapture
vs.Market
Alphavs.
Market
SharpeRatio
R-Squaredvs.
Market
6.77% 0.19% 9.94% 0.96 -28.93% 99.17% 95.46% 0.41% 0.54 97.59%
6.58% 0.00% 10.20% 1.00 -31.33% 100.00% 100.00% 0.00% 0.51 100.00%
Page 4

Historic Change in Assets
Distribution of Returns
Quarterly Change in Assets
Ormond Beach General Ormond Beach Policy Index Net Cash Flow
($20.0)
$0.0
$20.0
$40.0
$60.0
$80.0
Ma
rke
t
Valu
e In
Milli
on
s
3/01 3/02 3/03 3/04 3/05 3/06 3/07 3/08 3/09 3/10 3/11 3/12 3/13 3/14 3/15 3/16 3/17 3/18 12/19
$10.9
$52.2
$54.4
Market ValueAs of
10/01/2019
NetTransfers
Contributions Distributions Fees Expenses IncomeReturn OnInvestment
Market ValueAs of
12/31/2019
Ormond Beach General 51,495.97 - 1,757.71 -2,065.82 -58.10 - 619.98 3,301.16 54,430.93
0
25
50
75
100
Fre
qu
en
cy
< -5 -5 To -4 -4 To -3 -3 To -2 -2 To -1 -1 To 0 0 To 1 1 To 2 2 To 3 3 To 4 4 To 5 > 5
Returns (%)
2 4 4
1318
26
56 56
33
10
2 1
City of Ormond Beach
as of December 31, 2019
Total Fund - Change in Assets & Distribution of Returns
The prices, quotes, or statistics contained herein have been obtained from sources believed to be reliable, however, its accuracy cannot be guaranteed. Past performance is not aguarantee of future results.
Page 5
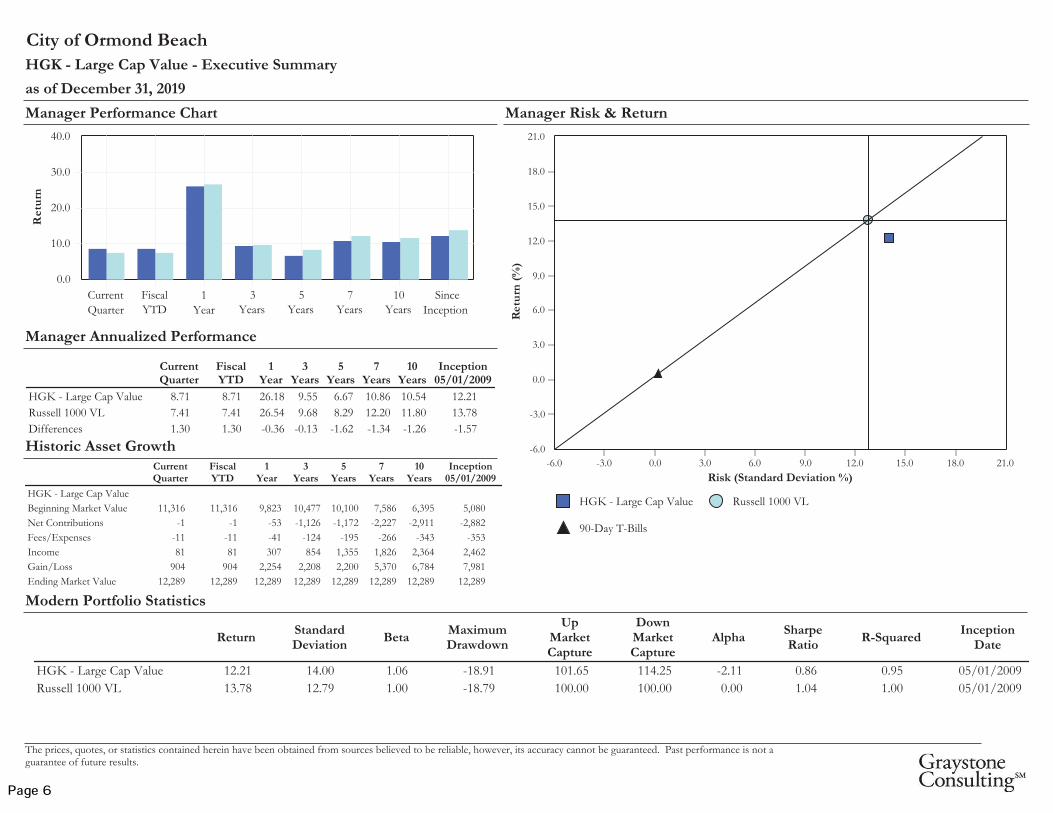
Manager Performance Chart Manager Risk & Return
Modern Portfolio Statistics
Historic Asset Growth
Manager Annualized Performance
0.0
10.0
20.0
30.0
40.0
Re
turn
Current
Quarter
Fiscal
YTD
1
Year
3
Years
5
Years
7
Years
10
Years
Since
Inception
HGK - Large Cap Value Russell 1000 VL
90-Day T-Bills
-6.0
-3.0
0.0
3.0
6.0
9.0
12.0
15.0
18.0
21.0
Re
turn
(%)
-6.0 -3.0 0.0 3.0 6.0 9.0 12.0 15.0 18.0 21.0
Risk (Standard Deviation %)
CurrentQuarter
FiscalYTD
1Year
3Years
5Years
7Years
10Years
Inception05/01/2009
HGK - Large Cap Value 8.71 8.71 26.18 9.55 6.67 10.86 10.54 12.21
Russell 1000 VL 7.41 7.41 26.54 9.68 8.29 12.20 11.80 13.78
Differences 1.30 1.30 -0.36 -0.13 -1.62 -1.34 -1.26 -1.57
CurrentQuarter
FiscalYTD
1Year
3Years
5Years
7Years
10Years
Inception05/01/2009
HGK - Large Cap Value
Beginning Market Value 11,316 11,316 9,823 10,477 10,100 7,586 6,395 5,080
Net Contributions -1 -1 -53 -1,126 -1,172 -2,227 -2,911 -2,882
Fees/Expenses -11 -11 -41 -124 -195 -266 -343 -353
Income 81 81 307 854 1,355 1,826 2,364 2,462
Gain/Loss 904 904 2,254 2,208 2,200 5,370 6,784 7,981
Ending Market Value 12,289 12,289 12,289 12,289 12,289 12,289 12,289 12,289
ReturnStandardDeviation
BetaMaximumDrawdown
UpMarketCapture
DownMarketCapture
AlphaSharpeRatio
R-SquaredInception
Date
HGK - Large Cap Value 12.21 14.00 1.06 -18.91 101.65 114.25 -2.11 0.86 0.95 05/01/2009
Russell 1000 VL 13.78 12.79 1.00 -18.79 100.00 100.00 0.00 1.04 1.00 05/01/2009
90-Day T-Bills 0.53 0.22 0.00 0.00 1.53 -1.22 0.54 N/A 0.00 05/01/2009
as of December 31, 2019
HGK - Large Cap Value - Executive Summary
City of Ormond Beach
The prices, quotes, or statistics contained herein have been obtained from sources believed to be reliable, however, its accuracy cannot be guaranteed. Past performance is not aguarantee of future results.
Page 6

Historic Change in Assets
Distribution of Returns
Quarterly Change in Assets
HGK - Large Cap Value Russell 1000 VL Net Cash Flow
($6.0)
$0.0
$6.0
$12.0
$18.0
$24.0
Ma
rke
t
Valu
e In
Milli
on
s
4/09 1/10 10/10 7/11 4/12 1/13 10/13 7/14 4/15 1/16 10/16 7/17 4/18 1/19 12/19
$1.8
$14.7
$12.3
Market ValueAs of
10/01/2019
NetTransfers
Contributions Distributions Fees ExpensesReturn OnInvestment
Market ValueAs of
12/31/2019
HGK - Large Cap Value 11,315,585.92 - 81,271.36 -82,189.68 -10,754.01 - 984,906.33 12,288,819.92
0
8
16
24
32
Fre
qu
en
cy
< -5 -5 To -4 -4 To -3 -3 To -2 -2 To -1 -1 To 0 0 To 1 1 To 2 2 To 3 3 To 4 4 To 5 > 5
Returns (%)
12
46
46
1513
12
15
18
7
16
City of Ormond Beach
as of December 31, 2019
HGK - Large Cap Value - Change in Assets & Distribution of Returns
The prices, quotes, or statistics contained herein have been obtained from sources believed to be reliable, however, its accuracy cannot be guaranteed. Past performance is not aguarantee of future results.
Page 7

Sharpe Ratio
0.0
0.4
0.8
1.2
1.6
12/19 12/18 12/17 12/16
0.7
0.6
0.8 0.8
0.60.6
0.50.5
Beta
0.0
0.6
1.2
1.8
-0.6
12/19 12/18 12/17 12/16
1.11.2 1.2 1.2
Up Market Capture
0.0
150.0
300.0
-150.0
12/19 12/18 12/17 12/16
109.9119.6 111.2 108.0
Down Market Capture
0.0
150.0
300.0
-150.0
12/19 12/18 12/17 12/16
117.7 120.2138.0 137.3
City of Ormond BeachHGK - Large Cap Value - Rolling Three Year MPT Statistics
as of December 31, 2019
The prices, quotes, or statistics contained herein have been obtained from sources believed to be reliable, however, its accuracy cannot be guaranteed. Past performance is not aguarantee of future results.
Page 8

Allocation
HGK - Large Cap Value Russell 1000 VL
0.0 6.0 12.0 18.0 24.0 30.0 36.0
Utilities
Real Estate
Materials
Information Technology
Industrials
Health Care
Financials
Energy
Consumer Staples
Consumer Discretionary
Communication Services
Performance
HGK - Large Cap Value Russell 1000 VL
0.0 10.0 20.0 30.0-10.0-20.0
Utilities
Real Estate
Materials
Information Technology
Industrials
Health Care
Financials
Energy
Consumer Staples
Consumer Discretionary
Communication Services
Total Attribution
0.0 0.2 0.4 0.6 0.8 1.0 1.2 1.4 1.6-0.2-0.4-0.6-0.8-1.0
Utilities
Real Estate
Materials
Information Technology
Industrials
Health Care
Financials
Energy
Consumer Staples
Consumer Discretionary
Communication Services
City of Ormond Beach
HGK - Large Cap Value - Quarterly Performance Attributes
as of December 31, 2019
The prices, quotes, or statistics contained herein have been obtained from sources believed to be reliable, however, its accuracy cannot be guaranteed. Past performance is not aguarantee of future results.
Page 9

Allocation - 10/01/2019
Portfolio Benchmark
Performance - Quarter EndingDecember 31, 2019
Portfolio Benchmark
Attribution
Sector Stock Interaction Total
Communication Services 8.00 8.19 10.53 6.75 0.00 0.31 -0.01 0.30
Consumer Discretionary 3.87 6.09 9.27 4.11 0.07 0.31 -0.11 0.27
Consumer Staples 7.72 9.17 -0.60 3.49 0.06 -0.38 0.06 -0.26
Energy 10.69 8.37 2.64 5.72 -0.04 -0.26 -0.07 -0.37
Financials 19.18 23.56 14.64 9.97 -0.11 1.10 -0.20 0.78
Health Care 16.70 12.40 15.72 12.02 0.20 0.46 0.16 0.82
Industrials 10.22 9.41 12.94 9.01 0.01 0.37 0.03 0.41
Information Technology 7.93 6.02 9.10 12.18 0.09 -0.19 -0.06 -0.15
Materials 5.45 4.29 9.61 8.07 0.01 0.07 0.02 0.09
Real Estate 6.21 5.51 -4.58 -0.04 -0.05 -0.25 -0.03 -0.33
Utilities 4.04 7.01 -6.34 0.54 0.20 -0.48 0.20 -0.07
Total 100.00 100.00 8.90 7.41 0.44 1.07 -0.02 1.49
City of Ormond BeachHGK - Large Cap Value - Quarterly Performance Attributes
as of December 31, 2019
All the values for Allocation, Performance and Attribution are expresssed in Percentage(%) termsThe prices, quotes, or statistics contained herein have been obtained from sources believed to be reliable, however, its accuracy cannot be guaranteed. Past performance is not aguarantee of future results.
Page 10

Portfolio Characteristics
Portfolio Benchmark
Wtd. Avg. Mkt. Cap ($000) 109,171,366.81 131,913,417.27
Median Mkt. Cap ($000) 39,121,650.50 9,882,157.10
Price/Earnings ratio 15.96 18.40
Price/Book ratio 2.28 2.26
5 Yr. EPS Growth Rate (%) 7.41 6.25
Beta (5 Years, Monthly) 1.18 1.00
Number of Stocks 50 764
Debt to Equity 0.13 0.51
Top Ten Equity Holdings
PortfolioWeight
(%)
BenchmarkWeight
(%)
ActiveWeight
(%)
QuarterlyReturn
(%)
Citigroup Inc 2.51 1.21 1.30 16.45
Conocophillips 2.40 0.50 1.90 15.01
Bristol-Myers Squibb Co 2.34 0.43 1.91 27.63
Metlife Inc. 2.29 0.28 2.01 9.08
Universal Health Services Inc. 2.29 0.08 2.21 -3.42
Unitedhealth Group Inc 2.28 0.00 2.28 35.80
Discovery Communications 2.28 0.04 2.24 22.94
Capital One Financial Corp. 2.28 0.33 1.95 13.58
CVS Health Corp 2.24 0.67 1.57 18.69
AbbVie Inc 2.23 0.00 2.23 18.63
% of Portfolio 23.14 3.54 19.60
Ten Best Performers
PortfolioWeight
(%)
BenchmarkWeight
(%)
ActiveWeight
(%)
QuarterlyReturn
(%)
Unitedhealth Group Inc 2.28 0.00 2.28 35.80
State Street Corp 2.22 0.20 2.02 34.51
Apple Inc 1.48 0.00 1.48 31.50
Bristol-Myers Squibb Co 2.34 0.43 1.91 27.63
Discovery Communications 2.28 0.04 2.24 22.94
JPMorgan Chase & Co 2.22 3.02 -0.80 19.40
CVS Health Corp 2.24 0.67 1.57 18.69
AbbVie Inc 2.23 0.00 2.23 18.63
Lear Corp 2.16 0.06 2.10 17.09
Intel Corp 2.14 1.81 0.33 16.78
% of Portfolio 21.59 6.23 15.36
Ten Worst Performers
PortfolioWeight
(%)
BenchmarkWeight
(%)
ActiveWeight
(%)
QuarterlyReturn
(%)
Welltower Inc 1.99 0.23 1.76 -8.83
Constellation Brands Inc 2.15 0.21 1.94 -8.10
IBM Corp. 2.14 0.33 1.81 -6.74
Occidental Petroleum Corp 1.82 0.26 1.56 -5.37
J.M. Smucker Co (The) 2.10 0.08 2.02 -4.56
Public Service Ent. Group 1.78 0.21 1.57 -4.11
Universal Health Services Inc. 2.29 0.08 2.21 -3.42
Consolidated Edison Inc. 1.97 0.21 1.76 -3.41
Simon Property Group Inc. 2.09 0.04 2.05 -2.99
Kimberly-Clark Corp 1.96 0.33 1.63 -2.44
% of Portfolio 20.29 1.98 18.31
City of Ormond BeachHGK - Large Cap Value - Portfolio Characteristics
as of December 31, 2019
Page 11

Manager Performance Chart Manager Risk & Return
Modern Portfolio Statistics
Historic Asset Growth
Manager Annualized Performance
0.0
15.0
30.0
45.0
60.0
Re
turn
Current
Quarter
Fiscal
YTD
1
Year
3
Years
5
Years
7
Years
Since
Inception
Sawgrass - Large Cap Growth Russell 1000 Gr
90-Day T-Bills
-8.0
-4.0
0.0
4.0
8.0
12.0
16.0
20.0
24.0
Re
turn
(%)
-4.0 -2.0 0.0 2.0 4.0 6.0 8.0 10.0 12.0 14.0 16.0
Risk (Standard Deviation %)
CurrentQuarter
FiscalYTD
1Year
3Years
5Years
7Years
Inception05/01/2012
Sawgrass - Large Cap Growth 8.50 8.50 31.15 18.64 12.69 15.92 14.66
Russell 1000 Gr 10.62 10.62 36.39 20.49 14.63 16.92 15.44
Differences -2.12 -2.12 -5.24 -1.85 -1.94 -1.00 -0.78
CurrentQuarter
FiscalYTD
1Year
3Years
5Years
7Years
Inception05/01/2012
Sawgrass - Large Cap Growth
Beginning Market Value 6,195 6,195 5,409 5,122 4,999 3,733 3,698
Net Contributions -251 -251 -556 -1,586 -1,832 -2,487 -2,488
Fees/Expenses -8 -8 -32 -93 -147 -197 -216
Income 27 27 98 316 479 622 667
Gain/Loss 487 487 1,530 2,691 2,950 4,779 4,788
Ending Market Value 6,449 6,449 6,449 6,449 6,449 6,449 6,449
ReturnStandardDeviation
BetaMaximumDrawdown
UpMarketCapture
DownMarketCapture
AlphaSharpeRatio
R-SquaredInception
Date
Sawgrass - Large Cap Growth 14.66 9.96 0.81 -10.53 88.80 80.52 2.03 1.36 0.91 05/01/2012
Russell 1000 Gr 15.44 11.76 1.00 -15.89 100.00 100.00 0.00 1.23 1.00 05/01/2012
90-Day T-Bills 0.70 0.25 0.00 0.00 2.13 -1.69 0.69 N/A 0.00 05/01/2012
as of December 31, 2019
Sawgrass - Large Cap Growth - Executive Summary
City of Ormond Beach
The prices, quotes, or statistics contained herein have been obtained from sources believed to be reliable, however, its accuracy cannot be guaranteed. Past performance is not aguarantee of future results.
Page 12

Historic Change in Assets
Distribution of Returns
Quarterly Change in Assets
Sawgrass - Large Cap Growth Russell 1000 Gr Net Cash Flow
($3.0)
$0.0
$3.0
$6.0
$9.0
Ma
rke
t
Valu
e In
Milli
on
s
4/12 10/12 4/13 10/13 4/14 10/14 4/15 10/15 4/16 10/16 4/17 10/17 4/18 10/18 4/19 12/19
$1.0
$6.9
$6.4
Market ValueAs of
10/01/2019
NetTransfers
Contributions Distributions Fees ExpensesReturn OnInvestment
Market ValueAs of
12/31/2019
Sawgrass - Large Cap Growth 6,194,528.01 - 27,129.43 -277,632.40 -8,278.86 - 513,634.08 6,449,380.26
0
6
12
18
24
Fre
qu
en
cy
< -5 -5 To -4 -4 To -3 -3 To -2 -2 To -1 -1 To 0 0 To 1 1 To 2 2 To 3 3 To 4 4 To 5 > 5
Returns (%)
4
1 1
7 7 7
13
15
1112
5
9
City of Ormond Beach
as of December 31, 2019
Sawgrass - Large Cap Growth - Change in Assets & Distribution of Returns
The prices, quotes, or statistics contained herein have been obtained from sources believed to be reliable, however, its accuracy cannot be guaranteed. Past performance is not aguarantee of future results.
Page 13

Sharpe Ratio
0.0
0.7
1.4
2.1
2.8
12/19 12/18 12/17 12/16
0.9 0.9
1.9
0.6
1.1 1.1
1.8
0.4
Beta
0.0
0.5
1.0
1.5
-0.5
12/19 12/18 12/17 12/16
0.8 0.8 0.80.8
Up Market Capture
0.0
100.0
200.0
-100.0
12/19 12/18 12/17 12/16
91.0 86.7 79.9 83.9
Down Market Capture
0.0
100.0
200.0
-100.0
12/19 12/18 12/17 12/16
81.4 77.1 75.6
92.1
City of Ormond BeachSawgrass - Large Cap Growth - Rolling Two Year MPT Statistics
as of December 31, 2019
The prices, quotes, or statistics contained herein have been obtained from sources believed to be reliable, however, its accuracy cannot be guaranteed. Past performance is not aguarantee of future results.
Page 14

Allocation
Sawgrass - Large Cap Growth
Russell 1000 Gr
0.0 10.0 20.0 30.0 40.0 50.0 60.0
Real Estate
Materials
Information Technology
Industrials
Health Care
Financials
Energy
Consumer Staples
Consumer Discretionary
Communication Services
Performance
Sawgrass - Large Cap Growth
Russell 1000 Gr
0.0 8.0 16.0 24.0-8.0-16.0
Real Estate
Materials
Information Technology
Industrials
Health Care
Financials
Energy
Consumer Staples
Consumer Discretionary
Communication Services
Total Attribution
0.0 0.2 0.4 0.6 0.8-0.2-0.4-0.6-0.8-1.0-1.2
Real Estate
Materials
Information Technology
Industrials
Health Care
Financials
Energy
Consumer Staples
Consumer Discretionary
Communication Services
City of Ormond Beach
Sawgrass - Large Cap Growth - Quarterly Performance Attributes
as of December 31, 2019
The prices, quotes, or statistics contained herein have been obtained from sources believed to be reliable, however, its accuracy cannot be guaranteed. Past performance is not aguarantee of future results.
Page 15

Allocation - 10/01/2019
Portfolio Benchmark
Performance - Quarter EndingDecember 31, 2019
Portfolio Benchmark
Attribution
Sector Stock Interaction Total
Communication Services 14.81 11.41 8.14 10.78 0.01 -0.30 -0.09 -0.38
Consumer Discretionary 12.56 14.43 -0.09 6.13 0.08 -0.90 0.12 -0.70
Consumer Staples 6.72 4.93 4.07 3.61 -0.12 0.02 0.01 -0.09
Energy 0.00 0.27 0.00 6.36 0.01 0.00 0.00 0.01
Financials 3.95 3.16 8.49 8.91 -0.01 -0.01 0.00 -0.03
Health Care 13.11 14.23 16.65 15.49 -0.06 0.16 -0.01 0.10
Industrials 14.13 9.97 5.68 2.65 -0.33 0.30 0.13 0.10
Information Technology 32.51 37.58 12.87 14.40 -0.20 -0.57 0.08 -0.69
Materials 2.21 1.45 -2.30 1.76 -0.07 -0.06 -0.03 -0.16
Real Estate 0.00 2.58 0.00 0.90 0.25 0.00 0.00 0.25
Total 100.00 100.00 8.92 10.52 -0.43 -1.35 0.19 -1.60
City of Ormond BeachSawgrass - Large Cap Growth - Quarterly Performance Attributes
as of December 31, 2019
All the values for Allocation, Performance and Attribution are expresssed in Percentage(%) termsThe prices, quotes, or statistics contained herein have been obtained from sources believed to be reliable, however, its accuracy cannot be guaranteed. Past performance is not aguarantee of future results.
Page 16

Portfolio Characteristics
Portfolio Benchmark
Wtd. Avg. Mkt. Cap ($000) 324,432,892.86 386,597,171.99
Median Mkt. Cap ($000) 125,504,418.00 13,375,054.25
Price/Earnings ratio 24.48 29.36
Price/Book ratio 5.40 7.87
5 Yr. EPS Growth Rate (%) 12.40 21.83
Beta (5 Years, Monthly) 0.80 1.00
Number of Stocks 50 530
Debt to Equity -0.64 0.75
Top Ten Equity Holdings
PortfolioWeight
(%)
BenchmarkWeight
(%)
ActiveWeight
(%)
QuarterlyReturn
(%)
Apple Inc 6.87 8.54 -1.67 31.50
Microsoft Corp 5.72 7.80 -2.08 13.82
Alphabet Inc 5.05 2.62 2.43 9.68
Home Depot Inc. (The) 3.36 0.90 2.46 -5.28
Amgen Inc 3.33 0.87 2.46 25.40
Comcast Corp 3.14 0.62 2.52 0.23
Mastercard Inc 3.10 1.73 1.37 10.08
Honeywell International Inc 2.81 0.41 2.40 5.13
Oracle Corp 2.79 0.71 2.08 -3.30
TJX Companies Inc (The) 2.67 0.48 2.19 9.98
% of Portfolio 38.84 24.68 14.16
Ten Best Performers
PortfolioWeight
(%)
BenchmarkWeight
(%)
ActiveWeight
(%)
QuarterlyReturn
(%)
Unitedhealth Group Inc 2.03 1.82 0.21 35.80
Apple Inc 6.87 8.54 -1.67 31.50
Amgen Inc 3.33 0.87 2.46 25.40
Varian Medical Systems Inc 0.89 0.08 0.81 19.25
AbbVie Inc 1.40 0.86 0.54 18.63
Intel Corp 1.42 0.00 1.42 16.78
Broadcom Inc 2.58 0.80 1.78 15.64
Illinois Tool Works Inc. 1.55 0.38 1.17 15.47
Citrix Systems Inc. 1.50 0.08 1.42 15.26
Facebook Inc 2.55 3.21 -0.66 15.26
% of Portfolio 24.12 16.64 7.48
Ten Worst Performers
PortfolioWeight
(%)
BenchmarkWeight
(%)
ActiveWeight
(%)
QuarterlyReturn
(%)
McDonald's Corp 0.96 0.16 0.80 -7.38
Akamai Technologies Inc 0.98 0.08 0.90 -5.47
Verisk Analytics Inc 0.94 0.16 0.78 -5.40
Home Depot Inc. (The) 3.36 0.90 2.46 -5.28
Dunkin' Brands Group Inc 1.44 0.04 1.40 -4.35
Oracle Corp 2.79 0.71 2.08 -3.30
Ecolab Inc. 1.53 0.32 1.21 -2.30
Cisco Systems Inc 2.07 1.34 0.73 -2.21
Dell Technologies Inc 1.22 0.04 1.18 -0.91
Comcast Corp 3.14 0.62 2.52 0.23
% of Portfolio 18.43 4.37 14.06
City of Ormond BeachSawgrass - Large Cap Growth - Portfolio Characteristics
as of December 31, 2019
Page 17

Manager Performance Chart Manager Risk & Return
Modern Portfolio Statistics
Historic Asset Growth
Manager Annualized Performance
0.0
15.0
30.0
45.0
60.0
Re
turn
Current
Quarter
Fiscal
YTD
1
Year
3
Years
5
Years
7
Years
Since
Inception
Polen - Large Cap Growth Russell 1000 Gr
90-Day T-Bills
-8.0
-4.0
0.0
4.0
8.0
12.0
16.0
20.0
24.0
Re
turn
(%)
-4.0 -2.0 0.0 2.0 4.0 6.0 8.0 10.0 12.0 14.0 16.0
Risk (Standard Deviation %)
CurrentQuarter
FiscalYTD
1Year
3Years
5Years
7Years
Inception05/01/2012
Polen - Large Cap Growth 10.64 10.64 39.20 24.88 18.10 18.84 16.89
Russell 1000 Gr 10.62 10.62 36.39 20.49 14.63 16.92 15.44
Differences 0.02 0.02 2.81 4.39 3.47 1.92 1.45
CurrentQuarter
FiscalYTD
1Year
3Years
5Years
7Years
Inception05/01/2012
Polen - Large Cap Growth
Beginning Market Value 5,949 5,949 5,456 5,526 5,223 3,630 3,683
Net Contributions -110 -110 -953 -3,049 -3,594 -3,596 -3,597
Fees/Expenses -9 -9 -35 -109 -175 -226 -235
Income 9 9 45 140 244 335 368
Gain/Loss 620 620 1,946 3,951 4,760 6,316 6,240
Ending Market Value 6,459 6,459 6,459 6,459 6,459 6,459 6,459
ReturnStandardDeviation
BetaMaximumDrawdown
UpMarketCapture
DownMarketCapture
AlphaSharpeRatio
R-SquaredInception
Date
Polen - Large Cap Growth 16.89 11.60 0.92 -12.60 97.80 81.78 2.49 1.35 0.87 05/01/2012
Russell 1000 Gr 15.44 11.76 1.00 -15.89 100.00 100.00 0.00 1.23 1.00 05/01/2012
90-Day T-Bills 0.70 0.25 0.00 0.00 2.13 -1.69 0.69 N/A 0.00 05/01/2012
as of December 31, 2019
Polen - Large Cap Growth - Executive Summary
City of Ormond Beach
The prices, quotes, or statistics contained herein have been obtained from sources believed to be reliable, however, its accuracy cannot be guaranteed. Past performance is not aguarantee of future results.
Page 18

Historic Change in Assets
Distribution of Returns
Quarterly Change in Assets
Polen - Large Cap Growth Russell 1000 Gr Net Cash Flow
($4.0)
$0.0
$4.0
$8.0
$12.0
Ma
rke
t
Valu
e In
Milli
on
s
4/12 10/12 4/13 10/13 4/14 10/14 4/15 10/15 4/16 10/16 4/17 10/17 4/18 10/18 4/19 12/19
($0.1)
$5.9
$6.5
Market ValueAs of
10/01/2019
NetTransfers
Contributions Distributions Fees ExpensesReturn OnInvestment
Market ValueAs of
12/31/2019
Polen - Large Cap Growth 5,949,302.03 - 9,166.59 -119,649.86 -9,007.12 - 629,150.91 6,458,962.55
0
5
10
15
20
Fre
qu
en
cy
< -5 -5 To -4 -4 To -3 -3 To -2 -2 To -1 -1 To 0 0 To 1 1 To 2 2 To 3 3 To 4 4 To 5 > 5
Returns (%)
3 3
0
8
6
1112
1011
5
9
14
City of Ormond Beach
as of December 31, 2019
Polen - Large Cap Growth - Change in Assets & Distribution of Returns
The prices, quotes, or statistics contained herein have been obtained from sources believed to be reliable, however, its accuracy cannot be guaranteed. Past performance is not aguarantee of future results.
Page 19

Sharpe Ratio
0.0
0.7
1.4
2.1
2.8
12/19 12/18 12/17 12/16
0.9 0.9
1.9
0.6
1.41.3
1.5
0.7
Beta
0.0
0.5
1.0
1.5
-0.5
12/19 12/18 12/17 12/16
0.9 0.9 0.9 0.9
Up Market Capture
0.0
100.0
200.0
-100.0
12/19 12/18 12/17 12/16
109.6 108.8
87.5100.4
Down Market Capture
0.0
100.0
200.0
-100.0
12/19 12/18 12/17 12/16
79.0 81.3
113.4
83.3
City of Ormond BeachPolen - Large Cap Growth - Rolling Two Year MPT Statistics
as of December 31, 2019
The prices, quotes, or statistics contained herein have been obtained from sources believed to be reliable, however, its accuracy cannot be guaranteed. Past performance is not aguarantee of future results.
Page 20

Allocation
Polen - Large Cap Growth
Russell 1000 Gr
0.0 15.0 30.0 45.0 60.0 75.0
Real Estate
Materials
Information Technology
Industrials
Health Care
Financials
Energy
Consumer Staples
Consumer Discretionary
Communication Services
Performance
Polen - Large Cap Growth
Russell 1000 Gr
0.0 6.0 12.0 18.0 24.0 30.0 36.0
Real Estate
Materials
Information Technology
Industrials
Health Care
Financials
Energy
Consumer Staples
Consumer Discretionary
Communication Services
Total Attribution
0.0 0.4 0.8 1.2 1.6 2.0-0.4-0.8-1.2-1.6-2.0-2.4-2.8
Real Estate
Materials
Information Technology
Industrials
Health Care
Financials
Energy
Consumer Staples
Consumer Discretionary
Communication Services
City of Ormond Beach
Polen - Large Cap Growth - Quarterly Performance Attributes
as of December 31, 2019
The prices, quotes, or statistics contained herein have been obtained from sources believed to be reliable, however, its accuracy cannot be guaranteed. Past performance is not aguarantee of future results.
Page 21

Allocation - 10/01/2019
Portfolio Benchmark
Performance - Quarter EndingDecember 31, 2019
Portfolio Benchmark
Attribution
Sector Stock Interaction Total
Communication Services 18.27 11.41 12.21 10.78 0.02 0.16 0.10 0.28
Consumer Discretionary 18.70 14.43 4.34 6.13 -0.19 -0.26 -0.08 -0.52
Consumer Staples 0.00 4.93 0.00 3.61 0.34 0.00 0.00 0.34
Energy 0.00 0.27 0.00 6.36 0.01 0.00 0.00 0.01
Financials 2.15 3.16 18.89 8.91 0.02 0.32 -0.10 0.23
Health Care 10.58 14.23 22.38 15.49 -0.18 0.98 -0.25 0.55
Industrials 0.00 9.97 0.00 2.65 0.78 0.00 0.00 0.78
Information Technology 50.30 37.58 10.00 14.40 0.49 -1.65 -0.56 -1.72
Materials 0.00 1.45 0.00 1.76 0.13 0.00 0.00 0.13
Real Estate 0.00 2.58 0.00 0.90 0.25 0.00 0.00 0.25
Total 100.00 100.00 10.85 10.52 1.67 -0.45 -0.89 0.33
City of Ormond BeachPolen - Large Cap Growth - Quarterly Performance Attributes
as of December 31, 2019
All the values for Allocation, Performance and Attribution are expresssed in Percentage(%) termsThe prices, quotes, or statistics contained herein have been obtained from sources believed to be reliable, however, its accuracy cannot be guaranteed. Past performance is not aguarantee of future results.
Page 22

Portfolio Characteristics
Portfolio Benchmark
Wtd. Avg. Mkt. Cap ($000) 334,655,519.28 386,597,171.99
Median Mkt. Cap ($000) 126,623,722.66 13,375,054.25
Price/Earnings ratio 34.97 29.36
Price/Book ratio 9.33 7.87
5 Yr. EPS Growth Rate (%) 22.06 21.83
Beta (5 Years, Monthly) 0.92 1.00
Number of Stocks 25 530
Debt to Equity 1.64 0.75
Top Ten Equity Holdings
PortfolioWeight
(%)
BenchmarkWeight
(%)
ActiveWeight
(%)
QuarterlyReturn
(%)
Microsoft Corp 9.56 7.80 1.76 13.82
Visa Inc 7.34 2.11 5.23 9.42
Facebook Inc 7.16 3.21 3.95 15.26
Alphabet Inc 7.10 2.62 4.48 9.68
Adobe Inc 6.24 1.05 5.19 19.39
Zoetis Inc 5.60 0.41 5.19 6.37
Mastercard Inc 5.46 1.73 3.73 10.08
Accenture PLC 4.96 0.88 4.08 9.94
Nike Inc 4.23 0.82 3.41 8.15
Dollar General Corporation 3.95 0.25 3.70 -1.67
% of Portfolio 61.60 20.88 40.72
Ten Best Performers
PortfolioWeight
(%)
BenchmarkWeight
(%)
ActiveWeight
(%)
QuarterlyReturn
(%)
Align Technology Inc 2.93 0.14 2.79 54.23
Regeneron Pharma 2.49 0.04 2.45 35.36
Adobe Inc 6.24 1.05 5.19 19.39
MSCI Inc 2.16 0.14 2.02 18.89
Facebook Inc 7.16 3.21 3.95 15.26
Microsoft Corp 9.56 7.80 1.76 13.82
ServiceNow Inc 2.23 0.34 1.89 11.22
Mastercard Inc 5.46 1.73 3.73 10.08
O'Reilly Automotive Inc 3.91 0.21 3.70 9.97
Accenture PLC 4.96 0.88 4.08 9.94
% of Portfolio 47.10 15.54 31.56
Ten Worst Performers
PortfolioWeight
(%)
BenchmarkWeight
(%)
ActiveWeight
(%)
QuarterlyReturn
(%)
Dollar General Corporation 3.95 0.25 3.70 -1.67
Nestle SA 3.31 0.00 3.31 -0.35
Starbucks Corp 2.49 0.68 1.81 -0.08
Abbott Laboratories 2.97 0.42 2.55 4.23
PayPal Holdings Inc 3.24 0.83 2.41 4.42
Booking Holdings Inc 1.94 0.56 1.38 4.64
Automatic Data Processing Inc. 3.27 0.49 2.78 6.20
Zoetis Inc 5.60 0.41 5.19 6.37
Gartner Inc 3.17 0.09 3.08 7.77
Nike Inc 4.23 0.82 3.41 8.15
% of Portfolio 34.17 4.55 29.62
City of Ormond BeachPolen - Large Cap Growth - Portfolio Characteristics
as of December 31, 2019
Page 23

Manager Performance Chart Manager Risk & Return
Modern Portfolio Statistics
Historic Asset Growth
Manager Annualized Performance
0.0
15.0
30.0
45.0
Re
turn
Current
Quarter
Fiscal
YTD
1
Year
3
Years
Since
Inception
Cambiar - Small/Mid Cap Value Russell 2500 VL
90-Day T-Bills
-8.0
-4.0
0.0
4.0
8.0
12.0
16.0
20.0
24.0
Re
turn
(%)
-6.0 -3.0 0.0 3.0 6.0 9.0 12.0 15.0 18.0 21.0
Risk (Standard Deviation %)
CurrentQuarter
FiscalYTD
1Year
3Years
Inception07/01/2016
Cambiar - Small/Mid Cap Value 8.26 8.26 32.08 13.46 16.79
Russell 2500 VL 7.07 7.07 23.57 6.12 9.81
Differences 1.19 1.19 8.51 7.34 6.98
CurrentQuarter
FiscalYTD
1Year
3Years
Inception07/01/2016
Cambiar - SMID Cap Value
Beginning Market Value 3,095 3,095 2,559 2,416 2,051
Net Contributions - - -12 -94 -91
Fees/Expenses -5 -5 -19 -53 -57
Income 331 331 368 450 467
Gain/Loss -75 -75 449 625 975
Ending Market Value 3,345 3,345 3,345 3,345 3,345
ReturnStandardDeviation
BetaMaximumDrawdown
UpMarketCapture
DownMarketCapture
AlphaSharpeRatio
R-SquaredInception
Date
Cambiar - Small/Mid Cap Value 16.79 13.20 0.88 -12.60 108.90 71.16 7.60 1.14 0.91 07/01/2016
Russell 2500 VL 9.81 14.33 1.00 -18.42 100.00 100.00 0.00 0.63 1.00 07/01/2016
90-Day T-Bills 1.46 0.22 0.00 0.00 4.20 -3.22 1.48 N/A 0.02 07/01/2016
as of December 31, 2019
Cambiar - Small/Mid Cap Value - Executive Summary
City of Ormond Beach
The prices, quotes, or statistics contained herein have been obtained from sources believed to be reliable, however, its accuracy cannot be guaranteed. Past performance is not aguarantee of future results.
Page 24

Historic Change in Assets
Distribution of Returns
Quarterly Change in Assets
Cambiar - Small/Mid Cap Value Russell 2500 VL Net Cash Flow
$0.7
$1.4
$2.1
$2.8
$3.5
$4.2
Ma
rke
t
Valu
e In
Milli
on
s
6/16 9/16 12/16 3/17 6/17 9/17 12/17 3/18 6/18 9/18 12/18 3/19 6/19 9/19 12/19
$1.9
$2.7
$3.3
Market ValueAs of
10/01/2019
NetTransfers
Contributions Distributions Fees ExpensesReturn OnInvestment
Market ValueAs of
12/31/2019
Cambiar - Small/Mid Cap Value 3,094,725.29 - 347,702.61 -347,953.95 -5,028.42 - 255,477.52 3,344,923.05
0
3
6
9
12
Fre
qu
en
cy
< -5 -5 To -4 -4 To -3 -3 To -2 -2 To -1 -1 To 0 0 To 1 1 To 2 2 To 3 3 To 4 4 To 5 > 5
Returns (%)
3
0
1 1
3
4
5
8
5
3
5
4
City of Ormond Beach
as of December 31, 2019
Cambiar - Small/Mid Cap Value - Change in Assets & Distribution of Returns
The prices, quotes, or statistics contained herein have been obtained from sources believed to be reliable, however, its accuracy cannot be guaranteed. Past performance is not aguarantee of future results.
Page 25

Sharpe Ratio
0.0
0.5
1.0
1.5
-0.5
-1.0
12/19 12/18
0.2
-0.2
0.8
0.4
Beta
0.0
0.5
1.0
1.5
-0.5
12/19 12/18
0.90.8
Up Market Capture
0.0
100.0
200.0
-100.0
12/19 12/18
115.3 117.0
Down Market Capture
0.0
100.0
200.0
-100.0
12/19 12/18
74.8 73.9
City of Ormond BeachCambiar - Small/Mid Cap Value - Rolling Two Year MPT Statistics
as of December 31, 2019
The prices, quotes, or statistics contained herein have been obtained from sources believed to be reliable, however, its accuracy cannot be guaranteed. Past performance is not aguarantee of future results.
Page 26

Allocation
Cambiar - Small/Mid Cap Value
Russell 2500 VL
0.0 6.0 12.0 18.0 24.0 30.0 36.0
Utilities
Real Estate
Materials
Information Technology
Industrials
Health Care
Financials
Energy
Consumer Staples
Consumer Discretionary
Communication Services
Performance
Cambiar - Small/Mid Cap Value
Russell 2500 VL
0.0 10.0 20.0 30.0-10.0-20.0
Utilities
Real Estate
Materials
Information Technology
Industrials
Health Care
Financials
Energy
Consumer Staples
Consumer Discretionary
Communication Services
Total Attribution
0.0 0.3 0.6 0.9 1.2 1.5 1.8 2.1-0.3-0.6-0.9-1.2-1.5
Utilities
Real Estate
Materials
Information Technology
Industrials
Health Care
Financials
Energy
Consumer Staples
Consumer Discretionary
Communication Services
City of Ormond Beach
Cambiar - Small/Mid Cap Value - Quarterly Performance Attributes
as of December 31, 2019
The prices, quotes, or statistics contained herein have been obtained from sources believed to be reliable, however, its accuracy cannot be guaranteed. Past performance is not aguarantee of future results.
Page 27

Allocation - 10/01/2019
Portfolio Benchmark
Performance - Quarter EndingDecember 31, 2019
Portfolio Benchmark
Attribution
Sector Stock Interaction Total
Communication Services 0.00 3.09 0.00 8.84 -0.06 0.00 0.00 -0.06
Consumer Discretionary 12.07 10.32 7.91 6.34 -0.01 0.16 0.03 0.18
Consumer Staples 4.71 3.29 -8.66 6.26 -0.01 -0.49 -0.21 -0.71
Energy 0.00 4.34 0.00 8.58 -0.07 0.00 0.00 -0.07
Financials 22.38 23.71 5.67 6.98 0.00 -0.31 0.02 -0.29
Health Care 7.38 5.46 11.89 12.39 0.10 -0.03 -0.01 0.07
Industrials 22.75 13.14 10.28 9.66 0.25 0.08 0.06 0.39
Information Technology 20.12 8.78 15.61 13.13 0.69 0.22 0.28 1.19
Materials 2.75 6.21 7.46 7.96 -0.03 -0.03 0.02 -0.05
Real Estate 2.59 15.34 1.67 2.67 0.56 -0.15 0.13 0.53
Utilities 5.26 6.33 1.90 -2.04 0.10 0.25 -0.04 0.30
Total 100.00 100.00 8.52 7.04 1.52 -0.31 0.27 1.48
City of Ormond BeachCambiar - Small/Mid Cap Value - Quarterly Performance Attributes
as of December 31, 2019
All the values for Allocation, Performance and Attribution are expresssed in Percentage(%) termsThe prices, quotes, or statistics contained herein have been obtained from sources believed to be reliable, however, its accuracy cannot be guaranteed. Past performance is not aguarantee of future results.
Page 28

Portfolio Characteristics
Portfolio Benchmark
Wtd. Avg. Mkt. Cap ($000) 9,373,397.09 5,424,150.17
Median Mkt. Cap ($000) 8,512,651.68 1,091,602.10
Price/Earnings ratio 18.71 17.30
Price/Book ratio 2.38 1.95
5 Yr. EPS Growth Rate (%) 11.74 8.61
Beta (5 Years, Monthly) 0.89 1.00
Number of Stocks 39 1,804
Debt to Equity 0.30 1.04
Top Ten Equity Holdings
PortfolioWeight
(%)
BenchmarkWeight
(%)
ActiveWeight
(%)
QuarterlyReturn
(%)
Leidos Holdings Inc 3.14 0.46 2.68 14.41
Levi Strauss & Co 3.11 0.00 3.11 2.09
ON Semiconductor Corp 3.09 0.35 2.74 26.91
Qorvo Inc 3.03 0.00 3.03 56.77
Bruker Corp 3.00 0.00 3.00 16.12
Toro Co (The) 2.95 0.00 2.95 9.03
Huntington Ingalls Industries Inc 2.93 0.07 2.86 18.94
Arch Capital Group Ltd 2.92 0.00 2.92 2.17
East West Bancorp Inc 2.91 0.25 2.66 10.66
Westlake Chemical Corp 2.88 0.09 2.79 7.46
% of Portfolio 29.96 1.22 28.74
Ten Best Performers
PortfolioWeight
(%)
BenchmarkWeight
(%)
ActiveWeight
(%)
QuarterlyReturn
(%)
Qorvo Inc 3.03 0.00 3.03 56.77
ON Semiconductor Corp 3.09 0.35 2.74 26.91
PVH Corp 2.49 0.00 2.49 19.22
Huntington Ingalls Industries Inc 2.93 0.07 2.86 18.94
Incyte Corp 2.51 0.00 2.51 17.63
Zions Bancorporation NA 2.80 0.31 2.49 17.42
Bruker Corp 3.00 0.00 3.00 16.12
Masco Corp 2.40 0.00 2.40 15.51
Leidos Holdings Inc 3.14 0.46 2.68 14.41
VICI Properties Inc 1.69 0.41 1.28 14.15
% of Portfolio 27.08 1.60 25.48
Ten Worst Performers
PortfolioWeight
(%)
BenchmarkWeight
(%)
ActiveWeight
(%)
QuarterlyReturn
(%)
AXIS Capital Holdings Ltd 2.78 0.16 2.62 -9.75
MAXIMUS Inc. 2.39 0.00 2.39 -3.36
Advance Auto Parts Inc. 2.78 0.00 2.78 -3.13
Atmos Energy Corp 2.88 0.46 2.42 -1.26
Knight-Swift Transportation Holdings Inc 2.47 0.16 2.31 -1.10
Sabre Corp 2.55 0.18 2.37 0.82
Invitation Homes Inc 2.57 0.00 2.57 1.67
Levi Strauss & Co 3.11 0.00 3.11 2.09
Arch Capital Group Ltd 2.92 0.00 2.92 2.17
Qiagen NV 2.27 0.26 2.01 2.52
% of Portfolio 26.72 1.22 25.50
City of Ormond BeachCambiar - Small/Mid Cap Value - Portfolio Characteristics
as of December 31, 2019
Page 29

Manager Performance Chart Manager Risk & Return
Modern Portfolio Statistics
Historic Asset Growth
Manager Annualized Performance
0.0
15.0
30.0
45.0
Re
turn
Current
Quarter
Fiscal
YTD
1
Year
3
Years
Since
Inception
Fiera - Small/Mid Cap Growth Russell 2500 GR
90-Day T-Bills
-3.0
0.0
3.0
6.0
9.0
12.0
15.0
18.0
Re
turn
(%)
-9.0 -6.0 -3.0 0.0 3.0 6.0 9.0 12.0 15.0 18.0 21.0 24.0
Risk (Standard Deviation %)
CurrentQuarter
FiscalYTD
1Year
3Years
Inception02/01/2015
Fiera - Small/Mid Cap Growth 11.69 11.69 32.58 15.69 10.35
Russell 2500 GR 10.57 10.57 32.65 15.17 11.39
Differences 1.12 1.12 -0.07 0.52 -1.04
CurrentQuarter
FiscalYTD
1Year
3Years
Inception02/01/2015
Fiera - Small/Mid Cap Growth
Beginning Market Value 2,978 2,978 2,520 2,298 2,341
Net Contributions - - -1 -152 -283
Fees/Expenses -4 -4 -17 -50 -75
Income 7 7 21 52 78
Gain/Loss 341 341 799 1,173 1,260
Ending Market Value 3,321 3,321 3,321 3,321 3,321
ReturnStandardDeviation
BetaMaximumDrawdown
UpMarketCapture
DownMarketCapture
AlphaSharpeRatio
R-SquaredInception
Date
Fiera - Small/Mid Cap Growth 10.35 16.02 0.99 -20.39 97.61 101.74 -0.84 0.63 0.96 02/01/2015
Russell 2500 GR 11.39 15.83 1.00 -21.25 100.00 100.00 0.00 0.70 1.00 02/01/2015
90-Day T-Bills 1.06 0.26 0.00 0.00 2.67 -2.22 1.06 N/A 0.00 02/01/2015
as of December 31, 2019
Fiera Capital - Small/Mid Cap Growth - Executive Summary
City of Ormond Beach
The prices, quotes, or statistics contained herein have been obtained from sources believed to be reliable, however, its accuracy cannot be guaranteed. Past performance is not aguarantee of future results.
Page 30

Historic Change in Assets
Distribution of Returns
Quarterly Change in Assets
Fiera - Small/Mid Cap Growth Russell 2500 GR Net Cash Flow
$0.7
$1.4
$2.1
$2.8
$3.5
$4.2
Ma
rke
t
Valu
e In
Milli
on
s
1/15 4/15 7/15 10/15 1/16 4/16 7/16 10/16 1/17 4/17 7/17 10/17 1/18 4/18 7/18 10/18 1/19 4/19 7/19 12/19
$2.0
$3.5
$3.3
Market ValueAs of
10/01/2019
NetTransfers
Contributions Distributions Fees ExpensesReturn OnInvestment
Market ValueAs of
12/31/2019
Fiera - Small/Mid Cap Growth 2,978,123.09 - 7,334.38 -7,577.53 -4,466.91 - 348,014.19 3,321,427.22
0
4
8
12
16
Fre
qu
en
cy
< -5 -5 To -4 -4 To -3 -3 To -2 -2 To -1 -1 To 0 0 To 1 1 To 2 2 To 3 3 To 4 4 To 5 > 5
Returns (%)
7
1 10
65
7
8
56
3
10
City of Ormond Beach
as of December 31, 2019
Fiera Capital - Small/Mid Cap Growth - Change in Assets & Distribution of Returns
The prices, quotes, or statistics contained herein have been obtained from sources believed to be reliable, however, its accuracy cannot be guaranteed. Past performance is not aguarantee of future results.
Page 31

Allocation
Fiera - Small/Mid Cap Growth
Russell 2500 GR
0.0 8.0 16.0 24.0 32.0 40.0 48.0
Utilities
Real Estate
Materials
Information Technology
Industrials
Health Care
Financials
Energy
Consumer Staples
Consumer Discretionary
Communication Services
Performance
Fiera - Small/Mid Cap Growth
Russell 2500 GR
0.0 15.0 30.0 45.0-15.0
Utilities
Real Estate
Materials
Information Technology
Industrials
Health Care
Financials
Energy
Consumer Staples
Consumer Discretionary
Communication Services
Total Attribution
0.0 0.3 0.6 0.9 1.2 1.5 1.8-0.3-0.6-0.9-1.2-1.5
Utilities
Real Estate
Materials
Information Technology
Industrials
Health Care
Financials
Energy
Consumer Staples
Consumer Discretionary
Communication Services
City of Ormond Beach
Fiera - Small/Mid Cap Growth - Quarterly Performance Attributes
as of December 31, 2019
The prices, quotes, or statistics contained herein have been obtained from sources believed to be reliable, however, its accuracy cannot be guaranteed. Past performance is not aguarantee of future results.
Page 32
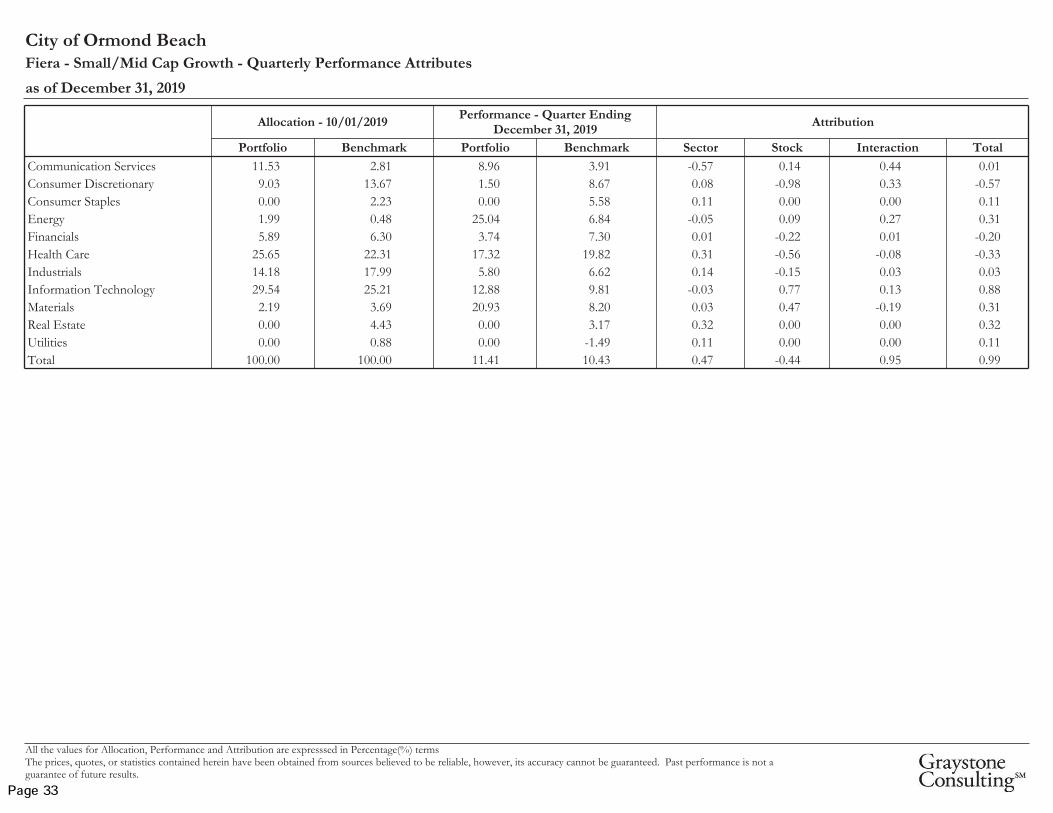
Allocation - 10/01/2019
Portfolio Benchmark
Performance - Quarter EndingDecember 31, 2019
Portfolio Benchmark
Attribution
Sector Stock Interaction Total
Communication Services 11.53 2.81 8.96 3.91 -0.57 0.14 0.44 0.01
Consumer Discretionary 9.03 13.67 1.50 8.67 0.08 -0.98 0.33 -0.57
Consumer Staples 0.00 2.23 0.00 5.58 0.11 0.00 0.00 0.11
Energy 1.99 0.48 25.04 6.84 -0.05 0.09 0.27 0.31
Financials 5.89 6.30 3.74 7.30 0.01 -0.22 0.01 -0.20
Health Care 25.65 22.31 17.32 19.82 0.31 -0.56 -0.08 -0.33
Industrials 14.18 17.99 5.80 6.62 0.14 -0.15 0.03 0.03
Information Technology 29.54 25.21 12.88 9.81 -0.03 0.77 0.13 0.88
Materials 2.19 3.69 20.93 8.20 0.03 0.47 -0.19 0.31
Real Estate 0.00 4.43 0.00 3.17 0.32 0.00 0.00 0.32
Utilities 0.00 0.88 0.00 -1.49 0.11 0.00 0.00 0.11
Total 100.00 100.00 11.41 10.43 0.47 -0.44 0.95 0.99
City of Ormond BeachFiera - Small/Mid Cap Growth - Quarterly Performance Attributes
as of December 31, 2019
All the values for Allocation, Performance and Attribution are expresssed in Percentage(%) termsThe prices, quotes, or statistics contained herein have been obtained from sources believed to be reliable, however, its accuracy cannot be guaranteed. Past performance is not aguarantee of future results.
Page 33

Portfolio Characteristics
Portfolio Benchmark
Wtd. Avg. Mkt. Cap ($000) 8,410,028.02 5,922,809.37
Median Mkt. Cap ($000) 6,158,890.63 1,330,361.76
Price/Earnings ratio 27.06 27.86
Price/Book ratio 5.58 5.12
5 Yr. EPS Growth Rate (%) 24.38 17.43
Beta (5 Years, Monthly) 0.99 1.00
Number of Stocks 68 1,409
Debt to Equity 1.11 1.32
Top Ten Equity Holdings
PortfolioWeight
(%)
BenchmarkWeight
(%)
ActiveWeight
(%)
QuarterlyReturn
(%)
Arrowhead Pharmaceuticals Inc 3.41 0.27 3.14 125.09
Live Nation Entertainment Inc 3.09 0.00 3.09 7.73
Splunk Inc 2.70 0.00 2.70 27.07
Entegris Inc 2.61 0.31 2.30 6.61
Broadridge Fin. Solutions 2.49 0.00 2.49 -0.27
Berry Global Group Inc 2.44 0.11 2.33 20.93
Copart Inc 2.39 0.00 2.39 13.21
Immunomedics Inc 2.35 0.16 2.19 59.58
IAC/InterActiveCorp 2.16 0.00 2.16 14.29
Aimmune Therapeutics Inc 2.12 0.07 2.05 59.84
% of Portfolio 25.76 0.92 24.84
Ten Best Performers
PortfolioWeight
(%)
BenchmarkWeight
(%)
ActiveWeight
(%)
QuarterlyReturn
(%)
Arrowhead Pharmaceuticals Inc 3.41 0.27 3.14 125.09
Aimmune Therapeutics Inc 2.12 0.07 2.05 59.84
Immunomedics Inc 2.35 0.16 2.19 59.58
arGEN-X SE 0.84 0.00 0.84 40.86
Valeant Pharmaceuticals Int'l Inc 1.37 0.00 1.37 36.93
BeiGene Ltd 1.22 0.00 1.22 35.36
WPX Energy Inc 0.87 0.00 0.87 29.74
Splunk Inc 2.70 0.00 2.70 27.07
Paycom Software Inc 1.35 0.61 0.74 26.38
Biomarin Pharmaceutical Inc 1.35 0.00 1.35 25.45
% of Portfolio 17.58 1.11 16.47
Ten Worst Performers
PortfolioWeight
(%)
BenchmarkWeight
(%)
ActiveWeight
(%)
QuarterlyReturn
(%)
Sage Therapeutics Inc 0.45 0.17 0.28 -48.54
Etsy Inc 1.65 0.24 1.41 -21.59
Insperity Inc. 0.84 0.15 0.69 -12.42
Portola Pharmaceuticals Inc 1.65 0.08 1.57 -10.96
iRhythm Technologies Inc 0.72 0.08 0.64 -8.12
Veeva Systems Inc 1.40 0.00 1.40 -7.88
Evercore Inc 0.75 0.05 0.70 -5.98
bluebird bio Inc 1.10 0.00 1.10 -4.43
Dunkin' Brands Group Inc 1.54 0.27 1.27 -4.35
Legg Mason Inc 1.47 0.00 1.47 -3.84
% of Portfolio 11.57 1.04 10.53
City of Ormond BeachFiera - Small/Mid Cap Growth - Portfolio Characteristics
as of December 31, 2019
Page 34

Manager Performance Chart Manager Risk & Return
Modern Portfolio Statistics
Historic Asset Growth
Manager Annualized Performance
0.0
8.0
16.0
24.0
32.0
Re
turn
Current
Quarter
Fiscal
YTD
1
Year
3
Years
5
Years
7
Years
10
Years
Since
Inception
Delaware - International Value MSCI EAFE Net
90-Day T-Bills
-1.0
0.0
1.0
2.0
3.0
4.0
5.0
6.0
7.0
8.0
Re
turn
(%)
-9.0 -6.0 -3.0 0.0 3.0 6.0 9.0 12.0 15.0 18.0 21.0 24.0
Risk (Standard Deviation %)
CurrentQuarter
FiscalYTD
1Year
3Years
5Years
7Years
10Years
Inception08/01/2005
Delaware - International Value 9.15 9.15 20.34 9.06 5.92 7.35 5.97 5.55
MSCI EAFE Net 8.17 8.17 22.01 9.56 5.67 6.35 5.50 4.91
Differences 0.98 0.98 -1.67 -0.50 0.25 1.00 0.47 0.64
CurrentQuarter
FiscalYTD
1Year
3Years
5Years
7Years
10Years
Inception08/01/2005
Delaware - Intl Value
Beginning Market Value 3,128 3,128 2,900 1,967 1,945 1,603 1,509 2,675
Net Contributions - - -51 893 891 892 892 -542
Fees/Expenses -6 -6 -23 -61 -91 -121 -155 -239
Income 26 26 119 305 443 603 788 1,247
Gain/Loss 260 260 462 303 220 431 374 266
Ending Market Value 3,408 3,408 3,408 3,408 3,408 3,408 3,408 3,408
ReturnStandardDeviation
BetaMaximumDrawdown
UpMarketCapture
DownMarketCapture
AlphaSharpeRatio
R-SquaredInception
Date
Delaware - International Value 5.55 14.74 0.85 -48.35 91.19 86.69 1.23 0.36 0.92 08/01/2005
MSCI EAFE Net 4.91 16.57 1.00 -56.68 100.00 100.00 0.00 0.30 1.00 08/01/2005
90-Day T-Bills 1.27 0.47 0.00 0.00 3.26 -2.38 1.27 N/A 0.00 08/01/2005
as of December 31, 2019
Delaware - International Value - Executive Summary
City of Ormond Beach
The prices, quotes, or statistics contained herein have been obtained from sources believed to be reliable, however, its accuracy cannot be guaranteed. Past performance is not aguarantee of future results.
Page 35

Historic Change in Assets
Distribution of Returns
Quarterly Change in Assets
Delaware - International Value MSCI EAFE Net Net Cash Flow
$0.0
$1.5
$3.0
$4.5
Ma
rke
t
Valu
e In
Milli
on
s
7/05 4/06 1/07 10/07 7/08 4/09 1/10 10/10 7/11 4/12 1/13 10/13 7/14 4/15 1/16 10/16 7/17 4/18 1/19 12/19
$1.9
$3.1
$3.4
Market ValueAs of
10/01/2019
NetTransfers
Contributions Distributions Fees ExpensesReturn OnInvestment
Market ValueAs of
12/31/2019
Delaware - International Value 3,127,844.28 - 79,102.50 -79,355.97 -5,856.31 - 285,947.67 3,407,682.17
0
8
16
24
32
Fre
qu
en
cy
< -5 -5 To -4 -4 To -3 -3 To -2 -2 To -1 -1 To 0 0 To 1 1 To 2 2 To 3 3 To 4 4 To 5 > 5
Returns (%)
17
2
5
21
12
17
14
17
20
15
12
21
City of Ormond Beach
as of December 31, 2019
Delaware - International Value - Change in Assets & Distribution of Returns
The prices, quotes, or statistics contained herein have been obtained from sources believed to be reliable, however, its accuracy cannot be guaranteed. Past performance is not aguarantee of future results.
Page 36

Sharpe Ratio
0.0
0.4
0.8
1.2
1.6
-0.4
-0.8
12/19 12/18 12/17 12/16
0.7
0.2
0.7
-0.1
0.7
0.3
0.7
0.1
Beta
0.0
0.5
1.0
1.5
-0.5
12/19 12/18 12/17 12/16
1.0
0.8 0.8 0.8
Up Market Capture
0.0
100.0
200.0
-100.0
12/19 12/18 12/17 12/16
103.791.3 94.1 95.4
Down Market Capture
0.0
100.0
200.0
-100.0
12/19 12/18 12/17 12/16
110.4
84.9 90.982.5
City of Ormond BeachDelaware - International Value - Rolling Three Year MPT Statistics
as of December 31, 2019
The prices, quotes, or statistics contained herein have been obtained from sources believed to be reliable, however, its accuracy cannot be guaranteed. Past performance is not aguarantee of future results.
Page 37

Allocation
Delaware - International Value
MSCI EAFE Net
0.0 5.0 10.0 15.0 20.0 25.0 30.0
Utilities
Real Estate
Materials
Information Technology
Industrials
Health Care
Financials
Energy
Consumer Staples
Consumer Discretionary
Communication Services
Performance
Delaware - International Value
MSCI EAFE Net
0.0 5.0 10.0 15.0 20.0 25.0
Utilities
Real Estate
Materials
Information Technology
Industrials
Health Care
Financials
Energy
Consumer Staples
Consumer Discretionary
Communication Services
Total Attribution
0.0 0.2 0.4 0.6 0.8 1.0 1.2 1.4 1.6-0.2-0.4-0.6-0.8
Utilities
Real Estate
Materials
Information Technology
Industrials
Health Care
Financials
Energy
Consumer Staples
Consumer Discretionary
Communication Services
City of Ormond Beach
Delaware - International Value - Quarterly Performance Attributes
as of December 31, 2019
The prices, quotes, or statistics contained herein have been obtained from sources believed to be reliable, however, its accuracy cannot be guaranteed. Past performance is not aguarantee of future results.
Page 38

Allocation - 10/01/2019
Portfolio Benchmark
Performance - Quarter EndingDecember 31, 2019
Portfolio Benchmark
Attribution
Sector Stock Interaction Total
Communication Services 14.47 5.37 5.08 4.90 -0.31 0.01 0.02 -0.28
Consumer Discretionary 10.14 11.50 9.93 9.29 -0.01 0.07 -0.01 0.05
Consumer Staples 6.94 12.01 10.62 2.20 0.31 1.01 -0.43 0.89
Energy 5.98 5.13 1.23 3.97 -0.04 -0.14 -0.02 -0.20
Financials 19.10 18.50 8.74 8.47 0.00 0.05 0.00 0.05
Health Care 13.03 11.60 11.00 12.45 0.06 -0.17 -0.02 -0.13
Industrials 11.30 14.74 10.15 10.06 -0.06 0.01 0.00 -0.05
Information Technology 8.91 6.75 16.71 12.64 0.09 0.27 0.09 0.46
Materials 0.00 7.00 0.00 10.56 -0.16 0.00 0.00 -0.16
Real Estate 0.00 3.60 0.00 4.45 0.14 0.00 0.00 0.14
Utilities 10.12 3.80 13.41 5.30 -0.19 0.31 0.51 0.63
Total 100.00 100.00 9.65 8.25 -0.17 1.43 0.14 1.40
City of Ormond BeachDelaware - International Value - Quarterly Performance Attributes
as of December 31, 2019
All the values for Allocation, Performance and Attribution are expresssed in Percentage(%) termsThe prices, quotes, or statistics contained herein have been obtained from sources believed to be reliable, however, its accuracy cannot be guaranteed. Past performance is not aguarantee of future results.
Page 39

Portfolio Characteristics
Portfolio Benchmark
Wtd. Avg. Mkt. Cap ($000) 86,946,000.76 66,589,840.53
Median Mkt. Cap ($000) 52,230,685.32 11,161,860.46
Price/Earnings ratio 14.23 17.24
Price/Book ratio 1.73 2.34
5 Yr. EPS Growth Rate (%) -0.23 6.00
Beta (5 Years, Monthly) 0.91 1.00
Number of Stocks 40 918
Debt to Equity 1.06 1.07
Top Ten Equity Holdings
PortfolioWeight
(%)
BenchmarkWeight
(%)
ActiveWeight
(%)
QuarterlyReturn
(%)
Scottish and Southern Energy PLC 3.86 0.13 3.73 24.17
Takeda Pharmaceutical Co Ltd 3.71 0.40 3.31 14.71
Taiwan Semiconductor 3.52 0.00 3.52 25.88
Honda Motor Co Ltd 3.49 0.31 3.18 8.55
ABB Ltd 3.35 0.30 3.05 22.47
CK Hutchison Holdings Ltd 3.30 0.17 3.13 8.03
Tokio Marine Holdings Inc 3.28 0.24 3.04 5.30
Sanofi 3.24 0.76 2.48 8.35
Glaxosmithkline PLC 3.22 0.79 2.43 11.33
Lloyds Banking Group PLC 3.15 0.39 2.76 25.38
% of Portfolio 34.12 3.49 30.63
Ten Best Performers
PortfolioWeight
(%)
BenchmarkWeight
(%)
ActiveWeight
(%)
QuarterlyReturn
(%)
Taiwan Semiconductor 3.52 0.00 3.52 25.88
Lloyds Banking Group PLC 3.15 0.39 2.76 25.38
Scottish and Southern Energy PLC 3.86 0.13 3.73 24.17
ABB Ltd 3.35 0.30 3.05 22.47
National Grid plc 1.98 0.29 1.69 17.90
WH Group Ltd 1.83 0.07 1.76 15.37
Tesco PLC 3.11 0.22 2.89 15.16
WPP PLC 2.52 0.12 2.40 14.93
Kingfisher PLC 2.10 0.04 2.06 14.78
Takeda Pharmaceutical Co Ltd 3.71 0.40 3.31 14.71
% of Portfolio 29.13 1.96 27.17
Ten Worst Performers
PortfolioWeight
(%)
BenchmarkWeight
(%)
ActiveWeight
(%)
QuarterlyReturn
(%)
Deutsche Telekom AG 1.79 0.37 1.42 -2.55
Telia Company AB 2.76 0.08 2.68 -1.44
Koninklijke Ahold Delhaize NV 0.92 0.20 0.72 0.00
Continental AG 2.76 0.10 2.66 0.83
BP PLC 2.55 0.86 1.69 0.89
Eni SpA 2.81 0.27 2.54 1.54
Royal Dutch Shell PLC 2.94 0.85 2.09 1.69
China Mobile Ltd 2.37 0.00 2.37 2.10
Mitsubishi Electric Corp 2.40 0.17 2.23 4.03
Compagnie de Saint Gobain SA 2.53 0.14 2.39 4.38
% of Portfolio 23.83 3.04 20.79
City of Ormond BeachDelaware - International Value - Portfolio Characteristics
as of December 31, 2019
Page 40

Manager Performance Chart Manager Risk & Return
Modern Portfolio Statistics
Historic Asset Growth
Manager Annualized Performance
0.0
8.0
16.0
24.0
32.0
Re
turn
Current
Quarter
Fiscal
YTD
1
Year
3
Years
5
Years
7
Years
10
Years
Since
Inception
Renaissance - International Growth MSCI AC World ex US Net
90-Day T-Bills
-4.0
-2.0
0.0
2.0
4.0
6.0
8.0
10.0
12.0
Re
turn
(%)
-6.0 -3.0 0.0 3.0 6.0 9.0 12.0 15.0 18.0 21.0 24.0
Risk (Standard Deviation %)
CurrentQuarter
FiscalYTD
1Year
3Years
5Years
7Years
10Years
Inception05/01/2009
Renaissance - International Growth 8.03 8.03 19.85 7.29 4.23 6.66 5.62 8.69
MSCI AC World ex US Net 8.92 8.92 21.51 9.87 5.51 5.44 4.97 7.96
Differences -0.89 -0.89 -1.66 -2.58 -1.28 1.22 0.65 0.73
CurrentQuarter
FiscalYTD
1Year
3Years
5Years
7Years
10Years
Inception05/01/2009
Renaissance - Intl Growth
Beginning Market Value 2,899 2,899 2,626 1,899 1,933 1,536 1,422 1,145
Net Contributions - - -1 913 911 910 910 741
Fees/Expenses -5 -5 -19 -52 -77 -101 -130 -133
Income 13 13 71 190 270 360 462 486
Gain/Loss 219 219 449 176 89 421 461 886
Ending Market Value 3,126 3,126 3,126 3,126 3,126 3,126 3,126 3,126
ReturnStandardDeviation
BetaMaximumDrawdown
UpMarketCapture
DownMarketCapture
AlphaSharpeRatio
R-SquaredInception
Date
Renaissance - International Growth 8.69 15.47 0.98 -23.75 98.89 93.56 0.97 0.58 0.90 05/01/2009
MSCI AC World ex US Net 7.96 15.03 1.00 -23.29 100.00 100.00 0.00 0.55 1.00 05/01/2009
90-Day T-Bills 0.53 0.22 0.00 0.00 1.39 -1.19 0.54 N/A 0.00 05/01/2009
as of December 31, 2019
Renaissance - International Growth - Executive Summary
City of Ormond Beach
The prices, quotes, or statistics contained herein have been obtained from sources believed to be reliable, however, its accuracy cannot be guaranteed. Past performance is not aguarantee of future results.
Page 41

Historic Change in Assets
Distribution of Returns
Quarterly Change in Assets
Renaissance - International Growth MSCI AC World ex US Net Net Cash Flow
($1.5)
$0.0
$1.5
$3.0
$4.5
Ma
rke
t
Valu
e In
Milli
on
s
4/09 1/10 10/10 7/11 4/12 1/13 10/13 7/14 4/15 1/16 10/16 7/17 4/18 1/19 12/19
$1.8
$3.0$3.1
Market ValueAs of
10/01/2019
NetTransfers
Contributions Distributions Fees ExpensesReturn OnInvestment
Market ValueAs of
12/31/2019
Renaissance - International Growth 2,898,569.86 - 13,128.35 -13,367.33 -4,748.60 - 232,390.87 3,125,973.15
0
8
16
24
32
Fre
qu
en
cy
< -5 -5 To -4 -4 To -3 -3 To -2 -2 To -1 -1 To 0 0 To 1 1 To 2 2 To 3 3 To 4 4 To 5 > 5
Returns (%)
10
46
89
15 15
17
10
5
8
21
City of Ormond Beach
as of December 31, 2019
Renaissance - International Growth - Change in Assets & Distribution of Returns
The prices, quotes, or statistics contained herein have been obtained from sources believed to be reliable, however, its accuracy cannot be guaranteed. Past performance is not aguarantee of future results.
Page 42

Sharpe Ratio
0.0
0.5
1.0
1.5
-0.5
-1.0
12/19 12/18 12/17 12/16
0.7
0.4
0.7
-0.1
0.5
0.0
0.7
-0.1
Beta
0.0
0.6
1.2
1.8
-0.6
12/19 12/18 12/17 12/16
1.2
1.0
0.9 0.9
Up Market Capture
0.0
100.0
200.0
-100.0
12/19 12/18 12/17 12/16
101.488.6 89.1 86.2
Down Market Capture
0.0
100.0
200.0
-100.0
12/19 12/18 12/17 12/16
120.3112.1
78.5 85.8
City of Ormond BeachRenaissance - International Growth - Rolling Three Year MPT Statistics
as of December 31, 2019
The prices, quotes, or statistics contained herein have been obtained from sources believed to be reliable, however, its accuracy cannot be guaranteed. Past performance is not aguarantee of future results.
Page 43

Allocation
Renaissance - International Growth
MSCI AC World ex US Net
0.0 6.0 12.0 18.0 24.0 30.0
Utilities
Real Estate
Materials
Information Technology
Industrials
Health Care
Financials
Energy
Consumer Staples
Consumer Discretionary
Communication Services
Performance
Renaissance - International Growth
MSCI AC World ex US Net
0.0 8.0 16.0 24.0-8.0-16.0
Utilities
Real Estate
Materials
Information Technology
Industrials
Health Care
Financials
Energy
Consumer Staples
Consumer Discretionary
Communication Services
Total Attribution
0.0 0.2 0.4 0.6 0.8-0.2-0.4-0.6-0.8-1.0-1.2-1.4-1.6
Utilities
Real Estate
Materials
Information Technology
Industrials
Health Care
Financials
Energy
Consumer Staples
Consumer Discretionary
Communication Services
City of Ormond Beach
Renaissance - International Growth - Quarterly Performance Attributes
as of December 31, 2019
The prices, quotes, or statistics contained herein have been obtained from sources believed to be reliable, however, its accuracy cannot be guaranteed. Past performance is not aguarantee of future results.
Page 44

Allocation - 10/01/2019
Portfolio Benchmark
Performance - Quarter EndingDecember 31, 2019
Portfolio Benchmark
Attribution
Sector Stock Interaction Total
Communication Services 12.91 6.83 9.01 7.15 -0.12 0.13 0.11 0.12
Consumer Discretionary 9.44 11.40 2.07 11.26 -0.04 -1.05 0.18 -0.91
Consumer Staples 5.47 10.16 1.75 2.23 0.32 -0.05 0.02 0.29
Energy 7.28 6.75 8.84 6.81 -0.01 0.14 0.01 0.14
Financials 20.08 21.55 7.54 8.31 0.01 -0.17 0.01 -0.14
Health Care 9.08 8.53 13.76 12.52 0.02 0.11 0.01 0.13
Industrials 10.54 11.92 9.12 9.69 -0.01 -0.07 0.01 -0.07
Information Technology 15.40 8.85 9.03 15.65 0.43 -0.59 -0.43 -0.59
Materials 5.53 7.30 10.65 10.76 -0.03 -0.01 0.00 -0.04
Real Estate 2.23 3.21 -3.84 7.47 0.02 -0.36 0.11 -0.24
Utilities 2.03 3.50 4.95 4.89 0.06 0.00 0.00 0.06
Total 100.00 100.00 7.82 9.05 0.65 -1.92 0.03 -1.24
City of Ormond BeachRenaissance - International Growth - Quarterly Performance Attributes
as of December 31, 2019
All the values for Allocation, Performance and Attribution are expresssed in Percentage(%) termsThe prices, quotes, or statistics contained herein have been obtained from sources believed to be reliable, however, its accuracy cannot be guaranteed. Past performance is not aguarantee of future results.
Page 45

Portfolio Characteristics
Portfolio Benchmark
Wtd. Avg. Mkt. Cap ($000) 61,323,538.39 75,601,211.88
Median Mkt. Cap ($000) 32,576,090.99 8,444,352.02
Price/Earnings ratio 14.34 16.14
Price/Book ratio 2.11 2.34
5 Yr. EPS Growth Rate (%) 11.19 8.14
Beta (5 Years, Monthly) 1.02 1.00
Number of Stocks 55 2,412
Debt to Equity 0.67 1.04
Top Ten Equity Holdings
PortfolioWeight
(%)
BenchmarkWeight
(%)
ActiveWeight
(%)
QuarterlyReturn
(%)
Taiwan Semiconductor 2.35 1.21 1.14 25.88
CRH PLC 2.28 0.14 2.14 17.37
Nippon T&T 2.27 0.14 2.13 6.35
NXP Semiconductors NV 2.22 0.16 2.06 16.98
CHUGAI PHARMACEUTICAL CO LTD 2.20 0.00 2.20 N/A
Alibaba Group Holding Ltd 2.13 1.59 0.54 26.83
Tim Participacoes SA 2.13 0.01 2.12 34.89
Canadian Pacific Railway 2.12 0.16 1.96 14.89
Acs, Actividades De Construccion Y Servicios SA 2.09 0.05 2.04 0.12
Carnival Corporation & Plc 2.08 0.03 2.05 15.89
% of Portfolio 21.87 3.49 18.38
Ten Best Performers
PortfolioWeight
(%)
BenchmarkWeight
(%)
ActiveWeight
(%)
QuarterlyReturn
(%)
Tim Participacoes SA 2.13 0.01 2.12 34.89
Alibaba Group Holding Ltd 2.13 1.59 0.54 26.83
Infineon Technologies 1.71 0.13 1.58 26.65
Taiwan Semiconductor 2.35 1.21 1.14 25.88
Oil Co LUKOIL PJSC 1.89 0.17 1.72 23.32
Astellas Pharma Inc 1.90 0.14 1.76 20.87
CRH PLC 2.28 0.14 2.14 17.37
Schneider Electric SA 1.91 0.25 1.66 17.03
NXP Semiconductors NV 2.22 0.16 2.06 16.98
Icon PLC 1.88 0.00 1.88 16.89
% of Portfolio 20.40 3.80 16.60
Ten Worst Performers
PortfolioWeight
(%)
BenchmarkWeight
(%)
ActiveWeight
(%)
QuarterlyReturn
(%)
Gildan Activewear Inc 1.82 0.03 1.79 -16.41
China Unicom (Hong Kong) Ltd 1.58 0.03 1.55 -10.77
JOYY Inc 0.91 0.01 0.90 -6.12
Danone SA 1.74 0.23 1.51 -5.85
Daiwa House Industry Co Ltd 1.92 0.08 1.84 -3.84
Enerplus Corp 1.38 0.00 1.38 -3.83
Seven & I Holdings Co Ltd 1.40 0.12 1.28 -3.66
Acs, Actividades De Construccion Y Servicios SA 2.09 0.05 2.04 0.12
Canadian National Railway 1.69 0.29 1.40 1.11
Check Point Software 1.96 0.06 1.90 1.33
% of Portfolio 16.49 0.90 15.59
City of Ormond BeachRenaissance - International Growth - Portfolio Characteristics
as of December 31, 2019
Page 46

Manager Performance Chart Manager Risk & Return
Modern Portfolio Statistics
Historic Asset Growth
Manager Annualized Performance
0.0
3.0
6.0
9.0
12.0
Re
turn
Current
Quarter
Fiscal
YTD
1
Year
3
Years
5
Years
7
Years
10
Years
Since
Inception
Garcia Hamilton - Fixed Income BC Gov/Cr Intm
90-Day T-Bills
0.0
0.8
1.6
2.4
3.2
4.0
4.8
5.6
6.4
Re
turn
(%)
-1.0 -0.5 0.0 0.5 1.0 1.5 2.0 2.5 3.0 3.5 4.0 4.5
Risk (Standard Deviation %)
CurrentQuarter
FiscalYTD
1Year
3Years
5Years
7Years
10Years
Inception10/01/2003
Garcia Hamilton - FI 0.32 0.32 6.04 3.10 2.76 2.80 3.98 4.67
BC Gov/Cr Intm 0.37 0.37 6.80 3.24 2.57 2.15 3.05 3.50
Differences -0.05 -0.05 -0.76 -0.14 0.19 0.65 0.93 1.17
CurrentQuarter
FiscalYTD
1Year
3Years
5Years
7Years
10Years
Inception10/01/2003
Garcia Hamilton - FI
Beginning Market Value 15,932 15,932 15,104 14,008 13,471 10,521 8,856 4,397
Net Contributions -1 -1 -5 604 596 2,932 2,768 5,182
Fees/Expenses -10 -10 -39 -102 -171 -228 -300 -399
Income 124 124 441 1,110 2,031 2,898 4,400 6,188
Gain/Loss -74 -74 469 351 45 -151 248 603
Ending Market Value 15,971 15,971 15,971 15,971 15,971 15,971 15,971 15,971
ReturnStandardDeviation
BetaMaximumDrawdown
UpMarketCapture
DownMarketCapture
AlphaSharpeRatio
R-SquaredInception
Date
Garcia Hamilton - Fixed Income 4.67 3.22 0.91 -3.97 108.07 66.83 1.46 1.02 0.59 10/01/2003
BC Gov/Cr Intm 3.50 2.71 1.00 -4.05 100.00 100.00 0.00 0.80 1.00 10/01/2003
90-Day T-Bills 1.31 0.45 0.01 0.00 17.10 -16.92 1.27 N/A 0.01 10/01/2003
as of December 31, 2019
Garcia Hamilton - Fixed Income - Executive Summary
City of Ormond Beach
The prices, quotes, or statistics contained herein have been obtained from sources believed to be reliable, however, its accuracy cannot be guaranteed. Past performance is not aguarantee of future results.
Page 47

Historic Change in Assets
Distribution of Returns
Quarterly Change in Assets
Garcia Hamilton - Fixed Income BC Gov/Cr Intm Net Cash Flow
($6.0)
$0.0
$6.0
$12.0
$18.0
$24.0
Ma
rke
t
Valu
e In
Milli
on
s
9/03 9/04 9/05 9/06 9/07 9/08 9/09 9/10 9/11 9/12 9/13 9/14 9/15 9/16 9/17 9/18 12/19
$9.2
$13.8
$16.0
Market ValueAs of
10/01/2019
NetTransfers
Contributions Distributions Fees ExpensesReturn OnInvestment
Market ValueAs of
12/31/2019
Garcia Hamilton - Fixed Income 15,931,818.08 - 430,577.64 -431,865.02 -9,957.06 - 50,739.90 15,971,313.54
0
50
100
150
Fre
qu
en
cy
< -5 -5 To -4 -4 To -3 -3 To -2 -2 To -1 -1 To 0 0 To 1 1 To 2 2 To 3 3 To 4 4 To 5 > 5
Returns (%)
0 0 0 4 5
52
101
26
4 2 1 0
City of Ormond Beach
as of December 31, 2019
Garcia Hamilton - Fixed Income - Change in Assets & Distribution of Returns
The prices, quotes, or statistics contained herein have been obtained from sources believed to be reliable, however, its accuracy cannot be guaranteed. Past performance is not aguarantee of future results.
Page 48

Sharpe Ratio
0.0
0.4
0.8
1.2
1.6
12/19 12/18 12/17 12/16
0.8
0.3
0.7
0.90.9
0.3
0.5
0.8
Beta
0.0
0.4
0.8
1.2
-0.4
12/19 12/18 12/17 12/16
0.7
0.4
0.50.6
Up Market Capture
0.0
100.0
200.0
-100.0
12/19 12/18 12/17 12/16
81.4
53.366.6
80.8
Down Market Capture
0.0
100.0
200.0
-100.0
12/19 12/18 12/17 12/16
46.9
-9.0
13.8 13.3
City of Ormond BeachGarcia Hamilton - Fixed Income - Rolling Three Year MPT Statistics
as of December 31, 2019
The prices, quotes, or statistics contained herein have been obtained from sources believed to be reliable, however, its accuracy cannot be guaranteed. Past performance is not aguarantee of future results.
Page 49

Account Name YTD
1
Year
3
Years
5
Years
10
Years
Since
Inception
Inception
Date
Performance Appendix
QTD
Performance Data below is net of fees. Please see the Morgan Stanley Smith Barney LLC Form ADV Part 2 Brochure for advisory accounts and/or any applicable brokerage account trade confirmation statements for
a full disclosure of the applicable charges, fees and expenses. Your Financial Advisor will provide those documents to you upon request.
Cambiar / GW Capital - Small/Mid Cap Value 31.26 31.26 12.74 -- -- 16.09 07/01/20168.09
Delaware - International Value 19.45 19.45 8.27 5.15 5.17 4.76 08/01/20058.96
Fiera - Small/Mid Cap Growth 31.82 31.82 15.01 -- -- 9.72 02/01/201511.54
Garcia Hamilton - Fixed Income 5.77 5.77 2.89 2.54 3.74 4.40 10/01/20030.26
HGK - Large Cap Value 25.71 25.71 9.14 6.27 10.12 11.80 05/01/20098.61
Polen - Large Cap Growth 38.39 38.39 24.14 17.40 -- 16.22 05/01/201210.48
Renaissance - International Growth 19.09 19.09 6.62 3.57 4.95 8.02 05/01/20097.85
Sawgrass - Large Cap Growth 30.47 30.47 18.01 12.09 -- 14.02 05/01/20128.36
All performance above are Time Weighted(TWR) performance
Glossary of Terms
Active Contribution Return: The gain or loss percentage of an investment relative to the performance of
the investment benchmark.
Active Exposure: The percentage difference in weight of the portfolio compared to its policy benchmark.
Active Return: Arithmetic difference between the manager’s return and the benchmark’s return over a
specified time period.
Actual Correlation: A measure of the correlation (linear dependence) between two variables X and Y, with
a value between +1 and -1 inclusive. This is also referred to as coefficient of correlation.
Alpha: A measure of a portfolio's time weighted return in excess of the market’s return, both adjusted for
risk. A positive alpha indicates that the portfolio outperformed the market on a risk-adjusted basis, and a
negative alpha indicates the portfolio did worse than the market.
Best Quarter: The highest quarterly return for a certain time period.
Beta: A measure of the sensitivity of a portfolio’s time weighted return (net of fees) against that of the
market. A beta greater than 1.00 indicates volatility greater than the market.
Consistency: The percentage of quarters that a product achieved a rate of return higher than that of its
benchmark. The higher the consistency figure, the more value a manager has contributed to the product’s
performance.
Core: Refers to an investment strategy mandate that is blend of growth and value styles without a
pronounced tilt toward either style.
Cumulative Selection Return (Cumulative Return): Cumulative investment performance over a specified
Cumulative Selection Return (Cumulative Return): Cumulative investment performance over a specified
period of time.
Distribution Rate: The most recent distribution paid, annualized, and then divided by the current market
price. Distribution rate may consist of investment income, short-term capital gains, long-term capital gains,
and/or return of capital.
Down Market Capture: The ratio of average portfolio returns over the benchmark during periods of
negative benchmark return. Lower values indicate better product performance.
Downside Risk: A measure similar to standard deviation, but focuses only on the negative movements of
the return series. It is calculated by taking the standard deviation of the negative quarterly set of returns. The
higher the value, the more risk the product has.
Downside Semi Deviation: A statistical calculation that measures the volatility of returns below a
minimum acceptable return. This return measure isolates the negative portion of volatility: the larger the
number, the greater the volatility.
Drawdown: A drawdown is the peak-to-trough decline during a specific period of an investment, fund or
commodity.
Excess over Benchmark: The percentage gain or loss of an investment relative to the investment's
benchmark.
Excess Return: Arithmetic difference between the manager’s return and the risk-free return over a specified
time period.
Growth: A diversified investment strategy which includes investment selections that have capital

Growth: A diversified investment strategy which includes investment selections that have capital
appreciation as the primary goal, with little or no dividend payouts. These strategies can include
reinvestment in expansion, acquisitions, and/or research and development opportunities.
Growth of Dollar: The aggregate amount an investment has gained or lost over a certain time period, also
referred to as Cumulative Return, stated in terms of the amount to which an initial dollar investment would
have grown over the given time period.
Investment Decision Process (IDP): A model for structuring the investment process and implementing the
correct attribution methodologies. The IDP includes every decision made concerning the division of the
assets under management over the various asset categories. To analyze each decision‘s contribution to the
total return, a modeling approach must measure the marginal value of every individual decision. In this
respect, the hierarchy of the decisions becomes very important. We therefore use the IDP model, which
serves as a proper foundation for registering the decisions and relating them to each other.
Information Ratio: Measured by dividing the active rate of return by the tracking error. The higher the
Information Ratio, the more value-added contribution by the manager.
Jensen’s Alpha: The Jensen's alpha measure is a risk-adjusted performance measure that represents theaverage return on a portfolio or investment above or below that predicted by the capital asset pricing model(CAPM) given the portfolio's or investment's beta and the average market return. This metric is alsocommonly referred to as alpha..
Kurtosis: A statistical measure that is used to describe the distribution, or skewness, of observed dataaround the mean, sometimes referred to as the volatility of volatility.
Maximum Drawdown: The drawdown is defined as the percent retrenchment from a fund's peak to thefund's trough value. It is in effect from the time the fund's retrenchment begins until a new fund high isreached. The maximum drawdown encompasses both the period from the fund's peak to the fund's valley(length), and the time from the fund's valley to a new fund high (recovery). It measures the largestpercentage drawdown that has occurred in any fund's data record.
Modern Portfolio Theory (MPT): An investment analysis theory on how risk-averse investors canconstruct portfolios to optimize or maximize expected return based on a given level of market risk,emphasizing that risk is an inherent part of higher reward.
Mutual Fund (MF): An investment program funded by shareholders that trade in diversified holdings andis professionally managed.
Peer Group: A combination of funds that share the same investment style combined as a group forcomparison purposes.
Peer/ Plan Sponsor Universe: A combination of asset pools of total plan investments by specific sponsorand plan types for comparison purposes.
Performance Ineligible Assets: Performance returns are not calculated for certain assets because accuratevaluations and transaction data for these assets are not processed or maintained by us. Common examples ofthese include life insurance, some annuities and some assets held externally.
Performance Statistics: A generic term for various measures of investment performance measurementterms.
Portfolio Characteristics: A generic term for various measures of investment portfolio characteristics.
Preferred Return: A term used in the private equity (PE) world, and also referred to as a “Hurdle Rate.” Itrefers to the threshold return that the limited partners of a private equity fund must receive, prior to the PEfirm receiving its carried interest or "carry."
firm receiving its carried interest or "carry."
Ratio of Cumulative Wealth: A defined ratio of the Cumulative Return of the portfolio divided by theCumulative Return of the benchmark for a certain time period.
Regression Based Analysis: A statistical process for estimating the relationships among variables. Itincludes many techniques for modeling and analyzing several variables, when the focus is on therelationship between a dependent variable and one or more independent variables
Residual Correlation: Within returns-based style analysis, residual correlation refers to the portion of astrategy’s return pattern that cannot be explained by its correlation to the asset-class benchmarks to which itis being compared.
Return: A rate of investment performance for the specified period.
Rolling Percentile Ranking: A measure of an investment portfolio’s ranking versus a peer group for aspecific rolling time period (i.e. Last 3 Years, Last 5 years, etc.).
R-Squared: The percentage of a portfolio's performance explained by the behavior of the appropriatebenchmark. High R-Squared means a higher correlation of the portfolio's performance to the appropriatebenchmark.
SA/CF (Separate Account/Comingled Fund): Represents an acronym for Separate Account andCommingled Fund investment vehicles.
Sector Benchmark: A market index that serves as a proxy for a sector within an asset class.
Sharpe Ratio: Represents the excess rate of return over the risk free return divided by the standarddeviation of the excess return. The result is the absolute rate of return per unit of risk. The higher the value,the better the product’s historical risk-adjusted performance results in.
Standard Deviation: A statistical measure of the range of a portfolio's performance; the variability of areturn around its average return over a specified time period.
Total Fund Benchmark: The policy benchmark for a complete asset pool that could consist of multipleinvestment mandates.
Total Fund Composite: The aggregate of multiple portfolios within an asset pool or household.
Tracking Error: A measure of standard deviation for a portfolio's investment performance, relative to theperformance of an appropriate market benchmark.
Treynor Ratio: A ratio that divides the excess return (above the risk free rate) by the portfolio’s beta toarrive at a unified measure of risk adjusted return. It is generally used to rank portfolios, funds andbenchmarks. A higher ratio is indicative of higher returns per unit of market risk. This measurement canhelp determine if the portfolio is reaching its goal of increasing returns while managing market risk.
Up Market Capture: The ratio of average portfolio returns over the benchmark during periods of positivebenchmark return. Higher values indicate better product performance.
Upside Semi Deviation: A statistical calculation that measures the volatility of returns above an acceptablereturn. This return measure isolates the positive portion of volatility: the larger the number, the greater thevolatility.
Value: A diversified investment strategy that includes investment selections which tend to trade at a lowerprice relative to its dividends, earnings, and sales. Common attributes are stocks that include high dividend,low price-to-book ratio, and/or low price-to-earnings ratio.
Worst Quarter: The lowest rolling quarterly return for a certain time period.

Worst Quarter: The lowest rolling quarterly return for a certain time period.
Information Disclosures
Performance results are annualized for time periods greater than one year and include all cash and cash
equivalents, realized and unrealized capital gains and losses, and dividends, interest and income. The
investment results depicted herein represent historical performance. As a result of recent market activity,
current performance may vary from the figures shown. Past performance is not a guarantee of future
results.
Please see the Morgan Stanley Smith Barney LLC Form ADV Part 2 Brochure for advisory accounts
and/or any applicable brokerage account trade confirmation statements for a full disclosure of the
applicable charges, fees and expenses. Your Financial Advisor will provide those documents to you upon
request.
Benchmark indices and blends included in this material are for informational purposes only, are
provided solely as a comparison tool and may not reflect the underlying composition and/or investment
objective(s) associated with the account(s). Indices are unmanaged and not available for direct
investment. Index returns do not take into account fees or other charges. Such fees and charges would
reduce performance.
The performance data shown reflects past performance, which does not guarantee future results.
Investment return and principal will fluctuate so that an investor’s shares when redeemed may be worth
more or less than original cost. Please note, current performance may be higher or lower than the
performance data shown. For up to date month-end performance information, please contact your
Financial Advisor or visit the funds’ company website.
Investors should carefully consider the fund’s investment objectives, risks, charges and expenses before
investing. The prospectus and, if available the summary prospectus, contains this and other information
that should be read carefully before investing. Investors should review the information in the prospectus
carefully. To obtain a prospectus, please contact your Financial Advisor or visit the funds’ company
website.
Past performance is no guarantee of future results.
Investing involves market risk, including possible loss of principal. Growth investing does not guarantee a
profit or eliminate risk. The stocks of these companies can have relatively high valuations. Because of these
high valuations, an investment in a growth stock can be more risky than an investment in a company with
more modest growth expectations. Value investing involves the risk that the market may not recognize that
securities are undervalued and they may not appreciate as anticipated. Small and mid-capitalization
companies may lack the financial resources, product diversification and competitive strengths of larger
companies. The securities of small capitalization companies may not trade as readily as, and be subject to
higher volatility than those of larger, more established companies. Bond funds and bond holdings have the
same interest rate, inflation and credit risks that are associated with the underlying bonds owned by the
funds. The return of principal in bond funds, and in funds with significant bond holdings, is not guaranteed.
International securities’ prices may carry additional risks, including foreign economic, political, monetary
and/or legal factors, changing currency exchange rates, foreign taxes and differences in financial and
accounting standards. International investing may not be for everyone. These risks may be magnified in
emerging markets. Alternative investments, including private equity funds, real estate funds, hedge funds,
managed futures funds, and funds of hedge funds, private equity, and managed futures funds, are
managed futures funds, and funds of hedge funds, private equity, and managed futures funds, are
speculative and entail significant risks that can include losses due to leveraging or\other speculative
investment practices, lack of liquidity, volatility of returns, restrictions on transferring interests in a fund,
potential lack of diversification, absence and/or delay of information regarding valuations and pricing,
complex tax structures and delays in tax reporting, less regulation and higher fees than mutual funds and
risks associated with the operations, personnel and processes of the advisor. Master Limited Partnerships
(MLPs) are limited partnerships or limited liability companies that are taxed as partnerships and whose
interests (limited partnership units or limited liability company units) are traded on securities exchanges like
shares of common stock. Currently, most MLPs operate in the energy, natural resources or real estate
sectors. Investments in MLP interests are subject to the risks generally applicable to companies in the
energy and natural resources sectors, including commodity pricing risk, supply and demand risk, depletion
risk and exploration risk; and MLP interests in the real estate sector are subject to special risks, including
interest rate and property value fluctuations, as well as risks related to general and economic conditions.
Because of their narrow focus, MLPs maintain exposure to price volatility of commodities and/or
underlying assets and tend to be more volatile than investments that diversify across many sectors and
companies. MLPs are also subject to additional risks including: investors having limited control and rights
to vote on matters affecting the MLP, limited access to capital, cash flow risk, lack of liquidity, dilution risk,
conflict of interests, and limited call rights related to acquisitions.
Mortgage backed securities also involve prepayment risk, in that faster or slower prepayments than
expected on underlying mortgage loans can dramatically alter the yield-to-maturity of a mortgage-backed
security and prepayment risk includes the possibility that a fund may invest the proceeds at generally lower
interest rates.
Tax managed funds may not meet their objective of being tax-efficient.
Real estate investments are subject to special risks, including interest rate and property value fluctuations,
as well as risks related to general and economic conditions. High yield fixed income securities, also known
as “junk bonds”, are considered speculative, involve greater risk of default and tend to be more volatile than
investment grade fixed income securities.
Credit quality is a measure of a bond issuer’s creditworthiness, or ability to repay interest and principal to
bondholders in a timely manner. The credit ratings shown are based on security rating as provided by
Standard & Poor’s, Moody’s and/or Fitch, as applicable. Credit ratings are issued by the rating agencies for
the underlying securities in the fund and not the fund itself, and the credit quality of the securities in the
fund does not represent the stability or safety of the fund. Credit ratings shown range from AAA, being the
highest, to D, being the lowest based on S&P and Fitch’s classification (the equivalent of Aaa and C,
respectively, by Moody(s). Ratings of BBB or higher by S&P and Fitch (Baa or higher by Moody’s) are
considered to be investment grade-quality securities. If two or more of the agencies have assigned different
ratings to a security, the highest rating is applied. Securities that are not rated by all three agencies are listed
as “NR”.
“Alpha tilt strategies comprise a core holding of stocks that mimic a benchmark type index such as theS&P 500 to which additional securities are added to help tilt the fund toward potentially outperforming the
market in an effort to enhance overall investment returns. Tilt strategies are subject to significant timing
risk and could potentially expose investors to extended periods of underperformance.”
Custom Account Index: The Custom Account Index is an investment benchmark based on your historical
target allocations and/or manager selection that you may use to evaluate the performance of your account.
The Custom Account index does take into consideration certain changes that may have occurred in your
portfolio since the inception of your account, i.e., asset class and/or manager changes. However, in some
circumstances, it may not be an appropriate benchmark for use with your specific account composition. For

circumstances, it may not be an appropriate benchmark for use with your specific account composition. For
detailed report of the historical composition of this blend please contact your Financial Advisor.
Peer Groups
Peer Groups are a collection of similar investment strategies that essentially group investment products that
share the same investment approach. Peer Groups are used for comparison purposes to compare and
illustrate a clients investment portfolio versus its peer across various quantitative metrics like performance
and risk. Peer Group comparison is conceptually another form of benchmark comparison whereby the
actual investment can be ranked versus its peer across various quantitative metrics.
All Peer Group data are provided by Investment Metrics, LLC.
The URL below provides all the definitions and methodology about the various Peer Groups
https://www.invmetrics.com/style-peer-groups
Peer Group Ranking Methodology
A percentile rank denotes the value of a product in which a certain percent of observations fall within a peer
group. The range of percentile rankings is between 1 and 100, where 1 represents a high statistical value and
100 represents a low statistical value.
The 30th percentile, for example, is the value in which 30% of the highest observations may be found, the
65th percentile is the value in which 65% of the highest observations may be found, and so on.
Percentile rankings are calculated based on a normalized distribution ranging from 1 to 100 for all products
in each peer group, where a ranking of 1 denotes a high statistical value and a ranking of 100 denotes a low
statistical value. It is important to note that the same ranking methodology applies to all statistics, implying
that a ranking of 1 will always mean highest value across all statistics.
For example, consider a risk/return assessment using standard deviation as a measure of risk. A percentile
ranking equal to 1 for return denotes highest return, whereas a percentile ranking of 1 for standard deviation
denotes highest risk among peers.
In addition, values may be used to demonstrate quartile rankings. For example, the third quartile is also
known as the 75th percentile, and the median is the 50th percentile.
Alternatives
Graystone Consulting is a business of Morgan Stanley Smith Barney LLC. (“Morgan Stanley”) Thismaterial is not to be reproduced or distributed to any other persons (other than professional advisors of theinvestors) and is intended solely for the use of the persons to whom it has been delivered. This material isnot for distribution to the general public.
The sole purpose of this material is to inform, and it in no way is intended to be an offer or solicitation topurchase or sell any security, other investment or service, or to attract any funds or deposits. Investmentsmentioned may not be suitable for all clients. Any product discussed herein may be purchased only after aclient has carefully reviewed the offering memorandum and executed the subscription documents. MorganStanley has not considered the actual or desired investment objectives, goals, strategies, guidelines, orfactual circumstances of any investor in any fund(s). Before making any investment, each investor shouldcarefully consider the risks associated with the investment, as discussed in the applicable offeringmemorandum, and make a determination based upon their own particular circumstances, that the investmentis consistent with their investment objectives and risk tolerance.
is consistent with their investment objectives and risk tolerance.
This information is being provided as a service of your Graystone Institutional Consultant and does notsupersede or replace your Morgan Stanley customer statement. The information is as of the date(s) notedand subject to daily market fluctuation. Your interests in Alternative Investments, which may have beenpurchased through us, are generally not held here, and are generally not covered by SIPC. The informationprovided to you: 1) is included as a service to you, valuations for certain products may not be available; 2)is derived from you or another external source for which we are not responsible, and may have beenmodified to take into consideration capital calls or distributions to the extent applicable; 3) may not reflectactual shares, share prices or values; 4) may include invested or distributed amounts in addition to a fairvalue estimate; and 5) should not be relied upon for tax reporting purposes. Notwithstanding the foregoing,1) to the extent this report displays Alternative Investment positions within a Morgan Stanley IndividualRetirement Account (“IRA”), such positions are held by Morgan Stanley Smith Barney LLC as thecustodian of your Morgan Stanley IRA; and 2) if your Alternative Investment positon(s) is held by us and isregistered pursuant to the Securities Act of 1933, as amended, your Alternative Investment position(s) iscovered by SIPC.
Alternatives may be either traditional alternative investment vehicles or non-traditional alternative strategyvehicles. Traditional alternative investment vehicles may include, but are not limited to, Hedge Funds,Fund of Funds (both registered and unregistered), Exchange Funds, Private Equity Funds, Private CreditFunds, Real Estate Funds, and Managed Futures Funds. Non-traditional alternative strategy vehicles mayinclude, but are not limited to, Open or Closed End Mutual Funds, Exchange-Traded and Closed-EndFunds, Unit Investment Trusts, exchange listed Real Estate Investment Trusts (REITs), and Master LimitedPartnerships (MLPs). These non-traditional alternative strategy vehicles also seek alternative-like exposurebut have significant differences from traditional alternative investment vehicles. Non-traditional alternativestrategy vehicles may behave like, have characteristics of, or employ various investment strategies andtechniques for both hedging and more speculative purposes such as short-selling, leverage, derivatives, andoptions, which can increase volatility and the risk of investment loss. Characteristics such as correlation totraditional markets, investment strategy, and market sector exposure can play a role in the classification of atraditional security being classified as alternative.
Traditional alternative investment vehicles are illiquid and usually are not valued daily. The estimatedvaluation provided will be as of the most recent date available and will be included in summaries of yourassets. Such valuation may not be the most recent provided by the fund in which you are invested. Norepresentation is made that the valuation is a market value or that the interest could be liquidated at thisvalue. We are not required to take any action with respect to your investment unless valid instructions arereceived from you in a timely manner. Some positions reflected herein may not represent interests in thefund, but rather redemption proceeds withheld by the issuer pending final valuations which are not subjectto the investment performance of the fund and may or may not accrue interest for the length of thewithholding. Morgan Stanley does not engage in an independent valuation of your alternative investmentassets. Morgan Stanley provides periodic information to you including the market value of an alternativeinvestment vehicle based on information received from the management entity of the alternative investmentvehicle or another service provider.
Traditional alternative investment vehicles often are speculative and include a high degree of risk. .Investors should carefully review and consider potential risks before investing. Certain of these risks mayinclude but are not limited to:• Loss of all or a substantial portion of the investment due to leveraging, short-selling, or other speculative practices;• Lack of liquidity in that there may be no secondary market for afund;• Volatility of returns;• Restrictions on transferring interests in a fund;• Potential lack of diversificationand resulting higher risk due to concentration of trading authority when a single advisor is utilized;•Absence of information regarding valuations and pricing;• Complex tax structures and delays in taxreporting;• Less regulation and higher fees than mutual funds; and• Risks associated with the operations,personnel, and processes of the manager. As a diversified global financial services firm, Morgan StanleyWealth Management engages in a broad spectrum of activities including financial advisory services,investment management activities, sponsoring and managing private investment funds, engaging in broker-dealer transactions and principal securities, commodities and foreign exchange transactions, researchpublication, and other activities. In the ordinary course of its business, Morgan Stanley Wealth Managementtherefore engages in activities where Morgan Stanley Wealth Management’s interests may conflict with theinterests of its clients, including the private investment funds it manages. Morgan Stanley Wealth

interests of its clients, including the private investment funds it manages. Morgan Stanley WealthManagement can give no assurance that conflicts of interest will be resolved in favor of its clients or anysuch fund.
Indices are unmanaged and investors cannot directly invest in them. Composite index results are shown forillustrative purposes and do not represent the performance of a specific investment. Past performance is noguarantee of future results. Actual results may vary. Diversification does not assure a profit or protectagainst loss in a declining market. Any performance or related information presented has not been adjustedto reflect the impact of the additional fees paid to a placement agent by an investor (for Morgan Stanleyplacement clients, a one-time upfront Placement Fee of up to 3%, and for Morgan Stanley investmentadvisory clients, an annual advisory fee of up to 2.5%), which would result in a substantial reduction in thereturns if such fees were incorporated.
For most investment advisory clients, the program account will be charged an asset-based wrap fee everyquarter (“the Fee”). In general, the Fee covers investment advisory services and reporting. In addition to theFee, clients will pay the fees and expenses of any funds in which their account is invested. Fund fees andexpenses are charged directly to the pool of assets the fund invests in and impact the valuations. Clientsmust understand that these fees and expenses are an additional cost and will not be included in the Feeamount in the account statements.
As fees are deducted quarterly, the compounding effect will be to increase the impact of the fees by anamount directly related to the gross account performance. For example, for an account with an initial valueof $100,000 and a 2.5% annual fee, if the gross performance is 5% per year over a three year period, thecompounding effect of the fees will result in a net annual compound rate of return of approximately 2.40%per year over a three year period, and the total value of the client’s portfolio at the end of the three yearperiod would be approximately $115,762.50 without the fees and $107,372.63 with the fees. Please see theapplicable Morgan Stanley Smith Barney LLC Form ADV Part 2A for more information including adescription of the fee schedule. It is available at www.morganstanley.com/ADV<http://www.morganstanley.com/ADV> <http://www.morganstanley.com/ADV> or from your FinancialAdvisor/Private Wealth Advisor.
Alternative investments involve complex tax structures, tax inefficient investing, and delays in distributingimportant tax information. Individual funds have specific risks related to their investment programs that willvary from fund to fund. Clients should consult their own tax and legal advisors as Morgan Stanley does notprovide tax or legal advice. Interests in alternative investment products are offered pursuant to the terms ofthe applicable offering memorandum, are distributed by Morgan Stanley Smith Barney LLC and certain ofits affiliates, and (1) are not FDIC-insured, (2) are not deposits or other obligations of Morgan Stanley orany of its affiliates, (3) are not guaranteed by Morgan Stanley and its affiliates, and (4) involve investmentrisks, including possible loss of principal. Morgan Stanley Smith Barney LLC is a registered broker-dealer,not a bank.
SIPC insurance does not apply to precious metals, other commodities, or traditional alternative investments.
© 2018 Morgan Stanley Smith Barney LLC. Member SIPC.
Money Market Funds
You could lose money in Money Market Funds. Although MMFs classified as government funds (i.e.,MMFs that invest 99.5% of total assets in cash and/or securities backed by the U.S government) and retailfunds (i.e., MMFs open to natural person investors only) seek to preserve value at $1.00 per share, theycannot guarantee they will do so. The price of other MMFs will fluctuate and when you sell shares they maybe worth more or less than originally paid. MMFs may impose a fee upon sale or temporarily suspend salesif liquidity falls below required minimums. During suspensions, shares would not be available forpurchases, withdrawals, check writing or ATM debits. A MMF investment is not insured or guaranteed bythe Federal Deposit Insurance Corporation or other government agency.