Embed Size (px)
Citation preview
Summary of Performance of the Everglades Stormwater
Treatment Areas (STAs)
Summary of Performance of the Everglades Stormwater
Treatment Areas (STAs)
Gary Goforth, P.E., Ph.D.Chief Consulting Engineer
South Florida Water Management District
Gary Goforth, P.E., Ph.D.Chief Consulting Engineer
South Florida Water Management District
Overview
Historical perspective on Everglades restorationPerformance of the Stormwater Treatment Areas (STAs)
Historical perspective on Everglades restorationPerformance of the Stormwater Treatment Areas (STAs)
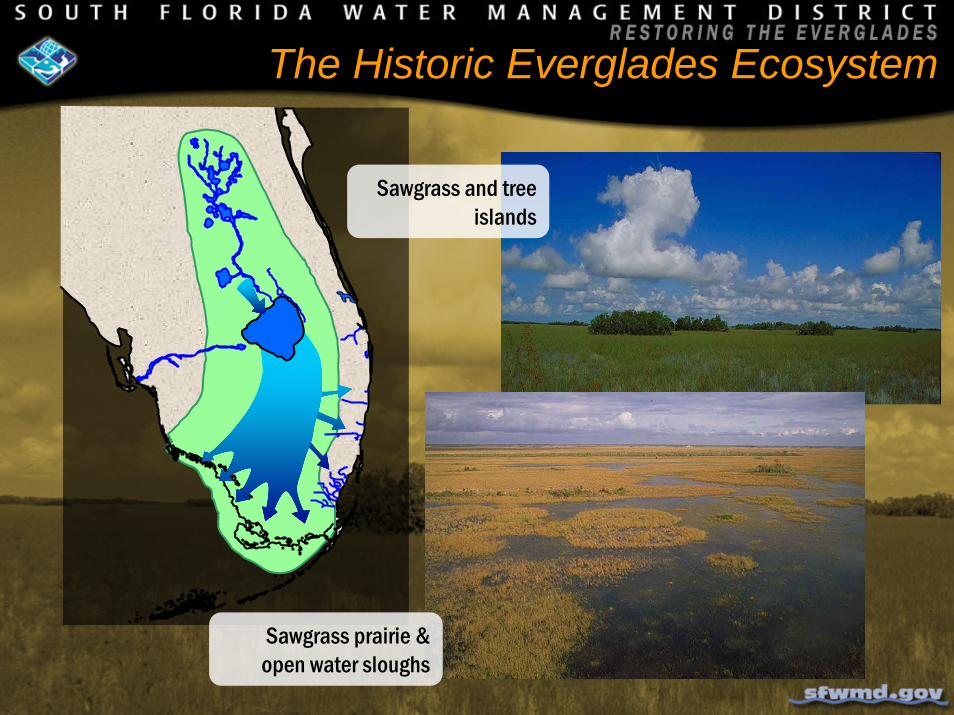
Sawgrass and tree islands
Sawgrass prairie & open water sloughs
The Historic Everglades Ecosystem
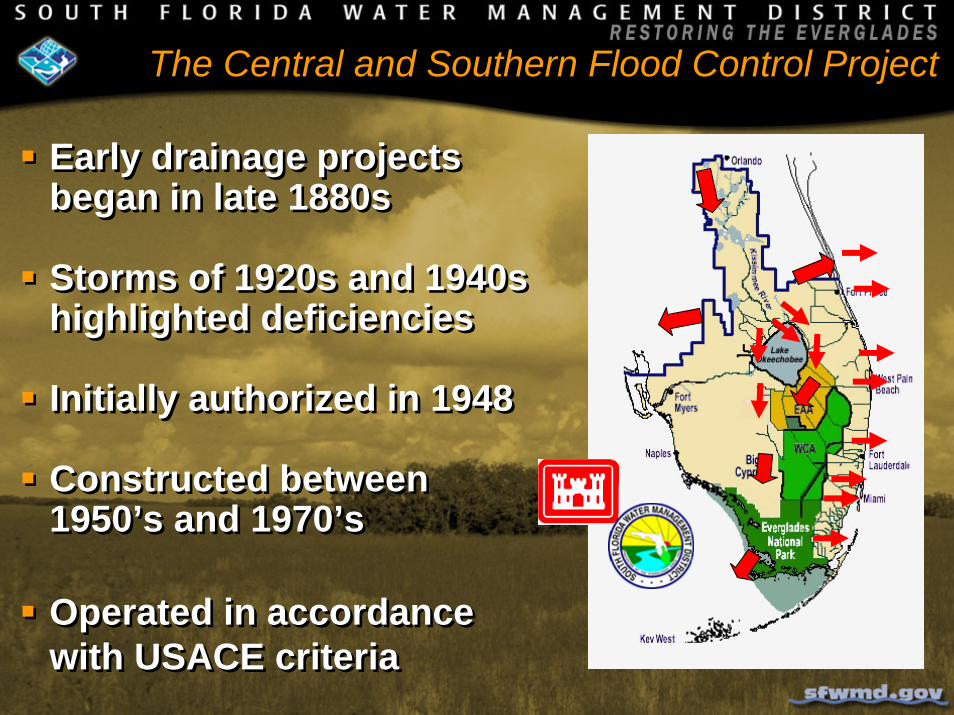
The Central and Southern Flood Control Project
Early drainage projects began in late 1880s
Storms of 1920s and 1940s highlighted deficiencies
Initially authorized in 1948
Constructed between 1950’s and 1970’s
Operated in accordance with USACE criteria
Early drainage projects began in late 1880s
Storms of 1920s and 1940s highlighted deficiencies
Initially authorized in 1948
Constructed between 1950’s and 1970’s
Operated in accordance with USACE criteria
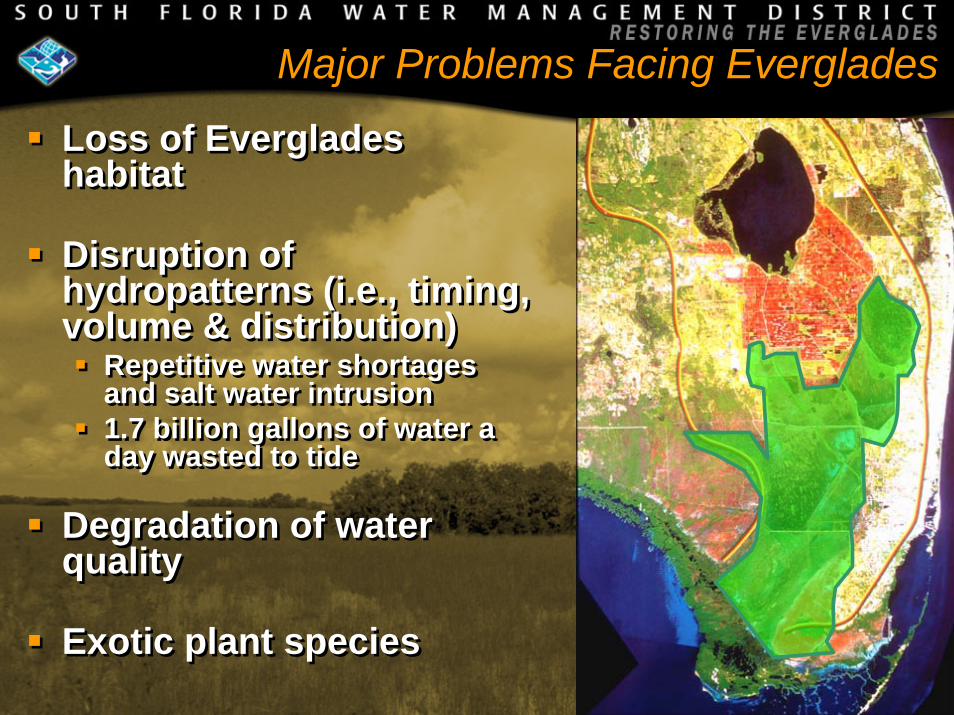
Major Problems Facing Everglades
Loss of Everglades habitat
Disruption of hydropatterns (i.e., timing, volume & distribution)
Repetitive water shortages and salt water intrusion1.7 billion gallons of water a day wasted to tide
Degradation of water quality
Exotic plant species
Loss of Everglades habitat
Disruption of hydropatterns (i.e., timing, volume & distribution)
Repetitive water shortages and salt water intrusion1.7 billion gallons of water a day wasted to tide
Degradation of water quality
Exotic plant species
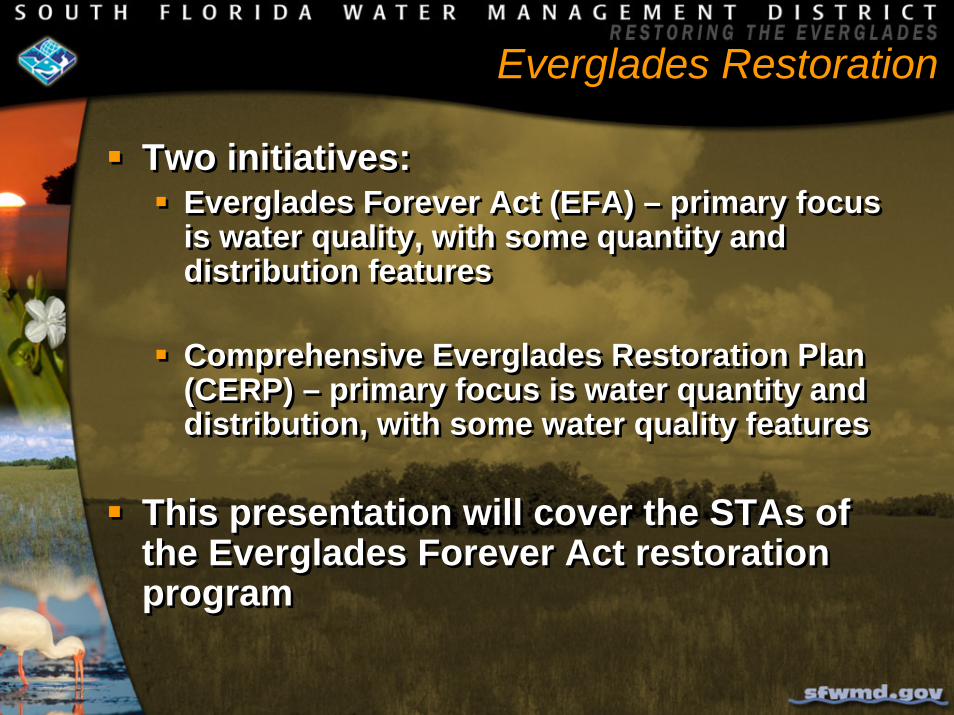
Everglades Restoration
Two initiatives:Everglades Forever Act (EFA) – primary focus is water quality, with some quantity and distribution features
Comprehensive Everglades Restoration Plan (CERP) – primary focus is water quantity and distribution, with some water quality features
This presentation will cover the STAs of the Everglades Forever Act restoration program
Everglades Forever Act
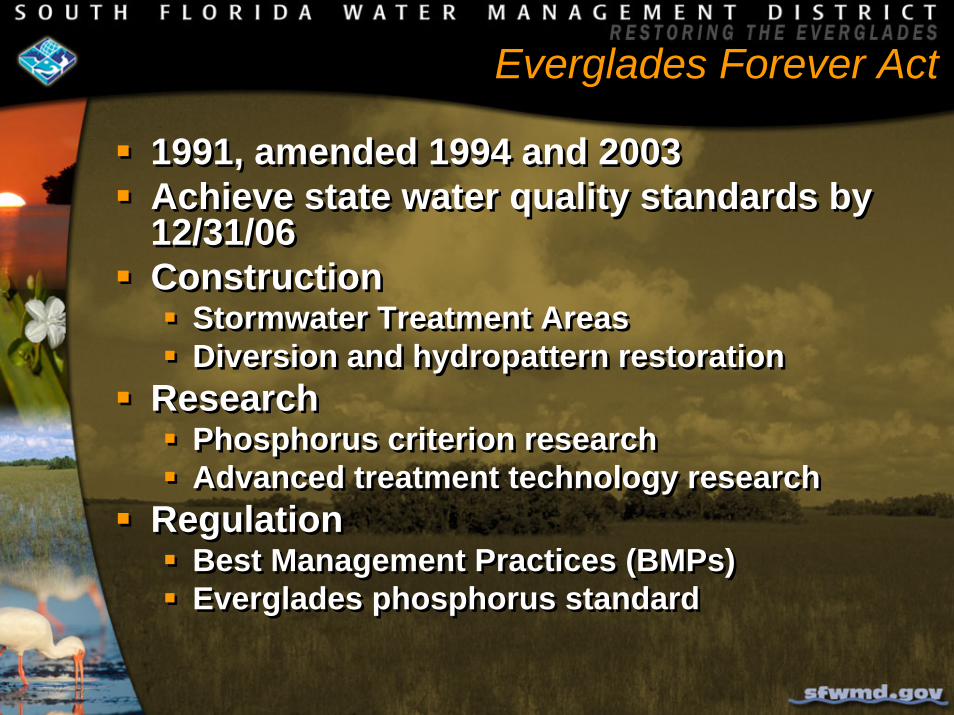
1991, amended 1994 and 2003Achieve state water quality standards by 12/31/06Construction
Stormwater Treatment AreasDiversion and hydropattern restoration
ResearchPhosphorus criterion researchAdvanced treatment technology research
RegulationBest Management Practices (BMPs)Everglades phosphorus standard
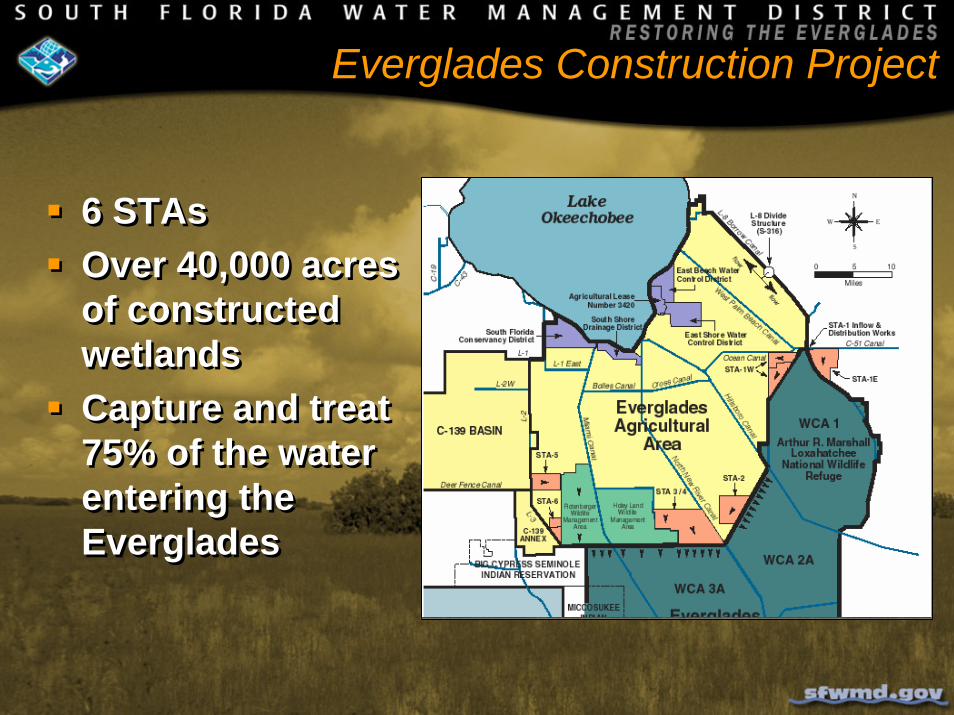
Everglades Construction Project
6 STAsOver 40,000 acres of constructed wetlandsCapture and treat 75% of the water entering the Everglades
6 STAsOver 40,000 acres of constructed wetlandsCapture and treat 75% of the water entering the Everglades
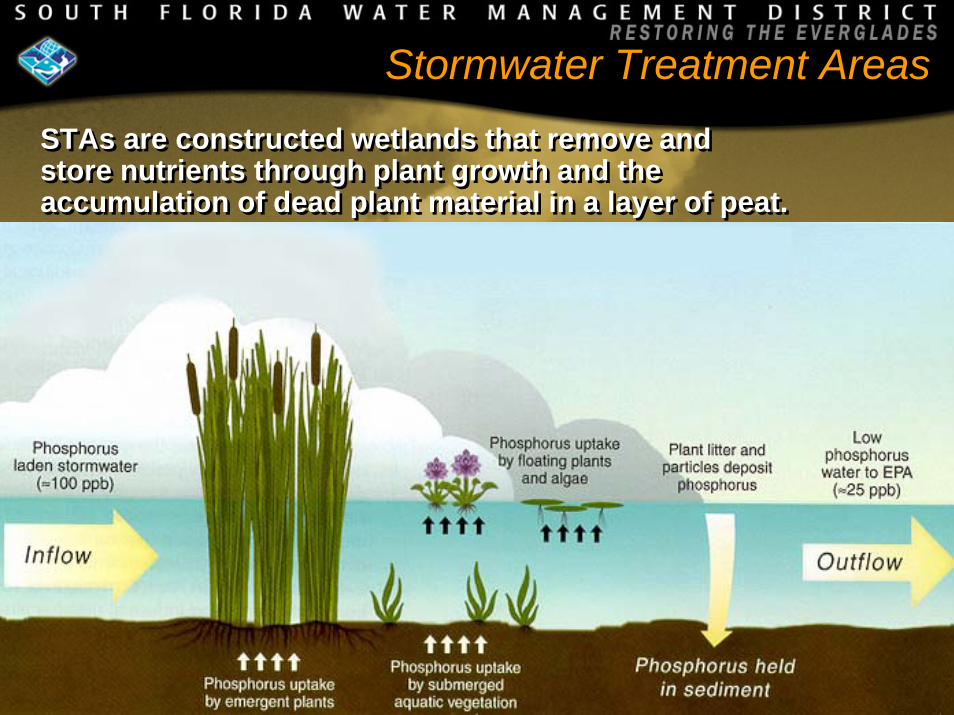
Stormwater Treatment Areas
STAs are constructed wetlands that remove andstore nutrients through plant growth and the accumulation of dead plant material in a layer of peat.
STAs are constructed wetlands that remove andstore nutrients through plant growth and the accumulation of dead plant material in a layer of peat.
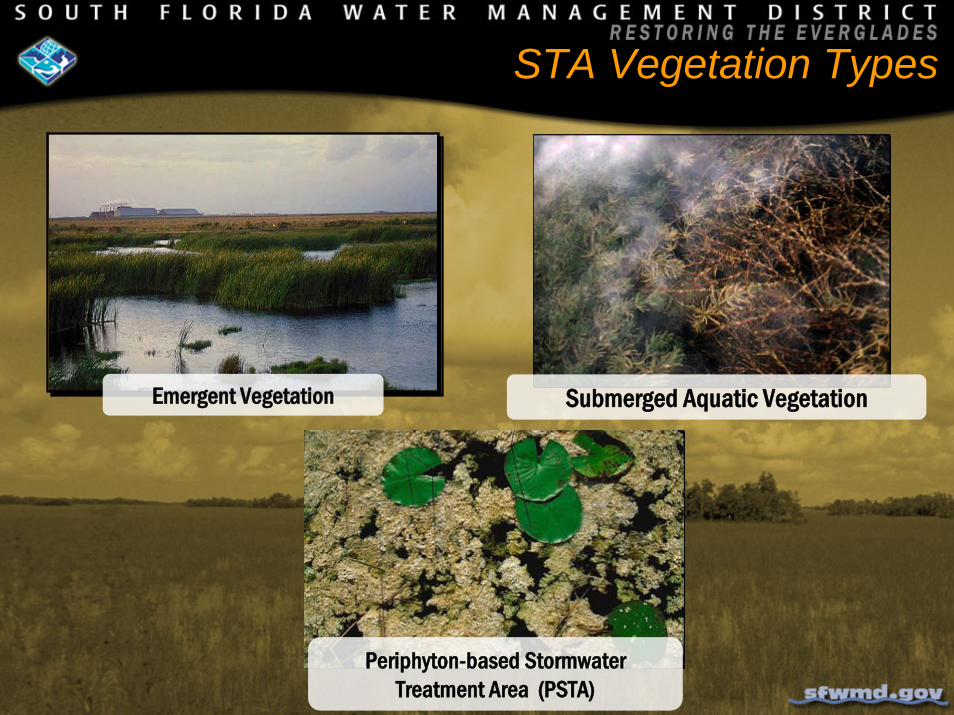
STA Vegetation Types
Emergent Vegetation Submerged Aquatic Vegetation
Periphyton-based Stormwater Treatment Area (PSTA)
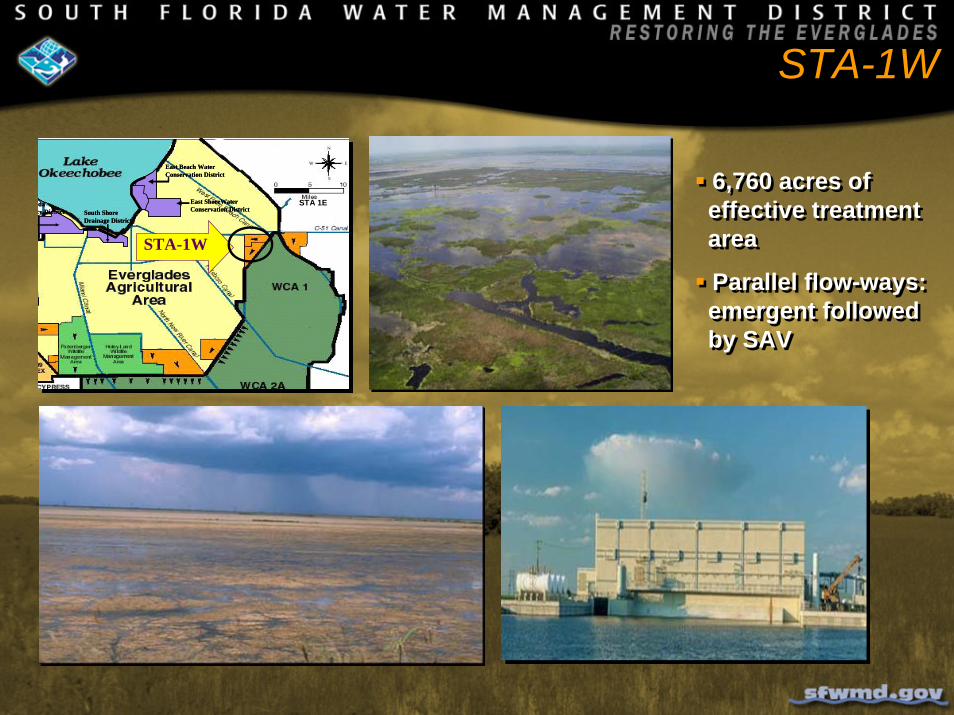
STA-1W
East Beach WaterConservation District
East ShoreWaterConservation DistrictSouth Shore
Drainage District
dacy District
East Beach WaterConservation District
East ShoreWaterConservation DistrictSouth Shore
Drainage District
dacy District
STA 1E
STA-1W
East Beach WaterConservation District
East ShoreWaterConservation DistrictSouth Shore
Drainage District
dacy District
East Beach WaterConservation District
East ShoreWaterConservation DistrictSouth Shore
Drainage District
dacy District
STA 1E
STA-1W
6,760 acres ofeffective treatmentarea
Parallel flow-ways: emergent followed by SAV
6,760 acres ofeffective treatmentarea
Parallel flow-ways: emergent followed by SAV
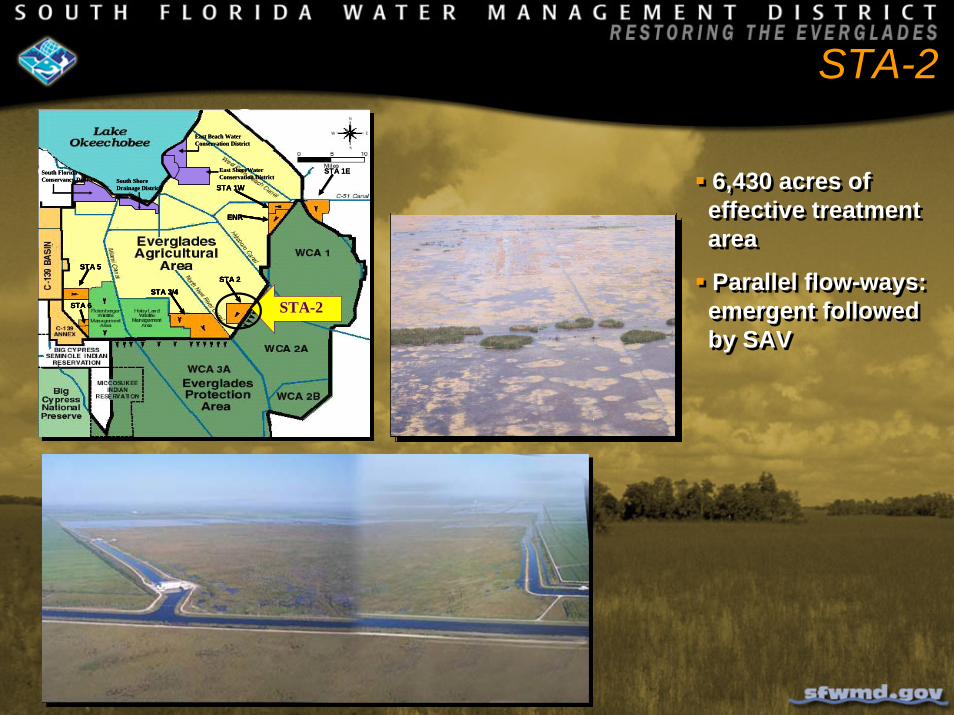
STA-2
6,430 acres ofeffective treatmentarea
Parallel flow-ways: emergent followed by SAV
6,430 acres ofeffective treatmentarea
Parallel flow-ways: emergent followed by SAV
East Beach WaterConservation District
East ShoreWaterConservation DistrictSouth Shore
Drainage District
South FloridaConservancy District
STA 1E
STA 1W
STA 2STA 3/4
STA 5
STA 6
ENR
East Beach WaterConservation District
East ShoreWaterConservation DistrictSouth Shore
Drainage District
South FloridaConservancy District
East Beach WaterConservation District
East ShoreWaterConservation DistrictSouth Shore
Drainage District
South FloridaConservancy District
STA 1E
STA 1W
STA 2STA 3/4
STA 5
STA 6
ENR
STA 1E
STA 1W
STA 2STA 3/4
STA 5
STA 6
ENR
STA 1W
STA 2STA 3/4
STA 5
STA 6
ENR
STA 2STA 3/4
STA 5
STA 6
ENR
STA-2
East Beach WaterConservation District
East ShoreWaterConservation DistrictSouth Shore
Drainage District
South FloridaConservancy District
STA 1E
STA 1W
STA 2STA 3/4
STA 5
STA 6
ENR
East Beach WaterConservation District
East ShoreWaterConservation DistrictSouth Shore
Drainage District
South FloridaConservancy District
East Beach WaterConservation District
East ShoreWaterConservation DistrictSouth Shore
Drainage District
South FloridaConservancy District
STA 1E
STA 1W
STA 2STA 3/4
STA 5
STA 6
ENR
STA 1E
STA 1W
STA 2STA 3/4
STA 5
STA 6
ENR
STA 1W
STA 2STA 3/4
STA 5
STA 6
ENR
STA 2STA 3/4
STA 5
STA 6
ENR
STA-2
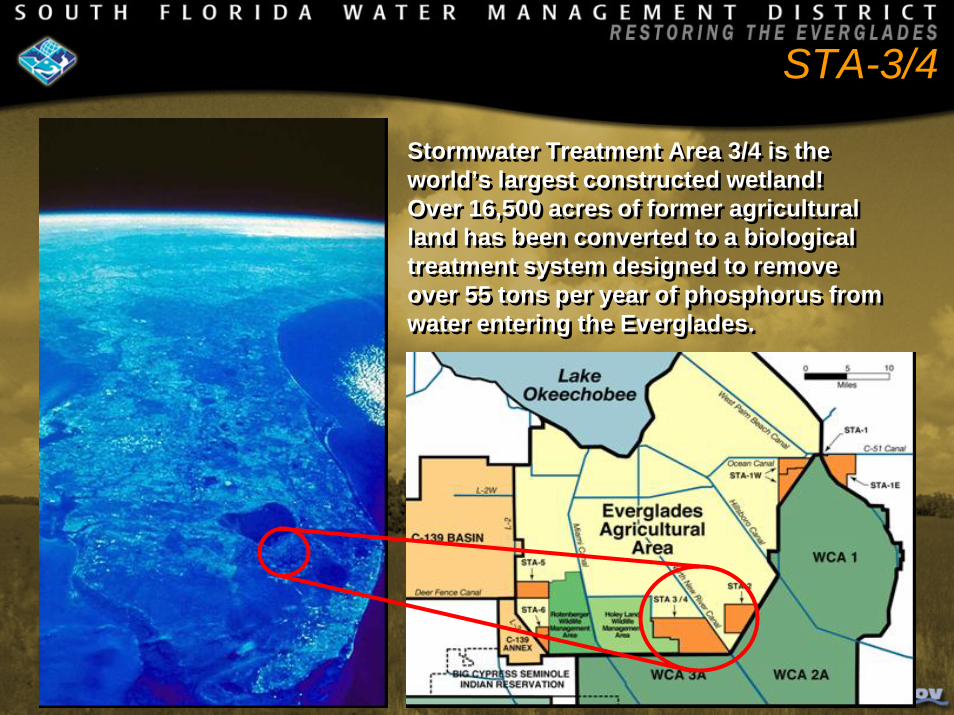
Stormwater Treatment Area 3/4 is the world’s largest constructed wetland! Over 16,500 acres of former agricultural land has been converted to a biological treatment system designed to remove over 55 tons per year of phosphorus from water entering the Everglades.
Stormwater Treatment Area 3/4 is the world’s largest constructed wetland! Over 16,500 acres of former agricultural land has been converted to a biological treatment system designed to remove over 55 tons per year of phosphorus from water entering the Everglades.
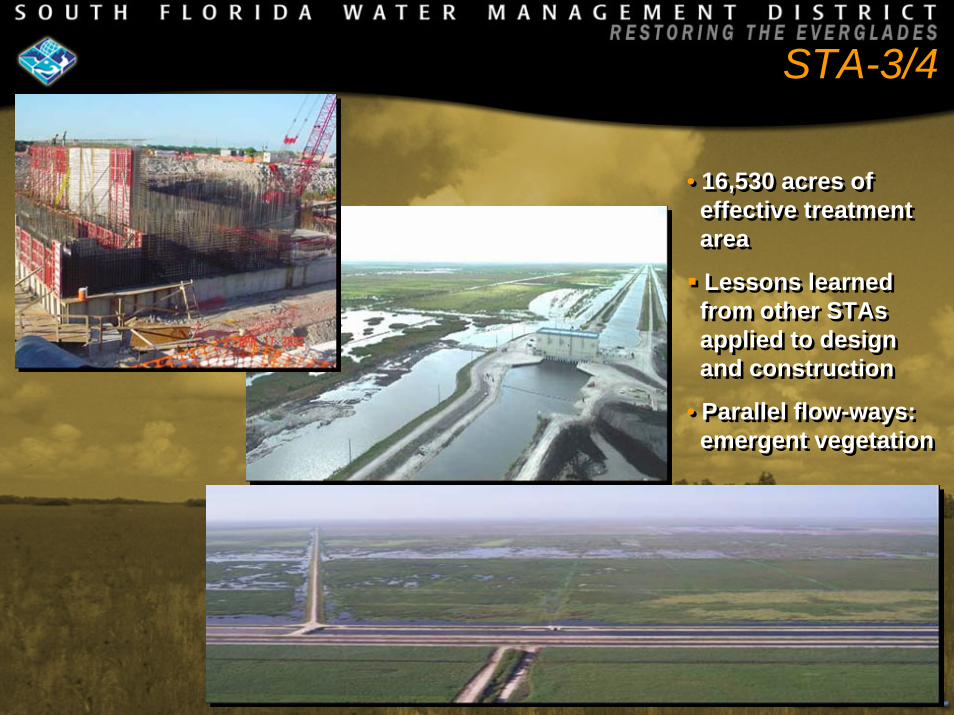
STA-3/4
STA-3/4
• 16,530 acres ofeffective treatmentarea
Lessons learnedfrom other STAsapplied to designand construction
• Parallel flow-ways: emergent vegetation
• 16,530 acres ofeffective treatmentarea
Lessons learnedfrom other STAsapplied to designand construction
• Parallel flow-ways: emergent vegetation
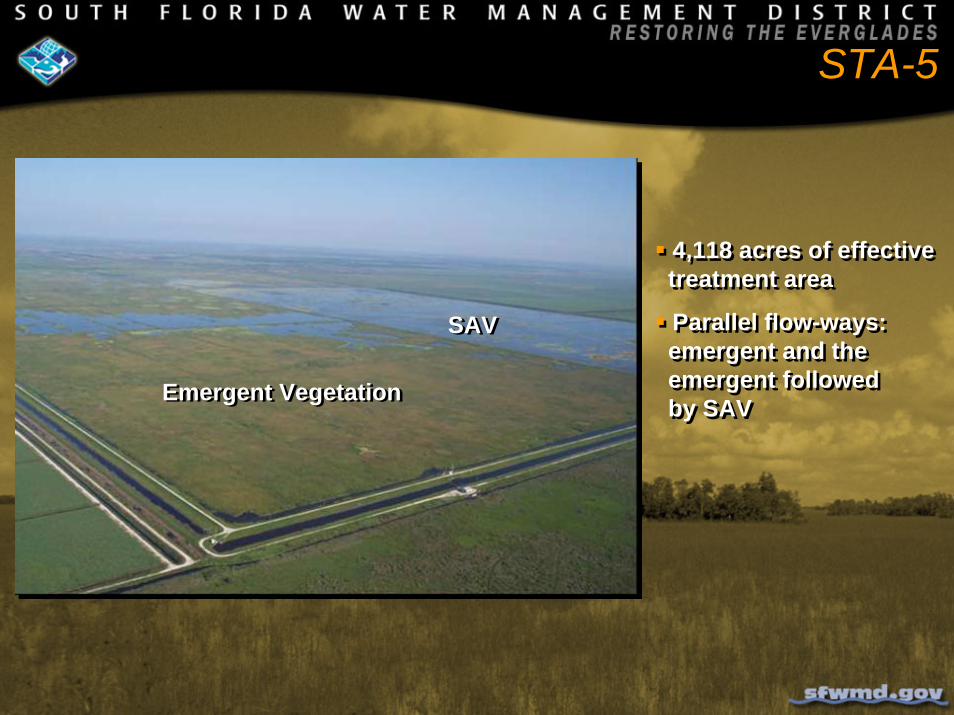
4,118 acres of effectivetreatment area
Parallel flow-ways:emergent and theemergent followedby SAV
4,118 acres of effectivetreatment area
Parallel flow-ways:emergent and theemergent followedby SAVEmergent VegetationEmergent Vegetation
SAVSAV
STA-5
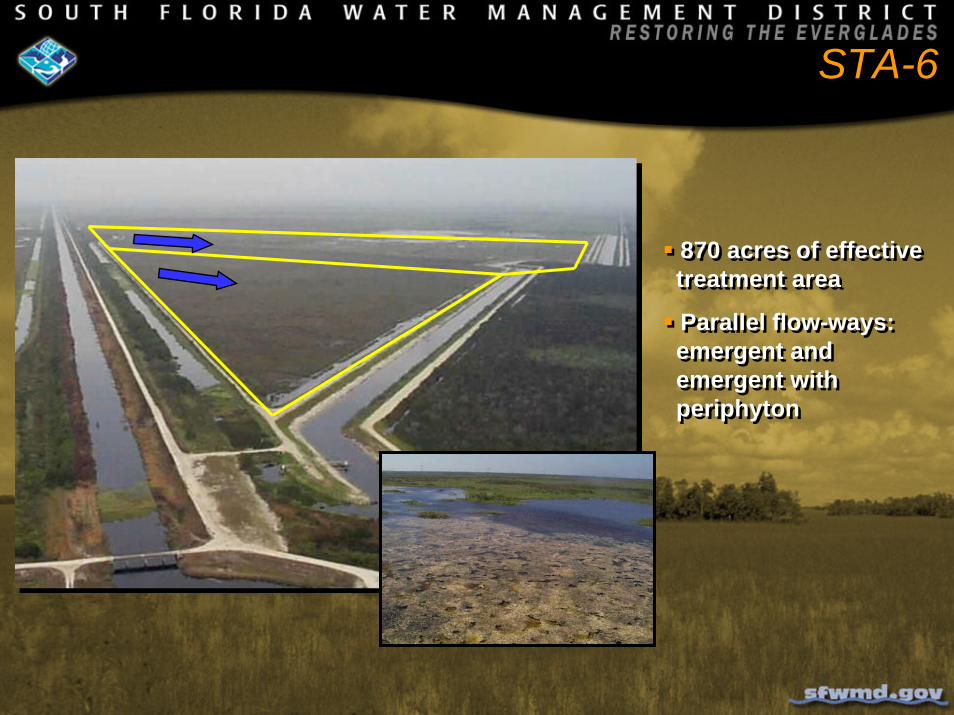
870 acres of effectivetreatment area
Parallel flow-ways:emergent and emergent withperiphyton
870 acres of effectivetreatment area
Parallel flow-ways:emergent and emergent withperiphyton
STA-6
Performance
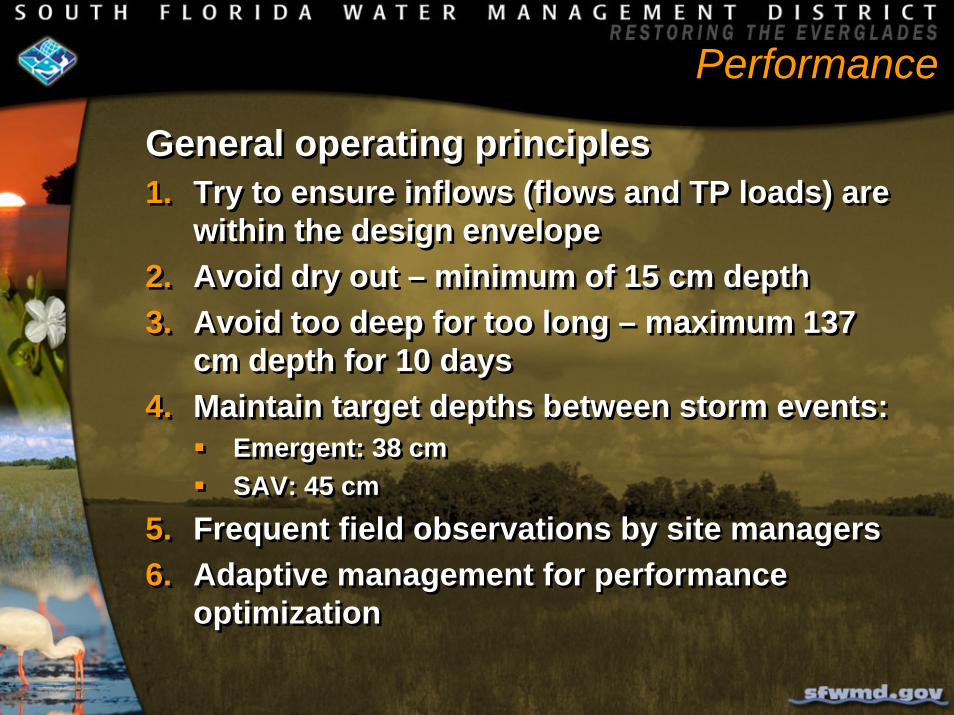
General operating principles 1. Try to ensure inflows (flows and TP loads) are
within the design envelope2. Avoid dry out – minimum of 15 cm depth3. Avoid too deep for too long – maximum 137
cm depth for 10 days4. Maintain target depths between storm events:
Emergent: 38 cm SAV: 45 cm
5. Frequent field observations by site managers 6. Adaptive management for performance
optimization
Summary of STA Performance
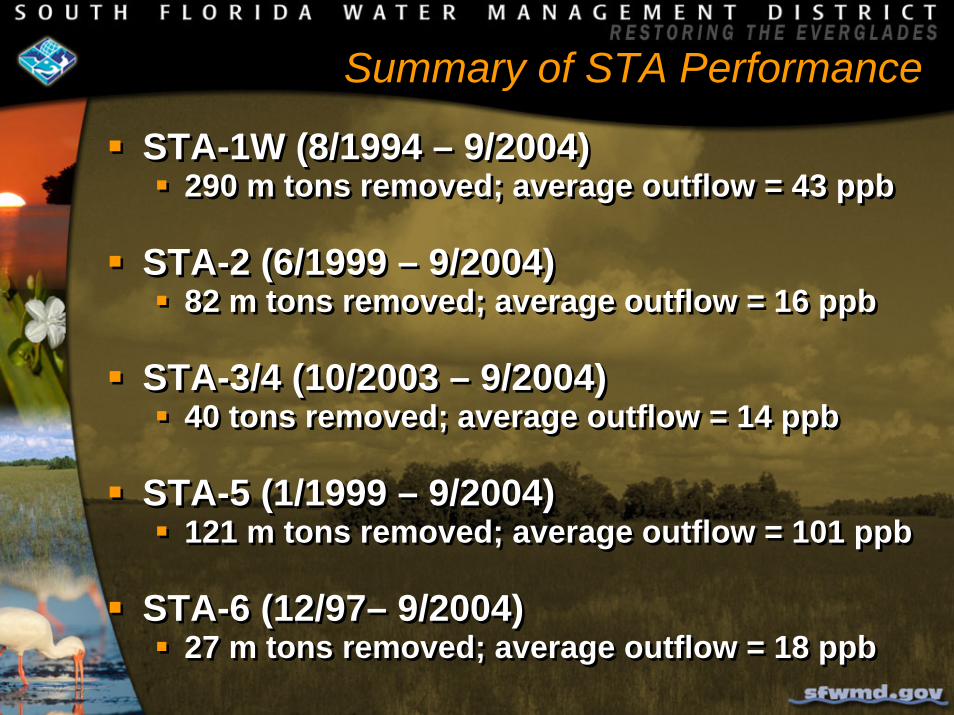
STA-1W (8/1994 – 9/2004)290 m tons removed; average outflow = 43 ppb
STA-2 (6/1999 – 9/2004)82 m tons removed; average outflow = 16 ppb
STA-3/4 (10/2003 – 9/2004)40 tons removed; average outflow = 14 ppb
STA-5 (1/1999 – 9/2004)121 m tons removed; average outflow = 101 ppb
STA-6 (12/97– 9/2004)27 m tons removed; average outflow = 18 ppb
STA Performance Synopsis – 9/04
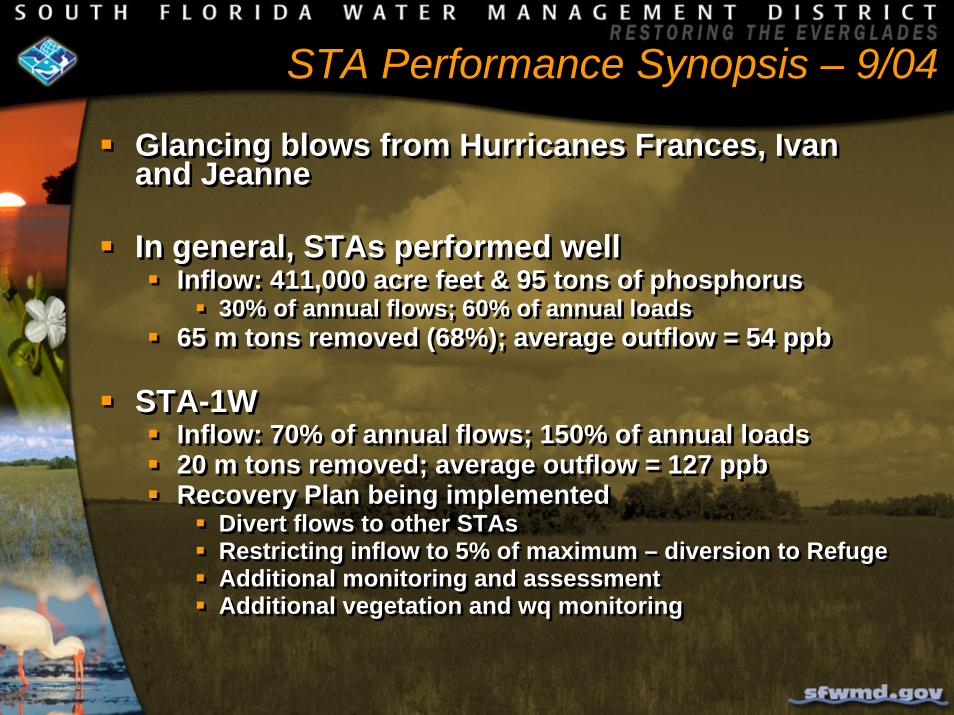
Glancing blows from Hurricanes Frances, Ivan and Jeanne
In general, STAs performed wellInflow: 411,000 acre feet & 95 tons of phosphorus
30% of annual flows; 60% of annual loads65 m tons removed (68%); average outflow = 54 ppb
STA-1W Inflow: 70% of annual flows; 150% of annual loads20 m tons removed; average outflow = 127 ppbRecovery Plan being implemented
Divert flows to other STAsRestricting inflow to 5% of maximum – diversion to RefugeAdditional monitoring and assessmentAdditional vegetation and wq monitoring
-
25
50
75
100
125
150
- 50 100 150 200 250 300
Inflow Concentrations (ppb)
Out
flow
P (p
pb)
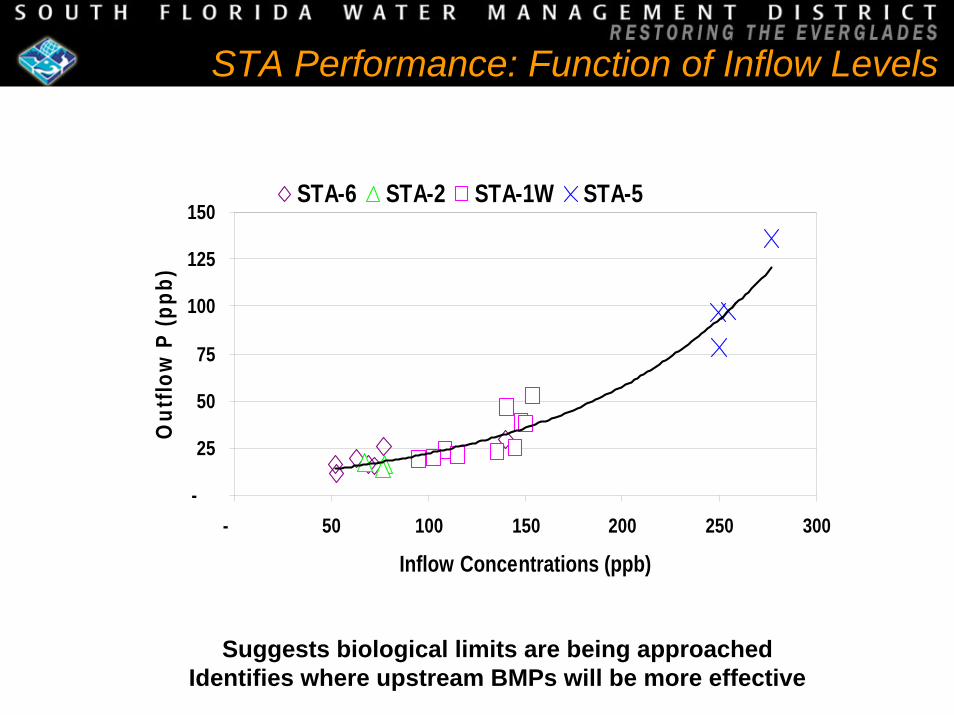
STA-6 STA-2 STA-1W STA-5
Suggests biological limits are being approached Identifies where upstream BMPs will be more effective
STA Performance: Function of Inflow Levels
0
10
20
30
40
Water Year
Settl
ing
Rat
e (m
/yr)
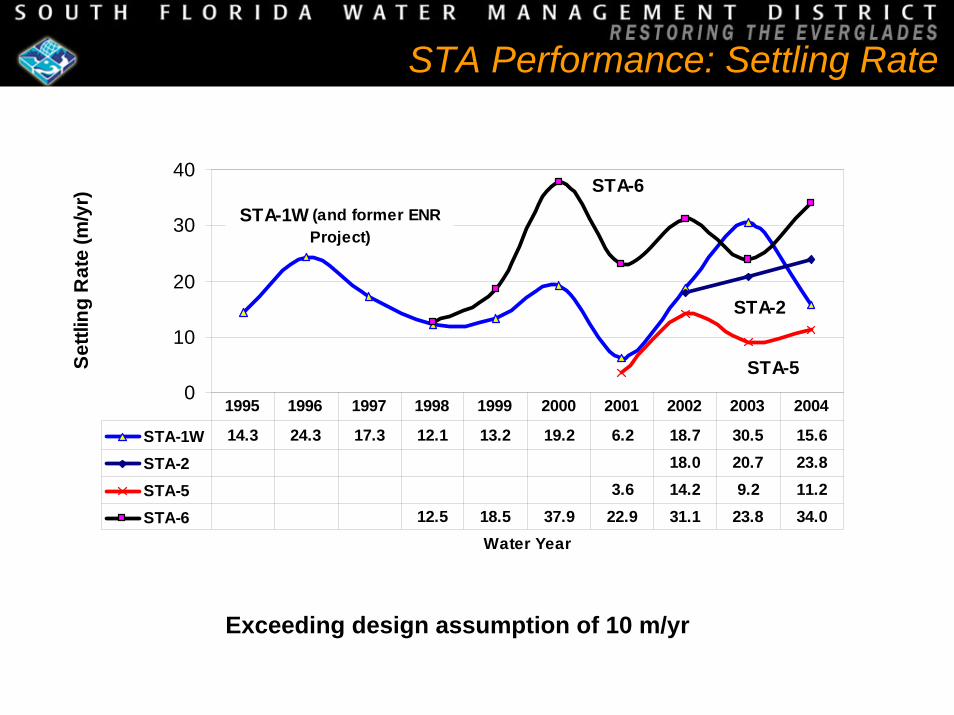
STA-1W 14.3 24.3 17.3 12.1 13.2 19.2 6.2 18.7 30.5 15.6
STA-2 18.0 20.7 23.8
STA-5 3.6 14.2 9.2 11.2
STA-6 12.5 18.5 37.9 22.9 31.1 23.8 34.0
1995 1996 1997 1998 1999 2000 2001 2002 2003 2004
STA-1W (and former ENR Project)
STA-2
STA-6
STA-5
STA Performance: Settling Rate
Exceeding design assumption of 10 m/yr
Summary
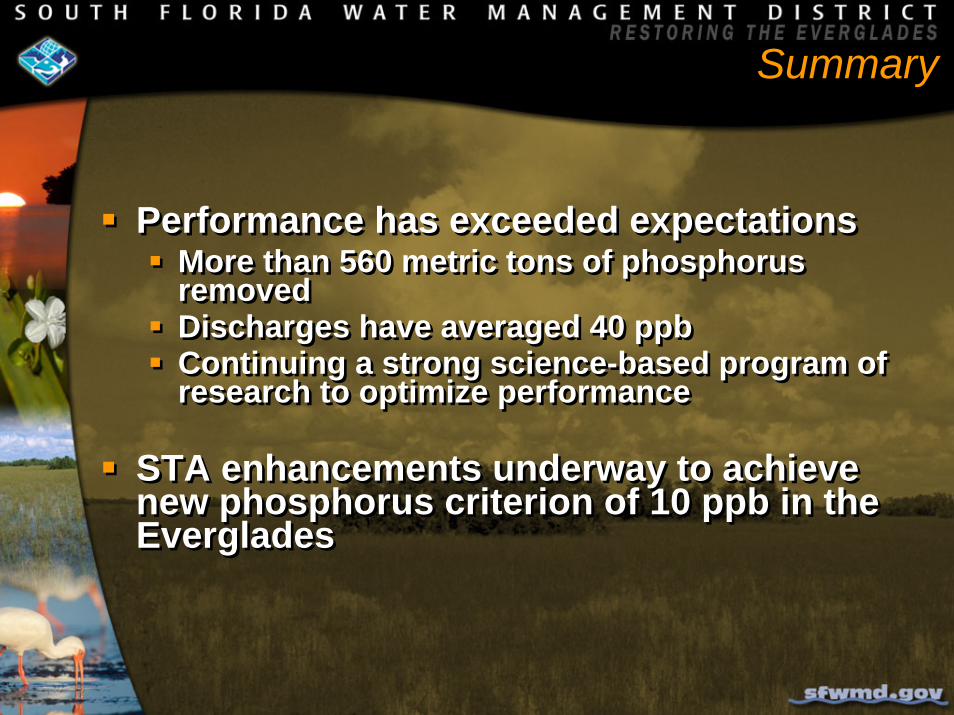
Performance has exceeded expectationsMore than 560 metric tons of phosphorus removedDischarges have averaged 40 ppbContinuing a strong science-based program of research to optimize performance
STA enhancements underway to achieve new phosphorus criterion of 10 ppb in the Everglades
Performance has exceeded expectationsMore than 560 metric tons of phosphorus removedDischarges have averaged 40 ppbContinuing a strong science-based program of research to optimize performance
STA enhancements underway to achieve new phosphorus criterion of 10 ppb in the Everglades
Summary of Performance of the Everglades Stormwater
Treatment Areas (STAs)
Summary of Performance of the Everglades Stormwater
Treatment Areas (STAs)
Gary Goforth, P.E., Ph.D.Chief Consulting Engineer
South Florida Water Management District
Gary Goforth, P.E., Ph.D.Chief Consulting Engineer
South Florida Water Management District