Embed Size (px)
Citation preview
Summary of Instrument and Question Design
Professor Ron FrickerNaval Postgraduate School
Monterey, California
1
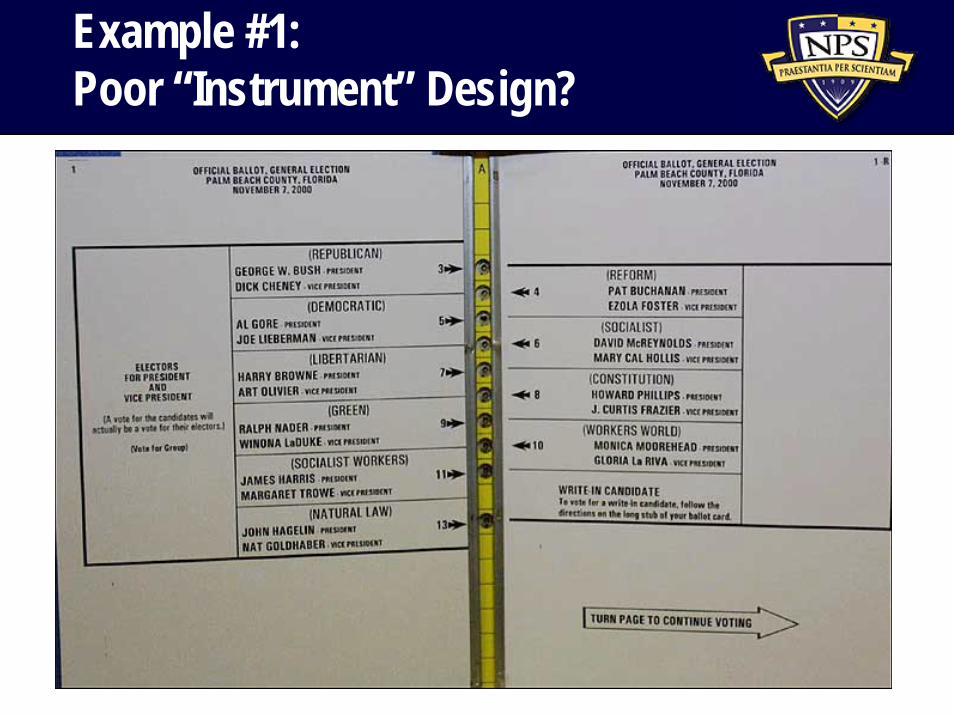
Example #1:Poor “Instrument” Design?
2
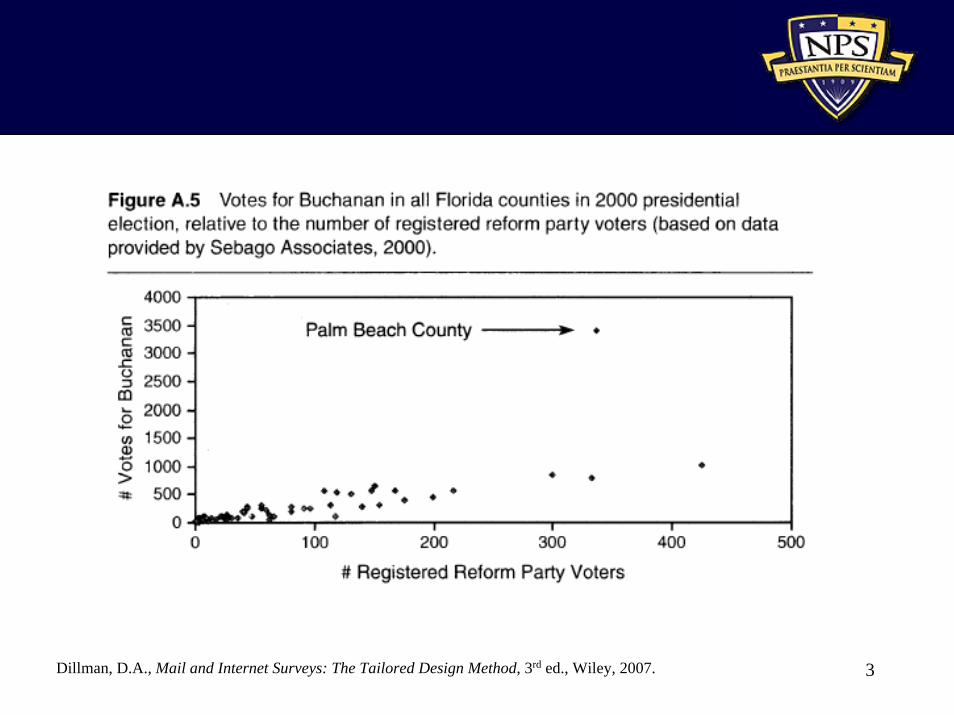
Dillman, D.A., Mail and Internet Surveys: The Tailored Design Method, 3rd ed., Wiley, 2007. 3
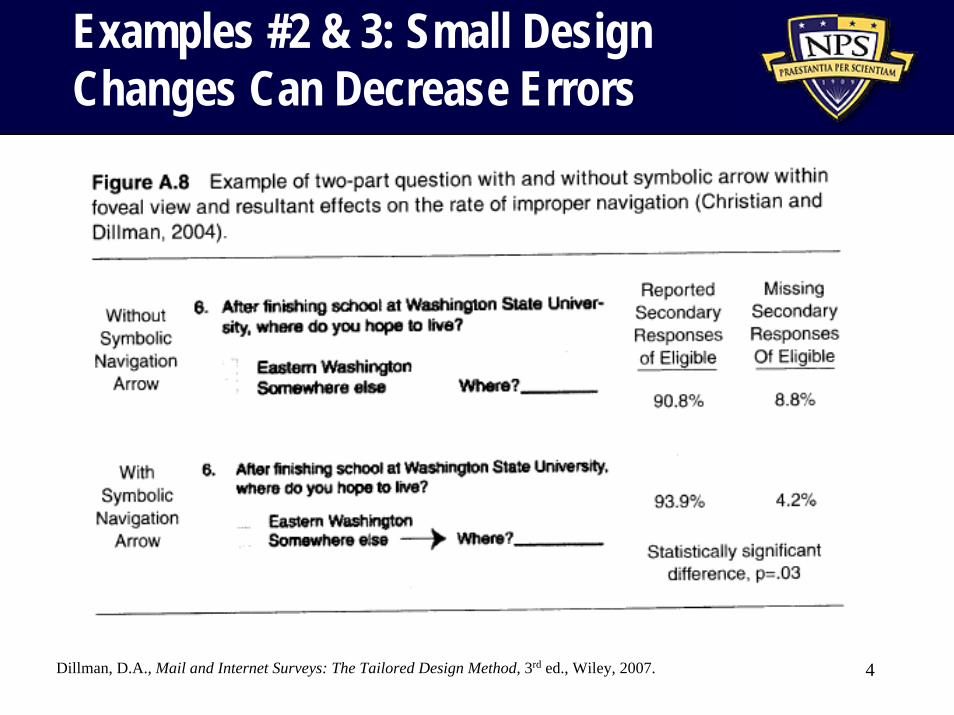
Examples #2 & 3: Small Design Changes Can Decrease Errors
Dillman, D.A., Mail and Internet Surveys: The Tailored Design Method, 3rd ed., Wiley, 2007. 4
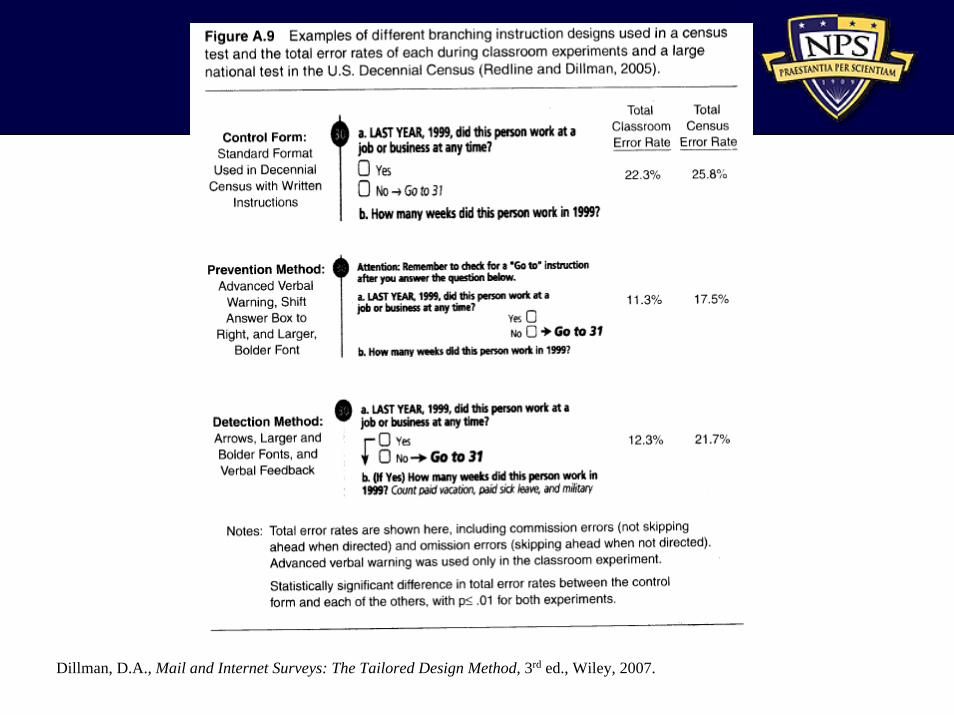
Dillman, D.A., Mail and Internet Surveys: The Tailored Design Method, 3rd ed., Wiley, 2007.
Goals for this Lecture
• In this lecture, we will summarize some guidelines for instrument and question design– How to start a survey– General instrument guidelines– General question guidelines– General response scale guidelines
• As with any list of general rules, they’re sometimes wrong– Use these guidelines as a starting point, not as
dogma that must be rigidly followed6
Good Design Helps Minimize Nonresponse and Measurement Error
• Instrument should be easy to understand, to navigate, and to complete– Encourage response
• Questions must be:– Clear– Unambiguous– Minimize possible bias
• E.g., questions with socially desirable answers• The harder it is for the respondents, the
higher the survey nonresponse rate
7
Make the Survey User-friendly!
• Make the instrument user-friendly and allow for flexibility– Make it simple to read, follow, and complete– Let respondents skip around, go back and change responses– Good electronic survey design:
• Don’t force answers unless absolutely necessary– But do remind respondents if they fail to answer
• Include response checks as much as possible• Automate skip patterns
• Invest time in instrument design to minimize respondent burden – Payoff will be in improved response rates
8
How to Start the Survey
• Open with easy questions all respondents can answer with little effort– Initial questions should also be non-threatening
• Don’t start with knowledge or awareness questions
• First questions should be directly related to the topic as described in the introduction or advance/cover letter– Make it immediately relevant to the respondent
9
Keep the Survey as Short as Possible
• Minimize total number of questions– Remember the Mark Twain quote: “I'm sorry this letter is so
long, but I did not have time to make it shorter.”– Bottom line: If you aren’t going to analyze it, don’t ask it!
• Corollary: If it doesn’t help answer the research objective, don’t ask it
• Ensure respondents have ability to respond via chosen survey modes – Web-based survey: do all potential respondents have
Internet access?• Else, could result in selection bias
– Allow for alternate response modes as necessary
10
Physical Format Checklist
• Number all questions sequentially • Use large, clear type
– Make it easy to read
• Use ‘white space’– Don’t crowd questions and text – Place more blank space between questions than between
subcomponents of questions
• Put special instructions on questionnaire as needed, next to (or within) question
• Clearly distinguish directions from questions– Use different fonts, white space, boxes, etc.
11
Physical Format, Continued
• Don’t split questions across pages/screens– If necessary (e.g., question requires 1.5 pages),
restate question and response categories on next page
• If possible, list response categories vertically instead of horizontally
• Be consistent with – Direction of response categories– Placement of response categories
12
Organizing the Questions
• Segment questions by topic• Ask about related topics together• Salient questions take precedence over less salient
ones• Ask recall backwards in time• Use transitions when changing topics – give a sense
of progress through the questionnaire• Leave objectionable questions (e.g., income) for the
end• Put demographic questions at the end
13
Guidelines for Writing Good Questions
• Questions must be:– Easily and consistently understood– Easy to answer:
• Only ask one question at a time• Break complicated questions/concepts up into a series of
simpler questions• Respondents have a common understanding of
– The meaning of each question– What constitutes an adequate answer
• Respondents also must:– Have access to information needed to answer– Be willing to provide answers called for by questions
Fowler, F.J., Jr., Improving Survey Questions: Design and Evaluation, SAGE Publications andFowler, F.J., Jr., Survey Research Methods, SAGE Publications.
14

Eliciting Correct Information Not As Simple As One Might Expect
15
A simple model of the cognitive process in answering questions:
Comprehension
• Comprehension includes such processes as– Attending to the question, and instructions;– Assigning a meaning to the surface form of the
question; and, – Inferring the question’s point
• Interpreting the question entails– Parsing the question– Assigning meanings to the key elements– Inferring the purpose behind the question– Determining the boundaries and potential overlap
between permissible answers 16
Retrieval
• Retrieval is the process of recalling information relevant to answering the question from long-term memory (or from where ever the information is physically stored)
• Successful retrieval can depend on– Nature of the events in question– How long ago the events took place– The number and richness of the “cues” that initiate
the retrieval process17
Estimation and Judgment
• Estimation and judgment are the processes of combining or supplementing what the respondent has retrieved
• Essentially, the respondent must figure out how to quantify or rate the information being retrieved to appropriately answer the question
• May also have to literally estimate their answer from imperfect memory /records of events
18
Reporting
• Reporting is the process of selecting and communicating an answer, which includes– Mapping the answer onto the question’s response
options– Altering the answer for consistency with prior
answers, perceived acceptability, etc.• How respondents report their answer will
depend in part on the fit between the information they retrieve and constraints imposed by the question
19
Problems in Answering Survey Questions
1. Failure to encode information sought2. Misinterpretation of the question3. Forgetting and other memory problems4. Flawed judgment or estimation strategies5. Problems in formatting answer6. More or less deliberate misreporting7. Failure to follow instructions
20
Encoding Problems
• People are notoriously poor eyewitnesses– Similarly, they often miss key details of many
things observed / experienced• A.F. Smith study compared what people said
they ate in a survey to what was recorded in detailed food diaries the respondents kept– He concluded, “dietary [survey] reports…consist in
large part of individuals’ guesses about what they probably ate.”
• Conclusion: People cannot report what they have not mentally “encoded”
21
Misinterpreting Questions
• Respondents are unlikely to provide accurate answers to misinterpreted questions
• Seven types of comprehension problems:– Grammatical ambiguity– Excessive complexity– Faulty presupposition– Vague concepts– Vague quantifiers– Unfamiliar terms– False inferences
22
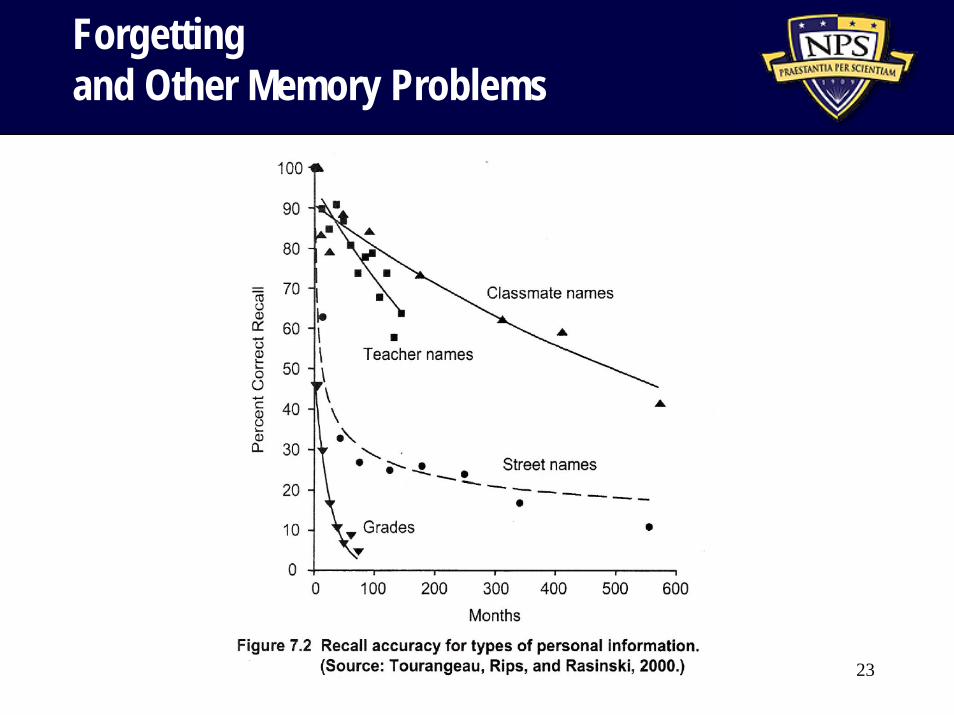
Forgetting and Other Memory Problems
23
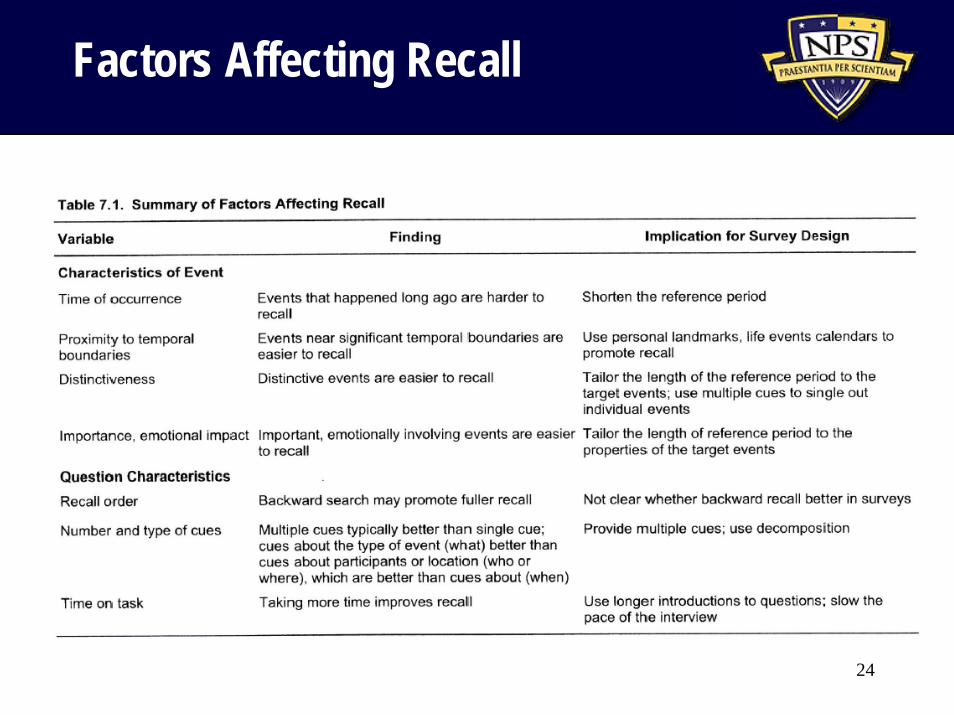
Factors Affecting Recall
24
Formatting the Answer
• Once respondents have estimated an answer, they must translate it into an acceptable answer
• More or less difficult depending on the response format: – open-ended– closed-ended with ordered response scale– closed-ended with categorical response options
• Good design can mitigate some problems, but some will likely remain
25
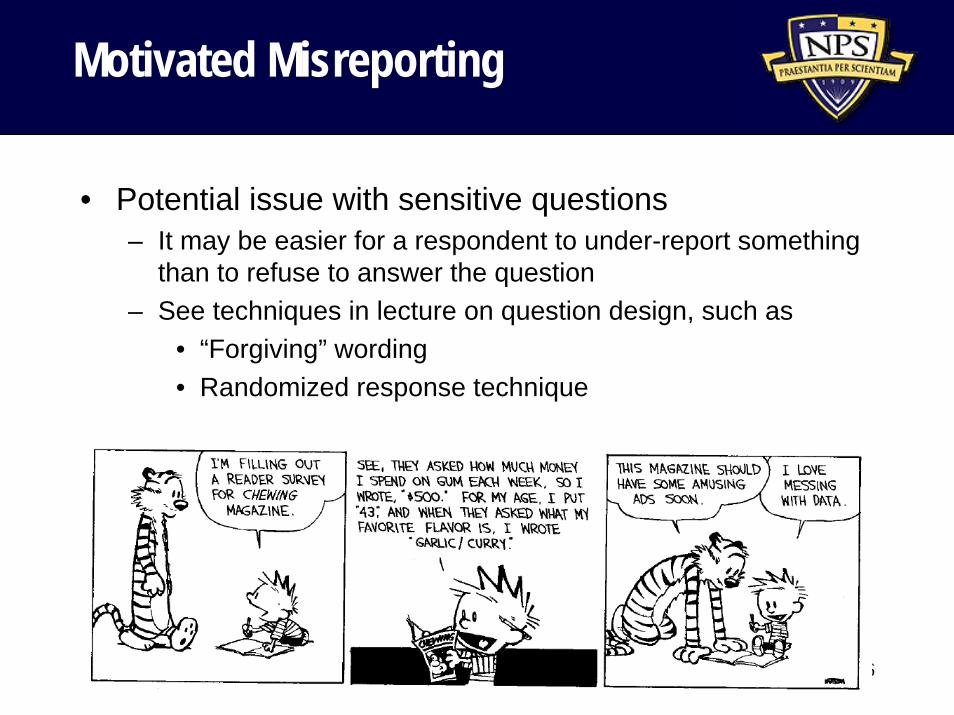
Motivated Misreporting
• Potential issue with sensitive questions– It may be easier for a respondent to under-report something
than to refuse to answer the question– See techniques in lecture on question design, such as
• “Forgiving” wording• Randomized response technique
26
Question Design Guidelines
• Most survey question design isn’t rocket science – It’s mainly common sense combined with careful pre-testing
of questions and responses• Keep questions as simple and direct as possible
– Break complex queries into a series of questions• Avoid ambiguous terms and questions like the plague
– Corollary: Carefully and clearly define complex and technical terms
• Only ask open-ended questions if necessary– Don’t ask respondents to do your work for you– Exception: As appropriate, give respondents a chance to
provide input not otherwise asked for
27
Disadvantages of Closed Questions
• Categories may be leading to respondents• May make it too easy to answer without
thinking• May limit spontaneity • Not best when
– Asking for frequency of sensitive behaviors– There are numerous possible responses
28
Open-ended Questions
• Useful for allowing respondents to provide additional data not asked for in the survey– Can mitigate possible frustration w/ survey
• Also good for– Understanding reasoning behind other answers– When possible responses exceeds reasonable list– May be easiest way to collect information about
complicated phenomenon/issue/problem• But, use sparingly:
– Generally hard to analyze• New software making this less of a problem
– If overused, puts large burden on respondents29
Don’t Forget “Don’t Knows”
• Lack can frustrate some respondents– If respondents forced to just skip answering a
question (item nonresponse) can make analysis more difficult
• Solutions:– Ask a screening question first
• Appropriately allows instrument to build in “skip patterns” for respondents to skip over questions that do not apply
– Include a “no opinion” or “don’t know” response– Force respondent to answer the question (tricky to
do well)30
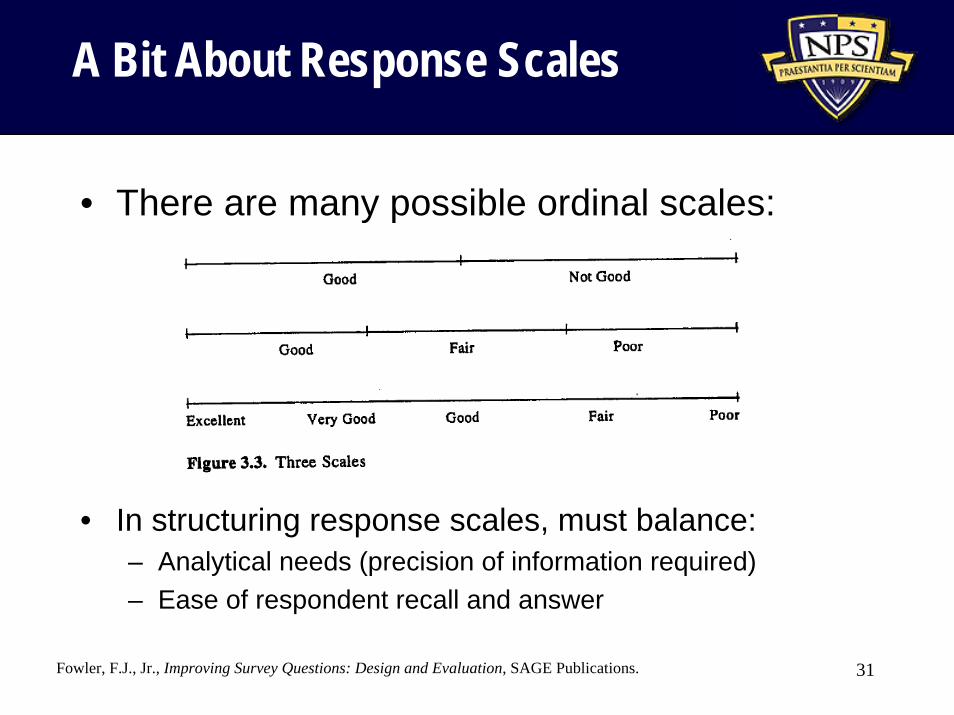
A Bit About Response Scales
• There are many possible ordinal scales:
• In structuring response scales, must balance:– Analytical needs (precision of information required)– Ease of respondent recall and answer
Fowler, F.J., Jr., Improving Survey Questions: Design and Evaluation, SAGE Publications. 31
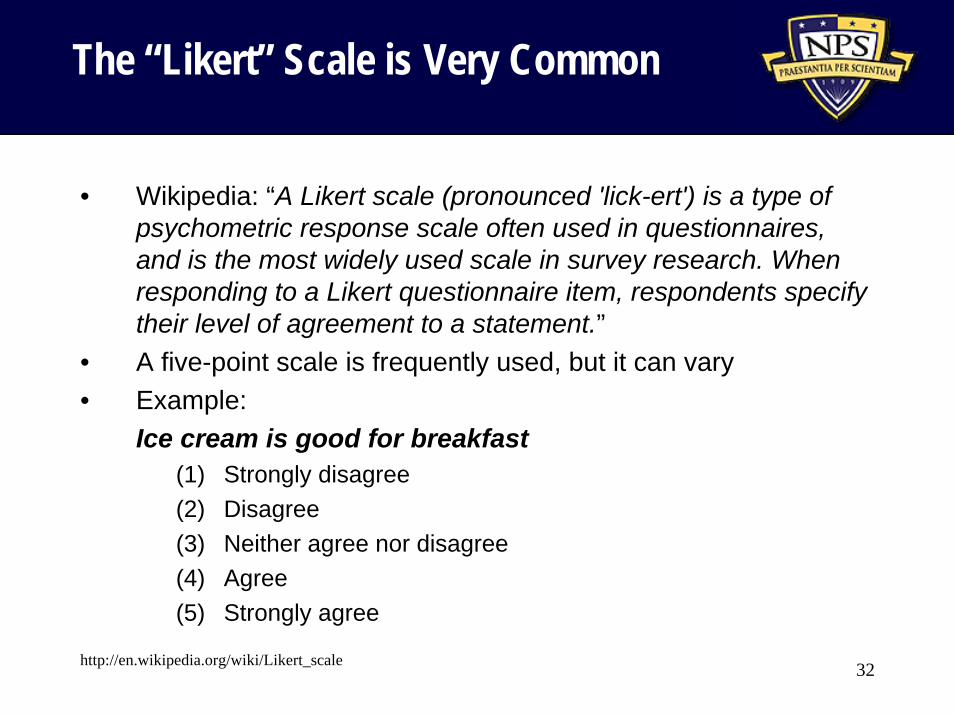
The “Likert” Scale is Very Common
• Wikipedia: “A Likert scale (pronounced 'lick-ert') is a type of psychometric response scale often used in questionnaires, and is the most widely used scale in survey research. When responding to a Likert questionnaire item, respondents specify their level of agreement to a statement.”
• A five-point scale is frequently used, but it can vary• Example:
Ice cream is good for breakfast(1) Strongly disagree (2) Disagree (3) Neither agree nor disagree (4) Agree (5) Strongly agree
http://en.wikipedia.org/wiki/Likert_scale 32
Constructing Response Scales
• Number of points in scale should be determined by how you plan to use the data
• Respondents can generally only remember a maximum of 5 responses unless visual cues are used
• With scales with few points, every scale can be labeled– In longer scales, only label midpoint and endpoints
• Graphic images such as thermometers and ladders can be effective
33
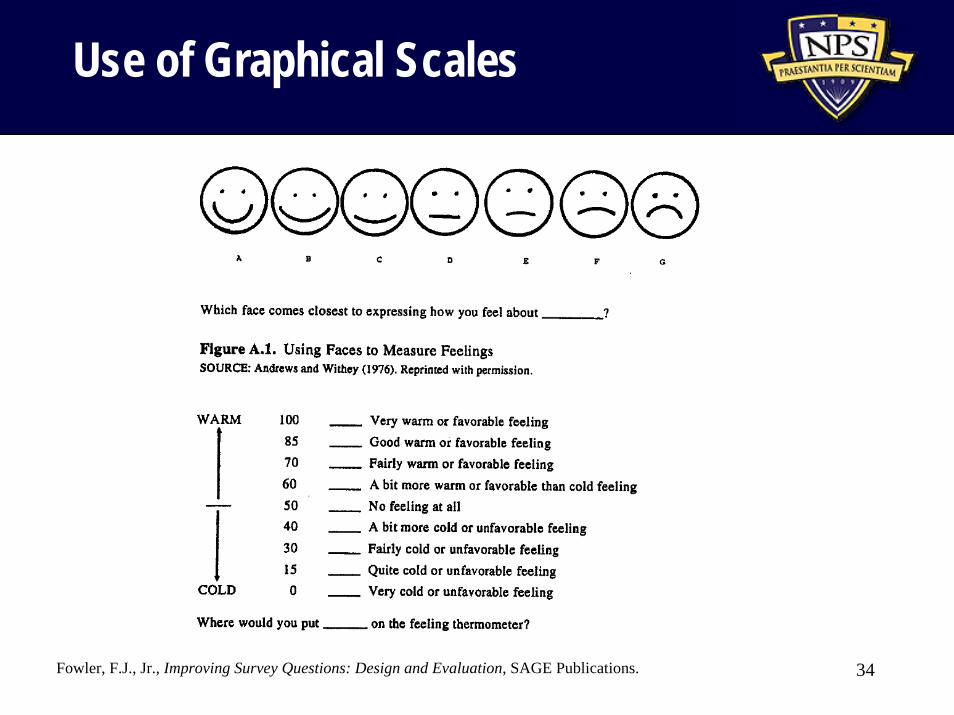
Use of Graphical Scales
Fowler, F.J., Jr., Improving Survey Questions: Design and Evaluation, SAGE Publications. 34
Specific Response Scale Guidelines (1)
• Clearly label the response scale(s)• Be consistent with the scale labels and ordering
throughout the instrument• Keep the number of response categories to the
necessary minimum:– At what level of detail can respondents easily
recall/respond?– How finely can respondents meaningfully answer?– What is necessary for the analysis?
• If “n/a” response needed/appropriate, visually distance it from the rest of the scale
35
Specific Response Scale Guidelines (2)
• Response categories should be consistent with the question– In the absence of another need/requirement,
default to five-point Likert scale• Categories must be exhaustive, including
every possible answer• Categories must be mutually exclusive (no
overlap)• If appropriate, include a “don’t know” category
36
Don’t Forget to Collect Relevant Covariate Data
• Usually it is important to collect covariate data for the analysis– Depends on the research objectives, of course
• For example, demographic data– E.g., for individuals: age, gender, race, marital
status, military service, rank, etc.– E.g., for organizations: size, type, mission, etc.
• Usually these are important categories that you want to conduct the analysis by
37
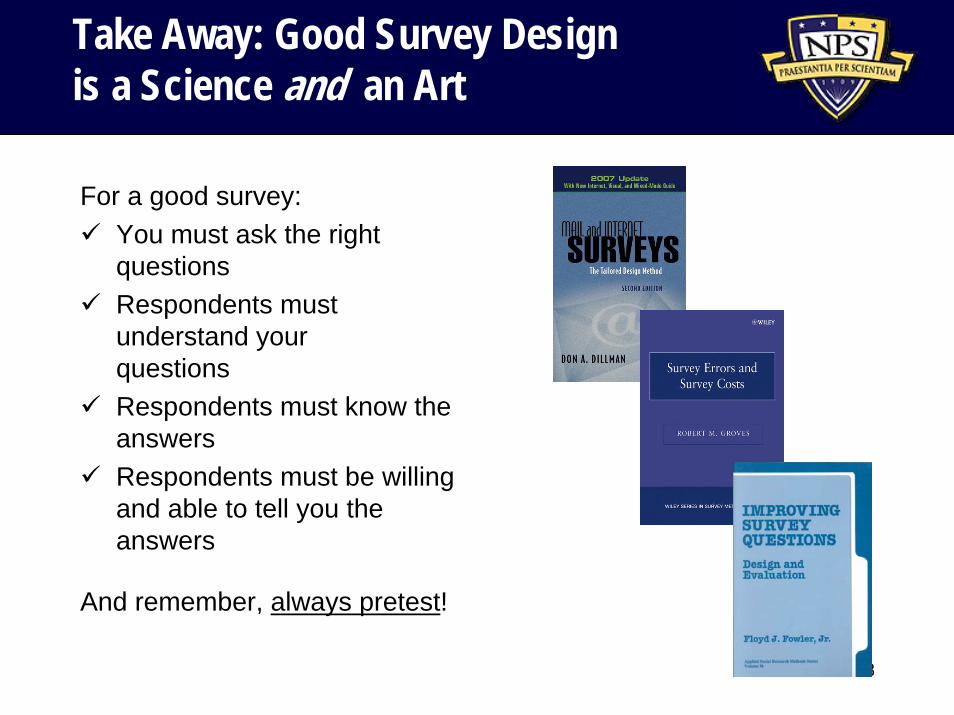
Take Away: Good Survey Design is a Science and an Art
For a good survey:You must ask the right questionsRespondents must understand your questionsRespondents must know the answersRespondents must be willing and able to tell you the answers
And remember, always pretest!
38
What We Have Covered
• In this lecture, we have summarized some guidelines for instrument and question design– How to start a survey– General instrument guidelines– General question guidelines– General response scale guidelines
• Remember, as with any list of general rules, they’re sometimes wrong– Use these guidelines as a starting point, not as
dogma that must be rigidly followed.39


![Instrument Question Answer[1].Doc.r](https://img.pdfslide.us/doc/110x75/577ce0901a28ab9e78b39b13/instrument-question-answer1docr.jpg)