Embed Size (px)
Citation preview
3/31/2015
Summary of Impacts of Environmental Regulations in the ERCOT Region Warren Lasher Director, System Planning
3/31/2015 1
• Several new regulations have been proposed or finalized since ERCOT conducted its last major study of the potential impacts of environmental regulations in 2011.
• In combination, these rules appear to have the potential to have a significant impact on grid resources.
Study Purpose and Background
3/31/2015 2
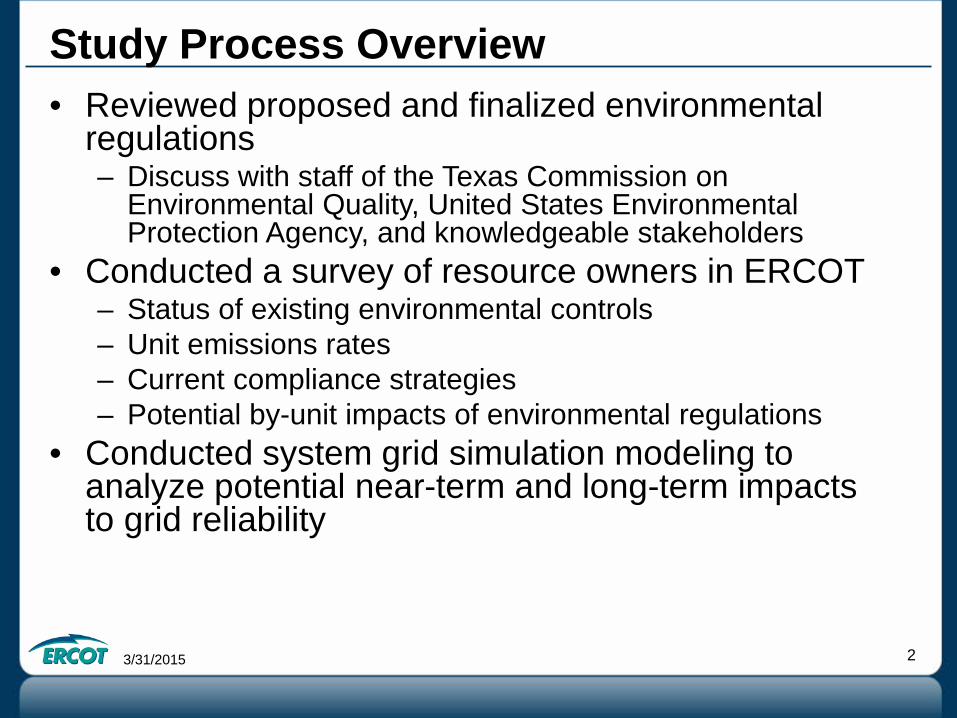
• Reviewed proposed and finalized environmental regulations – Discuss with staff of the Texas Commission on
Environmental Quality, United States Environmental Protection Agency, and knowledgeable stakeholders
• Conducted a survey of resource owners in ERCOT – Status of existing environmental controls – Unit emissions rates – Current compliance strategies – Potential by-unit impacts of environmental regulations
• Conducted system grid simulation modeling to analyze potential near-term and long-term impacts to grid reliability
Study Process Overview
3/31/2015 3
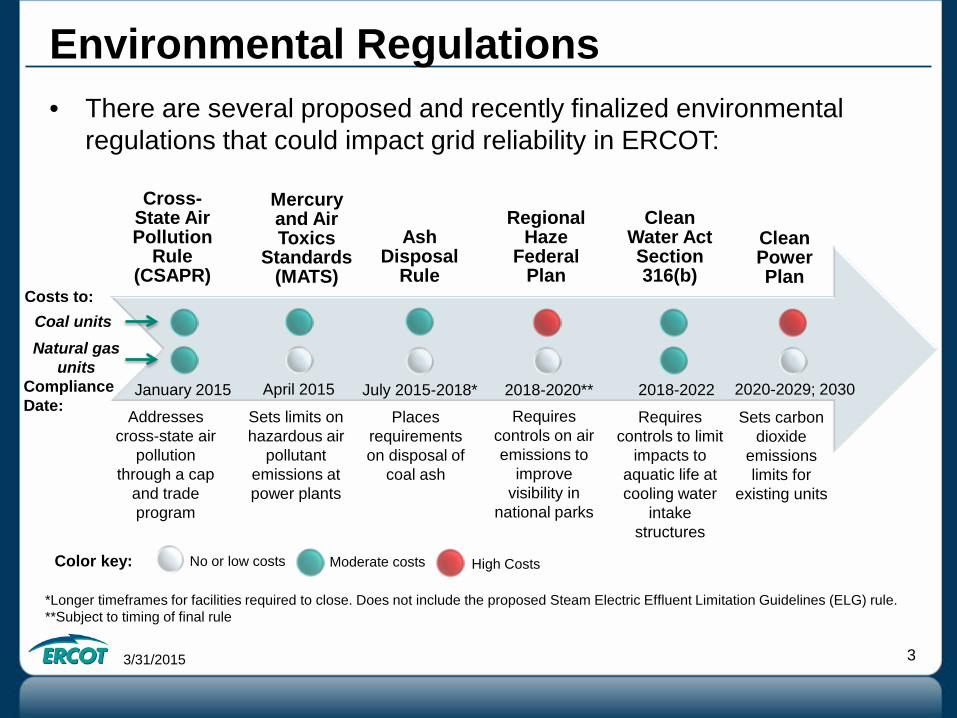
Cross-State Air Pollution
Rule (CSAPR)
Mercury and Air Toxics
Standards (MATS)
Ash Disposal
Rule
Regional Haze
Federal Plan
Clean Water Act Section 316(b)
Clean Power Plan
Environmental Regulations
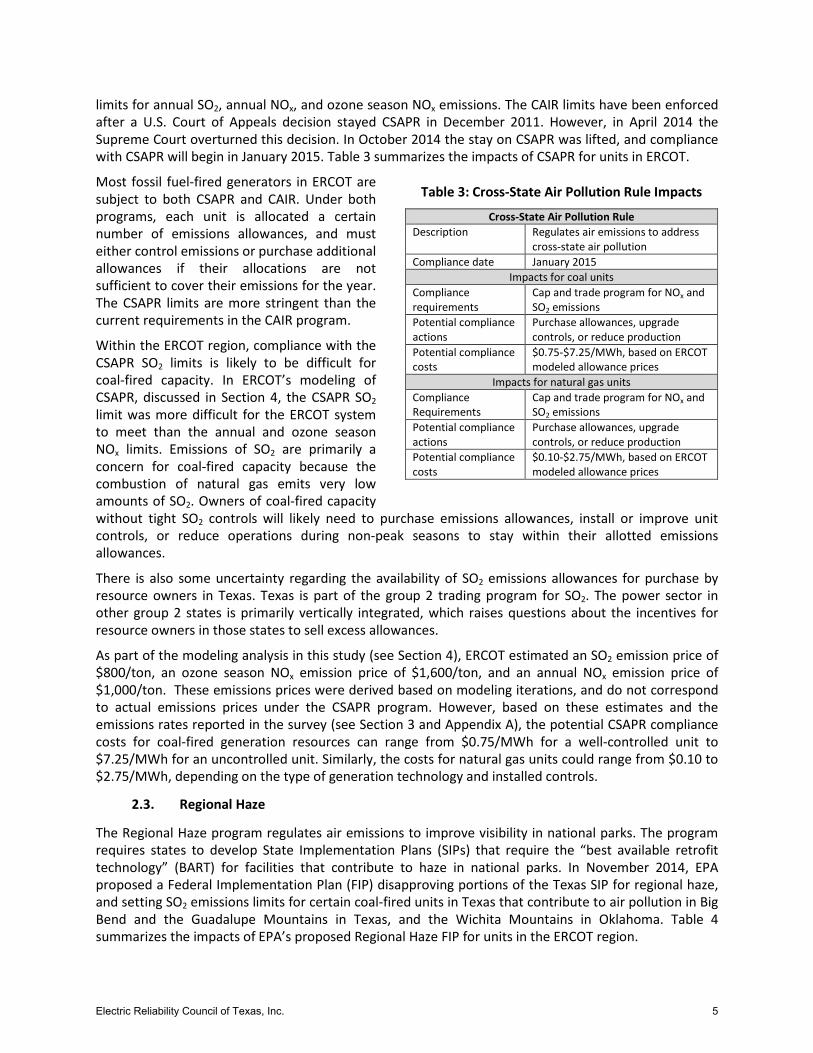
April 2015 January 2015 2018-2020** 2018-2022 July 2015-2018* 2020-2029; 2030 Compliance Date:
Addresses cross-state air
pollution through a cap
and trade program
Sets limits on hazardous air
pollutant emissions at power plants
Requires controls on air emissions to
improve visibility in
national parks
Requires controls to limit
impacts to aquatic life at cooling water
intake structures
Sets carbon dioxide
emissions limits for
existing units
Places requirements on disposal of
coal ash
*Longer timeframes for facilities required to close. Does not include the proposed Steam Electric Effluent Limitation Guidelines (ELG) rule. **Subject to timing of final rule
• There are several proposed and recently finalized environmental regulations that could impact grid reliability in ERCOT:
Coal units Natural gas
units
Costs to:
Color key: No or low costs Moderate costs High Costs
3/31/2015 4
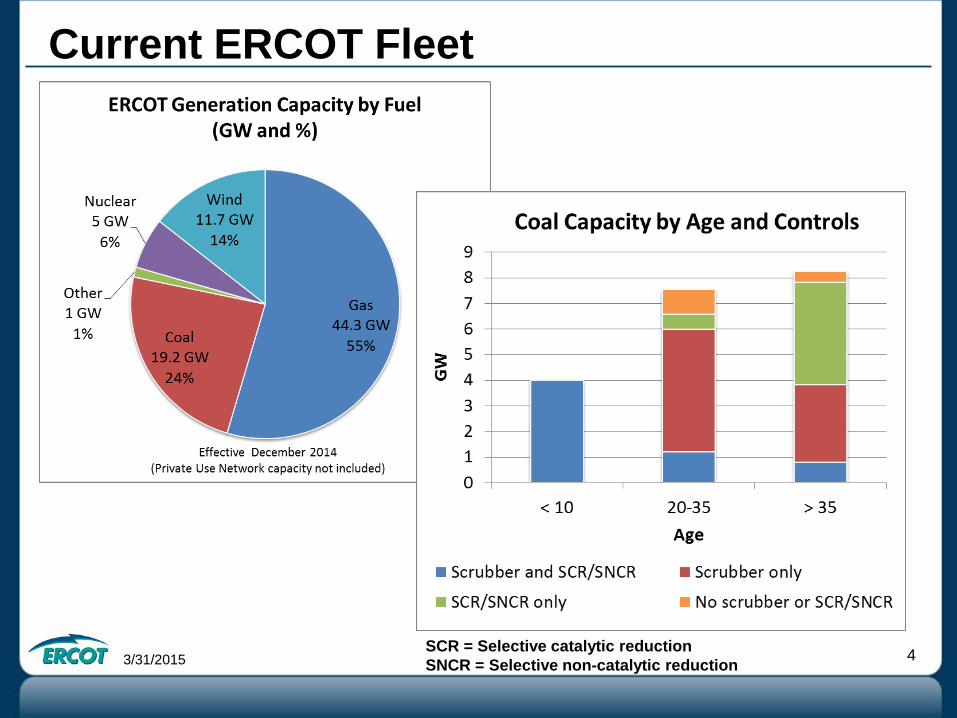
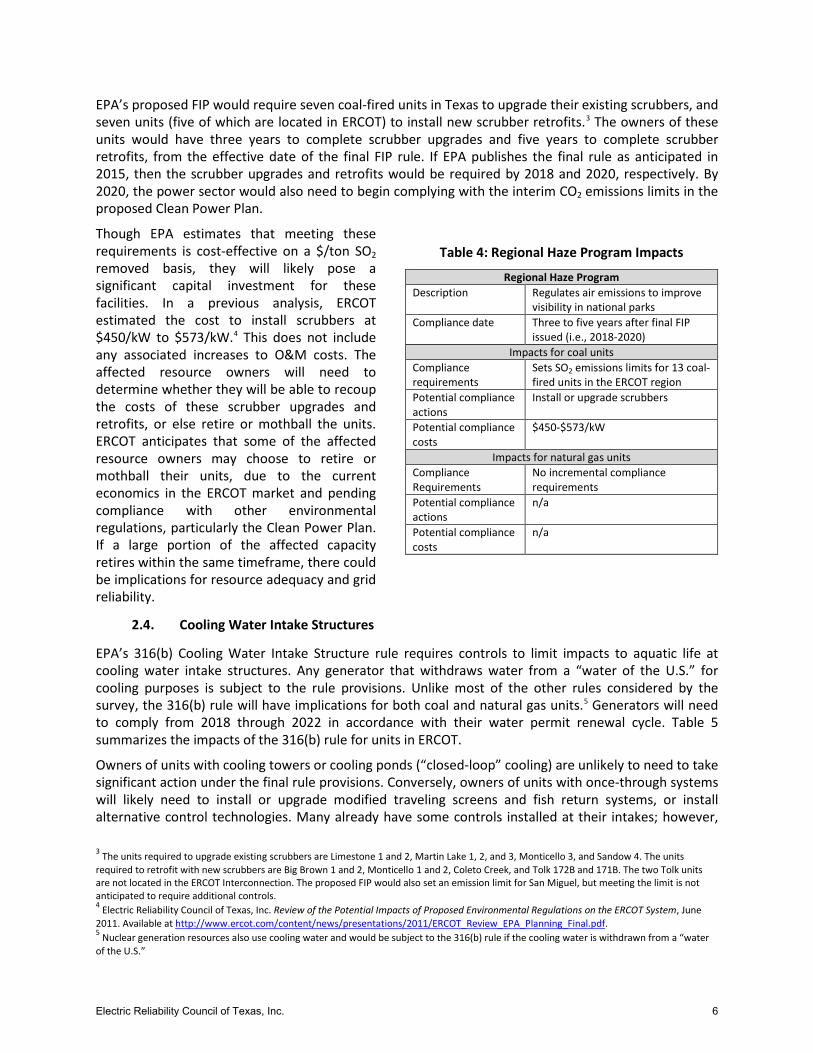
Current ERCOT Fleet
SCR = Selective catalytic reduction SNCR = Selective non-catalytic reduction
3/31/2015 5
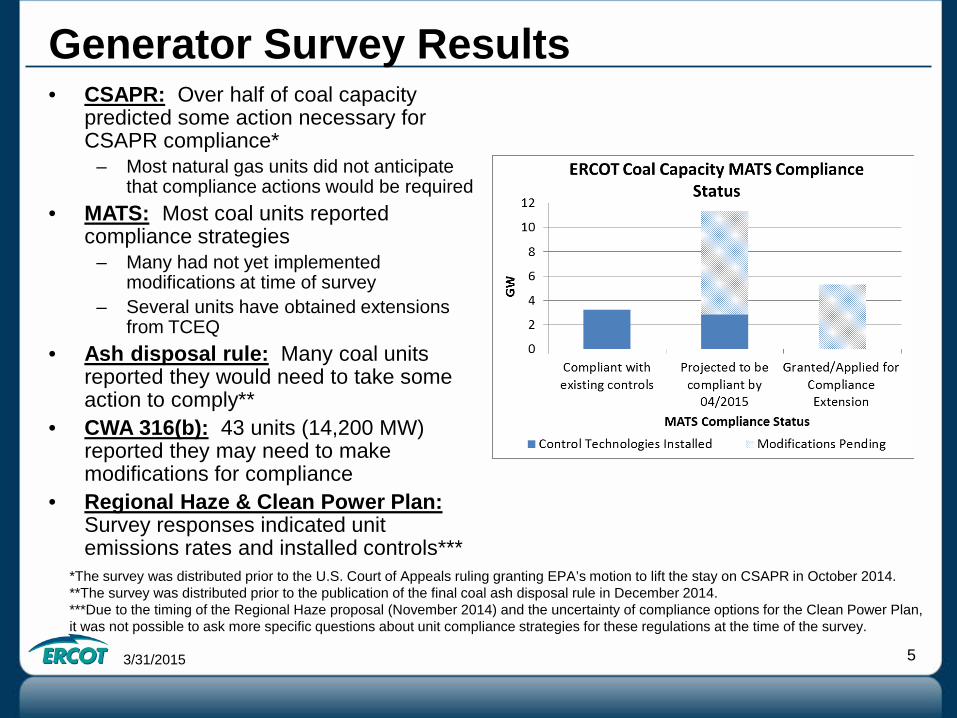
• CSAPR: Over half of coal capacity predicted some action necessary for CSAPR compliance*
– Most natural gas units did not anticipate that compliance actions would be required
• MATS: Most coal units reported compliance strategies
– Many had not yet implemented modifications at time of survey
– Several units have obtained extensions from TCEQ
• Ash disposal rule: Many coal units reported they would need to take some action to comply**
• CWA 316(b): 43 units (14,200 MW) reported they may need to make modifications for compliance
• Regional Haze & Clean Power Plan: Survey responses indicated unit emissions rates and installed controls***
Generator Survey Results
*The survey was distributed prior to the U.S. Court of Appeals ruling granting EPA’s motion to lift the stay on CSAPR in October 2014. **The survey was distributed prior to the publication of the final coal ash disposal rule in December 2014. ***Due to the timing of the Regional Haze proposal (November 2014) and the uncertainty of compliance options for the Clean Power Plan, it was not possible to ask more specific questions about unit compliance strategies for these regulations at the time of the survey.
3/31/2015 6
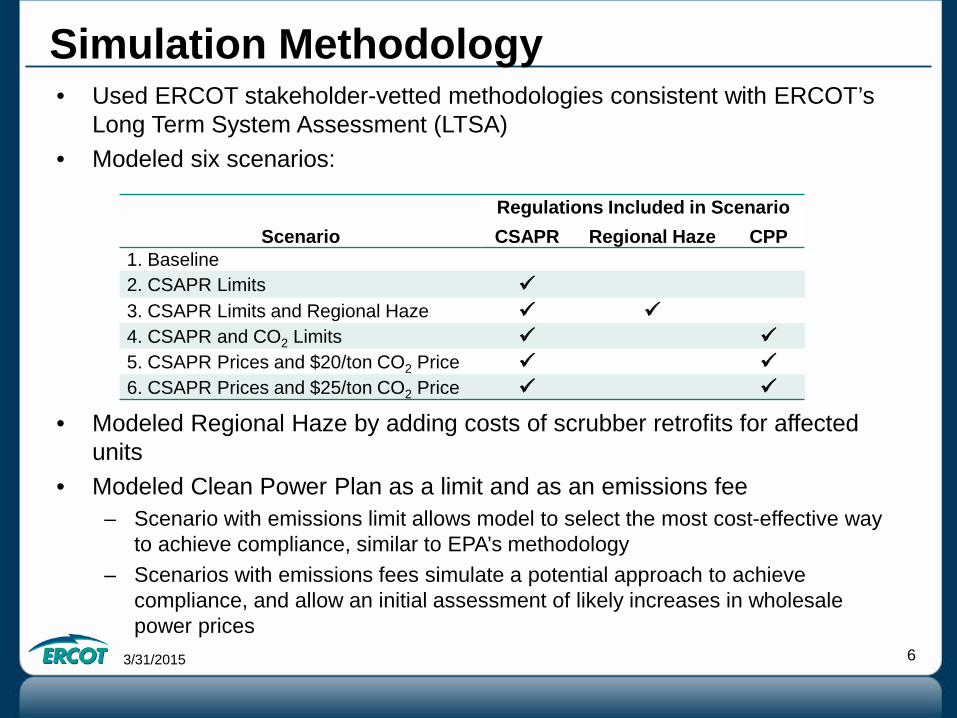
• Used ERCOT stakeholder-vetted methodologies consistent with ERCOT’s Long Term System Assessment (LTSA)
• Modeled six scenarios:
• Modeled Regional Haze by adding costs of scrubber retrofits for affected units
• Modeled Clean Power Plan as a limit and as an emissions fee – Scenario with emissions limit allows model to select the most cost-effective way
to achieve compliance, similar to EPA’s methodology – Scenarios with emissions fees simulate a potential approach to achieve
compliance, and allow an initial assessment of likely increases in wholesale power prices
Simulation Methodology
Scenario Regulations Included in Scenario CSAPR Regional Haze CPP
1. Baseline 2. CSAPR Limits 3. CSAPR Limits and Regional Haze 4. CSAPR and CO2 Limits 5. CSAPR Prices and $20/ton CO2 Price 6. CSAPR Prices and $25/ton CO2 Price
3/31/2015 7
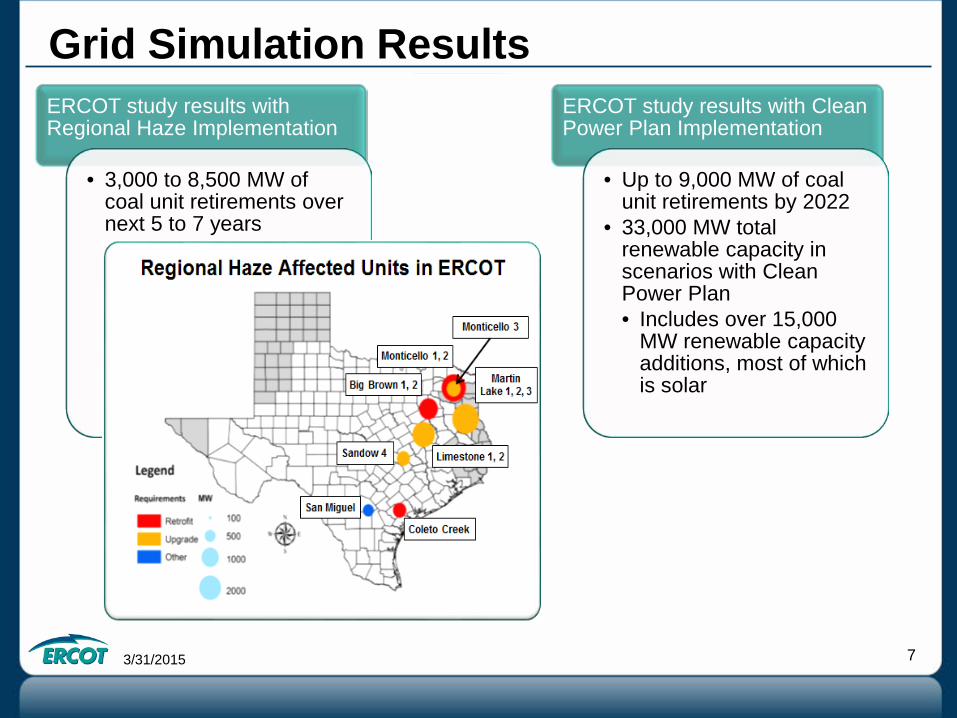
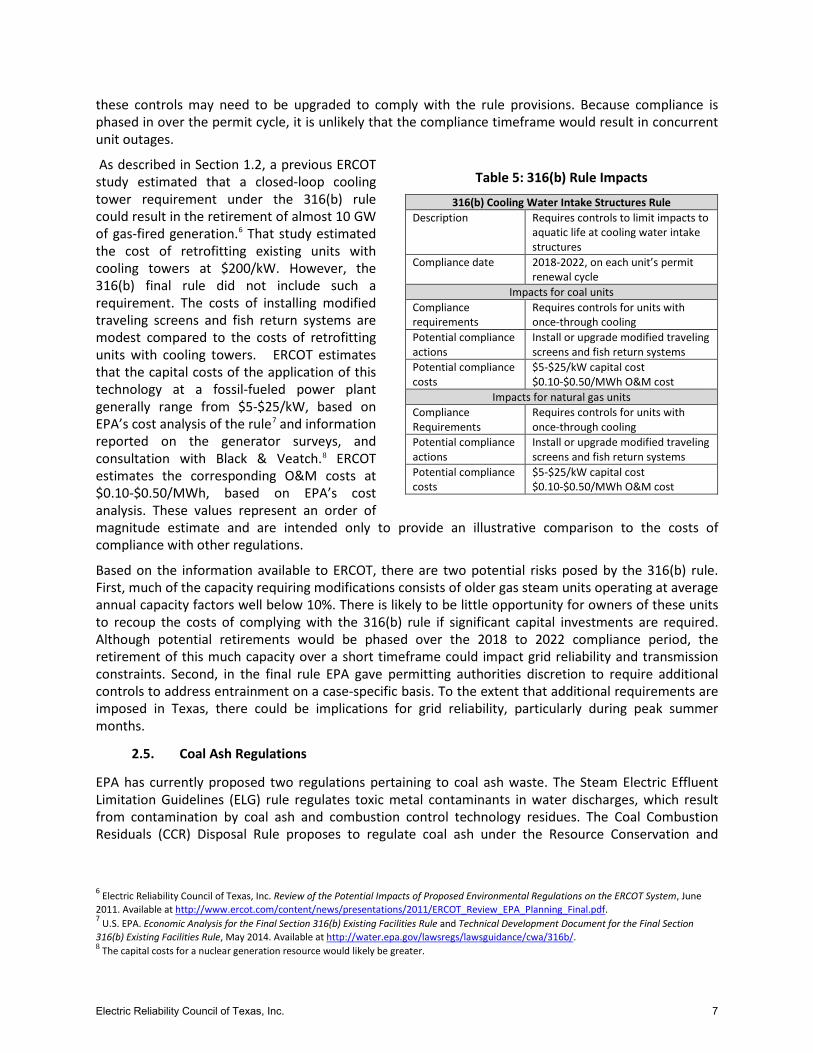
Grid Simulation Results ERCOT study results with Regional Haze Implementation
• 3,000 to 8,500 MW of coal unit retirements over next 5 to 7 years
ERCOT study results with Clean Power Plan Implementation
• Up to 9,000 MW of coal unit retirements by 2022
• 33,000 MW total renewable capacity in scenarios with Clean Power Plan • Includes over 15,000
MW renewable capacity additions, most of which is solar
3/31/2015 8
• Resource Adequacy: if future unit retirements occur without sufficient notice for the market to respond with new investment, there could be periods with reduced reserve margins and increased risk of system scarcity events.
• Transmission Reliability: the retirement of legacy units may result in localized transmission constraints that may affect transmission reliability and grid congestion.
– Transmission improvements require four to five years for planning, routing approval, and construction.
– Reliability-Must-Run contracts may not be an option if units are retired for environmental compliance reasons.
• Renewables Integration: while ERCOT has been very successful at integrating renewable generation, grid operations with the levels of renewables seen in future scenarios will be a challenge. At high levels of renewable penetration, any must-take requirements on renewable output to achieve environmental compliance goals could affect grid reliability.
Possible Grid Impacts
ERCOT Public December 16, 2014
Impacts of Environmental Regulations
in the ERCOT Region
Executive Summary The Electric Reliability Council of Texas (ERCOT) is the independent system operator (ISO) for the ERCOT Interconnection, which encompasses approximately 90% of electric load in Texas. ERCOT is the independent organization established by the Texas Legislature to be responsible for the reliable planning and operation of the electric grid for the ERCOT Interconnection. Under the North American Electric Reliability Corporation (NERC) reliability construct, ERCOT is designated as the Reliability Coordinator, the Balancing Authority, and as a Transmission Operator for the ERCOT region. ERCOT is also registered for several other functions, including the Planning Authority function.
There are several proposed or recently finalized U.S. Environmental Protection Agency (EPA) regulations that could have an impact on grid reliability in ERCOT. These rules include the Mercury and Air Toxics Standards (MATS), the Cross-State Air Pollution Rule (CSAPR), the Regional Haze program, the Cooling Water Intake Structures rule, the Steam Electric Effluent Limitation Guidelines (ELG) rule, the Coal Combustion Residuals (CCR) Disposal rule, and the Clean Power Plan. This study assesses the individual and cumulative impact of these regulations on generation resources in the ERCOT region, and potential implications for grid reliability.
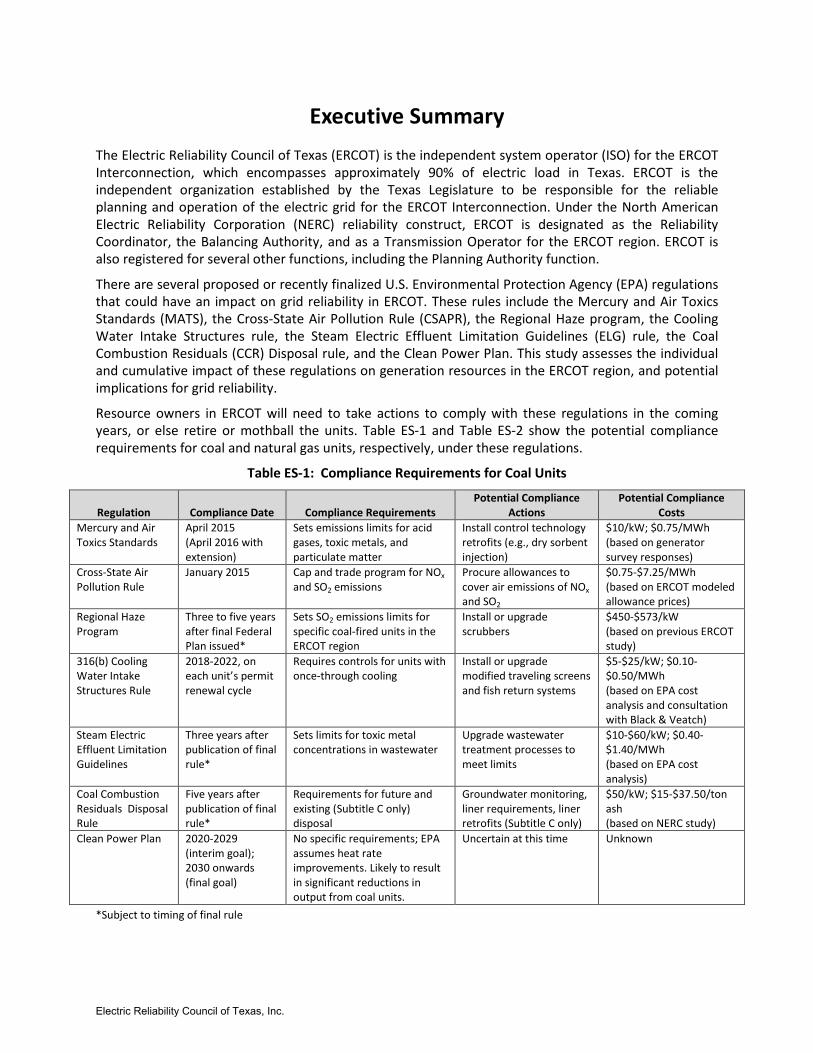
Resource owners in ERCOT will need to take actions to comply with these regulations in the coming years, or else retire or mothball the units. Table ES-1 and Table ES-2 show the potential compliance requirements for coal and natural gas units, respectively, under these regulations.
Table ES-1: Compliance Requirements for Coal Units
Regulation Compliance Date Compliance Requirements Potential Compliance
Actions Potential Compliance
Costs Mercury and Air Toxics Standards
April 2015 (April 2016 with extension)
Sets emissions limits for acid gases, toxic metals, and particulate matter
Install control technology retrofits (e.g., dry sorbent injection)
$10/kW; $0.75/MWh (based on generator survey responses)
Cross-State Air Pollution Rule
January 2015 Cap and trade program for NOx and SO2 emissions
Procure allowances to cover air emissions of NOx and SO2
$0.75-$7.25/MWh (based on ERCOT modeled allowance prices)
Regional Haze Program
Three to five years after final Federal Plan issued*
Sets SO2 emissions limits for specific coal-fired units in the ERCOT region
Install or upgrade scrubbers
$450-$573/kW (based on previous ERCOT study)
316(b) Cooling Water Intake Structures Rule
2018-2022, on each unit’s permit renewal cycle
Requires controls for units with once-through cooling
Install or upgrade modified traveling screens and fish return systems
$5-$25/kW; $0.10-$0.50/MWh (based on EPA cost analysis and consultation with Black & Veatch)
Steam Electric Effluent Limitation Guidelines
Three years after publication of final rule*
Sets limits for toxic metal concentrations in wastewater
Upgrade wastewater treatment processes to meet limits
$10-$60/kW; $0.40-$1.40/MWh (based on EPA cost analysis)
Coal Combustion Residuals Disposal Rule
Five years after publication of final rule*
Requirements for future and existing (Subtitle C only) disposal
Groundwater monitoring, liner requirements, liner retrofits (Subtitle C only)
$50/kW; $15-$37.50/ton ash (based on NERC study)
Clean Power Plan 2020-2029 (interim goal); 2030 onwards (final goal)
No specific requirements; EPA assumes heat rate improvements. Likely to result in significant reductions in output from coal units.
Uncertain at this time Unknown
*Subject to timing of final rule
Electric Reliability Council of Texas, Inc.
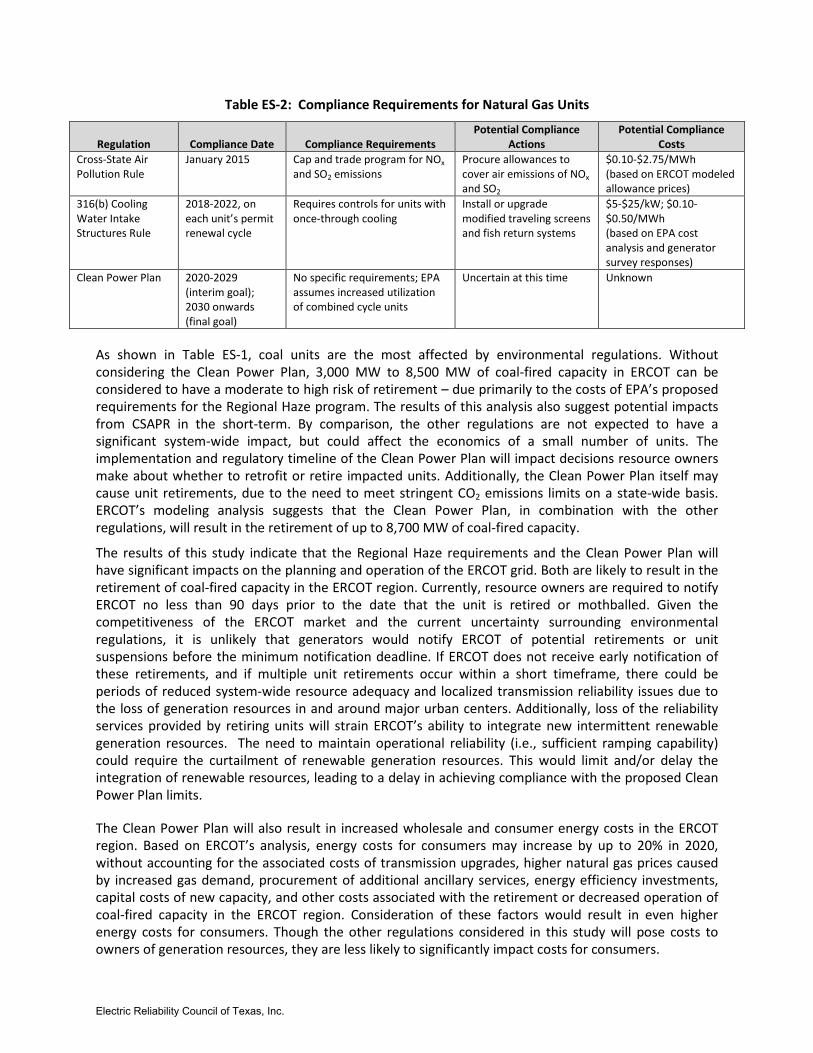
Table ES-2: Compliance Requirements for Natural Gas Units
Regulation Compliance Date Compliance Requirements Potential Compliance
Actions Potential Compliance
Costs Cross-State Air Pollution Rule
January 2015 Cap and trade program for NOx and SO2 emissions
Procure allowances to cover air emissions of NOx and SO2
$0.10-$2.75/MWh (based on ERCOT modeled allowance prices)
316(b) Cooling Water Intake Structures Rule
2018-2022, on each unit’s permit renewal cycle
Requires controls for units with once-through cooling
Install or upgrade modified traveling screens and fish return systems
$5-$25/kW; $0.10-$0.50/MWh (based on EPA cost analysis and generator survey responses)
Clean Power Plan 2020-2029 (interim goal); 2030 onwards (final goal)
No specific requirements; EPA assumes increased utilization of combined cycle units
Uncertain at this time Unknown
As shown in Table ES-1, coal units are the most affected by environmental regulations. Without considering the Clean Power Plan, 3,000 MW to 8,500 MW of coal-fired capacity in ERCOT can be considered to have a moderate to high risk of retirement – due primarily to the costs of EPA’s proposed requirements for the Regional Haze program. The results of this analysis also suggest potential impacts from CSAPR in the short-term. By comparison, the other regulations are not expected to have a significant system-wide impact, but could affect the economics of a small number of units. The implementation and regulatory timeline of the Clean Power Plan will impact decisions resource owners make about whether to retrofit or retire impacted units. Additionally, the Clean Power Plan itself may cause unit retirements, due to the need to meet stringent CO2 emissions limits on a state-wide basis. ERCOT’s modeling analysis suggests that the Clean Power Plan, in combination with the other regulations, will result in the retirement of up to 8,700 MW of coal-fired capacity.
The results of this study indicate that the Regional Haze requirements and the Clean Power Plan will have significant impacts on the planning and operation of the ERCOT grid. Both are likely to result in the retirement of coal-fired capacity in the ERCOT region. Currently, resource owners are required to notify ERCOT no less than 90 days prior to the date that the unit is retired or mothballed. Given the competitiveness of the ERCOT market and the current uncertainty surrounding environmental regulations, it is unlikely that generators would notify ERCOT of potential retirements or unit suspensions before the minimum notification deadline. If ERCOT does not receive early notification of these retirements, and if multiple unit retirements occur within a short timeframe, there could be periods of reduced system-wide resource adequacy and localized transmission reliability issues due to the loss of generation resources in and around major urban centers. Additionally, loss of the reliability services provided by retiring units will strain ERCOT’s ability to integrate new intermittent renewable generation resources. The need to maintain operational reliability (i.e., sufficient ramping capability) could require the curtailment of renewable generation resources. This would limit and/or delay the integration of renewable resources, leading to a delay in achieving compliance with the proposed Clean Power Plan limits.
The Clean Power Plan will also result in increased wholesale and consumer energy costs in the ERCOT region. Based on ERCOT’s analysis, energy costs for consumers may increase by up to 20% in 2020, without accounting for the associated costs of transmission upgrades, higher natural gas prices caused by increased gas demand, procurement of additional ancillary services, energy efficiency investments, capital costs of new capacity, and other costs associated with the retirement or decreased operation of coal-fired capacity in the ERCOT region. Consideration of these factors would result in even higher energy costs for consumers. Though the other regulations considered in this study will pose costs to owners of generation resources, they are less likely to significantly impact costs for consumers.
Electric Reliability Council of Texas, Inc.
Table of Contents
1. Introduction ............................................................................................................................... 1
1.1. Background on Environmental Regulations ........................................................................ 1
1.2. Prior ERCOT Studies of Environmental Regulations ........................................................... 2
2. Requirements and Costs of Environmental Regulations ........................................................... 4
2.1. Mercury and Air Toxics Standards ...................................................................................... 4
2.2. Cross-State Air Pollution Rule ............................................................................................. 4
2.3. Regional Haze ...................................................................................................................... 5
2.4. Cooling Water Intake Structures ......................................................................................... 6
2.5. Coal Ash Regulations ........................................................................................................... 7
2.6. Clean Power Plan ................................................................................................................ 9
3. Generator Environmental Survey .............................................................................................. 9
3.1. Survey Methodology ........................................................................................................... 9
3.2. Survey Results ................................................................................................................... 10
4. Modeling Analysis .................................................................................................................... 11
4.1. Modeling Methodology .................................................................................................... 12
Modeled Scenarios ..................................................................................................... 12 4.1.1.
ERCOT Long-Term Modeling Assumptions ................................................................ 13 4.1.2.
Modeling Assumptions Specific to this Study ............................................................ 14 4.1.3.
Load Forecast Development ...................................................................................... 17 4.1.4.
4.2. Modeling Results .............................................................................................................. 18
4.3. Comparison to EPA’s Clean Power Plan Analysis .............................................................. 23
5. Discussion ................................................................................................................................ 24
5.1. Impact of Unit Retirements .............................................................................................. 24
Unit Retirements without the Clean Power Plan ....................................................... 24 5.1.1.
Unit Retirements with the Clean Power Plan ............................................................ 28 5.1.2.
5.2. Impact of Renewables Integration .................................................................................... 29
5.3. Impact on Transmission .................................................................................................... 31
6. Generation Cost Analysis ......................................................................................................... 32
7. Conclusion ............................................................................................................................... 36
Appendices
Appendix A: Unit Emissions and Control Technologies
Electric Reliability Council of Texas, Inc.
1. Introduction This study assesses the potential impacts of several proposed and recently finalized U.S. Environmental Protection Agency (EPA) regulations on grid reliability in the Electric Reliability Council of Texas (ERCOT) region. The analysis considers the impacts of the Mercury and Air Toxics Standards (MATS), the Cross-State Air Pollution Rule (CSAPR), the Regional Haze program, the Cooling Water Intake Structures rule, the Steam Electric Effluent Limitation Guidelines (ELG) rule, the Coal Combustion Residuals (CCR) Disposal rule, and the Clean Power Plan.
ERCOT approaches this analysis from the perspective of an independent system operator in a competitive market that has achieved significant success in using competition to drive efficient outcomes. Existing market policies and investments in transmission in ERCOT have incentivized market participants to maximize the efficiency of the generating fleet and develop new technologies including renewable generation. With recent investments in transmission, more than 11 GW of wind capacity have been successfully integrated into the ERCOT grid. The ERCOT region maintains a forward-looking open market and provides affordable and reliable electricity to consumers in Texas.
ERCOT undertook two parallel efforts for this study. First, in the summer of 2014, ERCOT distributed a survey to fossil fuel-fired generators on the impacts of relevant environmental regulations. The responses indicate the current compliance status of fossil fuel-fired resources in the ERCOT region. Second, ERCOT conducted a modeling analysis of the impacts of CSAPR, the Regional Haze program, and the Clean Power Plan on generation resources and energy costs in the ERCOT region.
The report is organized as follows:
• Section 1.1 provides an overview of the environmental regulations evaluated in this study;
• Section 1.2 describes prior ERCOT analyses related to the potential impacts of environmental regulations;
• Section 2 discusses the requirements and associated costs of environmental regulations for generation resources;
• Section 3 presents the results of the generator survey;
• Section 4 describes the methodology and results of ERCOT’s modeling analysis;
• Section 5 discusses the impacts of these regulations for grid reliability in the ERCOT region;
• Section 6 presents a cost analysis of the relevant environmental regulations; and,
• Section 7 provides a summary of the conclusions of this study.
1.1. Background on Environmental Regulations
There are several proposed and recently finalized environmental regulations that may impact generation resources in the ERCOT region. In the coming years, generators will need to make decisions about how to comply with these regulations in light of market trends in the power sector and other regulations on the horizon. The cumulative impact of market economics and environmental regulations could affect the economic viability of generation resources and result in capacity retirements. In addition, complying with these regulations in the near-term could lead to concurrent unit outages and increased seasonal mothballing of capacity. If these changes result in impacts to grid reliability and transmission constraints, and there is not sufficient time to mitigate these issues, there could be challenges to ERCOT’s management of the grid.
Electric Reliability Council of Texas, Inc. 1
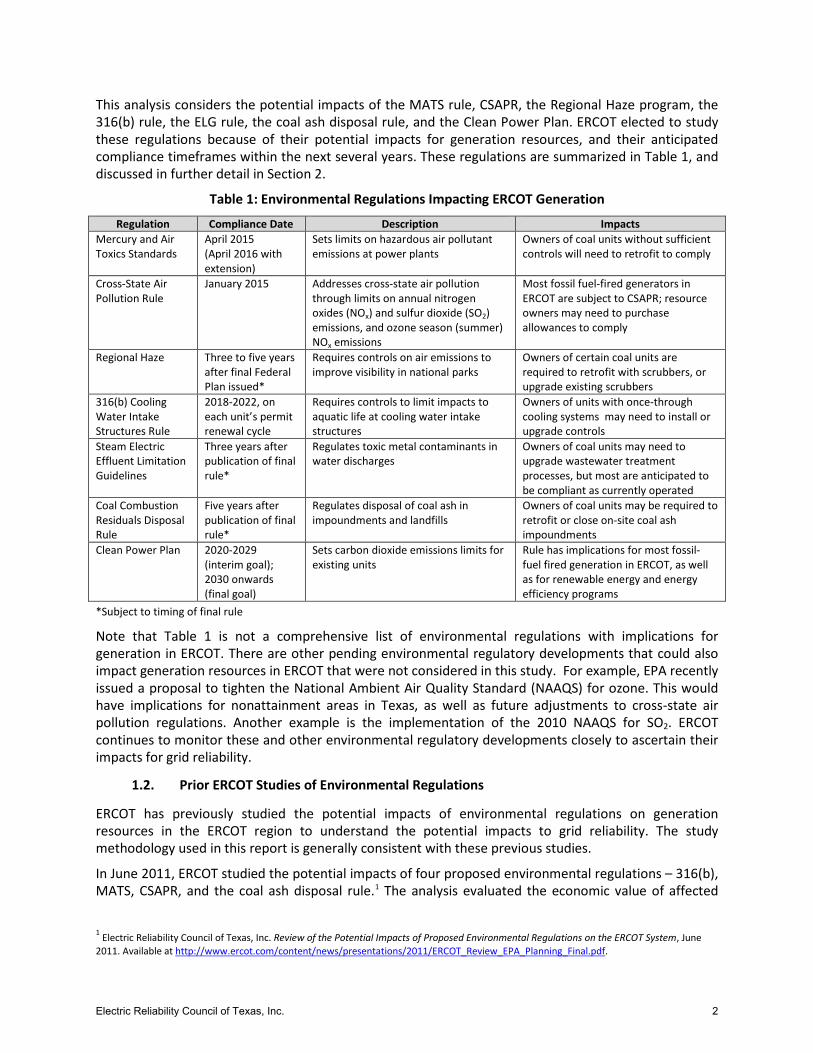
This analysis considers the potential impacts of the MATS rule, CSAPR, the Regional Haze program, the 316(b) rule, the ELG rule, the coal ash disposal rule, and the Clean Power Plan. ERCOT elected to study these regulations because of their potential impacts for generation resources, and their anticipated compliance timeframes within the next several years. These regulations are summarized in Table 1, and discussed in further detail in Section 2.
Table 1: Environmental Regulations Impacting ERCOT Generation
Regulation Compliance Date Description Impacts Mercury and Air Toxics Standards
April 2015 (April 2016 with extension)
Sets limits on hazardous air pollutant emissions at power plants
Owners of coal units without sufficient controls will need to retrofit to comply
Cross-State Air Pollution Rule
January 2015 Addresses cross-state air pollution through limits on annual nitrogen oxides (NOx) and sulfur dioxide (SO2) emissions, and ozone season (summer) NOx emissions
Most fossil fuel-fired generators in ERCOT are subject to CSAPR; resource owners may need to purchase allowances to comply
Regional Haze Three to five years after final Federal Plan issued*
Requires controls on air emissions to improve visibility in national parks
Owners of certain coal units are required to retrofit with scrubbers, or upgrade existing scrubbers
316(b) Cooling Water Intake Structures Rule
2018-2022, on each unit’s permit renewal cycle
Requires controls to limit impacts to aquatic life at cooling water intake structures
Owners of units with once-through cooling systems may need to install or upgrade controls
Steam Electric Effluent Limitation Guidelines
Three years after publication of final rule*
Regulates toxic metal contaminants in water discharges
Owners of coal units may need to upgrade wastewater treatment processes, but most are anticipated to be compliant as currently operated
Coal Combustion Residuals Disposal Rule
Five years after publication of final rule*
Regulates disposal of coal ash in impoundments and landfills
Owners of coal units may be required to retrofit or close on-site coal ash impoundments
Clean Power Plan 2020-2029 (interim goal); 2030 onwards (final goal)
Sets carbon dioxide emissions limits for existing units
Rule has implications for most fossil-fuel fired generation in ERCOT, as well as for renewable energy and energy efficiency programs
*Subject to timing of final rule
Note that Table 1 is not a comprehensive list of environmental regulations with implications for generation in ERCOT. There are other pending environmental regulatory developments that could also impact generation resources in ERCOT that were not considered in this study. For example, EPA recently issued a proposal to tighten the National Ambient Air Quality Standard (NAAQS) for ozone. This would have implications for nonattainment areas in Texas, as well as future adjustments to cross-state air pollution regulations. Another example is the implementation of the 2010 NAAQS for SO2. ERCOT continues to monitor these and other environmental regulatory developments closely to ascertain their impacts for grid reliability.
1.2. Prior ERCOT Studies of Environmental Regulations
ERCOT has previously studied the potential impacts of environmental regulations on generation resources in the ERCOT region to understand the potential impacts to grid reliability. The study methodology used in this report is generally consistent with these previous studies.
In June 2011, ERCOT studied the potential impacts of four proposed environmental regulations – 316(b), MATS, CSAPR, and the coal ash disposal rule.1 The analysis evaluated the economic value of affected
1 Electric Reliability Council of Texas, Inc. Review of the Potential Impacts of Proposed Environmental Regulations on the ERCOT System, June 2011. Available at http://www.ercot.com/content/news/presentations/2011/ERCOT_Review_EPA_Planning_Final.pdf.
Electric Reliability Council of Texas, Inc. 2
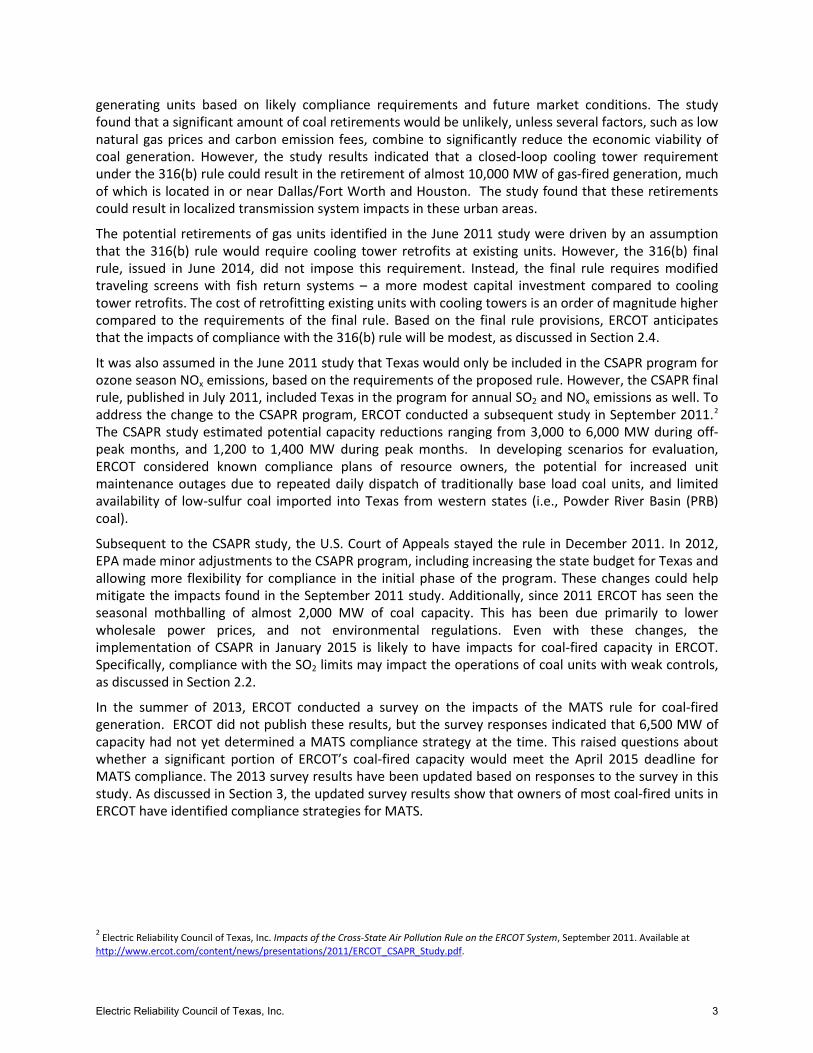
generating units based on likely compliance requirements and future market conditions. The study found that a significant amount of coal retirements would be unlikely, unless several factors, such as low natural gas prices and carbon emission fees, combine to significantly reduce the economic viability of coal generation. However, the study results indicated that a closed-loop cooling tower requirement under the 316(b) rule could result in the retirement of almost 10,000 MW of gas-fired generation, much of which is located in or near Dallas/Fort Worth and Houston. The study found that these retirements could result in localized transmission system impacts in these urban areas.
The potential retirements of gas units identified in the June 2011 study were driven by an assumption that the 316(b) rule would require cooling tower retrofits at existing units. However, the 316(b) final rule, issued in June 2014, did not impose this requirement. Instead, the final rule requires modified traveling screens with fish return systems – a more modest capital investment compared to cooling tower retrofits. The cost of retrofitting existing units with cooling towers is an order of magnitude higher compared to the requirements of the final rule. Based on the final rule provisions, ERCOT anticipates that the impacts of compliance with the 316(b) rule will be modest, as discussed in Section 2.4.
It was also assumed in the June 2011 study that Texas would only be included in the CSAPR program for ozone season NOx emissions, based on the requirements of the proposed rule. However, the CSAPR final rule, published in July 2011, included Texas in the program for annual SO2 and NOx emissions as well. To address the change to the CSAPR program, ERCOT conducted a subsequent study in September 2011.2 The CSAPR study estimated potential capacity reductions ranging from 3,000 to 6,000 MW during off-peak months, and 1,200 to 1,400 MW during peak months. In developing scenarios for evaluation, ERCOT considered known compliance plans of resource owners, the potential for increased unit maintenance outages due to repeated daily dispatch of traditionally base load coal units, and limited availability of low-sulfur coal imported into Texas from western states (i.e., Powder River Basin (PRB) coal).
Subsequent to the CSAPR study, the U.S. Court of Appeals stayed the rule in December 2011. In 2012, EPA made minor adjustments to the CSAPR program, including increasing the state budget for Texas and allowing more flexibility for compliance in the initial phase of the program. These changes could help mitigate the impacts found in the September 2011 study. Additionally, since 2011 ERCOT has seen the seasonal mothballing of almost 2,000 MW of coal capacity. This has been due primarily to lower wholesale power prices, and not environmental regulations. Even with these changes, the implementation of CSAPR in January 2015 is likely to have impacts for coal-fired capacity in ERCOT. Specifically, compliance with the SO2 limits may impact the operations of coal units with weak controls, as discussed in Section 2.2.
In the summer of 2013, ERCOT conducted a survey on the impacts of the MATS rule for coal-fired generation. ERCOT did not publish these results, but the survey responses indicated that 6,500 MW of capacity had not yet determined a MATS compliance strategy at the time. This raised questions about whether a significant portion of ERCOT’s coal-fired capacity would meet the April 2015 deadline for MATS compliance. The 2013 survey results have been updated based on responses to the survey in this study. As discussed in Section 3, the updated survey results show that owners of most coal-fired units in ERCOT have identified compliance strategies for MATS.
2 Electric Reliability Council of Texas, Inc. Impacts of the Cross-State Air Pollution Rule on the ERCOT System, September 2011. Available at http://www.ercot.com/content/news/presentations/2011/ERCOT_CSAPR_Study.pdf.
Electric Reliability Council of Texas, Inc. 3
2. Requirements and Costs of Environmental Regulations
Each regulation considered in this study has distinct compliance requirements that will affect generators in ERCOT. The costs associated with meeting these requirements vary, with some regulations posing more modest costs compared to others. Both individually and cumulatively, these costs will influence resource owners’ decisions about whether to retrofit or retire units to comply with environmental regulations. The sections that follow discuss the specific compliance requirements and associated costs for each environmental regulation considered in this study.
2.1. Mercury and Air Toxics Standards
The MATS rule sets emissions limits for hazardous air pollutants emitted from power plants. The regulated pollutants include acid gases, toxic metals, and particulate matter. The rule will impact coal-fired generators in the ERCOT region. Owners of units without sufficient controls to meet the rule limits will need to install new control technologies to comply. Compliance options include scrubbers, activated carbon injection (ACI), dry sorbent injection (DSI), and use of PRB coal in the fuel mix. Generators have until April 2015 to comply, although resource owners may apply for one-year compliance extensions from the Texas Commission on Environmental Quality (TCEQ). There is also an option for an additional year (to April 2017) for reliability critical units. Table 2 summarizes the impacts of MATS for units in ERCOT.
Given the April 2015 compliance date for MATS, there is some risk for units that have not yet completed the necessary modifications. Further, for those units with compliance extensions, there is risk that the owners of these units may choose to retire rather than comply with MATS, especially in light of recent Regional Haze developments and eventual compliance with the Clean Power Plan. Given the timeframe for MATS compliance, this could present a risk to reliability if a significant number of units do not meet the MATS requirements over the next two years.
The costs of retrofitting units to comply with MATS will vary depending on the control technology selected. The most common option in the ERCOT region is the installation of DSI and/or ACI systems. The survey, discussed in Section 3, asked resource owners to report the capital and operations and maintenance (O&M) costs associated with outstanding unit modifications for MATS. Based on this information, ERCOT estimates an average capital cost for MATS compliance of approximately $10/kW, and an average O&M cost of $0.75/MWh. These costs are the averages of the information reported on the survey, and do not correspond to a specific retrofit technology.
2.2. Cross-State Air Pollution Rule
The Cross-State Air Pollution Rule (CSAPR) and its precursor, the Clean Air Interstate Rule (CAIR), focus on the impact of upwind states’ emissions to downwind states’ air pollution. Both rules set state-wide
Table 2: Mercury and Air Toxics Standards Impacts
Mercury and Air Toxics Standards Description Sets limits on hazardous air
pollutant emissions at power plants Compliance date April 2015 (April 2016 with
extension) Impacts for coal units
Compliance requirements
Sets emissions limits for acid gases, toxic metals, and particulate matter
Potential compliance actions
Retrofit units with scrubbers, dry sorbent injection, activated carbon injection; use PRB coal in fuel mix
Potential compliance costs
$10/kW capital cost $0.75/MWh O&M cost
Impacts for natural gas units Compliance Requirements
None
Potential compliance actions
n/a
Potential compliance costs
n/a
Electric Reliability Council of Texas, Inc. 4
limits for annual SO2, annual NOx, and ozone season NOx emissions. The CAIR limits have been enforced after a U.S. Court of Appeals decision stayed CSAPR in December 2011. However, in April 2014 the Supreme Court overturned this decision. In October 2014 the stay on CSAPR was lifted, and compliance with CSAPR will begin in January 2015. Table 3 summarizes the impacts of CSAPR for units in ERCOT.
Most fossil fuel-fired generators in ERCOT are subject to both CSAPR and CAIR. Under both programs, each unit is allocated a certain number of emissions allowances, and must either control emissions or purchase additional allowances if their allocations are not sufficient to cover their emissions for the year. The CSAPR limits are more stringent than the current requirements in the CAIR program.
Within the ERCOT region, compliance with the CSAPR SO2 limits is likely to be difficult for coal-fired capacity. In ERCOT’s modeling of CSAPR, discussed in Section 4, the CSAPR SO2 limit was more difficult for the ERCOT system to meet than the annual and ozone season NOx limits. Emissions of SO2 are primarily a concern for coal-fired capacity because the combustion of natural gas emits very low amounts of SO2. Owners of coal-fired capacity without tight SO2 controls will likely need to purchase emissions allowances, install or improve unit controls, or reduce operations during non-peak seasons to stay within their allotted emissions allowances.
There is also some uncertainty regarding the availability of SO2 emissions allowances for purchase by resource owners in Texas. Texas is part of the group 2 trading program for SO2. The power sector in other group 2 states is primarily vertically integrated, which raises questions about the incentives for resource owners in those states to sell excess allowances.
As part of the modeling analysis in this study (see Section 4), ERCOT estimated an SO2 emission price of $800/ton, an ozone season NOx emission price of $1,600/ton, and an annual NOx emission price of $1,000/ton. These emissions prices were derived based on modeling iterations, and do not correspond to actual emissions prices under the CSAPR program. However, based on these estimates and the emissions rates reported in the survey (see Section 3 and Appendix A), the potential CSAPR compliance costs for coal-fired generation resources can range from $0.75/MWh for a well-controlled unit to $7.25/MWh for an uncontrolled unit. Similarly, the costs for natural gas units could range from $0.10 to $2.75/MWh, depending on the type of generation technology and installed controls.
2.3. Regional Haze
The Regional Haze program regulates air emissions to improve visibility in national parks. The program requires states to develop State Implementation Plans (SIPs) that require the “best available retrofit technology” (BART) for facilities that contribute to haze in national parks. In November 2014, EPA proposed a Federal Implementation Plan (FIP) disapproving portions of the Texas SIP for regional haze, and setting SO2 emissions limits for certain coal-fired units in Texas that contribute to air pollution in Big Bend and the Guadalupe Mountains in Texas, and the Wichita Mountains in Oklahoma. Table 4 summarizes the impacts of EPA’s proposed Regional Haze FIP for units in the ERCOT region.
Table 3: Cross-State Air Pollution Rule Impacts
Cross-State Air Pollution Rule Description Regulates air emissions to address
cross-state air pollution Compliance date January 2015
Impacts for coal units Compliance requirements
Cap and trade program for NOx and SO2 emissions
Potential compliance actions
Purchase allowances, upgrade controls, or reduce production
Potential compliance costs
$0.75-$7.25/MWh, based on ERCOT modeled allowance prices
Impacts for natural gas units Compliance Requirements
Cap and trade program for NOx and SO2 emissions
Potential compliance actions
Purchase allowances, upgrade controls, or reduce production
Potential compliance costs
$0.10-$2.75/MWh, based on ERCOT modeled allowance prices
Electric Reliability Council of Texas, Inc. 5
EPA’s proposed FIP would require seven coal-fired units in Texas to upgrade their existing scrubbers, and seven units (five of which are located in ERCOT) to install new scrubber retrofits.3 The owners of these units would have three years to complete scrubber upgrades and five years to complete scrubber retrofits, from the effective date of the final FIP rule. If EPA publishes the final rule as anticipated in 2015, then the scrubber upgrades and retrofits would be required by 2018 and 2020, respectively. By 2020, the power sector would also need to begin complying with the interim CO2 emissions limits in the proposed Clean Power Plan.
Though EPA estimates that meeting these requirements is cost-effective on a $/ton SO2 removed basis, they will likely pose a significant capital investment for these facilities. In a previous analysis, ERCOT estimated the cost to install scrubbers at $450/kW to $573/kW.4 This does not include any associated increases to O&M costs. The affected resource owners will need to determine whether they will be able to recoup the costs of these scrubber upgrades and retrofits, or else retire or mothball the units. ERCOT anticipates that some of the affected resource owners may choose to retire or mothball their units, due to the current economics in the ERCOT market and pending compliance with other environmental regulations, particularly the Clean Power Plan. If a large portion of the affected capacity retires within the same timeframe, there could be implications for resource adequacy and grid reliability.
2.4. Cooling Water Intake Structures
EPA’s 316(b) Cooling Water Intake Structure rule requires controls to limit impacts to aquatic life at cooling water intake structures. Any generator that withdraws water from a “water of the U.S.” for cooling purposes is subject to the rule provisions. Unlike most of the other rules considered by the survey, the 316(b) rule will have implications for both coal and natural gas units.5 Generators will need to comply from 2018 through 2022 in accordance with their water permit renewal cycle. Table 5 summarizes the impacts of the 316(b) rule for units in ERCOT.
Owners of units with cooling towers or cooling ponds (“closed-loop” cooling) are unlikely to need to take significant action under the final rule provisions. Conversely, owners of units with once-through systems will likely need to install or upgrade modified traveling screens and fish return systems, or install alternative control technologies. Many already have some controls installed at their intakes; however,
3 The units required to upgrade existing scrubbers are Limestone 1 and 2, Martin Lake 1, 2, and 3, Monticello 3, and Sandow 4. The units required to retrofit with new scrubbers are Big Brown 1 and 2, Monticello 1 and 2, Coleto Creek, and Tolk 172B and 171B. The two Tolk units are not located in the ERCOT Interconnection. The proposed FIP would also set an emission limit for San Miguel, but meeting the limit is not anticipated to require additional controls. 4 Electric Reliability Council of Texas, Inc. Review of the Potential Impacts of Proposed Environmental Regulations on the ERCOT System, June 2011. Available at http://www.ercot.com/content/news/presentations/2011/ERCOT_Review_EPA_Planning_Final.pdf. 5 Nuclear generation resources also use cooling water and would be subject to the 316(b) rule if the cooling water is withdrawn from a “water of the U.S.”
Table 4: Regional Haze Program Impacts
Regional Haze Program Description Regulates air emissions to improve
visibility in national parks Compliance date Three to five years after final FIP
issued (i.e., 2018-2020) Impacts for coal units
Compliance requirements
Sets SO2 emissions limits for 13 coal-fired units in the ERCOT region
Potential compliance actions
Install or upgrade scrubbers
Potential compliance costs
$450-$573/kW
Impacts for natural gas units Compliance Requirements
No incremental compliance requirements
Potential compliance actions
n/a
Potential compliance costs
n/a
Electric Reliability Council of Texas, Inc. 6
these controls may need to be upgraded to comply with the rule provisions. Because compliance is phased in over the permit cycle, it is unlikely that the compliance timeframe would result in concurrent unit outages.
As described in Section 1.2, a previous ERCOT study estimated that a closed-loop cooling tower requirement under the 316(b) rule could result in the retirement of almost 10 GW of gas-fired generation.6 That study estimated the cost of retrofitting existing units with cooling towers at $200/kW. However, the 316(b) final rule did not include such a requirement. The costs of installing modified traveling screens and fish return systems are modest compared to the costs of retrofitting units with cooling towers. ERCOT estimates that the capital costs of the application of this technology at a fossil-fueled power plant generally range from $5-$25/kW, based on EPA’s cost analysis of the rule7 and information reported on the generator surveys, and consultation with Black & Veatch.8 ERCOT estimates the corresponding O&M costs at $0.10-$0.50/MWh, based on EPA’s cost analysis. These values represent an order of magnitude estimate and are intended only to provide an illustrative comparison to the costs of compliance with other regulations.
Based on the information available to ERCOT, there are two potential risks posed by the 316(b) rule. First, much of the capacity requiring modifications consists of older gas steam units operating at average annual capacity factors well below 10%. There is likely to be little opportunity for owners of these units to recoup the costs of complying with the 316(b) rule if significant capital investments are required. Although potential retirements would be phased over the 2018 to 2022 compliance period, the retirement of this much capacity over a short timeframe could impact grid reliability and transmission constraints. Second, in the final rule EPA gave permitting authorities discretion to require additional controls to address entrainment on a case-specific basis. To the extent that additional requirements are imposed in Texas, there could be implications for grid reliability, particularly during peak summer months.
2.5. Coal Ash Regulations
EPA has currently proposed two regulations pertaining to coal ash waste. The Steam Electric Effluent Limitation Guidelines (ELG) rule regulates toxic metal contaminants in water discharges, which result from contamination by coal ash and combustion control technology residues. The Coal Combustion Residuals (CCR) Disposal Rule proposes to regulate coal ash under the Resource Conservation and
6 Electric Reliability Council of Texas, Inc. Review of the Potential Impacts of Proposed Environmental Regulations on the ERCOT System, June 2011. Available at http://www.ercot.com/content/news/presentations/2011/ERCOT_Review_EPA_Planning_Final.pdf. 7 U.S. EPA. Economic Analysis for the Final Section 316(b) Existing Facilities Rule and Technical Development Document for the Final Section 316(b) Existing Facilities Rule, May 2014. Available at http://water.epa.gov/lawsregs/lawsguidance/cwa/316b/. 8 The capital costs for a nuclear generation resource would likely be greater.
Table 5: 316(b) Rule Impacts
316(b) Cooling Water Intake Structures Rule Description Requires controls to limit impacts to
aquatic life at cooling water intake structures
Compliance date 2018-2022, on each unit’s permit renewal cycle
Impacts for coal units Compliance requirements
Requires controls for units with once-through cooling
Potential compliance actions
Install or upgrade modified traveling screens and fish return systems
Potential compliance costs
$5-$25/kW capital cost $0.10-$0.50/MWh O&M cost
Impacts for natural gas units Compliance Requirements
Requires controls for units with once-through cooling
Potential compliance actions
Install or upgrade modified traveling screens and fish return systems
Potential compliance costs
$5-$25/kW capital cost $0.10-$0.50/MWh O&M cost
Electric Reliability Council of Texas, Inc. 7
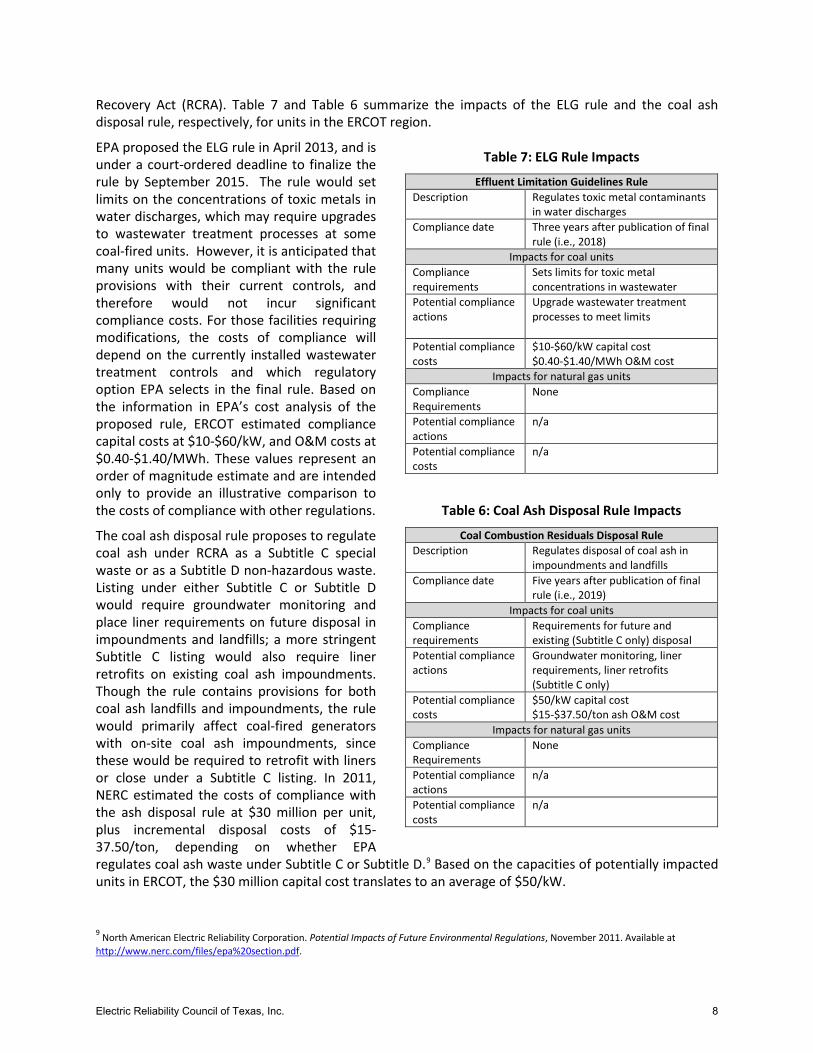
Recovery Act (RCRA). Table 7 and Table 6 summarize the impacts of the ELG rule and the coal ash disposal rule, respectively, for units in the ERCOT region.
EPA proposed the ELG rule in April 2013, and is under a court-ordered deadline to finalize the rule by September 2015. The rule would set limits on the concentrations of toxic metals in water discharges, which may require upgrades to wastewater treatment processes at some coal-fired units. However, it is anticipated that many units would be compliant with the rule provisions with their current controls, and therefore would not incur significant compliance costs. For those facilities requiring modifications, the costs of compliance will depend on the currently installed wastewater treatment controls and which regulatory option EPA selects in the final rule. Based on the information in EPA’s cost analysis of the proposed rule, ERCOT estimated compliance capital costs at $10-$60/kW, and O&M costs at $0.40-$1.40/MWh. These values represent an order of magnitude estimate and are intended only to provide an illustrative comparison to the costs of compliance with other regulations.
The coal ash disposal rule proposes to regulate coal ash under RCRA as a Subtitle C special waste or as a Subtitle D non-hazardous waste. Listing under either Subtitle C or Subtitle D would require groundwater monitoring and place liner requirements on future disposal in impoundments and landfills; a more stringent Subtitle C listing would also require liner retrofits on existing coal ash impoundments. Though the rule contains provisions for both coal ash landfills and impoundments, the rule would primarily affect coal-fired generators with on-site coal ash impoundments, since these would be required to retrofit with liners or close under a Subtitle C listing. In 2011, NERC estimated the costs of compliance with the ash disposal rule at $30 million per unit, plus incremental disposal costs of $15-37.50/ton, depending on whether EPA regulates coal ash waste under Subtitle C or Subtitle D.9 Based on the capacities of potentially impacted units in ERCOT, the $30 million capital cost translates to an average of $50/kW.
9 North American Electric Reliability Corporation. Potential Impacts of Future Environmental Regulations, November 2011. Available at http://www.nerc.com/files/epa%20section.pdf.
Table 7: ELG Rule Impacts
Effluent Limitation Guidelines Rule Description Regulates toxic metal contaminants
in water discharges Compliance date Three years after publication of final
rule (i.e., 2018) Impacts for coal units
Compliance requirements
Sets limits for toxic metal concentrations in wastewater
Potential compliance actions
Upgrade wastewater treatment processes to meet limits
Potential compliance costs
$10-$60/kW capital cost $0.40-$1.40/MWh O&M cost
Impacts for natural gas units Compliance Requirements
None
Potential compliance actions
n/a
Potential compliance costs
n/a
Table 6: Coal Ash Disposal Rule Impacts
Coal Combustion Residuals Disposal Rule Description Regulates disposal of coal ash in
impoundments and landfills Compliance date Five years after publication of final
rule (i.e., 2019) Impacts for coal units
Compliance requirements
Requirements for future and existing (Subtitle C only) disposal
Potential compliance actions
Groundwater monitoring, liner requirements, liner retrofits (Subtitle C only)
Potential compliance costs
$50/kW capital cost $15-$37.50/ton ash O&M cost
Impacts for natural gas units Compliance Requirements
None
Potential compliance actions
n/a
Potential compliance costs
n/a
Electric Reliability Council of Texas, Inc. 8
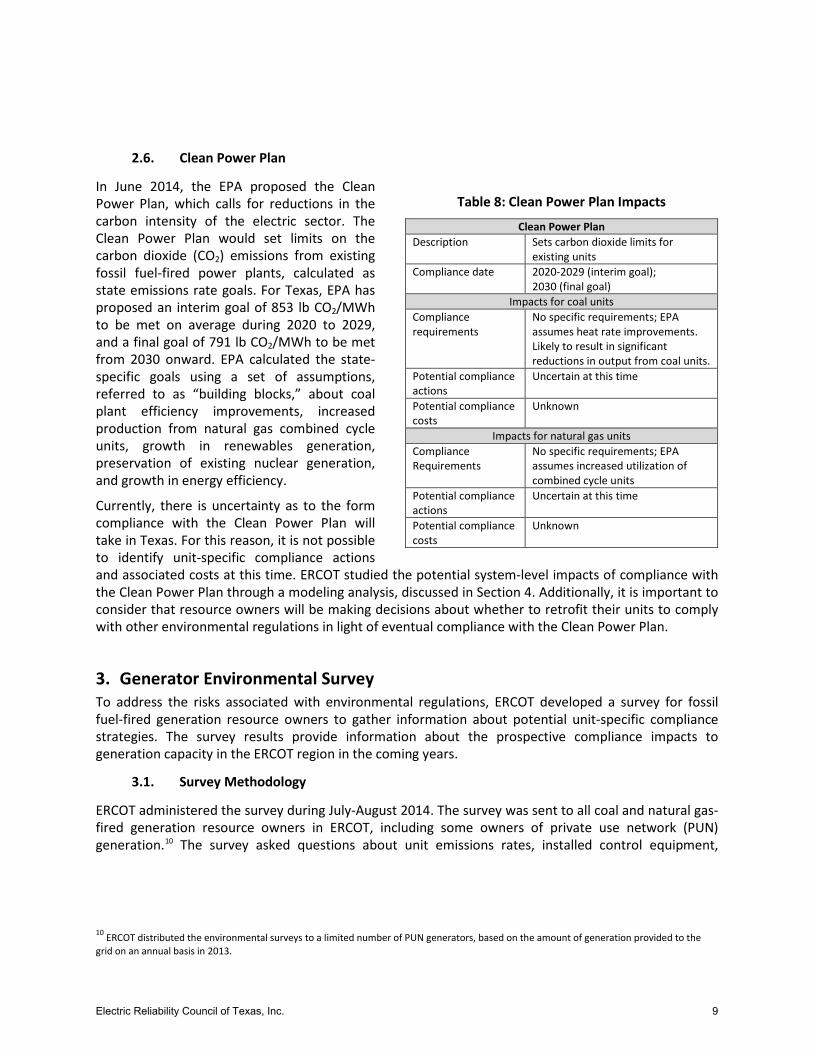
2.6. Clean Power Plan
In June 2014, the EPA proposed the Clean Power Plan, which calls for reductions in the carbon intensity of the electric sector. The Clean Power Plan would set limits on the carbon dioxide (CO2) emissions from existing fossil fuel-fired power plants, calculated as state emissions rate goals. For Texas, EPA has proposed an interim goal of 853 lb CO2/MWh to be met on average during 2020 to 2029, and a final goal of 791 lb CO2/MWh to be met from 2030 onward. EPA calculated the state-specific goals using a set of assumptions, referred to as “building blocks,” about coal plant efficiency improvements, increased production from natural gas combined cycle units, growth in renewables generation, preservation of existing nuclear generation, and growth in energy efficiency.
Currently, there is uncertainty as to the form compliance with the Clean Power Plan will take in Texas. For this reason, it is not possible to identify unit-specific compliance actions and associated costs at this time. ERCOT studied the potential system-level impacts of compliance with the Clean Power Plan through a modeling analysis, discussed in Section 4. Additionally, it is important to consider that resource owners will be making decisions about whether to retrofit their units to comply with other environmental regulations in light of eventual compliance with the Clean Power Plan.
3. Generator Environmental Survey To address the risks associated with environmental regulations, ERCOT developed a survey for fossil fuel-fired generation resource owners to gather information about potential unit-specific compliance strategies. The survey results provide information about the prospective compliance impacts to generation capacity in the ERCOT region in the coming years.
3.1. Survey Methodology
ERCOT administered the survey during July-August 2014. The survey was sent to all coal and natural gas-fired generation resource owners in ERCOT, including some owners of private use network (PUN) generation.10 The survey asked questions about unit emissions rates, installed control equipment,
10 ERCOT distributed the environmental surveys to a limited number of PUN generators, based on the amount of generation provided to the grid on an annual basis in 2013.
Table 8: Clean Power Plan Impacts
Clean Power Plan Description Sets carbon dioxide limits for
existing units Compliance date 2020-2029 (interim goal);
2030 (final goal) Impacts for coal units
Compliance requirements
No specific requirements; EPA assumes heat rate improvements. Likely to result in significant reductions in output from coal units.
Potential compliance actions
Uncertain at this time
Potential compliance costs
Unknown
Impacts for natural gas units Compliance Requirements
No specific requirements; EPA assumes increased utilization of combined cycle units
Potential compliance actions
Uncertain at this time
Potential compliance costs
Unknown
Electric Reliability Council of Texas, Inc. 9
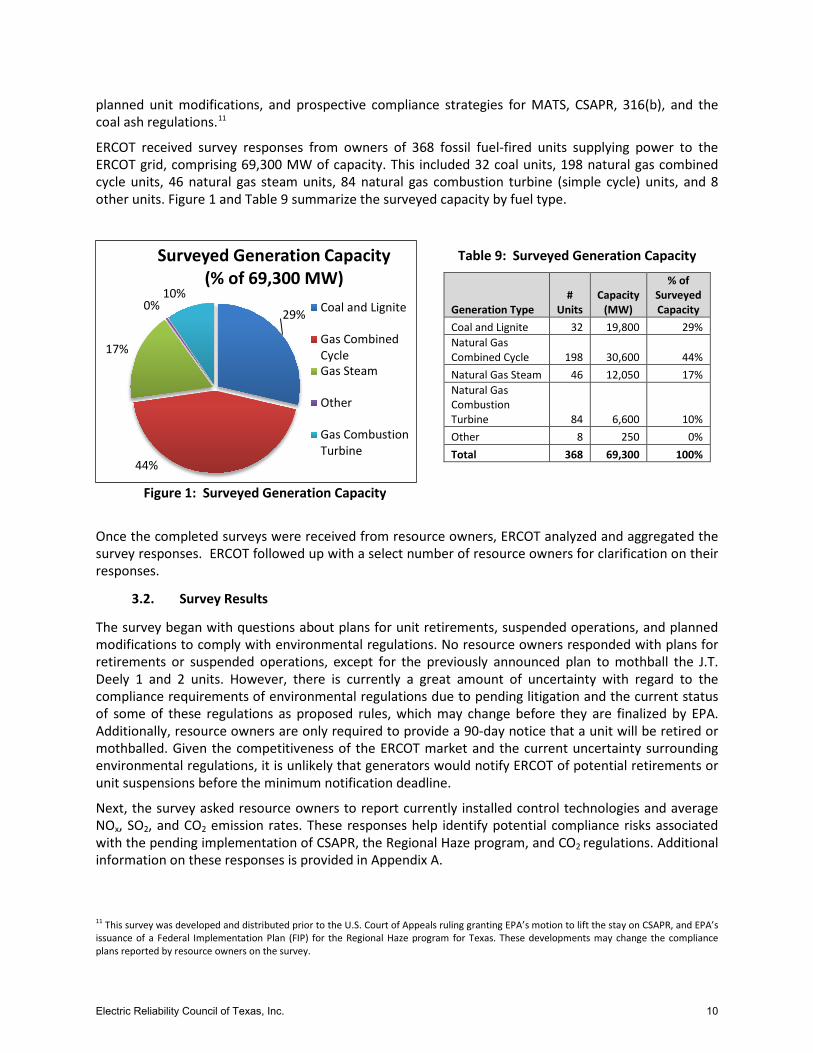
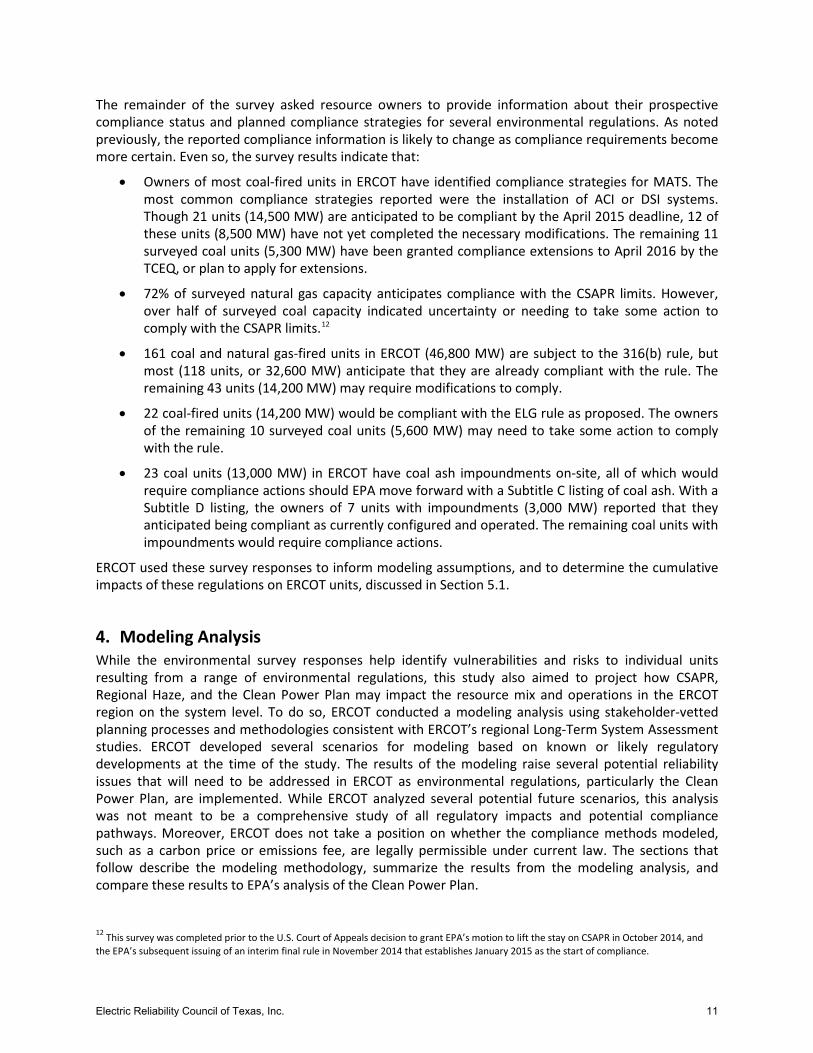
Table 9: Surveyed Generation Capacity
Generation Type #
Units Capacity
(MW)
% of Surveyed Capacity
Coal and Lignite 32 19,800 29% Natural Gas Combined Cycle 198 30,600 44% Natural Gas Steam 46 12,050 17% Natural Gas Combustion Turbine 84 6,600 10% Other 8 250 0% Total 368 69,300 100%
planned unit modifications, and prospective compliance strategies for MATS, CSAPR, 316(b), and the coal ash regulations.11
ERCOT received survey responses from owners of 368 fossil fuel-fired units supplying power to the ERCOT grid, comprising 69,300 MW of capacity. This included 32 coal units, 198 natural gas combined cycle units, 46 natural gas steam units, 84 natural gas combustion turbine (simple cycle) units, and 8 other units. Figure 1 and Table 9 summarize the surveyed capacity by fuel type.
Figure 1: Surveyed Generation Capacity
Once the completed surveys were received from resource owners, ERCOT analyzed and aggregated the survey responses. ERCOT followed up with a select number of resource owners for clarification on their responses.
3.2. Survey Results
The survey began with questions about plans for unit retirements, suspended operations, and planned modifications to comply with environmental regulations. No resource owners responded with plans for retirements or suspended operations, except for the previously announced plan to mothball the J.T. Deely 1 and 2 units. However, there is currently a great amount of uncertainty with regard to the compliance requirements of environmental regulations due to pending litigation and the current status of some of these regulations as proposed rules, which may change before they are finalized by EPA. Additionally, resource owners are only required to provide a 90-day notice that a unit will be retired or mothballed. Given the competitiveness of the ERCOT market and the current uncertainty surrounding environmental regulations, it is unlikely that generators would notify ERCOT of potential retirements or unit suspensions before the minimum notification deadline.
Next, the survey asked resource owners to report currently installed control technologies and average NOx, SO2, and CO2 emission rates. These responses help identify potential compliance risks associated with the pending implementation of CSAPR, the Regional Haze program, and CO2 regulations. Additional information on these responses is provided in Appendix A.
11 This survey was developed and distributed prior to the U.S. Court of Appeals ruling granting EPA’s motion to lift the stay on CSAPR, and EPA’s issuance of a Federal Implementation Plan (FIP) for the Regional Haze program for Texas. These developments may change the compliance plans reported by resource owners on the survey.
29%
44%
17%
0% 10%
Surveyed Generation Capacity (% of 69,300 MW)
Coal and Lignite
Gas CombinedCycleGas Steam
Other
Gas CombustionTurbine
Electric Reliability Council of Texas, Inc. 10
The remainder of the survey asked resource owners to provide information about their prospective compliance status and planned compliance strategies for several environmental regulations. As noted previously, the reported compliance information is likely to change as compliance requirements become more certain. Even so, the survey results indicate that:
• Owners of most coal-fired units in ERCOT have identified compliance strategies for MATS. The most common compliance strategies reported were the installation of ACI or DSI systems. Though 21 units (14,500 MW) are anticipated to be compliant by the April 2015 deadline, 12 of these units (8,500 MW) have not yet completed the necessary modifications. The remaining 11 surveyed coal units (5,300 MW) have been granted compliance extensions to April 2016 by the TCEQ, or plan to apply for extensions.
• 72% of surveyed natural gas capacity anticipates compliance with the CSAPR limits. However, over half of surveyed coal capacity indicated uncertainty or needing to take some action to comply with the CSAPR limits.12
• 161 coal and natural gas-fired units in ERCOT (46,800 MW) are subject to the 316(b) rule, but most (118 units, or 32,600 MW) anticipate that they are already compliant with the rule. The remaining 43 units (14,200 MW) may require modifications to comply.
• 22 coal-fired units (14,200 MW) would be compliant with the ELG rule as proposed. The owners of the remaining 10 surveyed coal units (5,600 MW) may need to take some action to comply with the rule.
• 23 coal units (13,000 MW) in ERCOT have coal ash impoundments on-site, all of which would require compliance actions should EPA move forward with a Subtitle C listing of coal ash. With a Subtitle D listing, the owners of 7 units with impoundments (3,000 MW) reported that they anticipated being compliant as currently configured and operated. The remaining coal units with impoundments would require compliance actions.
ERCOT used these survey responses to inform modeling assumptions, and to determine the cumulative impacts of these regulations on ERCOT units, discussed in Section 5.1.
4. Modeling Analysis While the environmental survey responses help identify vulnerabilities and risks to individual units resulting from a range of environmental regulations, this study also aimed to project how CSAPR, Regional Haze, and the Clean Power Plan may impact the resource mix and operations in the ERCOT region on the system level. To do so, ERCOT conducted a modeling analysis using stakeholder-vetted planning processes and methodologies consistent with ERCOT’s regional Long-Term System Assessment studies. ERCOT developed several scenarios for modeling based on known or likely regulatory developments at the time of the study. The results of the modeling raise several potential reliability issues that will need to be addressed in ERCOT as environmental regulations, particularly the Clean Power Plan, are implemented. While ERCOT analyzed several potential future scenarios, this analysis was not meant to be a comprehensive study of all regulatory impacts and potential compliance pathways. Moreover, ERCOT does not take a position on whether the compliance methods modeled, such as a carbon price or emissions fee, are legally permissible under current law. The sections that follow describe the modeling methodology, summarize the results from the modeling analysis, and compare these results to EPA’s analysis of the Clean Power Plan.
12 This survey was completed prior to the U.S. Court of Appeals decision to grant EPA’s motion to lift the stay on CSAPR in October 2014, and the EPA’s subsequent issuing of an interim final rule in November 2014 that establishes January 2015 as the start of compliance.
Electric Reliability Council of Texas, Inc. 11
4.1. Modeling Methodology
This study used Energy Exemplar’s PLEXOS Integrated Energy Model to estimate changes to electric generation in ERCOT given a set of assumptions about future market trends and the implementation of environmental regulations. ERCOT modeled several distinct scenarios that considered different ways to implement the emissions limits, in comparison to a baseline. The modeling approach draws on stakeholder-vetted assumptions used in ERCOT’s Long-Term System Assessment, with additional assumptions specific to this analysis that reflect the environmental regulations studied. The load forecast is based on ERCOT’s neural network models that combine weather, demographic, and economic variables to project long-term trends.
The PLEXOS Integrated Energy Model uses mixed integer programming to model the power sector. In this study, ERCOT used the long-term modeling capability in PLEXOS to get an estimate of unit retirements and capacity additions over the 2015 to 2029 timeframe. The long-term expansion is based on economics, and does not consider reliability or operational challenges. Then, ERCOT used PLEXOS’s short term modeling capability to mimic chronological hourly unit commitment and economic dispatch for the years 2020 and 2029. ERCOT elected to use the PLEXOS model for this study because it can simulate both real-world market operations and long term capacity expansion planning using either emission constrained or emission price scenarios.
Modeled Scenarios 4.1.1.
In approaching this modeling analysis, ERCOT developed a set of scenarios that reflect the potential range of system impacts under likely regulatory outcomes and in light of ongoing trends in the electric sector. To do so, ERCOT focused on those environmental regulations most likely to have system-level impacts in ERCOT, rather than those with more limited or unit-specific implications. Though the 316(b), MATS, and coal ash regulations may cumulatively impact individual resource owners’ decisions on whether to retire or mothball units, the impacts of these individual regulations are unlikely to impact overall trends on the ERCOT system as they are not expected to affect the economics of a significant number of units. For this reason, ERCOT focused its modeling efforts on the impacts of CSAPR, Regional Haze and the Clean Power Plan, as these regulations have the greatest potential to shift generation trends in ERCOT.
ERCOT evaluated CSAPR and the proposed Clean Power Plan using two methodologies. First, ERCOT considered scenarios with the emissions limits in these rules applied as a constraint, to allow the long-term simulation model to select the most cost-effective way to achieve compliance from electric generating resources. Second, emissions fees were used to cause the system to achieve the proposed standards. The benefit of the first approach is that it would be expected to minimize the overall cost to the system, and should lead to results that are comparable to the methodology utilized by the EPA in its analysis of the impacts of the Clean Power Plan. However, it may not be a change that is achievable within the current electricity market design in ERCOT.13 For this reason, ERCOT also modeled emissions fee scenarios. The CSAPR rule uses such an emissions trading scheme to achieve compliance with the limits. Though a carbon price is not an explicit component of the Clean Power Plan proposal, it is often discussed as an option for complying with the limits, and is included here in order to assess the system impacts of a potential approach to compliance. By modeling the carbon price option, ERCOT does not take any position about the policy merits or legal permissibility of such a compliance approach. With
13 Electric supply is deregulated in the ERCOT region at the wholesale and retail level. As a result, electric generation and construction of new capacity is driven by market forces. As a result, there is no mechanism to force the ERCOT system to achieve compliance with environmental regulations in a specific manner. Resource owners will make decisions about how to operate existing resources and whether to add new capacity based on market forces.
Electric Reliability Council of Texas, Inc. 12
regards to the Regional Haze program, ERCOT modeled the requirements in EPA’s proposed FIP as additional costs for impacted generators.
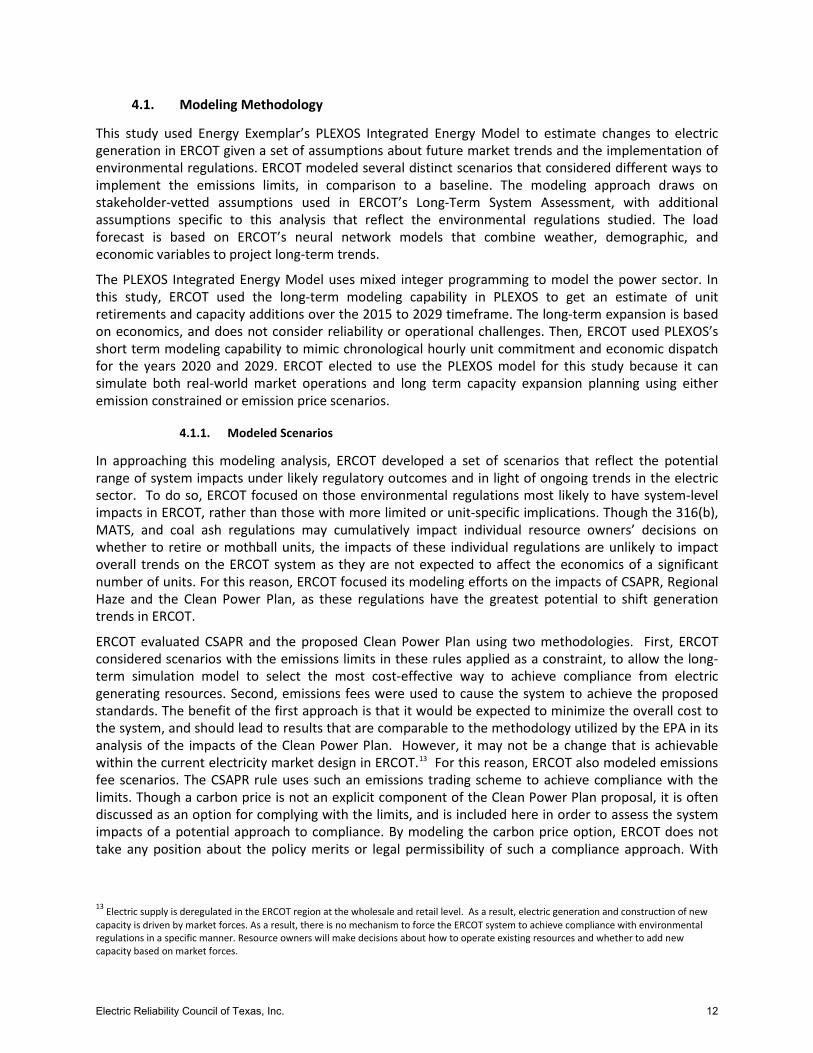
ERCOT modeled six distinct scenarios over the timeframe 2015 to 2029 to evaluate the impacts of CSAPR, Regional Haze, and the Clean Power Plan in the ERCOT region. Table 10 summarizes the assumptions of the six scenarios. The first scenario estimated a baseline of the ERCOT system under current market trends against which anticipated CSAPR and Clean Power Plan changes could be compared. Then, ERCOT modeled five scenarios to simulate the potential impacts of CSAPR, Regional Haze, and the Clean Power Plan. CSAPR and the Clean Power Plan are imposed as system constraints in scenarios 2, 3, and 4; and as emissions prices in scenarios 5 and 6. Scenario 3 also includes the requirements of EPA’s proposed Regional Haze FIP for Texas.
Table 10: Scenarios Modeled in Analysis
Scenario*
Environmental Regulations Included in Scenario
Emissions Limits Modeled As Limit or Emissions Price
CSAPR Regional
Haze CPP Limit Price 1. Baseline No No No No No
2. CSAPR Limits Yes No No Yes No 3. CSAPR Limits and Regional Haze Yes Yes No Yes No
4. CSAPR and CO2 Limits Yes No Yes Yes No 5. CSAPR Prices and $20/ton CO2 Price Yes No Yes No Yes
6. CSAPR Prices and $25/ton CO2 Price Yes No Yes No Yes
*Note: In the summary report of this analysis published on November 17, 2014, scenarios 4 through 6 were labeled as “CO2 Limit”, “$20/ton CO2”, and “25/ton CO2”, respectively. Scenarios 2 and 3 were not included in the summary report
ERCOT Long-Term Modeling Assumptions 4.1.2.
This study uses stakeholder-vetted assumptions consistent with ERCOT’s Long Term System Assessment (LTSA).14 Specifically, the baseline scenario in this study is based on the Current Trends scenario from the 2014 LTSA, and the subsequent scenarios were layered on top of the baseline scenario assumptions. The LTSA Current Trends scenario assumes that current policies and regulations will remain in place and that no new policies will be introduced. Table 11 summarizes the model input assumptions used in the LTSA Current Trends scenario.
These assumptions include the anticipated expiration of the Production Tax Credit (PTC) and phase out of the Investment Tax Credit (ITC). The PTC expiration assumption is particularly significant because it influences the amount of wind capacity additions predicted by the model.
14 For more information, visit ERCOT’s Regional Planning Group (RPG) website at http://www.ercot.com/committees/other/rpg/index.html.
Electric Reliability Council of Texas, Inc. 13
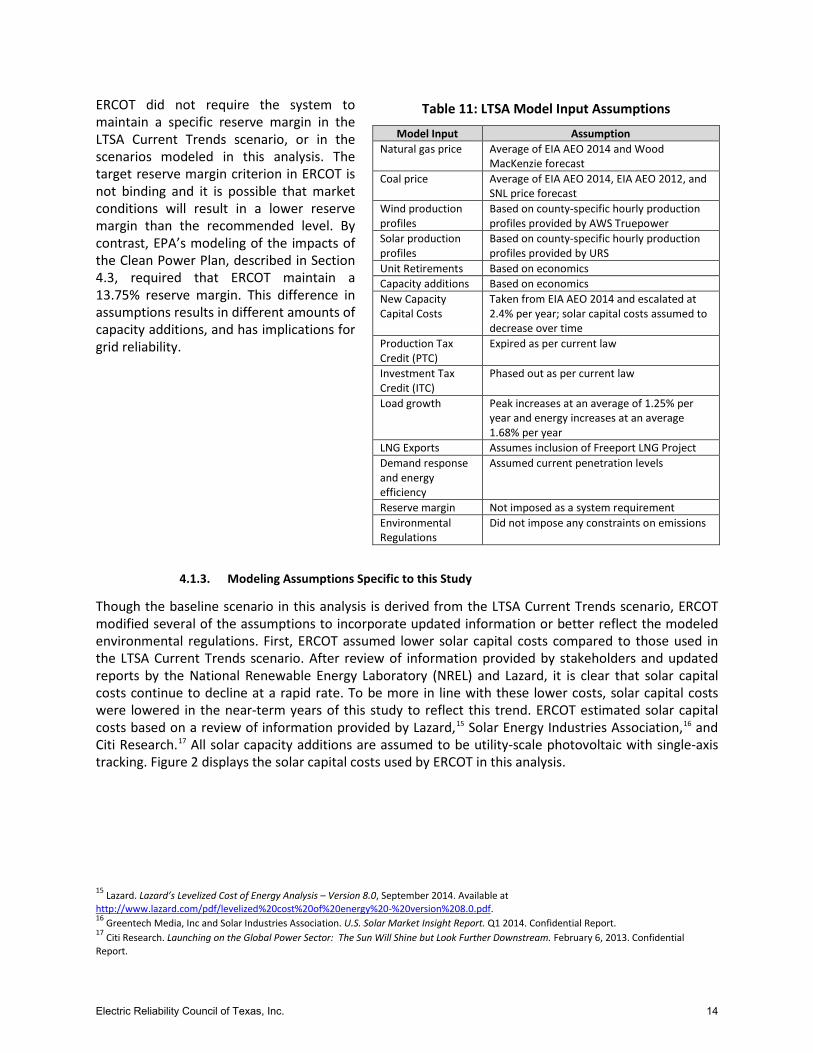
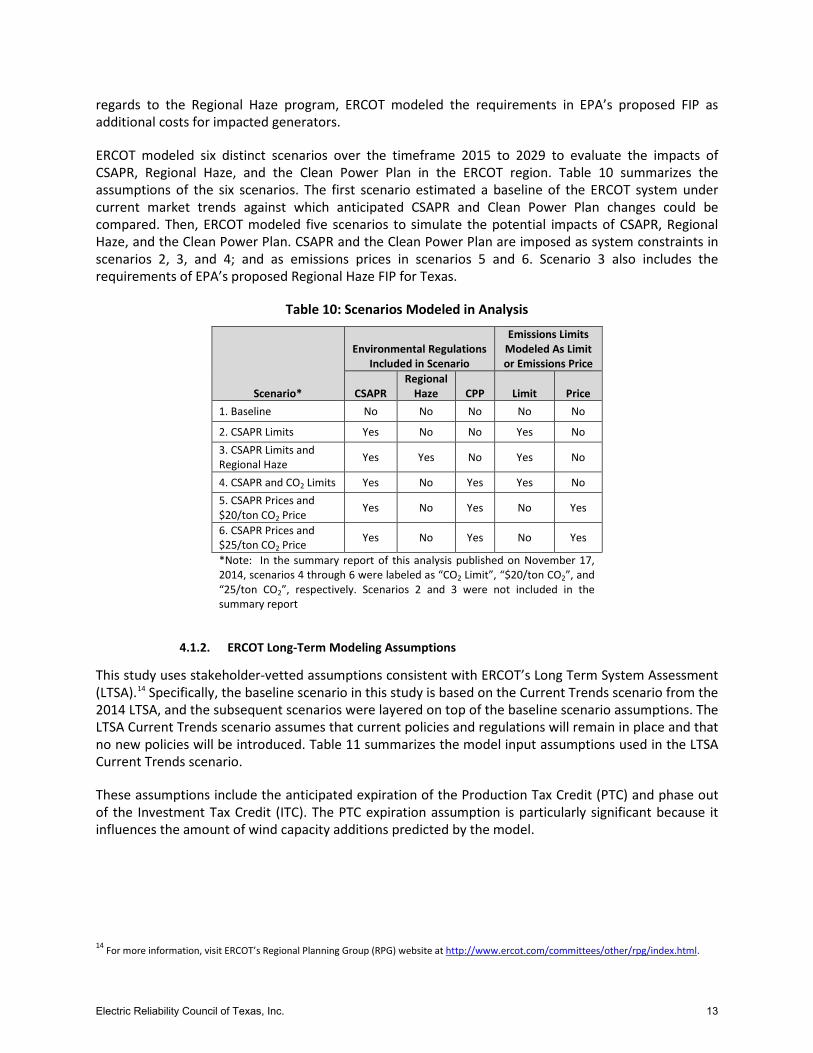
Table 11: LTSA Model Input Assumptions
Model Input Assumption Natural gas price Average of EIA AEO 2014 and Wood
MacKenzie forecast Coal price Average of EIA AEO 2014, EIA AEO 2012, and
SNL price forecast Wind production profiles
Based on county-specific hourly production profiles provided by AWS Truepower
Solar production profiles
Based on county-specific hourly production profiles provided by URS
Unit Retirements Based on economics Capacity additions Based on economics New Capacity Capital Costs
Taken from EIA AEO 2014 and escalated at 2.4% per year; solar capital costs assumed to decrease over time
Production Tax Credit (PTC)
Expired as per current law
Investment Tax Credit (ITC)
Phased out as per current law
Load growth Peak increases at an average of 1.25% per year and energy increases at an average 1.68% per year
LNG Exports Assumes inclusion of Freeport LNG Project Demand response and energy efficiency
Assumed current penetration levels
Reserve margin Not imposed as a system requirement Environmental Regulations
Did not impose any constraints on emissions
ERCOT did not require the system to maintain a specific reserve margin in the LTSA Current Trends scenario, or in the scenarios modeled in this analysis. The target reserve margin criterion in ERCOT is not binding and it is possible that market conditions will result in a lower reserve margin than the recommended level. By contrast, EPA’s modeling of the impacts of the Clean Power Plan, described in Section 4.3, required that ERCOT maintain a 13.75% reserve margin. This difference in assumptions results in different amounts of capacity additions, and has implications for grid reliability.
Modeling Assumptions Specific to this Study 4.1.3.
Though the baseline scenario in this analysis is derived from the LTSA Current Trends scenario, ERCOT modified several of the assumptions to incorporate updated information or better reflect the modeled environmental regulations. First, ERCOT assumed lower solar capital costs compared to those used in the LTSA Current Trends scenario. After review of information provided by stakeholders and updated reports by the National Renewable Energy Laboratory (NREL) and Lazard, it is clear that solar capital costs continue to decline at a rapid rate. To be more in line with these lower costs, solar capital costs were lowered in the near-term years of this study to reflect this trend. ERCOT estimated solar capital costs based on a review of information provided by Lazard,15 Solar Energy Industries Association,16 and Citi Research.17 All solar capacity additions are assumed to be utility-scale photovoltaic with single-axis tracking. Figure 2 displays the solar capital costs used by ERCOT in this analysis.
15 Lazard. Lazard’s Levelized Cost of Energy Analysis – Version 8.0, September 2014. Available at http://www.lazard.com/pdf/levelized%20cost%20of%20energy%20-%20version%208.0.pdf. 16 Greentech Media, Inc and Solar Industries Association. U.S. Solar Market Insight Report. Q1 2014. Confidential Report. 17 Citi Research. Launching on the Global Power Sector: The Sun Will Shine but Look Further Downstream. February 6, 2013. Confidential Report.
Electric Reliability Council of Texas, Inc. 14
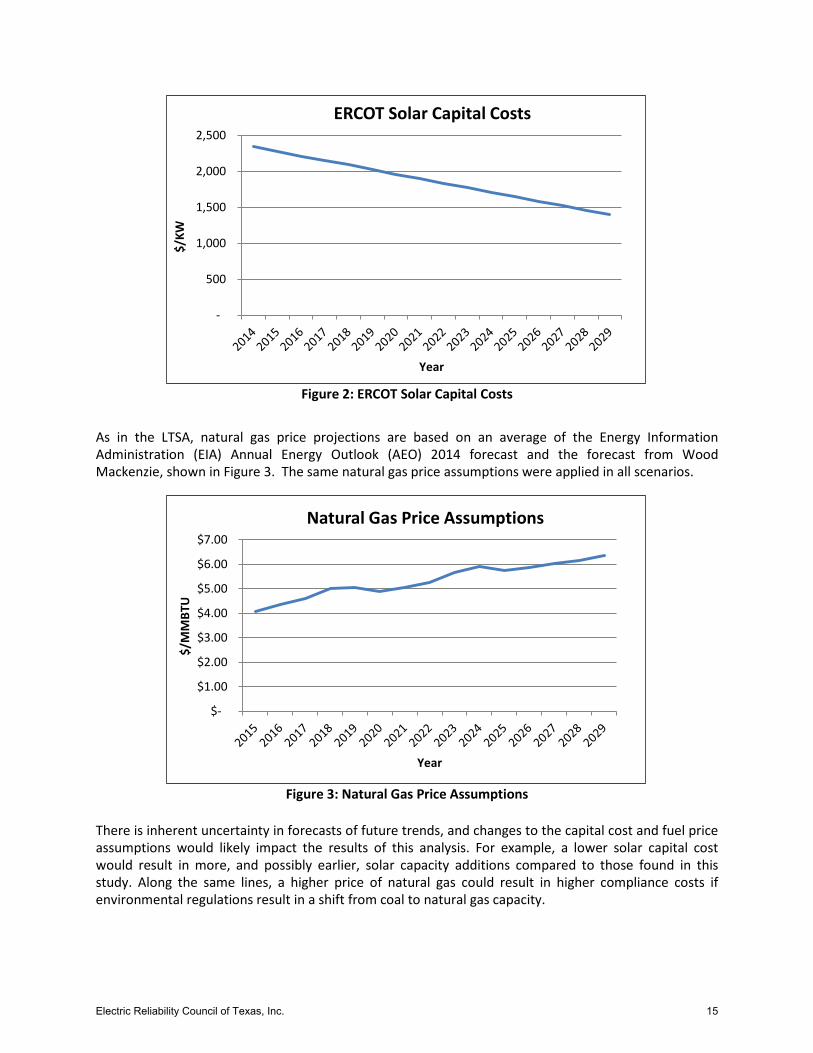
Figure 2: ERCOT Solar Capital Costs
As in the LTSA, natural gas price projections are based on an average of the Energy Information Administration (EIA) Annual Energy Outlook (AEO) 2014 forecast and the forecast from Wood Mackenzie, shown in Figure 3. The same natural gas price assumptions were applied in all scenarios.
Figure 3: Natural Gas Price Assumptions
There is inherent uncertainty in forecasts of future trends, and changes to the capital cost and fuel price assumptions would likely impact the results of this analysis. For example, a lower solar capital cost would result in more, and possibly earlier, solar capacity additions compared to those found in this study. Along the same lines, a higher price of natural gas could result in higher compliance costs if environmental regulations result in a shift from coal to natural gas capacity.
-
500
1,000
1,500
2,000
2,500
$/KW
Year
ERCOT Solar Capital Costs
$-
$1.00
$2.00
$3.00
$4.00
$5.00
$6.00
$7.00
$/M
MBT
U
Year
Natural Gas Price Assumptions
Electric Reliability Council of Texas, Inc. 15
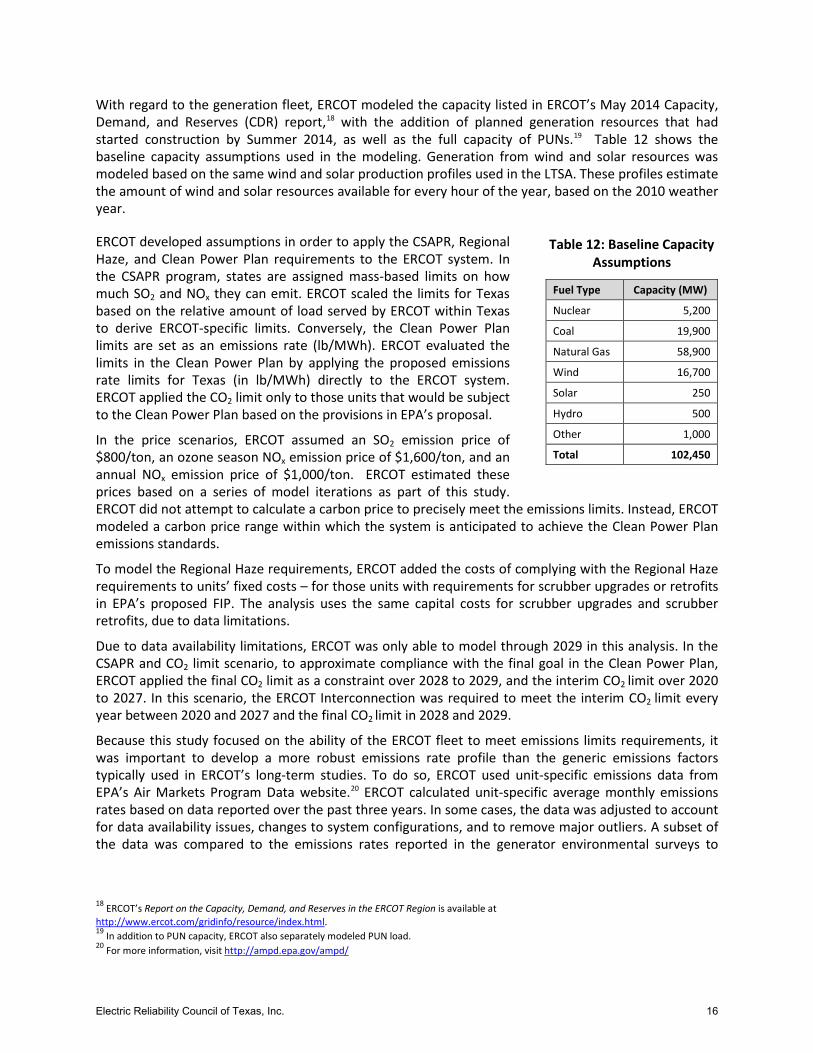
Table 12: Baseline Capacity Assumptions
Fuel Type Capacity (MW)
Nuclear 5,200
Coal 19,900
Natural Gas 58,900
Wind 16,700
Solar 250
Hydro 500
Other 1,000
Total 102,450
With regard to the generation fleet, ERCOT modeled the capacity listed in ERCOT’s May 2014 Capacity, Demand, and Reserves (CDR) report,18 with the addition of planned generation resources that had started construction by Summer 2014, as well as the full capacity of PUNs.19 Table 12 shows the baseline capacity assumptions used in the modeling. Generation from wind and solar resources was modeled based on the same wind and solar production profiles used in the LTSA. These profiles estimate the amount of wind and solar resources available for every hour of the year, based on the 2010 weather year.
ERCOT developed assumptions in order to apply the CSAPR, Regional Haze, and Clean Power Plan requirements to the ERCOT system. In the CSAPR program, states are assigned mass-based limits on how much SO2 and NOx they can emit. ERCOT scaled the limits for Texas based on the relative amount of load served by ERCOT within Texas to derive ERCOT-specific limits. Conversely, the Clean Power Plan limits are set as an emissions rate (lb/MWh). ERCOT evaluated the limits in the Clean Power Plan by applying the proposed emissions rate limits for Texas (in lb/MWh) directly to the ERCOT system. ERCOT applied the CO2 limit only to those units that would be subject to the Clean Power Plan based on the provisions in EPA’s proposal.
In the price scenarios, ERCOT assumed an SO2 emission price of $800/ton, an ozone season NOx emission price of $1,600/ton, and an annual NOx emission price of $1,000/ton. ERCOT estimated these prices based on a series of model iterations as part of this study. ERCOT did not attempt to calculate a carbon price to precisely meet the emissions limits. Instead, ERCOT modeled a carbon price range within which the system is anticipated to achieve the Clean Power Plan emissions standards.
To model the Regional Haze requirements, ERCOT added the costs of complying with the Regional Haze requirements to units’ fixed costs – for those units with requirements for scrubber upgrades or retrofits in EPA’s proposed FIP. The analysis uses the same capital costs for scrubber upgrades and scrubber retrofits, due to data limitations.
Due to data availability limitations, ERCOT was only able to model through 2029 in this analysis. In the CSAPR and CO2 limit scenario, to approximate compliance with the final goal in the Clean Power Plan, ERCOT applied the final CO2 limit as a constraint over 2028 to 2029, and the interim CO2
limit over 2020 to 2027. In this scenario, the ERCOT Interconnection was required to meet the interim CO2
limit every year between 2020 and 2027 and the final CO2
limit in 2028 and 2029.
Because this study focused on the ability of the ERCOT fleet to meet emissions limits requirements, it was important to develop a more robust emissions rate profile than the generic emissions factors typically used in ERCOT’s long-term studies. To do so, ERCOT used unit-specific emissions data from EPA’s Air Markets Program Data website.20 ERCOT calculated unit-specific average monthly emissions rates based on data reported over the past three years. In some cases, the data was adjusted to account for data availability issues, changes to system configurations, and to remove major outliers. A subset of the data was compared to the emissions rates reported in the generator environmental surveys to
18 ERCOT’s Report on the Capacity, Demand, and Reserves in the ERCOT Region is available at http://www.ercot.com/gridinfo/resource/index.html. 19 In addition to PUN capacity, ERCOT also separately modeled PUN load. 20 For more information, visit http://ampd.epa.gov/ampd/
Electric Reliability Council of Texas, Inc. 16
validate the calculated emissions rates. For units for which this information was not available, ERCOT developed an average emissions profile by generation technology type based on the available data.
Finally, in the baseline and CSAPR limit scenario ERCOT assumed energy efficiency savings at 1% of load for all modeled years, consistent with current levels of energy efficiency as measured by the Electric Utility Marketing Managers of Texas (EUMMOT).21 For the scenarios with the Clean Power Plan, ERCOT assumed growth in energy efficiency savings to a level of 5% by 2029. By contrast, EPA’s building blocks assumed Texas could achieve a cumulative 9.91% savings from energy efficiency by 2029. ERCOT did not use the energy efficiency savings level estimated by EPA because ERCOT believes that a 5% savings level represents a moderate energy efficiency growth assumption, between the current level of savings and EPA’s goal. ERCOT’s more moderate assumption is also consistent with the approach taken by the Mid-Continent Independent System Operator (MISO) in its analysis of the impacts of the Clean Power Plan.22 MISO modeled three energy efficiency assumptions: base energy efficiency trends, EPA’s Building Block 4, and 50% of EPA’s Building Block 4. ERCOT’s approach of using 5% is consistent with the third assumption modeled by MISO.
Load Forecast Development 4.1.4.
The load forecasts used in this analysis were produced using a set of neural networks to capture and project the long-term trends extracted from historical load data. The long-term trend in monthly energy was modeled separately for each of the eight weather zones in ERCOT. The models incorporated economic, demographic, and weather data to develop the monthly energy forecast.
After the calculation of the monthly energy forecast, the development of the hourly load forecast required the allocation of that monthly energy to each hour in the month. A total of 864 neural network models were developed to produce hourly energy allocations for the twelve months. ERCOT validated the models by back-casting the hourly load allocations against several years of historical hourly load. Model validation was conducted by using historical monthly energy in the modeling networks to back-cast the hourly loads for each day in the historical load database.
A key input of both energy models is the forecasted weather. A normal (typical) weather hourly profile is used in both models. Normal weather means what is expected on a 50% probability basis; i.e., that the forecast for the monthly energy or peak demand has a 50% probability of being under or over the actual energy or peak. This is also known as the 50/50 forecast.
ERCOT’s analysis included 12 years of weather data (2002 to 2013). The methodology that ERCOT selected to create the “normal” weather year is commonly referred to as the Rank and Sort methodology. A forecast is created using each of the 12 years of historical weather data. The resultant hourly forecast is ordered from the largest value to the smallest value. The normal weather forecast is then determined by calculating the average of each ordered hourly value.
Another key input of both energy models is the forecast of the number of premises in each customer class. Premises are classified as residential, business (small commercial), or industrial. A weather normalized use per premise is also included in the model.
Premises forecasts are developed using various economic variables such as non-farm employment, housing stock, and population. The current condition of the United States economy and its future direction is an element of great uncertainty. Texas thus far has not been affected to the same extent as the United States as a whole by the current economic downturn. This has led to Texas having stronger
21 EUMMOT’s Energy Efficiency Accomplishments Report is available at http://www.texasefficiency.com/index.php/publications/reports. 22 MISO. GHG Regulation Impact Analysis, July 30, 2014. Available at https://www.misoenergy.org/Library/Repository/Meeting%20Material/Stakeholder/PAC/2014/20140730/20140730%20PAC%20Item%2012a%20GHG%20Regulation%20Impact%20Analysis.pdf.
Electric Reliability Council of Texas, Inc. 17
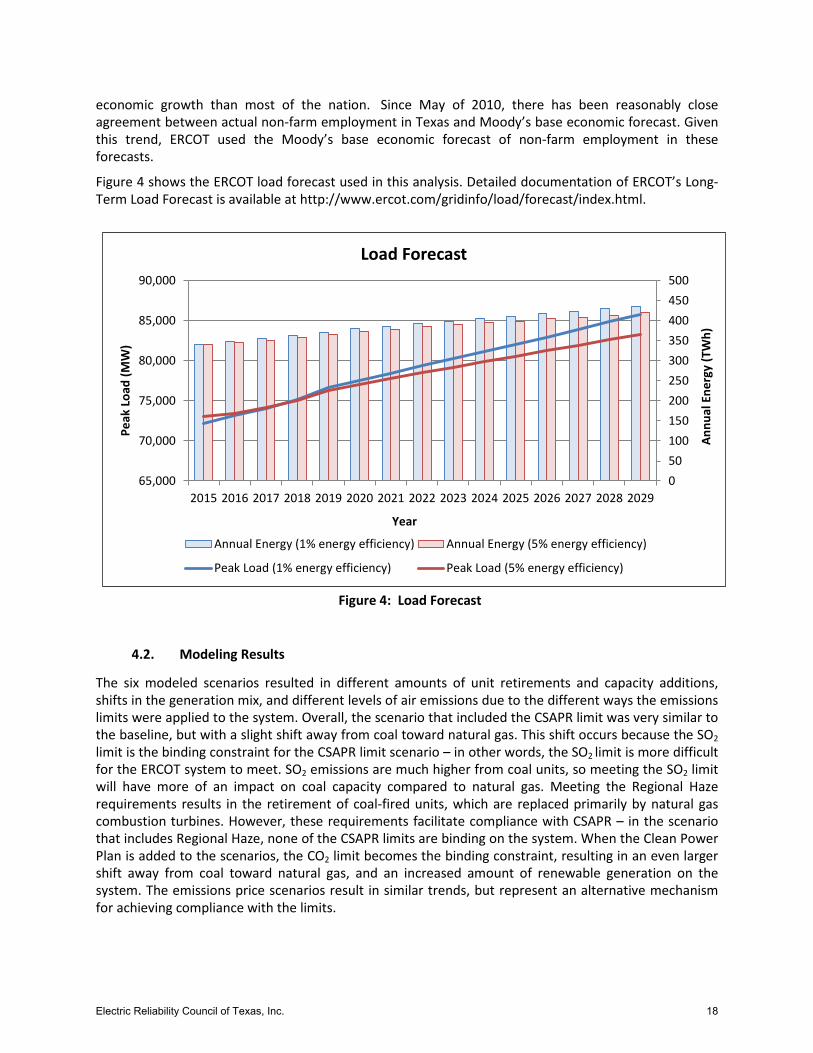
economic growth than most of the nation. Since May of 2010, there has been reasonably close agreement between actual non-farm employment in Texas and Moody’s base economic forecast. Given this trend, ERCOT used the Moody’s base economic forecast of non-farm employment in these forecasts.
Figure 4 shows the ERCOT load forecast used in this analysis. Detailed documentation of ERCOT’s Long-Term Load Forecast is available at http://www.ercot.com/gridinfo/load/forecast/index.html.
4.2. Modeling Results
The six modeled scenarios resulted in different amounts of unit retirements and capacity additions, shifts in the generation mix, and different levels of air emissions due to the different ways the emissions limits were applied to the system. Overall, the scenario that included the CSAPR limit was very similar to the baseline, but with a slight shift away from coal toward natural gas. This shift occurs because the SO2 limit is the binding constraint for the CSAPR limit scenario – in other words, the SO2 limit is more difficult for the ERCOT system to meet. SO2 emissions are much higher from coal units, so meeting the SO2 limit will have more of an impact on coal capacity compared to natural gas. Meeting the Regional Haze requirements results in the retirement of coal-fired units, which are replaced primarily by natural gas combustion turbines. However, these requirements facilitate compliance with CSAPR – in the scenario that includes Regional Haze, none of the CSAPR limits are binding on the system. When the Clean Power Plan is added to the scenarios, the CO2 limit becomes the binding constraint, resulting in an even larger shift away from coal toward natural gas, and an increased amount of renewable generation on the system. The emissions price scenarios result in similar trends, but represent an alternative mechanism for achieving compliance with the limits.
Figure 4: Load Forecast
050100150200250300350400450500
65,000
70,000
75,000
80,000
85,000
90,000
2015 2016 2017 2018 2019 2020 2021 2022 2023 2024 2025 2026 2027 2028 2029
Annu
al E
nerg
y (T
Wh)
Peak
Loa
d (M
W)
Year
Load Forecast
Annual Energy (1% energy efficiency) Annual Energy (5% energy efficiency)
Peak Load (1% energy efficiency) Peak Load (5% energy efficiency)
Electric Reliability Council of Texas, Inc. 18
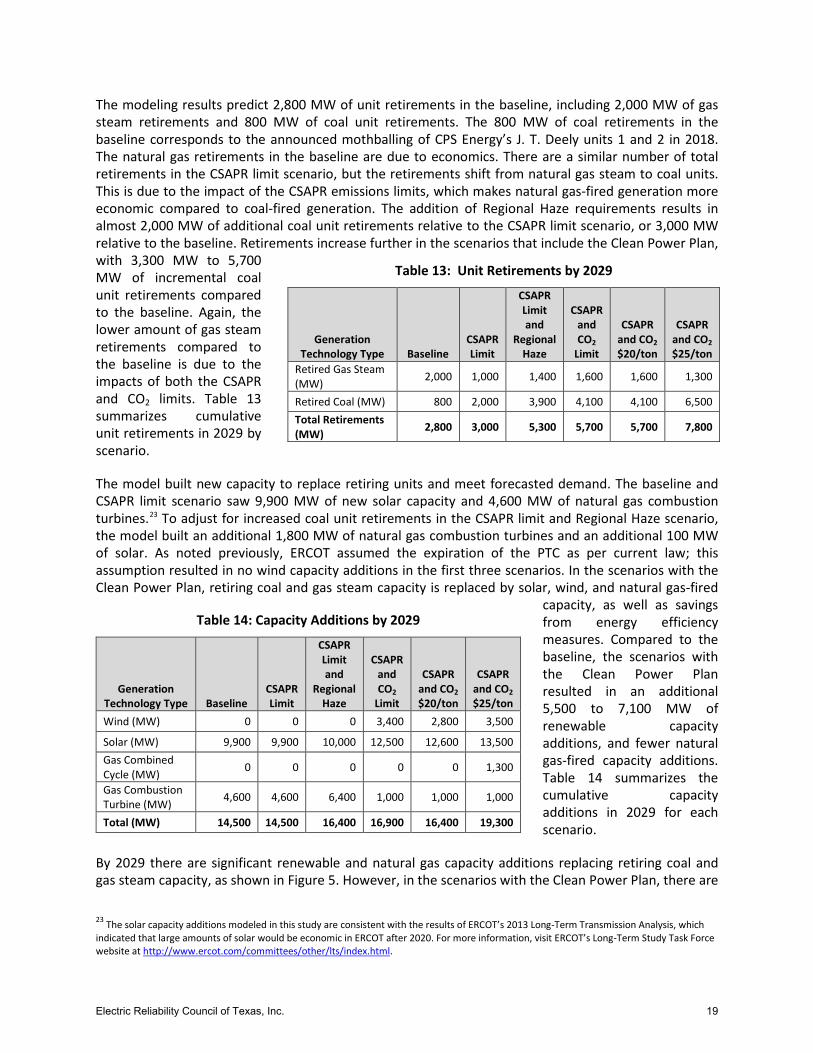
Table 13: Unit Retirements by 2029
Generation Technology Type Baseline
CSAPR Limit
CSAPR Limit and
Regional Haze
CSAPR and CO2
Limit
CSAPR and CO2 $20/ton
CSAPR and CO2 $25/ton
Retired Gas Steam (MW) 2,000 1,000 1,400 1,600 1,600 1,300
Retired Coal (MW) 800 2,000 3,900 4,100 4,100 6,500 Total Retirements (MW) 2,800 3,000 5,300 5,700 5,700 7,800
Table 14: Capacity Additions by 2029
Generation Technology Type Baseline
CSAPR Limit
CSAPR Limit and
Regional Haze
CSAPR and CO2
Limit
CSAPR and CO2 $20/ton
CSAPR and CO2 $25/ton
Wind (MW) 0 0 0 3,400 2,800 3,500
Solar (MW) 9,900 9,900 10,000 12,500 12,600 13,500 Gas Combined Cycle (MW) 0 0 0 0 0 1,300
Gas Combustion Turbine (MW) 4,600 4,600 6,400 1,000 1,000 1,000
Total (MW) 14,500 14,500 16,400 16,900 16,400 19,300
The modeling results predict 2,800 MW of unit retirements in the baseline, including 2,000 MW of gas steam retirements and 800 MW of coal unit retirements. The 800 MW of coal retirements in the baseline corresponds to the announced mothballing of CPS Energy’s J. T. Deely units 1 and 2 in 2018. The natural gas retirements in the baseline are due to economics. There are a similar number of total retirements in the CSAPR limit scenario, but the retirements shift from natural gas steam to coal units. This is due to the impact of the CSAPR emissions limits, which makes natural gas-fired generation more economic compared to coal-fired generation. The addition of Regional Haze requirements results in almost 2,000 MW of additional coal unit retirements relative to the CSAPR limit scenario, or 3,000 MW relative to the baseline. Retirements increase further in the scenarios that include the Clean Power Plan, with 3,300 MW to 5,700 MW of incremental coal unit retirements compared to the baseline. Again, the lower amount of gas steam retirements compared to the baseline is due to the impacts of both the CSAPR and CO2 limits. Table 13 summarizes cumulative unit retirements in 2029 by scenario.
The model built new capacity to replace retiring units and meet forecasted demand. The baseline and CSAPR limit scenario saw 9,900 MW of new solar capacity and 4,600 MW of natural gas combustion turbines.23 To adjust for increased coal unit retirements in the CSAPR limit and Regional Haze scenario, the model built an additional 1,800 MW of natural gas combustion turbines and an additional 100 MW of solar. As noted previously, ERCOT assumed the expiration of the PTC as per current law; this assumption resulted in no wind capacity additions in the first three scenarios. In the scenarios with the Clean Power Plan, retiring coal and gas steam capacity is replaced by solar, wind, and natural gas-fired
capacity, as well as savings from energy efficiency measures. Compared to the baseline, the scenarios with the Clean Power Plan resulted in an additional 5,500 to 7,100 MW of renewable capacity additions, and fewer natural gas-fired capacity additions. Table 14 summarizes the cumulative capacity additions in 2029 for each scenario.
By 2029 there are significant renewable and natural gas capacity additions replacing retiring coal and gas steam capacity, as shown in Figure 5. However, in the scenarios with the Clean Power Plan, there are
23 The solar capacity additions modeled in this study are consistent with the results of ERCOT’s 2013 Long-Term Transmission Analysis, which indicated that large amounts of solar would be economic in ERCOT after 2020. For more information, visit ERCOT’s Long-Term Study Task Force website at http://www.ercot.com/committees/other/lts/index.html.
Electric Reliability Council of Texas, Inc. 19
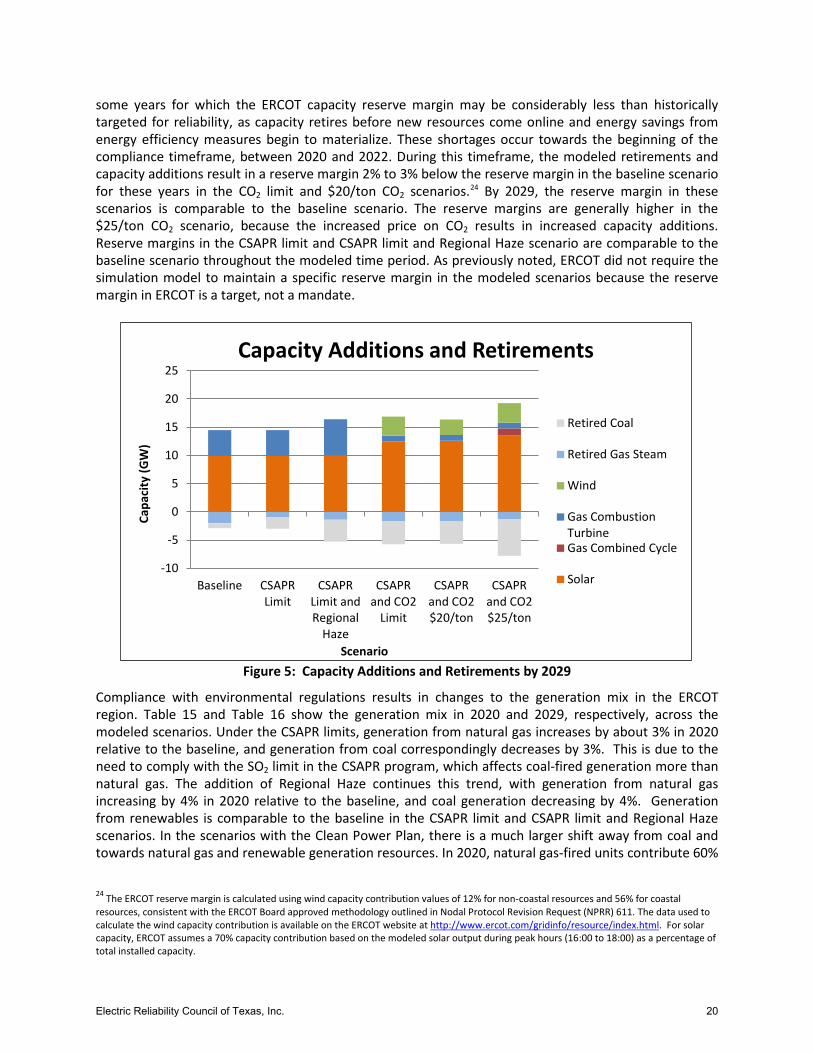
some years for which the ERCOT capacity reserve margin may be considerably less than historically targeted for reliability, as capacity retires before new resources come online and energy savings from energy efficiency measures begin to materialize. These shortages occur towards the beginning of the compliance timeframe, between 2020 and 2022. During this timeframe, the modeled retirements and capacity additions result in a reserve margin 2% to 3% below the reserve margin in the baseline scenario for these years in the CO2 limit and $20/ton CO2 scenarios.24 By 2029, the reserve margin in these scenarios is comparable to the baseline scenario. The reserve margins are generally higher in the $25/ton CO2 scenario, because the increased price on CO2 results in increased capacity additions. Reserve margins in the CSAPR limit and CSAPR limit and Regional Haze scenario are comparable to the baseline scenario throughout the modeled time period. As previously noted, ERCOT did not require the simulation model to maintain a specific reserve margin in the modeled scenarios because the reserve margin in ERCOT is a target, not a mandate.
Figure 5: Capacity Additions and Retirements by 2029
Compliance with environmental regulations results in changes to the generation mix in the ERCOT region. Table 15 and Table 16 show the generation mix in 2020 and 2029, respectively, across the modeled scenarios. Under the CSAPR limits, generation from natural gas increases by about 3% in 2020 relative to the baseline, and generation from coal correspondingly decreases by 3%. This is due to the need to comply with the SO2 limit in the CSAPR program, which affects coal-fired generation more than natural gas. The addition of Regional Haze continues this trend, with generation from natural gas increasing by 4% in 2020 relative to the baseline, and coal generation decreasing by 4%. Generation from renewables is comparable to the baseline in the CSAPR limit and CSAPR limit and Regional Haze scenarios. In the scenarios with the Clean Power Plan, there is a much larger shift away from coal and towards natural gas and renewable generation resources. In 2020, natural gas-fired units contribute 60%
24 The ERCOT reserve margin is calculated using wind capacity contribution values of 12% for non-coastal resources and 56% for coastal resources, consistent with the ERCOT Board approved methodology outlined in Nodal Protocol Revision Request (NPRR) 611. The data used to calculate the wind capacity contribution is available on the ERCOT website at http://www.ercot.com/gridinfo/resource/index.html. For solar capacity, ERCOT assumes a 70% capacity contribution based on the modeled solar output during peak hours (16:00 to 18:00) as a percentage of total installed capacity.
-10
-5
0
5
10
15
20
25
Baseline CSAPRLimit
CSAPRLimit andRegional
Haze
CSAPRand CO2
Limit
CSAPRand CO2$20/ton
CSAPRand CO2$25/ton
Capa
city
(GW
)
Scenario
Capacity Additions and Retirements
Retired Coal
Retired Gas Steam
Wind
Gas CombustionTurbineGas Combined Cycle
Solar
Electric Reliability Council of Texas, Inc. 20
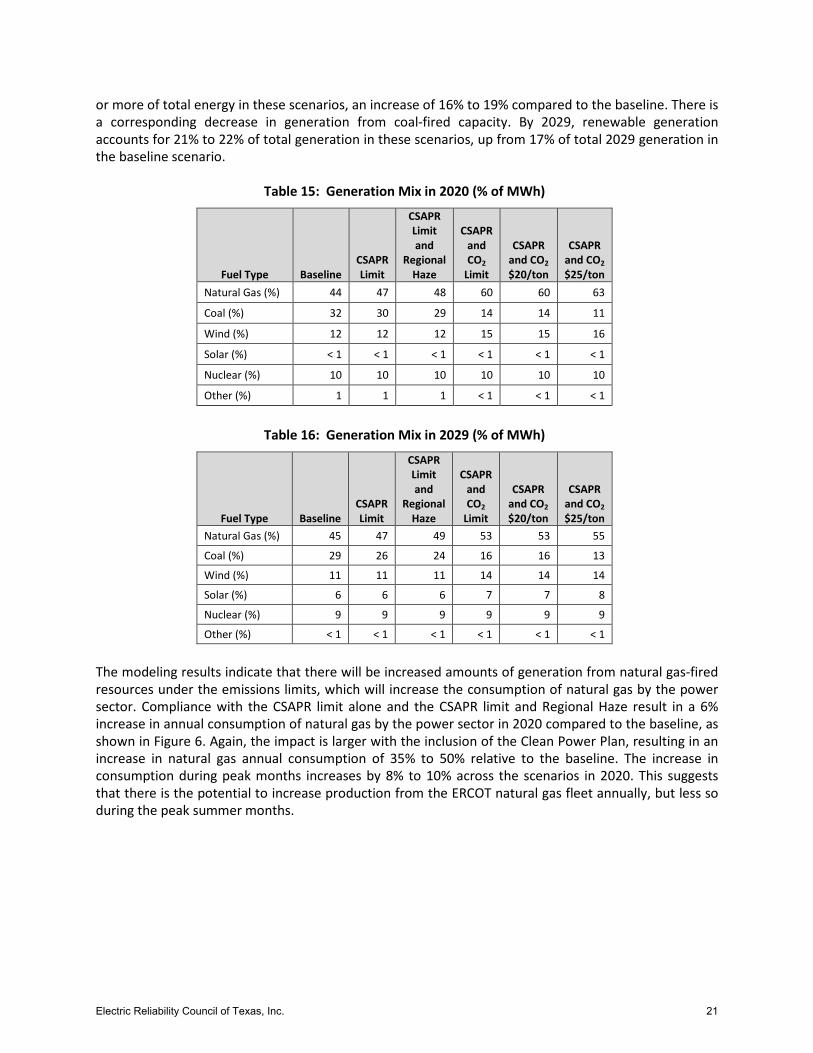
Table 15: Generation Mix in 2020 (% of MWh)
Fuel Type Baseline CSAPR Limit
CSAPR Limit and
Regional Haze
CSAPR and CO2
Limit
CSAPR and CO2 $20/ton
CSAPR and CO2 $25/ton
Natural Gas (%) 44 47 48 60 60 63
Coal (%) 32 30 29 14 14 11
Wind (%) 12 12 12 15 15 16
Solar (%) < 1 < 1 < 1 < 1 < 1 < 1
Nuclear (%) 10 10 10 10 10 10
Other (%) 1 1 1 < 1 < 1 < 1
Table 16: Generation Mix in 2029 (% of MWh)
Fuel Type Baseline CSAPR Limit
CSAPR Limit and
Regional Haze
CSAPR and CO2
Limit
CSAPR and CO2 $20/ton
CSAPR and CO2 $25/ton
Natural Gas (%) 45 47 49 53 53 55
Coal (%) 29 26 24 16 16 13
Wind (%) 11 11 11 14 14 14
Solar (%) 6 6 6 7 7 8
Nuclear (%) 9 9 9 9 9 9
Other (%) < 1 < 1 < 1 < 1 < 1 < 1
or more of total energy in these scenarios, an increase of 16% to 19% compared to the baseline. There is a corresponding decrease in generation from coal-fired capacity. By 2029, renewable generation accounts for 21% to 22% of total generation in these scenarios, up from 17% of total 2029 generation in the baseline scenario.
The modeling results indicate that there will be increased amounts of generation from natural gas-fired resources under the emissions limits, which will increase the consumption of natural gas by the power sector. Compliance with the CSAPR limit alone and the CSAPR limit and Regional Haze result in a 6% increase in annual consumption of natural gas by the power sector in 2020 compared to the baseline, as shown in Figure 6. Again, the impact is larger with the inclusion of the Clean Power Plan, resulting in an increase in natural gas annual consumption of 35% to 50% relative to the baseline. The increase in consumption during peak months increases by 8% to 10% across the scenarios in 2020. This suggests that there is the potential to increase production from the ERCOT natural gas fleet annually, but less so during the peak summer months.
Electric Reliability Council of Texas, Inc. 21
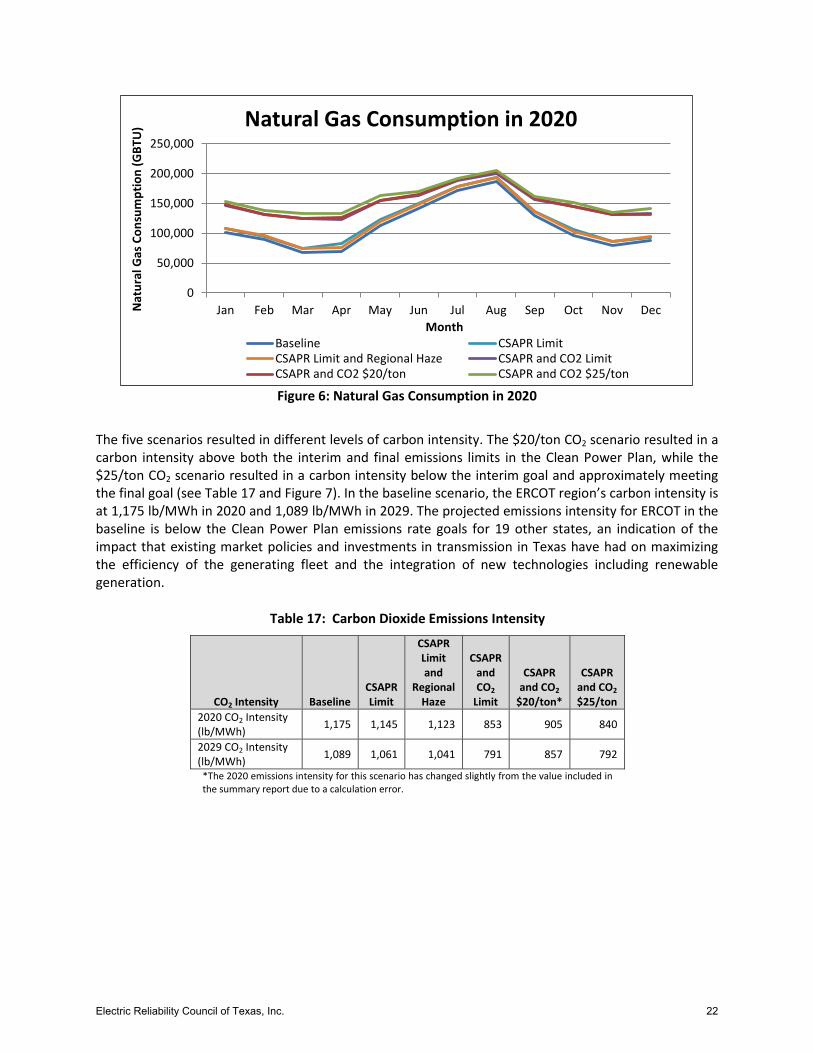
Table 17: Carbon Dioxide Emissions Intensity
CO2 Intensity Baseline CSAPR Limit
CSAPR Limit and
Regional Haze
CSAPR and CO2
Limit
CSAPR and CO2
$20/ton*
CSAPR and CO2 $25/ton
2020 CO2 Intensity (lb/MWh) 1,175 1,145 1,123 853 905 840
2029 CO2 Intensity (lb/MWh) 1,089 1,061 1,041 791 857 792
*The 2020 emissions intensity for this scenario has changed slightly from the value included in the summary report due to a calculation error.
Figure 6: Natural Gas Consumption in 2020
The five scenarios resulted in different levels of carbon intensity. The $20/ton CO2 scenario resulted in a carbon intensity above both the interim and final emissions limits in the Clean Power Plan, while the $25/ton CO2 scenario resulted in a carbon intensity below the interim goal and approximately meeting the final goal (see Table 17 and Figure 7). In the baseline scenario, the ERCOT region’s carbon intensity is at 1,175 lb/MWh in 2020 and 1,089 lb/MWh in 2029. The projected emissions intensity for ERCOT in the baseline is below the Clean Power Plan emissions rate goals for 19 other states, an indication of the impact that existing market policies and investments in transmission in Texas have had on maximizing the efficiency of the generating fleet and the integration of new technologies including renewable generation.
0
50,000
100,000
150,000
200,000
250,000
Jan Feb Mar Apr May Jun Jul Aug Sep Oct Nov DecNat
ural
Gas
Con
sum
ptio
n (G
BTU
)
Month
Natural Gas Consumption in 2020
Baseline CSAPR LimitCSAPR Limit and Regional Haze CSAPR and CO2 LimitCSAPR and CO2 $20/ton CSAPR and CO2 $25/ton
Electric Reliability Council of Texas, Inc. 22
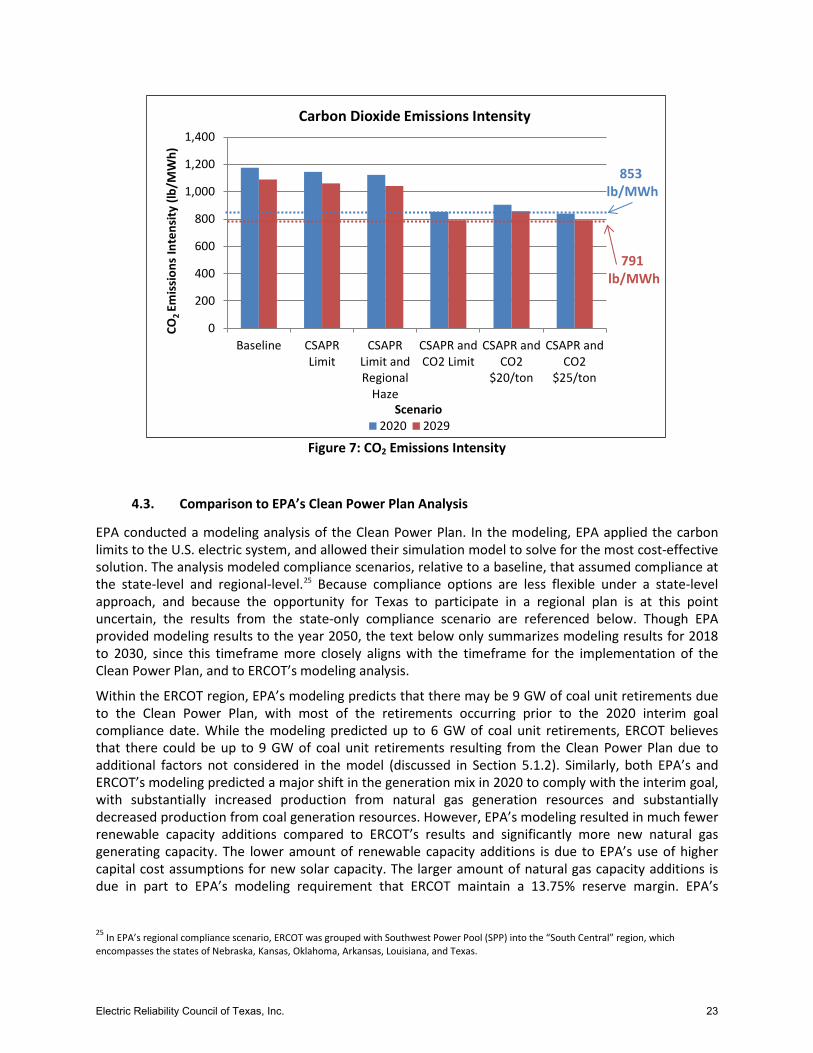
Figure 7: CO2 Emissions Intensity
4.3. Comparison to EPA’s Clean Power Plan Analysis
EPA conducted a modeling analysis of the Clean Power Plan. In the modeling, EPA applied the carbon limits to the U.S. electric system, and allowed their simulation model to solve for the most cost-effective solution. The analysis modeled compliance scenarios, relative to a baseline, that assumed compliance at the state-level and regional-level.25 Because compliance options are less flexible under a state-level approach, and because the opportunity for Texas to participate in a regional plan is at this point uncertain, the results from the state-only compliance scenario are referenced below. Though EPA provided modeling results to the year 2050, the text below only summarizes modeling results for 2018 to 2030, since this timeframe more closely aligns with the timeframe for the implementation of the Clean Power Plan, and to ERCOT’s modeling analysis.
Within the ERCOT region, EPA’s modeling predicts that there may be 9 GW of coal unit retirements due to the Clean Power Plan, with most of the retirements occurring prior to the 2020 interim goal compliance date. While the modeling predicted up to 6 GW of coal unit retirements, ERCOT believes that there could be up to 9 GW of coal unit retirements resulting from the Clean Power Plan due to additional factors not considered in the model (discussed in Section 5.1.2). Similarly, both EPA’s and ERCOT’s modeling predicted a major shift in the generation mix in 2020 to comply with the interim goal, with substantially increased production from natural gas generation resources and substantially decreased production from coal generation resources. However, EPA’s modeling resulted in much fewer renewable capacity additions compared to ERCOT’s results and significantly more new natural gas generating capacity. The lower amount of renewable capacity additions is due to EPA’s use of higher capital cost assumptions for new solar capacity. The larger amount of natural gas capacity additions is due in part to EPA’s modeling requirement that ERCOT maintain a 13.75% reserve margin. EPA’s
25 In EPA’s regional compliance scenario, ERCOT was grouped with Southwest Power Pool (SPP) into the “South Central” region, which encompasses the states of Nebraska, Kansas, Oklahoma, Arkansas, Louisiana, and Texas.
0
200
400
600
800
1,000
1,200
1,400
Baseline CSAPRLimit
CSAPRLimit andRegional
Haze
CSAPR andCO2 Limit
CSAPR andCO2
$20/ton
CSAPR andCO2
$25/ton
CO2
Emis
sion
s In
tens
ity (l
b/M
Wh)
Scenario
Carbon Dioxide Emissions Intensity
2020 2029
853 lb/MWh
791 lb/MWh
Electric Reliability Council of Texas, Inc. 23
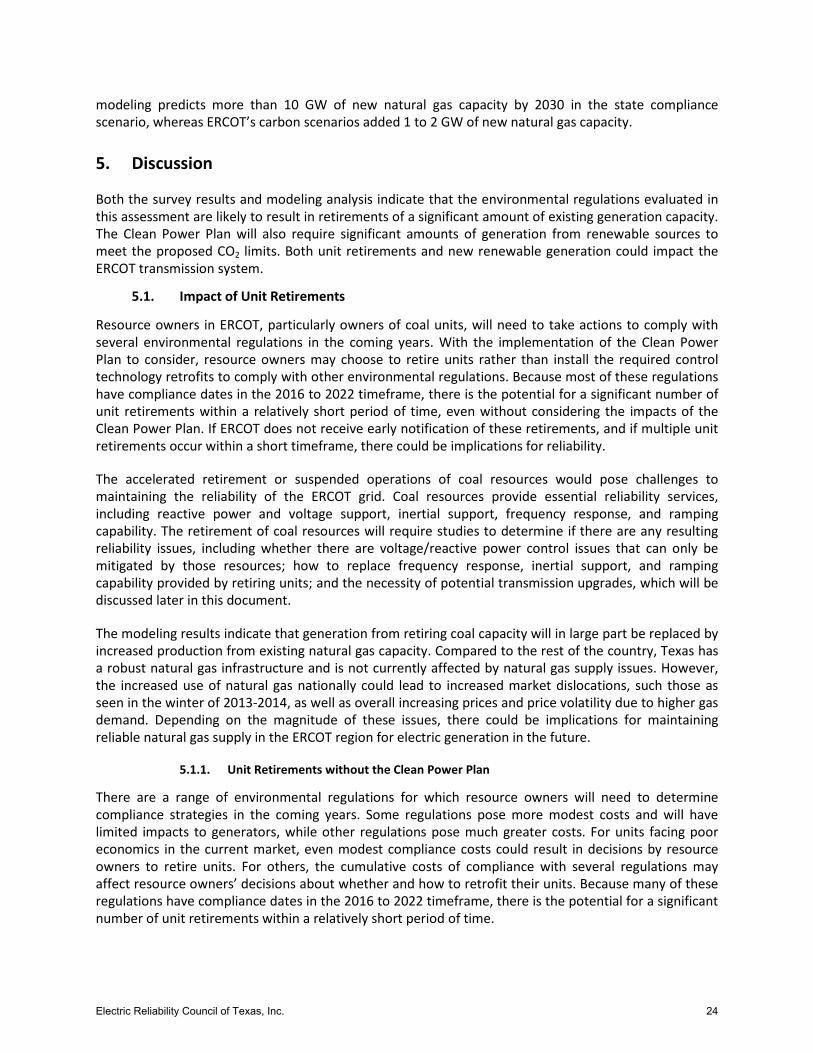
modeling predicts more than 10 GW of new natural gas capacity by 2030 in the state compliance scenario, whereas ERCOT’s carbon scenarios added 1 to 2 GW of new natural gas capacity.
5. Discussion
Both the survey results and modeling analysis indicate that the environmental regulations evaluated in this assessment are likely to result in retirements of a significant amount of existing generation capacity. The Clean Power Plan will also require significant amounts of generation from renewable sources to meet the proposed CO2 limits. Both unit retirements and new renewable generation could impact the ERCOT transmission system.
5.1. Impact of Unit Retirements
Resource owners in ERCOT, particularly owners of coal units, will need to take actions to comply with several environmental regulations in the coming years. With the implementation of the Clean Power Plan to consider, resource owners may choose to retire units rather than install the required control technology retrofits to comply with other environmental regulations. Because most of these regulations have compliance dates in the 2016 to 2022 timeframe, there is the potential for a significant number of unit retirements within a relatively short period of time, even without considering the impacts of the Clean Power Plan. If ERCOT does not receive early notification of these retirements, and if multiple unit retirements occur within a short timeframe, there could be implications for reliability.
The accelerated retirement or suspended operations of coal resources would pose challenges to maintaining the reliability of the ERCOT grid. Coal resources provide essential reliability services, including reactive power and voltage support, inertial support, frequency response, and ramping capability. The retirement of coal resources will require studies to determine if there are any resulting reliability issues, including whether there are voltage/reactive power control issues that can only be mitigated by those resources; how to replace frequency response, inertial support, and ramping capability provided by retiring units; and the necessity of potential transmission upgrades, which will be discussed later in this document.
The modeling results indicate that generation from retiring coal capacity will in large part be replaced by increased production from existing natural gas capacity. Compared to the rest of the country, Texas has a robust natural gas infrastructure and is not currently affected by natural gas supply issues. However, the increased use of natural gas nationally could lead to increased market dislocations, such those as seen in the winter of 2013-2014, as well as overall increasing prices and price volatility due to higher gas demand. Depending on the magnitude of these issues, there could be implications for maintaining reliable natural gas supply in the ERCOT region for electric generation in the future.
Unit Retirements without the Clean Power Plan 5.1.1.
There are a range of environmental regulations for which resource owners will need to determine compliance strategies in the coming years. Some regulations pose more modest costs and will have limited impacts to generators, while other regulations pose much greater costs. For units facing poor economics in the current market, even modest compliance costs could result in decisions by resource owners to retire units. For others, the cumulative costs of compliance with several regulations may affect resource owners’ decisions about whether and how to retrofit their units. Because many of these regulations have compliance dates in the 2016 to 2022 timeframe, there is the potential for a significant number of unit retirements within a relatively short period of time.
Electric Reliability Council of Texas, Inc. 24
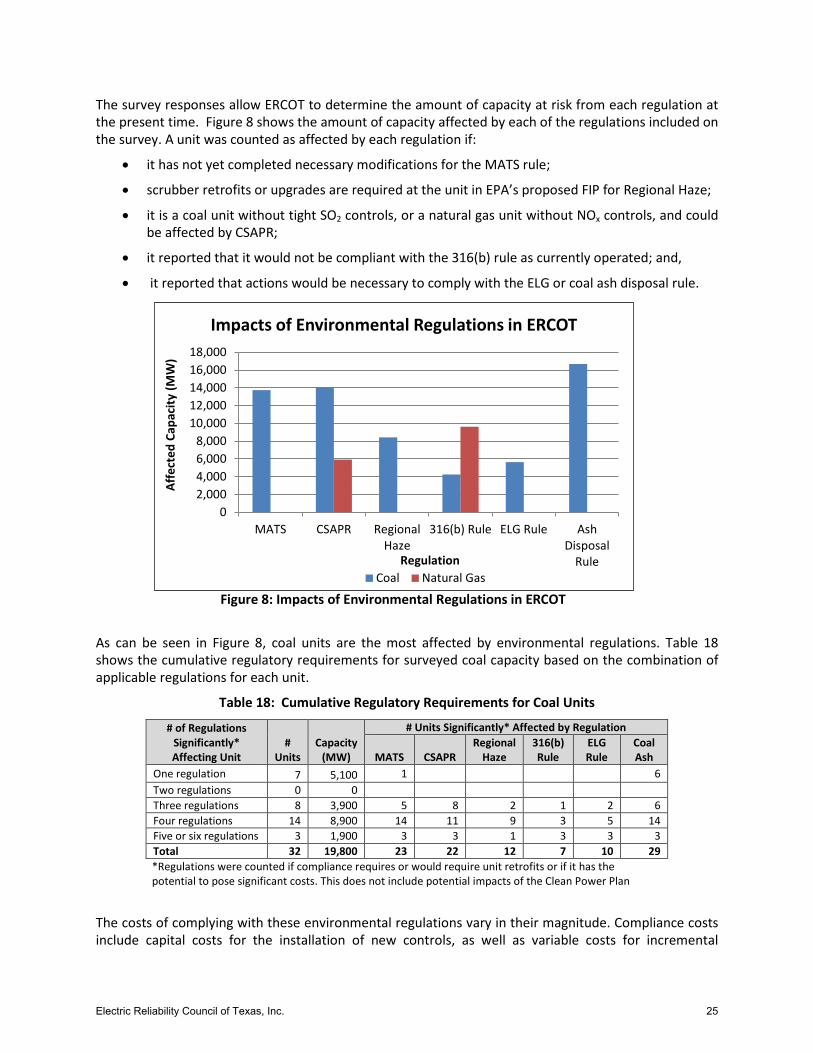
The survey responses allow ERCOT to determine the amount of capacity at risk from each regulation at the present time. Figure 8 shows the amount of capacity affected by each of the regulations included on the survey. A unit was counted as affected by each regulation if:
• it has not yet completed necessary modifications for the MATS rule;
• scrubber retrofits or upgrades are required at the unit in EPA’s proposed FIP for Regional Haze;
• it is a coal unit without tight SO2 controls, or a natural gas unit without NOx controls, and could be affected by CSAPR;
• it reported that it would not be compliant with the 316(b) rule as currently operated; and,
• it reported that actions would be necessary to comply with the ELG or coal ash disposal rule.
As can be seen in Figure 8, coal units are the most affected by environmental regulations. Table 18 shows the cumulative regulatory requirements for surveyed coal capacity based on the combination of applicable regulations for each unit.
Table 18: Cumulative Regulatory Requirements for Coal Units
# of Regulations Significantly* Affecting Unit
# Units
Capacity (MW)
# Units Significantly* Affected by Regulation
MATS CSAPR Regional
Haze 316(b) Rule
ELG Rule
Coal Ash
One regulation 7 5,100 1 6 Two regulations 0 0 Three regulations 8 3,900 5 8 2 1 2 6 Four regulations 14 8,900 14 11 9 3 5 14 Five or six regulations 3 1,900 3 3 1 3 3 3 Total 32 19,800 23 22 12 7 10 29 *Regulations were counted if compliance requires or would require unit retrofits or if it has the potential to pose significant costs. This does not include potential impacts of the Clean Power Plan
The costs of complying with these environmental regulations vary in their magnitude. Compliance costs include capital costs for the installation of new controls, as well as variable costs for incremental
Figure 8: Impacts of Environmental Regulations in ERCOT
02,0004,0006,0008,000
10,00012,00014,00016,00018,000
MATS CSAPR RegionalHaze
316(b) Rule ELG Rule AshDisposal
Rule
Affe
cted
Cap
acity
(MW
)
Regulation
Impacts of Environmental Regulations in ERCOT
Coal Natural Gas
Electric Reliability Council of Texas, Inc. 25
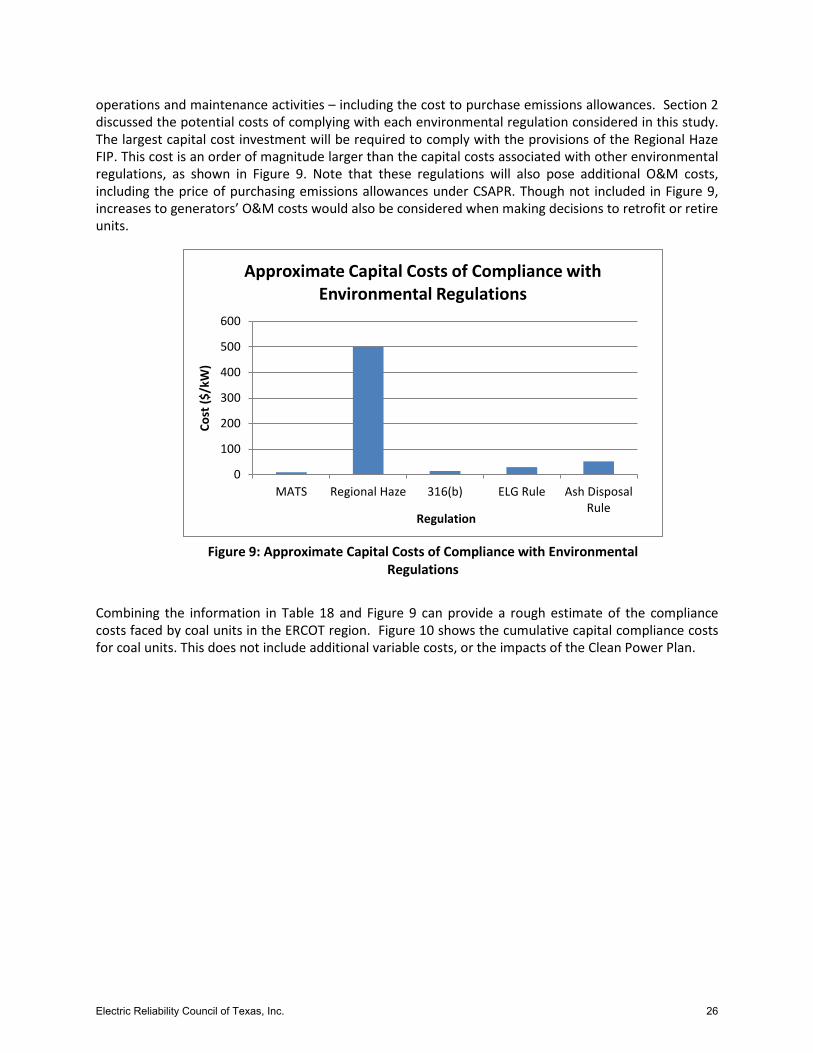
operations and maintenance activities – including the cost to purchase emissions allowances. Section 2 discussed the potential costs of complying with each environmental regulation considered in this study. The largest capital cost investment will be required to comply with the provisions of the Regional Haze FIP. This cost is an order of magnitude larger than the capital costs associated with other environmental regulations, as shown in Figure 9. Note that these regulations will also pose additional O&M costs, including the price of purchasing emissions allowances under CSAPR. Though not included in Figure 9, increases to generators’ O&M costs would also be considered when making decisions to retrofit or retire units.
Combining the information in Table 18 and Figure 9 can provide a rough estimate of the compliance costs faced by coal units in the ERCOT region. Figure 10 shows the cumulative capital compliance costs for coal units. This does not include additional variable costs, or the impacts of the Clean Power Plan.
0
100
200
300
400
500
600
MATS Regional Haze 316(b) ELG Rule Ash DisposalRule
Cost
($/k
W)
Regulation
Approximate Capital Costs of Compliance with Environmental Regulations
Figure 9: Approximate Capital Costs of Compliance with Environmental Regulations
Electric Reliability Council of Texas, Inc. 26
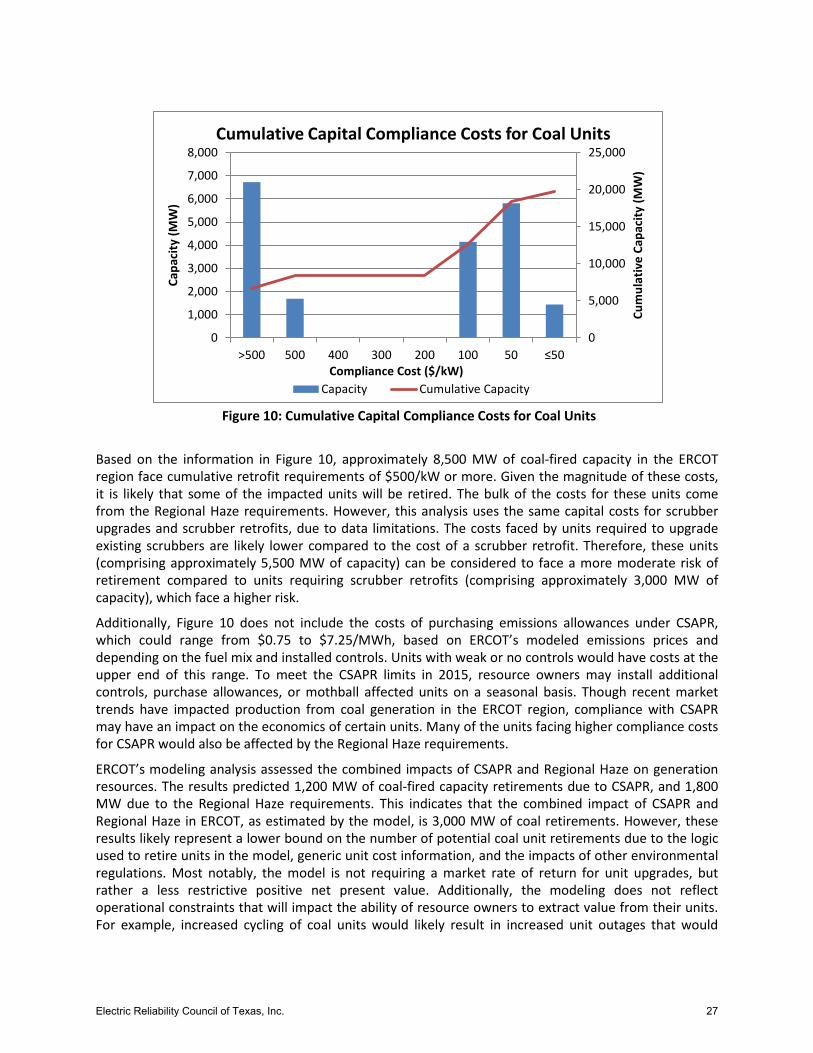
Based on the information in Figure 10, approximately 8,500 MW of coal-fired capacity in the ERCOT region face cumulative retrofit requirements of $500/kW or more. Given the magnitude of these costs, it is likely that some of the impacted units will be retired. The bulk of the costs for these units come from the Regional Haze requirements. However, this analysis uses the same capital costs for scrubber upgrades and scrubber retrofits, due to data limitations. The costs faced by units required to upgrade existing scrubbers are likely lower compared to the cost of a scrubber retrofit. Therefore, these units (comprising approximately 5,500 MW of capacity) can be considered to face a more moderate risk of retirement compared to units requiring scrubber retrofits (comprising approximately 3,000 MW of capacity), which face a higher risk.
Additionally, Figure 10 does not include the costs of purchasing emissions allowances under CSAPR, which could range from $0.75 to $7.25/MWh, based on ERCOT’s modeled emissions prices and depending on the fuel mix and installed controls. Units with weak or no controls would have costs at the upper end of this range. To meet the CSAPR limits in 2015, resource owners may install additional controls, purchase allowances, or mothball affected units on a seasonal basis. Though recent market trends have impacted production from coal generation in the ERCOT region, compliance with CSAPR may have an impact on the economics of certain units. Many of the units facing higher compliance costs for CSAPR would also be affected by the Regional Haze requirements.
ERCOT’s modeling analysis assessed the combined impacts of CSAPR and Regional Haze on generation resources. The results predicted 1,200 MW of coal-fired capacity retirements due to CSAPR, and 1,800 MW due to the Regional Haze requirements. This indicates that the combined impact of CSAPR and Regional Haze in ERCOT, as estimated by the model, is 3,000 MW of coal retirements. However, these results likely represent a lower bound on the number of potential coal unit retirements due to the logic used to retire units in the model, generic unit cost information, and the impacts of other environmental regulations. Most notably, the model is not requiring a market rate of return for unit upgrades, but rather a less restrictive positive net present value. Additionally, the modeling does not reflect operational constraints that will impact the ability of resource owners to extract value from their units. For example, increased cycling of coal units would likely result in increased unit outages that would
Figure 10: Cumulative Capital Compliance Costs for Coal Units
0
5,000
10,000
15,000
20,000
25,000
0
1,000
2,000
3,000
4,000
5,000
6,000
7,000
8,000
>500 500 400 300 200 100 50 ≤50
Cum
ulat
ive
Capa
city
(MW
)
Capa
city
(MW
)
Compliance Cost ($/kW)
Cumulative Capital Compliance Costs for Coal Units
Capacity Cumulative Capacity
Electric Reliability Council of Texas, Inc. 27
impact the economics of these units. Given these operational constraints, it is likely that there may be additional coal capacity in the ERCOT region that would also retire due to Regional Haze.
Compared to Regional Haze and CSAPR, the other environmental regulations are expected to affect the economics of at most a small number of units and thus are not expected to have a significant system-wide impact. Coal and natural gas units facing compliance with these other regulations thus have a relatively low risk of retirement. Even so, it is possible that resource owners of units facing poor economics may choose to retire rather than retrofit impacted units. For example, owners of older gas steam units with lower capacity factors may choose to retire the units rather than install controls for the 316(b) rule if significant capital investments are required.
Unit Retirements with the Clean Power Plan 5.1.2.
The Clean Power Plan is likely to result in coal unit retirements, due to the need to meet stringent CO2 emissions limits on a state-wide basis. However, the Clean Power Plan will also impact decisions resource owners make about investments to comply with the other environmental regulations, several of which have compliance deadlines in the 2016 to 2022 timeframe. This raises the potential for a significant number of unit retirements within a relatively short period of time.
As noted in Section 5.1.1, 3,000 to 8,500 MW of coal capacity faces a moderate to high risk of retirement due to the Regional Haze requirements. It is likely that some amount of this capacity would retire, even without considering the impacts of the Clean Power Plan. However, in the context of eventual compliance with CO2 regulations, retrofitting coal units facing significant compliance requirements becomes less economic. Resource owners may be reticent to make significant capital investments, especially for coal units that are not already relatively well-controlled.
ERCOT’s modeling results predicted between 3,300 and 5,700 MW of coal unit retirements incremental to the baseline in the scenarios with CSAPR and the Clean Power Plan. As discussed in Section 5.1.1, ERCOT believes that the modeled retirements represent a lower bound on the number of potential coal unit retirements. ERCOT directed the model to retire capacity at the point when generic operating and fixed costs exceed revenues. However, in the modeling results for the scenarios with the Clean Power Plan, there are several units operating at low revenues and/or low capacity factors that would likely be retired, especially when other non-modeled factors are taken into account. Based on a review of capacity factors and operating revenues for the remaining coal units, ERCOT anticipates the retirement of an additional 2,000 MW of coal capacity and the seasonal mothball of 1,000 MW of coal capacity beyond what is specified in the model output, compared to the CSAPR and $25/ton CO2 modeled scenario. These results indicate the overall impact of CSAPR, Regional Haze, the Clean Power Plan, and other environmental regulations to the current coal fleet will be the retirement or seasonal mothballing of between 3,300 MW and 8,700 MW of capacity.
The model also predicted the retirement of 1,300 to 1,600 MW of natural gas steam capacity in the Clean Power Plan scenarios, which is less than the 2,000 MW retired in the baseline scenario. The fewer retirements of natural gas steam units in the carbon scenarios reflects the impact of both the CSAPR and carbon dioxide limits on production from coal units, which improves the economics of natural gas steam units during this period. However, as with coal resources, there are a number of factors that may result in additional natural gas steam unit retirements compared to those found by the model. ERCOT estimates that an additional 1,500 to 4,500 MW of natural gas steam capacity may be at risk of retirement based on low net revenues in the model results combined with the need to comply with the 316(b) rule, CSAPR, and other environmental regulations.
Electric Reliability Council of Texas, Inc. 28
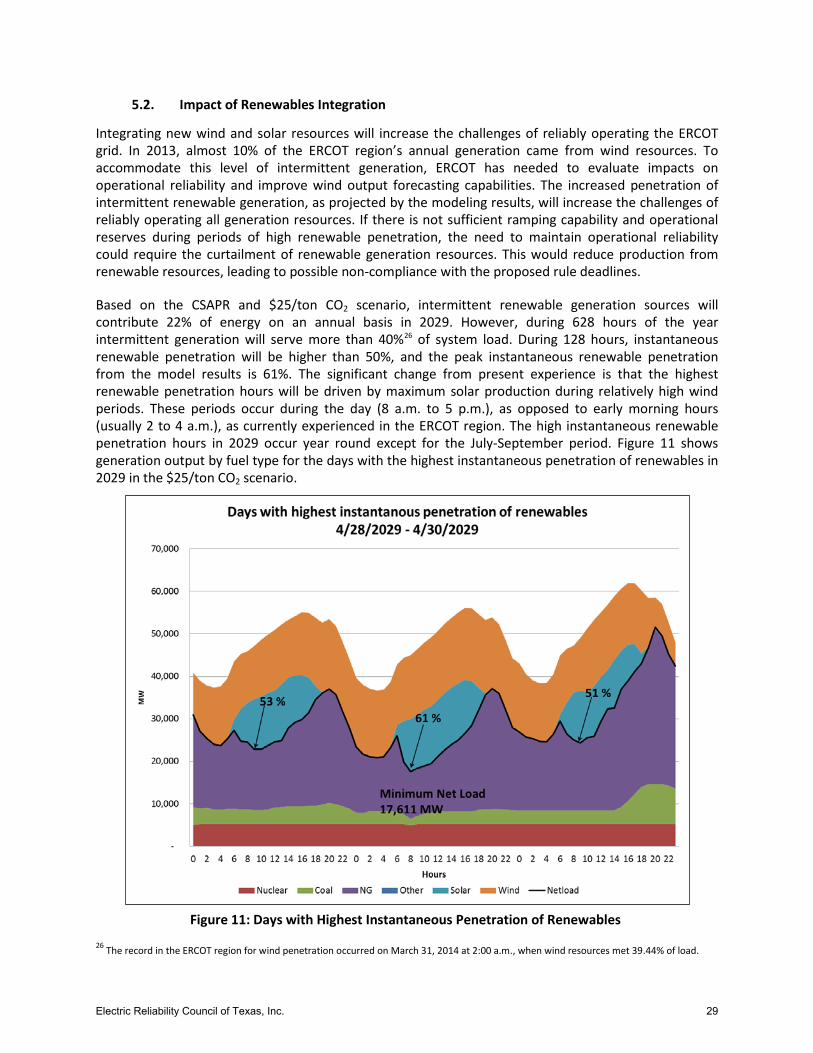
5.2. Impact of Renewables Integration
Integrating new wind and solar resources will increase the challenges of reliably operating the ERCOT grid. In 2013, almost 10% of the ERCOT region’s annual generation came from wind resources. To accommodate this level of intermittent generation, ERCOT has needed to evaluate impacts on operational reliability and improve wind output forecasting capabilities. The increased penetration of intermittent renewable generation, as projected by the modeling results, will increase the challenges of reliably operating all generation resources. If there is not sufficient ramping capability and operational reserves during periods of high renewable penetration, the need to maintain operational reliability could require the curtailment of renewable generation resources. This would reduce production from renewable resources, leading to possible non-compliance with the proposed rule deadlines.
Based on the CSAPR and $25/ton CO2 scenario, intermittent renewable generation sources will contribute 22% of energy on an annual basis in 2029. However, during 628 hours of the year intermittent generation will serve more than 40%26 of system load. During 128 hours, instantaneous renewable penetration will be higher than 50%, and the peak instantaneous renewable penetration from the model results is 61%. The significant change from present experience is that the highest renewable penetration hours will be driven by maximum solar production during relatively high wind periods. These periods occur during the day (8 a.m. to 5 p.m.), as opposed to early morning hours (usually 2 to 4 a.m.), as currently experienced in the ERCOT region. The high instantaneous renewable penetration hours in 2029 occur year round except for the July-September period. Figure 11 shows generation output by fuel type for the days with the highest instantaneous penetration of renewables in 2029 in the $25/ton CO2 scenario.
26 The record in the ERCOT region for wind penetration occurred on March 31, 2014 at 2:00 a.m., when wind resources met 39.44% of load.
Figure 11: Days with Highest Instantaneous Penetration of Renewables
Electric Reliability Council of Texas, Inc. 29
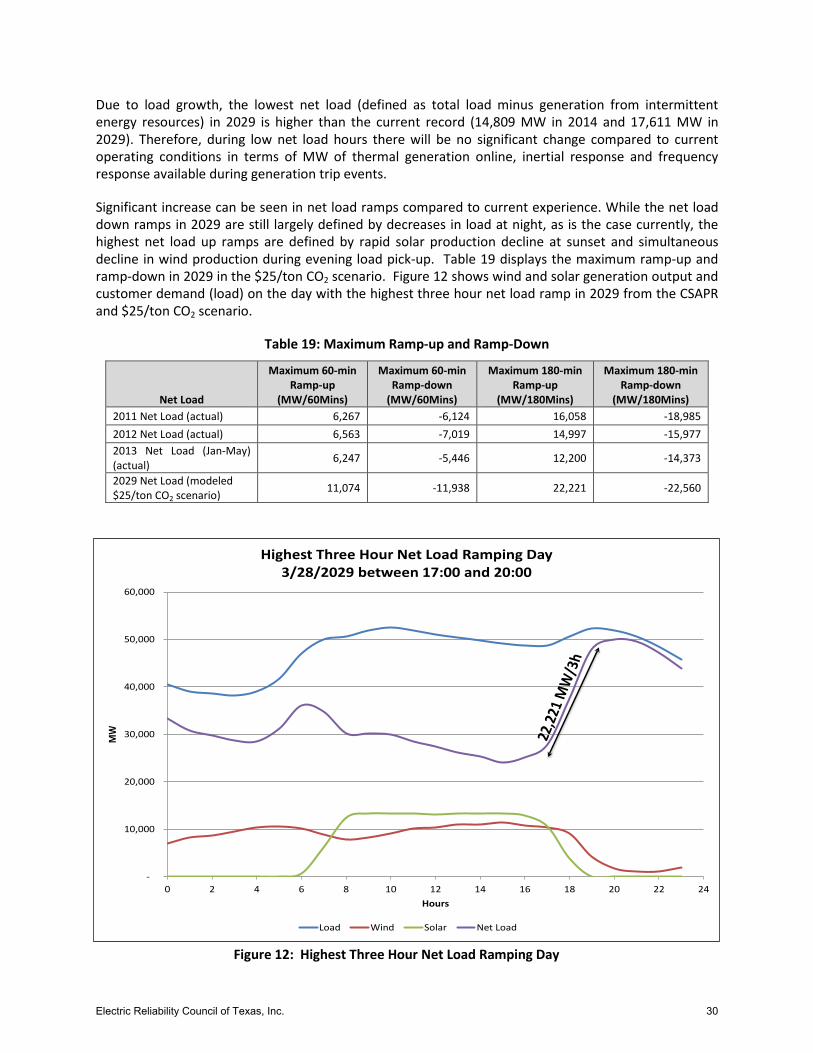
Due to load growth, the lowest net load (defined as total load minus generation from intermittent energy resources) in 2029 is higher than the current record (14,809 MW in 2014 and 17,611 MW in 2029). Therefore, during low net load hours there will be no significant change compared to current operating conditions in terms of MW of thermal generation online, inertial response and frequency response available during generation trip events.
Significant increase can be seen in net load ramps compared to current experience. While the net load down ramps in 2029 are still largely defined by decreases in load at night, as is the case currently, the highest net load up ramps are defined by rapid solar production decline at sunset and simultaneous decline in wind production during evening load pick-up. Table 19 displays the maximum ramp-up and ramp-down in 2029 in the $25/ton CO2 scenario. Figure 12 shows wind and solar generation output and customer demand (load) on the day with the highest three hour net load ramp in 2029 from the CSAPR and $25/ton CO2 scenario.
Table 19: Maximum Ramp-up and Ramp-Down
Net Load
Maximum 60-min Ramp-up
(MW/60Mins)
Maximum 60-min Ramp-down
(MW/60Mins)
Maximum 180-min Ramp-up
(MW/180Mins)
Maximum 180-min Ramp-down
(MW/180Mins) 2011 Net Load (actual) 6,267 -6,124 16,058 -18,985 2012 Net Load (actual) 6,563 -7,019 14,997 -15,977 2013 Net Load (Jan-May) (actual) 6,247 -5,446 12,200 -14,373
2029 Net Load (modeled $25/ton CO2 scenario) 11,074 -11,938 22,221 -22,560
-
10,000
20,000
30,000
40,000
50,000
60,000
0 2 4 6 8 10 12 14 16 18 20 22 24
MW
Hours
Highest Three Hour Net Load Ramping Day3/28/2029 between 17:00 and 20:00
Load Wind Solar Net Load
Figure 12: Highest Three Hour Net Load Ramping Day
Electric Reliability Council of Texas, Inc. 30
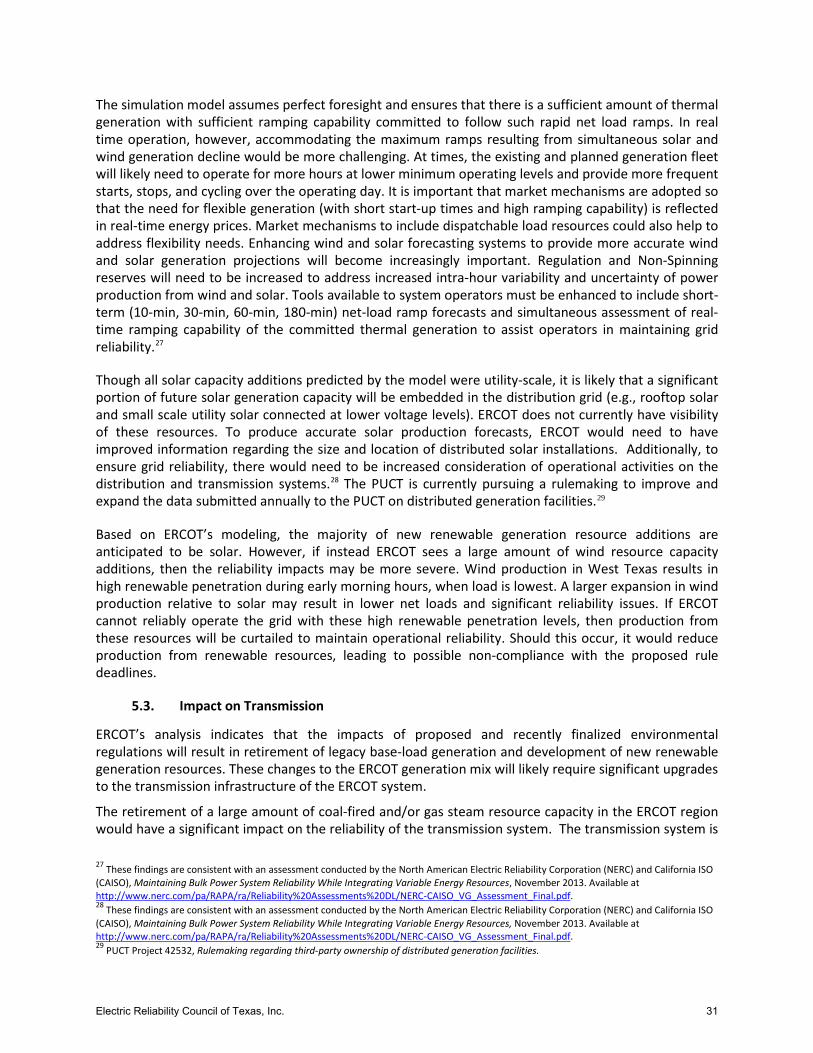
The simulation model assumes perfect foresight and ensures that there is a sufficient amount of thermal generation with sufficient ramping capability committed to follow such rapid net load ramps. In real time operation, however, accommodating the maximum ramps resulting from simultaneous solar and wind generation decline would be more challenging. At times, the existing and planned generation fleet will likely need to operate for more hours at lower minimum operating levels and provide more frequent starts, stops, and cycling over the operating day. It is important that market mechanisms are adopted so that the need for flexible generation (with short start-up times and high ramping capability) is reflected in real-time energy prices. Market mechanisms to include dispatchable load resources could also help to address flexibility needs. Enhancing wind and solar forecasting systems to provide more accurate wind and solar generation projections will become increasingly important. Regulation and Non-Spinning reserves will need to be increased to address increased intra-hour variability and uncertainty of power production from wind and solar. Tools available to system operators must be enhanced to include short-term (10-min, 30-min, 60-min, 180-min) net-load ramp forecasts and simultaneous assessment of real-time ramping capability of the committed thermal generation to assist operators in maintaining grid reliability.27
Though all solar capacity additions predicted by the model were utility-scale, it is likely that a significant portion of future solar generation capacity will be embedded in the distribution grid (e.g., rooftop solar and small scale utility solar connected at lower voltage levels). ERCOT does not currently have visibility of these resources. To produce accurate solar production forecasts, ERCOT would need to have improved information regarding the size and location of distributed solar installations. Additionally, to ensure grid reliability, there would need to be increased consideration of operational activities on the distribution and transmission systems.28 The PUCT is currently pursuing a rulemaking to improve and expand the data submitted annually to the PUCT on distributed generation facilities.29
Based on ERCOT’s modeling, the majority of new renewable generation resource additions are anticipated to be solar. However, if instead ERCOT sees a large amount of wind resource capacity additions, then the reliability impacts may be more severe. Wind production in West Texas results in high renewable penetration during early morning hours, when load is lowest. A larger expansion in wind production relative to solar may result in lower net loads and significant reliability issues. If ERCOT cannot reliably operate the grid with these high renewable penetration levels, then production from these resources will be curtailed to maintain operational reliability. Should this occur, it would reduce production from renewable resources, leading to possible non-compliance with the proposed rule deadlines.
5.3. Impact on Transmission
ERCOT’s analysis indicates that the impacts of proposed and recently finalized environmental regulations will result in retirement of legacy base-load generation and development of new renewable generation resources. These changes to the ERCOT generation mix will likely require significant upgrades to the transmission infrastructure of the ERCOT system.
The retirement of a large amount of coal-fired and/or gas steam resource capacity in the ERCOT region would have a significant impact on the reliability of the transmission system. The transmission system is
27 These findings are consistent with an assessment conducted by the North American Electric Reliability Corporation (NERC) and California ISO (CAISO), Maintaining Bulk Power System Reliability While Integrating Variable Energy Resources, November 2013. Available at http://www.nerc.com/pa/RAPA/ra/Reliability%20Assessments%20DL/NERC-CAISO_VG_Assessment_Final.pdf. 28 These findings are consistent with an assessment conducted by the North American Electric Reliability Corporation (NERC) and California ISO (CAISO), Maintaining Bulk Power System Reliability While Integrating Variable Energy Resources, November 2013. Available at http://www.nerc.com/pa/RAPA/ra/Reliability%20Assessments%20DL/NERC-CAISO_VG_Assessment_Final.pdf. 29 PUCT Project 42532, Rulemaking regarding third-party ownership of distributed generation facilities.
Electric Reliability Council of Texas, Inc. 31
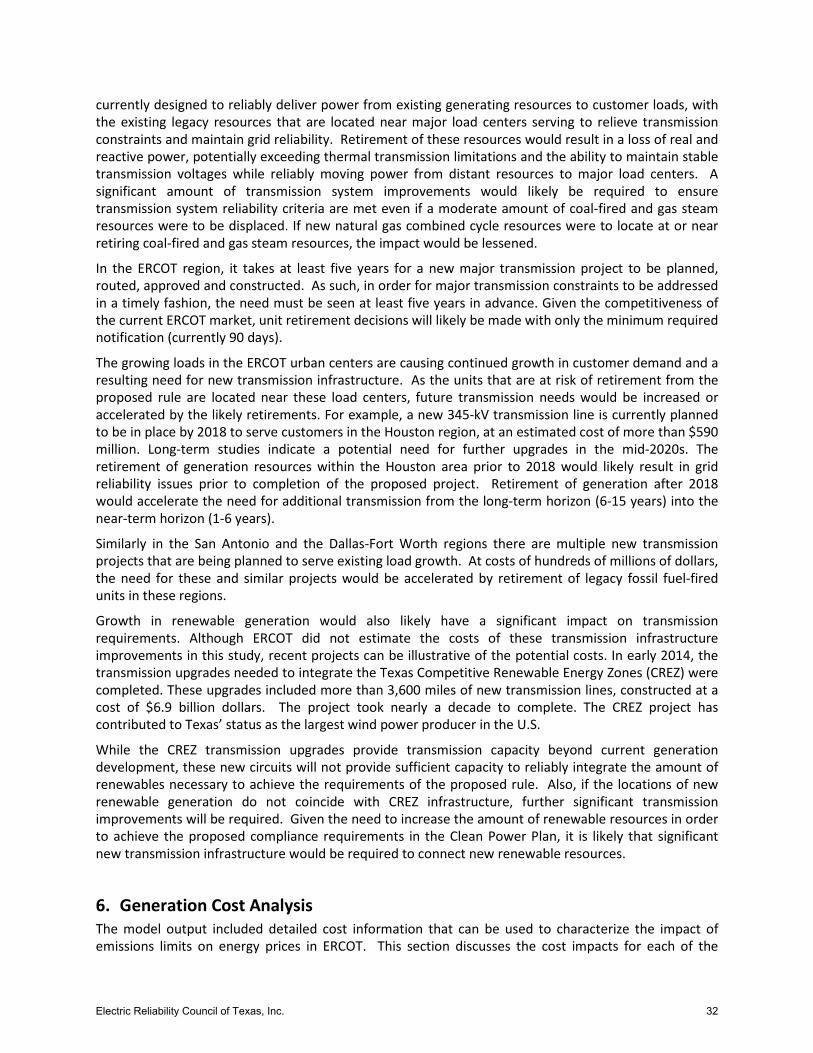
currently designed to reliably deliver power from existing generating resources to customer loads, with the existing legacy resources that are located near major load centers serving to relieve transmission constraints and maintain grid reliability. Retirement of these resources would result in a loss of real and reactive power, potentially exceeding thermal transmission limitations and the ability to maintain stable transmission voltages while reliably moving power from distant resources to major load centers. A significant amount of transmission system improvements would likely be required to ensure transmission system reliability criteria are met even if a moderate amount of coal-fired and gas steam resources were to be displaced. If new natural gas combined cycle resources were to locate at or near retiring coal-fired and gas steam resources, the impact would be lessened.
In the ERCOT region, it takes at least five years for a new major transmission project to be planned, routed, approved and constructed. As such, in order for major transmission constraints to be addressed in a timely fashion, the need must be seen at least five years in advance. Given the competitiveness of the current ERCOT market, unit retirement decisions will likely be made with only the minimum required notification (currently 90 days).
The growing loads in the ERCOT urban centers are causing continued growth in customer demand and a resulting need for new transmission infrastructure. As the units that are at risk of retirement from the proposed rule are located near these load centers, future transmission needs would be increased or accelerated by the likely retirements. For example, a new 345-kV transmission line is currently planned to be in place by 2018 to serve customers in the Houston region, at an estimated cost of more than $590 million. Long-term studies indicate a potential need for further upgrades in the mid-2020s. The retirement of generation resources within the Houston area prior to 2018 would likely result in grid reliability issues prior to completion of the proposed project. Retirement of generation after 2018 would accelerate the need for additional transmission from the long-term horizon (6-15 years) into the near-term horizon (1-6 years).
Similarly in the San Antonio and the Dallas-Fort Worth regions there are multiple new transmission projects that are being planned to serve existing load growth. At costs of hundreds of millions of dollars, the need for these and similar projects would be accelerated by retirement of legacy fossil fuel-fired units in these regions.
Growth in renewable generation would also likely have a significant impact on transmission requirements. Although ERCOT did not estimate the costs of these transmission infrastructure improvements in this study, recent projects can be illustrative of the potential costs. In early 2014, the transmission upgrades needed to integrate the Texas Competitive Renewable Energy Zones (CREZ) were completed. These upgrades included more than 3,600 miles of new transmission lines, constructed at a cost of $6.9 billion dollars. The project took nearly a decade to complete. The CREZ project has contributed to Texas’ status as the largest wind power producer in the U.S.
While the CREZ transmission upgrades provide transmission capacity beyond current generation development, these new circuits will not provide sufficient capacity to reliably integrate the amount of renewables necessary to achieve the requirements of the proposed rule. Also, if the locations of new renewable generation do not coincide with CREZ infrastructure, further significant transmission improvements will be required. Given the need to increase the amount of renewable resources in order to achieve the proposed compliance requirements in the Clean Power Plan, it is likely that significant new transmission infrastructure would be required to connect new renewable resources.
6. Generation Cost Analysis The model output included detailed cost information that can be used to characterize the impact of emissions limits on energy prices in ERCOT. This section discusses the cost impacts for each of the
Electric Reliability Council of Texas, Inc. 32
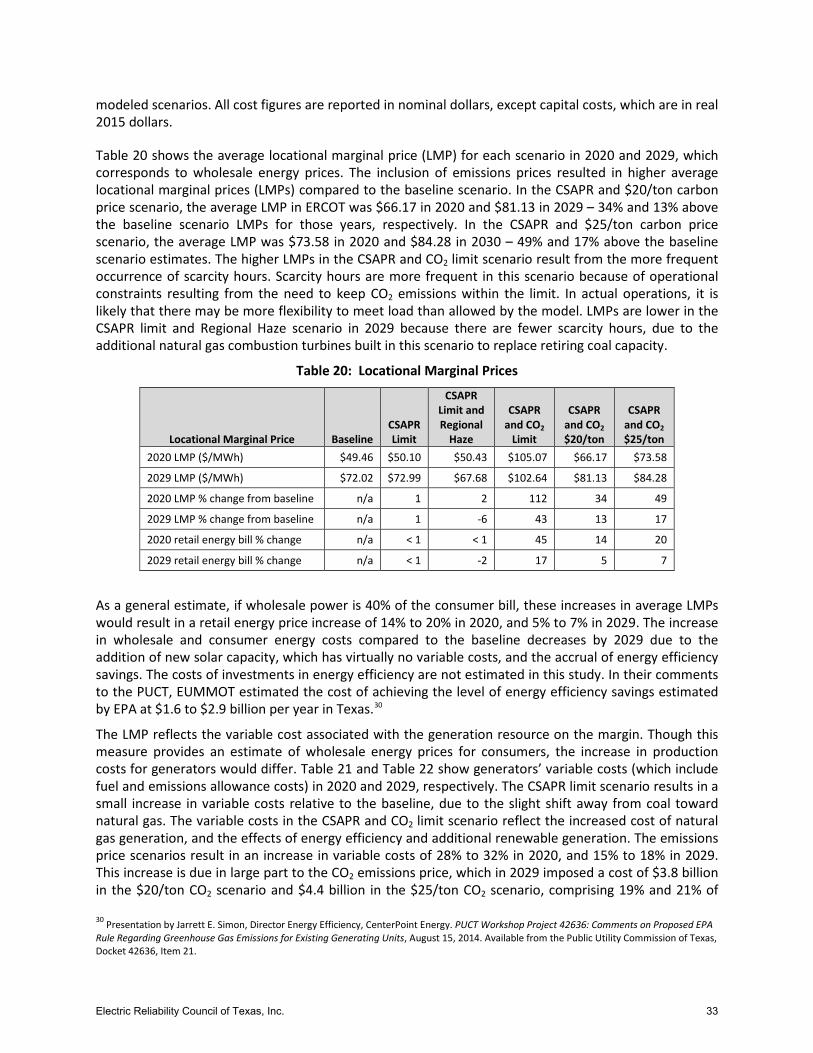
modeled scenarios. All cost figures are reported in nominal dollars, except capital costs, which are in real 2015 dollars.
Table 20 shows the average locational marginal price (LMP) for each scenario in 2020 and 2029, which corresponds to wholesale energy prices. The inclusion of emissions prices resulted in higher average locational marginal prices (LMPs) compared to the baseline scenario. In the CSAPR and $20/ton carbon price scenario, the average LMP in ERCOT was $66.17 in 2020 and $81.13 in 2029 – 34% and 13% above the baseline scenario LMPs for those years, respectively. In the CSAPR and $25/ton carbon price scenario, the average LMP was $73.58 in 2020 and $84.28 in 2030 – 49% and 17% above the baseline scenario estimates. The higher LMPs in the CSAPR and CO2 limit scenario result from the more frequent occurrence of scarcity hours. Scarcity hours are more frequent in this scenario because of operational constraints resulting from the need to keep CO2 emissions within the limit. In actual operations, it is likely that there may be more flexibility to meet load than allowed by the model. LMPs are lower in the CSAPR limit and Regional Haze scenario in 2029 because there are fewer scarcity hours, due to the additional natural gas combustion turbines built in this scenario to replace retiring coal capacity.
Table 20: Locational Marginal Prices
Locational Marginal Price Baseline CSAPR Limit
CSAPR Limit and Regional
Haze
CSAPR and CO2
Limit
CSAPR and CO2 $20/ton
CSAPR and CO2 $25/ton
2020 LMP ($/MWh) $49.46 $50.10 $50.43 $105.07 $66.17 $73.58
2029 LMP ($/MWh) $72.02 $72.99 $67.68 $102.64 $81.13 $84.28
2020 LMP % change from baseline n/a 1 2 112 34 49
2029 LMP % change from baseline n/a 1 -6 43 13 17
2020 retail energy bill % change n/a < 1 < 1 45 14 20
2029 retail energy bill % change n/a < 1 -2 17 5 7
As a general estimate, if wholesale power is 40% of the consumer bill, these increases in average LMPs would result in a retail energy price increase of 14% to 20% in 2020, and 5% to 7% in 2029. The increase in wholesale and consumer energy costs compared to the baseline decreases by 2029 due to the addition of new solar capacity, which has virtually no variable costs, and the accrual of energy efficiency savings. The costs of investments in energy efficiency are not estimated in this study. In their comments to the PUCT, EUMMOT estimated the cost of achieving the level of energy efficiency savings estimated by EPA at $1.6 to $2.9 billion per year in Texas.30
The LMP reflects the variable cost associated with the generation resource on the margin. Though this measure provides an estimate of wholesale energy prices for consumers, the increase in production costs for generators would differ. Table 21 and Table 22 show generators’ variable costs (which include fuel and emissions allowance costs) in 2020 and 2029, respectively. The CSAPR limit scenario results in a small increase in variable costs relative to the baseline, due to the slight shift away from coal toward natural gas. The variable costs in the CSAPR and CO2 limit scenario reflect the increased cost of natural gas generation, and the effects of energy efficiency and additional renewable generation. The emissions price scenarios result in an increase in variable costs of 28% to 32% in 2020, and 15% to 18% in 2029. This increase is due in large part to the CO2 emissions price, which in 2029 imposed a cost of $3.8 billion in the $20/ton CO2 scenario and $4.4 billion in the $25/ton CO2 scenario, comprising 19% and 21% of
30 Presentation by Jarrett E. Simon, Director Energy Efficiency, CenterPoint Energy. PUCT Workshop Project 42636: Comments on Proposed EPA Rule Regarding Greenhouse Gas Emissions for Existing Generating Units, August 15, 2014. Available from the Public Utility Commission of Texas, Docket 42636, Item 21.
Electric Reliability Council of Texas, Inc. 33
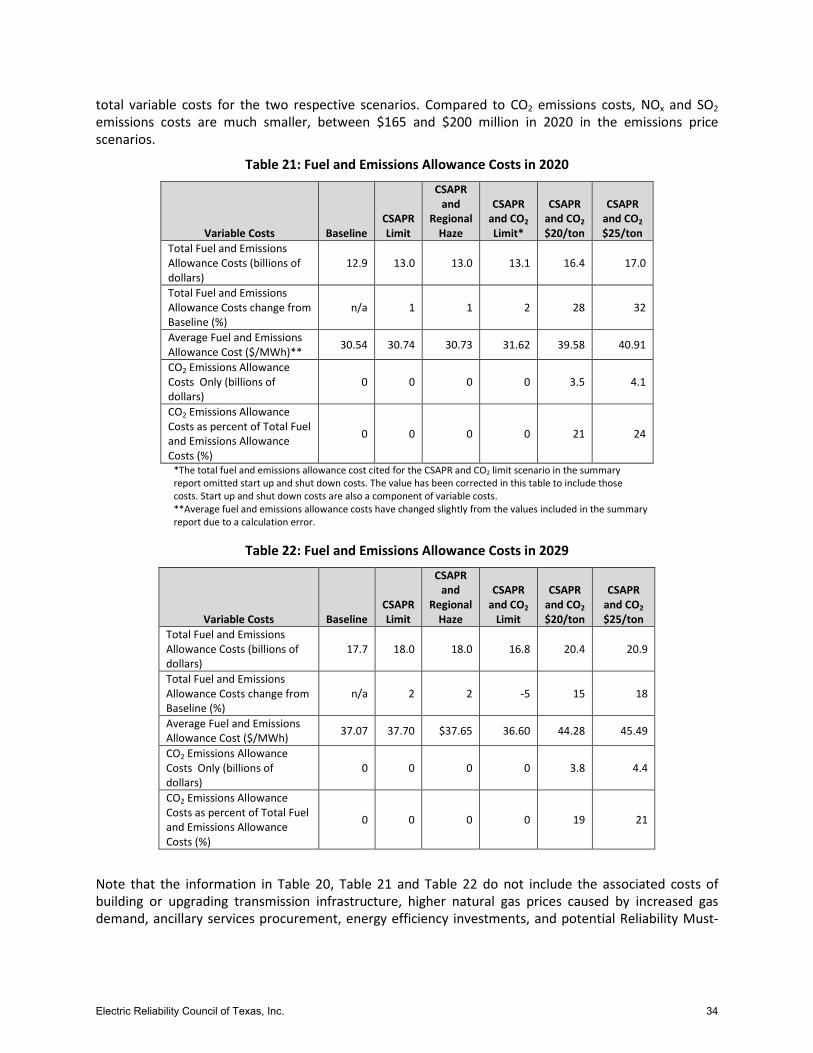
total variable costs for the two respective scenarios. Compared to CO2 emissions costs, NOx and SO2 emissions costs are much smaller, between $165 and $200 million in 2020 in the emissions price scenarios.
Table 21: Fuel and Emissions Allowance Costs in 2020
Variable Costs Baseline CSAPR Limit
CSAPR and
Regional Haze
CSAPR and CO2 Limit*
CSAPR and CO2 $20/ton
CSAPR and CO2 $25/ton
Total Fuel and Emissions Allowance Costs (billions of dollars)
12.9 13.0 13.0 13.1 16.4 17.0
Total Fuel and Emissions Allowance Costs change from Baseline (%)
n/a 1 1 2 28 32
Average Fuel and Emissions Allowance Cost ($/MWh)** 30.54 30.74 30.73 31.62 39.58 40.91
CO2 Emissions Allowance Costs Only (billions of dollars)
0 0 0 0 3.5 4.1
CO2 Emissions Allowance Costs as percent of Total Fuel and Emissions Allowance Costs (%)
0 0 0 0 21 24
*The total fuel and emissions allowance cost cited for the CSAPR and CO2 limit scenario in the summary report omitted start up and shut down costs. The value has been corrected in this table to include those costs. Start up and shut down costs are also a component of variable costs. **Average fuel and emissions allowance costs have changed slightly from the values included in the summary report due to a calculation error.
Table 22: Fuel and Emissions Allowance Costs in 2029
Variable Costs Baseline CSAPR Limit
CSAPR and
Regional Haze
CSAPR and CO2
Limit
CSAPR and CO2 $20/ton
CSAPR and CO2 $25/ton
Total Fuel and Emissions Allowance Costs (billions of dollars)
17.7 18.0 18.0 16.8 20.4 20.9
Total Fuel and Emissions Allowance Costs change from Baseline (%)
n/a 2 2 -5 15 18
Average Fuel and Emissions Allowance Cost ($/MWh) 37.07 37.70 $37.65 36.60 44.28 45.49
CO2 Emissions Allowance Costs Only (billions of dollars)
0 0 0 0 3.8 4.4
CO2 Emissions Allowance Costs as percent of Total Fuel and Emissions Allowance Costs (%)
0 0 0 0 19 21
Note that the information in Table 20, Table 21 and Table 22 do not include the associated costs of building or upgrading transmission infrastructure, higher natural gas prices caused by increased gas demand, ancillary services procurement, energy efficiency investments, and potential Reliability Must-
Electric Reliability Council of Texas, Inc. 34
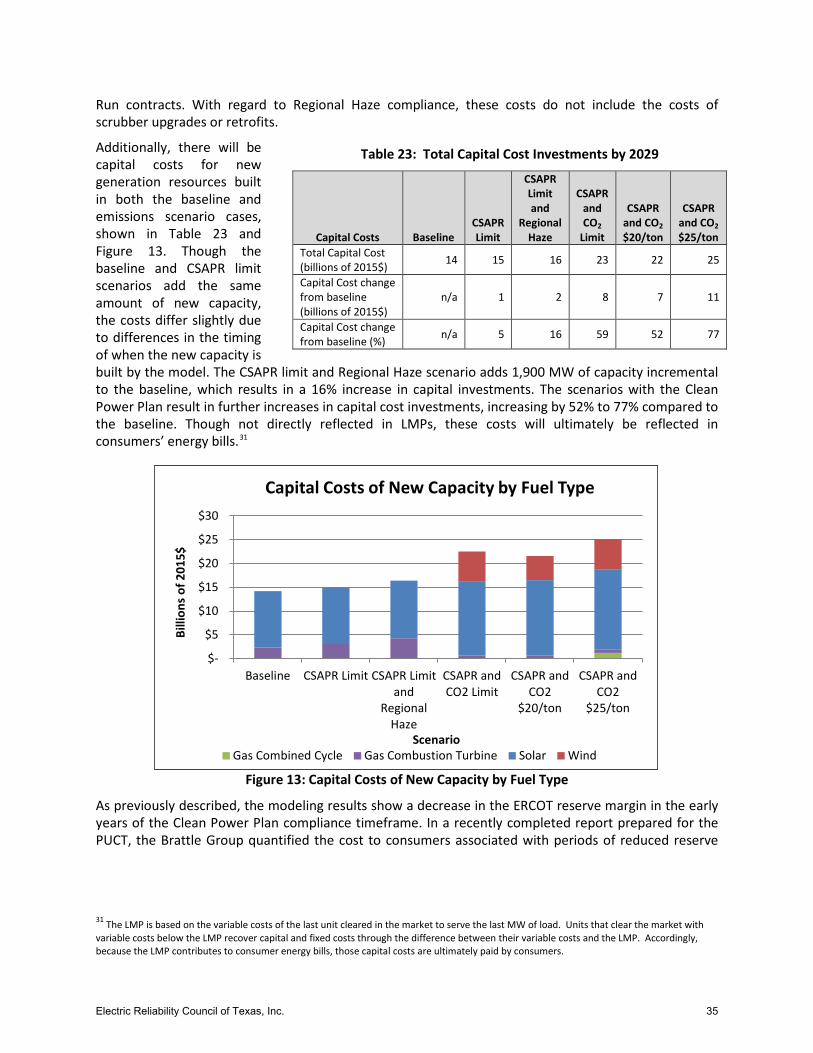
Table 23: Total Capital Cost Investments by 2029
Capital Costs Baseline CSAPR Limit
CSAPR Limit and
Regional Haze
CSAPR and CO2
Limit
CSAPR and CO2 $20/ton
CSAPR and CO2 $25/ton
Total Capital Cost (billions of 2015$) 14 15 16 23 22 25
Capital Cost change from baseline (billions of 2015$)
n/a 1 2 8 7 11
Capital Cost change from baseline (%) n/a 5 16 59 52 77
Run contracts. With regard to Regional Haze compliance, these costs do not include the costs of scrubber upgrades or retrofits.
Additionally, there will be capital costs for new generation resources built in both the baseline and emissions scenario cases, shown in Table 23 and Figure 13. Though the baseline and CSAPR limit scenarios add the same amount of new capacity, the costs differ slightly due to differences in the timing of when the new capacity is built by the model. The CSAPR limit and Regional Haze scenario adds 1,900 MW of capacity incremental to the baseline, which results in a 16% increase in capital investments. The scenarios with the Clean Power Plan result in further increases in capital cost investments, increasing by 52% to 77% compared to the baseline. Though not directly reflected in LMPs, these costs will ultimately be reflected in consumers’ energy bills.31
Figure 13: Capital Costs of New Capacity by Fuel Type
As previously described, the modeling results show a decrease in the ERCOT reserve margin in the early years of the Clean Power Plan compliance timeframe. In a recently completed report prepared for the PUCT, the Brattle Group quantified the cost to consumers associated with periods of reduced reserve
31 The LMP is based on the variable costs of the last unit cleared in the market to serve the last MW of load. Units that clear the market with variable costs below the LMP recover capital and fixed costs through the difference between their variable costs and the LMP. Accordingly, because the LMP contributes to consumer energy bills, those capital costs are ultimately paid by consumers.
$-
$5
$10
$15
$20
$25
$30
Baseline CSAPR Limit CSAPR Limitand
RegionalHaze
CSAPR andCO2 Limit
CSAPR andCO2
$20/ton
CSAPR andCO2
$25/ton
Billi
ons
of 2
015$
Scenario
Capital Costs of New Capacity by Fuel Type
Gas Combined Cycle Gas Combustion Turbine Solar Wind
Electric Reliability Council of Texas, Inc. 35
margins.32 These costs include a range of production costs, including the cost of emergency generation, the cost of utilizing interruptible customers, the costs of utilizing all of the available ancillary services, and the impact to consumers from firm load shedding, all of which increase at lower reserve margins. As an example, the retirement of 6,000 MW of generation capacity would be expected to reduce the system reserve margin by about 8%. Based on this report, if this capacity change occurred when the system reserve margin was approximately 14%, the increased annual system costs at the resulting 6% reserve margin would be approximately $800 million higher than would be expected prior to the regulatory impact.33
Finally, ERCOT used the same natural gas price assumptions in all of the modeled scenarios. As noted previously, with the increased consumption of natural gas anticipated not only in ERCOT but nationally with the implementation of the Clean Power Plan, natural gas prices could increase beyond the levels anticipated in this modeling analysis. This would pose additional costs to consumers, which are not reflected in this study.
7. Conclusion The results of this study indicate that the Regional Haze program and the Clean Power Plan will both lead to the retirement of coal-fired capacity in ERCOT. EPA’s proposed Regional Haze FIP is likely to result in the retirement of coal units due to the costs associated with upgrading and retrofitting scrubbers. ERCOT anticipates that 3,000 MW to 8,500 MW of coal-fired capacity in ERCOT face a moderate to high risk of retirement due to these requirements. If implemented as proposed, the Clean Power Plan will also result in coal unit retirements, due to the need to meet stringent CO2 emissions limits on a state-wide basis. ERCOT’s analysis suggests that the Clean Power Plan, in combination with other environmental regulations, will result in the retirement of up to 8,700 MW of coal-fired capacity. By comparison, the other regulations are not expected to have a significant system-wide impact, but could affect the economics of a small number of units.
The retirement of existing capacity in ERCOT could result in localized transmission reliability issues due to the loss of fossil fuel-fired generation resources in and around major urban centers, and will strain ERCOT’s ability to integrate new intermittent renewable generation resources. If the expected retirement of coal resources were to occur over a short period of time, reserve margins in the ERCOT region could reduce considerably, leading to increased risk of rotating outages as a last resort to maintain operating balance between customer demand and available generation. The need to maintain operational reliability (i.e., sufficient ramping capability) could require the curtailment of renewable generation resources. This would limit and/or delay the integration of renewable resources, leading to possible non-compliance with the proposed Clean Power Plan deadlines. These issues highlight the need for the Clean Power Plan to include a process to effectively manage electric system reliability issues, along the lines of the ISO/RTO Council (IRC) proposal for the inclusion of a reliability safety valve process.
The Clean Power Plan will also result in increased energy costs for consumers in the ERCOT region. Based on ERCOT’s modeling analysis, energy costs for consumers may increase by up to 20% in 2020, without accounting for the associated costs of transmission upgrades, higher natural gas prices caused by increased gas demand, procurement of additional ancillary services, energy efficiency investments,
32 The Brattle Group. Estimating the Economically Optimal Reserve Margin in ERCOT, January, 2014. Available at http://interchange.puc.texas.gov/WebApp/Interchange/application/dbapps/filings/pgSearch_Results.asp?TXT_CNTR_NO=40000&TXT_ITEM_NO=649. 33 See Figure 22 of the Brattle Group report (page 48).
Electric Reliability Council of Texas, Inc. 36
capital costs of new capacity, and other costs associated with the retirement or decreased operation of coal-fired capacity in ERCOT. Consideration of these factors would result in even higher energy costs for consumers. Though the other regulations considered in this study will pose costs to owners of generation resources, they are less likely to significantly impact costs for consumers.
At this time, there is uncertainty regarding the implementation of environmental regulations, particularly the Clean Power Plan. Once EPA finalizes these regulations and pending litigation is resolved, resource owners will need to make decisions about their generation units that could result in reliability and transmission constraints. As new information becomes available, ERCOT will continue to analyze the impacts of regulatory developments that may affect the ability to provide reliable electricity to consumers in Texas.
Electric Reliability Council of Texas, Inc. 37
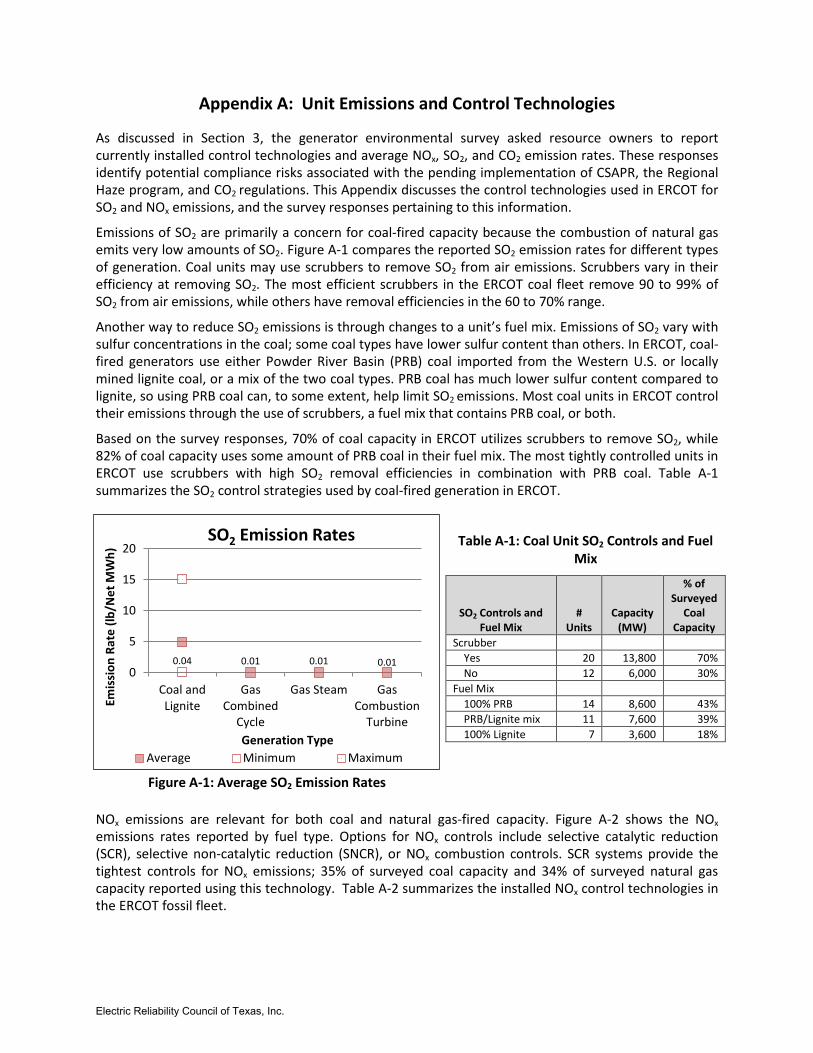
Appendix A: Unit Emissions and Control Technologies
As discussed in Section 3, the generator environmental survey asked resource owners to report currently installed control technologies and average NOx, SO2, and CO2 emission rates. These responses identify potential compliance risks associated with the pending implementation of CSAPR, the Regional Haze program, and CO2 regulations. This Appendix discusses the control technologies used in ERCOT for SO2 and NOx emissions, and the survey responses pertaining to this information.
Emissions of SO2 are primarily a concern for coal-fired capacity because the combustion of natural gas emits very low amounts of SO2. Figure A-1 compares the reported SO2 emission rates for different types of generation. Coal units may use scrubbers to remove SO2 from air emissions. Scrubbers vary in their efficiency at removing SO2. The most efficient scrubbers in the ERCOT coal fleet remove 90 to 99% of SO2 from air emissions, while others have removal efficiencies in the 60 to 70% range.
Another way to reduce SO2 emissions is through changes to a unit’s fuel mix. Emissions of SO2 vary with sulfur concentrations in the coal; some coal types have lower sulfur content than others. In ERCOT, coal-fired generators use either Powder River Basin (PRB) coal imported from the Western U.S. or locally mined lignite coal, or a mix of the two coal types. PRB coal has much lower sulfur content compared to lignite, so using PRB coal can, to some extent, help limit SO2
emissions. Most coal units in ERCOT control their emissions through the use of scrubbers, a fuel mix that contains PRB coal, or both.
Based on the survey responses, 70% of coal capacity in ERCOT utilizes scrubbers to remove SO2, while 82% of coal capacity uses some amount of PRB coal in their fuel mix. The most tightly controlled units in ERCOT use scrubbers with high SO2 removal efficiencies in combination with PRB coal. Table A-1 summarizes the SO2 control strategies used by coal-fired generation in ERCOT.
Table A-1: Coal Unit SO2 Controls and Fuel Mix
SO2 Controls and Fuel Mix
# Units
Capacity (MW)
% of Surveyed
Coal Capacity
Scrubber Yes 20 13,800 70% No 12 6,000 30%
Fuel Mix 100% PRB 14 8,600 43% PRB/Lignite mix 11 7,600 39% 100% Lignite 7 3,600 18%
NOx emissions are relevant for both coal and natural gas-fired capacity. Figure A-2 shows the NOx emissions rates reported by fuel type. Options for NOx controls include selective catalytic reduction (SCR), selective non-catalytic reduction (SNCR), or NOx combustion controls. SCR systems provide the tightest controls for NOx emissions; 35% of surveyed coal capacity and 34% of surveyed natural gas capacity reported using this technology. Table A-2 summarizes the installed NOx control technologies in the ERCOT fossil fleet.
Figure A-1: Average SO2 Emission Rates
0.01 0.01 0.01 0.04 0
5
10
15
20
Coal andLignite
GasCombined
Cycle
Gas Steam GasCombustion
Turbine
Emis
sion
Rat
e (lb
/Net
MW
h)
Generation Type
SO2 Emission Rates
Average Minimum Maximum
Electric Reliability Council of Texas, Inc.
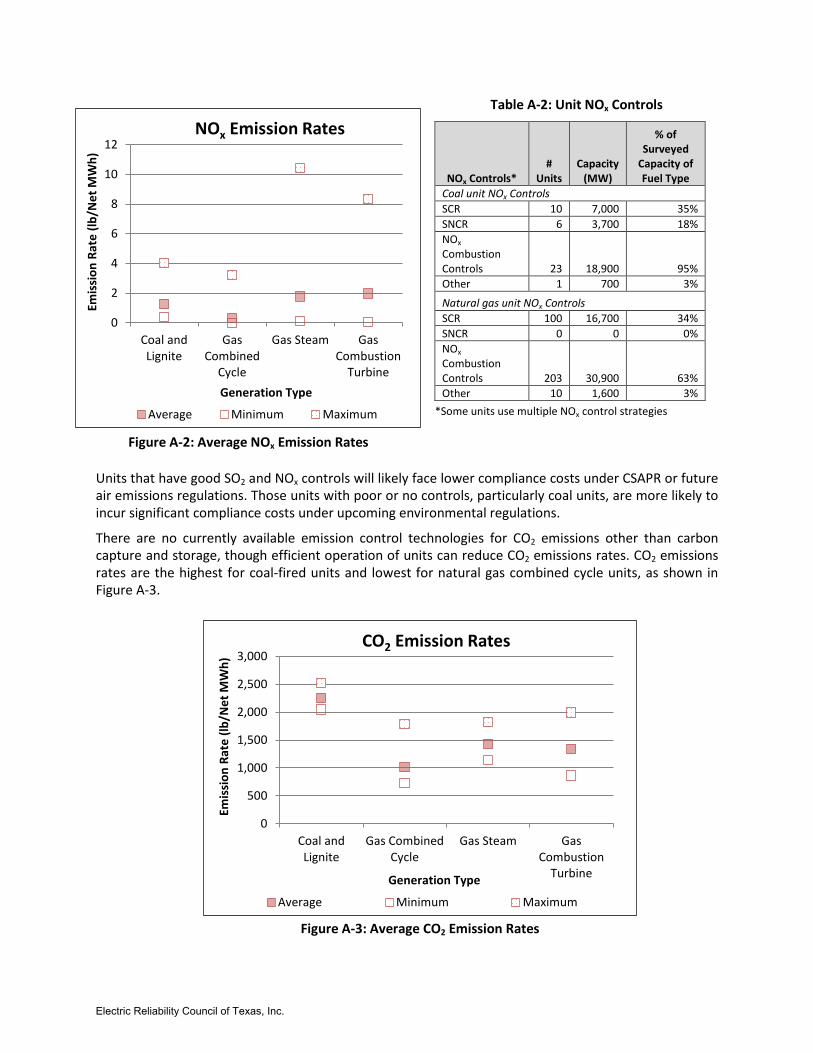
Table A-2: Unit NOx Controls
NOx Controls* #
Units Capacity
(MW)
% of Surveyed
Capacity of Fuel Type
Coal unit NOx Controls SCR 10 7,000 35% SNCR 6 3,700 18% NOx Combustion Controls 23 18,900 95% Other 1 700 3%
Natural gas unit NOx Controls SCR 100 16,700 34% SNCR 0 0 0% NOx Combustion Controls 203 30,900 63% Other 10 1,600 3%
*Some units use multiple NOx control strategies
Units that have good SO2 and NOx controls will likely face lower compliance costs under CSAPR or future air emissions regulations. Those units with poor or no controls, particularly coal units, are more likely to incur significant compliance costs under upcoming environmental regulations.
There are no currently available emission control technologies for CO2 emissions other than carbon capture and storage, though efficient operation of units can reduce CO2 emissions rates. CO2 emissions rates are the highest for coal-fired units and lowest for natural gas combined cycle units, as shown in Figure A-3.
Figure A-2: Average NOx Emission Rates
Figure A-3: Average CO2 Emission Rates
0
2
4
6
8
10
12
Coal andLignite
GasCombined
Cycle
Gas Steam GasCombustion
Turbine
Emis
sion
Rat
e (lb
/Net
MW
h)
Generation Type
NOx Emission Rates
Average Minimum Maximum
0
500
1,000
1,500
2,000
2,500
3,000
Coal andLignite
Gas CombinedCycle
Gas Steam GasCombustion
Turbine
Emis
sion
Rat
e (lb
/Net
MW
h)
Generation Type
CO2 Emission Rates
Average Minimum Maximum
Electric Reliability Council of Texas, Inc.