Embed Size (px)
Citation preview

September 2004 • NREL/MP-560-36734
Summary of Electrolytic Hydrogen Production
Milestone Completion Report
Johanna Ivy
National Renewable Energy Laboratory1617 Cole Boulevard, Golden, Colorado 80401-3393 303-275-3000 • www.nrel.gov
Operated for the U.S. Department of Energy Office of Energy Efficiency and Renewable Energy by Midwest Research Institute • Battelle
Contract No. DE-AC36-99-GO10337

NOTICE
This report was prepared as an account of work sponsored by an agency of the United States government. Neither the United States government nor any agency thereof, nor any of their employees, makes any warranty, express or implied, or assumes any legal liability or responsibility for the accuracy, completeness, or usefulness of any information, apparatus, product, or process disclosed, or represents that its use would not infringe privately owned rights. Reference herein to any specific commercial product, process, or service by trade name, trademark, manufacturer, or otherwise does not necessarily constitute or imply its endorsement, recommendation, or favoring by the United States government or any agency thereof. The views and opinions of authors expressed herein do not necessarily state or reflect those of the United States government or any agency thereof.
Available electronically at http://www.osti.gov/bridge
Available for a processing fee to U.S. Department of Energy and its contractors, in paper, from:
U.S. Department of Energy Office of Scientific and Technical Information P.O. Box 62 Oak Ridge, TN 37831-0062 phone: 865.576.8401 fax: 865.576.5728 email: mailto:[email protected]
Available for sale to the public, in paper, from: U.S. Department of Commerce National Technical Information Service 5285 Port Royal Road Springfield, VA 22161 phone: 800.553.6847 fax: 703.605.6900 email: [email protected] online ordering: http://www.ntis.gov/ordering.htm
Printed on paper containing at least 50% wastepaper, including 20% postconsumer waste

1.0 Executive Summary
This report provides a technical and economic overview of the electrolytic hydrogen production systems commercially available as of December 2003. The technical analysis focuses on five companies’ electrolysis units: Stuart IMET; Teledyne HM and EC; Proton HOGEN; Norsk Hydro HPE and Atmospheric; and Avalence Hydrofiller. Cost information was obtained for three different systems, and the economics of these processes were analyzed.
The technical analysis found that currently, the largest electrolyzer unit sold produces only 380,000 kg H2/year. There are two limitations for electrolyzers of this size. If the system were to be used for forecourt production, fueling approximately 1,900 cars, 2.3 MW of electricity would be required. This electricity demand would likely preclude the purchase of cheaper industrial electricity in the forecourt scenario, thus raising the price of hydrogen. If the system were to be used in a large hydrogen generation plant, the limited hydrogen production capacity means that a significant number of electrolyzer units would be required. For example, a 500,000 kg/day hydrogen generation plant using nuclear power and electrolysis would require 500 of the largest electrolyzer units available today. In this scenario, electrolyzers 10 to 100 times the size of today’s units could be utilized.
An initial cost boundary analysis was completed to determine the effects of electricity price on hydrogen costs. For each electrolyzer, the specific system energy requirement was used to determine how much electricity is needed to produce hydrogen; no capital, operating or maintenance costs are included in the calculation. At current electrolyzer efficiencies, in order to produce hydrogen at lower than $3.00/kg, electricity costs must be lower than 4 and 5.5 cents per kWh. For an ideal system operating at 100% efficiency, electricity costs must be less then 7.5 cents per kWh to produce hydrogen at lower than $3.00/kg. This analysis demonstrates that regardless of any additional cost elements, electricity costs will be a major price contributor.
The detailed economic analyses are based on three distinct systems for which cost and economic data were available. These data may or may not be representative of the costs and systems within each category. These three systems represent a small neighborhood (~20 kg/day), a small forecourt (~100 kg/day), and a forecourt size (~1000 kg/day). In this analysis, the hydrogen selling prices were $19.01/kg H2 for the small neighborhood size, $8.09/kg H2 for the small forecourt size, and $4.15/kg H2 for the forecourt size. The analysis was performed using year 2000 dollars, which were escalated to 2005 dollars. For the forecourt case, electricity represents 58% of the cost of the hydrogen, and the capital costs only 32%. For the small forecourt case, the electricity contribution drops to 35% while the capital costs become the major cost factor at 55%. In the neighborhood case, the capital costs increase to 73%, but electricity costs are not insignificant at 17%. This analysis demonstrated that for all systems electricity price is a contributor to hydrogen price, but for small-sized electrolyzers, capital costs are more significant.
1

2.0 Introduction
The purpose of this report is to give an overview of the current state of electrolytic hydrogen production technologies, and to provide an economic analysis of the processes. The study focuses on five companies’ current electrolyzer lines: Stuart IMET; Teledyne HM and EC; Proton HOGEN; Norsk Hydro HPE and Atmospheric; and Avalence Hydrofiller. The report details the state of technology as of December 2003 for all five companies’ electrolysis units, and then analyzes the economics of three standard sized electrolysis processes.
3.0 Analysis Methodology
The technical details for each company’s electrolysis systems were obtained from research on the Internet, and from personal conversations with industry representatives. The data presented are representative of systems available in December 2003. A detailed summary of each electrolysis model included in this study can be found in Appendix A.
For purposes of the analysis, the available electrolysis systems were categorized into five different size ranges: home, small neighborhood, neighborhood, small forecourt and forecourt. The term forecourt refers to a refueling station. The number of cars served and hydrogen production rate for each size are as follows:
• The home size will serve the fuel needs of 1- 5 cars with a hydrogen production rate of 200-1000 kg H2/year.
• The small neighborhood size will serve the fuel needs of 5-50 cars with a hydrogen production rate of 1000-10,000 kg H2/year.
• The neighborhood size will serve the fuel needs of 50-150 cars with a hydrogen production rate of 10,000 – 30,000 kg H2/year.
• The small forecourt size, which could be a single hydrogen pump at an existing station, will serve 150 – 500 cars with a hydrogen production rate of 30,000 – 100,000 kg H2/year.
• A full hydrogen forecourt will serve more then 500 cars per year with a hydrogen production rate of greater then 100,000 kg H2/year.
The number of cars served was determined by calculating that a car requires approximately 200 kg of hydrogen per year. This 200 kg requirement assumes that on average a car travels 12,000 miles per year, and that a vehicle will travel 60 miles/kg of hydrogen.
Table 1 below illustrates where each manufacture’s electrolysis models fit into these categories.
2

Table 1: Hydrogen Station Size
Manufacturer Model Hydrogen
Production Rate # of cars served Station size
kg/day kg/year Avalence Hydrofiller 15 0.9 315 1.6 Home Proton HOGEN 20 1 396 2.0 Home Proton HOGEN 40 2 789 3.9 Home Avalence Hydrofiller 50 3 1182 6 Small Neighborhood Teledyne HM-50 6 2205 11 Small Neighborhood Stuart IMET 300, 1 cell stack, 300 cm3 6 2364 12 Small Neighborhood Avalence Hydrofiller 175 10 3622 18 Small Neighborhood Stuart IMET 1000, 1 cell stack, 1000 cm3 11 3939 20 Small Neighborhood Teledyne HM-100 12 4410 22 Small Neighborhood Teledyne HM-125 15 5514 28 Small Neighborhood Teledyne HM-150 18 6615 33 Small Neighborhood Proton HOGEN 3801 22 7875 39 Small Neighborhood Norsk HPE 10 22 7875 39 Small Neighborhood Teledyne HM-200 24 8820 44 Small Neighborhood Norsk HPE 12 26 9450 47 Small Neighborhood Norsk HPE 16 35 12600 63 Neighborhood Norsk HPE 20 43 15747 79 Neighborhood Norsk HPE 24 52 18897 94 Neighborhood Teledyne EC-500 60 22047 110 Neighborhood Stuart IMET 1000, 2 cell stack, 1000 cm3 65 23622 118 Neighborhood Norsk HPE 30 65 23622 118 Neighborhood Teledyne EC-600 72 26457 132 Neighborhood Norsk HPE 40 86 31494 157 Small Forecourt Teledyne EC-750 91 33069 165 Small Forecourt Stuart IMET 1000, 3 cell stack, 1000 cm3 97 35433 177 Small Forecourt Norsk Atmospheric Type No.5010 (4000 Amp DC) 108 39369 197 Small Forecourt Norsk Atmospheric Type No.5010 (5150 Amp DC) 108 39369 197 Small Forecourt Norsk HPE 50 108 39369 197 Small Forecourt Stuart IMET 1000, 4 cell stack, 1000 cm3 129 47241 236 Small Forecourt Norsk HPW 60 129 47241 236 Small Forecourt Stuart IMET 1000, 4 cell stack, 1000 cm3 194 70863 354 Small Forecourt Norsk Atmospheric Type No.5020 (4000 Amp DC) 324 118104 591 Forecourt Norsk Atmospheric Type No.5020 (5150 Amp DC) 324 118104 591 Forecourt Norsk Atmospheric Type No.5030 (4000 Amp DC) 647 236205 1181 Forecourt Norsk Atmospheric Type No.5030 (5150 Amp DC) 647 236205 1181 Forecourt Norsk Atmospheric Type No.5040 (4000 Amp DC) 813 296832 1484 Forecourt Norsk Atmospheric Type No.5040 (5150 Amp DC) 1046 381864 1909 Forecourt
1 Proton’s HOGEN 380 has now been replaced by the HOGEN H Series. The HOGEN 380 pre-production unit was used because data on Proton’s H Series Electrolyzers were not available in December 2003, which is the cutoff time for this report.
3

The table illustrates the production rates of current electrolysis units. Today, only Norsk Hydro makes an electrolyzer large enough to be considered a forecourt-sized system. Alkaline producers Teledyne and Stuart manufacture systems in the small neighborhood, neighborhood and small forecourt range, and Avalence’s small unipolar alkaline electrolyzers are currently only sized for the home and small neighborhood. In contrast, Proton Exchange Membrane (PEM) electrolysis units, produced by Proton, are only sized for the home or small neighborhood system. This is a typical trend in the industry today as the high capital costs of PEM units limit their current viability in the large hydrogen production market, while alkaline units, with their lower capital costs, can produce across a range of hydrogen capacities.
Additionally, the categories were used to allow cost data to be generalized by system size. The economic analyses are based on three distinct systems for which cost and economic data were available. These data may or may not be representative of the costs and systems within each category. The three systems represent a small neighborhood (~20 kg/day), a small forecourt (~100 kg/day), and a forecourt size (~1000 kg/day). The specific manufacturer and model analyzed is not presented as it was agreed that specific cost data would remain confidential.
The initial version of this analysis, published March 19, 2004, used a beta version of the H2A model to calculate the discounted cash flow for the electrolysis process. In this version of the analysis, an updated version of the H2A model was used.
4.0 Technology Description
Hydrogen is produced via electrolysis by passing electricity through two electrodes in water. The water molecule is split and produces oxygen at the anode and hydrogen at the cathode.
Three types of industrial electrolysis units are being produced today. Two involve an aqueous solution of potassium hydroxide (KOH), which is used because of its high conductivity, and are referred to as alkaline electrolyzers. These units can be either unipolar or bipolar. The unipolar electrolyzer resembles a tank and has electrodes connected in parallel. A membrane is placed between the cathode and anode, which separate the hydrogen and oxygen as the gasses are produced, but allows the transfer of ions. The bipolar design resembles a filter press. Electrolysis cells are connected in series, and hydrogen is produced on one side of the cell, oxygen on the other. Again, a membrane separates the electrodes.
The third type of electrolysis unit is a Solid Polymer Electrolyte (SPE) electrolyzer. These systems are also referred to as PEM or Proton Exchange Membrane electrolyzers. In this unit the electrolyte is a solid ion conducting membrane as opposed to the aqueous solution in the alkaline electrolyzers. The membrane allows the H+ ion to transfer from the anode side of the membrane to the cathode side, where it forms hydrogen. The SPE membrane also serves to separate the hydrogen and oxygen gasses, as oxygen is produced
4

at the anode on one side of the membrane and hydrogen is produced on the opposite side of the membrane.
The Avalence Hydrofiller is the only unipolar electrolyzer discussed in this study. Norsk Hydro, Stuart, and Teledyne all produce bipolar electrolysis units. These units are currently capable of producing the largest amounts of hydrogen, and today are in use worldwide. The PEM electrolysis unit is the newest of the technologies discussed in this report, and Proton is the only PEM electrolyzer discussed in this study.
Regardless of the technology, the overall electrolysis reaction is the same:
H2O → ½ O2 + H2
However, reaction at each electrode differs between PEM and alkaline systems. In a PEM system the reactions at the electrodes are:
PEM Hydrogen Production at the Cathode
2 H+ + 2e- → H2
PEM Oxygen Production at the Anode
H2O → ½ O2 + 2 H+ + 2e-
In an alkaline system the reaction at each electrode are:
Alkaline Hydrogen Production at the Cathode
2 H2O + 2e- → H2 + 2OH-
Alkaline Oxygen Production at the Anode
2OH- → ½ O2 + 2 H2O + 2e-
5.0 Process Design
A typical electrolysis process diagram is shown in Figure 1 below. Note that different processes will use different pieces of equipment. For example, PEM units will not require the KOH mixing tank, as no electrolytic solution is needed for these electrolyzers. Another example involves water purification equipment. Water quality requirements differ across electrolyzers. Some units include water purification inside their hydrogen generation unit, while others require an external deionizer or reverse osmosis unit before water is fed to the cell stacks. For systems that do not include a water purifier, one is added in the process flow. A water storage tank may be included to ensure that the process has adequate water in storage in case the water system is interrupted. Each system has a hydrogen generation unit that integrates the electrolysis stack, gas purification and dryer, and heat removal. Electrolyte circulation is also included in the
5

hydrogen generation unit in alkaline systems. The integrated system is usually enclosed in a container or is installed as a complete package. Oxygen and purified hydrogen are produced from the hydrogen generation unit. If desired, a compressor and hydrogen storage can be added to the system. Although hydrogen storage and compression are included in the process diagram below, for purposes of this analysis, hydrogen storage is not included. It is assumed that as the hydrogen is produced it is fed directly into a pipeline or truck. In addition, note that there is no oxygen compression and storage. For the purposes of this analysis, oxygen production is not considered.
Typical utilities that the electrolysis systems need include electricity for electrolysis and other peripheral equipment; cooling water for the hydrogen generation unit; pre-pressurization gas; and inert gas.
Process H2O High Purity H2O
Water Purifier
Power Supply y Electrolysis module y Electrolyte circulation
Compressor
y Hydrogen Gas Dryer/Purifier
Utilities
Feed Water Storage Tank
Hydrogen Storage
Prepressurization Gas
KOH Mixing Tank
H2 >99% Pure H2
High Purity H2O
Instrument Air
Cooling Water
Electrolyte Solution
Hydrogen Generation
Unit
Figure 1: Process Flow Diagram
5.1. Mass Balance Results
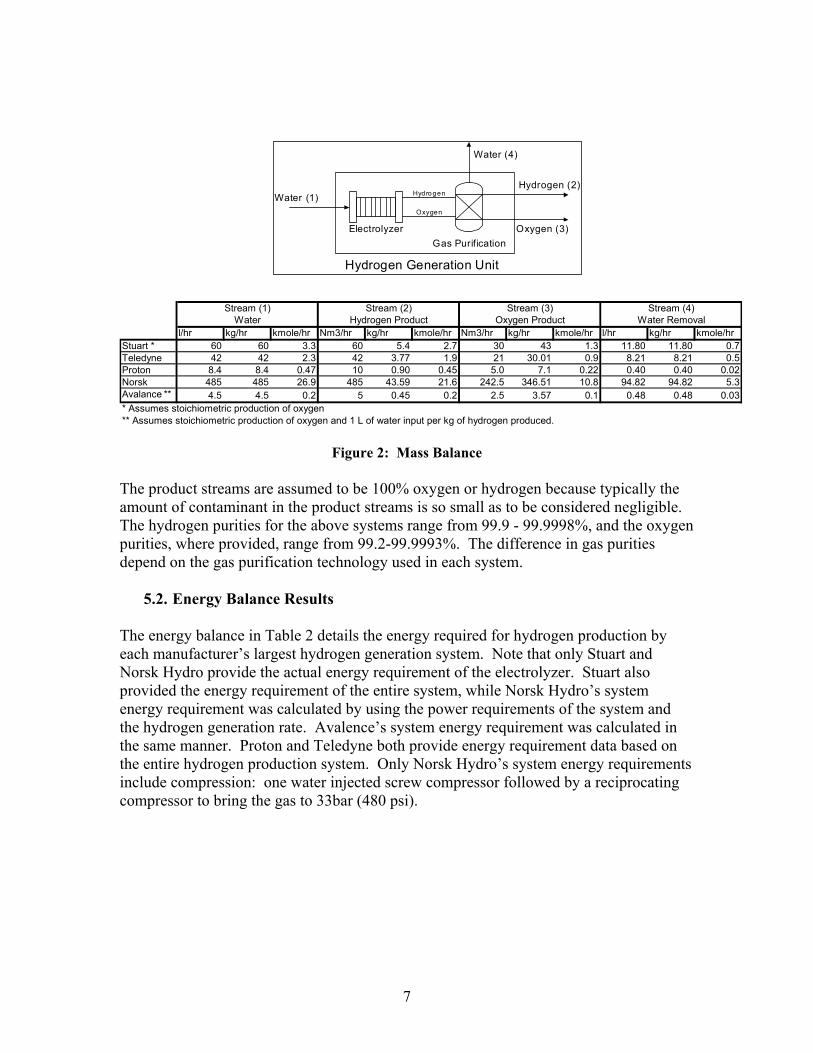
A simplified process flow is displayed in Figure 2 below to help illustrate the mass balance of the electrolysis system. The mass balance data provided are based on each of the manufacturers’ largest electrolysis system: the Stuart IMET 1000, the Teledyne EC-750, the Proton Hogen 380, the Norsk Hydro Atmospheric Type No.5040 (5150 Amp DC) and the Avalence Hydrofiller 175.
6
Gas Purification
Water (4)
Electrolyzer
Hydrogen (2)
O xygen (3)
Water (1)
Hydrogen Generation Unit
Hydro gen
O xyge n
l/hr kg/hr kmole/hr Nm3/hr kg/hr kmole/hr Nm3/hr kg/hr kmole/hr l/hr kg/hr kmole/hr Stuart * 60 60 3.3 60 5.4 2.7 30 43 1.3 11.80 11.80 0.7 Teledyne 42 42 2.3 42 3.77 1.9 21 30.01 0.9 8.21 8.21 0.5 Proton 8.4 8.4 0.47 10 0.90 0.45 5.0 7.1 0.22 0.40 0.40 0.02 Norsk 485 485 26.9 485 43.59 21.6 242.5 346.51 10.8 94.82 94.82 5.3 Avalance ** 4.5 4.5 0.2 5 0.45 0.2 2.5 3.57 0.1 0.48 0.48 0.03
Stream (3) Oxygen Product
Stream (4) Water Removal
Stream (1) Water
Stream (2) Hydrogen Product
* Assumes stoichiometric production of oxygen ** Assumes stoichiometric production of oxygen and 1 L of water input per kg of hydrogen produced.
Figure 2: Mass Balance
The product streams are assumed to be 100% oxygen or hydrogen because typically the amount of contaminant in the product streams is so small as to be considered negligible. The hydrogen purities for the above systems range from 99.9 - 99.9998%, and the oxygen purities, where provided, range from 99.2-99.9993%. The difference in gas purities depend on the gas purification technology used in each system.
5.2. Energy Balance Results
The energy balance in Table 2 details the energy required for hydrogen production by each manufacturer’s largest hydrogen generation system. Note that only Stuart and Norsk Hydro provide the actual energy requirement of the electrolyzer. Stuart also provided the energy requirement of the entire system, while Norsk Hydro’s system energy requirement was calculated by using the power requirements of the system and the hydrogen generation rate. Avalence’s system energy requirement was calculated in the same manner. Proton and Teledyne both provide energy requirement data based on the entire hydrogen production system. Only Norsk Hydro’s system energy requirements include compression: one water injected screw compressor followed by a reciprocating compressor to bring the gas to 33bar (480 psi).
7

Table 2: Energy Balance
Energy Required: System
Energy Required:
Electrolyzer Hydrogen
Production
System Power
Requirement Manufacturer Model kWh/Nm3 kWh/kg kWh/Nm3 Nm3/hr kW Stuart: IMET 1000 4.8 4.2 60 288 Teledyne: EC-750 5.6 - 42 235.2 Proton: HOGEN 380 6.3 - 10 63 Norsk Hydro: Atmospheric Type No.5040 (5150 Amp DC) 4.8 4.3 485 2330 Avalence: Hydrofiller 175 5.4 - 4.6 25
53.4
62.3
70.1
53.5
60.5
6.0 Efficiency Results Efficient conversion of water and electricity to hydrogen is critical to the electrolytic hydrogen production technology.
6.1. Conversion Efficiency
The conversion efficiency of water to hydrogen is shown in Table 3. Overall, the conversion efficiency is high, ranging from 80-95%.
Table 3: Conversion Efficiency
Reactants Product
H2 Product
O2 Conversion efficiency
kg/hr kg/hr kg/hr % Stuart: IMET 1000 60 43 80% Teledyne: EC-750 42 30 80% Proton: GEN 380 8.4 7.1 95% Norsk Hydro: Atmospheric Type No.5040 (5150 Amp DC) 485 347 80% Avalence: Hydrofiller 175 4.5 3.6 89%
5.4 3.8
HO 0.9
434 0.45
6.2. Energy efficiency Energy efficiency is defined as the higher heating value (HHV) of hydrogen divided by the energy consumed by the electrolysis system per kilogram of hydrogen produced. The justification for using HHV can be seen in Appendix B. The energy efficiency of the electrolysis process is shown in Table 4. The energy efficiency ranges from 56-73%. Proton’s PEM process has the lowest efficiency at 56% and both Stuart’s and Norsk Hydro’s bipolar alkaline efficiencies are the highest at 73%. An efficiency goal for electrolyzers in the future has been reported to be in the 50 kWh/kg range, or a system efficiency of 78%. However, this 78% includes compression of the hydrogen gas to 6000
8

psi. Currently, these electrolyzers, other then Avalence’s, reach a pressure ranging from 60-435 psig for the power requirements presented. These efficiencies would decrease if additional compression up to 6000 psig were included. Only Avalence’s energy requirement of 60.5 kWh/kg includes reaching hydrogen pressures in the 6000 psig range.
Note that in this study the energy requirement of the entire electrolysis system is used to calculate the efficiency, not just the efficiency of the electrolyzer. As an example, the electrolyzer alone for the Stuart IMET 1000 requires 46.8 kWh/kg (4.2 kWh/Nm3), which corresponds to 83% efficiency when you divide the HHV of hydrogen by the electrolyzer power requirement. However, when you include the rectifier and auxiliaries the energy requirement becomes 53.5 kWh/kg or 73% efficient. As a result, when referring to the “System Energy Required” in this study, the value refers to the entire electrolysis system, not just the electrolyzer itself.
Table 4: Energy Efficiency
Energy Required System
HHV of Hydrogen (equivalent to 142 MJ/kg)
System Efficiency
Production Pressure
kWh/kg kWh/kg % psig Stuart: IMET 1000 53.4 73 360 Teledyne: EC-750 62.3 63 60-115 Proton: HOGEN 380 70.1 56 200 Norsk Hydro: Atmospheric Type No.5040 (5150 Amp DC) 53.5 73 435
Avalence: Hydrofiller 175 60.5 64 up to
10,000
39 39 39
39
39
7.0 Capital and Operating Cost Results
An initial boundary analysis was completed to determine the effects of electricity price on hydrogen costs, and the results are shown in Figure 3. For each electrolyzer, the specific system energy requirement is used to determine how much electricity is needed to produce hydrogen; no capital, operating or maintenance costs are included in the calculation. The system energy requirement used is the lowest energy requirement reported for each manufacturer. This graph shows that, at current electrolyzer efficiencies, in order to produce hydrogen at lower than $3.00/kg, electricity costs must be between 4 and 5.5¢/kWh. In order to produce hydrogen for less than $3.00/kg with a system that is 100% efficient, electricity prices must be less than 7.5¢/kWh. The U.S. Department of Energy’s Energy Information Administration (EIA) reports 2002 industrial, commercial, and residential electricity prices at 4.83, 7.89, and 8.45¢/kWh, respectively. Thus, if only electricity costs were incurred, current electrolyzers could produce hydrogen for $3.00/kg at industrial electricity prices; an ideal system could produce hydrogen for $3.00/kg at slightly lower then commercial prices. This analysis
9

shows that regardless of any additional cost elements, electricity costs will be a major price contributor.
H2
cost
$/k
g
Hydrogen costs via electrolysis with electricity costs only
$8.00
Commercial System Efficiencies (54-67 kWh/kg)$7.00
$6.00 Ideal System (HHV of Hydrogen 39 kWh/kg)
$5.00
$4.00 `
$3.00
$2.00
$1.00
$0.00
0.000 0.010 0.020 0.030 0.040 0.050 0.060 0.070 0.080 0.090 0.100
Electricity costs $/kWh
Figure 32
8.0 Discounted Cash Flow Results
The discounted cash flow analysis was completed using the H2A model. The specifics for each of the three systems analyzed will not be presented here, as each vendor requested that the detailed economic data they provided remain confidential. Non-confidential data and parameters are provided in Table 5, and show the cost assumptions that were used in the analysis which are common between all three systems analyzed. These parameters are included to help provide transparency in the analysis.
Table 5: DCF Parameters Parameter Assumption
Process Parameters Primary Feedstock Electricity and Water Electricity Used Industrial Electricity Conversion Technology Electrolysis
Financial Parameters Start-up Year 2005 After-Tax Real IRR (%) 10 Depreciation Type MACRS
2 The Proton efficiency is based on the HOGEN 380 series, which is no longer available. Current efficiencies of Proton systems are in the 62-70 kWh/kg range
10

Parameter tion Depreciation Schedule Length (No. of Years) 7 Analysis Period (years) 40 Plant Life (years) 40 Assumed Inflation Rate (%) 1.9 State Income Taxes (%) 6 Federal Income Taxes (%) 35 Effective Tax Rate (%) 38.9 Operating Capacity Factor (%) 97 % Equity Financing 100 Length of Construction Period (years) 1 % of Capital Spent in 1st Year of Construction 100 Start-up Time (years) 1 % of Revenues During Start-up (%) 75 % of Variable Operating Costs During Start-up (%) 75 % of Fixed Operating Costs During Start-up (%) 100 Salvage Value of Capital (% of Total Capital Investment) 10 Decommissioning Costs (% of Total Capital Investment) 10
Replacement Capital Parameters Electrolyzer cell stack lifetime (years) 5-15
Indirect Depreciable Capital Parameters Buildings (% of fixed capital investment) 14 Yard Improvements (% of fixed capital investment) 3.5 Construction (% of fixed capital investment) 9 Engineering and design (% of fixed capital investment) 8 Contingency (% of fixed capital investment) 25-30
Non Depreciable Capital Parameters Land ($/acre) 5,000
O&M Parameters Burdened Labor ($/hour) 50 Overhead and G&A (% of labor cost) 20 Property Tax (% of depreciable capital costs) 1 Insurance Rate (% of depreciable capital costs) 1
Assump
2005 was chosen as the startup year for this analysis because the study focuses on currently available technology. Presently, the electrolysis industry meets a smaller market demand then would exist if hydrogen were in use as a transportation fuel. As the demand for hydrogen increases, capital costs will come down due to mass production. The economic results of this study should be considered representative of the electrolysis market as it stands today and in the near future, but not representative of long term costs and prices.
The three systems represented in the discount cash flow (DCF) analysis were the only three systems for which cost and economic data were available. These data may or may not be representative of the costs and systems within each category.
11

Electricity prices for this analysis come from the H2A model, which projects electricity prices through 2070. The projections from 2001 through 2025 come from the latest Annual Energy Outlook (AEO 2004) recently published by EIA. The projections between 2025 and 2035 are extrapolations of the EIA projections. The projections past 2035 are derived from growth rates that came from a Pacific Northwest National Laboratory long-term energy model called Climate Assessment Model (M-CAM).
Industrial electricity prices, reported as 4.83¢/kWh for 2002 by EIA, were used for all base case economic analyses. While electrolyzers may be too small to obtain the cheaper electricity prices usually available to industrial users, using such prices in this analysis sets the boundary for research goals on other parameters such as capital costs and efficiency. Additionally, sensitivity analyses were run to determine the impact of higher electricity prices on the hydrogen selling price results.
The results of the base case discounted cash flow analyses are shown in Table 6. The hydrogen selling price ranges from $19.01/kg for the small neighborhood size to $4.15/kg for the forecourt size. The analysis was performed using year 2000 dollars, which were escalated to 2005 dollars. The after-tax real IRR was fixed at 10% and the hydrogen selling price was varied until the NPV equaled zero.
Table 6: DCF CALCULATION OUTPUTS: Small Neighborhood Small Forecourt Forecourt Required Hydrogen Selling Price (Year 2000 Real Dollars) $19.01 $8.09 $4.15 Required Hydrogen Selling Price (Nominal Startup Year Dollars) $20.88 $8.89 $4.56 After-Tax Real IRR 10.0% 10.0% 10.0% Pre-Tax Real IRR 13.0% 12.5% 12.7% After-Tax Nominal IRR 12.1% 12.1% 12.1% Pre-Tax Nominal IRR 15.1% 14.6% 14.9%
DCF Outputs
The above DCF calculations yielded the specific item costs for each of the systems, and are shown in Table 7. The feedstock cost contribution includes only the cost of electricity for the system. Although it can be argued that electricity is not a feedstock, it was entered as such so that the electricity cost contribution can be easily distinguished from other utilities such as the process water, cooling water and inert gas contribution, which can be seen in the variable O&M cost contribution row. As anticipated, the cost of electricity is a factor in all three of the cases.
12

Table 7: DCF Item Costs
Specific Item Costs Small
Neighborhood Small
Forecourt Forecourt
Item Cost Cost Cost Units
Capital Cost Contribution $13.90 $4.43 $1.32 /kg of H2 Feedstock Cost Contribution $3.15 $2.80 $2.41 /kg of H2
Other Raw Material Cost Contribution $0.00 $0.00 $0.02 /kg of H2 Fixed O&M (labor etc.) Cost Contribution $1.93 $0.80 $0.37 /kg of H2
Variable O&M Cost Contribution $0.01 $0.05 $0.03 /kg of H2 Decommissioning Costs $0.02 $0.01 $0.00 /kg of H2
Byproduct Credit Cost Contribution $0.00 $0.00 $0.00 /kg of H2
Note that a few factors differ between electrolysis cases, which will vary the cost numbers. First, each system has different electrolyzer system efficiencies. As a result, the systems will need different amount of electricity to make the same amount of hydrogen. Second, different electrolyzers have different system lives. This analysis had an analysis period and plant life of 40 years. This time was chosen to be consistent with the H2A guidelines. However, electrolyzers have a stack life of 5-15 years, so different manufacturers stacks will need to be replaced at different intervals. The systems with the shorter system life will have higher capital costs.
The graph in Figure 4 better illustrates the different cost contributions for all three cases, along with the difference in cost contributions across the cases. For all three cases, the other raw material cost contribution, decommissioning cost contribution, and variable O&M cost contribution are negligible. The other raw material cost contribution includes the KOH electrolyte, when applicable. The variable O&M costs include utility costs: process or de-mineralized water, cooling water and inert gas. The inert gas is needed for instruments and initial system pressurization. For all electrolysis units, capital costs and feedstock costs are the two largest cost contributors, and fixed O&M costs are the third largest contributor.
13

$/kg
Hyd
roge
n (2
000
dolla
rs)
$20.00
$18.00
$16.00
$14.00
$12.00
$10.00
$8.00
$6.00
$4.00
$2.00
$-
Hydrogen Selling Price Industrial Electricity
$2.41 $2.80 $3.15
$1.32
$4.43
$13.90
$0.37
$0.80
$1.93 Decommissioning Costs Other Raw Material Costs Other Variable Costs (including utilities) Fixed O&M Capital Costs Feedstock Costs
Forecourt - $4.15/kg Small Forecourt - $8.09/kg Neighborhood - $19.01/kg (~1000 kg/day) (~100 kg/day) (~20 kg/day)
Hydrogen Market
Figure 4
Figure 5 illustrates the driving cost for each of the three cases. For the forecourt case, electricity represents 58% of the cost of the hydrogen, and the capital costs only 32%. For the small forecourt case, the electricity contribution drops to 35% while the capital costs become the major cost factor at 55%. In the neighborhood case, the capital costs increase further to 73%, but electricity costs are not insignificant at 17%. This graph shows that the small neighborhood case and small forecourt cases must focus on capital cost reductions in order to be competitive with the forecourt cases. All three cases need to consider electricity cost as a factor and look to minimize those costs.
14

% C
ost c
ontr
ibut
ion
Cost contribution (Year 2000 dollars) Industrial Electricity
100%
90%
80%
70%
60%
50%
40%
30%
20%
10%
0%
58%
35%
17%
32%
55%
73%
9% 10% 10%
Forecourt - $4.15/kg Small Forecourt - $8.09/kg Neighborhood - $19.01/kg (~1000 kg/day) (~100 kg/day) (~20 kg/day)
Hydrogen Market
Feedstock Costs Capital Costs Fixed O&M Other Variable Costs (including utilities) Other Raw Material Costs Decommissioning Costs
Figure 5
The previous graph shows how dependent the electrolysis hydrogen costs are on electricity price. The price of electricity is important, and, as stated earlier, all of these costs are based on industrial electricity cost. In order to better determine the relationship between hydrogen price and electricity cost, a sensitivity analysis was run using higher commercial electricity prices.
The graph in Figure 6 illustrates how an increase in electricity price to commercial levels increases the price of hydrogen.
15

Hyd
roge
n C
osts
($/k
g)
Effects of Commercial Electricity vs Industrial Electrcity on H2 Costs (Year 2000 dollars)
$25.00
$20.00
$15.00
$10.00
$5.00
$-Industrial Commercial Industrial Commercial Industrial Commercial
$2.41 $3.68 $2.80 $4.28 $3.15 $4.82$1.32
$1.35 $4.43 $4.47
$13.90 $13.94
$0.37 $0.37
$0.80 $0.80
$1.93 $1.93
Decommissioning Costs Other Raw Material Costs Other Variable Costs (including utilities) Fixed O&M Capital Costs Feedstock Costs
$4.15/kg $5.45/kg $8.09/kg $9.61/kg $19.01/kg $20.72/kg Forecourt Small Forecourt Small Neighborhood
(~1000 kg/day) (~100 kg/day) (~20 kg/day)
Hydrogen Market Figure 6
Obviously, an increase in electricity costs leads to an increase in hydrogen costs. For the forecourt case, the price of hydrogen increases from $4.15/kg to $5.45/kg, an increase of 31%. The price of hydrogen from the small forecourt case increases from $8.09/kg to $9.61/kg, an increase of 19%. Finally, the small neighborhood case increases from $19.01/kg to $20.72/kg, an increase of 9%. As the electricity price represents a smaller percentage of the hydrogen price contributions in the small neighborhood and small forecourt cases, the effect of using commercial electricity is decreased. However, as the technology improves capital costs will become less of a factor, and the effect of higher electricity costs will be significant for all systems, regardless of size.
9.0 Conclusions The cost of producing hydrogen via current electrolytic processes is largely dependent on the cost of electricity, the efficiencies of the systems, and the capital costs of the systems.
The cost of electricity and the system efficiencies are interrelated because either an increase in efficiency or a decrease in electricity costs will bring down the overall electricity cost contribution. However, the amount the system efficiency can be increased is limited, and current industry goals are to reduce the energy requirement of the system to around 50 kWh/kg of hydrogen (a system efficiency of 78%), including compression of the hydrogen gas to 6000 psig. While this increased efficiency will bring down the electrical cost contribution, it will not reduce the cost as much as a significant reduction in electricity price. If forecourt systems can use industrial priced electricity as opposed to commercial priced electricity, hydrogen prices can be reduced by 31%. If even lower
16

priced electricity alternatives are available they should be evaluated for electrolytic hydrogen production.
The smaller systems have a two-fold challenge. First the capital costs of such systems need to be reduced so that those costs are no longer a major cost contribution. All electrolysis systems will benefit from a reduction in capital results as the hydrogen economy grows and these systems are mass produced, but the smaller systems will benefit the most, as the largest percentage of their hydrogen cost contribution comes from capital costs. Second, a scenario must exist where systems that require 15-300kW of electricity can negotiate for industrial electricity prices, as opposed to the costly commercial or residential prices. Such a scenario may require a shift in the price policies of the power companies.
Another challenge of the electrolysis industry is the limited hydrogen production rates of the current units. Electrolysis units are sized to meet the demands of today’s hydrogen markets, but in a world where a hydrogen economy exists, today’s systems are too small to take advantage of the potential low cost, high volume electricity production methods such as wind and nuclear power. In order to effectively use the large amounts of electricity produced from such systems, electrolyzers 10 to 100 times the size of today’s units could be utilized.
10.0 Future Work Several opportunities for further analysis exist, and are briefly described.
10.1. Sensitivity Analyses Monte Carlo sensitivity analysis and tornado diagrams need to be completed for the next phase of this study to better understand the relationship between parameters included in the study and hydrogen price.
10.2. Future electrolysis The purpose of this study was to develop an understanding of the electrolytic hydrogen production technology today. However, it may be years before this technology becomes an important player in the transportation fuel arena. The future costs of hydrogen production via electrolysis need to be researched and analyzed.
10.3. Distributed generation and H2 production In order for electrolysis to produce low cost hydrogen, low cost electricity must be available. Scenarios need to be researched under which electricity could be available to forecourt sized electrolyzers for prices equal to or less than current industrial electricity prices. One of the scenarios that may be of particular interest in longer-term models is distributed hydrogen generation and its relationship to distributed power.
10.4. “Off Peak” Electricity Oftentimes off peak electricity prices are used as a scenario by which electrolytic hydrogen production can become more economical. However, a better understanding of
17

the off peak pricing and the effect that large-scale hydrogen production would have on off peak pricing is needed.
10.5. Oxygen credits Oxygen by-product credits are another way electrolytic hydrogen is also made more economical. A better understanding of the current and future oxygen market is needed to justify such a credit.
10.6. Power requirements The power requirements of electrolysis systems are not insignificant. The largest forecourt system requires 2.3 MW of power. A better understanding of the current power infrastructure needs to be understood, so the feasibility of delivering 2.3 MW of power to a forecourt station can be validated. The chart in Appendix A shows the power requirements for each size of electrolyzer in this study.
10.7. Additional scenarios for small neighborhood and home The market for small neighborhood and home transportation fuel production does not currently exist. Additional analysis could be done to better understand how electrolysis units would have to function in such a market. As an example, in this analysis, the fixed O&M costs include the labor, general and administrative (G&A), property tax and insurance costs required for an electrolysis plant. For the small neighborhood size, it was assumed that these units would serve 5 to 50 cars a year, and would resemble a typical filling station, but smaller. However, the validity of this assumption needs to be examined for the small neighborhood and also for home refueling units. These electrolysis units may be different from the filling stations today and require less land, labor, insurance and property tax charges. Particularly with home electrolysis, the refueling units would need to operate as an appliance; the homeowner would do any maintenance with occasional expert help brought in for repairs. As a result, insurance and property taxes would not be assessed, and labor and G&A costs should be greatly reduced. This would lead to an overall reduction in the hydrogen costs for these smaller units. A better understanding of the needs and associated costs of hydrogen production in the home and neighborhood market is needed.
18

11.0 Appendix
11.1. Appendix A: Overview of Current Electrolysis Systems
Manufacturer Model Technology Hydrogen Production
Rate
Hydrogen product pressure Energy Requirement
Power required
for max H2 production H2 Purity Lifetime
Nm3/hr kg/hr psig kWh/Nm3 kWh/kg kW % years Min Max Min Max
Avalence Hydrofiller 15 Unipolar Alkaline 0.4 0.04 up to 10,000 psig 5.13 56.4 2 99.7
Avalence Hydrofiller 50 Unipolar Alkaline 1.3 0.1 up to 10,000 psig 5.33 59.2 7 99.7
Avalence Hydrofiller 175 Unipolar Alkaline 4.6 0.4 up to 10,000 psig 5.43 60.5 25 99.7
Norsk Atmospheric Type No.5010 (4000 Amp DC) Bipolar Alkaline 0 50 0 4.5 0.3 4.8 53.4 240
99.9 ± 0.1 7-10
Norsk Atmospheric Type No.5010 (5150 Amp DC) Bipolar Alkaline 0 50 0 4.5 0.3 4.8 53.4 240
99.9 ± 0.1 7-10
Norsk Atmospheric Type No.5020 (4000 Amp DC) Bipolar Alkaline 50 150 4.5 13.5 0.3 4.8 53.4 720
99.9 ± 0.1 7-10
Norsk Atmospheric Type No.5020 (5150 Amp DC) Bipolar Alkaline 50 150 4.5 13.5 0.3 4.8 53.4 720
99.9 ± 0.1 7-10
Norsk Atmospheric Type No.5030 (4000 Amp DC) Bipolar Alkaline 150 300 13.5 27.0 0.3 4.8 53.4 1440
99.9 ± 0.1 7-10
Norsk Atmospheric Type No.5030 (5150 Amp DC) Bipolar Alkaline 150 300 13.5 27.0 0.3 4.8 53.4 1440
99.9 ± 0.1 7-10
3 This energy requirement was calculated using the input power value in kW provided by Avalence
19

Manufacturer Model Technology Hydrogen Production
Rate
Hydrogen product pressure Energy Requirement
Power required
for max H2 production H2 Purity Lifetime
Nm3/hr kg/hr psig kWh/Nm3 kWh/kg kW % years Min Max Min Max
Norsk Atmospheric Type No.5040 (4000 Amp DC) Bipolar Alkaline 300 377 27.0 33.9 0.3 4.8 53.4 1810
99.9 ± 0.1 7-10
Norsk Atmospheric Type No.5040 (5150 Amp DC) Bipolar Alkaline 300 485 27.0 43.6 0.3 4.8 53.4 2328
99.9 ± 0.1 7-10
Norsk HPE 10 Bipolar Alkaline 10 0.9 232 4.84 53.4 48 99.8 7-10 Norsk HPE 12 Bipolar Alkaline 12 1.1 232 4.84 53.4 58 99.8 7-10 Norsk HPE 16 Bipolar Alkaline 16 1.4 232 4.84 53.4 77 99.8 7-10 Norsk HPE 20 Bipolar Alkaline 20 1.8 232 4.84 53.4 96 99.8 7-10 Norsk HPE 24 Bipolar Alkaline 24 2.2 232 4.84 53.4 115 99.8 7-10 Norsk HPE 30 Bipolar Alkaline 30 2.7 232 4.84 53.4 144 99.8 7-10 Norsk HPE 40 Bipolar Alkaline 40 3.6 232 4.84 53.4 192 99.8 7-10 Norsk HPE 50 Bipolar Alkaline 50 4.5 232 4.84 53.4 240 99.8 7-10 Norsk HPE 60 Bipolar Alkaline 60 5.4 232 4.84 53.4 288 99.8 7-10 Proton HOGEN H Series PEM 0 6 0 0.5 218 6.3 70.1 38 99.999 Proton HOGEN 20 PEM 0.5 0.04 200 5.6 62.3 3 99.999 5-7 Proton HOGEN 40 PEM 1 0.1 200 5.6 62.3 6 99.999 5-7 Proton HOGEN 380 PEM 10 0.9 200 6.3 70.1 63 99.999 5-7 Stuart IMET 1000, 1 cell stack, 1000 cm3 Bipolar Alkaline 3 5 0.3 0.4 360 4.8 53.4 24 99.997 10 Stuart IMET 1000, 2 cell stack, 1000 cm3 Bipolar Alkaline 16 30 1.4 2.7 360 4.8 53.4 144 99.997 10
4 This energy requirement was calculated using the total plant energy requirement in kW provided by Norsk Hydro
20

Manufacturer Model Technology Hydrogen Production
Rate
Hydrogen product pressure Energy Requirement
Power required
for max H2 production H2 Purity Lifetime
Nm3/hr kg/hr psig kWh/Nm3 kWh/kg kW % years Min Max Min Max
Stuart IMET 1000, 3 cell stack, 1000 cm3 Bipolar Alkaline 31 45 2.8 4.0 360 4.8 53.4 216 99.997 10 Stuart IMET 1000, 4 cell stack, 1000 cm3 Bipolar Alkaline 64 60 5.8 5.4 360 4.8 53.4 288 99.997 10 Stuart IMET 1000, 6 cell stack, 1000 cm3 Bipolar Alkaline 90 8.1 360 4.8 53.4 360 99.997 10 Stuart IMET 300, 1 cell stack, 300 cm3 Bipolar Alkaline 1 3 0.1 0.3 360 4.9 54.5 15 99.997 10 Teledyne EC-500 Bipolar Alkaline 28 2.5 60-115 5.6 62.3 157 99.9998 15 Teledyne EC-600 Bipolar Alkaline 33.6 3.0 60-115 5.6 62.3 188 99.9998 15 Teledyne EC-750 Bipolar Alkaline 42 3.8 60-115 5.6 62.3 235 99.9998 15 Teledyne HM-50 Bipolar Alkaline 2.8 0.3 100 6.1 67.9 17 99.9998 15 Teledyne HM-100 Bipolar Alkaline 5.6 0.5 100 5.7 63.4 32 99.9998 15 Teledyne HM-125 Bipolar Alkaline 7 0.6 100 5.7 63.4 40 99.9998 15 Teledyne HM-150 Bipolar Alkaline 8.4 0.8 100 5.7 63.4 48 99.9998 15 Teledyne HM-200 Bipolar Alkaline 11.2 1.0 100 5.3 59.0 59 99.9998 15
21

11.2. Appendix B: Higher Heating Value Justification
The reaction of the formation of water is:
H2 + ½ O2 -> H2O + energy
At 25 C and 1 atm, the heat of formation of liquid water, or the energy released when water is formed in the reaction above is 39 kWh/kg of hydrogen. This value is the higher heating value (HHV) of hydrogen. The heat of formation of steam is 33 kWh/kg of hydrogen, and is the lower heating value (LHV) of hydrogen.
The electrolysis reaction is the opposite of the formation of water reaction:
H2O + energy -> H2 + ½ O2
For purposes of electrolysis in this report liquid water, and not steam, is electrolyzed to produce hydrogen. So the reaction above is the reverse of the formation of liquid water. As a result, the amount of energy needed to create hydrogen from water using electrolysis is 39 kWh/kg. In order to determine the efficiency of the electrolysis process, the theoretical amount of energy needed, 39 kWh/kg of hydrogen, needs to be divided by the actual amount of energy used by the electrolysis unit to create hydrogen.
The reason this distinction is important is because by using the lower heating value, we misrepresent the efficiency of electrolyzers. If you use LHV, to calculate the efficiencies, the efficiencies are low. For example, the Stuart IMET 1000 series electrolyzers are calculated to be 33 kWh/kg (LHV) ÷ 53.4 kWh/kg (the energy required to produce 1 kg of hydrogen using Stuart electrolyzer) which equals 64%. Using the HHV of 39 kWh/kg yields an efficiency of 73%. Another way to look at it is if the actual energy required to create 1 kg of hydrogen, 39 kWh/kg, is divided into the LHV value, the maximum efficiency of the electrolysis process is 33.3/39.4 = 84.5%. That is to say, that an electrolyzer that converts every kWh of input energy into hydrogen energy will have only 84.5% efficiency, even though there are no losses5.
5 Merer, Rupert. " RE: H2A Update." Personal e-mail. 17 Mar. 2004.
22

11.3. Appendix C: Bibliography
Andreassen, Knut. “Hydrogen Production by Electrolysis.” Hydrogen Power: Theroretical and Engineering Solutions. Ed T.O. Saetre. Proceedings of the HYPOTHESIS II Symposium, 18-22 Aug. 1997, Grimstad, Norway. London: Klewer Academic Publishers, 1998.
Avalence LLC. “Hydrofiller Series Specifications.” Brochure. The 16th NREL Industry Growth Forum, 17 Nov. – 19 Nov. 2003, Hyatt Regency Austin.
Bortel, Jeffrey. Personal interview. 11 Nov. 2003.
Cloumann, Andres. “RE: Norsk systems.” E-mail to Matthew Kauffman. 5 Jan. 2004.
Delivering the Power of Hydrogen. Stuart Energy, 20 Oct. 2003 <http://www.stuartenergy.com/index.html>.
Eliassen, Bjorn E. Norsk Hydro Electrolyzers Electrolyzer Hydrogen Plant 485 Nm3/h Hydrogen. Norsk Hydro Electrolyzers, AS, 8 Aug. 2002.
Fairlie, Matthew and Jim Hinatsu. Personal interview. 26 Jan. 2004.
Goel, Nitin, Samantha Mirabal, H.A. (Skip) Ingley, and D. Yogi Goswami. “Hydrogen Production.” Advances in Solar Energy: An Annual Review of Research and Development 15 (2003): 411-6.
Hinatsu, Jim. " RE: Electrolysis Analysis." Personal e-mail. 20 Feb. 2004.
Hinatsu, Jim. " RE: H2A Update." Personal e-mail. 17 Mar. 2004.
Hoffmann, Peter. Tomorrow’s Energy: Hydrogen, Fuel Cells and the Prospects for a Cleaner Planet. Cambridge, Massachusetts: The MIT Press, 2001.
Maloney, Tom. "Electrolysis Report." Personal e-mail. 5 Mar. 2004.
Merer, Rupert. " RE: H2A Update." Personal e-mail. 17 Mar. 2004.
Norsk Hydro Electrolyzers AS: World Leader in Water Electrolysis. Norsk Hydro Electrolysers AS, 6 Nov. 2003 <http://www.electrolysers.com/>.
Naqvi, Syed N. “Small-Scale Hydrogen Production by Electrolysis of Water.” Small-Scale Hydrogen Production. Menlo Park, California: Process Economics Program, 2003.
23

Peters, Max S., Klaus D. Timmerhaus, and Ronald E. West. Plant Design and Economics for Chemical Engineers. New York: McGraw Hill, 2003.
Placet, Marylynn. “RE: Quick Question.” Personal e-mail. 30 Jan. 2004.
Proton Energy Systems, Inc. Proton Energy Systems, Inc., 21 Oct. 2003 <http://www.protonenergy.com/>.
Proton Energy Systems, Inc. HOGEN Hydrogen Generators. 2002. <http://www.protonenergy.com/html/gasproducts/generators/files/industrial_broc hure-english.pdf>.
Shimko, Martin. “NREL Electrolysis Analysis Report.” Personal e-mail. 8 Mar. 2004.
Stuart Energy. Hydrogen Energy Station: Welcome to the Evolution of Energy. 2003.
Teledyne Energy Systems, Inc. Description: Hydrogen Generation System.
Teledyne Energy Systems, Inc. Teledyne Energy Systems, Inc., 21 Oct. 2003 <http://www.teledyneenergysystems.com/>.
Teledyne Titan EC Generator Series. Teledyne Energy Systems, Inc. 5 Jun. 2002. <http://www.teledyneenergysystems.com/pdf/Titan_EC_june02.pdf>
Teledyne Titan HM Generator Series. Teledyne Energy Systems, Inc. 5 Jun. 2002. <http://www.teledyneenergysystems.com/pdf/Titan_EC_june02.pdf>.
Turner, John. Personal interview. 19 Mar. 2004.
24

REPORT DOCUMENTATION PAGE Form Approved OMB No. 0704-0188
The public reporting burden for this collection of information is estimated to average 1 hour per response, including the time for reviewing instructions, searching existing data sources, gathering and maintaining the data needed, and completing and reviewing the collection of information. Send comments regarding this burden estimate or any other aspect of thiscollection of information, including suggestions for reducing the burden, to Department of Defense, Executive Services and Communications Directorate (0704-0188). Respondents should be aware that notwithstanding any other provision of law, no person shall be subject to any penalty for failing to comply with a collection of information if it does not display acurrently valid OMB control number. PLEASE DO NOT RETURN YOUR FORM TO THE ABOVE ORGANIZATION. 1. REPORT DATE (DD-MM-YYYY)
September 2004 2. REPORT TYPE
Milestone Report 3. DATES COVERED (From - To)
4. TITLE AND SUBTITLE Summary of Electrolytic Hydrogen Production: Milestone Completion Report
5a. CONTRACT NUMBER DE-AC36-99-GO10337
5b. GRANT NUMBER
5c. PROGRAM ELEMENT NUMBER
6. AUTHOR(S) J. Ivy
5d. PROJECT NUMBER NREL/MP-560-36734
5e. TASK NUMBER HY04.5640
5f. WORK UNIT NUMBER
7. PERFORMING ORGANIZATION NAME(S) AND ADDRESS(ES) National Renewable Energy Laboratory 1617 Cole Blvd. Golden, CO 80401-3393
8. PERFORMING ORGANIZATION REPORT NUMBER NREL/MP-560-36734
9. SPONSORING/MONITORING AGENCY NAME(S) AND ADDRESS(ES) 10. SPONSOR/MONITOR'S ACRONYM(S) NREL
11. SPONSORING/MONITORING AGENCY REPORT NUMBER
12. DISTRIBUTION AVAILABILITY STATEMENT National Technical Information Service U.S. Department of Commerce 5285 Port Royal Road Springfield, VA 22161
13. SUPPLEMENTARY NOTES
14. ABSTRACT (Maximum 200 Words) This report provides an overview of the current state of electrolytic hydrogen production techonologies and an economic analysis of the processes and systems available as of December 2003. The operating specifications of commercially available electrolyzers from five manufacturers, i.e., Stuart, Teledyne, Proton, Norsk Hydro, and Avalence, are summarized. Detailed economic analyses of three systems for which cost and economic data were available were completed. The contributions of the cost of electricity, system efficiency, and capital costs to the total cost of electrolysis are discussed.
15. SUBJECT TERMS Economics of Electrolysis; Electrolytic Hydrogen Production; Technoeconomic Analysis of Electrolysis
16. SECURITY CLASSIFICATION OF: 17. LIMITATION OF ABSTRACT
UL
18. NUMBER OF PAGES
19a. NAME OF RESPONSIBLE PERSON
a. REPORT Unclassified
b. ABSTRACT Unclassified
c. THIS PAGE Unclassified 19b. TELEPONE NUMBER (Include area code)
Standard Form 298 (Rev. 8/98) Prescribed by ANSI Std. Z39.18