Embed Size (px)
Citation preview

- 1 -
May 10, 2018
Summary of Consolidated Financial Statements
for the Fiscal Year Ended March 31, 2018 [Prepared under Japanese GAAP, UNAUDITED]
NISSIN FOODS HOLDINGS CO., LTD.
Stock code: 2897
Stock exchange listing: Tokyo
URL: https://www.nissin.com/jp/
https://www.nissin.com/en_jp/
Phone: +81-3-3205-5111
Representative: Koki Ando, Representative Director, President and CEO
Contact: Yukio Yokoyama, Director , CFO, and Managing Executive Officer
Scheduled date of general meeting of shareholders: June 27, 2018 (Japanese only)
Scheduled date of filing of securities report: June 27, 2018 (Japanese only)
Scheduled date of dividend payment: June 28, 2018
Preparation of supplementary documents: Yes
Holding of financial results meeting: Yes (for institutional investors and analysts)
(All amounts are rounded down to the nearest million yen)
1. Consolidated Financial Results for the Fiscal Year ended March 31, 2018 (April 1, 2017–March 31, 2018) (1) Operating Results
(% figures represent year-on-year changes)
Net sales Operating income Ordinary income Net income attributable to owners of parent
(¥ million) (%) (¥ million) (%) (¥ million) (%) (¥ million) (%)
FY 2018 516,400 +4.2 34,112 +19.2 40,588 +23.5 29,104 +23.5 FY 2017 495,715 +5.9 28,618 +8.4 32,864 +6.9 23,558 -12.4
Note: Comprehensive income: FY 2018: ¥33,236 million (up 202.4%); FY 2017: ¥10,991 million (down 43.9%)
Net income
attributable
to owners of parent
per share (primary)
(¥)
Net income
attributable
to owners of parent
per share (diluted)
(¥)
Return on equity
(%)
Ordinary
income/total assets
(%)
Operating income/
net sales (%)
FY 2018 279.52 278.16 8.2 7.3 6.6
FY 2017 221.33 220.25 6.7 6.0 5.8
Reference: Equity in earnings of affiliates: FY 2018: ¥2,680 million; FY 2017: ¥1,687 million (2) Financial Position
Total assets Net assets Equity ratio Net assets per share
As of (¥ million) (¥ million) (%) (¥)
March 31, 2018 568,111 391,776 64.5 3,519.36 March 31, 2017 537,180 353,517 63.5 3,276.55
Reference: Equity attributable to owners of parent: as of March 31, 2018: ¥366,486 million, as of March 31, 2017: ¥341,057 million
(3) Cash Flows
Net cash provided by
operating activities
(¥ million)
Net cash used in
investing activities
(¥ million)
Net cash used in
financing activities
(¥ million)
Cash and cash
equivalents at end of
year (¥ million)
FY 2018 44,890 (47,781) (11,126) 49,620
FY 2017 33,151 (29,814) (26,055) 67,563

- 2 -
2. Details of Dividends Cash dividend per share
Total amount
of dividends
(Annual)
Payout ratio
(consolidated)
Ratio of total
amount of
dividends to net
assets
(consolidated)
End of 1st
quarter
End of 2nd
quarter
End of 3rd
quarter Year-end Annual
(¥) (¥) (¥) (¥) (¥) (¥ million) (%) (%)
FY 2017 — 40.00 — 45.00 85.00 9,011 38.4 2.6 FY 2018 — 45.00 — 45.00 90.00 9,371 32.2 2.6
FY 2019 — 55.00 — 55.00 110.00 44.1
(Forecast)
3. Forecasts of Consolidated Results for the FY 2019 (April 1, 2018–March 31, 2019)
(% figures represent changes from the previous year)
Revenue Operating profit Profit
attributable to
owners of parent
Basic earnings per share
(¥ million) (%) (¥ million) (%) (¥ million) (%) (¥)
FY 2019 455,000 - 36,000 - 26,000 - 249.68
(Note) The above consolidated results forecasts are presented based on the International Financial Reporting Standards (IFRS) because
the Company has decided to voluntarily adopt the IFRS, starting with its consolidated financial statements for the first three months of
the fiscal year ended March 31, 2019. Changes (%) from the actual results of the fiscal year ended March 31, 2018, which have been
prepared in compliance with the Japanese Accounting Standards, are not presented in the above forecasts.
Notes:
(1) Changes in principal subsidiaries during the FY 2018 (changes in specified subsidiaries that resulted in changes in scope of
consolidation): None
-Newly consolidated: None
-Excluded from consolidation: None
(2) Changes in significant accounting policy, procedure and presentation methods for consolidated financial statements:
1) Changes due to revisions of accounting standards: None
2) Changes other than 1): None
3) Changes in accounting estimates: None
4) Retrospective restatement: None
(3) Number of shares outstanding (common stock)
1) Number of shares outstanding (including treasury stock) as of the end of:
FY 2018 117,463,685 shares
FY 2017 117,463,685 shares
2) Number of shares of treasury stock outstanding as of the end of:
FY 2018 13,329,298 shares
FY 2017 13,373,235 shares
3) Average number of shares outstanding during the period:
FY 2018 104,122,031 shares
FY 2017 106,439,006 shares

- 3 -
(Reference) Individual (Nissin Foods Holdings Co., Ltd.) Financial Results for the Fiscal Year ended March 31,
2018 (April 1, 2017–March 31, 2018)
(1) Operating Results (% figures represent year-on-year changes)
Net sales Operating income Ordinary income Net income (¥ million) (%) (¥ million) (%) (¥ million) (%) (¥ million) (%)
FY 2018 45,980 -3.4 14,583 -15.5 16,949 -12.9 16,326 -25.0 FY 2017 47,611 +25.4 17,256 +111.3 19,452 +117.8 21,771 +159.6
Net income
attributable to
owners of parent
per share (primary)
(¥)
Net income
attributable to
owners of parent
per share (diluted)
(¥)
FY 2018 156.80 156.04 FY 2017 204.55 203.55
(2) Financial Position
Total assets Net assets Equity ratio Net assets per share
(¥ million) (¥ million) (%) (¥)
FY 2018 371,023 241,382 64.6 2,300.52
FY 2017 372,447 226,796 60.5 2,163.22
Reference: Equity attributable to owners of parent: as of March 31, 2018: ¥239,562 million, as of March 31, 2017: ¥225,170 million
* This summary of consolidated financial statements is outside the scope of audits by certified public accountants or audit firms.
* Notes for proper use of forecasts and other remarks
Disclaimer regarding appropriate use of forecasts:
Forecasts contain forward-looking statements based on estimates made as of the day of release of these materials. Actual results
may differ materially depending on a number of factors including but not limited to potential risks and uncertainties. Please refer
to page 6 for “(4) Explanation Concerning Consolidated Forecasts” of “1. Analysis of Operating Results and Financial Position.”
How to obtain supplemental information material:
The material is available through TDnet and the company’s website.

- 4 -
1.Analysis of Operating Results and Financial Position (1) Qualitative Information Concerning Consolidated Business Results
During the consolidated fiscal year under review, the global economy generally recovered, although there was
concern about uncertainties regarding policy directions in the United States and Europe and the effects of fluctuations
in the financial and capital markets. In Western countries, economies showed a steady recovery, reflecting an
expansion in consumer spending against a backdrop of favorable employment and income conditions. In Asia,
including China, the economy also continued to recover owing to solid internal and external demand.
In Japan, corporate earnings remained firm on the back of this growth in the global economy. Consumer
spending also recovered, reflecting continued improvements in the employment and income conditions, and the
economy continued to recovery moderately.
In the instant noodles industry, total worldwide demand recovered to 100 billion units, reflecting growth in
demand in many regions including Asian emerging countries. Domestic total demand reached a record high.
Under this environment, based on the “Medium-Term Management Plan 2021,” of which term covers five
years from the fiscal year ended March 31, 2017, to realize the improvements of “Earning power through operations”
and “Value in capital markets,” we are working on the strategic themes such as 1) Promoting global branding, 2)
Focusing on priority overseas locations, 3) Laying stronger foundations for our domestic profit base, 4) Establishing a
second pillar that generates revenue and profit, 5) Developing and strengthening human resources for global
management.
〈Consolidated results〉 (¥ Million)
FY 2017 FY 2018 Year on year
From April 1, 2016
To March 31, 2017
From April 1, 2017
To March 31, 2018 Amount %
Net sales 495,715 516,400 + 20,684 + 4.2
Operating income 28,618 34,112 + 5,493 + 19.2
Ordinary income 32,864 40,588 + 7,724 + 23.5
Net income
attributable to owners
of parent
23,558 29,104 + 5,545 + 23.5
The following is an overview of performance by reportable segment.
〈Sales and Operating income by reportable segment〉 (¥ Million)
Net sales
Change Operating income
Change FY 2017 FY 2018 FY 2017 FY 2018
NISSIN FOOD
PRODUCTS 228,560 232,932 + 4,372 27,683 28,291 + 608
MYOJO
FOODS 40,612 41,487 + 875 1,784 2,056 + 271
Chilled and
frozen foods 61,794 64,004 + 2,210 1,933 2,140 + 207
The Americas 60,420 64,455 + 4,035 2,309 2,023 - 285
China 35,987 42,583 + 6,595 3,405 3,569 + 163
Other 68,341 70,936 + 2,594 2,638 1,974 - 664
Total 495,715 516,400 + 20,684 39,755 40,056 + 300
Note: Segment income is reconciled to operating income of the consolidated statements of income.
Note: “Other” includes business segments not included in reportable segments such as domestic confectionary, beverages,
Europe and Asia.

- 5 -
(i) NISSIN FOOD PRODUCTS
The sales of NISSIN FOOD PRODUCTS Co., Ltd. increased year on year with a rise in sales of cup-type
noodles and instant rice products, despite the effects of the weak market for bag-type noodle products.
In cup-type noodles, sales of the CUP NOODLE series remained steady, including CUP NOODLE NICE, a
product line featuring a rich soup that was launched in April 2017, distinguished by 50% less fat, 40% less
carbohydrates, and only 178 kilocalories. The NISSIN MENSHOKUNIN series, which was renewed in August 2017,
also remained strong. In bag-type noodle products, the OWAN series, which was released in September 2017
featuring the concept of “noodle soup in the amount of one Owan bowl volume suitable to serve as an extra side
dish!”, contributed to an increase in sales.
In the category of instant rice products, sales of the NISSIN CURRY MESHI continued to do well. Meanwhile,
the enhanced lineup of products that need only hot water to cook them, such as the BUKKOMI MESHI series and the
NIHON MESHI series, contributed to the sales growth.
(ii) MYOJO FOODS
Looking at sales of MYOJO FOODS Co., Ltd, the Myojo Non-Fried Charumera Tonkotsu featuring hard
noodle attribute continued to perform well in the Myojo Charumera series of bag-type noodles, and sales of Myojo
Hyobanya series, which included a new product featuring Miso taste, was also solid. As a result, the company
registered an increase in sales.
Sales of cup-type noodles also picked up, reflecting the growth of the Myojo Umadashiya series that were
launched last year, as well as the Myojo Bubuka series and the Myojo Charumera Cup series.
(iii) Chilled and frozen foods
At NISSIN CHILLED FOODS Co., Ltd., sales of ramen products remained steady, mainly due to the effects of
the renewal of Ramenya-san, a core brand, and favorable evaluations of easy cooking highlighted in the Fry Pan
Hitotsu De series. However, sales declined overall year on year, reflecting the effects of a decrease in sales of fried
noodle products due to sluggish demand and an intensifying competitive environment.
NISSIN FROZEN FOODS Co., Ltd. saw steady sales, mainly led by pasta and ramen products with precooked
ingredients. In pasta products, the Reito NISSIN Mochitto Nama Pasta series, including Creamy Bolognese with
minced beef and maitake mushroom, continued to post strong sales. In addition, the NISSIN Spa Oh BIG and the
NISSIN Spa Oh Premium series featuring voluminous and premium attributes, respectively, performed well. As for
ramen products with precooked ingredients, products such as Reito NISSIN Chuka Shirunashi Tan Tan Men and Reito
NISSIN GooTa Lajao Tan Tan Men remained solid, registering an increase in profit overall.
(iv) The Americas
The Americas is working on creating value-added markets as well as empowering existing products to become
less susceptible to the effects of price competition. In this situation, sales increased, reflecting the renewal of CUP
NOODLES in the U.S. and Brazil in September 2016 as well as the release of high quality CUP NOODLES in the
United States. However, profit declined in the Americas segment due to the deterioration of external conditions in the
United States, such as increases in logistics expenses and personnel cost, although some factors such as price
revisions in Brazil and a decline in the cost of main raw materials contributed to an increase in profit.
(v) China
In China, the instant noodle market has bottomed out in mainland China, and the market for high-end products
is expanding. In this environment, the Group worked to expand its geographical sales area (the north, northeast, and
southwest areas) and strengthen CUP NOODLES in China. Meanwhile, the Demae Iccho remained strong in both the
Hong Kong area and mainland China. In addition, MC Marketing & Sales (Hong Kong) Limited, which became a
consolidated subsidiary in the fourth quarter of the previous fiscal year, contributed to the increase in sales.
(2) Analysis of Financial Position
Note: Refer to pages from 7 to 8 for further information.

- 6 -
(3) Analysis of Cash Flows
〈Cash Flow〉 (¥ Million)
FY 2017 FY 2018
Change From April 1, 2016
To March 31, 2017
From April 1, 2017
To March 31, 2018
Net cash provided by operating activities 33,151 44,890 + 11,739
Net cash used in investing activities (29,814) (47,781) - 17,967
Net cash used in financing activities (26,055) (11,126) + 14,928
Effect of exchange rate changes on cash and
cash equivalents 1,360 (3,185) - 4,545
Net increase (decrease) in cash and cash
equivalents (21,357) (17,203) + 4,154
Cash and cash equivalents at beginning of the
year 88,689 67,563 - 21,125
Cash and cash equivalents at end of the year 67,563 49,620 - 17,942
Please refer to pages from 13 to 14 for details of cash flow.
(4) Explanation Concerning Consolidated Forecasts
Please refer to page 1 for the full-year forecasts for the fiscal year ended March 31, 2019 (from April 1, 2018
to March 31, 2019). The Company has decided to voluntarily adopt the International Financial Reporting Standards
(IFRS) starting with its consolidated financial statements for the first three months of the fiscal year ended March 31,
2019. Therefore, the aforementioned forecasts of consolidated results have been prepared based on the IFRS.
The projected exchange rates for the major currencies used in the forecasts for overseas subsidiaries are
¥106.2 to US$1.00, ¥13.5 to HK$1.00, ¥16.9 to CNY1.00, and ¥32.0 to BRL1.00.
2.Basic Concept of the Selection of Accounting Standards
From the perspective of the international comparability of financial information and quality improvements in
business administration, the Group will voluntarily adopt the International Financial Reporting Standards (IFRS),
starting with its consolidated financial statements for the first three months of the fiscal year ended March 31, 2019.

- 7 -
3.Consolidated Financial Statements and Major Notes
1. Consolidated Balance Sheets (¥ Million)
FY 2017
As of March 31, 2017
FY 2018
As of March 31, 2018
Assets
Current assets
Cash and deposits 70,919 56,131
Notes and accounts receivable—trade 65,290 69,133
Marketable securities 1,155 51
Finished goods and merchandise 12,697 13,990
Raw materials and supplies 16,209 15,441
Deferred tax assets 5,149 4,683
Others 6,849 11,113
Allowance for doubtful receivables (385) (398)
Total current assets 177,887 170,147
Fixed assets
Tangible fixed assets
Building and structures, net 60,936 64,830
Machinery, equipment and vehicles, net 50,689 57,898
Tools and fixtures, net 4,200 4,117
Land 52,748 52,507
Leased assets, net 3,400 3,016
Construction in progress 14,488 30,135
Others, net 1,550 1,566
Total tangible fixed assets 188,013 214,071
Intangible fixed assets
Goodwill 30,464 25,970
Others 13,606 11,294
Total intangible fixed assets 44,070 37,264
Investments and other assets
Investments in securities 120,136 138,606
Investments in capital 782 715
Long-term loans 918 39
Deferred tax assets 2,120 4,667
Net defined benefit asset 335 405
Others 3,046 3,199
Allowance for doubtful receivables (132) (1,006)
Total investments and other assets 127,208 146,628
Total fixed assets 359,293 397,964
Total assets 537,180 568,111

- 8 -
(¥ Million)
FY 2017
As of March 31, 2017
FY 2018
As of March 31, 2018
Liabilities
Current liabilities
Notes and accounts payable—trade 51,705 56,635
Short-term borrowings 18,450 3,235
Accrued payables 32,961 33,230
Lease liabilities within one year 449 481
Accrued income taxes 7,926 5,886
Others 24,355 31,324
Total current liabilities 135,847 130,793
Long-term liabilities
Long-term debt 15,867 14,146
Lease liabilities beyond one year 2,863 2,523
Asset retirement obligations 55 78
Deferred tax liabilities 16,629 19,276
Deferred tax liabilities for remeasurements 2,002 956
Liability for retirement benefits 7,346 5,461
Others 3,051 3,099
Total long-term liabilities 47,815 45,541
Total liabilities 183,662 176,335
Equity
Shareholders’ equity
Common stock 25,122 25,122
Capital surplus 49,823 51,218
Retained earnings 308,074 327,996
Treasury stock, at cost (58,190) (58,002)
Total shareholders’ equity 324,830 346,335
Accumulated other comprehensive income
Unrealized gain on available-for-sale securities 23,794 31,419
Deferred gain (loss) on hedges - (35)
Land revaluation reserve (6,382) (5,492)
Foreign currency translation adjustments (1,403) (6,867)
Accumulated remeasurements of retirement
benefits plans 218 1,127
Total accumulated other comprehensive income 16,227 20,151
Stock acquisition rights 1,626 1,819
Non-controlling interests 10,833 23,470
Total equity 353,517 391,776
Total liabilities and equity 537,180 568,111

- 9 -
2. Consolidated Statements of Income and Comprehensive Income
(Consolidated Statements of Income) (¥ Million)
FY 2017
From April 1, 2016
To March 31, 2017
FY 2018
From April 1, 2017
To March 31, 2018
Net sales 495,715 516,400
Cost of sales 270,219 282,271
Gross profit 225,496 234,128
Selling, general and administrative expenses 196,878 200,016
Operating income 28,618 34,112
Non-operating income
Interest income 811 1,163
Dividend income 1,405 1,385
Gain on sales of marketable securities 1,332 888
Equity in earnings of affiliates 1,687 2,680
Others 896 1,737
Total non-operating income 6,133 7,855
Non-operating expenses
Interest expenses 356 432
Foreign exchange loss 774 157
Commission fee 276 163
Others 479 623
Total non-operating expenses 1,886 1,378 Ordinary income 32,864 40,588 Extraordinary gains
Gain on sales of fixed assets 141 769
Gain on sales of investments in securities 6,834 1,093
Insurance proceeds 283 427
Gain on change in equity - 4,352
Others 245 165
Total extraordinary gains 7,505 6,808
Extraordinary losses
Loss on sales of fixed assets 124 453
Loss on disposal of fixed assets 618 670
Impairment loss 977 5,346
Loss on valuation of stocks of subsidiaries and
affiliates 1,073 555
Provision of allowance for doubtful receivables - 829
Loss on business of subsidiaries and associates - 1,100
Loss due to a fire 511 -
Settlement payout due to contract change 585 -
Loss on closing factory 609 99
Others 351 818
Total extraordinary losses 4,851 9,872
Income before income taxes 35,517 37,525
Income taxes 12,819 11,528
Income taxes adjustment (1,029) (3,121)
Total income taxes 11,789 8,406
Net income 23,728 29,118 Net income attributable to non-controlling interests 170 14 Net income attributable to owners of parent 23,558 29,104
- 10 -
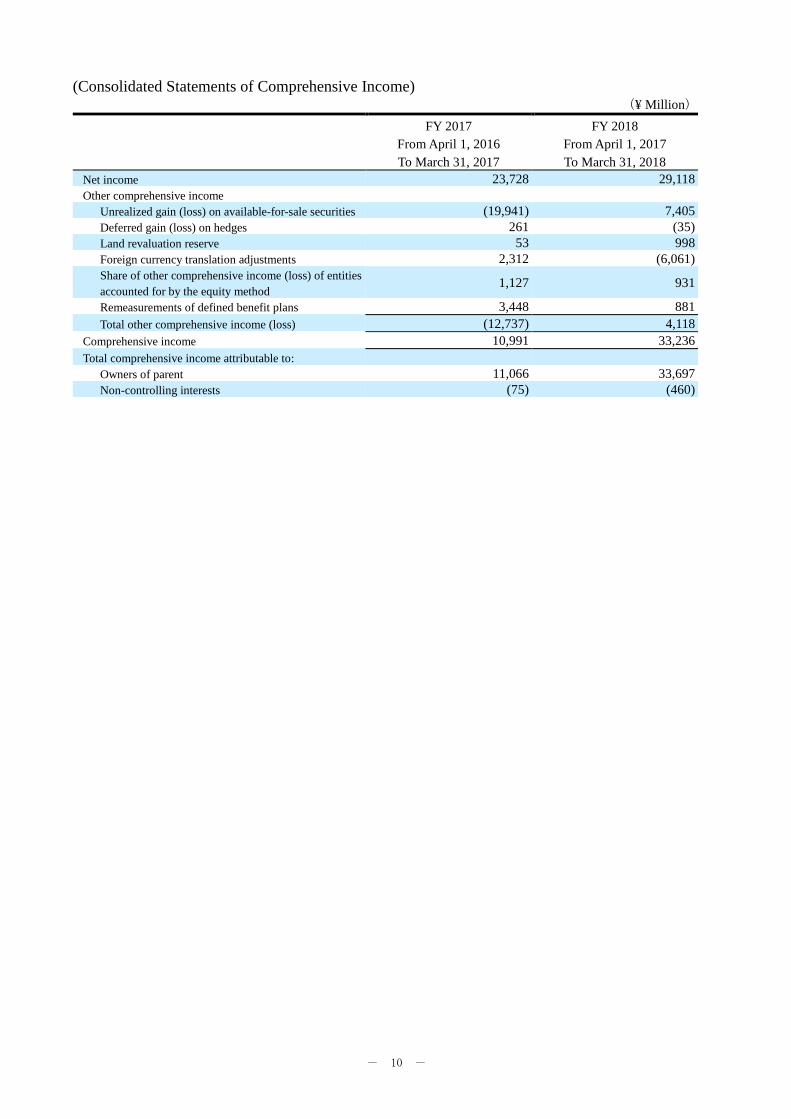
(Consolidated Statements of Comprehensive Income) (¥ Million)
FY 2017
From April 1, 2016
To March 31, 2017
FY 2018
From April 1, 2017
To March 31, 2018
Net income 23,728 29,118
Other comprehensive income
Unrealized gain (loss) on available-for-sale securities (19,941) 7,405
Deferred gain (loss) on hedges 261 (35)
Land revaluation reserve 53 998
Foreign currency translation adjustments 2,312 (6,061)
Share of other comprehensive income (loss) of entities
accounted for by the equity method 1,127 931
Remeasurements of defined benefit plans 3,448 881
Total other comprehensive income (loss) (12,737) 4,118
Comprehensive income 10,991 33,236
Total comprehensive income attributable to:
Owners of parent 11,066 33,697
Non-controlling interests (75) (460)

- 11 -
3. Consolidated Statements of Changes in Net Assets Fiscal Year ended March 31, 2017 (From April 1, 2016 to March 31, 2017)
(¥ Million)
Shareholder’s equity
Common stock Capital surplus Retained earnings Treasury stock Total shareholders’
equity Balance at the beginning of the
year 25,122 48,177 293,803 (35,836) 331,267
Increase (decrease) during the year
Cash dividends paid (8,648) (8,648)
Net income attributable to
owners of parent 23,558 23,558
Acquisition of treasury stock (22,939) (22,939)
Sales of treasury stock (84) 584 500 Reversal of land revaluation
reserve 56 56
Transfer from retained earnings to capital surplus
78 (78) -
Change in scope of
consolidation (228) (228)
Change of fiscal term of
consolidated subsidiaries (387) (387)
Change of interests held by
parent company due to
transactions with non-controlling-interest shareholder
1,652 1,652
Net changes of items other than
shareholders' equity -
Total increase (decrease) during
the year - 1,646 14,270 (22,354) (6,436)
Balance at the end of the year 25,122 49,823 308,074 (58,190) 324,830
Accumulated other comprehensive income
Stock acquisition
rights
Non-controlling
interests
Total
equity
Unrealized
gain on
available-
for-
sale
securities
Deferred
gain (loss)
on hedges
Land
revaluatio
n reserve
Foreign
currency
translation
adjustments
Accumulated
remeasuremen
ts of
retirement
benefits plans
Total
accumulate
d other
comprehens
ive income
Balance at the beginning of the
year 43,172 (261) (6,379) (4,576) (3,178) 28,774 1,859 9,786 371,688
Increase (decrease) during the year
Cash dividends paid (8,648) Net income attributable to owners of parent 23,558
Acquisition of treasury stock (22,939)
Sales of treasury stock 500
Reversal of land revaluation
reserve 56
Transfer from retained earnings
to capital surplus -
Change in scope of consolidation (228)
Change of fiscal term of
consolidated subsidiaries (387)
Change of interests held by
parent company due to
transactions with non-
controlling-interest shareholder
1,652
Net changes of items other than shareholders' equity (19,377) 261 (2) 3,173 3,397 (12,547) (233) 1,046 (11,734)
Total increase (decrease) during
the year (19,377) 261 (2) 3,173 3,397 (12,547) (233) 1,046 (18,170)
Balance at the end of the year 23,794 - (6,382) (1,403) 218 16,227 1,626 10,833 353,517

- 12 -
Fiscal Year ended March 31, 2018 (From April 1, 2017 to March 31, 2018)
(¥ Million)
Shareholder’s equity
Common stock Capital surplus Retained earnings Treasury stock Total shareholders’
equity Balance at the beginning of the
year 25,122 49,823 308,074 (58,190) 324,830
Increase (decrease) during the year
Cash dividends paid (9,369) (9,369) Net income attributable to
owners of parent 29,104 29,104
Acquisition of treasury stock (8) (8)
Sales of treasury stock (25) 196 171 Reversal of land revaluation
reserve 108 108
Transfer from retained earnings to capital surplus
25 (25) -
Change in scope of consolidation -
Change of fiscal term of
consolidated subsidiaries 104 104
Change of interests held by
parent company due to transactions with non-
controlling-interest shareholder
1,395 1,395
Net changes of items other than
shareholders' equity -
Total increase (decrease) during the
year - 1,395 19,922 187 21,504
Balance at the end of the year 25,122 51,218 327,996 (58,002) 346,335
Accumulated other comprehensive income
Stock
acquisition
rights
Non-
controlling
interests
Total equity
Unrealize
d gain on
available-
for-
sale
securities
Deferred gain
(loss) on
hedges
Land
revaluatio
n reserve
Foreign
currency
translation
adjustments
Accumulated
remeasuremen
ts of
retirement
benefits plans
Total
accumulate
d other
comprehens
ive income
Balance at the beginning of the
year 23,794 - (6,382) (1,403) 218 16,227 1,626 10,833 353,517
Total increase (decrease) during the
year
Cash dividends paid (9,369) Net income attributable to
owners of parent 29,104
Acquisition of treasury stock (8)
Sales of treasury stock 171
Reversal of land revaluation
reserve 108
Transfer from retained earnings to capital surplus
-
Change in scope of consolidation -
Change of fiscal term of
consolidated subsidiaries 104
Change of interests held by parent company due to
transactions with non-
controlling-interest shareholder
1,395
Net changes of items other than shareholders' equity 7,625 (35) 890 (5,464) 908 3,924 193 12,636 16,754
Total increase (decrease) during the
year 7,625 (35) 890 (5,464) 908 3,924 193 12,636 38,258
Balance at the end of the year 31,419 (35) (5,492) (6,867) 1,127 20,151 1,819 23,470 391,776
- 13 -
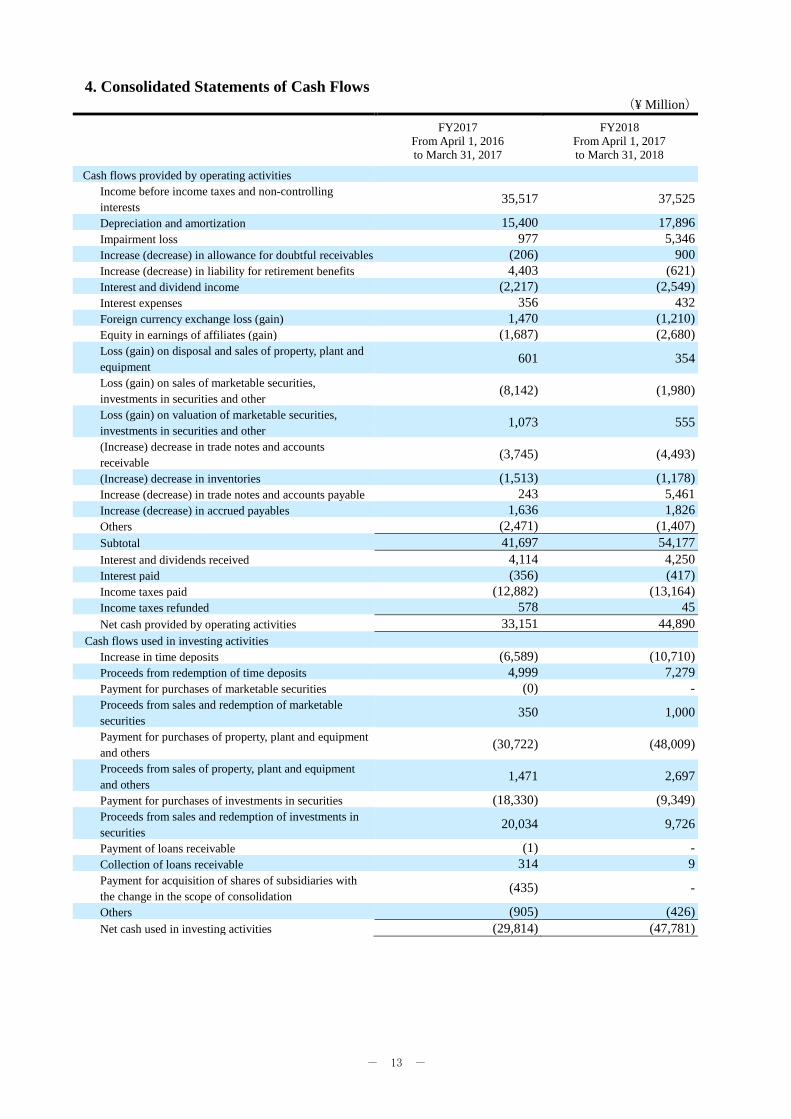
4. Consolidated Statements of Cash Flows (¥ Million)
FY2017
From April 1, 2016
to March 31, 2017
FY2018
From April 1, 2017
to March 31, 2018
Cash flows provided by operating activities
Income before income taxes and non-controlling
interests 35,517 37,525
Depreciation and amortization 15,400 17,896
Impairment loss 977 5,346
Increase (decrease) in allowance for doubtful receivables (206) 900
Increase (decrease) in liability for retirement benefits 4,403 (621)
Interest and dividend income (2,217) (2,549)
Interest expenses 356 432
Foreign currency exchange loss (gain) 1,470 (1,210)
Equity in earnings of affiliates (gain) (1,687) (2,680)
Loss (gain) on disposal and sales of property, plant and
equipment 601 354
Loss (gain) on sales of marketable securities,
investments in securities and other (8,142) (1,980)
Loss (gain) on valuation of marketable securities,
investments in securities and other 1,073 555
(Increase) decrease in trade notes and accounts
receivable (3,745) (4,493)
(Increase) decrease in inventories (1,513) (1,178)
Increase (decrease) in trade notes and accounts payable 243 5,461
Increase (decrease) in accrued payables 1,636 1,826
Others (2,471) (1,407)
Subtotal 41,697 54,177
Interest and dividends received 4,114 4,250
Interest paid (356) (417)
Income taxes paid (12,882) (13,164)
Income taxes refunded 578 45
Net cash provided by operating activities 33,151 44,890
Cash flows used in investing activities
Increase in time deposits (6,589) (10,710)
Proceeds from redemption of time deposits 4,999 7,279
Payment for purchases of marketable securities (0) -
Proceeds from sales and redemption of marketable
securities 350 1,000
Payment for purchases of property, plant and equipment
and others (30,722) (48,009)
Proceeds from sales of property, plant and equipment
and others 1,471 2,697
Payment for purchases of investments in securities (18,330) (9,349)
Proceeds from sales and redemption of investments in
securities 20,034 9,726
Payment of loans receivable (1) -
Collection of loans receivable 314 9
Payment for acquisition of shares of subsidiaries with
the change in the scope of consolidation (435) -
Others (905) (426)
Net cash used in investing activities (29,814) (47,781)

- 14 -
(¥ Million)
FY2017
From April 1, 2016
to March 31, 2017
FY2018
From April 1, 2017
to March 31, 2018
Cash flows used in financing activities
Net increase (decrease) in short-term borrowings (341) (14,816)
Proceeds from long-term debt 6,098 4,803
Repayment of long-term debt (2,918) (6,008)
Net increase in treasury stock (22,939) (8)
Cash dividends paid (8,648) (9,369)
Cash dividends paid to non-controlling-interest
shareholders (32) (144)
Proceeds from payment from non-controlling-interest
shareholders 2,454 14,908
Proceeds from sale of shares of subsidiaries without
the change of the scope of consolidation 710 -
Others (439) (491)
Net cash used in financing activities (26,055) (11,126)
Effect of exchange rate changes on cash and cash
equivalents 1,360 (3,185)
Net increase (decrease) in cash and cash equivalents (21,357) (17,203)
Cash and cash equivalents at beginning of the year 88,689 67,563
Increase in cash and cash equivalents arising from initial
consolidation of subsidiaries 211 -
Increase (decrease) in cash and cash equivalents resulting
from the change in the fiscal year-end of consolidated
subsidiaries
20 (739)
Cash and cash equivalents at end of the year 67,563 49,620

- 15 -
5. Notes on Consolidated Financial Statements
(Notes on the Premise of Going concern)
None
(Additional information)
(Changes to matters related to the fiscal year end regarding consolidated subsidiaries)
When preparing its consolidated financial statements, the Company has traditionally followed its policy of
using final or provisional financial statements prepared as of December 31 for seven consolidated subsidiaries
including NISSIN FOODS ASIA PTE. LTD., making the necessary adjustments regarding important
transactions conducted between the Company’s consolidated fiscal year-end and their fiscal year-end. Effective
from this fiscal year ended March 31, 2018, the Company has either changed the fiscal year-end to March 31 or
adopted a new policy to undertake provisional account settlement on March 31 for those seven consolidated
subsidiaries in order to ensure more appropriate disclosure regarding the consolidated financial statements.
The effect of this changes in profit or loss arising from the change implemented to the fiscal year-end
during the period from January 1, 2017 to March 31, 2017 have been adjusted as part of the change in retained
earnings, and increase or decrease of cash and cash equivalents from this change is stated as “Increase (decrease)
in cash and cash equivalents resulting from the change in the fiscal year-end of consolidated subsidiaries” in the
consolidated cash flow statements.

- 16 -
A: Segment Information
1. Overview of reportable segments
The Group’s reportable segments are those for which separate financial information is available and regular evaluation by the
Board of Directors is being performed in order to decide how resources are allocated among the Group.
The Group employs holding company system. According to the operating unit strategy of six operating companies in Japan
and four overseas business regions, the reportable segments consist of NISSIN FOOD PRODUCTS, MYOJO FOODS, Chilled and
frozen foods, The Americas and China. The segments of NISSIN FOOD PRODUCTS, MYOJO FOODS, The Americas and China
are operating the business of manufacturing and selling bag-type and cup-type noodles. The “Chilled and frozen foods” is
operating the business of manufacturing and selling chilled and frozen foods.
2. Net sales, income or loss, assets and other items by reportable segment
The accounting methods of reported business segments are generally the same as the statements in “Important items used as
basic materials for the preparation of consolidated financial statements.” Incomes in the reported segments are values based on
operating income. Intersegment sales or transfers are based on current market prices.
3. Information on net sales, income or loss, assets and other items by reportable segments
Fiscal Year ended March 31, 2017 (From April 1, 2016 to March 31, 2017)
(¥ Million)
Reportable segment Others
*1
Total Reconciliation
*2
*4
Consolidated
*3
NISSIN FOOD
PRODUCT
S
MYOJO FOODS
Chilled and frozen foods
The Americas
China Subtotal
Net sales
Sales to third party 228,560 40,612 61,794 60,420 35,987 427,373 68,341 495,715 - 495,715
Intersegment sales 874 6,132 1,638 1 186 8,832 28,050 36,883 (36,883) -
Total 229,434 46,744 63,432 60,421 36,173 436,206 96,392 532,599 (36,883) 495,715
Segment operating
income (loss) 27,683 1,784 1,933 2,309 3,405 37,116 2,638 39,755 (11,137) 28,618
Segment assets 166,678 49,241 29,968 44,615 50,564 341,068 129,265 470,334 66,846 537,180
Other items
Depreciation and
Amortization 5,300 1,393 679 2,261 1,320 10,955 4,445 15,400 - 15,400
Investment in
entities accounted
for by the equity
method
- - - - - - 29,374 29,374 - 29,374
Increase(decrease)
in fixed assets and
intangible assets 9,638 1,874 1,412 4,219 6,039 23,185 13,157 36,343 (2) 36,340
(Notes)
1. “Others” consists of the operating segments not included in reportable segments. It includes domestic
confectionary and beverages business, and overseas business in Europe and Asia.
2. Operating income under “Reconciliation” amounted to minus ¥11,137 million, consisting of minus ¥4,275
million from retirement benefit expenses, minus ¥1,871 million from the amortization of goodwill, minus ¥327
million from elimination of intersegment transactions and minus ¥4,661 million from group expenses.
3. Segment income is adjusted to operating income of consolidated statements of income.
4. Segment assets under “reconciliation” include the corporate assets which cannot be allocated to any particular
segment amounting to ¥66, 846 million. The amount mainly consists of ¥34,365 million of surplus investment
funds, ¥30,464 million of goodwill, and ¥2,016 million of other investments.

- 17 -
Fiscal Year ended March 31, 2018 (From April 1, 2017 to March 31, 2018)
(¥ Million)
Reportable segment Others
*1
Total Reconciliation
*2
*4
Consolidated
*3
NISSIN
FOOD PRODUCT
S
MYOJO
FOODS
Chilled and
frozen foods
The
Americas
China Subtotal
Net sales
Sales to third party 232,932 41,487 64,004 64,455 42,583 445,463 70,936 516,400 - 516,400
Intersegment sales 999 5,807 1,409 4 366 8,585 28,716 37,301 (37,301) -
Total 233,931 47,295 65,413 64,459 42,949 454,049 99,652 553,701 (37,301) 516,400
Segment income 28,291 2,056 2,140 2,023 3,569 38,081 1,974 40,056 (5,944) 34,112
Segment assets 184,052 51,113 32,352 45,433 61,219 374,171 144,858 519,029 49,082 568,111
Other items
Depreciation and
Amortization 6,114 1,534 803 2,001 1,949 12,403 5,492 17,896 - 17,896
Investment in
entities accounted
for by the equity
method
- - - - - - 43,047 43,047 - 43,047
Increase(decrease)
in fixed assets and
intangible assets 33,631 2,222 1,600 3,788 3,395 44,638 7,400 52,039 (31) 52,007
(Notes)
1. “Others” consists of the operating segments not included in reportable segments. It includes domestic
confectionary and beverages business, and overseas business in Europe and Asia.
2. Operating income under “Reconciliation” amounted to minus ¥5,944million, consisting of ¥682 million from
retirement benefit expenses, minus ¥1,673 million from the amortization of goodwill, minus ¥287 million from
elimination of intersegment transactions and minus ¥4,666 million from group expenses.
3. Segment income is adjusted to Operating income of Consolidated Statements of Income.
4. Segment assets under “Reconciliation” include the corporate assets which cannot be allocated to any particular
segment amounting to ¥49,082 million. The amount mainly consists of ¥21,308 million of surplus investment
funds, ¥25,970 million of goodwill, and ¥1,802 million of other investments.

- 18 -
B: Related Information
Fiscal Year ended March 31, 2017 (From April 1, 2016 to March 31, 2017)
1. Information by product and service
(¥ Million)
Instant noodles
and ancillary
businesses
Other
Businesses Total
Sales to third party 426,238 69,477 495,715
(Notes) 1. Business segments are classified, taking the type, nature, etc. of products into account.
2. Main products in each business
(1) Instant noodles and ancillary businesses: Bag-type instant noodles, cup-type noodles, chilled foods, frozen foods
(2) Other businesses: Confectionery and beverages
2. Information by region
(¥ Million)
Japan The Americas Other Areas Total
Sales to third party 385,303 60,435 49,976 495,715
Fixed assets 140,372 19,687 27,953 188,013
(Notes) National or geographic segments are based on geographic proximity.
3. Information by major customer
(¥ Million)
Company Amount Main reportable segment
MITSUBISHI Corporation 180,969 NISSIN FOOD PRODUCTS
ITOCHU Corporation 138,731 NISSIN FOOD PRODUCTS
Fiscal Year ended March 31, 2018 (From April 1, 2017 to March 31, 2018)
1. Products and Services
(¥ Million)
Instant noodles
and ancillary
businesses
Other
Businesses Total
Sales to third party 439,529 76,870 516,400
(Notes) 1. Business segments are classified, taking the type, nature, etc. of products into account.
2. Main products in each business
(1) Instant noodles and ancillary businesses: Bag-type instant noodles, cup-type noodles, chilled foods, frozen foods
(2) Other businesses: Instant rice, confectionery and beverages
2. Information by region
(¥ Million)
Japan The
Americas Other Areas Total
Sales to third party 393,616 64,468 58,315 516,400
Fixed assets 164,612 20,468 28,990 214,071
(Notes) National or geographic segments are based on geographic proximity.
3. Information of major customers
(¥ Million)
Amount Main reportable segment
MITSUBISHI Corporation 194,882 NISSIN FOOD PRODUCTS
ITOCHU Corporation 140,135 NISSIN FOOD PRODUCTS
C: Information on the impairment loss of fixed assets by reportable segment

- 19 -
Fiscal Year ended March 31, 2017 (From April 1, 2016 to March 31, 2017)
(¥ Million)
Reportable segment
Others
Corporate
and
Elimination Total
NISSIN
FOOD
PRODUCTS
MYOJO
FOODS
Chilled and
frozen foods
The
Americas
China
Impairment loss 86 35 - - 565 290 - 977
Note: “Others” consists of the operating segments not included in reportable segments. It includes domestic confectionary and
beverages business, and overseas business in Europe and Asia.
Fiscal Year ended March 31, 2018 (From April 1, 2017 to March 31, 2018)
(¥ Million)
Reportable segment
Others
Corporate
and
Elimination Total
NISSIN
FOOD
PRODUCTS
MYOJO
FOODS
Chilled and
frozen foods
The
Americas
China
Impairment loss 3,805 42 - 92 184 1,222 - 5,346
Note: “Others” consists of the operating segments not included in reportable segments. It includes domestic confectionary and
beverages business, and overseas business in Europe and Asia.
D: Information on the amortization and unamortized balance of goodwill by reportable segment
Fiscal Year ended March 31, 2017 (From April 1, 2016 to March 31, 2017)
(¥ Million)
Reportable segment
Others
Corporate
and
Elimination Total
NISSIN
FOOD
PRODUCTS
MYOJO
FOODS
Chilled and
frozen foods
The
Americas
China
Amount of
amortization for FY
2017
- 213 - 1,554 7 96 - 1,871
Balance as of March
31, 2017 - - - 30,019 445 - - 30,464
Note: “Others” consists of the operating segments not included in reportable segments. It includes domestic confectionary and
beverages business, and overseas business in Europe and Asia.
Fiscal Year ended March 31, 2018 (From April 1, 2017 to March 31, 2018)
(¥ Million)
Reportable segment
Others
Corporate
and
Elimination Total
NISSIN
FOOD
PRODUCTS
MYOJO
FOODS
Chilled and
frozen foods
The
Americas
China
Amount of
amortization for
FY 2018
- - - 1,579 93 - - 1,673
Balance as of
March 31, 2018 - - - 25,638 332 - - 25,970
Note: “Others” consists of the operating segments not included in reportable segments. It includes domestic confectionary and
beverages business, and overseas business in Europe and Asia.
E: Information on the gain on negative goodwill by reportable segment
Fiscal Year ended March 31, 2017 (From April 1, 2016 to March 31, 2017)
None
Fiscal Year ended March 31, 2018 (From April 1, 2017 to March 31, 2018)
None

- 20 -
(Per Share Information)
FY2017
From April 1, 2016
to March 31, 2017
FY2018
From April 1, 2017
to March 31, 2018
Net assets per share(¥) 3,276.55 3,282.02 3,018.82
Net income attributable to owners of parent
per share (primary) (¥) 221.33 167.88 174.83
Net income attributable to owners of parent
per share (diluted) (¥) 220.25 167.10 174.13
Net assets per share(¥) 3,519.36 Net income attributable to owners of parent
per share (primary) (¥) 279.52
Net income attributable to owners of parent
per share (diluted) (¥) 278.16
(Note) The calculation basis of the amount of net income attributable to owners of parent per share and the amount of net income
attributable to owners of parent per share (diluted) is as follows.
FY2017
From April 1, 2016
to March 31, 2017
FY2018
From April 1, 2017
to March 31, 2018
Amount of net income attributable to owners of parent
per share (primary) (¥)
Net income attributable to owners of parent (¥ million) 23,558 29,104
Amount not belonging to common shares (¥ million) - -
Net income attributable to owners of parent pertaining to
common shares (¥ million) 23,558 29,104
Average number of shares outstanding during the period
(hundred) 1,064,390 1,041,220
Amount of net income attributable to owners of parent
per share (diluted)
Adjusted amount of net income attributable to owners of
parent (¥ million) - -
Number of increased common shares (hundred) 5,217 5,099
(Stock acquisition rights of common shares) (5,217) (5,099)
Outline of dilutive shares that were not included in the
calculation of net income attributable to owners of parent
per share (diluted) due to the lack of the dilution effect.
- -
(Material subsequent event)
(Cancellation of treasury stock)
NISSIN FOODS HOLDINGS CO., LTD. resolved to cancel treasury shares pursuant to Article 178 of the Companies Act at
the meeting of the Board of Directors held on May 10, 2018.
1. The reason for the cancellation of treasury stock Enhancement of the return of shareholders
2. The detail of the board resolution for cancellation of treasury stock
(1) Type of shares to be cancelled Common stock of the company
(2) Number of shares to be cancelled
11,763, 685 shares
(This number represents 10.01% of total
outstanding shares before cancellation)
(3) Date of cancellation May 24, 2018
(4) Total number of issued shares after the cancellation 105,700,000 shares