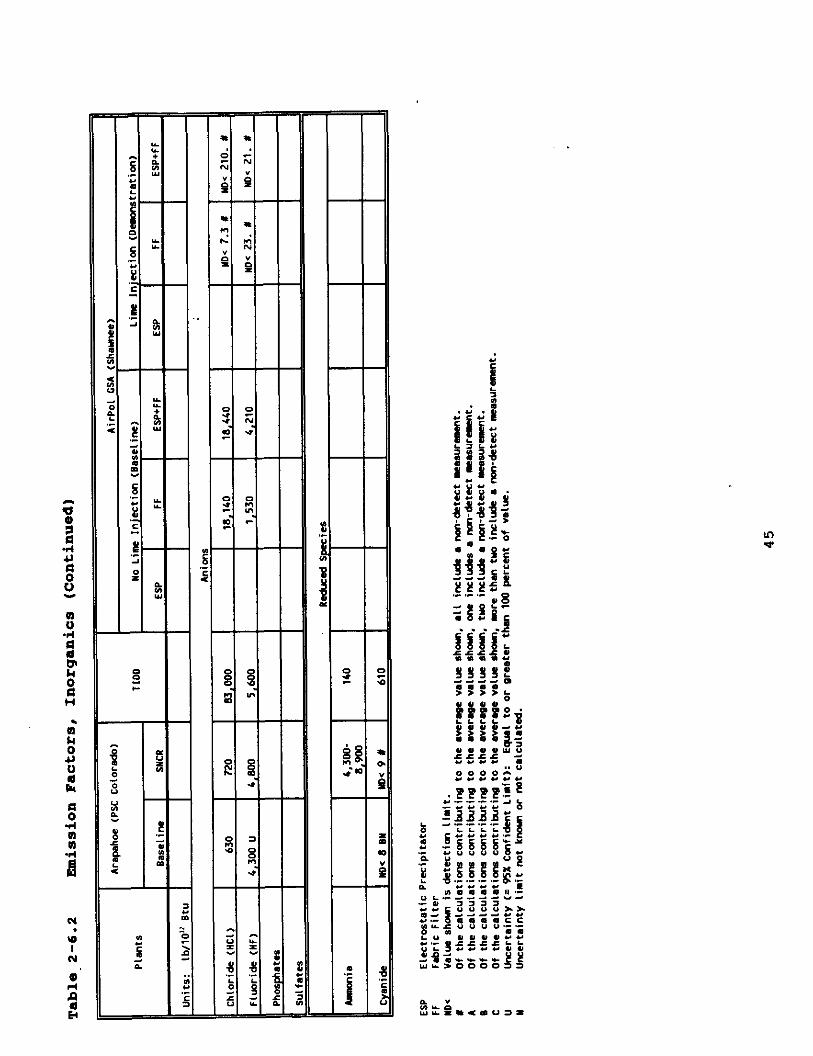
Embed Size (px)
Citation preview

SUMMARY OF AIR TOXICS -. EMISSIONS TESTING AT SIXTEEN
UTILITY POWER PLANTS
Prepared for U.S. Department of Energy
Pittsburgh Energy Technology Center
Prepared Under Burns and Roe Services Corporation
Contract No. DE-AC22-94PC92100 .Subtask 44.02
July 1996

SUMMARY OF AIR TOXICS EMISSIONS TESTING AT SIXTEEN . .
UTILITY POWER PLANTS
Prepared for U.S. Department of Energy
Pittsburgh Energy Technology Center .
Prepared by Adrian Radziwon and Edward Winter
Burns and Roe Services Corporation Terence J. McManus, Oak Ridge
Associated Universities
July 1996

TABLE OF CONTERlW
SECTION 1.0 INTRODUCTION ................... 1 Background . : .................. 1 Objectives .................... 1 Report Structure ................. 3 Uncertainties ................... 3
SECTION 2.0 EXECUTIVE SUMMARY ................. 7
SECTION 3,O INDIVIDUAL SITE RESULTS . . . . . . . ...... 57 Section 3.1 Coal Creek Station . . ...... 50 Section 3.2 Boswell Energy Center . ...... 66 Section 3.3 Springerville Station . ...... 73 Section 3.4 Cardinal Station . . . ...... 79 Section 3.5 Baldwin Station . . . . ...... 86 Section 3.6 Niles Station . . . . . ...... 94 Section 3.7 SNOX Process . . . . . ...... 101 Section 3.6 Plant Yates . . . . . . ...... 109 Section 3.9 Bailly Station . . . . ...... 117 Section 3.10 Nelson Dewey Station . ...... 125. Section 3.11 Plant Hammond . . . . . ...... 133 Section 3.12 Plant Smith . . . . . . ...... 141 Section 3.13 R.E. Burger Station . . ...... 149 Section 3.14 Arapahoe Station . . . ...... 155 Section 3.15 TIDD PFBC Demonstration ...... 163 Section 3.16 AirPol GSA System . . . ...... 169
SECTION 4.0 MERCURY SPECIATION ............... 188
APPENDIX REFERENCES AND REPORT CONTENT SUMMARY ...... 192

LIST OF TABLES
Table l-l Table 2-l Table 2-2
Table 2-3 Table 2-4
Table 2-5.1 Table 2-5,2 Table 2-5.3 Table 2-5.4
Table 2-5.5
Table 2-5.6
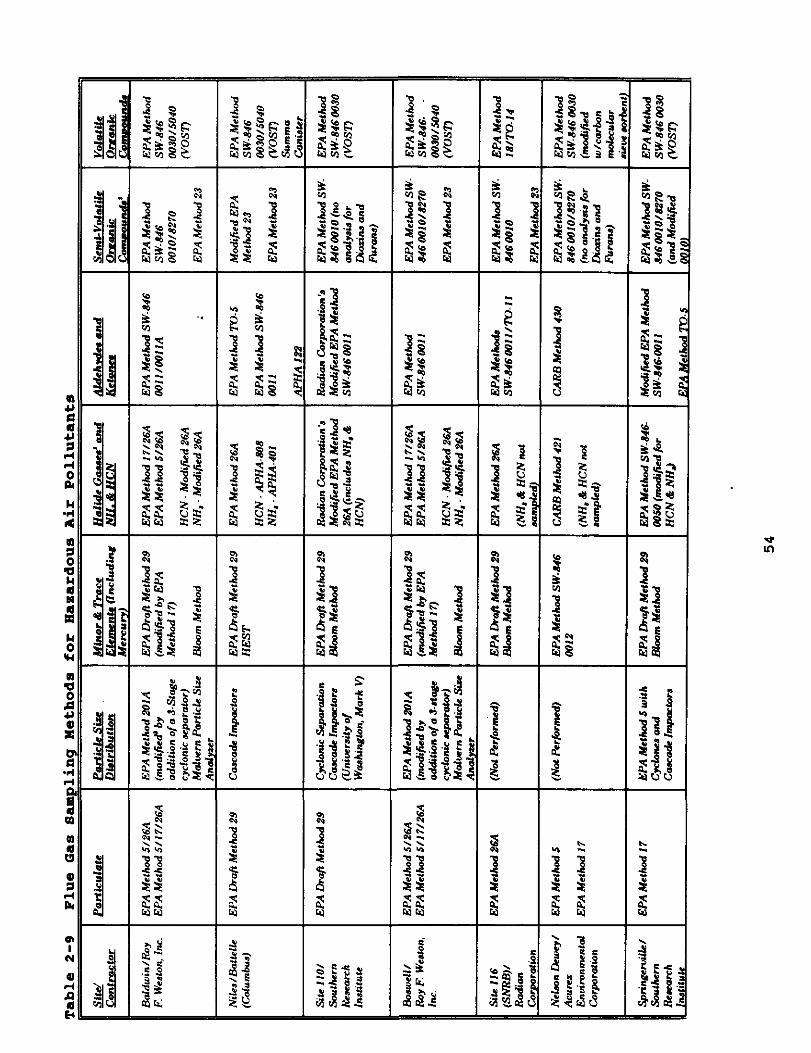
Table 2-6.1 Table 2-6.2 Table 2-7 Table 2-8.1 Table 2-8.2 Table 2-9
Table 3.1-1 Table 3.1-2
Table 3.1-3 Table 3.2-l
Table 3.2-2
Table 3.2-3 Table 3.3-l
Table 3.3-2
Table 3.3-3 Table 3.4-l Table 3.4-2
Table 3.4-3 Table 3.5-l
Table 3.5-2
Table 3.5-3
Table 3.5-4 Table 3.6-l
Target Analysis . . . . . . . . . . . . . . Power Plant Descriptions . . . . . . . . . . Definition of Normal and Standard Volumetric Units for Each Plant . . . . . . . . . . . . Average Coal Analyses for Plants . . . . . . Average Coal Analyses for Plants - Trace Elements . . . . . . . . . . . . . . . . . . Emission Factors, Aldehydes and Ketones . . Emission Factors, Dioxins . . . . . . . . . Emission Factors, Furans . . . . . . . . . . Emission Factors, Volatile Organic Compounds (VOC) . . . . . . . . . . . . . . . . . . . Emission Factors, Semi-Volatile Organic Compounds . . . . . . . . . . . . . . . . . Emission Factors, Polynuclear Aromatic Hydrocarbons (PAIi) . . . . . . . . . . . . . Emission Factors, Trace Metals . . . . . . . Emission Factors, Inorganics . . . . . . . . Stack Concentrations . . . . . . . . . . . . Removal Efficiencies of ESPs and Baghouses . Removal Efficiencies in Scrubbers . . . . . Flue Gas Sampling Methods for Hazardous Air Pollutants . . . . . . . . . . . . . . . Trace Element Flow Rates, Coal Creek Station Concentrations and Collection Device Removal Efficiencies, Coal Creek Station . . . . . . Stream Temperatures, Coal Creek Station . . Trace Element Flow Rates, Boswell Energy Center................. . . Concentrations and Collection Device Removal Efficiencies, Boswell Energy Center . . . . Stream Temperatures, Boswell Energy Center . Trace Element Flow Rates, Springerville Station . . . . . . . . . . . . . . . . . . Concentrations and Removal Efficiencies, Springerville Station . . . . . . . . . . . Stream Temperatures, Springerville Station . Trace Elements Flow Rates, Cardinal Station Concentration and Removal Efficiencies, Cardinal Station . . . . . . . . . . . . . . Stream Temperatures, Cardinal Station . . . Trace Element Flow Rates, Baldwin Station, Non-Soot Blowing Period . . . . . . . . . .' Trace Element Flow Rates, Baldwin Station, Soot Blowing Period . . . . . . . . . . . . Concentrations and Collection Device Removal Efficiencies, Baldwin Station . . . . . . . Stream Temperatures, Baldwin Station . . . . Trace Element Flow Rates, Niles Station . .
. . 4
. 11
12 13
. 16 19
. 22
. 26
. 29
. 35
. 38
. 41
. 44
. 46
. 49.
. 50
54 . 64
. 65
. 65
. 71
. 72
. 72
. 77
. 78
. 78
. 84
. 85
. 85
. 91
. 92
. 93
. 93
. 99

Table 3.6-2
Table 3.6-3 Table 3.7-l
Table 3.7-2
Table 3.7-3 Table 3.8-l Table 3.8-2
Table 3.8-3 Table 3.9,1 Table 3.9-2
Table 3.9-3 Table 3.10-l
Table 3.10-2
Table 3.10-3
Table 3.10-4 Table 3.11-1
Table 3.11-2
Table 3.11-3
Table 3.11-4 Table 3.12-1
Table 3.12-2
Table 3.12-3
Table 3.12-4 Table 3.13-1
Table 3.13-2
Table 3.13-3 Table 3.14-1
Table 3.14-2
Table 3.14-3
Table 3.15-1
Table 3.15-2
Table 3.15-3
100 100
107
108 108 115
Concentrations and Removal Efficiencies, Nile6 Station . . . . .~ . . . . . . . . . Stream Temperatures, Niles Station . . . . . . Trace Element Flow Rates, SNOX Process (Niles Station) . . . . . . . . . . . . . . . Concentrations and Removal Efficiencies, SNOX Process (Niles Station) . . . . . . . . . Stream Temperatures, SNOX Process . . . . . . Trace Element Flow Rates, Plant Yates . . . . Concentrations and Removal Efficiencies, Plant Yates . . . . . . . . . . . . . . . . . Stream Temperatures, Plant Yates . . . . . . . Trace Element Flow Rates, Bailly Station . . . Concentrations and Removal Efficiencies, Bailly Station . . . . . . . . . . . . . . . . Stream Temperatures, Bailly Station . . . . . Trace Element Flow Rates, Nelson Dewey Station, Baseline Data . . . . . . . . . . . . Trace Element Flow Rates, Nelson Dewey Station, Reburn Data . . . . . . . . . . . . . Concentrations and Removal Efficiencies, Nelson Dewey Station . . . . . . . . . . . . . Stream Temperatures, Nelson Dewey Station . . Trace Element Flow Rates, Plant Hammond, Over-Fire Air Tests- . . . . . . . . . . . . . Trace Element Flow Rates, Plant Hammond, Low-NO, Burner Tests . . . . . . . . . . . . . Concentrations and Removal Efficiencies, Plant Hammond . . . . . . ~. . . . . . . . . . Stream Temperatures, Plant Hammond . . . . . . Trace Element Flow Rates, Plant Smith, Baseline Tests . . . . . . . . . . . . . . . . Trace Element Flow Rates, Plant Smith, Low NO, Tests . . . . . . . . . . . . . . . . . . Concentrations and Removal Efficiencies, Plant Smith . . . . . . . . . . . . . . . . . Stream Temperatures, Plant Smith . . . . . . . Trace Element Flow Rates, R.E. Burger Station, SOx-NOx-ROx-BOX (SNRB) . . . . . . . . . . . . Concentrations and Removal Efficiencies, R.E. Burger Station . . . . . . . . . . . . . Stream Temperatures, R.E. Burger Station . . . Trace Element Flow Rates, Arapahoe Station, (Baseline) . . . . . . . . . . . . . . . . . . Trace Element Flow Rates Arapahoe Station, (SNCR) . . . . . . . . . . . . . . . . . . . . Concentrations and Removal Efficiencies, Arapahoe Station . . . . . . . . . . . . . . . Trace Element Flow Rates, TIDD PFBC Demonstration . . . . . . . . . . . . . . . . Concentrations and Control Device Removal Efficiencies, TIDD PFBC Demonstration . . . . Stream Temperatures, TIDD PFBC Demonstration .
116 116 122
123 124
130
131
132 132
138
139
140 140
146
147
148 148
153
154 154
160
161
162
167
168 168
Table 3.16-1
Table 3.16-2
Table 3.16-3
Table 3.16-4
Table 3.16-5
Table 3.16-6
Table 3.16-7 Table 4.1-l
Table 4.1-2 Table 4.1-3
Trace Element Flow Rates, AirPol GSA, Shawnee Power Plant, Series Configuration, Baseline Tests . . . . . . . . . . . . .~ i . . . . . .177 Trace Element Flow Rates, AirPol GSA, Shawnee Power Plant, Series Configuration, Demonstration Tests . . . . . . . . . . . . . 179 Trace Element Flow Rates, AirPol GSA, Shawnee Power Plant Parallel Configuration, Baseline Tests . . . . . . . . . . . . . . . . . ...181 Trace Element Flow Rates, AirPol GSA, Shawnee Power Plant Parallel Configuration, Demonstration Tests . . . . . . . . . . . . . 183 Concentrations and Removal Efficiencies, AirPol GSA Pilot Plant, Series Tests . . . . . 185 Concentrations and Removal Efficiencies, AirPol GSA Pilot Plant, Parallel Tests . . . . 186 Stream Temperatures, AirPol GSA System . . . . 187 Comparison of Mercury Measuring Techniques at Plant Stack . . . . . . . . . . . . . . . . . 189 Mercury Speciation Using the Bloom Train . . . 190 Method 29 Mercury Speciation . . . . . . . . . 191


LIST OF FIGURES
.
ESP Removal Efficiencies . . . . . . . . . . . 51 Baghouse Removal Efficiencies . . . . . . . . 52 Wet Scrubber Efficiencies . . . . . . . . . . 53 Coal Creek Station Unit No. 1 Flow Diagram . . 62 Trace Elements in Output Streams, Coal Creek Station . . . . . . . . . . . . . . . . 63 Boswell Energy Center Unit No. 2 Flow Diagram 69 Trace Elements in Output Streams, Boswell Energy Center . . . . . . . . . . . . . . . . 70 Springerville Generating Station Unit No. 2 Flow Diagram . . . . . . . . . . . . . . . . . 75 Trace Elements in Output Streams, Springerville Station . . . . . . . . . . . . 76 Unit 1 Flow Diagram, Cardinal Station . . . . 82 Trace Elements in Output Streams, Cardinal Station . . . . . . . . . . . . . . . . . . . 83 Baldwin Power Station Unit No. 2 Flow Diagram 88 Trace Elements in Output Streams, Baldwin Station, Non-Soot Blowing Tests . . . . . . . 89 Trace Elements in Output Streams, Baldwin Station, Soot Blowing Tests . . . . . . . . . 90 Niles Station Boiler No. 2 Flow Diagram . . . 97 Trace Elements in Output Streams, Niles Station . . . . . . . . . . . . . . . . . . . 98 SNOX Flow Diagram . . . . . . . . . . . . . . 105 Trace Elements in Output Streams SNOX Process, Nile6 Station . . . . . . . . . . . . 106 Power Plant Yates Flow Diagram . . . . . . , . 113 Trace Elements in Output Streams, Power Plant Yates . . . . . . . . . . . . . . . . . ...114 Unit 7 & 8 Flow Diagram, Bailly Generating Station . . . . . . . . . . . . . . . . . . . 120 Trace Elements in Output Streams, Bailly Station . . . . . . . . . . . . . . . . . . 121 Nelson Dewey Station . : '. . . . . . . . . . . 127 Trace Elements in Output Streams, Nelson Dewey Station, Baseline Tests . . . . . . . . 128 Trace Elements in Output Streams, Nelson Dewey Station, Reburn Tests . . . . . . . . . 129 Plant Hammond Flow Diagram, . . . . . . . . . . 135 Trace Elements in Output Streams, Plant Hammond, Over Fire Air . . . . . . . . . . . . 136 Trace Elements in Output Streams, Plant Hammond, Low NO, Burner '. . . . . . . . . . . 137 Plant Smith Flow Diagram . . . . . . . . . . . 143 Trace Elements in Output Streams, Plant Smith, Baseline Tests . . . . . . . . . . . . 144 Trace Elements in Output Streams, Plant Smith, Low NO, Tests . . . . . . . . . . . . . . . . 145 SNRBTM Flow Diagram, R.E. Burger Station . . . 151
Figure 2-l Figure 2-2 Figure 2-3 Figure 3.1-l Figure 3.1-2
Figure 3.2-l Figure 3.2-2
Figure 3.3-l
Figure 3.3-2
,Figure 3.4-l Figure 3.4-2
Figure 3.5-l Figure 3.5-2
Figure 3.5-3
Figure 3.6-l Figure 3.6-2
Figure 3.7-l Figure 3.7-2
Figure 3.8-l Figure 3.8-2
Figure 3.9-l
Figure 3.9-2
Figure 3.10-l Figure 3.10-2
Figure 3.10-3
Figure 3.11-1 Figure 3.11-2
Figure 3.11-3
Figure 3.12-1 Figure 3.12-2
Figure 3.12-3
Figure 3.13-l

Figure 3.13-2
Figure 3.14-l
Figure 3.14-2
Figure 3.14-3
Figure 3.15-1 Figure 3.15-2
Figure 3.16-1
Figure 3.-i6-2
Figure 3.16-3
Figure 3.16-4
Figure 3.16-5
Trace Elements in Output Streams, R.E. Burger Station, SNRB . . . . . . . . . . 152 Public Service of Colorado Arapahoe Station Flow Diagram . . . . . . . . . . . . . . . . . 157 Trace Elements in Output Streams, Arapahoe Station, Baseline Tests . . . . . . . . . . . 158 Trace Elements in Output Streams, Arapahoe Station, SNCR . . . . . , . . . . . . . . . . 159 TIDD PFBC Demonstration Flow Diagram . . . . . 165 Trace Elements in Output Streams, TIDD Power Plant, PFBC Demonstration . . . . . . . . , . 166 Gas Suspension Absorption System at Shawnee Power Plant . . . . . . . . . . . . . . . . . 172 Trace Elements in Output Streams, AirPol GSA, Shawnee Power Plant, Series Configuration, Baseline Tests . . . . . . . . . . . . . . . . 173 Trace Elements in Output Streams, AirPol GSA, Shawnee Power Plant, Series Configuration, Demonstration Tests . . . . . . . . . . . . . 174 Trace Elements in Output Streams, AirPol GAS, Shawnee Power Plant, Parallel Configuration, Baseline Tests . . . . . . . . . . . . . . . . 175 Trace Elements in Output Streams, AirPol GAS Shawnee Power Plant, Parallel Configuration, Demonstration Tests . . . . . . . . . . . . . 176

SECTION 1.0 INTRODUCTION
The U.S. Department of Energy performed comprehensive assessments
of toxic emissions from nine selected coal-fired electric utility
units. A similar assessment was also carried out at seven power
plants which are hosts to demonstration projects carried out under
the Clean..Coal Technology Program. These data are being collected
in response to the Clean Air Act Amendments of 1990, which require
that EPA conduct a study of the emissions of hazardous air pollutants (RAPS) from electric utility power plants, and that
these emissions be evaluated for potential health risks. The data have been compiled and combined with similar data collected as part
of the Field Chemical Emissions Monitoring program sponsored by the
Electric Power Research Institute (EPRI) and furnished to the U.S..
Environmental Protection Agency for emissions factor and health
risk determinations.
The assessments of emissions involve the collection and analysis of
samples from all major input and output streams of the selected power plants for selected hazardous pollutants contained in Title
III of the Clean Air Act.
The specific objectives of this program were:
. To collect and subsequently analyse representative solid,
liquid, and gas samples of all specified input and output
streams of the selected power plants for selected hazardous air pollutants listed in Title III of the 1990 Clean Air Act Amendments and to assess the potential level of release
(concentration) of these pollutants;
1

TO determine the removal efficiencies of pollution control
subsystems for selected pollutants at the pQwer plants;
To determine material balances for selected pollutants in
specified subsystems of the power plant and an overall material balance for the power plants;
To determine the concentration as a function of particle size
of the pollutants associated with the particulate fraction of
the flue gas streams;
To determine the concentration of the pollutants associated
with the particulate and vapor-phase fractions of the
specified flue gas streams;
To determine the concentrations of toxic substances on the
surfaces of fly ash particles;
To provide data for EPA for use in risk assessments and in
updating publication AP-42;
To determine hexavalent chromium stack emissions at selected
plants; and
To compare Method 29 vapor-phase mercury results with those
obtained via charcoal absorption.
e of This
Table l-l lists the chemical substances analysed during this
project. Not all of these compounds were measured at each power
plant.
2
Beport Structure
These results are reported in two sections. First (Section 2),
corresponding data for each of the plants are presented in a way to
allow comparisons to be made easily. Including:
. Select information about equipment and operation of each
plant.
. Coal analyses: ultimate, trace metals, and anions.
. Stack concentration of trace elements.
. Overall ranges of removal efficiencies.
Second (Section 3), more specific data for each individual plant-
are presented separately. Including
. Description of each plant, with flowsheet.
. Flow rates of trace metals at various locations in the plants.
. Distribution of trace metals in the output streams.
. Removal efficiencies of the control devices.
. Temperatures at various points in the plant.
Rmission factors, removal efficiencies, and other results presented
in this report rely on measurement data that vary with time and/or may be near the limit of detection or below it for many of the
3
T8bl. l-l Target AnalySiS
Tr.cc Elements
Antimony Arsenic barium Beryllium
Rediorwlidas
Boron C&Gun ChrmiM total Cdrlt
~axavalmt Chroniun
wrcury SpciaticWCnperison
Anions .a
Chloride Wl) Fluoride UIF) Sulfata Phosphates
ntid fpcies
Ammania Cyanide
organic6
FOr&+OldEh* Oiorins FW."S
VoLatile Organic8
wcllytdmm Nickel gelnirn Vanadium
8CnlW.C Methyl Chlorofom (l,l.l-Trichlormthgn) grmofon Methyl Ethyl Ketone (2-gutgnme) carbm Disulfide Mathylme Chloride (Dichloranethnc) Carbon Tgtrachloride Propylene Dichloride (1.2.Dichloropropww) Chlorcbmrme styrme Chloroform 1,1,2,2-TetrgchLoroethane 1.4~Dichlorcbenzene Tetrachloroethane cir-,1.3-DichlorDpropM TOluCna tram-1.5Dichlorcvcpme 1.1.27Trichloroethwe Ethyl gen2Me Trichloroethene Ethyl Chloride (Chloroethane) Vinyl ACCtltl Ethylene Dichloride (1,2,-Dichloroethane) Vinyl Chloride Ethylidm Dichloride (l,l-Dichlorwthuw) Vinylidm Chloride (l,l-Dichlorcethm) Methyl granide (Ermmethurc) n,p-xylem Methyl Chloride (Chloronrthan) o-xylem
Semivolatile Orpanics
Acnupthm Acenaphthalm Acetophman L-bminobiphenyl AniLim lnthracm Emridim Emzo(aMnthracme BR"ZO(~)pYMX gmzo(b)flwranthme Bmzo(g,h,i)perylme Bmro(k)flwrsnthmc Benzoic Acid Bmzyl Alcohol
IndmWl,2,3-cd)pyrr 7.12.Dinthyl~Wmthrrrr mphorm@ Dinrthylphemthylnin Methyl Methwmsulfwtc 2,&Dinrthylphnol 3-Ycthylchlolnthrm Dimehylphthalgte 2-Methylnphthalm 4,6-Dinitro-2-rthylphnrol 2-Mathylphewl to-Crgsol) 2,4-Dinitropheml L-Methylpkwl (p-cresol) 2,4-Dinitrotolum W-Nitrogo-di-n-hltyllim 2,6-Dinitrotolwne N-NitrosodimthylmirW Diphenylnin N-Nitrogodiphmylmine l,2-Diphanylhydrgrim N-Nitroscprc+-ylaWw Ethyl I(ethmnulfonate N-Yitroscpipridine 2-Nitrophmol Naphthalm L-Nitrophenol l-llaphthylamin Pentuhlorcbanrm
4
Table l-l (continued)
SemivoLatile Orgmics tcmtiwed)
I,-Bronophenyl Phcnyl Ether 2-Yaphthylnine Eutylbenzylphthalate 2-Nitromilin 4-Chloro-3-Yethylphml S-Yitromilin p-Chlormiline 4-Nitromilin bis(2-Chloroethoxy)rthane Nitrebenzm bis(2-Chloroethy~)ether Di-n-octylphthelate bis(Z-Chloroisopropyl)ether Dibenr(a,h)mthr~cm l-Chlormephthalme Dibmz(e,j)acridim 2-Chlormaphthalene Dibmrofurm 2-Chlorophenol DibutylphthaLate 4-Chlorophmyl Phenyl Ether 1.2~Dichlorcbenrm Chrysene 1,3-Dichkorobmrene bis(2-EhtylhexyW)phthaletc I,&Dichlorcbmrm Flwrmthme 3,3’-Dichlorcbmzidin FLWXMC 2.4~Dichlorophmol Hexachlorobenzmc 2,6-Dichlorophewl HexachlorabutAene 2,6-Dichloropheml ncx~chlorocyclopmtadime DiethylphthaLate Hexachloroethan p-Dimethyluninoazcbenzme
Additional Elncnts
Aluniran Calcium iron
Magwsiun Potassim Sodirn
Silicm Strontium Titmirn
Pentachlormltrobenrm Pmtachloropkmol Phmacetfn Phenmthrm Pherml 2-Picolim Pronnidc PYrHy Pyridin 1,2.4,5-T~tr~chloroknzcn 2.3.4.6.T*tr~chlorophmol 1.2.24.Trichlorobenznw 2.4.5lrichlorophenol 2.4.klrichlorophewl 2-Flwrobiphmyl 2-Fl~mrophmol Nitrchmne Phenol Terphmyl 2,4.6-Tribromophmol
Zinc Urmim (coal only) Thoriu (coal only)
5

substances of interest. In this summary report, highly uncertain
results have been flagged in the tables. For a more comprehensive examination of uncertainties associated with this data, the reader
is referred to a companion report, "A Comprehensive Assessment of
Toxic Emissions from Coal-Fired Power Plants: Statistical Correlations from the Combined DDE and EPRI Field Test Data" or the
complete testing reports for each power plant listed in the
Appendix.

SECTION 2.0 EXECUTIVE SUMMARY
This report is a summary of sixteen separate test projects sponsored by the U.S. Department of Energy in collaboration with the Electric Power Research Institute. Its purpose is to present, in a concise form, the results of those tests. To the maximum extent possible, results were taken directly from the reports. Calculations were performed only when necessary for the sake of comparison.
A summary of the results is presented in the following tables. These results are organised to allow plant-by-plant comparisons. Compounds that could have been measured by the techniques used but were not detected are not included in this report. If more information is needed, the reader is asked to consult the individual reports for each power station.
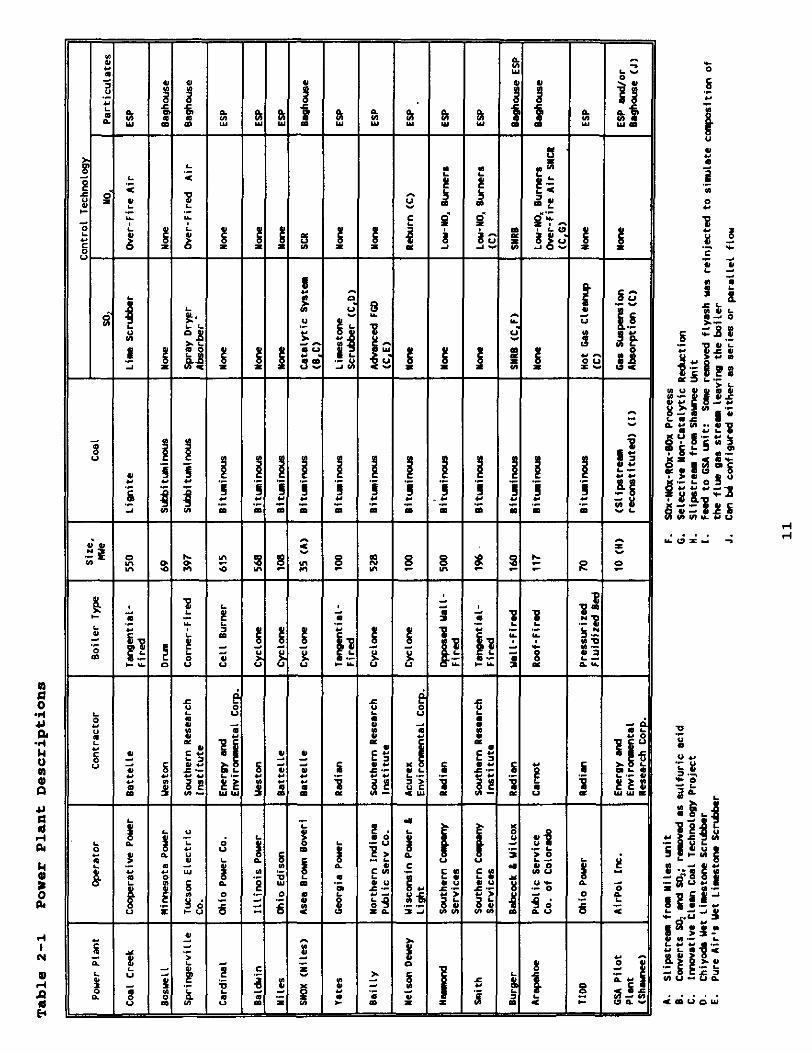
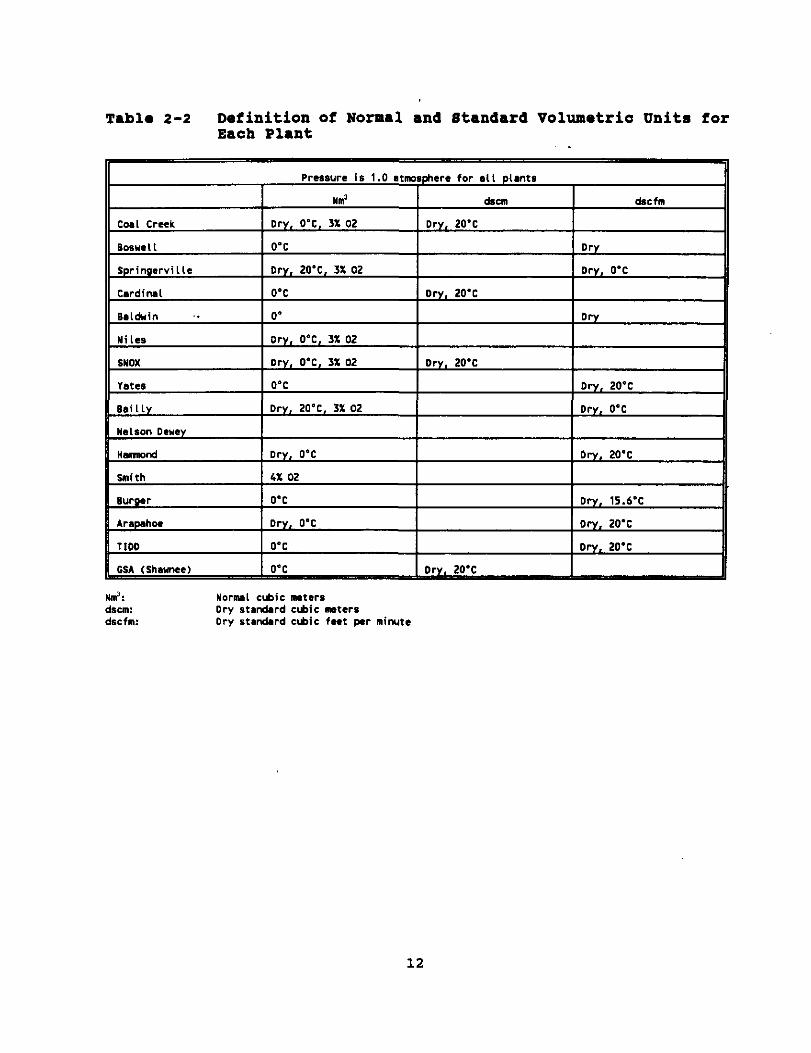
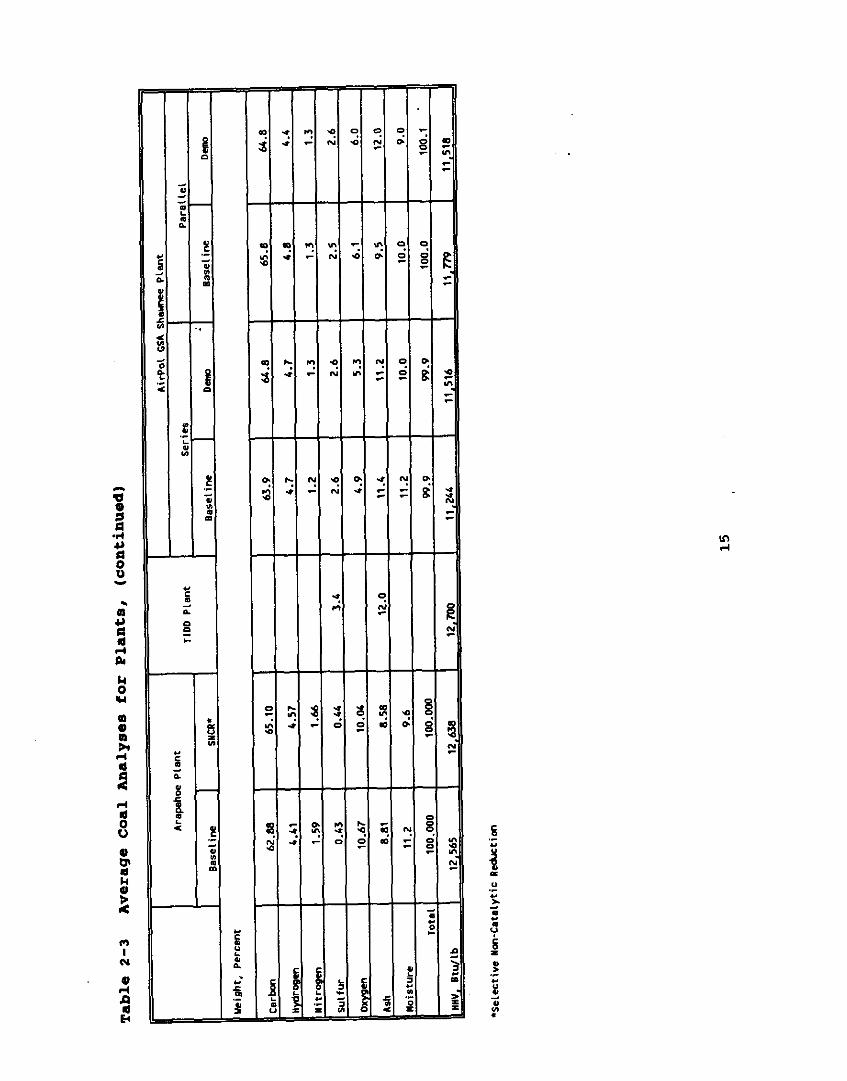
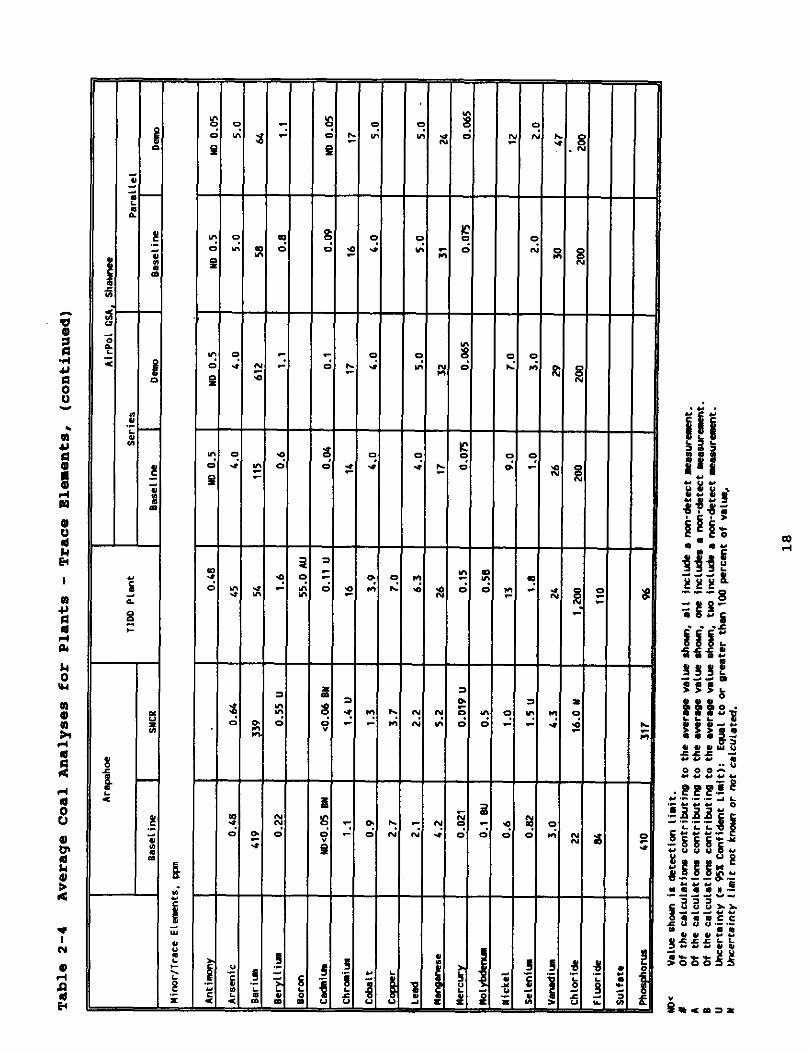
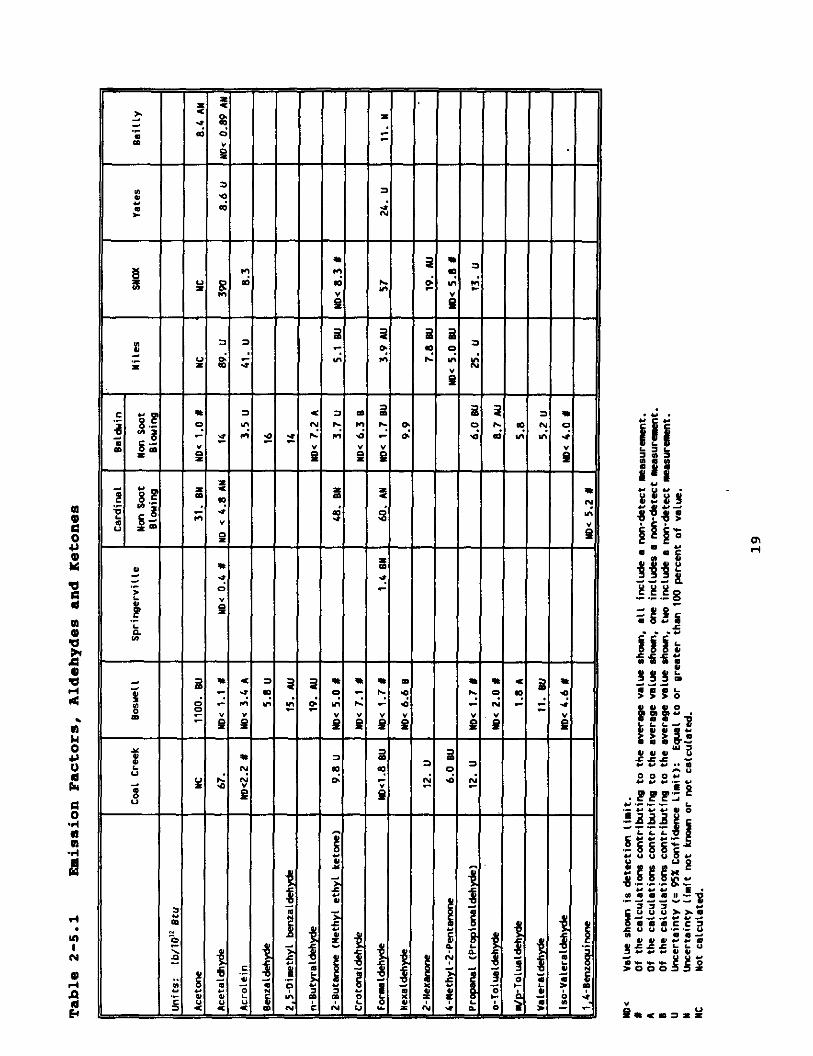
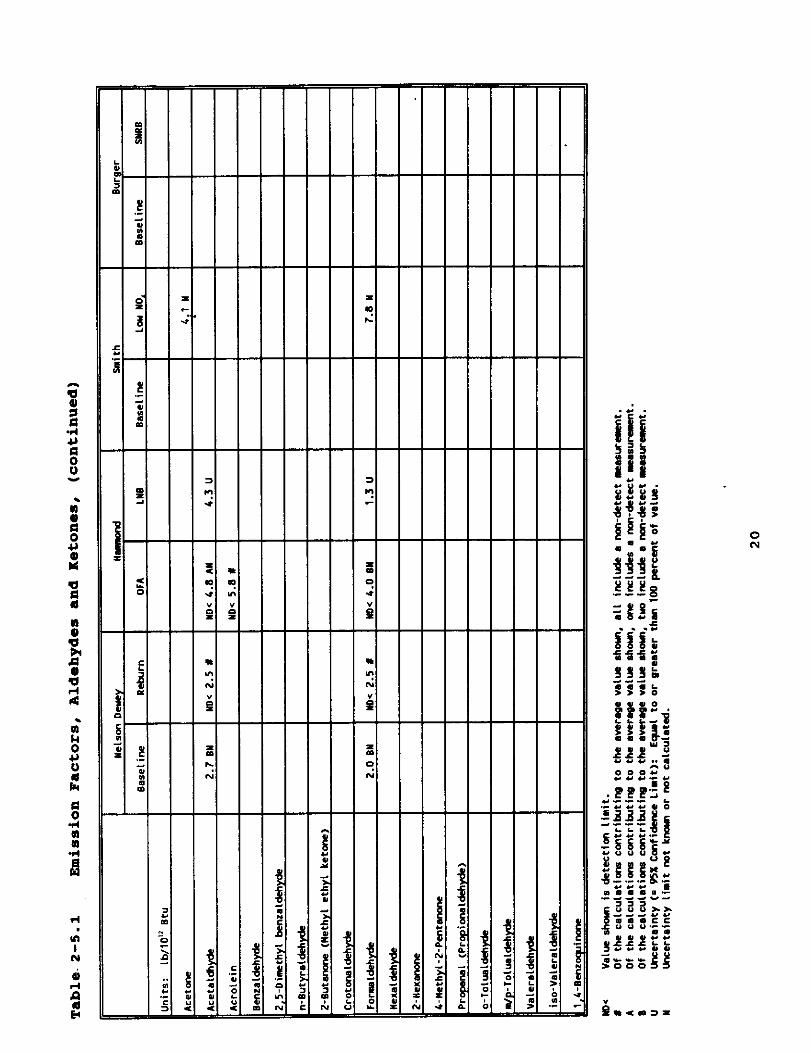
Table 2-l summarizes information about each plant. Table 2-2 lists the conventions used by each contractor for reporting volumetric gaseous data. Table 2-3 presents the ultimate analyses for the feed coals at the test sites while Table 2-4 presents the coal analyses for minor and trace elements. Emission factors are presented in Tables 2-5 and 2-6 for organic materials and for trace/minor elements, respectively. Table 2-7 presents the stack concentrations of trace elements. Tables 2-8.1 and 2-8.2 show the range and average of trace element removal efficiencies at the test sites equipped with particulate removal devices. These data are shown graphically in Figures 2-1, 2-2, and 2-3. Finally, stable 2-9 summarizes the sampling and analytical procedures used at each site.
Kpg-Detects
Non-detects are samples in which the particular chemical compound being analyzed for was not detected. In a great many instances,
7
the compounds of interest were present in the samples at concentrations near, at, or below the limits ~0.f the analytical procedures to detect them. When a compound is not detected, it is uncertain whether it is present or not. A non-detect does not guarantee that the compound in question is absent. If it is present in the sample, it is at a concentration below the detection limit of the measurement technique.
In some cases, where multiple samples were taken or multiple analyses were conducted on the same sample, a combination of non- detects and measurable results was observed. A convention was adopted to interpret data that included non-detects. This convention is used in the majority of the sixteen reports summarized here. The method used is described below and those plants that used different or unspecified methods are identified.
The commonly used method for handling non-detects in calculating emission rates and material balances is:
. If there are no non-detects, then the arithmetic average of the three or four samples is used.
. If there are both measurable quantities and non-detects, then one-half the detection limit is used for the non-detects in calculating averages. However, if the resulting average is calculated to be less than the highest detection limit, then the value is reported as "less than" the highest detection limit.
. If all values are non-detects, then the average is reported as "less than" the average of the detection limits.
Most of the reports used these conventions. Two exceptions are Plant Smith and Nelson Dewey Station. A description of the manner in which non-detects were handled was not found in the Smith
8

report. In the Nelson Dewey report, mass balance calculations involving non-detects were carried out using the detection limit for the value.
In the tables that follow, flags are used to classify the data. The flags and their definitions are:
#
A
B
C
All samples used to calculate the average shown are non-detects. That is, the compound was not observed in any of the measurements.
One of the samples is a non-detect, and measurable quantities were observed for the others.
Two of the samples are non-detects and at least one measurable quantity was observed.
More than two non-detects observed. When three samples are being reported using an average value, as many as six results could be involved in determining the average value. For example, in some samples, the entrained particulate phase and the gas phase were analysed separately providing two results for each sample.
Collecting and analysing stream samples in an operating power plant is very difficult. Load changes and natural variations in operation result in changing conditions over the duration of the test, which normally require several hours ,to complete. Because of this variability, similar runs on different days would not be expected to be exact replicates. Therefore, the limits of uncertainty have been calculated for emission factors and some of the other results. The technique used is described in the publication, ANSIjASME PTC 19.1 - 1985, "Measurement Uncertainty."
9
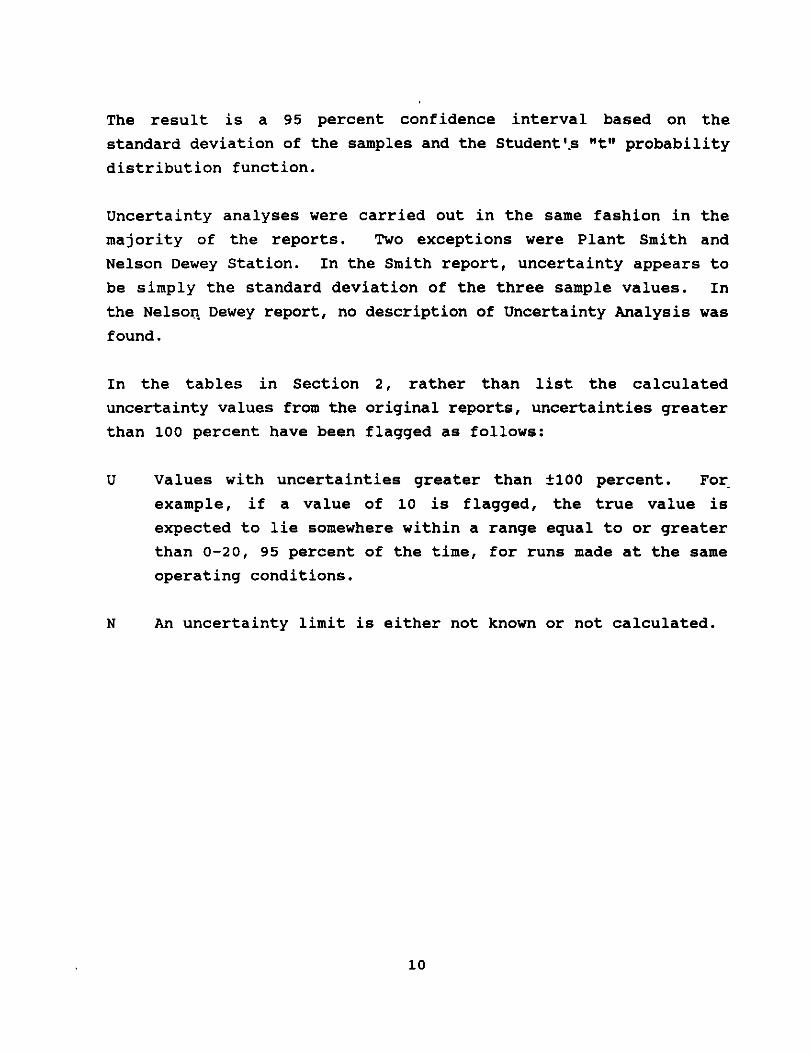
The result is a 95 percent confidence interval based on the standard deviation of the samples and the StudentIS %80 probability distribution function.
Uncertainty analyses were carried out in the same fashion in the majority of the reports. Two exceptions were Plant Smith and Nelson Dewey Station. In the Smith report, uncertainty appears to be simply the standard deviation of the three sample values. In the Nelson Dewey report, no description of Uncertainty Analysis was found.
In the tables in Section 2, rather than list the calculated uncertainty values from the original reports, uncertainties greater than 100 percent have been flagged as follows:
U Values with uncertainties greater than flO0 percent. For.
example, if a value of 10 is flagged, the true value is expected to lie somewhere within a range equal to or greater than O-20, 95 percent of the time, for runs made at the same operating conditions.
N An uncertainty limit is either not known or not calculated.
10
E ,L Y
P
L : Y
D Y 6 : ?I
-
11
5 .L 3 - -
-
E z
B
Tablo 2-2 Definition of Normal and Btandard Volumetrio Units for Each Plant
dscfm
Nd: Norml cubic maters dscm: Dry stsrdard chic meters dscfm: 0~ standard c!hic fnt per minute
12

I I I I I I al sl I I I ll


1 I 111111111 I I II 11 IIll 1
1 i i i i i i i pi i i 1.1

:
.
:
a c
:
:
;
E
:
% : :
<
5
li
v .
: * *
:
3
c
:
1 - .
:
1 -i 2 :
=
c I
” *
. * c
4
1 n
‘: 5
.i
T : .
=
.
P
F
i
.
:
f
;
i
i 5
4
I
0
I
i
Y
P
L
:
(I
l C Y
4
II 0
1
.a
5
:
3
f ?
1
4 n
c
,
t
c I
L I
i
:
:
:
r
1 c -
i
(I
: :
1
2 CI
x
i e ”
. c
2
3
2
g
4
6 .c
52 ;
k =
-
6 A
t
2 e .- ; 1 m
5 .- - 5
8 .r 1 d
6
ii-- I
;
0 s- 2 P ! .
i
= I. 4
: * < ” :
. Y n
i
6 I. n
+
;
: :
=
1
i
i : ,!
: Y c
=
: i
= c
6 C -I
i
* Y n
r
6 C n
1
: =

tie88 .- .- .- _ . .f# %sf: ;;; L . ..o
555 ..; ooo~” .t! z ‘; z y k
“353”’ uuu1*
--d-Y .-.CE
5 u cl - ‘Z ‘G YYY”.d

: i : ‘
a ‘i t e ‘Z :
z Y B m
E
i
3
I E i *
; d v
4
z 8 4 i i
;I k n; r:
I
1 ‘
i . 1 ? i : L 4 * n - =
,
= I r d I
2 r : *
i T 7 r i
i y!
.! : i i
i ._ ! ? : i =


N . ‘: N

r :
I
j : z : i c . II \ i
6 ? : 0
I :
i : i : : I , r \
P Y i *
I : i : z : : i 0 . \ q
: i r
c i
E E
i i : 5
9
E 5 5 9 ? i 5 : D ; ;

-
m 2 1 B
i I 2 Y ,r L ‘; 5 N. -

c
r
e

?. d !
a ID fi -a
u 5 E 5 E 8 5 si b 5 5: Y ‘.
u N. -. L F
I :
i : : ; i .
-: t
: ’ ”
i

s s ooo- ““““I
;.P,P.@Z #f wj i sugg= g,q@ .EEg”:i ‘-;;T-- s “““LL de-“” . ..CC 5 Y u u.;< YYY”” 9555:: iib6844

Table 24.5 Emission Factors, Semi-VOlatilO brgania Compounds (SVOC)
IID< VaLuc shoun is detection limit. x Of the CaIcuIations cmeritutiw to the average value shown, aLI include a ID)-detect mwsuremmt. h Of the calculations contributing to the werage vaLue shorn, on includes a nwvdetect naeurarent. 9 Of the calculations ccntrikutiw to the average value nhon, two irbzludc a ran-detect me~~~r~t. " Uncertainty (= 95% Confident Limit): Eque, tt, or greater th." 100 prcnt of v.Lue. n Uncertainty limit not known or not calculated.
35
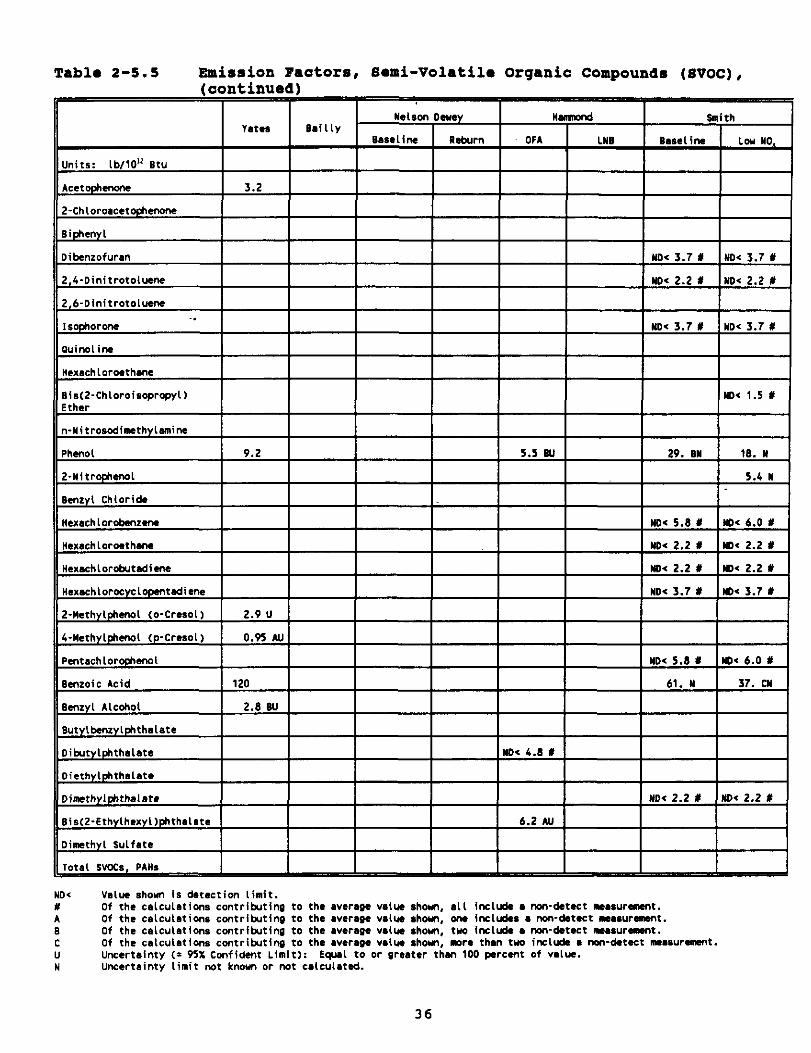
Table 2-5.5 Emission Faators, Bed-Volatile Organia Compounds (svoc), (continued)
III, Nelson Dewy I ii- Smith SdllY B~S~Lirn neburn OfA LWB Baseline Lou "0.
Puinolin
Hexachlorocthane
Bis(2-Chloroiswrowl)
Diiwthyl~thalate I I I I I I Bis(Z-Efhylhexyl)phfh~Inte 6.2 AU
Dimethyl fulfate
/iD’,:“.’ 1 ND’,::“*’
NW Value shown is detection limit. Y Of the caLcuLafions contributing to the averwe value sham, aLI include l ncivdetect meawrant. A Of the c(ILculations contributing to the average vaiw show, w includes a nwvdetsct msasurnat. B Of the calculations contributing to the average value shon, tw includa l GM-detect rrasur-t. c Of the ca1cuIations contributing to the wera9a V~(W shon, more than ~YO inclti l non-detect nrssurament. " uncertainty 0 95% confident Limit): Equ.L to or 9rsster thn 100 prc."t of value. Y Ui-artainty timit not knan or rat calculated.
36

Pablo Z-5.5 Emiaeion Factore, Semi-Voletile Organic compounde (mot), (continued)
IOX Value show in detection Limit. I Of the calculation* contritutirq to the average value *ham. atI include a nm-detect measurmt. , Of the calculations contributing to the average due rhonr, on includes a IOn-detect measurement. I Of the calculatims contributing to the aver&w vdu shown, two include a non-&test mwswment.
Of the calculations contributing to the awra~e valw show?. more than tw include l non-&ted measur-t. 0 Uncertainty (= 95X Confident Limit): Equal to or ~rc.ter than 100 percent of valw. I Uncertainty limit not known or nut calculated.
37
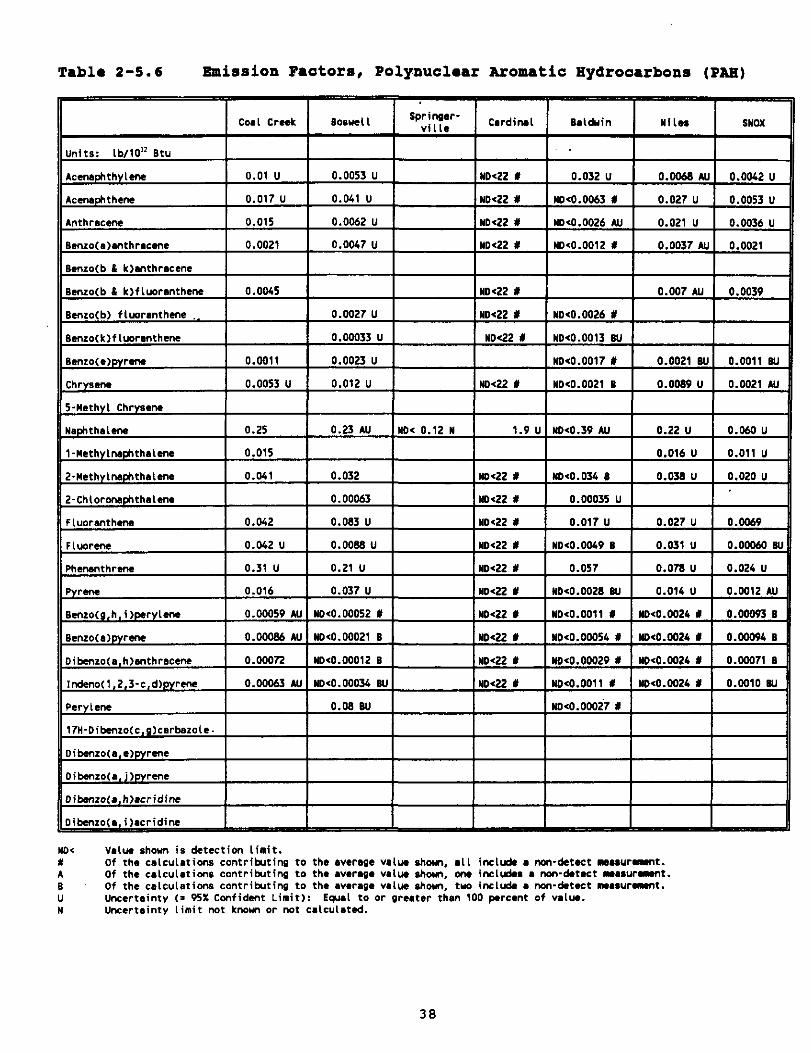
Table Z-5.6 Eahaion Factors, Polynuolear Aromatic Bydrooarbone (PAR)
Coal Creek soswel I Sprinwr- villa
Cardinal
I I 8&3uin I nites
ND< Value shorn is detection limit. x Of the calculations contribllting to the average valrw shorn,, .LI iKL& a nm-detect I*awr-t. A Of the calculations contributing to the average va1t.m ‘hon. on inclu4.s a rwv&tact I*wurmt. B Of the calculations contributing to the average value shoYn. tua include l non-detect "#SW-t. " Uncertainty (= 95% Confidmt Limit): Eq.4 to or $,re,tw than 100 p.rc.nt of valu.. w Uncertainty limit Iwt known or net calculated.
38

Table 2-5.6 Emission Factors, Polymmlear Aromatic Ziydrocarbons, (oontinued)
“0 Value ehmm is detection Limit. I Of the calculations contriixtin9 to the average value shun. 111 include a non-detect measur-t. A Of the calculations contributing to the average value shmm. on includes l Mn-detect musurrmt. s Of the cdculaticww cmtributiw to the l vwwe value show. two inclu& a revdetect measurrmt. " Uncertainty C= 95% Confident Limit): Equl to or wee., than 100 percant of value. w Uncertainty limit not known or not calculated.
39

Table 2-5.6 Emission FactOre, POlyNClear Aromatic Hydrocarbons, (oontinued)
NO< Value shorn is detecticm (init. x Of the calculations contributing to the wera9e vale shorn. aLL include a non-detect ~asurement. A Of the calculations contributing to the wera9e value sham, ona inclu!+s I nm-detect measurexmt. s Of the calculations contributin9 to the average value show, tw inclub a non-detect memsur-t. u Uncertainty C= 95% Confident Limit): EqwL to or Oreater than 100 prcent of vaLue. w Uncertainty Limit not kmm or r+st calculated.
40

. Y N e

I I I I s I I -I I I _I I II

5 Y 3
i
-
-
-
-
-
-
2
-
’ < WI u-1
-
-
2
i

,
E f II
E : t .- 2 2
i
‘
I z . ! ! .! : ! i .


0 0 z z z s s t-4 rl rl
[UAOIIIa~ JUa3.Iad
0 m z z z z z
0
r( rl
(UAOIlIa~ JUa3Jad

1
I 4~~; I
1 1
1 c: :
1 1 1
CU Y .-
c % I.
,:.
:gci
z,:
,z’: u b .” um b: cow o- *- 0 Y Q ha z: :ti kL 0)
aJ2 aJar l -
.- ; *z .:
w P
;:: .m .-
. . h w a a k 4-c)* owe
260,
1 I I


SECTIOR 3.0 INDIVIDUAL SITE RESULTS
This section contains selected results from each plant site. The data given here are reported in the units used in the individual reports except where calculations were necessary. Units may differ slightly. For example, gas stream concentrations for all plant sites are reported in micro-grams/normal cubic meter (pg/Ncm). Some contractors, however, reported results on a dry basis (jbg/dscm,.picro-grams/dry standard cubic meter), and some did not. Some concentrations were corrected to 3 percent oxygen, and some were not.
The stream numbers on the plant schematics correspond to the column numbers in the tables of stream flow rates.
57

Creek Statinn
The Coal Creek Station is located about 50 miles north of Bismarck, North Dakota, near Underwood, North Dakota. Coal Creek Station is a two-unit, zero discharge, 1,100 MWe, mine-mouth plant located in a lignite field. The two units are identical. The study described in this report was conducted on Unit No. 1. Each unit has a tangentially fired, water walled, dry bottom furnace, with a CombustioD Engineering Controlled Circulation boiler. The furnace is fueled by lignite that is conveyed into the plant from the Falkirk mine located adjacent to the plant. Coal is fed to the boiler through eight pulverisers, of which seven are in operation at any one time. Each unit is equipped with an electrostatic precipitator (ESP) for particulate removal, and with a wet flue gas desulfurisation unit (FGD, denoted as scrubber) for sulfur dioxide (SO,) removal. Each of these components is described below. _
Lignite is supplied to the plant from the nearby Falkirk mine by a conveyer system over 3 miles long. A series of conveyers and silos allows for supply of the plant, and for movement of coal in and out of yard storage supplies. The lignite is crushed, prior to being supplied to eight silos in each unit of the plant. The crushed lignite from the silos is then pulverised in eight bowl mills, which grind the coal to a fineness of 65 percent through 200 mesh. Only seven of the eight mills are in operation at any time. The pulverising process also reduces the moisture content of the coal by about half.' The pulverised lignite is transported to the furnace pneumatically, and injected into the furnace through tangential nozzles at eight levels in the windbox registers in the front and rear furnace walls.
Coal Creek Unit 1 is designed to achieve low NO, production by means of the tangential firing, which produces a vortex in the furnace, causing mixing of the fuel and air streams throughout the furnace. Internal recirculation of gas within the furnace vortex
56

provides low NO, production, and results in a long residence time for combustion, favoring low hydrocarbon and CO emissions. Reduction of NO, is also achieved by addition of overfire air.
Soot blowing at Unit 1 is conducted continuously on at least some portion of the furnace, using a total of 262 steam soot blowers installed in the furnace.
The flue..gas leaving the Unit 1 boiler travels through an economizer and then through two parallel air preheaters (not shown) on its way to the two parallel halves of the ESP. The two halves of the ESP are shown as ESP Xl and ESP #2 in Figure 3.1-1. Gas leaving the preheaters is divided into four ducts, two of which connect to each half of the ESP. The ESP is constructed as two separate shells or halves, permitting operation with one shell under reduced load conditions.
The ESP provides a specific collecting area of 599 square feet per 1000 actual cubic feet per minute of gas flow. ESP is rated at a removal efficiency of 99.5 percent at inlet particulate loadings of greater than 1.16 grains per actual cubic foot (2.65 grams per actual cubic meter). At lower inlet loadings, the outlet particulate loading is rated to be no higher than 0.0058 grains per actual cubic foot (0.013 grams per actual cubic meter).
Ash from the hoppers is removed by a pressurised pneumatic system that dumps two hoppers at a time. Flue gas leaves the ESP in four ducts which connect to four induced draft fans. The gas flow from these fans recombines into two ducts that connect to the Unit 1 scrubber system.
The Coal Creek Unit 1 scrubber is a Combustion Engineering Air Quality Control System (AQCS), which removes SO2 from the flue gas by means of four countercurrent spray towers using an alkali slurry. The system is designed to remove 90 percent of the SO,
59

from up to 60 percent of the flue gas flow. The unscrubbed (by- passed) flue gas is recombined with the scrubbed gas to reheat it. Flexibility in responding to variations in fuel sulfur content is provided by the variable gas bypass flow, and by the capability of operating with fewer than four spray towers at a time.
In the scrubber, alkaline slurry is pumped to the spray towers from two slurry reaction tanks (not shown), and drains back after collectioy! at the bottom of the scrubber. The scrubber slurry is maintained at a pIi of about 7 by intermittent automatic introduction of lime slurry into the reaction tanks. The lime slurry is made up as needed from commercial pebble lime and scrubber makeup water, to a nominal solids content of 15 percent. This slurry is added to the reaction tanks, along with scrubber makeup water for tank level control. Scrubber makeup water also enters the system as an intermittent flow of mist eliminator wash water (not shown).
The scrubber bypass flow can be adjusted by means of dampers in the flow line. The bypass flow results from the convergence (from opposite directions) of the two combined flow streams downstream of the four induced draft fans at the outlet of the ESP. At the convergence point, the combined bypass flows turn vertically to meet the scrubbed flue gas flow exiting the scrubber. As a result of the contorted bypass flow path, the gas velocity profile in the bypass duct is highly non-uniform.
During the six days of measurement in this study, the scrubber was operated in a normal manner. As a result, scrubber operation varied in response to variations in the sulfur content of the feed coal. Because of this factor, all four of the scrubber spray towers were in service on the first, fifth, and sixth days of measurements, but only three were in service on the second, third, and fourth days. Changeover between the two modes of operation was done after the completion of flue gas measurements on each day.
60
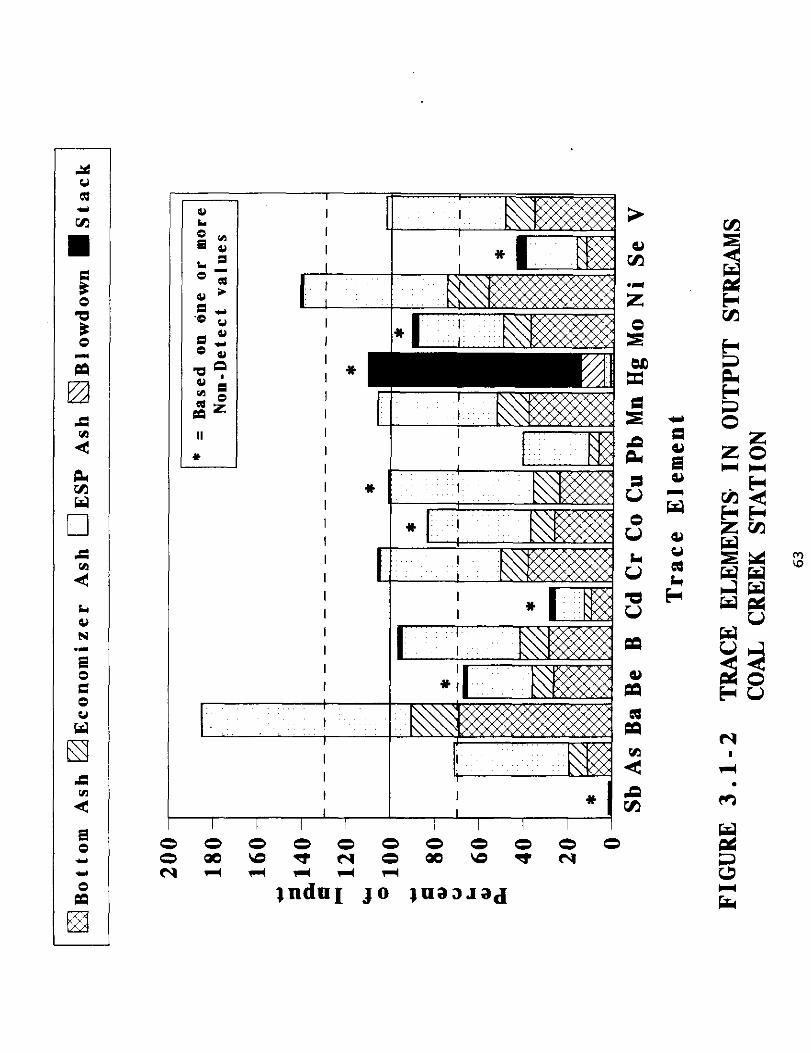
A schematic flow diagram is shown in Figure 3.1-1 and Figure 3.1-2
shows the partitioning results for the .trace elements. Tables 3.1-1 and 3.1-2 present the trace element flow rates and concentration/removal efficiency information for this plant. Table 3.1-3 gives the stream temperatures at various points in the plant.
. .
61

I b e Sam B co .- ‘;;z E .- $ -m *‘p
I 0000000
0000\0~f.00000 s z 0
earlrldrlr(
qnduI JO Juaarad


Table 3.1-2 conoentratione snd Collootion Dovioe Removal Effioienoiee, Coal Croak station
Table 3.1-3 Stroam Temperatures, Co81 Creak Station
ITemperature, deg F II II Steam, Superheater Outlet I 1004 II
Steam, Reheater Outlet 1005 ESP Inlet 340
ESP Outlet, Scrubber Inlet 317 Scrubber Outlet ITo Stack) 230
65

3.2
The Boswell Energy Center is located in Cohasset, Minnesota, and is owned and operated by Minnesota Power Company. The power plant comprises four coal-fired units numbered 1 through 4. Units 1 and 2 are each rated at 69 MWe, Unit 3 is rated at 350 MWe, and Unit 4 is rated at 500 MWe. Unit 2, built in 1957, was studied in this program. This unit, equipped with a Riley Stoker front-fired boiler, burns western subbituminous coal delivered to the station by train from the Powder River Basin area of Montana and Wyoming, primarily from the Rosebud seam. Average coal characteristics for this study were 8.4% ash, 0.70% sulfur, 24.0% moisture, and approximately 8,800 Btu/lb higher heating value.
Unit 2 is operated from a control- room which is common to both Units 1 and 2. At Unit 2, coal is transferred from storage bunkers through feeders directly into four pulverisers located on the ground floor. Pulverized coal is transported via primary air through 9 burners on the front of the furnace. Secondary combustion air is introduced to the furnace through a windbox. The combustion gases leave the furnace and enter the convective pass section of the boiler which is composed of vertically divided superheater and reheater sections. Main and reheat steam temperatures are controlled primarily by dampers at the,outlets of the superheater and reheater sections, and/or by a superheater/reheater bypass duct. Superheater and reheater attemperation sprays are available, but seldom used.
Next, the combustion gases are directed through an economizer section followed by an air preheater section. Some entrained particulate (i.e., ash) is deposited on various boiler wall and tube surfaces. Unit 2 is equipped with a series of sootblowers to remove this slagging and fouling material. The sootblowers are
66

used on an irregular basis. That is, when heat transfer patterns
change, the sootblowers are used to clean the contaminated surfaces
and regain optimum steam temperature control and thermal
efficiency. Selected sootblowing sequences are normally executed
at least once per shift, but not necessarily at the same time
during each shift.
At this unit, the economizer hoppers are maintained full, resulting
in the carryover of overhead ash (i.e., fly ash) to downstream
collection equipment.
Unit 2 uses a baghouse for particulate control. The original mechanical particulate collector has been removed, although the
housing remains as part of the ductwork leading to the retrofitted
baghouse. The baghouse consists of eight compartments containing
a total of 1,920 Teflon-coated fiberglass bags (240 bags per
compartment), has an air-to-cloth ratio of 1.974:1, and uses. reverse air for cleaning. It is designed for 99.7% particulate collection efficiency. The flue gas exit temperature is 300-400°F
under normal operating conditions. Boswell Unit 2 has no other air pollution control equipment currently installed.
Flue gas is discharged from Units 1, 2, and 3 via a common stack.
Maintenance is effected by directing gas flow from the common stack
to ,an adjacent 250-foot stack using dampers in the breaching of
each unit. The 250-foot stack originally served Units 1 and 2
prior to the construction of Unit 3. Since there are no provisions
for emission measurement on the 250-foot stack, a suitably configured and equipped section of ductwork located downstream of the Unit 2 baghouse and upstream of an induced draft (ID) fan was
selected for flue gas discharge characterization.
All overhead ash collected in the baghouse hoppers is removed from the plant site via truck.
67

Furnace bottom ash is sluiced to a common bottom ash pond for Units
1, 2, 3 and 4. Supernatant from the pond is used as return water
for all four units, and a portion of it is blown down. The blowdown is a part of the combined supernatant from the pond; it is
not specific to each unit.
A process flow diagram of Boswell Unit 2 i5 shown in Figure 3.2-l.
Partitioning results for trace element5 are presented in
Figure 3.2-2. Tables 3.2-l and 3.2-2 give the trace element flow rates and concentration/removal efficiency information for the
Boswell Plant. Table 3.2-3 gives the stream temperatures at
various points in the plant.
68

---z-l 4-r :I
I
.I
+

L -r 0
z z
0 0 0 UJ z ua
cv JndnI- Jo &~a~
Tablo 3.2-l Tram Blement Blow Rates, Boswoll Energy Center
IIDs Value shmin is &tectim limit " IKludes ore non-detect m.surment I IKiudcS two mn-datcct n.suremmto x Won-detectible in all soles
71

Tab10 3.2-2 Conoentrations and co11eation Deviao Removal Effiaiencies, Boswell Energy Center .
Tablo 3.2-3 Stream Temperatures, Boswell Energy Center
72
Springerville Generating Station Unit No. 2 is owned and operated
by the Tucson Electric Power Company (TEP) and is located near
Springerville, Arizona. The plant is a zero-discharge design,
burning subbituminous coal from the Lee Ranch Mine in New Mexico.
The coal has an average sulfur content of 0.7% and an ash content
of 19%. Typical gross electrical generation at full load is 397
me, and -the net generating capacity is approximately 360 RWe.
(During testing, Unit No. 2 was operated at maximum capacity, with 422 MWe gross and 383 RWe net electrical output.)
The Unit No. 2 boiler is a corner-fired, balanced-draft design with
overfire air for reducing NO, emissions. Coal is fed to the boiler through bowl mill pulverizers. Pyrite is separated from the coal
in the pulverizers. At full load, five or six pulverizers feed
about 200 tons per hour of coal into 24 burners and produce 2.6‘
million pounds per hour of steam. Approximately 22% of the coal
ash is retained as bottom ash in the boiler. The bottom ash is
removed by a sluice. Soot blowers for the boiler walls are
operated on a continuous cycle, and the air heater soot blowers are
operated once per shift (twice daily). Pulverizer reject (pyrite) and bottom and economizer ash (sluice) are pumped to dewatering
bins, surface water is passed through screens in the bins, and
returned back for sluicing operations. The dewatered solids are
trucked to the ash disposal area.
Unit No. 2 uses one cooling tower with 13 cells and one dual-
pressure, single-shell condenser. The condensate is treated and
recirculated. All makeup water for the unit is obtained from a
storage pond supplied by seven nearby wells, or other waste water
streams of the unit. Waste water is also treated on site and
either sent to evaporation ponds or used as makeup water for other unit processes.
73

Unit No. 2 uses a Dry Flue Gas Desulfurization (FGD) system. The system has three spray dryer absorber @DA). .modules and one
atomizer per absorber. A small portion of the flue gas (about 15%
at full load) bypasses the SDA modules. Under normal conditions,
at operation above 60% capacity, all three SDA modules are in
service. Fresh lime from Chemstar Lime of Nelson, AZ, is slaked in
ball mills at the plant. The fresh lime milk has a lag time of one
to two hours from the lime milk storage tank to the injection
through the atomisers. Solids content for the fresh lime slurry is
maintained at 24%. The FGD system uses sorbent/ash recycle from
the baghouse to supplement the fresh lime slurry. Recycle feed rate is adjusted to control the temperature of the flue gases
leaving the SDA modules to 71 C (160OF). Solids content of the slurry feed at the atomisers is kept at about 50%. Air is entrained into the bottoms of the SDA modules to limit solids dropout in the modules. All of the fly ash and slurry residue pass
through the SDA absorbers into the -baghouse inlet ducts.
The baghouse system consists of two baghouses with 14 compartments
each that withdraw flue gas from a common manifold. Filtered flue gases are pulled from the two baghouses into separate induced draft fans before being exhausted through the 152.4-m tall stack that is exclusive to Unit No. 2. Fly ashfsorbent is either recycled to the
mix tank to be used in the FGD system or transported to a fly ash
silo and then trucked to an ash disposal area.
Figure 3.3-l is a schematic process flow diagram for Unit No. 2 and
partitioning results for trace elements are presented in Figure 3.3-2. Tables 3.3-l and 3.3-2 give the trace element flow rates and concentration/removal efficiency information for the
springerville Station. Table 3.3-3 gives the stream temperatures at various points in the plant.
74
r
+a . k- a a
8;; .I J.5; a
I* I I
I
I k-H/////// Y
Table 3.3-2 Concentrations and Removal Efficiencies, Bpringerville Btatiion
Table 3.3-3 Stream Temperaturea, Bpringervillo Station
Temperature, deg F
SDA Inlet
SDA Outlet
290
167
Baghouse Inlet I 179
78

3.4 Cardinnl Statipn
Ohio Power Company's Cardinal Station is~ located in Brilliant,
Ohio, along the Ohio River. It has three coal-fired boilers and is
adjacent to the TIDD pressurized fluidized bed combustor (PFBC)
demonstration plant. Unit 1, the host site, is considered to be
representative of older coal-fired power plants without NO. or SO2
controls and was operated at maximum capacity (606 MWe average)
during the tests. Further, this unit is considered to be representative of cell burner boiler designs . . utilizing an electrostatic precipitator to control particulate emissions. These units are presently exempt from Phase 1 acid rain controls because
the effectiveness of existing NO, control technologies for this
application is not well known. Babcock and Wilcox is the only
manufacturer of cell burner units. This design was sold from 1960 to 1970.
The only atypical feature of the Cardinal boiler design is that the.
upper row of burners employs only a single nozzle. This feature is likely due to the lack of a spare pulverizer (all five must be in service to achieve full load) on this unit. Since NO, emissions
from the host unit are fairly typical of other cell burner units,
it is believed that combustion conditions within the furnace are
representative of most cell burner units despite this difference.
The plant fires a high-sulfur bituminous coal. This is typical of coals normally fired at the plant. The coal is a Pittsburgh No. 9
coal and is typical of medium volatile bituminous coals. The coal
is shipped to the station by rail, barge, or truck. Coal is
unloaded and stored at the plant in piles located between Units 1
and 2, and Unit 3. The coal for Unit 1 is delivered to five 600- ton bunkers by a series of conveyors without additional size reduction. At maximum firing rate, Unit 1 burns approximately 225 U.S. tons per hour. Coal from the bunkers is delivered to five
bowl-mill pulverizers. The pulverized coal is pneumatically conveyed by the primary air to the boiler. Rejects (mainly pyrites
79
and other hard mineral matter) from the pulveriser5 are collected
in bins at the base of the pulverizers.
The boiler is a forced-draft cell burner unit with two stages of
reheat, manufactured by Babcock and Wilcox. Cell burner boilers are characterised by relatively small furnaces, resulting in a heat
release per unit furnace volume of 6.7 MW/cubic meter. Downstream of the pulverisers, the air/coal mixture from each pipe is split
into two pipes, either feeding separate burners at the top burner
level or .$he two nozzles of a cell burner. Gaseous combustion products and entrained solids pass through the boiler and a single
convective pass prior to splitting off to two vertical-axis
regenerative rotary air preheaters.
Downstream of the air heaters are two Research-Cottrell ESPs
(identified as A and B) arranged in parallel for particulate
control. Each ESP has 10 fields in series. The ESP is moderately sized and has a design-specific collection area of 83 m'/m'/sec (424
ft'/lOOO acfm). Electromechanical rappers are employed for
discharge and collecting electrodes. Underneath each of the ESPs are three rows of six hoppers for collection of captured fly ash.
Flue gas is exhausted to the atmosphere from a single round stack
with a height exceeding 800 feet.
Bottom ash falls into the ash hopper at the base of the boiler.
The bottom ash hoppers are sluiced by water four times a day
forming a slurry of ash and water. The sluice cycle lasts one to
two hours. Water for the slurry is supplied from the ash water
recirculating pump pond from the Ohio River, and the slurry discharges to the bottom ash pond.
The fly ash collected in the ESP hoppers is removed with a vacuum pneumatic conveying system. A vacuum line from a water-driven
eductor (hydroveyor) runs to all the hoppers. Bach row of hoppers
can be isolated by an automated valve at the head of each line.
The fly ash hoppers are evacuated sequentially in a continuous
automatic cycle. The air is removed from the fly ash slurry
downstream of the hydroveyor in an air/water separator tank. The
slurry is then pumped from the tank and discharged to the fly ash
settling pond.
A schematic flow diagram is shown in Figure 3.4-l while
Figure 3.4-2 presents the trace element partitioning. Tables 3.4-l
and 3.4-2 show the trace element flow rate5 and
concentration/removal efficiencies for plant equipment. Table 3.4-3 gives the stream temperatures at various points in the
plant.
81
.
I I I I I
. . I I I I I I I I I I
1 ,,I,’ ‘,:~ :::,I ‘;~;’ ,: ,, ~:j,;
I I I I I
I
I I I I I
I I Eli %
I I a z

Table 3.4-l Trace Elumnts Flew Ratms, Cardinal Station
'Calculated fra crushed coal l alysis.
a4

Table 3.4-2 Coaaentration and. Removal Efficienciee, Cardinal station
Table 3.4-3 Stream Temperatures, Cardinal Btation
Temperature, deg F
Steam

3.5 BW
The Baldwin Power Station is located in Baldwin, Illinois, and is owned and operated by Illinois Power Company. The power plant is composed of three coal-fired units numbered 1 through 3. All three units are rated at 568 MWe. Unit 2 was studied in this program.
This Babcgck &.Wilcox cyclone furnace unit, built in 1973, burns
high-sulfur Illinois bituminous coal that is delivered to the
station by train. Average coal characteristics for this study were
10.2% ash, 2.9% sulfur, 15.0% moisture, and 10,600 Btuflb higher heating value.
Unit 2 is operated from a control room which is common to all three
units. At Unit 2, coal is transferred from storage bunkers through,
feeders directly into 14 cyclones. The boiler is opposed-fired
with a bottom row of four cyclones and a top row of three cyclones
on each side. The combustion gases exit the furnace and enter the
convective pass section of the boiler which includes superheater
and reheater sections. Main and reheat steam temperatures are
controlled primarily by flue gas recirculation and combustion air
flow, and attemperation sprays for secondary control. Next, the
combustion gases are directed through an economiser section.
Some entrained particulate (i.e., soot) is deposited on various
boiler wall and tube surfaces. Unit 2 is equipped with a series of
soot blowers to remove this slagging and fouling material. The
soot blowers are used on a regular basis, once per shift.
Supplemental soot blowing is performed to clean surfaces and regain
optimum steam temperature control and thermal efficiency when heat absorption patterns change.
Some overhead particulate is collected at the economiser outlet and is conveyed to an ash pond via a water sluice system. Final
86

particulate control is effected by an electrostatic precipitator
(ESP). The ESP ash is also sluiced to an ash pond.
The ESP consists of six chambers and each chamber is four fields
deep. The ESP has a specific collection area of 179.8 ft'/l,OOO
cfm and uses weighted wire electrodes. The collecting plates are spaced 9 inches apart. Unit 2 has no other pollution control equipment.
. . The unit has its own stack. Ports at the ESP inlet and outlet (stack) were used for flue gas emission sampling/testing purposes.
The unit's condenser system is a tube heat exchanger. The average intake rate of condenser water is 50 ft'/s. This system is served by a cooling reservoir (Baldwin Lake) covering an area of 2,000
acres and containing 22,000 acre feet of water.
The bottom ash, economiser hopper ash, and ESP hopper ashes are sluiced to an on-site ash pond system. The bottom ash is sluiced to its own primary and secondary ponds. The economizer and ESP
hopper ashes are sluiced to common primary and secondary ponds.
The supernatant from both secondary ponds overflows to a single
tertiary pond. The effluent from the tertiary pond is discharged to the nearby Kaskaskia River. All of the bottom ash is sold for
commercial use.
A process flow diagram of Baldwin Unit 2 is shown in Figure 3.5-l.
Figures 3.5-2 and 3.5-3 give the partitioning results for non-soot- blowing and soot-blowing periods. Tables 3.5-l and 3.5-2 present trace element flow rates for both periods. Table 3.5-3 presents
the concentration and removal efficiency results for both periods. Table 3.5-4 gives stream temperatures ,at various points in the
plant.
a7

I I I I I I I I I I I I I I I I I I I I I I I I I I I I I I I
I I
0 0 0 0 0
: z m z m
qndnI+ Jo &.~ad
/ I I I I I I I I I I I I I I I I I I I I I I I I I I I I I I I I I
0 z
0 0 0 0
z m 0 VJ
m 1ndoI- Jo ~&rad


Table 3.5-2 Traoo Element Flow Rato8, Baldwin Station, Soot Blowing Period
.
fos vaLw rholn is detection Limit ,nc,udc* me non-datrt me.*wemnt
8 ,nc,udes two non-detect n*..urantr c ~ndudes five nm-detect I*asur-ts (pralIeI srplinp in tm hopparr) t Non-detectibkc in di raaples
92

Table 3.5-3 conoentratiom and Collootion Bevia8 Removal Effiaiencies, Baldwin Station
Table 3.5-4 Stream Temperatures, Baldwin Station
Temperature, deg F
Non-Soot Blowing
II ESP Inlet I 336 II ESP Outlet (To Stack)
93

3.6 NV
Niles Station of Ohio Edison is located in Niles, Ohio, on the bank
of the Mahoning River. The Niles Boiler No. 2 is a Babcock &
Wilcox cyclone boiler burning bituminous coal with a net generating
capacity of 108 WWe. The furnace gas temperature at full load
upstream of the superheater is about 1900OF. The boiler has four
cyclone burners, each fed by a separate feeder. The Niles Plant
uses coal..with a low ash fusion temperature to allow the majority
of the ash to drop out in the furnace cyclone combustors and to
avoid carry-over into the boiler. The coal is mined in eastern
Ohio and western Pennsylvania and is received in the respective proportions of about 70130. Coal mined in Ohio comes principally from coal seams Nos. 6 and 7. The Pennsylvania mined coal comes
also from seams Nos. 6 and 7 and from the KittanningjFreeport seam.
All the coal burned at the plant is from spot market purchases.
which are provided by up to a dozen different suppliers. The
nominal contents of sulfur, ash, and higher heating value are 2.7
percent, lo-12 percent, and 12,000 Btu/lb, respectively. The coal is blended in the coal yard at the plant to meet 24-hour and 30-day
rolling averages for SO2 content of flue gas. The feed rate of
crushed coal to the four cyclone burners is determined by Ohio
Edison from the quantity of coal on the four conveyor belts
delivering the coal to the burners, along with the speed of travel
of the belts. Each belt holds approximately 45 kg/m (30 lbfft) of
coal. The lag time for coal on each of the four conveyor belts to
reach the cyclone burners and be fired is a few minutes.
The flue gas leaves the boiler economiser, passes through an air
heater (not shown), and enters an electrostatic precipitator (ESP) with five fields, each with two hoppers. The first row of hoppers is deactivated and acts to passively collect coarse ash leaving the
air heater. The fourth row of hoppers was also deactivated during
this study, but was sampled. The ESP hoppers are dumped about
every 4 hours; hopper sampling in this study was adapted to that
94
schedule. The proportions of ash collected in each row of hoppers
were estimated during this study by timing of the.dumping cycle of
the ESP. Collected ESP ash is transported to a settling pond by a
water sluice. The flue gas leaving the ESP is vented through a 120-m (393-foot) tall stack.
Characteristic of cyclone boilers, a large fraction of the ash from coal combustion is collected as bottom ash and relatively little as
fly ash. ..For Niles Boiler No. 2, typically about 85 percent of the
total ash is collected as bottom ash and air heater ash (of that
portion the great majority is bottom ash), and only about 15 percent of the total ash is collected in the ESP. The fly ash produced by a cyclone boiler typically is relatively coarse and has
a larger carbon content than does such ash from other boiler
designs. The typical average carbon content of the ash collected in the entire ESP is about 40 percent at Niles Boiler No. 2. The
coarse nature of the fly ash is the reason that the row 1 ESP
hoppers are operated as passive (i.e., deenergized) collectors.
A 35-megawatt equivalent slipstream of flue gas from the Niles
Boiler No. 2 is normally taken after the air heater and before the ESP to demonstrate the SNOX process, an ICCT demonstration by ABB
Combustion Engineering. The SNOX process was shut down during the
sampling period described here so that 100 percent of the Boiler
No. 2 flue gas passed through the ESP before venting through the
stack.
Ammonia is normally added to the flue gas upstream of the ESP at a
rate of 0.1-0.2 m'jmin (4-6 cubic feet per minute) to achieve a
concentration of about 18 ppm. This is done to control acid mist
fallout from the stack and does not appreciably affect ESP performance. However, during the course of this project ammonia was not added to the flue gas to assure consistency with separate
measurements made as part of another program on the SNOX process in
which ammonia was not added.
95

Normally, soot blowing occurs once each shift. To accommodate
measurements of the effect of soot blowing on .flue gas element
concentrations, Ohio Edison altered the schedule for soot blowing
during the field study. Soot blowing was conducted over a 2-hour period (approximately 6-8 a.m.) before sampling began each day and again after all sampling was completed each day. Soot blowing is conducted automatically using 18 lances sequentially, one at a
time. Seventeen of the lances are located in the furnace gas
convection path, and one is located at the top of the air heater.
compressed air is used for soot blowing.
A schematic of the Niles Boiler No. 2 process flow is shown in Figure 3.6-l. Figure 3.6-2 presents the partitioning of the
elements which give the trace element flow rates. Table 3.6-2 shows concentrations and removal efficiencies at key points in the
plant. Gas stream concentrations are reported on a dry basis,
corrected to 3% oxygen. Table 3.6-3 gives stream temperatures at
various points in the plant.
96


0 0 0 0 0
2 z v) =: m
1ndnI- Jo &~ad

Tabla 3.6-l Tram Elomant Flow Ratas, Idles Station
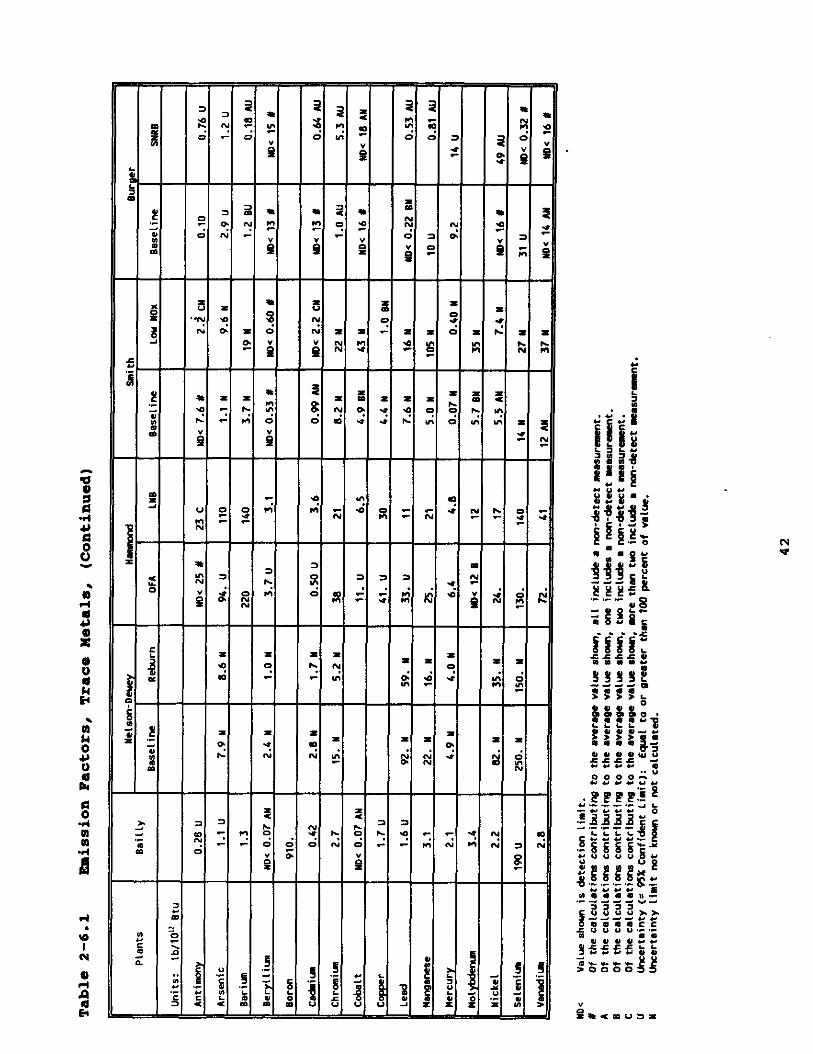
ND‘ Value *Iwin is detection Limit A lK,ude* me nm-detect mo.s”rment 8 Includes tbw non-detect re.swements * Non-detectiblc in l LL suples Y/A Not analyzd
99

Tab10 3.6-2 concentrations and Bornoval lffioionaioa, Nilos station
ESP Inlet,
ro/tld
Stack,
CS/Yd
ESP RamVll
Efficiency, Pcrcmt
Antimany 152 “0‘ 0.60 x Pp.8
Arsenic 2.274 70 97.4
Barium 1,129 a.a w.3
seryllim 59 0.31 99.6 . .
A IKludes me mwd8tect m.*“~anmlt s InsludeS tuo non-detect mo..“mmmS Y Non-detmctible in all smplcs
Tab10 3.6-3 Stream Temporhuros, Nilme Station
BTemperature, deg F
II Steam, Superheater Outlet I 1000 Steam, Reheater Outlet ESP Inlet
utlet (To Stack) 293
100

3.7 SNOX Procw
Niles Station of Ohio Edison is located in Niles, Ohio. The Niles Boiler No. 2 is a cyclone boiler burning bituminous coal with a net generating capacity of 100 MWe. The boiler has four cyclone burners, each fed by a separate feeder. Nominal sulfur content of the coal is 2.0 percent. The coal comes from several local sources and is blended in the coal yard to meet 24-hour and 30-day rolling averages for SO* content of flue gas.
The flue gas leaves the boiler, passes through an air heater (not shown), and enters an electrostatic precipitator (ESP) with five fields, each with two hoppers. The flue gas leaving the ESP is vented through a 120-m (393-foot) tall stack.
The SNOX process takes a slipstream of flue gas ahead of the ESP,. cleans the slipstream, and returns it to the flue gas after the ESP and before the stack. All flue gas sampling was conducted on the slipstream of the SNOX process. Therefore, operation of the ESP had no effect on the measurements summarized in this report.
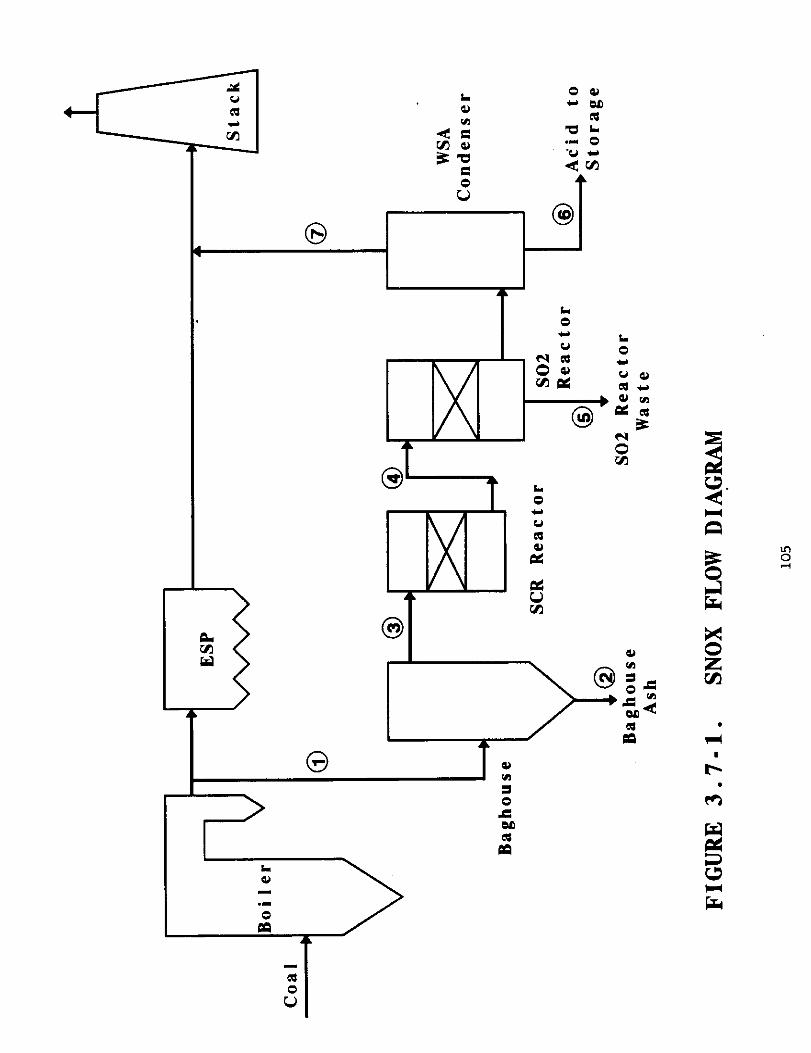
This ICCT project is the Wet Gas Sulfuric Acid (WSA)-Selective Catalytic Reduction of NO. (SNOX) demonstration by ABB Environmental Systems (Comprehensive Report to Congress, Clean Coal Technology Program, WSA-SNOX Flue Gas Cleaning .Demonstration Project, U.S. Department of Energy Report No. DOE/FE-0151, November 1959). Cosponsors are DOE, Ohio Coal Development Office, Ohio Edison, and Snamprogetti, USA. The SNOX process combines selective catalytic reduction and wet sulfuric acid technologies to remove both nitrogen and sulfur oxides from flue gas.
A 35-MWe equivalent slip of flue gas from the Niles Boiler No. 2 is taken after the air preheater and before the ESP to demonstrate the SNOX process. The SNOX system pulls a constant load from Boiler No. 2 as the total load on the boiler fluctuates about full load.
101

The flue gas entering the SNOX process from Boiler No. 2 first passes through a support burner (not shown). .to increase its temperature. The support burner is fueled with natural gas. The combustion air flow is steady, and the flow of natural gas is varied to maintain the temperature of the flue gas. The heated flue gas travels to a baghouse to remove particulate matter. After the flue gas leaves the baghouse, ammonia is added to the particulate-free flue gas. The flue gas then passes through the selective catalytic reduction (SCR) unit, where oxides of nitrogen are reduced to free nitrogen and water vapor. The flue gas then passes through the SO2 reactor where SO* is oxidized catalytically to sulfur trioxide and subsequently recovered as sulfuric acid in a wet gas sulfuric acid condenser. The flue gas then rejoins the flue gas from the boiler downstream of the ESP, and exits through the stack.
The SNOX baghouse removes particulate matter from the flue gas stream prior to the SO2 catalyst. This allows the catalyst, which collects and retains over 90 percent of the particulate matter reaching it, to be used for longer periods of time before cleaning.
The SNOX baghouse was manufactured by ABB Environmental Systems. With a gross air-to-cloth ratio of 3.76 (4.51 net), it has six compartments containing a total of 1,596 Gore-Tex bags. The bags are,431 cm long (169.75 inches) and 15.2 cm (6 inches) in diameter. The bag material is Teflon on fiberglass. New bags were installed in the baghouse several days before sampling began.
Collected particulate matter is dislodged from the bags by pulse jet cleaning several times an hour. The pulse pressure is 3.4-4.8 x lo5 kPa (50-70 psi). This is automatically initiated by pressure drop sensors. The ash falls into one of.six hoppers. The hoppers are dumped once a shift after the ESP hoppers are dumped. The Nile6 Station hydro-vat system first empties the ESP hoppers and then automatically empties the SNOX baghouse hoppers. Ash is drawn
102

out of the baghouse hoppers into a sluice line until the low vacuum limit is reached.
After the flue gas leaves the baghouse, it passes through a gas-gas heat exchanger (not shown), increasing the flue gas temperature. Ammonia is added to the flue gas on a local scale throughout the cross section of the duct through a matrix of nozzles. An additional 22.65 scmfmin (800 scfm) of air flow is added to the flue gas with the ammonia addition. The ammonia/flue gas mixture enters the SCR and contacts the monolithic catalyst. The catalyst reduces the NO to nitrogen and water vapor. The local concentration ratio of ammonia/nitrogen oxides can be slightly greater than stoichiometric because any unreacted ammonia that passes out of the SCR is oxidized to NO, water and nitrogen further downstream in the SO* reactor. Throughout this portion of the SNOX process, the temperature of the flue gas is above the dew point of ammonium sulfate and ammonium bisulfate. Therefore, no sulfate' particulate matter is generated in the flue gas from the ammonia.
The flue gas leaving the SCR is heated to increase its temperature for optimum conversion of SO, in the SO, reactor. The SO2 is oxidised to SO, as it passes through a sulfuric acid catalyst.
The flue gas then passes through the gas-gas heat exchanger where SO, is hydrated to sulfuric acid. The sulfuric acid vapor is condensed in the WSA condenser. This is a tube and shell falling film condenser with ambient air used as a cooling medium on the shell side. The condenser has 7,200 glass tubes.
The condensed sulfuric acid is fed into an acid conditioning and storage system.
A flow diagram is shown in Figure 3.7-l. Figure 3.7-2 shows the partitioning of the trace elements. Tables 3.7-l and 3.7-2 present the trace element flow rates and concentrations/removal
103
efficiencies, respectively. Table 3.7-3 gives the stream temperatures at various points in the plant.
104
4
I I Y I IQ,m
0 u I

0
2 z
0 0 0 In z m
N IndoI- Jo $-wad


Table 3.7-2 Conaontrations and Removal Etticionaie8, SNOX Proaeea (Nile8 Station)
Table 3.7-3 Stream Temperatures, SNOX Proae88
IiTemperature, deg F
II Steam, Superheater Outlet I 990 II II Steam. Reheater Outlet I 974 II
Baghouse Inlet 387
Baghouse Outlet 379 SCR Oultet 663
II WSA Condenser Inlet I 505 I
108

3.8 YateS
The Plant Yates Unit NO. 1 is a bituminous coal-fired steam electricity-generating unit with a net generating capacity of
100 HWe. Located in Newnan, Georgia, the station is owned and operated by Georgia Power Company. Unit 1 includes a tangentially fired CE boiler that burns a 2.5 0 sulfur blend of Illinois No. 5 and Illinois No. 6 bituminous coals, an electrostatic precipitator for particulate control, and the CT-121 flue gas desulfurization system for sulfur dioxide (SO,) emissions control during the ICCT demonstration.
Flue gas flows through a single duct into the ESP, which is four chambers wide and three rows of chambers deep; however, only the first two rows of chambers are energised. The ESP has a separate row of hoppers to collect the fly ash from each field, i.e., one. row of hoppers per field. After the ESP, the flue gas flows through a single ID fan and then to the CT-121 system. The flue gas exiting the CT-121 unit is vented to the atmosphere through a 250-foot exhaust stack.' No other units at the station use this stack.
The CT-121 is a second-generation FGD process and employs a unique absorber design, called a jet bubbling reactor (JBR), to combine conventional SO2 absorption, neutralisation, sulfite oxidation, and gypsum crystallization in one reaction vessel. The process is designed to operate in a pH range (3 to 5) where the driving force
for limestone dissolution is high, resulting in nearly complete reagent utilization. Oxidation of sulfite to sulfate is also promoted at the lower pH because of the increased solubility of innate oxidation catalysts such as iron (Fe). Because all of the absorbed SO2 is oxidised, there is sufficient surface area for gypsum crystal growth to prevent the slurry from becoming significantly supersaturated with calcium sulfate. This significantly reduces the potential for gypsum scaling, a problem
109

that frequently occurs in natural-oxidation FGD systems. Since much of the crystal attrition and secondary nucleation associated with the large centrifugal pumps in conventional FGD systems is also eliminated in the CT-121 design, large, easily dewatered gypsum crystals can be produced.
Flue gas from the boiler passes through the ESP and is pressurised by the Unit 1 ID fan. From the fan, the flue gas enters the gas- cooling section. Here, the flue gas is cooled and saturated with a mixture-'of JBR slurry, makeup water, and pond water. The quench slurry is sprayed into the gas at a liquid-to-gas ratio of about 10 gal/1000 acf at full boiler load using two centrifugal gas cooling pumps. The suction for the gas cooling pumps is located near the bottom of the JBR.
From the gas-cooling section, the flue gas enters the JBR. The JBR is the central feature of the CT-121 process. The gas enters an' enclosed plenum chamber formed by an upper deck plate and a lower deck plate. Sparger tube openings in the lower deck plate force the gas into the slurry contained in the jet bubbling (froth) zone of the JBR vessel. After bubbling through the slurry, the gas flows upward through gas risers which pass through both the lower and upper deck plates. Entrained liquor in the gas disengages in a second plenum above the upper deck plate, and the cleaned gas passes to the mist eliminator.
The slurry in the JBR can be divided into two zones: the jet bubbling or froth zone and the reaction zone. SO2 absorption occurs in the froth zone, while neutraliration, sulfite oxidation, and crystal growth occur in both the froth and reaction zones.
The froth zone is formed when the untreated gas is accelerated through the sparger tubes in the lower deck and bubbled beneath the surface of the slurry at a depth of 6 to 16 inches. The froth zone provides the gas-liquid interfacial area for SO2 mass transfer to
110
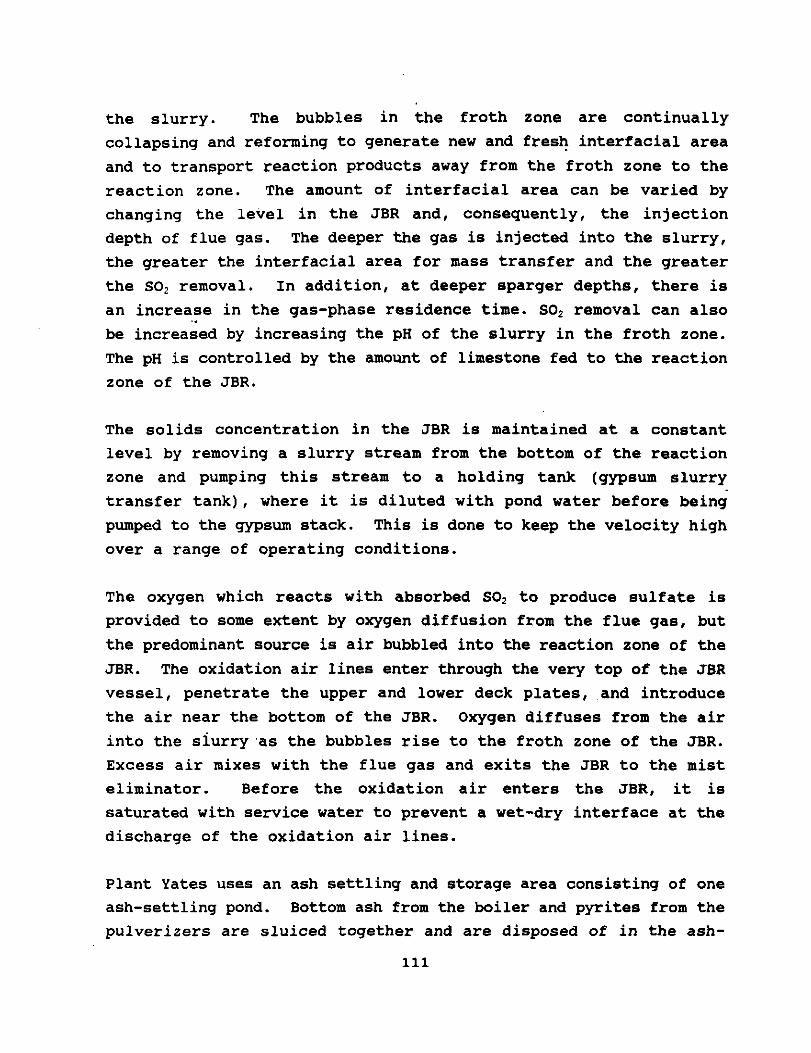
the slurry. The bubbles in the froth zone are continually collapsing and reforming to generate new and fresh interfacial area and to transport reaction products away from the froth zone to the reaction zone. The amount of interfacial area can be varied by changing the level in the JBR and, consequently, the injection depth of flue gas. The deeper the gas is injected into the slurry, the greater the interfacial area for mass transfer and the greater the SO, removal. In addition, at deeper sparger depths, there is an increase in the gas-phase residence time. SO2 removal can also . . be increased by increasing the pH of the slurry in the froth zone. The pH is controlled by the amount of limestone fed to the reaction zone of the JBR.
The solids concentration in the JBR is maintained at a constant level by removing a slurry stream from the bottom of the reaction zone and pumping this stream to a holding tank (gypsum slurry transfer tank), where it is diluted with pond water before being pumped to the gypsum stack. This is done to keep the velocity high over a range of operating conditions.
The oxygen which reacts with absorbed SO 2 to produce sulfate is provided to some extent by oxygen diffusion from the flue gas, but the predominant source is air bubbled into the reaction zone of the JBR. The oxidation air lines enter through the very top of the JBR vessel, penetrate the upper and lower deck plates, ,and introduce the air near the bottom of the JBR. Oxygen diffuses from the air into the siurry'as the bubbles rise to the froth zone of the JBR. Excess air mixes with the flue gas and exits the JBR to the mist eliminator. Before the oxidation air enters the JBR, it is saturated with service water to prevent a wet-dry interface at the discharge of the oxidation air lines.
Plant Yates uses an ash settling and storage area consisting of one ash-settling pond. Bottom ash from the boiler and pyrites from the pulverizers are sluiced together and are disposed of in the ash-
111
settling pond. The ESP ash, economiser ash, and air preheater ash are also sluiced together and disposed of in the same ash-settling pond. Water from the Chattahoochee River is used for cooling water in a once-through type steam condenser.
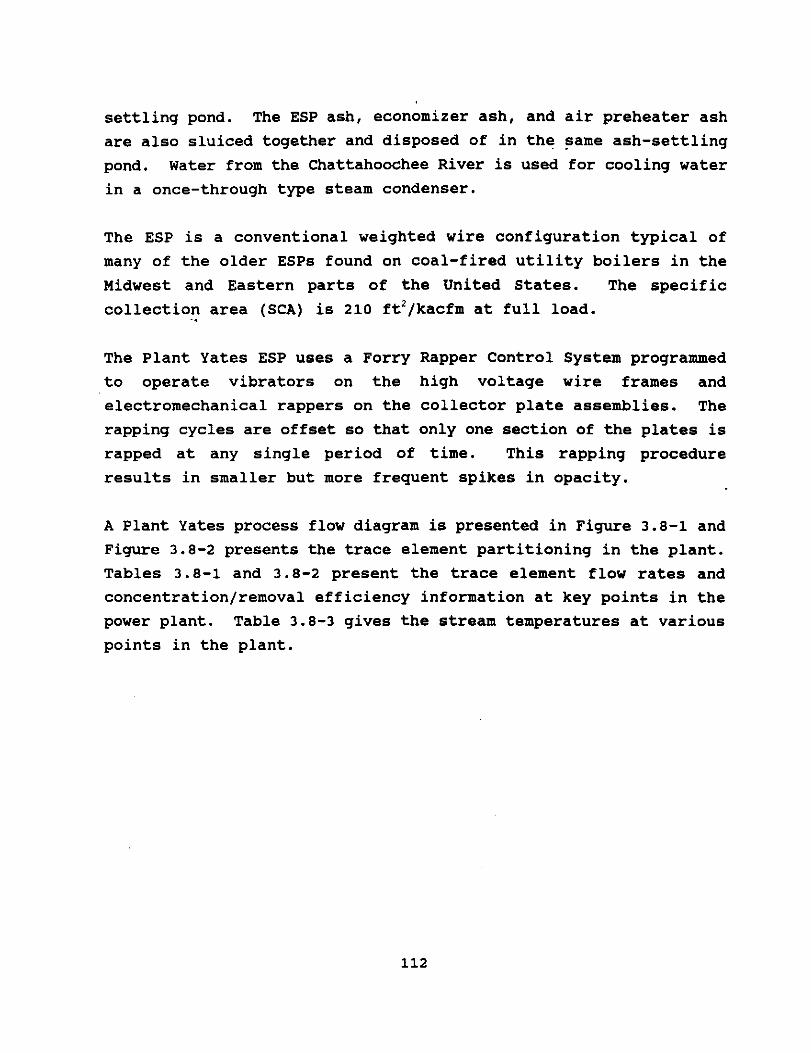
The ESP is a conventional weighted wire configuration typical of many of the older ESPs found on coal-fired utility boilers in the Midwest and Eastern parts of the United States. The specific collection area (SCA) is 210 ft'fkacfm at full load.
The Plant Yates ESP uses a Forry Rapper Control System programmed to operate vibrators on the high voltage wire frames and electromechanical rappers on the collector plate assemblies. The rapping cycles are offset so that only one section of the plates is rapped at any single period of time. This rapping procedure results in smaller but more frequent spikes in opacity.
A Plant Yates process flow diagram is presented in Figure 3.8-l and Figure 3.8-2 presents the trace element partitioning in the plant. Tables 3.8-l and 3.8-2 present the trace element flow rates and concentration/removal efficiency information at key points in the power plant. Table 3.8-3 gives the stream temperatures at various points in the plant.
112
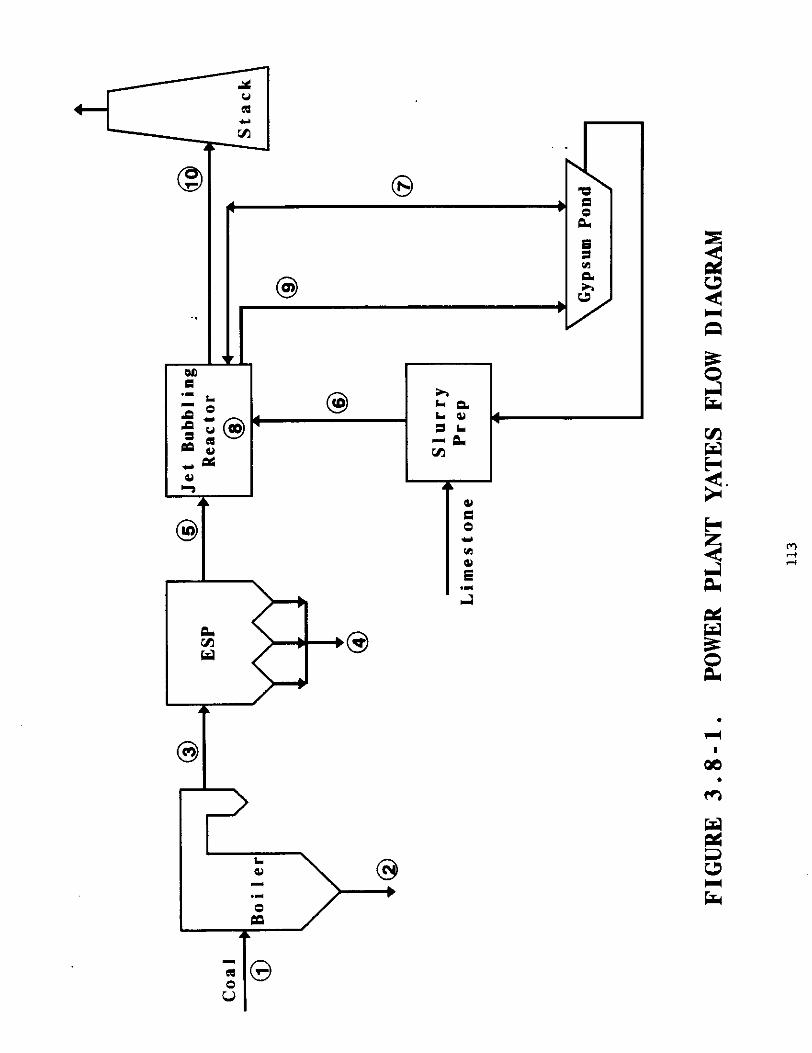
0 4
: ;;, h
.;
j&ij @ ILI
t-l
1k - -a *a m
& I A 0 i
T c) VI ii .- L;1 ä
t

.,, I ,,,
I I
I I I I I I I I

- I

Table 3.8-Z conoentrations an& Remowl Effiaienoie8, Phnt Yates
.
Tablo 3.8-3 stream Temperatures, Plant Yates
Temperature, de? F ESP Inlet ESP Outlet JBR Scrubber Stack
304 f
280 ---
129
116

3.9 BV
The Bailly Generating Station is owned and operated by the Northern Indiana Public Service Company (NIPSCO). The plant is located on the shores of Lake Michigan near Chesterton, Indiana. This project involved the two coal-fired units of the Bailly Generating Station with a combined capacity of 528 MWe; Unit No. 7 has a gross
capacity of 183 MWe and Unit No. 0 has a gross capacity of 345 MWe.
Each unit is equipped with a Babcock & Wilcox cyclone boiler and a steam turbine generator. Both units burn an Illinois/Indiana basin high-sulfur bituminous coal (2.5% to 4.5% sulfur). Unit 7 has four cyclone burners, and Unit 8 has eight cyclone burners. Full load on each unit usually varies by + 3MW. There is no control technology for NO, emissions.
Electrostatic precipitators (ESPs) are used on both units for particulate control. There are two ESPs on Unit 8 and one ESP on Unit 7. The two ESPs of Unit No. 8 are identical to the Unit No. 7 ESP. Each ESP is two shells wide and has 12 electrical fields. In addition, there are three rows of hoppers to collect fly ash from the 12 fields of each ESP. Thus, there are three hoppers in the direction of gas flow along any given lane of the ESP.
Ammonia is injected at a rate to yield 15 ppm concentration prior to the Unit No. 7 ESP and prior to each of the two Unit No. 8 ESPs for the control of SO3 to prevent acid mist emissions. There are separate ammonia injection systems for the two units.
The Bailly Station Unit No. 7 flue gas flows through a single duct into the ESP. The flue gas stream exits the ESP and subsequently connects downstream of the ESP with the flue gas duct from the combined outlets of the two ESPs of Unit No. 8. These two flue gas streams then join to form a single stream.
117

There are various ash disposal systems for Units No. 7 and No. 8 at the Bailly Station. Based on four years of records of waste . disposal from the plant, nominally 63% of the ash in the coal is collected as bottom ash and the remaining 37% is fly ash. Wet bottom ash is transferred to a slag tank where the ash is sluiced to an ash settling pond. The slag tank is dumped every six hours. The water from the settling pond is recycled back for the sluicing of the bottom ash. Economizer ash is not accumulated or evacuated in sufficient quantity or frequency to be considered as a separate waste stream. Makeup water is obtained from on-site facilities. Fly ash from the precipitators from both units is conveyed dry to an ash silo where it is trucked away to a landfill or sold.
Both units use Lake Michigan water as a once-through cooling medium.
Sulfur dioxide in the combined flue gas stream from the two units of the Bailly Generating Station is treated by the Advanced Flue Gas Desulfurization (AFGD) demonstration project managed by Pure Air of Allentown, Pennsylvania, (a joint venture of Air Products, Inc. and Mitsubishi Heavy Industries, Ltd.) under the Department of Energy's Clean Coal Technology program. The scrubber is owned and operated by Pure Air on the Lake. Pure Air's AFGD system is using wet limestone flue gas desulfurization (FGD) technology to achieve a high level of SG, removal (90 to 95+ percent capability) on high sulfur U.S. coals.
A feature of the AFGD process is the purchase and direct injection of powdered limestone in lieu of on-site limestone milling operations. This project includes an in-situ oxidation absorber module that produces high-quality gypsum from a range of high sulfur coals. These features serve to decrease facility size and costs for both installation and operation of the process. Iiigh- quality, by-product gypsum (93+ percent purity) is being produced and sold to a wallboard manufacturer. This by-product utilization
118
eliminates the problem of solid waste disposal and also contributes to the cost-effectiveness of the technology.
The flue gas stream from the AFGD process is vented to the atmosphere through a 480-foot stack.
Figure 3.9-l is a flow diagram of Bailly Station Units 7 and 8. Figure 3.9-2 presents the trace element partitioning. Tables 3.9-l and 3.9-2 comprise the trace element flow rates and . . concentration/removal efficiency results. Table 3.9-3 gives stream temperatures at various points in the plant.
119

& e4 4 .- CW
3
I
b
*
: .m
u3c
Q E 3 0
zc=
I &I. 63 *
2 3 W
c1
E .‘O
*- @ I= .- .- ‘2:
m
t
.
0; . m a @ k

I I 1
* r_
1,
IL
+ ; ;I,. ‘1~
I
0 z
0 00
0 0 2 m v1
crl Inday Jo j:aJad
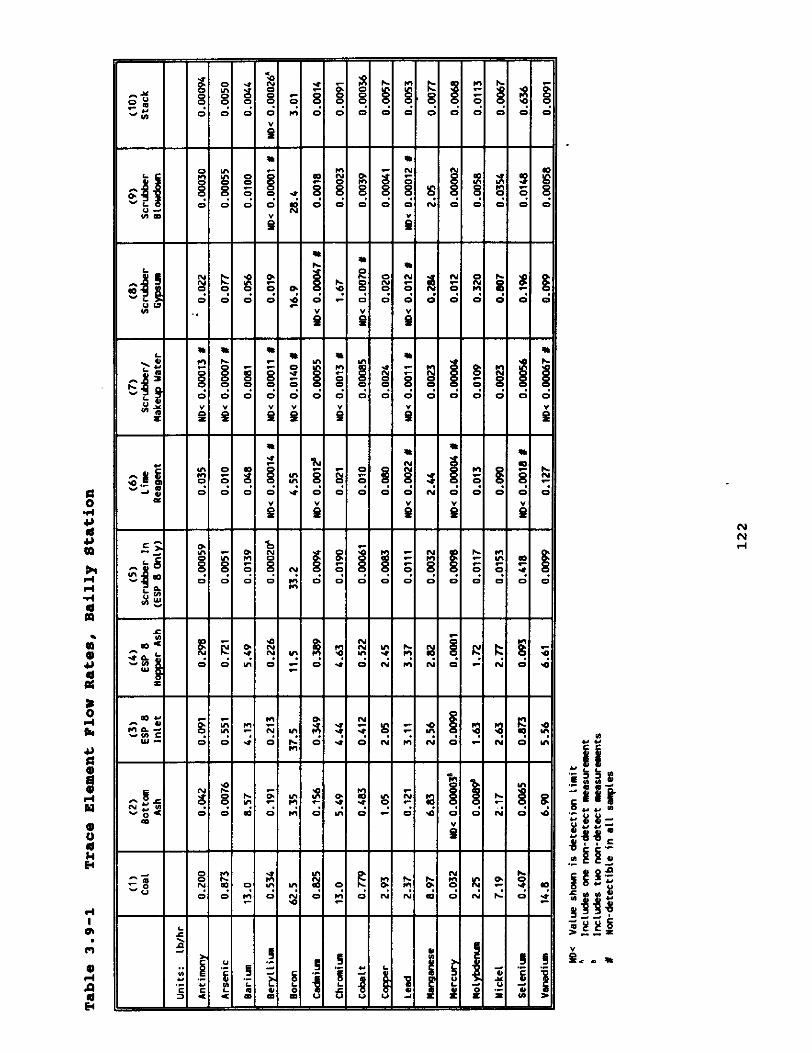
Tab18 3.9-3 Stream Temperatures, Bsilly Station
Temverature, deq F Unit 7
Economizer Inlet Steam, as throttle ESP Outlet
815 655 296
Unit 8 Economizer Inlet Economizer Outlet ESP Outlet
942 613 313
AFGD Inlet
124
The site for this test was Unit 2 of the Nelson Dewey Station, which is owned and operated by Wisconsin Power and Light. This unit is equipped with three cyclone burners and is a forced draft
unit with a nominal capacity of 100 MWe. Ths test unit burns an Indiana bituminous coal.
Environmental controls consist of an ESP for particulate control and a coal-fired reburn system for NO. control. The reburn system was recently retrofitted to this unit and consists of the pulverizer, reburn burners in the upper furnace, overfire air ports, and modifications to the control system. The unit could be operated in either the baseline mode without the reburn burners or in the low-NO, mode with approximately 20 percent of the heat input from the reburn burners. Under low NO, reburn operation, the existing cyclone burners are fired with 70 to 80 percent of the total coal feed as crushed coal. The cyclones are operated at around 110 percent excess air in the main combustion zone. The reburn burners are fired with the remaining 20 to 30 percent of the coal feed as pulverized coal. These reburn burners are operated
fuel rich at a reducing stoichiometry of 0.85 to 0.95. This reducing condition converts the nitrogen oxides formed in the cyclone burners to molecular nitrogen, thereby reducing NO,. The balance of air required to complete combustion is added in the burnout zone above the reburn zone through the use of overfire air ports.
The standard baseline coal which was used throughout the development of the reburn system was a bituminous Indiana Lamar coal with a heating value of about 11,500 Btu/lb, a sulfur level of about 1.6 percent, and ash content of about 9 percent. The plant was converting to subbituminous western coal as the standard fuel
125

after the test. As a result, the remaining supply of Lamar coal was very limited and the plant totally consumed ~the residual Lamar supply during the HAP testing. Some decisions on test priorities, sequencing, and duration of runs were structured around the need to stretch out the coal supply. To conserve coal, the unit was normally operated at low load between tests. During testing, and 2 hours before, the unit was operated at full load. At other times, however, the unit was fired at the lowest practical load to conserve remaining coal and maximize the flexibility for test run times.
Figure 3.10-l shows a schematic flow diagram of the test unit. Figures 3.10-2 and 3.10-3 show trace element partitioning results during baseline operation and during reburn testing. Tables 3.10-l and 3.10-2 present the trace element flow rates during these two periods. Table 3.10-3 gives trace element concentrations and. removal efficiencies for both periods. Table 3.10-4 gives stream temperatures at various points in the plant.
126

0 -L
I I I I I I I I I I I I I I I I I I I
1 I
:I:,‘:: :,I” : I I I 5 I I : : I ::~
I I
a i
=: z 0 0 0 0 VI
m )ndnI- Jo $m.q
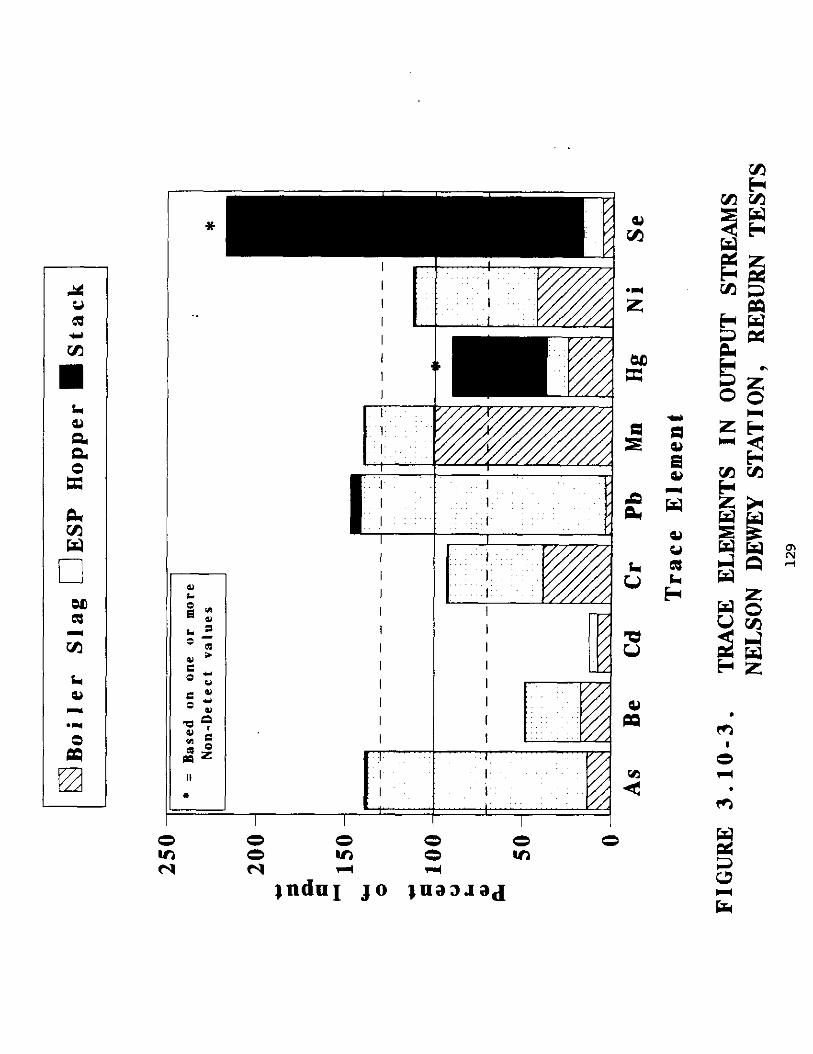
I
I. ~~‘, &Y ,,.,: ~~,,j~, :~I:~,,/;,: ~‘1, fyyy I, ~: 1 1’:” I I I I I I I I I I I
)ndnI JO Jnaa.Iad
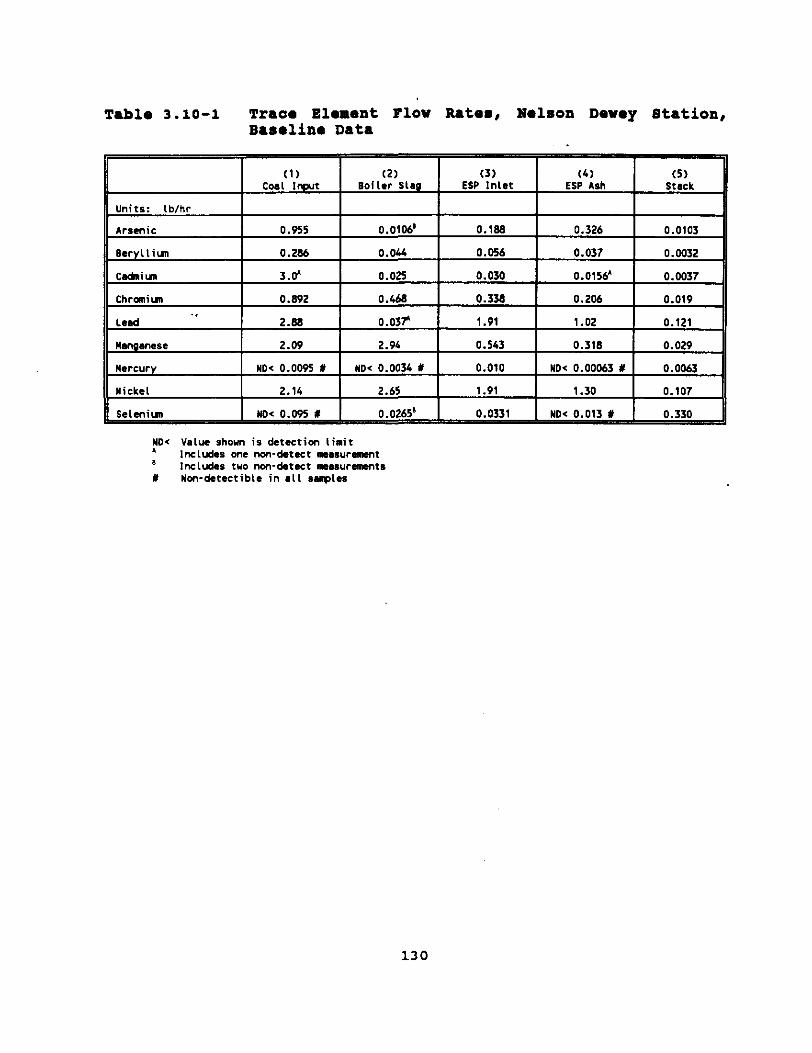
Tablo 3.10-l Traao Element Flow Rata8, Olson Doway Btation, Basolino Data
I NO< 0.0% x I 0.0265 I 0.0331 wo< 0.013 # 0.330
NO< Value shorn is detection limit 1 Incluc!es OM mn-detect me.*"remnt I Includes tw non-&tect m.s"remnts Y Non-detectible in all supples
130

Table 3.10-2 Trace Element Flow Rates, Ralson Dewey Station, Roburn Data
.
NO< Value shorn is detection limit. A IMludcS one mm-detect mcaruremnt II lnclu&s tbm nm-det*ct m.*"relmnts x Non-ddectiblc in all mplcs
131

Tab10 3.10-3 Conaontrations and Ramoval lWfiahnaio8, Nelson Doway Station
Table 3.10-4 Strmm Tampwaturoa, Nelson Dwoy Station
Temperature, deg F
ESP Inlet
Stack
513
I 492
132
3.11 Plant
The unit tested, Plant Hammond, has a generating capacity of
approximately 500 MWe. The opposed wall-fired, subcritical boiler
was designed by Foster Wheeler. A partial vertical dividing plate
within the furnace creates two combustion zones, and very little
mixing of the flue gas occurs between the A and B sides.
The plant burns a combination of bituminous coals that have a
typical sulfur content of 1.6% and a typical ash content of 10%. Bottom ash is removed from the boiler by an ash sluicing system. Electrostatic precipitators (ESPs) remove fly ash from the flue
gases. The flue gas treatment and ash removal facilities are
described in greater detail below.
The flue gas exiting each side of the furnace flows into a separate duct, designated the A or B side. Two ESPs, one each for the A and B sides, remove particulate matter from the flue gas. The unit is equipped with a conditioning system capable of injecting SO, or NH3
into the flue gas upstream of the ESPs to improve ESP performance.
The conditioning system was not in use during the Over-Fire Air
(OFA) testing. During the Over-Fire Air/Low NO, Burner (OFA/LNB)
test, NH, was injected at a rate of approximately 25'scfm, which is
equivalent to a concentration of about 20 ppmv in the flue gas entering the ESPs. The NH, injection was used because of plant concerns about complying with particulate matter emission limits.
Dry ash collected in the economiser and ESP hoppers is pneumatically transported to a tank where it is mixed with water
and sluiced to a settling pond. Bottom ash from the boiler is sluiced to a separate settling pond. The water used for ash
sluicing is recycled water from the settling ponds.
133

Overfire air ports were installed during a four-week outage in the
spring of 1990 by Foster Wheeler Energy Corporation (FWEC). The
design includes four overfire air ports on each side of the boiler
directly above the top row of burners. Overfire air is diverted
from the secondary air ductwork. At full load, approximately 20% of the secondary air is introduced through the overfire air ports.
The low-NO, burners were installed during a seven-week outage in
the spring of 1991. The FWEC burners are of the controlled . . flow/split flame (CFSF) design. The 24 burners are arranged on
opposing walls, with three rows of four burners on each wall. The low-NO, burners replaced the previous pre-NSPS Intervane burners
that were in place during the OFA test.
The Plant Hammond flow diagram is shown in Figure 3.11-1.
Partitioning results for the two test periods are given in
Figure 3.11-2 and 3.11-3. Tables 3.11-1 and 3.11-2 present trace‘
element flow rates for both (overfire air and low-NO, burner) test
periods. Table 3.11-3 shows trace element concentrations and removal efficiency data for both test periods. Table 3.11-4 gives stream temperatures at various points in the plant.
134
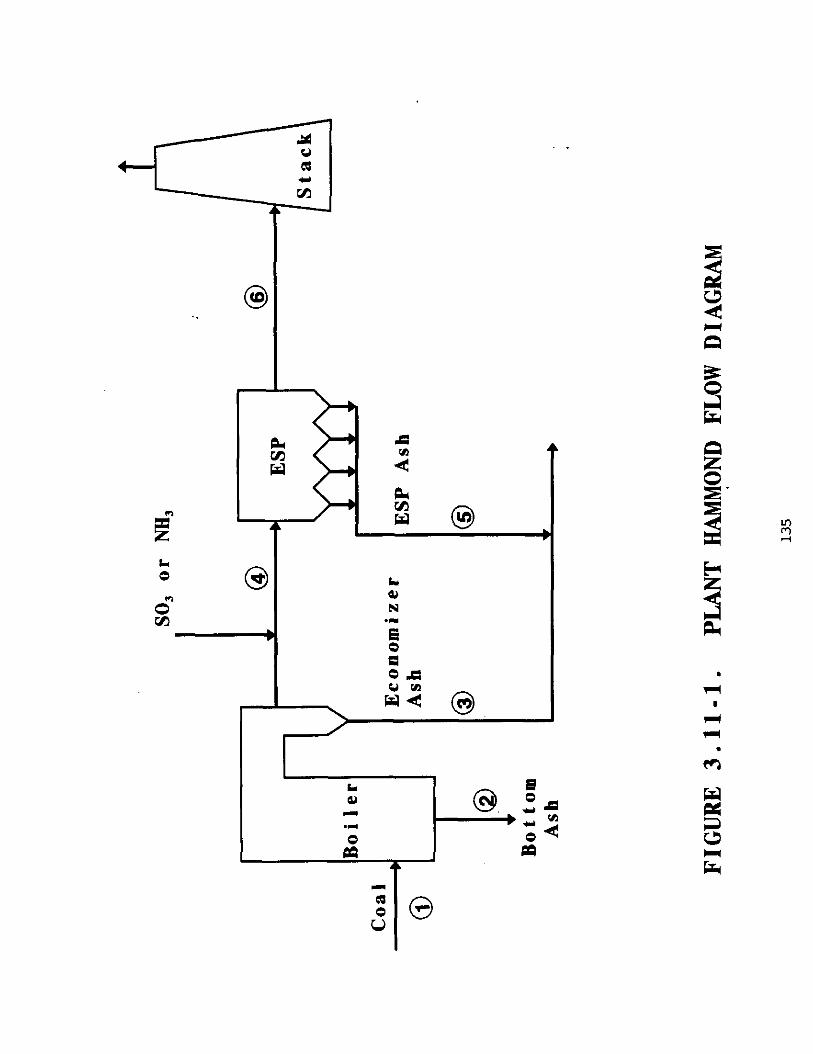
ba w N
.I
s CI OA
/1\
.
‘,, ~~:‘~~,Y, rn I I
I
I I I
0
z 00 z z z:
0
c-3
IndnTJo )za.Iad
I I I
I
I I I I I I I I I I I I I I I I I I I I I I I I I I I I I I I I
)ndnI JO JnaaJad

Tab18 3.11-1 Tram Element Flow Ratss, Plant Bamond, Over-Firs Air Tssts
NO< Value show! is detection limit A IncltiS OM nml-&tcct r*s”rrrnt a IncluC!es tw ncn-dot*ct me.sw9imnt* ' Non-dctcctible in all but one snple I Non-detcctible in all SWI+CS
138

Tab18 3.11-2 Traos Elsment Flow Ratsa, Plant Hammond, Low-NO,, Burnsr Tssts
.
ND< Value shwn is &action limit A Include, ow nm-ktect nua*uramt
Includes two !wn-&tut me.*wmEnts x Non-dctecctible in all saples
139

Tab18 3.11-3 Conasntrations and Runoval Effiaionciss, Plant Hammond
NC = Not Calculatd.
Tab18 3.11-4 Strsam Tamperaturss, Plant Hammond
140

n 3.12 Plant
. * Des-
There are two units at Plant Smith. Unit 1 is rated at 175 WWe and
Unit 2, the test unit, at 196 WWe. Both units have tangentially-
fired boilers. Originally, both units were equipped with cold-side
ESPs; in 1977, however, when the units were converted to balanced
draft operation, both units were also retrofitted with hot-side
ESPS. Both units continue to operate with a hot-side and a cold-
side ESP in tandem. Flue gas leaving the two cold-side ESPs is
vented to the atmosphere through a common stack.
Over the years, the fuel supply at the test site has varied. About 10 years ago, for example, a low-sulfur coal from South Africa was
employed. During the past year or longer, on the other hand, coals
from Southern Illinois and Western Kentucky containing about 3%'
sulfur have been used as the fuel. A 3% sulfur Western Kentucky coal, purchased on the spot market was burned during both of the
test occasions described in this report. There is no provision at the test site for the removal of sulfur from the flue gas in a
scrubber of any type; however, a portion of the sulfur present in
the coal as pyrite is removed during the pulverization process
prior to combustion and is discharged as a waste stream.
During the first half of 1991, the furnace of Unit 2 began to
undergo modification with the installation of low NO. burners. This report includes the measurement of rates of toxic organic and
inorganic substances in the flue gas both before and after the
burner modifications were made. The measurements prior to the
final adoption of modified combustion conditions were conducted
during the period September 17-22, 1991; however, the baseline study was performed after certain structural changes in the furnace
had been completed. The subsequent measurements with burner
141

modifications in place were made during the period January 14-17, 1992.
Figure 3.12-1 shows the flow arrangement for Plant Smith. Figures 3.12-2 and 3.12-3 give partitioning results for baseline and Low- NO, test periods. Trace element flow rates are given for both periods in Tables 3.12-l and 3.12-2. Table 3.12-3 gives concentrations and removal efficiencies for trace elements during both periods. Table 3.12-4 gives stream temperatures at various points in'the plant.
142

J I I I I I I I
IndnI JO )naaJad

I ‘+ I
k-, ,/, ,i,i,:, .., ,:r. iJER
/! / I!!!!!!! !I!!!! !!!!!!!I! !Tm:V//
I I I I I I * I
I I
I I


4 a

Tablo 3.12-3 coaaaatr~tioas and Removal Effiaioaaios, Plant Smith
Antiman
k Arsenic
Barium
Bcr LLim
cacknim
ESP E#P B9selin ESP Inlet, out1*t, RIDVl I 1nht.
ro/wn? AwIn? Efficiency,
Percmt rwid
128 ~0‘ 24.8 x l 91.0 29a
195 1.82 Pp.1 aa.
2,lOfl 5.60 W.6 7.220
60.7 YOS 1.35 Y a 9a.a 62.4
WCx Yhbz shorn is detectim limit. x Of the calculations ccmritutiw to the wer999 vdue rhom, 9LL include I nm-detect n*wuremmt.
Table 3.12-4 Stream Tomperaturos, Plant Smith
148

3.13 R.E. Burm .
Testing was performed on Boiler #8 of Ohio Edison's R.E. Burger Station located in Dilles Bottom, Ohio, and having a gross generating capacity of 160 MWe. The boiler was designed by Babcock and Wilcox and has been in operation since 1955. Testing was conducted during April and May of 1993. The boiler is wall-fired and burns a medium sulfur (3.5%) bituminous coal from Ohio. The coal burned during the test period averaged about 2% moisture and 12% ash.
Bottom ash is removed from the boiler by an ash sluicing system, and fly ash is removed by a cold-side electrostatic precipitator (ESP) with a design efficiency of 99.35%. Flue gas exiting the ESP is discharged through the stack.
The SNRBTM process was on site as part of a test program being‘ performed by Babcock and Wilcox (B&W) under DOE's Innovative Clean Coal Technology Program. The SNRBTM unit draws a 5-MW (equivalent) slipstream from the boiler. This corresponds to approximately 2% of the total flue gas. The SNRBrr' process removes particulates, nitrogen oxides (NO,), and sulfur oxides (SO,) from the flue gas. The flue gas exiting the SNRB" process is then rejoined with flue gas exiting the boiler prior to entering the ESP.
In this process, both dry sorbent (lime) and ammonia are injected upstream of a fabric filter (baghouse). A catalyst for the selective catalytic reduction (SCR) of NO. is mounted inside the filter bags, providing for the destruction of NO, as the flue gas/ammonia mixture passes over the catalyst. Sulfur oxides are adsorbed by the sorbent both in the flue gas duct and on the filter bags in the baghouse. Because the NO, and SO, removal processes require operation at elevated temperature (550-900°F), special high temperature fabric filter bags are used.
149
The baghouse consists of six individual modules each containing 42 bag/catalyst assemblies. The baghouse is designed to handle about 48,000 ft'/min (actual) of flue gas. Flue gas heaters are located at the inlet and outlet of the baghouse to simulate the economiser and the air heater sections, respectively.
Figure 3.13-1 is a process flow diagram of the site while Figure 3.13-2 gives information on trace element partitioning. Tables 3.13-1 and 3.13-2 present trace element flow rates and . . concentration/removal efficiency data respectively Table 3.13-3 gives stream temperatures at various points in the plant.
150

0 .-
t

I
:
I I I I
I I I .I I z I
k I 2
%
e
*
z 0 m
N
Indny Jo

Tab10 3.13-2 Coaaoatratioas and Romaval Effiaiaaaios, R.E. Burgor Station
MD< VaLue shown is datectim limit. * Of the calculations contrikuti~ to the average value show, aLI ifbzlti e nm-detect mmsuremmt.
Tabla 3.13-3 Stream Tamporatures, R.E. Burger Station
Temperatura, deg F SNRB Inlet Baghouse Inlet
639 865
II SNRB Outlet I 793 I II ESP Inlet I 317 I
154

3.14 Ara.p&oeSt&j.DD
. * Des-
The Public Service of Colorado's Arapahoe Station was used for this test. The boiler for the test unit is a 115 MWe, roof-fired boiler that was fired on a western bituminous coal during the test period. This particular boiler is also capable of burning natural gas.
. . Low NO, burners and overfire air ports have been installed for NO, control. The test unit is also equipped with a selective non- catalytic reduction (SNCR) unit that utilizes a urea injection system. The SNCR unit was operated during one phase of the test program. Particulate removal is accomplished with a fabric filter dust collector (FFDC) having an air-to-cloth ratio of 2. The design of the FFDC calls for particulate removal down to 0.007 grains/dry standard cubic foot. No SO2 removal system was used‘ during the test period, although this unit will use sorbent injection upstream of the FFDC in the future.
Bottom ash consists of the larger ash particles, including those removed from the boiler surfaces during soot blowing. The bottom ash is discharged to a hopper from which it is sluiced into the ash pit water box and grinder. From there it is transported to the settling pond. Solids are periodically removed from the settling pond and transported off-site for disposal. Fly ash is discharged into a series of hoppers and is then pneumatically conveyed to a flyash silo. It is then transported off-site for disposal.
A schematic flow diagram is presented in Figure 3.14-1. Figures 3.14-2 and 3.14-3 present partitioning results for the trace elements during these same periods.. Tables 3.14-1 and 3.14-2 present trace element flow rates results during baseline operation and SNCR testing, respectively. Table 3.14-3 gives trace element
155

concentrations and removal efficiencies during both periods. Temperature data was not available at this planet,
. .
156

I I I I I I I I I I:,
,,, ,,,,Yp ‘: .,, I
I I I I I I I I I I I I I I I
l-l-i-
z 0000000
zLaOGQ\Od~ r( r( d 7-t
qndn1 JO qnaa.Iad

-
/I I I
I I I
YI
;F
I I I
I I I I I I I 6
: : : :::,L”‘~ z
cz
ii
<
0 00 z s z z z z
0 0 s N
rl rl r4 rl rl
JndnI JO Jnaa.Iad

Tab10 3.14-l Trmao Element PlOW Rates, Arapahoo station, (Basolina)
ND< Value sham is detection Limit li Includes one non-detect m.*w-t
Includes- two ncwdetut m.sur-t* x Non-detectibla in dl sulplas
160

Tab10 3.14-2 Tram Element Blow Ratam Arapahoo Station, (8NcR)
ND< Value shorn is detection Lillt A lncludas one non-detut m.surcmmt 8 Includes tua non-&tut I*.s”mmntl Y Won-detectible in 111 mpler
161
Tab10 3.14-3 Conaantrationr and Ramoval Efficimnoias, A.rapahoa station
NW VaIm shown is detection Limit. t Of the cslculatiwa cmtributinp to the wwnsa valu shon, all in&da a wv&tect m~~ur-t.
162

PFBC Demonstration .
The TIDD PFBC demonstration, located in Brilliant, Ohio, is operated by Ohio Power Company, a subsidiary of American Electric Power (AEP). The boiler at the TIDD site is a bubbling-bed, pressurized fluidized bed combustor (PFBC) rated at 70 MWe full load. Total plant load during the test period was 45 to 46 MW; 37 MW was produced by a steam turbine generator and 0 MW was produced by depressurizing the hot flue gases through a gas turbine genera- tor. The process operating conditions for the unit were selected by AEP and represent typical long-term operating conditions for the process.
Crushed coal (Pittsburgh No. 8, bituminous) is combined with water from a nearby river to produce a coal paste which was approximately‘ 25 weight percent moisture. The paste is fed to the combustion chambers along with crushed dolomite. The material is fluidized by high velocity combustion air in the water-cooled boiler. Mean bed temperatures in the combustion chambers were controlled at approximately 1500’F during the test period. As the coal is combusted, the calcium carbonate in the dolomite or limestone is calcined to form quicklime which then reacts with the SO2 and oxygen in the combustion gases to form solid calcium sulfate. This reaction removes SO2 from the combustion gases, thus controlling SO2 emissions. Test data from this program show approximately 902 removal of sulfur dioxide in the combustor. Formation of. nitrogen oxides (NO,) is minimized because of the relatively low combustion temperature of the PFBC process.
After releasing heat to the in-bed, water-cooled boiler tubes, the particulate-laden combustion gases flow into seven parallel, two- step cyclones. These cyclones remove approximately 932 of the entrained solids (primarily sulfated lime, unreacted lime, ash, and
163

unburned carbon) from the gases. The combustion gases then flow to the gas turbine where they are expanded and then.exit through the turbine exhaust gas economizer. Final particulate removal from the gases is achieved in an electrostatic precipitator (ESP) before the gases are released to the atmosphere.
Bed ash, which comprises about 45% of the total ash produced, is periodicall,y removed from the bottom of the combustor through a lock hopper system. Solids collected by the primary cyclone are . . transported to a storage silo. Secondary cyclone solids are combined with the material collected in the ESP. All solids are transported by truck off site for disposal.
A research feature of the TIDD facility is a demonstration-scale hot gas cleanup (HGCU) system. Treated gas from one of the seven cyclone systems (approximately one-seventh of the total gas flow from the combustor) is diverted to a ceramic barrier, advanced' particle filter (APF) and back-up cyclone, and directed back to the outlet header of the secondary cyclones. The APF uses silicon carbide candles in a cluster/plenum arrangement developed by Westinghouse Corporation to filter the gas. Tempering air was added to the system during the test period to control ash bridging within the APF system, reducing the APF inlet gas temperature from 1500'F to approximately 13509. Entrained solids removed in the APF system are collected and transported by truck off site for disposal.
Figure 3.15-l shows a simple schematic of the unit. Figure 3.15-2 shows trace element partitioning results. Table 3.15-l and 3.15-2 present the trace element flow rates and concentration/removal efficiency results. Table 3.15-3 gives stream temperatures at various points in the plant.
164
n-l:, n 2 ii&
W
.c
2 F 9 b
.a 4 m a?
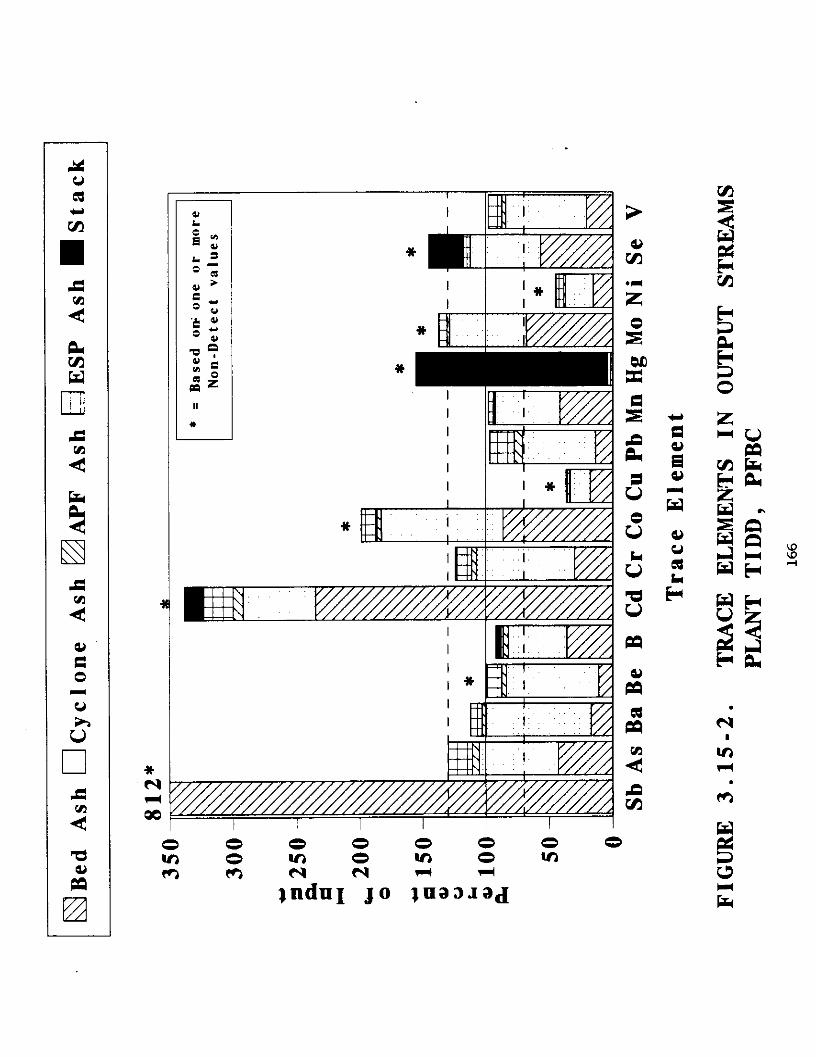
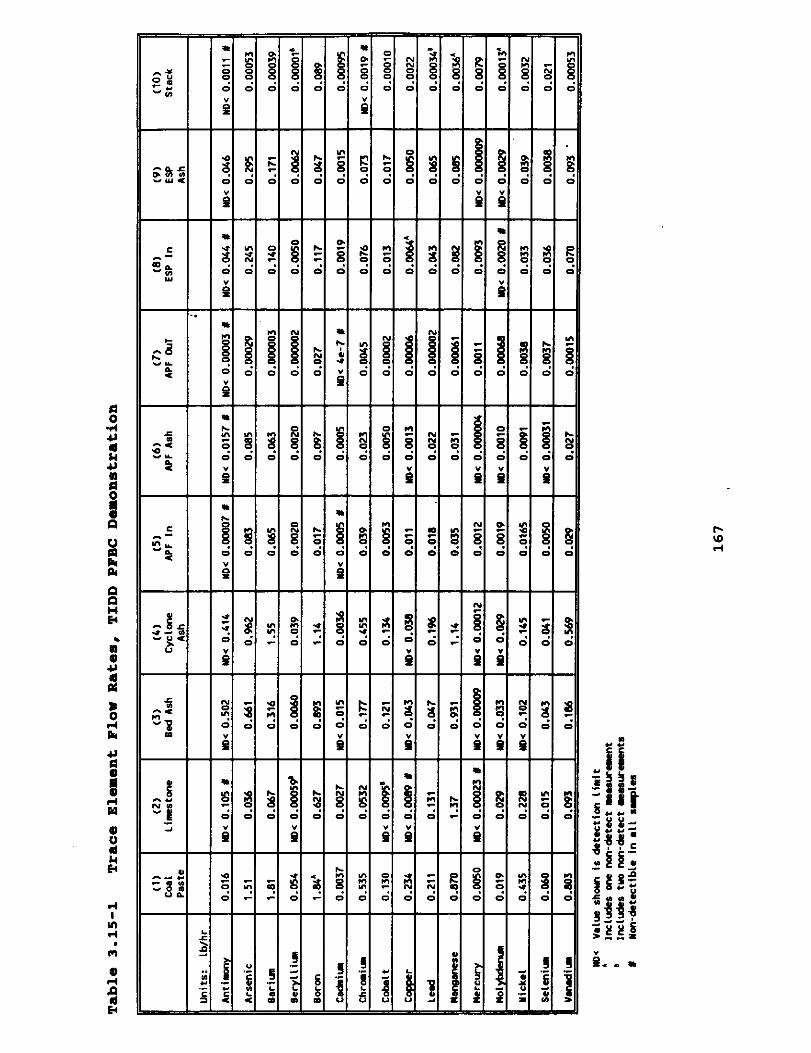
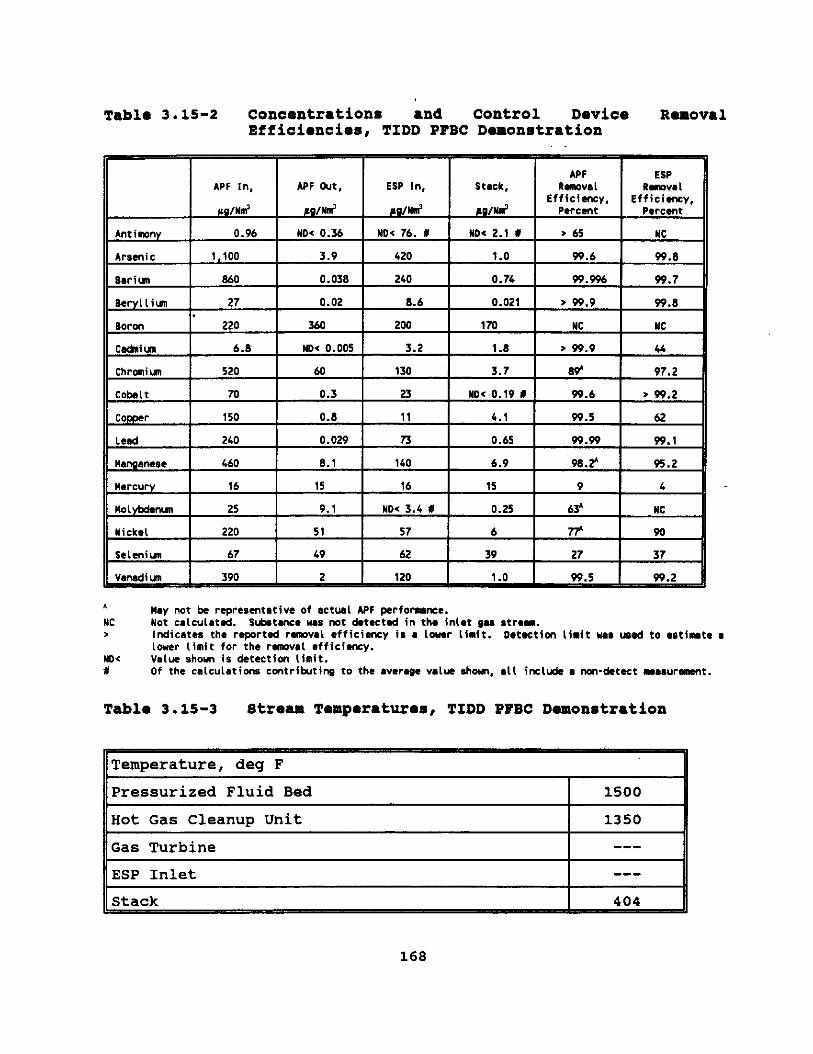
Table 3.15-2 Concontrationt3 and Control Device Removal Effiaioncios, TIDD PPBC Demonstration
A M*y ~)t be represmtative of actual WF perforunce. NC Not calculated. Stitance ws rat detect4 in the inlet gu str.m. > Indicates the reported ramoval cfficimcy is I lowar limit. Datrtlm Limit ws wad to estimate I
Lower limit for the r*nval mfficimcy. WDS value sham is detection limit. ii Of the calculaticrm cmtributing to the average value shon, all include l t-m-detect rasurmmt.
Tab10 3.15-3 Stream Temperatures, TIDD PBBC Damonstration
Temperature, deg F Pressurized Fluid Bed I 1500 I
II Hot Gas Cleanup Unit I 1350 I II Gas Turbine I --- II
ESP Inlet
168

3.16
A flexible pilot plant was COnStNCtSd at TVA's National Center for Emissions Research to demonstrate the AirPol Gas Suspension Absorption (GSA) process. Flue gas for the pilot plant is drawn from a pulverized coal-fired boiler at the TVA's Shawnee Power Plant. A. 9.43 Nm3/sec (21,463 scfm) slipstream of flue gas from the boiler (approximately 10 MWe equivalent) is taken downstream of a mechanical particulate collector. The slipstream passes through a cross-flow preheater to allow control over the flue gas temperature at the demonstration plant inlet. Fly ash removed in the mechanical collector is reinjected into the demonstration plant to simulate various inlet particulate loadings.
The main components of the GSA pilot plant are the following:
. Slurry preparation system;
. Reactor;
. Cyclone separator;
. Electrostatic precipitator;
. Pulse-jet baghouse.
The lime slurry is prepared from hydrated lime in a batch mixer and pumped to a storage tank. The slurry is pumped from the storage tank to the'GSA reactor, where it is injected upward through a two- fluid atomizer near the bottom of the reactor. The quantity of lime used is based on the SO2 content of the flue gas and the amount of SO? removal required. Trim water is added to cool the gas to the design temperature of approximately 62 to 60'C (145- 155°F).
The SO,-laden flue gas from the preheater enters the bottom of the GSA reactor and flows upward. Most of the water in lime slurry
169
droplets, heated by the flue gas, evaporates in the reactor, decreasing the gas temperature and leaving semi-dry solids. At a gas temperature close to the adiabatic saturation temperature, SO? (and to a lesser extent HCl and SO,) is absorbed by the lime. The resulting solids and unreacted lime are entrained in the flue gas along with the fly ash from the boiler. The flue gas passes up through the reactor and exits at the top into a cyclone-type mechanical collector. The cyclone removes most of the particles from the flue gas (90+ percent), and nearly all of these solids are recycled to the reactor via a screw conveyor, thereby increasing lime utilization. The remaining solids are discharged in the form of a dry by-product. The absorption reactions are thought to take place primarily in the thin layer of fresh lime slurry coating the dry recycle solids; thus the surface area added by the recycled fly ash enhances both the SO2 removal and the drying process in the reactor. The system is relatively forgiving to atomiser problems (e.g., Ww3aget erosion) since SO2 removal continues to occur via the recycled solids for short periods of time even when the atomizer is removed for maintenance. The high concentration of solids (approximately 200-800 grainsfscf) is thought to simultaneously clean the inner surface of the reactor.
The flue gas from the cyclone flows to an electrostatic precipitator for final particulate removal. The solids collected in the ESP are conveyed mechanically to a waste silo. In addition, a slipstream (approximately 1 MWe equivalent or approximately 10%) of the flue gas from the main GSA/ESP plant may be removed from the ESP inlet or outlet, passed through a pulsed-jet baghouse, and returned to the main plant ductwork downstream of the ESP. The baghouse has a nominal air-to-cloth ratio of 4.0 acfm/ft2 and the bags are cleaned by a low-pressure, high-volume, ambient air stream delivered by a rotating manifold. The solids collected in the baghouse are conveyed pneumatically to the waste silo. The treated flue gas is passed to an induced draft fan, reheated, and discharged to the atmosphere through a stack.
170
Tests were run during four periods:
. Baseline tests (no sorbent) - ESP/baghouse in series
. Demonstration test9 - ESP/baghouse in series
. Baseline tests - ESP/baghouse in parallel
. Demonstration tests - ESP/baghouse in parallel
Two slightly different modes of operation were employed during demonstration tests. During the series configuration demonstration tests, the input calcium-to-sulfur ratio (Ca/S) was held constant at 1.4 and the SO2 removal was allowed to vary. During the parallel configuration demonstration tests, Ca/S was varied to maintain overall SO2 removal constant at approximately 90 percent. The target approach to saturation temperature was 6.7'C (12OF) for both demonstration test configurations.
Figure 3.16-1 shows the flow diagram for the GSA System and Figures 3.16-2 through 3.16-5 show partitioning results for the four periods described previously. Tables 3.16-1 through 3.16-4 show trace elements flow rates for the four periods. Tables 3.16-5 and 3.16-6 present concentration and removal efficiency data for trace elements during these periods. Table 3.16-7 gives stream temperatures at various points in the plant.
171

*
0 t
.- * eu dQ) c- u-
am
G:: P,,
0m tr .I
P
’ 0
* A. Ial IeJgd

- t
~I ~,‘,‘,~
I I
* 0
z N
* [ t. ,I ,~, ,,
I

l
-
c
T

Tablo 3.16-1 Trace Element Flow Ratos, AirPol MA, Bhawnoo Power Plant, 8oriee Configuration, Basolino Tosta
Vat-dim I 0.015 I 0.07.0 I 0.016 I 0.067 w
fo< vahe shorn is detection limit Inckies on mn-detect me.surant
B ,K,udes tw nm-detest m.s"remmt* c *nclde* five nm-detect mar3UremmtO (parall*l Sm@ing Of tW SW*-) x Won-detectible in aLI surples
Table 3.16-1 Traoa Element Flow Rates, AirPol WA, Bhawnoo Power Plant, &aria8 Configuration, Bafmline Tests, (ContinuwI)
.
No< Valw show? is detection Limit A InsludeS OM non-detect me~suramnt I includes twa nwvdetecr ma.surnmts L lnchdes five non-detect me*surement* (parallel rmplina of two str*am) Y Won-detectible in aLk svrplcs
178

Tablo 3.16-2 Traca Elamont Flow Bates, AirPol MA, Bhawnoo Power Plant, series Configuration, Demonstration Testa
.
(1) Reinjccted
Fly Ash
(2) GSA Slip
str.ml
(10 Li=
SlWry
(12) Trim
uatw
(41 ESP In
(3) CySlOn SOlid
1
U0e Value shown is detection limit Includ2S me ml-l-detect me.nuremnt
I includes tna nm-detect me.*uremntr c includes five non-detect maruraats (pdnlld 9nplinp of two str*m) x Non-detectible in ail rq~las
179

Tablo 3.16-2 Traae Element Flow Rates, AirPol WA, Bhawneo Powar Plant, 8orimI Configuration, Demonstration Tests, (oontinued)
(61 ESP Ash
(71 Eaghousc
I"
(61 swhame
Ash
(91 Baghcue
out
(101 Stack
No< value shorn is &tectiw! limit A ,ncldes menon-detectm.s"relnmt B ,nc,t&* tw nm-detect m.,"mmnts
includes five non-detect mm*urmmnts (parall*l smplin9 Of tYO Streml Y Won-detectible in all saples
180

Tablo 3.16-3 Trace Elamont Flow Rates, AirPol WA, Bhawmo Powor Plant Parallel Configuration, Basolino To8ta
(1) (21 Reinjested 0SA SLip
Fly Ash str*am
(31 cycton Solids
(41 ESP In
(51 ESP
mtt*t
NW Value shown is detection limit L Includra OM non-detect ml?.rureamt 8 Includes two nm-dctCCt n.*ureannts
Inhsles five non-detect nssuramnts (par*llel snplinp of tna *we-> x Non-detectible in all snplcs ",A Mot ArdYZed
181
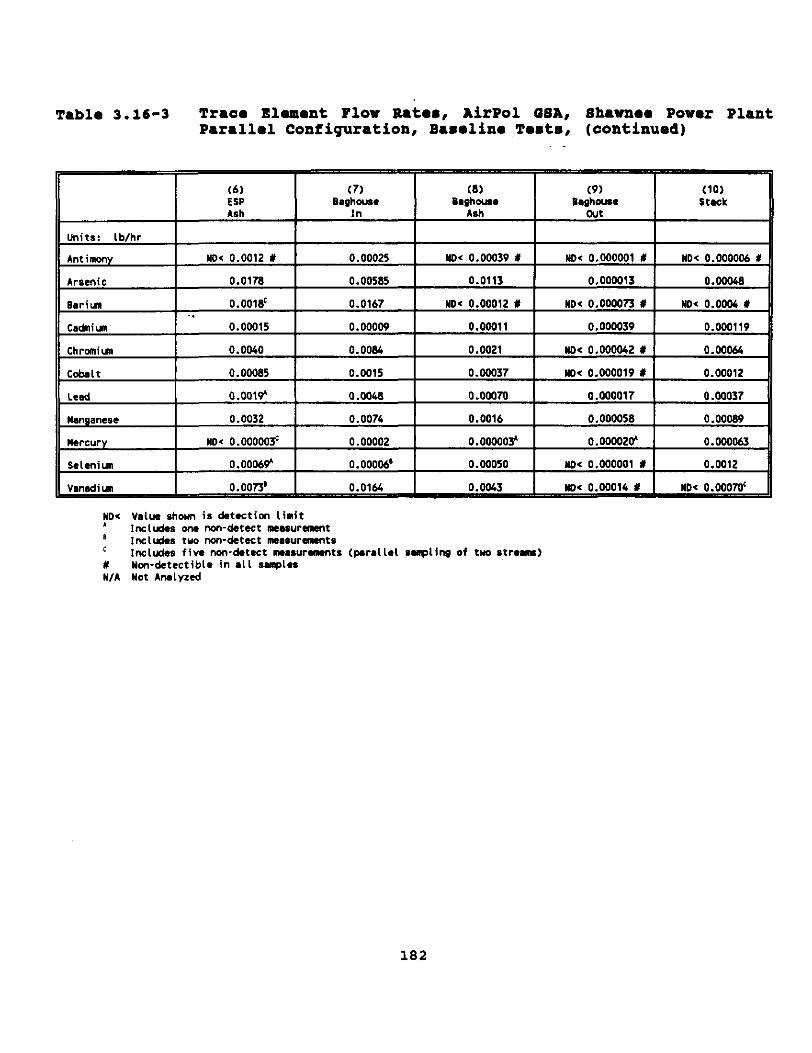
Tablo 3.16-3 Trace Element Flow Rataa, AirPol MA, Bhawnaa Powar Plant Parallol Configuration, Bamlino Tub, (oontinued)
foe valw shorn is detection limit ,KludeS OM mn-detect me.*urant
1 ,mzlti* tw non-detect m.s”ramnts L Includes fiv* man-detect m*surannts (pwallcl suplinp of two str*ml x Non-cktectible in all smples WA Not *ntyzed
162

Table 3.16-4 Trace Element Flow Rates, AirPol QBA, Bhawnoo Power Plant Parallol Configuration, Duaonstration Tests
MO< Value shown is detutim limit A Includes OM nm-detect mms”relwnt B ,nc,ude* WO non-dotut I*.surn*nt.
Includes five non-detect masurammts (paralI*I sllplicg of tw strsaw) x Ym-detectible in all sapln “,A Not Anslyred
183

Table 3.16-4 Traoa Elommt Flow Ratoa, AirPOl QBA, Bhawnoo Powor Plant Parallml Configuration, Demonstration Tmts, (continued)
to< value shorn is detection Limit Includes Me Cal-detect ve.sw-t
B InclKks tw nm-detect Il*.*wealmts c Includes five rem-drt*ct measurements (pr~lI*l sulplinp of tuo 6tr.m) # Non-detactiblc in aLl smplcs WA Yet A~lyzed
(101 Stack
No< 0.000006 1
0.0011'
o.oow
o.owofl
0.W16c
0.000371
O.WlO
0.0021
O.WOll
no‘ 0.000005 t
0.0035~
184
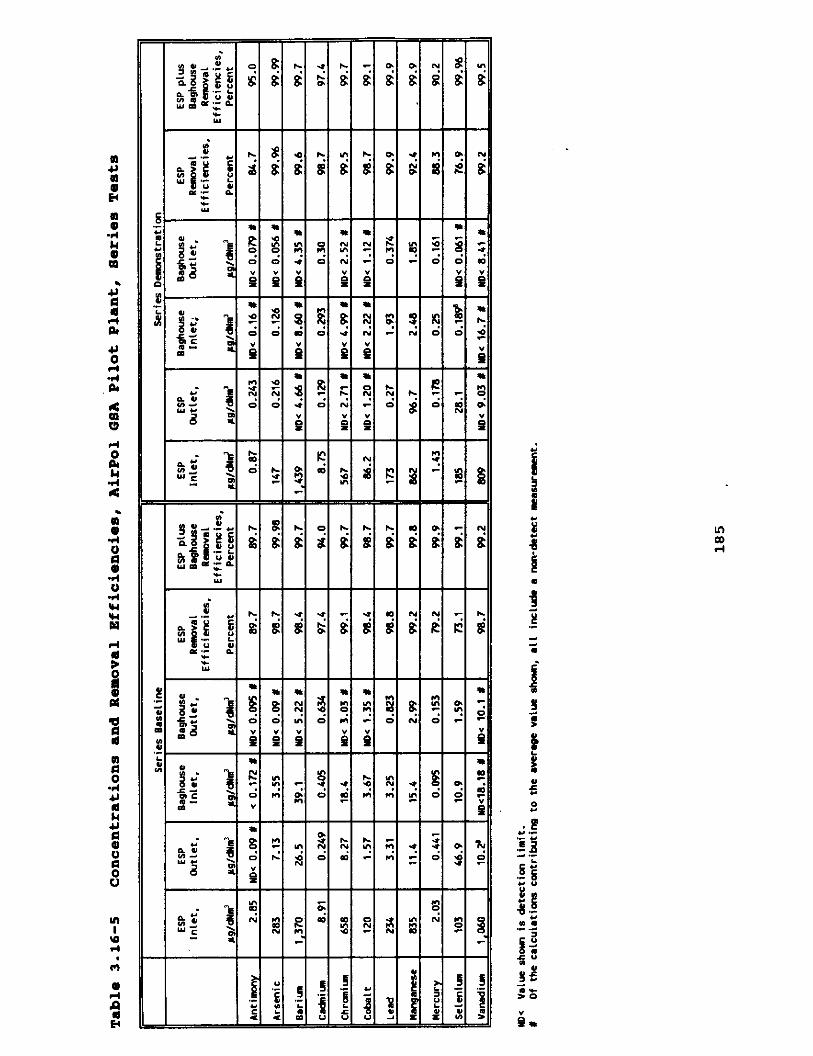
-
i- $ a 1 c- %
e : i a I ; x
-


Tab10 3.16-7 BtraaIn Temperatures, AirPol GBA Bystom
187
SECTION 4.0 MERCURY SPECIATION
The following three tables summarize the test results for mercury
speciation at the test facilities described in Section 3.0 of this
report. Efforts are continuing to validate a method to quantitatively speciate mercury forms.
. .
188
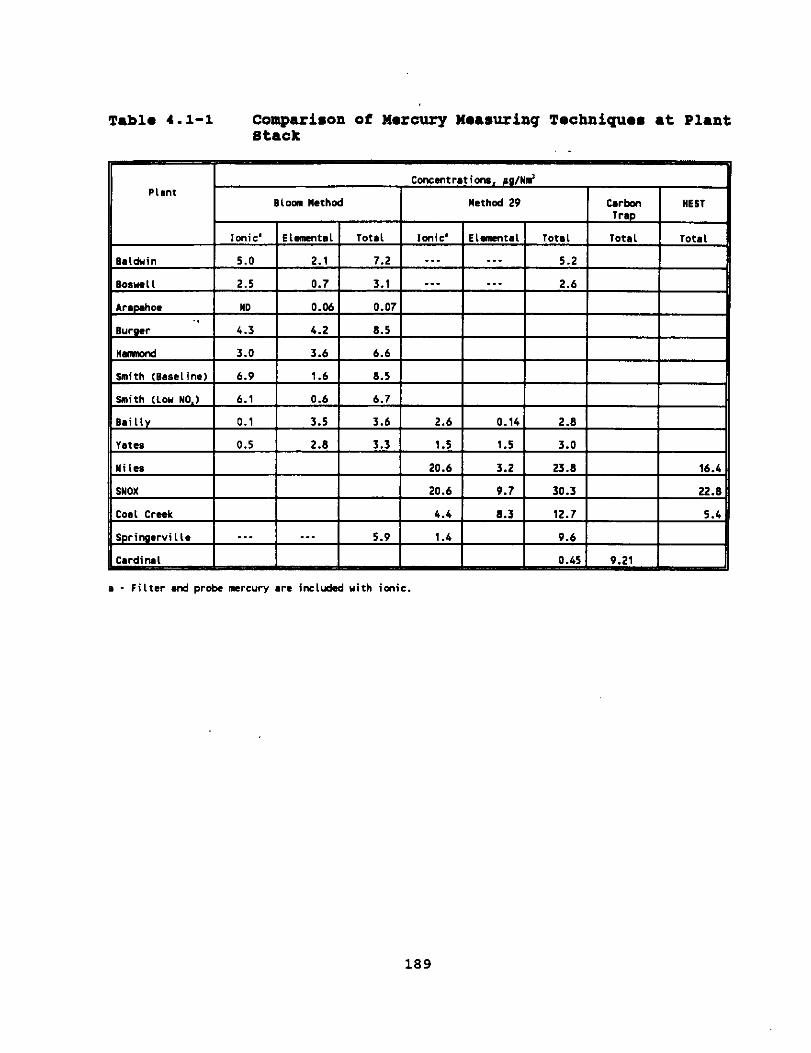
T8bl. 4.1-l Comparison of Mercury Measuring Techniques at Plant etaok
a . Filter and probe mercury are itxluded uith ionic.
189

Tebl. 4.1-2 naroury Bpeciation Wing the Bloom Train
Smith-Sasstim
Smith-Lou-NO. ESP Inlet ESP outlet
billy ESPO lntrt ESP8 Rlttet ESP7 Outlet Stack
"atea (CT-121) ESP Inlet ESP Cutlet
___ ___ ___ so.03 0.6 6.1 0.02 6.7
1.86 4.W ..- 6.85 3.22 4.15 _._ 7.37 2.06 ::t ___ 6.98 3.46 ___ 3.55
2.0 4.4 --_ 6.4 2.5 4.8 -__ 7.3
190

Ttile 4.1-3 Method 29 Uercury Bpeciation
PLant/Swplc Point
Miles ESP Inlet ESP outlet
cmemtr,
ha, m. PK& InpinBer ImAnger
22.5 4.2 0.9 20.6 3.2 0.02
SWO, Eaghmm Inlet Baghouse Outlet SCI Unit Outlet us* Cwdensec.Outlet
Coal Creek ESP Inlet ESP cutlet scruk&r Outlet
19.6 1.1 24.5
i:: 0.02
26.0 E
0.2 18.9 1.7
4.2 ::: 0.02 7.6 0.02 4.4 a.3 0.0
BaLduin ESP Inlet ESP out,*t
BOSWI L BaShowe Inlet Baghouse Outlet
___ .__ ___ _._ ___ ___
bi I Ly ESPB Inlet 1.04 2.87 --- ESPB Outlet 1.23 2.76 --- ESP7 0"tlet 1.40 2.76 --- Stack 0.14 2.65 ---
"ares ESP Inlet 0.35 5.1 --- ESP Outlet 0.98 4.6 --. Stack 1.5 1.5 ---
w
Filt*r
0.7 0.0
::t 0.5
0.02
0.04
2
-__ ___
. . .
0.27 0.03 0.05 0.02
Filt*r/Prabe Cc&in4
-__ ___
.__ ___
7.1 0.13
0.006
20.3 23.0
27.7 20.0 30.9 30.3
13.6 11.9 12.7
6.0 5.2
6.4 2.6
4.2 4.0 4.2 2.0
7.4 11.5 9.6
m;e
191
APPENDIX - REFERENCE8 MID-REPORT CONTENT B-Y
192

1. "A Study to Toxic Emissions from a Coal-Fired Power Plant
Utilizing and ESP/Wet FGD System" by Battelle, July 1994 (Coal
Creek Station)
Volume 1: Site description, sampling, sample analysis,
results, data analyses, special topics
Volume 2: Appendices including log sheets, auditing,
. . sampling protocol data sheets, QAfQC, analytical
protocol, uncertainty analysis
2. "A Study of Toxic Emissions from a Coal-Fired Power Plant -
Nile6 Station Boiler No. 2" by Battelle, June 1994
Volume 1: Site description, sampling, sample analysis,
results, data analyses, special reports
Volume 2: Appendices including log sheets, auditing,
sampling protocol data sheets, QA/QC, analytical
protocol, uncertainty analysis
3. "A Study of Toxic Emissions from a Coal-Fired Power Plant
Utilizing the BNOX Innovative Clean Coal Technology
Demonstration" by Battelle, July 1994 (Niles Station)
Volume 1: Site description, sampling, sample ~analysis,
results, data analyses, special topics
Volume 2: Appendices including log sheets, auditing,
sampling protocol data sheets, QA/QC, analytical
protocol, uncertainty analysis
193

4. "Gas Suspension Absorption (GSA) Demonstration Plant Air
Toxics Characterization" by Energy and Environmental Research
Corporation, September 1994 (Draft), (Shawnee Power Plant)
One Volume: Process/plant description, sampling and
analytical procedures, results, mass balances,
removal efficiency, emission factors, QWQC,
uncertainty analysis
5. @*Assessment of Toxic Emissions from a Coal-Fired Power Plant
Utilizing an ESP" by Energy and Environmental Research
Corporation, December 1994 (Cardinal Station)
Main Report: Site description, sample collection, sample
analysis, results, data analysis, special topics
Appendix A - External Quality Assurance
Appendix B - Sampling Protocol
Appendix C - Sampling Data Sheets
Appendix D - Internal Quality Assurance
Appendix E - Analytical Protocol
Appendix F - Uncertainty Analysis~
Appendix G - Gas Run Data
Appendix H - Liquid Run Data
Appendix I - Solids Run Data
6. "Characterizing Toxic Emissions from a Coal-Fired Power Plant
Demonstrating the AFGD ICCT Project and a Plant Utilizing a
DrY ScrubberfBaghouse System - Springerville Generating
194
Station Unit 2 and Dry Scrubber/Baghouse System" by Southern
Research Institute, June 1994
Main Report: Site description, sampling,, sample analysis,
analytical results, data analysis, special
topics
Appendices: Auditing, sampling protocol bunker coal
. . analyses, analytical protocol, QAfQC, analytical
calculations, uncertainty analyses, sampling
data sheets
7. "Toxic Assessment Report - Illinois Power Company Baldwin
Power Station" by Roy F. Weston, Inc., July 1994
Volume I: Unit description, study design and execution,
flue gas stream results, process streams, QA/QC
activities
Volume II:
Volume III:
Volume IV:
Process operations data, detailed test results,
raw test data
Laboratory reports
QA/QC audit report, QC oversight report, QA/QC
activities and results, equipment calibration
records, sample calculations
0. l*Toxics Assessment Report - Minnesota Power Company Boswell
Energy Center" by Roy F. Weston, Inc., July 1994
195

Volume I:
Volume II:
Volume III:
Volume IV:
Unit description, study design and execution,
flue gas stream results, process streams, QA/QC
activities
Process operations data, detailed test results,
raw test data
Laboratory reports
QA/QC audit report, QC oversight report, QA/QC
activities and results, equipment calibration
records, sample calculations
9. "Characterizing Toxic Emissions from a Coal-Fired Power Plant
Demonstrating the AFGD ICCT Project and Utilizing a Dry
Scrubber/Baghouse System - Bailly Station Units 7 and 8 and
AFGD ICCT Project@* by Southern Research Institute, October,
1994.
Main Report: Site description, sampling, sample analysis,
analytical results, data analysis, special
topics
Appendices: Auditing, sampling protocol bunker coal
analyses, analytical protocol, QA/QC, analytical
calculations, uncertainty analyses, sampling
data sheets
10. **A Study of Hazardous Air Pollutants at the TIDD PFBC
Demonstration Plant II by Radian Corporation, October 1994.
196
Volume I: Site description, results, data evaluation,
sample calculations
Volume II: Appendices - Sample collection and pretreatment,
analytical procedures, data, QA/QC results, data
trend plots, equipment calibration records,
field data sheets, uncertainty formulas
11. "A Study of Toxic Emissions from a Coal-Fired Power Plant
Utilizing an ESP While Demonstrating the ICCT CT-121 FGD
Project" by Radian Corporation, June 1994 (Plant Yates)
One Volume: Site description, results, data evaluation,
sample calculations, sample collection and
pretreatment, analytical procedures, detailed
analytical data, sampling data, QA/QC results
data trends, plots, equipment calibration
records, field data sheets, uncertainty formulas
12. "Field Chemical Emissions Monitoring Project Site 115
emissions Report" by Carnot, November 1994 (Preliminary Draft)
One Volume: Site description, results, chromium and mercury
speciation results, data evaluation, sample
calculations, sampling and analytical
concentrations, unused data, flow rates, process
operation, uncertainty analyses, QAIQC,
analytical and blank correction data
197

13. "Hazardous Air Pollution Monitoring: Demonstration of Coal
Reburning for Cyclone NO, Boiler Control" by Acurex
Environmental Corporation, June 1993
One Volume: Facility description, test plan, tests results
14. "Field Chemical Emissions Monitoring Project: site 116
Emissions Report" by Radian Corporation, July 1994 (Plant . .
Burger)
One Volume: Site description, results, data evaluation,
special topics, sample calculations, sampling
and analytical methods, process and sampling
data, QA/QC data
15. "Measurement of Chemical Emissions Under the Influence of Low-
NO, Combustion Modifications I* by Southern Research Institute,
October 1993 (Plant Smith)
One Volume: Site description, sampling and measurement
procedures, physical characterizations, chemical
analyses results, material balance data,
particle size data, special topics QA/QC
198

16. "Field Chemical Emissions Monitoring: Overfire Air and
Overfire Air/Low NO, Burner Operation" by -Southern Company
Services, Inc., November 1993 (Plant Hammond)
One Volume: Site description, results, data evaluation,
sample calculations, sample collection and
analysis, analytical data, QAIQC results,
process stream data .*
199