Embed Size (px)
Citation preview
Summary Measures of Socioeconomic Inequalities in Health
TECHNICAL REPORT September 2013

Public Health Ontario
Public Health Ontario is a Crown corporation dedicated to protecting and promoting the health of all
Ontarians and reducing inequities in health. Public Health Ontario links public health practitioners,
frontline health workers and researchers to the best scientific intelligence and knowledge from around
the world.
Public Health Ontario provides expert scientific and technical support to government, local public health
units and health care providers relating to the following:
communicable and infectious diseases
infection prevention and control
environmental and occupational health
emergency preparedness
health promotion, chronic disease and injury prevention
public health laboratory services
Public Health Ontario's work also includes surveillance, epidemiology, research, professional
development and knowledge services. For more information, visit www.publichealthontario.ca
How to cite this document:
Ontario Agency for Health Protection and Promotion (Public Health Ontario). Summary measures of
socioeconomic inequalities in health. Toronto, ON: Queen’s Printer for Ontario; 2013.
ISBN 978-1-4606-2945-1 [PDF]
Public Health Ontario acknowledges the financial support of the Ontario Government.
©Queen’s Printer for Ontario, 2013
Acknowledgements
Project Team
Naomi Schwartz, MPH
Epidemiologist, Analytic Services
Jeremy Herring, MSc
Epidemiologist Lead, Analytic Services
Reviewers
Natalie Greenidge, MHSc
Epidemiologist, Analytic Services
Karin Hohenadel, MSc
Epidemiologist, Analytic Services
Ian Johnson, MD, MSc, FRCPC
Scientific Advisor, Surveillance and
Epidemiology
Brenda Mitchell, MBA
Director, Knowledge Services
Lennon Li, PhD
Biostatistician, Analytic Services
Beata Pach, MA, MISt
Manager, Library Services
Mary-Anne Pietrusiak, MSc
Epidemiologist, Durham Region Health
Department
Ruth Sanderson, MSc
Manager, Analytic Services
Ingrid Tyler, MD, CCFP, MHSc, MEd, FRCPC
Public Health Physician, Science and Public
Health
Special Thanks
Allison McArthur, MISt
Library Information Specialist, Library Services
Health Indicators Team, Canadian Institute for
Health Information
Part of this work was conducted in completion
of a practicum for the MPH epidemiology
program at the University of Toronto, Dalla
Lana School of Public Health

Disclaimer
This document was developed by Public Health Ontario (PHO). PHO provides scientific and technical
advice to Ontario’s government, public health organizations and health care providers. PHO’s work is
guided by the current best available evidence.
PHO assumes no responsibility for the results of the use of this document by anyone. This document may be reproduced without permission for non-commercial purposes only and provided that appropriate credit is given to Public Health Ontario. No changes and/or modifications may be made to this document without explicit written permission from Public Health Ontario.

Contents
List of Abbreviations .......................................................................................................................... 1
Glossary of Terms .............................................................................................................................. 2
Main Messages .................................................................................................................................. 4
Executive Summary ............................................................................................................................ 5
BACKGROUND........................................................................................................................................... 5 APPROACHES AND LIMITATIONS .............................................................................................................. 5 RESULTS .................................................................................................................................................... 6 CONCLUSIONS........................................................................................................................................... 6
Introduction ...................................................................................................................................... 7
Inequities vs. Inequalities ......................................................................................................................... 8 Socioeconomic Inequalities in Health ...................................................................................................... 9 Measures of Socioeconomic Status .......................................................................................................... 9
Methods .......................................................................................................................................... 14
Results ............................................................................................................................................. 15
Selecting Summary Measures of Inequality ........................................................................................... 15 Relating SES to Health Outcome: Summary Measures of Inequality ..................................................... 16
Working Application of Measures ..................................................................................................... 29
Data Sources ........................................................................................................................................... 30 Formation of the Analytic Dataset ......................................................................................................... 30 Statistical Analysis .................................................................................................................................. 31 Demographic Information ...................................................................................................................... 32 Smoking Rates in Ontario and Selected PHUs ........................................................................................ 32 Summary Measures ................................................................................................................................ 35 Analysis Limitations and Strengths ......................................................................................................... 40
Discussion ........................................................................................................................................ 42
References ....................................................................................................................................... 45
Appendix A: Literature Review Search Strategy................................................................................. 50
Search strategy: MEDLINE (indexed records) ......................................................................................... 50 Search strategy: MEDLINE (non-indexed records) ................................................................................. 51 Search terms: health equity and indicators............................................................................................ 52
Appendix B: Excel SES Summary Measure Calculator ......................................................................... 53
Appendix C: Working Application Results – Demographic Profiles ..................................................... 56
Appendix D: Working Application Results – Smoking Rates by SES group ........................................... 59

Summary Measures of Socioeconomic Inequalities in Health | 1
List of Abbreviations
ABSM Area Based Socioeconomic Measure
AD Absolute Difference
CCHS Canadian Community Health Survey
CI Confidence Interval
CIHI Canadian Institute for Health Information
DA Dissemination Area
DRR Disparity Rate Ratio
HCI Health Concentration Index
INSPQ Institut National de Santé Publique de Québec
MOHLTC Ministry of Health and Long-Term Care
ON-Marg Ontario Marginalization Index
OPHS Ontario Public Health Standards
PAF Population Attributable Fraction
PHAC Public Health Agency of Canada
PHU Public Health Unit
QAIPPE Quintile of Adjusted Income per Person Equivalent
RII Relative Index of Inequality
ScotPHO Scotland Public Health Observatory
SES Socioeconomic Status
SII Slope Index of Inequality
UK United Kingdom
WHO World Health Organization

Summary Measures of Socioeconomic Inequalities in Health | 2
Glossary of Terms
Absolute Measures of Inequality: A simple arithmetic differences between a group rate and a specified
reference point.1 Absolute measures of inequality presented in this report are the absolute difference
and the slope index of inequality.
Area Based Socioeconomic Measures: A number of tools that use information to characterize the
socioeconomic profile of a geographic area rather than individuals.2 Area based socioeconomic
measures described in this report include the quintile of adjusted income per person equivalent, the
Ontario Marginalization Index, and the Institut National de Santé Publique de Québec index of material
and social deprivation.
The Health Concentration Index: A summary measure of inequality which is measured as two times the
area between the concentration curve (i.e., the curve modelling the cumulative share of the health
outcome in the population against the cumulative share of the population, ranked by SES from lowest to
highest) and the line of equality (i.e., the 45 degree line where the cumulative percent of the population
equals the cumulative share of the health outcome).3
Health Inequality: Any difference in the distribution of health status or health determinant between
different population groups.4
Health Inequity: A difference in the distribution of health status or health determinants between
different population groups which are unnecessary, avoidable, unjust and unfair.4
Measures of Socioeconomic Status: Measures used to divide a population by socioeconomic status.
These measures can be individual measures of socioeconomic status, like household income quintile, or
area based measures of socioeconomic status, like average neighbourhood income quintile.2
Measures of Total Population Impact: Measures of inequality which take into account not only the
effect of decreasing socioeconomic status on health but also the extent of socioeconomic inequalities
within the population. The larger the extent of inequalities by SES the higher these measures of total
impact will be.5 Measures of total population impact described in this report are the population
attributable fraction, the slope index of inequality, the relative index of inequality and the health
concentration index.
Modifiable Aerial Unit Problem: A bias which occurs when geographies used to estimate area level
socioeconomic status are determined based on convenient administrative factors rather than
meaningful geographic units with similar socioeconomic profiles.2
Ontario Marginalization Index: A complex area based socioeconomic measure which takes into account
multiple dimensions of marginalization including: material deprivation, residential instability,
dependency, and ethnic concentration, and is based on data from the Canadian Census.6

Summary Measures of Socioeconomic Inequalities in Health | 3
QAIPPE: A simple area based socioeconomic measure of neighbourhood income per person equivalent,
adjusted for household size, which is released by Statistics Canada.7
Population Attributable Fraction: A summary measure of inequality, measured as the projected
reduction in the rate of a health indicator if each socioeconomic group experienced the rate of the most
advantaged group, expressed as a fraction of the total health outcome.8
Priority Populations: The Ontario Public Health Standards defines priority populations as those
populations that are at risk and for whom public health interventions may be reasonably considered to
have a substantial impact at the population level.9 An alternative definition proposed by Sudbury &
District Health Unit states that priority populations are groups at increased risk of socially produced
health inequities.10
The Range: A summary measure of inequality which compares the rate of a health variable between the
most and least advantaged groups. The range can either be an absolute measure of inequality, known as
the absolute difference (AD), which takes the difference in rates of the health outcome between the
highest and lowest socioeconomic groups, or a relative measure of inequality, known as the disparity
rate ratio (DRR) which divides the rate of the least advantaged group by the rate of the most advantaged
group.8
The Relative Index of Inequality: A relative summary measure of inequality. There are two forms of the
relative index of inequality (RII), the RIImean and the RIIratio. The RIImean is calculated by dividing the slope
index of inequality by the mean rate of the health outcome in the population.11 The RIIratio represents
the predicted value of the health outcome in the least advantaged divided by the predicted value of the
most advantaged.12
Relative Measures of Inequality: Measures which express the difference between rates in terms of a
specified reference point.1 Relative measures of inequality described in this report are the disparity rate
ratio, the population attributable fraction, the relative index of inequality, and the health concentration
index.
The Slope Index of Inequality: An absolute summary measure of inequality, which represents the slope
of the regression comparing the mean health outcome in a socioeconomic group to the cumulative
percent of the population, ranked by socioeconomic position (from lowest to highest).13
Socioeconomic Status: This report defined socioeconomic status by individual factors relating to social
position or economic situation such as income, occupation level, and educational attainment, or area
level factors such as average neighbourhood income and neighbourhood deprivation indexes.
Summary Measures of Inequality: Measures which quantify the degree of health inequalities by relating
measures of socioeconomic status to health outcomes.5

Summary Measures of Socioeconomic Inequalities in Health | 4
Main Messages
Measuring inequalities in health is a first step in determining health inequities. Once a population is
determined to have an unequal distribution of health, the causes and context should be examined to
determine whether these differences are inequitable and socially produced. This method can help in the
identification of priority populations (i.e., at-risk populations for whom public health interventions may
be reasonably considered to have a substantial impact at the population level).
This report describes methods of measuring inequalities in health by socioeconomic status for a
technical audience. Recognizing the importance of addressing inequalities in health, this report
describes the published approaches of quantifying inequalities that could be used on the provincial level
in Ontario and by public health units to measure health inequalities and inform priority setting.
The results highlight five summary measures of inequality which have a strong basis in the scientific
literature. Choice of measure will depend on the purpose or research question, informed by the
advantages and limitations identified in this report. Often the choice of summary measure is not explicit
and more than one measure should be provided in order to describe different aspects of inequality.
This report provides the necessary scientific and technical basis of measuring inequalities and will help
public health units to identify and target programs to priority populations. Future work could address
the applications of measuring health inequalities to defining inequitable distributions of health and
identifying priority populations in clear language for public health decision-makers.

Summary Measures of Socioeconomic Inequalities in Health | 5
Executive Summary
BACKGROUND
Despite improvements in health status of the population, the gap in health between the most and least
advantaged in society has been growing.14,15 Considerable evidence suggests a socioeconomic gradient
of health whereby ill health outcomes are concentrated in more socioeconomically deprived groups.14,16
In Ontario, in recent years, emphasis has been placed on reducing socioeconomic inequalities in health.
The Ontario Public Health Standards (OPHS)9 require that public health units (PHUs) provide information
on health inequities, as well as use this information to assess population needs. Health inequities refer
to differences in health status between population groups which are unjust, while health inequalities
refer to any differences in health status and can be measured quantitatively.17 To accomplish the goals
set out in the OPHS, it is important to first quantify inequalities at the PHU level.
This report explores and critically appraises methods of measuring health inequalities by socioeconomic
status (SES) on the provincial and PHU level in Ontario. This includes methods of measuring SES through
individual and area based measures and calculating summary measures of inequality, relating SES to
health outcomes.
APPROACHES AND LIMITATIONS
A literature review was performed to identify suitable summary measures of inequality, focusing on
methods of calculation, critical appraisals and practical applications. Summary measures were selected
to reflect those commonly used in the literature, particularly within a Canadian context, and with a
strong research base.
Using smoking as an example, an analysis of smoking inequalities was performed to illustrate the use of
these summary measures in measuring inequalities. Data from the 2009–10 cycle of the Canadian
Community Health Survey (CCHS) were linked with two area-based measures of socioeconomic status, a
simple measure known as neighbourhood income quintile (QAIPPE) and a more complex measure
known as the Ontario Marginalization Index (ON-Marg). The ON-Marg dimensions of material
deprivation and residential instability were considered. Rates of smoking were calculated for each
quintile as defined by these area-based measures, as well as by quintile of individual level household
income. Summary measures relating socioeconomic status to health outcome were then calculated.
Summary measures of inequality identified were limited to available and commonly used measures. This
report provides summary measures that are supported in the scientific and grey literature but does not
provide an exhaustive list of available measures.

Summary Measures of Socioeconomic Inequalities in Health | 6
RESULTS
Five summary measures were shown in the literature to effectively measure health inequalities:
1) range
2) population attributable fraction
3) slope index of inequality
4) relative index of inequality
5) health concentration index
The various summary measures differed in their complexity of calculation and in their consideration of
different population segments. The range and population attributable fraction were defined as simpler
measures of inequality, which were faster to calculate but which ignore certain information on the study
population and its relationship with the health outcome. The slope and relative index of inequality as
well as the health concentration index were shown to be more complex measures which require the use
of sophisticated statistical software and which provide a more complete description of the study
population. The health concentration index provides a good visual description of inequalities, while the
population attributable fraction can be used to describe the population burden of illness.
An analysis of inequalities in smoking between socioeconomic groups found consistent results across all
summary measures, though more complex measures were less likely to find statistically significant
inequalities at the PHU level when using survey data with smaller sample sizes such as the CCHS.
Statistically significant inequalities were found for smoking for all summary measures at the provincial
level for Ontario. Area-based measures of SES gave higher values for inequalities as compared to the
individual level measure of household income.
CONCLUSIONS
This report demonstrates that each summary measure of inequality has its merits. Choice of measure
should depend on different factors including the purpose or research question and the data available.
Comparing results from several summary measures is useful in understanding the different dimensions
of inequality in a population. Less complex methods of calculating inequalities such as the range and
population attributable fraction can provide useful results at the PHU level, particularly when rapid
decisions are necessary. More complex methods such as the slope and relative index of inequality and
the health concentration index provide a more rigorous method for measuring inequalities and can
complement results found using simpler measures.

Summary Measures of Socioeconomic Inequalities in Health | 7
Introduction
The Ontario Public Health Standards (OPHS), released by the Ministry of Health and Long-Term Care
(MOHLTC), demonstrate a commitment to reducing health inequities. These standards state that
“addressing determinants of health and reducing health inequities are fundamental to the work of
public health in Ontario.” Requirements of the board of health under the Foundational Standard include
using information on inequities to assess the needs of the population, tailor programs and services for
priority populations, and provide population health information on health inequities.9 Health inequities
refer to differences in health status between population groups which are unjust, while health
inequalities refer to any differences in health status and can be measured quantitatively.17 To
accomplish this mandate, it is important that inequalities are first quantified. This report examines
methods of measuring socioeconomic status (SES) and the summary measures of inequality relating SES
to health outcomes.
The objectives of this report are to:
1) Identify measures of SES and summary measures for quantifying health inequalities.
2) Use information in the literature and from an analysis of inequalities in Ontario to provide a
detailed profile of the existing summary measures of inequality and offer technical advice to
public health epidemiologists.
3) Compare results of identified summary measures using individual and area based measures of
SES.
One major advantage of computing summary measures of inequality is the ability to compare
inequalities over time, geographic areas, and across various health indicators.1 While the report will
largely focus on measuring socioeconomic inequalities, some of the methods used can be adapted to
measure other types of inequalities, for example, inequalities between ethnic groups.
This report begins with background information on health inequalities, followed by a review of
individual and area-based measures of SES. It then describes the methods used to identify measures of
inequality. Several summary measures of inequality will be discussed, including their major applications,
strengths and limitations. Scenarios that favour the use of one summary inequality measure over
another are considered, and methods for calculating these summary measures at the provincial and
public health unit (PHU) level in Ontario are presented. Following this, an analysis examining inequality
of smoking rates by SES in Ontario and four selected PHUs of various sizes and geographies is presented
to illustrate the use of the different summary measures of inequality.

Summary Measures of Socioeconomic Inequalities in Health | 8
This report includes the following:
background information on health inequalities
a review of individual and area based measures of SES
the methods used in this report to identify measures of inequality
a discussion of several summary measures of inequality including their major applications, strengths and limitations and methods of calculation
an illustrative analysis examining inequality by smoking rates by SES in Ontario and four selected PHUs of various sizes and geographies
a discussion including technical advice on use of summary measures
Inequities vs. Inequalities
Inequality and inequity are two different concepts. The World Health Organization (WHO) defines a
health inequality as any difference in the distribution of health status or health determinants between
different population groups. Health inequalities can be attributed to free choice, biological variations,
the physical environment, and factors beyond the control of the individuals concerned. For example,
differences in physical capabilities between elderly and younger people in the population would be
considered an inequality. In contrast, inequity is an ethical concept which reflects principles of social
justice.17 Health inequities are defined as inequalities in which the outcome is unnecessary and
avoidable as well as unjust and unfair. For example, differences in health care accessibility between
socio-economic groups may be interpreted as an inequality as well as an inequity, while some
differences in physical capabilities between elderly and younger people would not be considered an
inequity as it is unavoidable.4 In general, differences due to biological variations, fully informed decisions
to participate in higher risk behaviours, and chance are not considered inequities.18,19 Many would
describe health inequalities across socioeconomic groups as unjust because they often reflect an unfair
distribution of the social determinants of health.19,20
Health inequalities can be measured quantitatively while health inequities cannot. This is because
identifying health inequities requires the use of judgment regarding the social justice of an inequality,
which may depend on the causes of the inequality and the context of the local community.5 Better
understanding of the causes and context of health inequalities can also help PHUs to better target
interventions and advocate for necessary changes. This report will focus on quantitative measures of
health inequalities. Identifying inequalities is a first and important step in the identification of inequities.

Summary Measures of Socioeconomic Inequalities in Health | 9
Socioeconomic Inequalities in Health
Considerable evidence indicates the existence of inequalities in the burden of disease between groups
of differing SES.11,14,16,21,22 The Black Report, published in the United Kingdom (UK) in 1980, brought
attention to inequalities in health by social class. The study, conducted by the UK department of Health
and Social Security, demonstrated significantly higher mortality rates among those in the lowest social
class compared to the highest. Despite showing overall improvements in health over time, the report
demonstrated that inequalities in health by SES had been increasing since World War II.11,15 Around the
world, a similar increased rate of poor health outcomes among those of low socioeconomic position has
been demonstrated, with adverse health outcomes concentrated in the most deprived populations.14
Many of these studies have demonstrated a socioeconomic gradient in which decreases in SES are
associated with incremental increases in health outcomes. In Canada, socioeconomic factors which have
been seen to influence health include: income, employment, education, food security, and social
supports and connectedness.23 Health variables which have demonstrated inequalities by SES include
high risk health behaviours, such as smoking and alcohol use, access to health care services, and various
health outcomes.24 Examples of health outcomes shown to vary by SES include chronic diseases, injuries,
self-rated health, oral health, and mortality.5,25-32
Although those living below a certain poverty threshold (absolute poverty) demonstrate inequalities due
to lack of adequate food/shelter —a clear gradient in SES has been shown, indicating that health
outcomes are also affected by factors beyond absolute poverty. The relative income hypothesis states
that health status depends not only on individual SES but also on complex factors beyond absolute
poverty, including the individual’s socioeconomic position within society.19
Measures of Socioeconomic Status
Measuring health inequalities by SES involves dividing a population into appropriate socioeconomic
groups; these groups can be individual measures of SES or area based.33 In measuring health
inequalities, populations are often divided into quintiles of SES.21,34-37 Summary measures of inequality
determine the degree to which these socioeconomic groups are related to health outcomes. Therefore,
before looking at summary measures it is important to examine the different methods of dividing a
population into socioeconomic groups.
INDIVIDUAL MEASURES OF SOCIOECONOMIC STATUS
Individual measures of socioeconomic status use individual level information such as income,
educational attainment, or occupation to classify populations into socioeconomic groups (e.g., income
quintiles, high school to university or occupational “levels”).24 Individual level information is the most
direct way of classifying individuals by socioeconomic information and is generally considered the
standard measure of SES. However, individual level information is often unavailable from major public
health databases and individual level SES data from self-reported surveys are often incomplete.2,38 When
Summary Measures of Socioeconomic Inequalities in Health | 10
measuring health inequalities, income is often chosen as a measure of individual SES as it is generally
considered the SES measure with the greatest impact on health inequalities.39 However, other individual
measure of SES (i.e., educational attainment and occupational level) can be used effectively to divide a
population into socioeconomic groups in order to measure socioeconomic inequalities.
AREA-BASED SOCIOECONOMIC MEASURES
Area-based socioeconomic measures (ABSMs) encompass a number of tools that use information to
characterize the socioeconomic profile of a geographic area rather than individuals. ABSMs can be very
simple measures of SES such as average neighbourhood income (i.e., the quintile of adjusted income per
person equivalent), or very complex, such as a multicomponent deprivation scores like the Ontario
Marginalization Index (ON-Marg).2,6 In recent years, usage of ABSMs for measuring SES has been
increasing. Reasons for using ABSMs include growing interest in place and context as a determinant of
health, and the need to incorporate socioeconomic inequality data when informing place-based decision
making.2 ABSMs have been recognized as independent predictors of health due to the importance of
contextual or area level influences on health.38,40 Commonly used databases such as vital statistics and
health administration data rarely provide information on socioeconomic factors. When individual level
data on SES is absent, ABSMs can be used as a proxy for individual level information.33 This involves
matching individuals to a spatial location using information on place of residence such as postal codes.2
In Canada, many ABSMs are provided at the level of dissemination areas (DAs).2,6 DAs are defined as
small, relatively stable geographic units and are the smallest standard geographic area for which all
census data is disseminated and cover all of Canada. The average population of a DA is about 700
people.41 As DAs are the smallest geographic area for which census data are disseminated, they are
recommended when using area-based measures as a proxy for individual SES to give the most accurate
results.
The choice of using an area-based measure will depend on factors such as the data and resources
available, and the purpose or research question. Before choosing to use an ABSM, the strengths and
limitations of ABSMs as compared to individual measures of SES should be well understood. One major
advantage of using an ABSM is that area-based measures are frequently consistent with individual level
indicators (the direction of the relationship is similar), as well as being statistically reliable.29 ABSMs also
characterize the entire population, and allow inequalities to be tracked through time and by geographic
location.24,29 Importantly, ABSMs can both measure contextual factors of SES, (for example, social
influences and access to resources) and account for aspects of individual level SES. One benefit of
measuring SES by area is the possibility of mapping inequalities, which can then be used to provide
information and context to local decision-makers.2,36,38,42
A potential bias in the use of ABSMs can occur when geographies used to estimate area level SES are
determined based on convenient administrative factors rather than meaningful geographic units with
similar socioeconomic profiles. This bias is technically known as the modifiable aerial unit problem.2
There are several disadvantages of using ABSMs as proxies for individual level data. ABSMs can
underestimate the effects found using individual level data due to a non-differential misclassification

Summary Measures of Socioeconomic Inequalities in Health | 11
bias. For example, those living in a highly deprived area are not necessarily of low SES (or vice versa).
Alternatively, ABSMs can also overestimate an effect size if there is a contextual effect of area level
deprivation, independent of individual level deprivation.33,43 For example, higher rates of smoking in a
low income neighbourhood could create social pressures which influence an individual’s risk of smoking
in addition to individual level factors relating low income and risk of smoking.44
Because of substantial limitations in using area-based measures as proxies for individual measures,
ABSMs should not be used to make inferences about individual level deprivation when individual level
SES data is available.33 To account for contextual factors of socioeconomic deprivation, a multilevel
model which incorporates individual and area level measures may be useful.36,38 The choice to use
ABSMs depends on the context and purpose of the analysis. If one wants to measure health inequalities
by area to identify areas at increased risk of poor health outcomes, or if one wishes to display
inequalities on a map to better understand regional inequalities, then the use of ABSMs may be
preferable to individual level data.2 However, when using ABSMs as a primary predictor of health it is
important to interpret results accordingly, (i.e., as an effect of living in a deprived area rather than an
effect of individual socioeconomic position).43
Tables 1-A: Advantages and Limitations of Using ABSMs as a Measure of SES
Advantages Limitations
Less missing information compared to individual SES variables
Takes into account contextual role of SES
Census boundaries don’t necessarily apply to “real” neighbourhoods with homogeneous populations (modifiable aerial unit problem)
Tables 1-B: Advantages and Limitations of Using ABSMs as a Proxy for Individual Data
Advantages Limitations
Often available when individual level data on SES is absent
Neighbourhood characteristics don’t always reflect individual characteristics (i.e., ecologic fallacy)
Contextual factors influence effect size
This report presents three widely used ABSMs: the quintile of adjusted income per person equivalent
(QAIPPE), the Ontario Marginalization Index (ON-Marg) and the index of material and social deprivation
created by the Institute National de Santé Publique de Québec (INSPQ).

Summary Measures of Socioeconomic Inequalities in Health | 12
Quintile of Adjusted Income per Person Equivalent (QAIPPE)
The quintile of adjusted income per person equivalent (QAIPPE) is a simple ABSM which is released by
Statistics Canada. The QAIPPE is a measure of neighbourhood income per person equivalent, adjusted
for household size, and is based on census summary data at the DA level. The single person equivalents
used to adjust household income are 1.00 for 1 person living in a household, 1.25 for 2 persons, 1.55 for
3 persons, 1.95 for 4 or 5 persons, and 2.44 for 6 or more persons sharing the same household. To
create the QAIPPE, Statistics Canada first used the DA average neighbourhood income per person
equivalent to rank all DAs and then divided the DAs into fifths, with the first quintile representing the
lowest SES and the fifth quintile representing the highest SES DA.7
Ontario Marginalization Index (ON-Marg)
Another, more complex ABSM is the Ontario Marginalization Index (ON-Marg) which looks at different
dimensions of marginalization, accounting for multiple contributing factors. The ON-Marg was
specifically developed to examine inequalities in health by population groups or geographic areas in
Ontario. Like the QAIPPE, the ON-Marg can be calculated at the DA level and is based on Canadian
census data. Unlike the QAIPPE, that considers material inequality alone, the ON-Marg examines
additional dimensions of inequality. There are four dimensions to the ON-Marg: material deprivation,
residential instability, dependency, and ethnic concentration. To calculate the ON-Marg, all DAs are
assigned a score for each dimension of marginalization and ranked from lowest to highest. The DAs are
then divided into quintiles for each dimension, creating four separate rankings of inequality.6
The index of material deprivation is based on the following area-based factors:
the proportion of the population above the age of 25 without a certificate, diploma, or degree
the proportion of lone parent families
the proportion of government transfer payments
the proportion of those unemployed above the age of 15
the proportion below the low income cut-off
the proportion of homes needing major repair
The index of residential instability is based on:
the proportion of the population living alone
the proportion of youth aged 5-15
the average number of persons per dwelling
the proportion of multi-unit housing
the proportion of population married or common low
the proportion of dwellings owned
Summary Measures of Socioeconomic Inequalities in Health | 13
the proportion of residential mobility
The dependency dimension is based on:
the proportion of seniors
the dependency ratio (population 0 to 14 and 65+ / population 15 to 64)
the labour force participation rate (age 15 and older)
Ethnic concentration is based on:
the proportion of five year recent immigrants
the proportion of visible minorities
Institut National de Santé Publique de Québec (INSPQ) index of material and social deprivation
Another, complex ABSM is the index of material and social deprivation created by the INSPQ, hereby
referred to as the INSPQ index. The INSPQ index is calculated at the DA level and is drawn from
Canadian census data for 1991, 1996, 2001, and 2006. Like the ON-Marg, the INSPQ index examines
material and social dimensions of inequality. There are two dimensions to the INSPQ index: material
deprivation, and social deprivation. To calculate the INSQP index, all DAs are assigned a score for each
dimension of deprivation and ranked from lowest to highest. The DAs are then divided into quintiles for
each dimension, creating two separate rankings of inequality.45
The index of material deprivation is based on the following area-based factors:
The proportion of the population aged 15 years and over without a high school diploma or equivalent
The employment to population ratio for the population 15 years and over
The average income of the population aged 15 years and over
The index of social deprivation is based on the following area-based factors:
The proportion of the population aged 15 and over living alone;
The proportion of the population aged 15 and over who are separated, divorced or widowed;
The proportion of single-parent families

Summary Measures of Socioeconomic Inequalities in Health | 14
Methods
A review of the scientific and grey literature was performed to identify appropriate summary measures
of inequality including methods of calculation, interpretation, and advantages and limitations. Grey
literature sources included government and non-government reports from the Public Health Agency of
Canada (PHAC), the Canadian Institute for Health Information (CIHI), Scotland Public Health Observatory
(ScotPHO), the World Bank, and the U.S. Department of Health and Human Services.
A systematic search strategy was undertaken for the literature review. A snowball strategy was used to
identify articles related to measures and indicators of health equality. To complement this search
strategy, English language articles which explored the concepts of health equity or health equality as
well as indicators or statistical measures were searched in MEDLINE. A detailed search strategy,
including all the search terms, can be found in Appendix A. References were reviewed to identify
additional articles relevant to measuring socioeconomic inequalities.
Review documents focusing on measurement of socioeconomic inequalities were used to inform the
selection of summary measures of inequality. In addition, measures used in Canada for quantifying
health inequalities by SES were considered for inclusion.
To ensure that the summary measures could be applied to measuring inequalities at the provincial level
in Ontario and at the PHU level, an analysis was carried out of inequalities in Ontario and four selected
PHUs of various sizes and geographies, using smoking as an example.

Summary Measures of Socioeconomic Inequalities in Health | 15
Results
Selecting Summary Measures of Inequality
The decision to use a specific summary measure of inequality often depends on the purpose or research
question, and the data and resources available.46 These summary measures can either be absolute
measures of inequality, arithmetic differences between a group rate and a specified reference group, or
relative measures of inequality, which are expressed as a percentage difference between a group rate
and a specified reference point.1
Wagstaff et al.3 present guidelines for selecting summary measures of inequality. These guidelines state
that summary measures must:
a) reflect the socioeconomic dimension of inequalities in health
b) reflect the experiences of the entire population
c) be sensitive to changes in the distribution of the population across socioeconomic groups
Based on these guidelines, only three measures of inequality were identified:
1) slope index of inequality
2) relative index of inequality
3) health concentration index
Notably, these three measures involve complex analyses and are related to one another mathematically
through a simple equation.3 However, Mackenbach and Kunst5 have argued that the guidelines
presented by Wagstaff et al. are overly strict and ignore measures which could provide insight into the
nature of inequalities while being easier to calculate with more straightforward interpretations.
Additional measures which have been used to calculate inequality in Canada are the range, as well as
the population attributable fraction (PAF).8 The next section will explore the summary measure of
inequality identified in the literature: the range, the PAF, the slope and relative index of inequality, and
the health concentration index.

Summary Measures of Socioeconomic Inequalities in Health | 16
Relating SES to Health Outcome: Summary Measures of Inequality
THE RANGE
The range is a measure of inequality which compares the rate of a health variable between the most
advantaged group and the least advantaged group. The range can be an absolute measure of inequality,
known as the absolute difference (AD) or absolute range, which takes the difference in rates of the
health outcome between the highest and lowest socioeconomic groups. By convention, the most
affluent group is used as the referent category.8 When the AD is equal to zero, equality in health is said
to exist. A 95% confidence interval (CI) which does not include zero indicates the presence of significant
inequalities in health.
The range can also be a relative measure of inequality, known as the disparity rate ratio (DRR) or the
relative range. The DRR is a measure of a socioeconomic gap, dividing the rate of the least advantaged
group by the rate of the most advantaged group. A DRR of one represents the absence of inequality in
the population. For an adverse health event, a DRR greater than one represents an increase in ill health
amongst the least advantaged.5,8 A 95% CI which does not include one indicates the presence of
significant inequalities in health. The DRR can be interpreted as the relative disparity between the
highest socioeconomic group and the lowest.

Summary Measures of Socioeconomic Inequalities in Health | 17
Calculating the Range and 95% CIs
The absolute difference can be calculated using the formula:
Where Ri refers to the rate of the health outcome in the least advantaged group and Rr
represents the rate of the health outcome in the most advantaged (or reference) group.
A method for calculating 95% CIs of the range is found in Cheng, et al.48 which also provides
a SAS macro for computing the range measures and 95% CIs. Calculation of the 95% CI for
the AD includes computing the standard error using the following formula:
√
Where SEi represents the standard error of the prevalence of the health outcome in the non-
reference group and SEr represents the standard error of the prevalence in the reference
group (or the most advantaged group).
The disparity rate ratio can be calculated using the formula8:
The standard error for the DRR is calculated through the equation:
√
where RSEdiff is the relative standard error of the difference, computed by the formula:
√
Where Ri and Rr are the prevalence rates in the non-reference and reference populations
respectively.
The RSEr is the relative standard error of the reference group and can be computed using the
equation:

Summary Measures of Socioeconomic Inequalities in Health | 18
The 95% CI is then calculated for both the AD and the DRR using the equation:
Where T is the point estimate of the range measure.
This approach assumes that the range measures themselves are normally distributed with a
certain mean and standard deviation
Interpreting the Range
Large values of the AD indicate high levels of inequality. Significance is determined if 95% CIs
do not include 0.
Large values of the DRR indicate high levels of inequality. Significance is determined if 95%
CIs do not include 1.
There are certain advantages to using the range as a measure of inequality. Calculation of the range is
easy to perform and the interpretation is straightforward. Figure 1 illustrates the range. The measures
are similar to a relative rate and relative difference, metrics commonly used in the health science
literature, and are therefore familiar to public health practitioners. The measure also provides flexibility
in the groups being compared.5 The range can be adapted as a relative rate comparing any two
socioeconomic groups. This is particularly useful when the socioeconomic variable does not reflect an
ordinal measure of SES with a clear hierarchical structure, such as income. For example, in many studies
conducted in England and Wales, population health is compared according to nominal measures, such
as occupation, a factor which is more difficult to translate into an ordinal socioeconomic variable.11,22 By
adapting the range, it would be possible to compare rates in health status between different
occupational groups without making assumptions about the hierarchical structure. Additionally, this
measure can be adapted to studying inequalities in health that cannot be ranked by SES, for example,
comparisons between ethnic groups.47
Summary Measures of Socioeconomic Inequalities in Health | 19
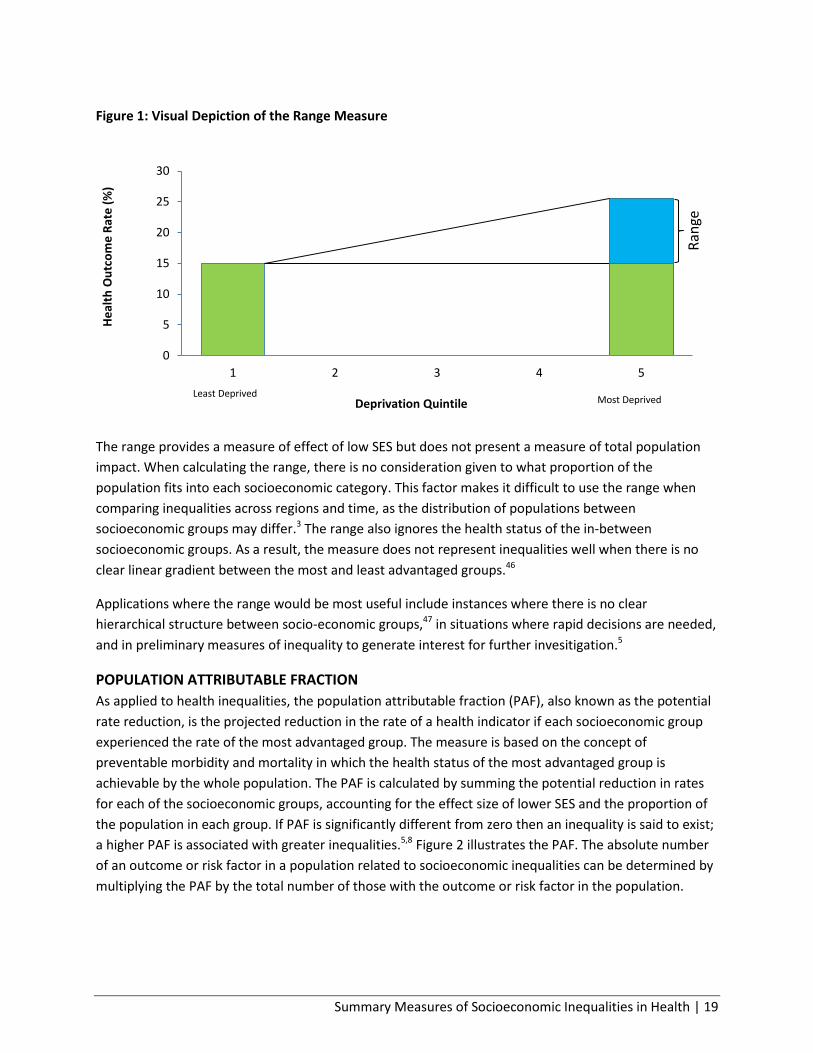
Figure 1: Visual Depiction of the Range Measure
The range provides a measure of effect of low SES but does not present a measure of total population
impact. When calculating the range, there is no consideration given to what proportion of the
population fits into each socioeconomic category. This factor makes it difficult to use the range when
comparing inequalities across regions and time, as the distribution of populations between
socioeconomic groups may differ.3 The range also ignores the health status of the in-between
socioeconomic groups. As a result, the measure does not represent inequalities well when there is no
clear linear gradient between the most and least advantaged groups.46
Applications where the range would be most useful include instances where there is no clear
hierarchical structure between socio-economic groups,47 in situations where rapid decisions are needed,
and in preliminary measures of inequality to generate interest for further invesitigation.5
POPULATION ATTRIBUTABLE FRACTION
As applied to health inequalities, the population attributable fraction (PAF), also known as the potential
rate reduction, is the projected reduction in the rate of a health indicator if each socioeconomic group
experienced the rate of the most advantaged group. The measure is based on the concept of
preventable morbidity and mortality in which the health status of the most advantaged group is
achievable by the whole population. The PAF is calculated by summing the potential reduction in rates
for each of the socioeconomic groups, accounting for the effect size of lower SES and the proportion of
the population in each group. If PAF is significantly different from zero then an inequality is said to exist;
a higher PAF is associated with greater inequalities.5,8 Figure 2 illustrates the PAF. The absolute number
of an outcome or risk factor in a population related to socioeconomic inequalities can be determined by
multiplying the PAF by the total number of those with the outcome or risk factor in the population.
0
5
10
15
20
25
30
1 2 3 4 5
He
alth
Ou
tco
me
Rat
e (
%)
Deprivation Quintile Least Deprived
Most Deprived
Ran
ge

Summary Measures of Socioeconomic Inequalities in Health | 20
Figure 2: Visual Depiction of PAF
Calculating the PAF:
∑
∑
Where Ri is the rate of health outcome in the non-reference group, R5 is the rate of the
health outcome in the reference group (assuming five quintile), and Pi is the proportion of
the population in the socioeconomic group.8
Interpreting the PAF
Large values of the PAF indicate high levels of inequality. Significance is determined if 95%
CIs do not include 0.
0
5
10
15
20
25
30
1 2 3 4 5
Hea
lth
Ou
tco
me
Rat
es (
%)
Deprivation Quintile Least Deprived Most Deprived
+ + +

Summary Measures of Socioeconomic Inequalities in Health | 21
Unlike the range, the PAF is a measure of total population impact. Measures of total population impact,
as identified by Mackenback and Kunst5 are measures in which the extent of socioeconomic inequalities
within a population are considered. This factor is reflected in the third guideline for summary measures
of inequality described by Wagstaff et al., 3 “that the measure be sensitive to changes in the distribution
of the population across socioeconomic groups.” The PAF also considers all socioeconomic groups, not
just the extremes. The PAF shares some advantages with the range: it is quick to calculate with a
straightforward interpretation, and it is commonly used in the health science literature and therefore is
familiar to public health practitioners.5 Lastly, its ability to demonstrate the population burden of
disease attributable to SES makes it very relevant from a decision maker’s perspective.46 An important
disadvantage of using the PAF is that it ignores information on the association between SES and the
frequency of the health outcome. For example, the PAF value could be similar for a systematic linear
increase in a health outcome with decreasing SES and a non-systematic association between SES and
health.5 For this reason, the PAF does not measure inequality well when there is no clear gradient in
health status between the highest and the lowest socioeconomic groups.46
The PAF would be most useful in matters where rapid decisions are needed or to provide preliminary
measures of inequality that may generate interest for further invesitigation.5
SLOPE AND RELATIVE INDEX OF INEQUALITY
The slope and relative index of inequality are regression based methods for determining the degree of
inequality in a population. The slope index of inequality (SII) is considered an absolute measure of
inequality, and represents the slope of the regression comparing the mean health outcome in a
socioeconomic group to the cumulative percent of the population, ranked by socioeconomic position
(from lowest to highest). The independent variable for the regression line, known as the relative rank, is
calculated by arranging the groups in order from lowest to highest SES and assigning the cumulative
proportion of the population to each group. The midpoint of the population proportion for the most
deprived socioeconomic group is taken as its relative rank. For each consecutive group the relative rank
is calculated by adding the midpoint of its population proportion to the proportion of the previous
groups. For grouped data, use of an ordinary least squares regression would result in heteroskedacity of
the error term (i.e., when different groups’ errors have different variances), which violates the
assumption of linear regression.13 Therefore, the regression most commonly used is a weighted least
squares regression, where the weights are proportional to the population size of the socioeconomic
groups.11 Figure 3 provides a visual illustration of the SII.

Summary Measures of Socioeconomic Inequalities in Health | 22
Figure 3: Visual Depiction of SII
Calculating the Slope and Relative Index of Inequality
The SII and RII transformed regression equation is given by the formula:
√ √ √
where √ is the square root of the population proportion in each socioeconomic group, Y is
the health outcome variable and b is the relative rank variable.64
The SII is interpreted as the absolute difference between the most and least deprived; it is significant if
the 95% CI does not include zero. If the SII is negative, then the health outcome is said to be greater in
those of lower SES.46 The interpretation is similar to a relative difference, but the intermediate
socioeconomic groups are accounted for as well the size of the socioeconomic groups in the calculation
of the slope coefficient of the regression. The SII is sensitive to the mean rate of health in the
population. For example, if the mean rate of ill health in the population doubled, the SII would double as
well.1,11
Another related measure of inequality, known as the relative index of inequality (RII), is not sensitive to
the mean rate of health in the population. There are two forms of the RII, the RIImean and the RIIratio. The
RIImean is calculated by dividing the SII by the mean rate of the health outcome in the population. The
0
5
10
15
20
25
30
0 0.2 0.4 0.6 0.8 1
He
alth
Ou
tco
me
(%
)
Cumulative Share of the Population Most Deprived Least Deprived

Summary Measures of Socioeconomic Inequalities in Health | 23
interpretation is the proportionate decline in the health outcome over the population, ranked by SES. A
large score of the RIImean indicates the presence of inequalities. A negative RIImean indicates that the
health outcome is greater in those of lower SES. Significance is determined if the 95% CI does not
include zero.11 The RIIratio represents the predicted value of the health outcome in the least advantaged
divided by the predicted value of the most advantaged. A large score of the RIIratio indicates high levels of
inequality, significance is determined if the 95% CI does not include one.12 Though similar to a relative
rate, the regression based measure is able to account for the intermediate socioeconomic groups as well
as the distribution of the population between socioeconomic groups.1 The RIIratio, as compared to the
RIImean, tends to overestimate differences.48
Interpreting the SII/RII
Large negative values of the SII indicate high levels of inequality with higher rates among the
least advantaged. Significance is determined if 95% CIs do not include 0.
Large negative values of the RIImean indicate high levels of inequality with higher rates among
the least advantaged. Significance is determined if 95% CIs do not include 0.
Large values of the RIIratio indicate high levels of inequality. Significance is determined if 95%
CIs do not include 0.
As the slope and relative index of inequality make use of a linear regression, the model should fulfill the
basic assumptions associated with regression and linearity.46 However, other forms of regression, such
as a logistic regression, can be used if the assumptions of linearity do not hold.12
One important advantage of the SII and RII are that the measures are able to incorporate information on
all the socioeconomic groups and the proportion of the population that they reflect. The regression
measures are appropriate when one is seeking to measure how health varies with the amount of
characteristic (for example with increasing SES) as opposed to comparisons between individual groups.1
Like the PAF, the slope and relative index of inequality provide a measure of total population impact
which accounts for the population size in each socioeconomic category. However, unlike the PAF, they
do not require a clear monotonic gradient in the rate of the health outcome to be meaningful. The SII
and RII can easily be converted between relative and absolute measures of inequality which may
provide a better understanding of the magnitude of inequality. An advantage of using regression based
measures is that standard diagnostic procedures can be used to determine model fit such as influential
observations.22 The interpretations of the SII and RII are both relatively intuitive, being very similar to
well understood concepts in health science literature, the rate difference and the rate ratio.1
One limitation of using the SII and RII is that the SES variable must be measured on an interval scale. This
can be problematic for some SES indicators which do not have obvious hierarchical structures such as
occupation groups. Attempting to organize these SES indicators on an interval scale requires certain
Summary Measures of Socioeconomic Inequalities in Health | 24
assumptions about the hierarchical relationship between the groups, which may result in certain biases.5
Another disadvantage is that the measures can yield unreliable results when they are applied to small
samples with aggregate data.46 Additionally, the calculation of these measures and 95% confidence
intervals requires the use of more sophisticated statistical software.1 Finally, the interpretation is more
complex than the range and PAF and therefore may be subject to misunderstandings.5
Applications where the RII and SII are most useful is when one is attempting to use a more rigorous
method of measuring inequality which takes into account both the size of the population in the different
socioeconomic groups and the effect size for all groups of the population. It is suggested to check less
complex methods of measuring inequalities, such as the range and PAF against these regression based
measures.5 This method is useful if one is interested in how health varies with the amount of the
characteristic, for example with increasing SES rather than between the groups themselves.1
HEALTH CONCENTRATION INDEX
The health concentration index (HCI), also known as the concentration index, is similar to a measure of
inequality commonly used in economic literature known as the Gini coefficient.37 The concentration
curve models the cumulative share of the health outcome in the population against the cumulative
share of the population, ranked by SES from lowest to highest. This curve is then compared to the line of
equality which is the 45 degree line where the cumulative percent of the population equals the
cumulative share of the health outcome. Figure 4 illustrates this comparison. The HCI is calculated as
two times the area between the concentration curve and the line of equality, and can take on values
between -1 and 1.3
Summary Measures of Socioeconomic Inequalities in Health | 25
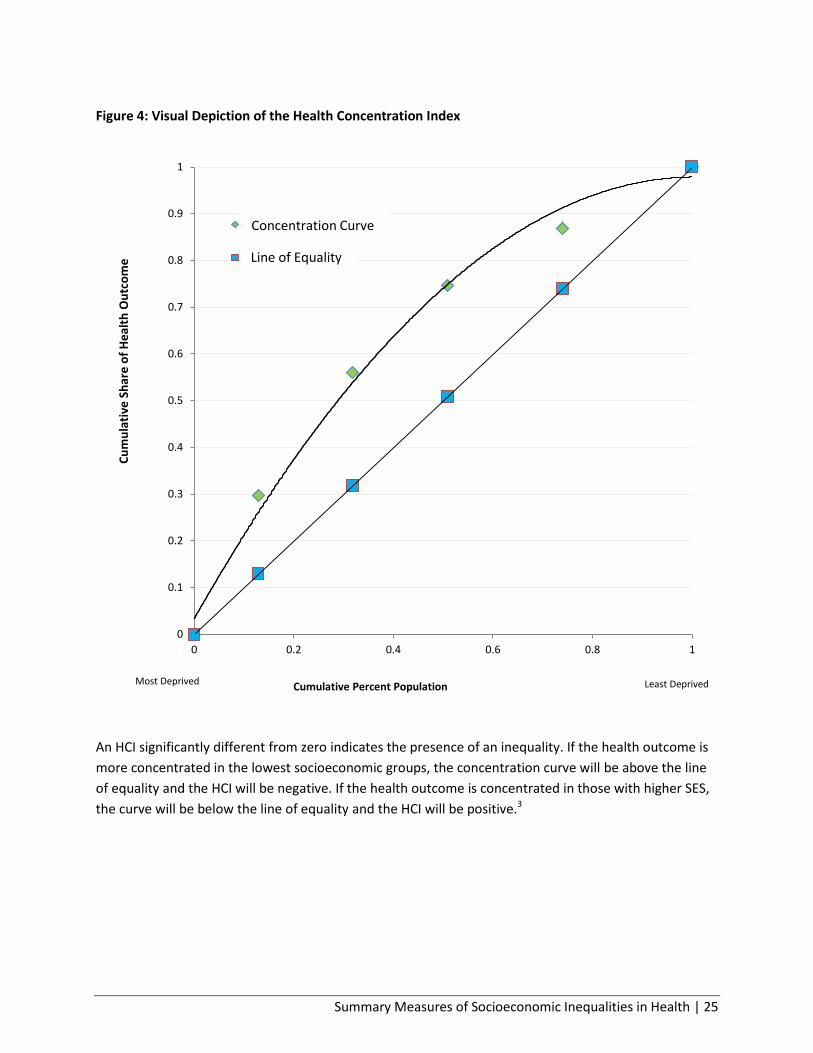
Figure 4: Visual Depiction of the Health Concentration Index
An HCI significantly different from zero indicates the presence of an inequality. If the health outcome is
more concentrated in the lowest socioeconomic groups, the concentration curve will be above the line
of equality and the HCI will be negative. If the health outcome is concentrated in those with higher SES,
the curve will be below the line of equality and the HCI will be positive.3
0
0.1
0.2
0.3
0.4
0.5
0.6
0.7
0.8
0.9
1
0 0.2 0.4 0.6 0.8 1
Cu
mu
lati
ve S
har
e o
f H
eal
th O
utc
om
e
Cumulative Percent Population
cum % Smokers
cumul % pop
Concentration Curve
Line of Equality
Most Deprived Least Deprived
Summary Measures of Socioeconomic Inequalities in Health | 26
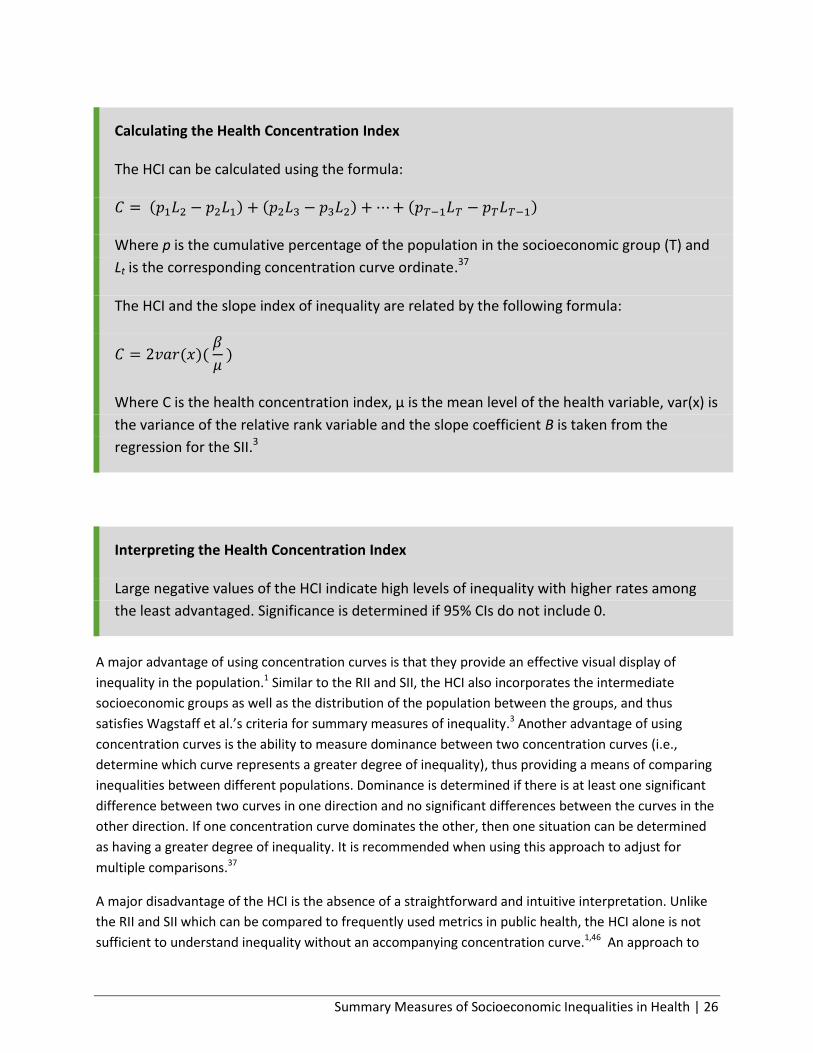
Calculating the Health Concentration Index
The HCI can be calculated using the formula:
Where p is the cumulative percentage of the population in the socioeconomic group (T) and
Lt is the corresponding concentration curve ordinate.37
The HCI and the slope index of inequality are related by the following formula:
Where C is the health concentration index, µ is the mean level of the health variable, var(x) is
the variance of the relative rank variable and the slope coefficient B is taken from the
regression for the SII.3
Interpreting the Health Concentration Index
Large negative values of the HCI indicate high levels of inequality with higher rates among
the least advantaged. Significance is determined if 95% CIs do not include 0.
A major advantage of using concentration curves is that they provide an effective visual display of
inequality in the population.1 Similar to the RII and SII, the HCI also incorporates the intermediate
socioeconomic groups as well as the distribution of the population between the groups, and thus
satisfies Wagstaff et al.’s criteria for summary measures of inequality.3 Another advantage of using
concentration curves is the ability to measure dominance between two concentration curves (i.e.,
determine which curve represents a greater degree of inequality), thus providing a means of comparing
inequalities between different populations. Dominance is determined if there is at least one significant
difference between two curves in one direction and no significant differences between the curves in the
other direction. If one concentration curve dominates the other, then one situation can be determined
as having a greater degree of inequality. It is recommended when using this approach to adjust for
multiple comparisons.37
A major disadvantage of the HCI is the absence of a straightforward and intuitive interpretation. Unlike
the RII and SII which can be compared to frequently used metrics in public health, the HCI alone is not
sufficient to understand inequality without an accompanying concentration curve.1,46 An approach to

Summary Measures of Socioeconomic Inequalities in Health | 27
interpreting the HCI was developed by Koolman and Van Doorslaer.49 This approach calculates the
percent redistribution of the health outcome necessary from the most advantaged half to the least
advantaged half of the population, in order to achieve equality (i.e., a health concentration index of
zero). Another issue with using the HCI is the complexity involved in calculation. Most statistical
software packages include simple functions for creating linear regression curves. However, this is not
the case for creating concentration curves.1 Furthermore, calculating measures of precision and
controlling for confounders is more difficult when calculating the HCI.5 As the HCI is mathematically
related to the SII and RII, in certain cases, it may be more appropriate to use a simpler regression based
measure.
The HCI is most useful when a more rigorous method of measuring inequalities, which takes into
account both the distribution of the population between the different socioeconomic groups and the
effect of low SES in all groups of the population, is required. This method is also useful for making
comparisons of inequality, as one can calculate dominance between two concentration curves. In
addition, the HCI is useful if one wishes to create an effective visual display of inequality in a
population.3

Summary Measures of Socioeconomic Inequalities in Health | 28
Table 2: Summary Measures of Inequality
Measure Relative/ Absolute
Advantages Limitations Useful Applications
The Range Absolute and relative
Fast to calculate, easy to interpret
Flexibility in groups being compared
Ignores middle socioeconomic groups and the population size of the socioeconomic groups
If no clear hierarchical structure between SES groups
When rapid decisions are needed
Population Attributable Fraction
Relative Considers all socioeconomic groups
Demonstrates population burden of disease
Ignores information on relationship between SES and frequency of the health outcome
Requires a linear gradient to be meaningful
When rapid decisions are needed
When desirable to demonstrate the population burden of inequality
Slope and Relative Index of Inequality
Absolute and relative
Takes into account population income distribution and strength of effect
More complex calculation and interpretation, requiring sophisticated statistical software
Requires an obvious hierarchical structure of SES variable
A more rigorous statistical method for calculating inequalities
Use to check less complex methods of measuring inequalities
Health Concentration Index
Relative Takes into account population income distribution and strength of effect
Good visualization of health disparities
Difficult to calculate measures of precision and control for confounding
No straightforward interpretation
A more rigorous statistical method for calculating inequalities
Use to check less complex methods of measuring inequalities
Making comparisons of inequality between populations
Creating effective visual displays of inequalities
Summary Measures of Socioeconomic Inequalities in Health | 29
Working Application of Measures
A working application is presented illustrating the use of all the methods described in the previous
chapter for measuring inequalities in Ontario and selected public health units. The working application
has two purposes:
1) To describe the methods used to measure health inequalities, illustrating the use of measures of
SES and summary measures of inequality
2) To examine the effectiveness of summary measures when applied to PHUs of various sizes and
geographies, as well as individual vs. area based measures so that practical recommendations
can be made.
The application examines socioeconomic inequalities in smoking, a health indicator known to vary by
SES.50,51
Socioeconomic inequalities in smoking rates have been reported in the literature, with less advantaged
groups tending to have higher rates of smoking.50,51 Smoking, whose use is strongly related to SES, is
considered the most significant modifiable risk factor contributing to health inequalities.52 Inequalities in
smoking may result from a number of social determinants including poor targeting of health information
to disadvantaged groups, lowered self-esteem, and increased stress level.52,53 Inequalities in smoking
rates between social classes are important as they relate to socioeconomic inequalities in many poor
health outcomes, including morbidity and mortality from cardiovascular disease, chronic obstructive
pulmonary disease, and various cancers.54,55 Understanding socioeconomic inequalities in smoking rates
is therefore necessary as it is both an important outcome of social determinants of health as well as a
strong contributor to inequalities in heath.
This report presents an analysis of inequalities in rates of current smoking at the provincial level and in
selected PHUs in Ontario. The analysis will compare smoking inequalities using individual level data on
SES (household income) as well as two ABSMs, a simple area based measure (QAIPPE) and a more
complex measure (ON-Marg), to assess the strengths of the approaches in measuring inequalities.
Additionally, the summary measures of inequality, described above, will be calculated and their use in
measuring socioeconomic inequalities will be evaluated.

Summary Measures of Socioeconomic Inequalities in Health | 30
Data Sources
CANADIAN COMMUNITY HEALTH SURVEY
Data from the Canadian Community Health Survey (CCHS) 2009–10 cycle provided the individual level
information, (i.e., smoking status, household income, demographic variables and geographic
information). The CCHS is a national survey of the Canadian population aged 12 and over which is
representative at the PHU level. The CCHS makes use of a complex stratified, and cluster sampling
design to achieve representativeness. Excluded from the CCHS sampling frame are individuals living on
Native Reserves and on Crown Lands, institutional residents, full-time members of the Canadian Forces,
and residents of certain remote regions.56 The 2009–2010 CCHS included 124,870 participants from
across Canada, achieving a response rate of 72.3%. The share file contains a portion (>90%) of the
original CCHS respondents. In Ontario, information on 40,403 individuals is available in the share file.56
Participants of the CCHS were assigned a census dissemination area based on their postal code.
CANADIAN CENSUS
Two variables which made use of 2006 Canadian census data were used in this analysis: quintile of
adjusted income per person equivalent (QAIPPE) and the Ontario Marginalization index (ON-Marg). The
QAIPPE, derived from 2006 census data, is the neighbourhood income for a DA, adjusted for household
size (i.e., the adjusted income per person equivalent (IPPE)), ranked and split into quintiles.7
The ON-Marg, an Ontario specific version of the Canadian Marginalization index (CAN-Marg) was also
derived from 2006 census data. The ON-Marg contains four dimensions of marginalization: material
deprivation, residential instability, dependency, and ethnic concentration.57 The indexes of material
deprivation and residential instability will be the focus of this analysis as they are more highly correlated
with health outcomes.6
Formation of the Analytic Dataset
Statistics Canada QAIPPE and ON-Marg data for Ontario residents were linked to CCHS data using DA
identification numbers. Participants were identified as current smokers if they defined themselves as
smoking cigarettes occasionally or daily. Other CCHS variables examined as potential covariates were
age, sex, education, ethnicity (recoded as white or non-white), immigrant status, marital status, urban or
rural status, and attainment of post-secondary education. For the purpose of this analysis, SES level was
identified as the exposure, while current smoking status was identified as the outcome of interest.
The study population was residents of Ontario, with a population size of approximately 13.0 million at
the time of the survey. Four PHUs of varying population sizes, geographies, and urban/rural status were
selected: PHU A is an urban/rural mix PHU with a large population of 400,000 (i.e., 390,000 above the
age of 12, represented by the CCHS sample), PHU B is a sparsely populated urban/rural mix PHU with a
very small population of 32,000 (i.e., 30,000 above the age of 12, represented by the CCHS sample), PHU

Summary Measures of Socioeconomic Inequalities in Health | 31
C is an urban/rural mix PHU with a small population of 180,000 (i.e.,165,000 above the age of 12,
represented by the CCHS sample), and PHU D is a metro centre with a population of 2.6 million (i.e., 2.34
million above the age of 12, represented by the CCHS sample.52,58 The analysis was performed at the
level of the selected PHUs and for the province of Ontario.
Statistical Analysis
The weighted population size by SES quintile for each geographic unit was computed using the SAS
procedure surveymeans. The total number of smokers was similarly calculated as the weighted number
of smokers in a PHU using the SAS procedure surveyfreq. Weighted rates of current smokers and
variance estimates for each SES quintile and for each geographic unit were calculated through
bootstrapping, using a SAS macro provided by Statistics Canada. The proportions of select socio-
demographic variables by SES quintile were calculated using proc surveyfreq.
The summary measures of inequality, described above, were computed for smoking rates across each of
the measures of SES (household income quintile, QAIPPE, ON-Marg material deprivation, and residential
instability).The area-based measures of QAIPPE, material deprivation, and residential instability were
compared against the individual-based measure of household income quintile. The summary measures
calculated were the range, the PAF, the SII, the RII, and the HCI.
An excel program created by Scotland Public Health Observatory (ScotPHO) was adapted to calculate all
of the listed summary measures of inequality, using methods described in the summary measures
section (adapted ScotPHO program available from Public Health Ontario upon request).47 Data on
population size and rates of smoking, both by SES quintile and overall, were required in the calculation
of point estimates for the summary measures of inequality. Calculation of the absolute number of
smokers related to income inequality additionally required providing the total number of smokers per
geographic unit. The excel file does not include calculations for measures of precision. Appendix C
provides a description of the excel program and how it can be used in the calculation of summary
measures of inequality.
The DRR and the AD with 95% confidence intervals were calculated using formulae provided by Cheng et
al.48 However, no adjustment was made for multiple comparisons.48 The formula for calculating the PAF
and 95% confidence intervals was provided by CIHI. SII and RII values with 95% confidence intervals
were calculated using the SAS procedure reg, and the formulae provided by Cheng et al.48 for calculating
measures of precision.48 Methods of calculating 95% confidence intervals for the health concentration
index are more complex and are not presented in this report. However, methods of calculation,
including a SAS macro are presented in Cheng et al.48 SAS syntax for calculating the DRR, PAF, SII and RII
with 95% CIs is available upon request.
Summary Measures of Socioeconomic Inequalities in Health | 32
Demographic Information
In Ontario, information on 40,403 individuals is available in the CCHS 2009–10 share file. The survey was
completed by 1385 respondents in PHU A, 359 respondents in PHU B, 919 respondents in PHU C, and
3493 respondents in PHU D. Self-reported data from the CCHS showed that 19% of Ontario residents
were current smokers. The population was composed of 49% males and 51% females, with a mean age
of 44 years. The rate of selected socio-demographic variables by socioeconomic group for each of the
measures of SES (income quintile, QAIPPE, ON-Marg material deprivation, and ON-Marg residential
instability) as well as the proportion of the population that falls into each socioeconomic category is
found in Appendix D.
Missing information was much more common for individual level household income (19%) as opposed
to area-based measures (ranging from 0.2–0.8%) (see Appendix D for details). Those with missing
information for household income had socio-demographic profiles which resembled lower income
quintiles. The population appeared to be evenly split between quintiles by household income as well as
quintiles by QAIPPE. However, for the ON-Marg indexes, of material deprivation and residential
instability, a greater proportion of the population was found in the more advantaged quintiles and a
smaller proportion in the least advantaged quintiles.
Average age composition was found to be consistent across socioeconomic groups. With the exception
of quintiles of residential instability, the following trends were observed: male sex, white ethnicity,
married individuals, and individuals with post-secondary education were overrepresented in more
advantaged quintiles, while immigrants and residents of urban areas were under-represented in more
advantaged quintiles. For residential instability quintiles, married individuals (not including common-
law) were under-represented among more marginalized groups, while urban status was highly
overrepresented among the most marginalized groups.
Smoking Rates in Ontario and Selected PHUs
Current smoking rates in Ontario and selected PHUs are shown in Figure 5. Smoking rates in PHU C and
PHU D were lower than the Ontario average, while rates in PHU A and PHU B were higher. PHU A, where
just over 20% of the population were found to be current smokers, showed the highest smoking rates.

Summary Measures of Socioeconomic Inequalities in Health | 33
Figure 5: Current smoking rates in Ontario and selected PHUs, 2009–10
Rates of current smoking for different SES measures in Ontario are shown in Figure 6. A clear gradient
was found for all SES measures whereby smoking rates were higher in more deprived SES quintiles.
0
5
10
15
20
25
PHU A PHU B PHU C PHU D
Cu
rren
t Sm
oki
ng
Rat
e p
er 1
00
po
pu
lati
on
Public Health Unit
ONTARIO AVERAGE

Summary Measures of Socioeconomic Inequalities in Health | 34
Figure 6: Current smoking rates by different SES measures in Ontario, 2009–10
Figure 6-A: Smoking Rates by Household Income
Quintile in Ontario
Figure 6-B: Smoking Rates by QAIPPE in Ontario
Figure 6-C: Smoking Rates by ON-Marg Material
Deprivation Quintile in Ontario
Figure 6-D: Smoking Rates by ON-Marg Residential
Instability Quintile in Ontario
Rates of current smoking by socioeconomic group in Ontario and various PHUs are displayed in
Appendix E. In general, a clear gradient was found whereby smoking rates were higher in more deprived
SES quintiles.
In all health units and for all groupings by SES, the rate of smoking was greater in the most deprived
quintile as opposed to the least deprived.
0
5
10
15
20
25
30
1 2 3 4 5Smo
kin
g R
ate
s p
er
10
0 p
op
ula
tio
n
Household Income Quintile Least Advantaged Most Advantaged
0
5
10
15
20
25
30
1 2 3 4 5
Smo
kin
g R
ate
s p
er
10
0 p
op
ula
tio
n
QAIPPE Least Advantaged Most Advantaged
0
5
10
15
20
25
30
1 2 3 4 5
Smo
kin
g R
ate
pe
r 1
00
Po
pu
lati
on
s
Deprivation Quintile Least Advantaged Most Advantaged
0
5
10
15
20
25
30
1 2 3 4 5Smo
kin
h R
ate
pe
r 1
00
Po
pu
lati
on
Instablility Quintile Least Advantaged Most Advantaged

Summary Measures of Socioeconomic Inequalities in Health | 35
Summary Measures
Table 3 displays values calculated for each of the summary measures of inequality for the different SES
measures and the different PHUs of interest.
Table 3: Summary Measures of Inequality by PHU and by SES measure, 2009–10
The Range The Indexes of Inequality
DRR (95% CI)
AD (95% CI)
PAF (%) (95% CI)
SII (95% CI)
RIImean (95% CI)
RIIratio (95% CI)
HCI
Ontario
Income Quintile
1.82
(1.61 – 2.03)
11.43
(9.25 – 13.60)
27.35
(21.39 – 32.94)
-12.37
(-21.38 – -3.37)
-0.66
(-1.14 – -0.18)
1.95
(1.14 – 3.33)
-0.103
QAIPPE 1.70
(1.46 – 1.94)
9.89
(7.69 – 12.08)
24.89
(17.79 – 31.30)
-12.70
(-14.46 – -
10.95)
-0.67
(-0.77 – -0.58)
2.02
(1.82 – 2.24)
-0.11
Material Deprivation Quintile
1.70
(1.45 – 1.96)
10.53
(8.01 – 13.05)
20.53
(13.18 – 26.50)
-12.86
(-18.29 – -7.43)
-0.68
(-0.97 – -0.39)
2.04
(1.47 – 2.82)
-0.11
Residential Instability Quintile
1.58
(1.28 – 1.88)
8.38
(6.00 – 10.76)
23.24
(17.00 – 29.12)
-10.67
(-13.35 – -8.00)
-0.57
(-0.71 – -0.43)
1.79
(1.53 – 2.09)
-0.09
PHU A: Large, urban/rural mix
Income Quintile
3.88
(3.22 – 4.54)
21.45
(12.27 – 30.62)
63.17
(41.21 – 77.45)
-26.09
(-43.34 – -8.84)
-1.30
(-2.15 – -0.44)
4.56
(1.04 – 19.95)
-0.21
QAIPPE 5.77
(5.26 – 6.28)
31.76
(21.82 – 41.70)
66.69
(50.83 – 77.75)
-38.56
(-63.70 – -13.41)
-1.91
(-3.16 – -0.67)
72.28
(0.00 – 2.07E8)
-0.31
Material Deprivation Quintile
4.60
(4.02 – 5.17)
36.45
(24.93 – 47.97)
49.43
(22.83 – 67.81)
-40.87
(-74.99 – -6.75)
-2.03
(-3.72 – -0.34)
*-179.58
(..–..) -0.31
Residential Instability Quintile
2.14
(1.34 – 2.94)
16.03
(5.31 – 26.74)
30.81
(-3.80 – 54.94)
-22.67
(-36.91 – -8.44)
-1.13
(-1.83 – -0.42)
3.50
(1.24 – 9.85)
-0.18

Summary Measures of Socioeconomic Inequalities in Health | 36
The Range The Indexes of Inequality
DRR (95% CI)
AD (95% CI)
PAF (%) (95% CI)
SII (95% CI)
RIImean (95% CI)
RIIratio (95% CI)
HCI
PHU B: Sparsely Populated urban/rural mix
Income Quintile
1.80
(0.00 v 4.10)
6.70
(-7.28 – 20.68)
53.50
(-9.33 – 82.13)
-11.36
(-68.26 – 45.54)
-0.58
(-3.46 – 2.31)
1.89
(0.08 – 43.78)
-0.09
QAIPPE 1.01
(0.00 –99.82)
0.150
(-14.35 – 14.64)
-2.59
(-51.42 – 35.67)
5.10
(-56.99 – 67.18)
0.26
(-2.89 – 3.40)
0.80
(0.03 – 19.59)
0.01
Material Deprivation Quintile
1.21
(0.00 – 5.43)
4.14
(-13.15 – 21.42)
10.08
(-46.68 – 49.65)
-4.84
(-28.13 – 18.45)
-0.25
(-1.12 – 0.63)
1.24
(0.51 – 3.01)
-0.04
Residential Instability Quintile
1.14
(0.00 – 11.52)
2.52
(-23.65 – 28.70)
15.96
(-42.81 – 55.05)
-5.73
(-47.85 – 36.39)
-0.29
(-2.42 – 1.84)
1.29
(0.15 – 11.39)
-0.03
PHU C: Small, urban/rural mix
Income Quintile
2.33
(1.42 – 3.24)
17.87
(5.89 – 29.84)
20.33
(-24.67 – 52.98)
-17.65
(-44.55 – 9.26)
-0.99
(-2.49 – 0.52)
3.23
(0.44 –23.63)
-0.15
QAIPPE 2.49
(1.50 – 3.47)
14.22
(3.19 – 25.26)
45.81
(6.32 – 70.09)
-20.53
(-31.29 – -9.78)
-1.15
(-1.75 – -0.55)
3.76
(1.53 – 9.22)
-0.18
Material Deprivation Quintile
1.94
(1.10 – 2.78)
10.94
(2.81 – 19.07)
34.92
(9.00 – 55.17)
-16.17
(-38.58 – 6.24)
-0.90
(-2.16 – 0.35)
2.61
(0.54 – 12.64)
-0.15
Residential Instability Quintile
1.51
(0.00 – 3.13)
8.37
(-4.35 – 21.08)
9.15
(-38.74 – 44.33)
-9.75
(-26.11 – 6.61)
-0.55
(-1.46 – 0.37)
1.76
(0.66 – 4.74)
-0.09
PHU D: Large, metro centre
Income Quintile
1.44
(0.29 – 2.59)
4.45
(-0.45 – 9.36)
39.20
(16.16 – 56.46)
-4.22
(-31.49 – 23.04)
-0.27
(-2.00 – 1.46)
1.29
(0.22 – 7.48)
-0.03
QAIPPE 1.56
(0.72 – 2.39)
5.73
(1.25 – 10.21)
34.51
(13.86 – 50.78)
-5.55
(-22.24 – 11.15)
-0.35
(-1.41 – 0.71)
1.42
(0.48 – 4.23)
-0.05
Material Deprivation Quintile
1.46
(0.29 – 2.63)
5.38
(-0.58 – 11.34)
25.42
(-3.43 – 47.17)
-6.76
(-13.98 – 0.46)
-0.43
(-0.89 – 0.03)
1.55
(0.96 – 2.50)
-0.07
Residential Instability Quintile
2.25
(1.52 – 2.98)
10.16
(4.74 – 15.58)
48.09
(16.42 – 68.24)
-10.18
(-21.91 – 1.55)
-0.65
(-1.39 – 0.10)
1.95
(0.85 – 4.47)
-0.09
*light green shading represents significant results

Summary Measures of Socioeconomic Inequalities in Health | 37
The summary measures were generally consistent with one another. In particular, the health
concentration index was highly consistent with the index of inequality measures. The PAF tended to be
less consistent with other summary measures of inequality. The SII as an absolute measure of inequality
showed similar results to the absolute difference but generally seemed to provide a higher value
compared to the absolute difference. The RIIratio appeared very unstable in measuring inequalities,
particularly when the difference in smoking rates between the most and least deprived group was very
high, such as for PHU A (Large, urban/rural mix). The DRR and RIIratio both represent a ratio of rates
between the most and least advantaged. The RIIratio generally overestimated inequality as compared to
the DRR. Significant health inequalities were found in Ontario across all summary measures and across
all measures of SES. The confidence intervals for the slope and relative index of inequality tended to be
wide as compared to the range measures. Therefore, fewer significant results were found according to
the index of inequality measures as compared to the range measures.
SUMMARY MEASURES ACROSS ONTARIO AND PHUs
For the province of Ontario, disparities in smoking rates, as measured by the DRR and AD, were
significant for all measures of SES. Differences in smoking rates ranged from 58% greater rates in the
most deprived as opposed to the least deprived quintile, or a difference in rates of 8.38 per 100
population, when measuring SES according to residential stability, to 82% greater rates in smoking, or an
increased rate of 11.43 per 100 population, in the most deprived quintile, when SES was measured
according to income quintile. According to the range measures, the greatest inequalities in smoking by
SES were observed in PHU A, with measured differences in smoking rates ranging from a 2.14 times
higher rate (in the most deprived as compared to the least deprived), or a difference in rates of 16.03
per 100 population, when SES was measured according to residential instability, to 5.77 times higher
smoking rates, or a difference of 31.76 per 100 population, when measured according to QAIPPE. Much
of the data for PHU B were not releasable due to extreme sampling variability and no significant
inequalities were found. Inequalities were found to be significant in PHU C (small, urban/rural mix) for
all measures of SES except residential instability. For PHU C, an approximate two fold increase in the
rate of smoking in the most deprived as opposed to the least deprived quintile was demonstrated for all
SES measures, with differences in rates between the least and most advantaged ranging from 8.37 per
100 population (by quintile of residential instability) to 17.87 per 100 population (by household income
quintile). The smallest values for health disparities were found in PHU D (Large, metro centre). However,
a large and significant value was found for residential instability, where those living in neighbourhoods
with the highest residential instability had over twice (i.e., 2.25) the smoking rate or a difference in rates
of 10.16 per 100 population, as compared to those living in neighbourhoods with the lowest residential
instability.
Across the PHUs, significant PAFs were found in PHU A for all measures of SES, except residential
instability which showed lower levels of inequality across all summary measures. For PHU C, PAF was
significant for QAIPPE and deprivation quintile, but not for income quintile, which was significant
according to the DRR and AD measures. For PHU D, PAF values were significant for all measures of SES
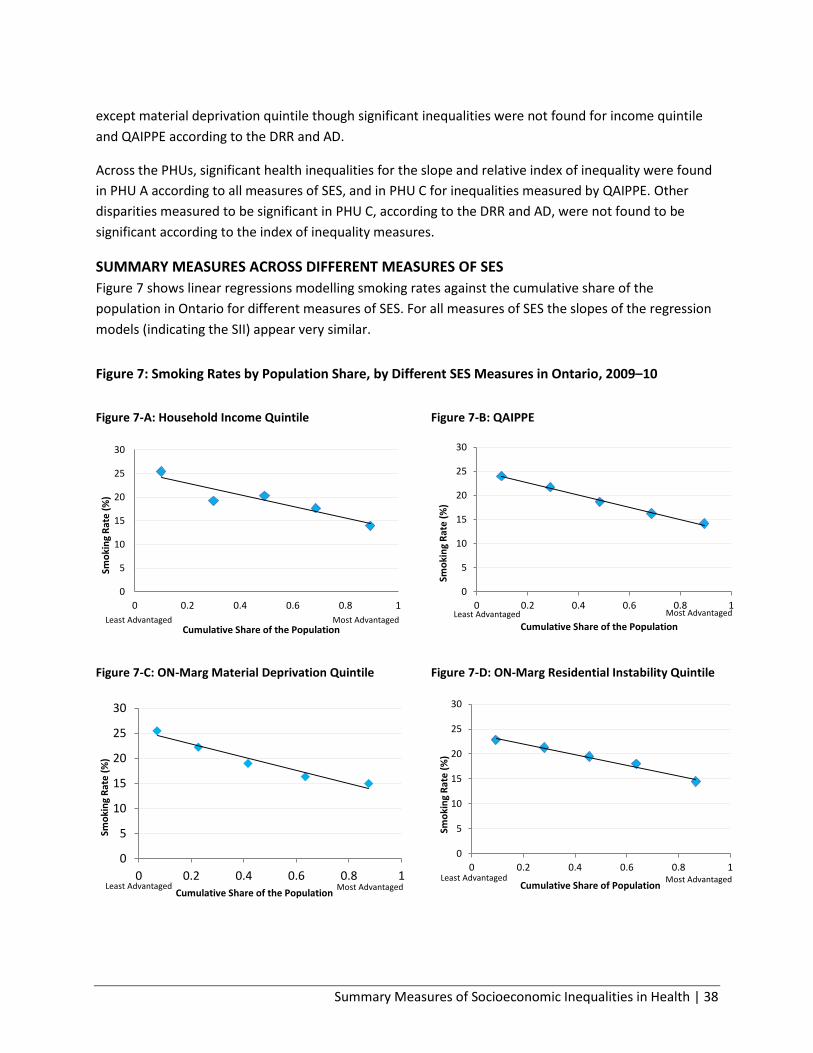
Summary Measures of Socioeconomic Inequalities in Health | 38
except material deprivation quintile though significant inequalities were not found for income quintile
and QAIPPE according to the DRR and AD.
Across the PHUs, significant health inequalities for the slope and relative index of inequality were found
in PHU A according to all measures of SES, and in PHU C for inequalities measured by QAIPPE. Other
disparities measured to be significant in PHU C, according to the DRR and AD, were not found to be
significant according to the index of inequality measures.
SUMMARY MEASURES ACROSS DIFFERENT MEASURES OF SES
Figure 7 shows linear regressions modelling smoking rates against the cumulative share of the
population in Ontario for different measures of SES. For all measures of SES the slopes of the regression
models (indicating the SII) appear very similar.
Figure 7: Smoking Rates by Population Share, by Different SES Measures in Ontario, 2009–10
Figure 7-A: Household Income Quintile
Figure 7-B: QAIPPE
Figure 7-C: ON-Marg Material Deprivation Quintile
Figure 7-D: ON-Marg Residential Instability Quintile
0
5
10
15
20
25
30
0 0.2 0.4 0.6 0.8 1
Smo
kin
g R
ate
(%
)
Cumulative Share of the Population Least Advantaged Most Advantaged
0
5
10
15
20
25
30
0 0.2 0.4 0.6 0.8 1
Smo
kin
g R
ate
(%
)
Cumulative Share of the Population Least Advantaged Most Advantaged
0
5
10
15
20
25
30
0 0.2 0.4 0.6 0.8 1
Smo
kin
g R
ate
(%
)
Cumulative Share of the Population Least Advantaged Most Advantaged
0
5
10
15
20
25
30
0 0.2 0.4 0.6 0.8 1
Smo
kin
g R
ate
(%
)
Cumulative Share of Population Least Advantaged Most Advantaged
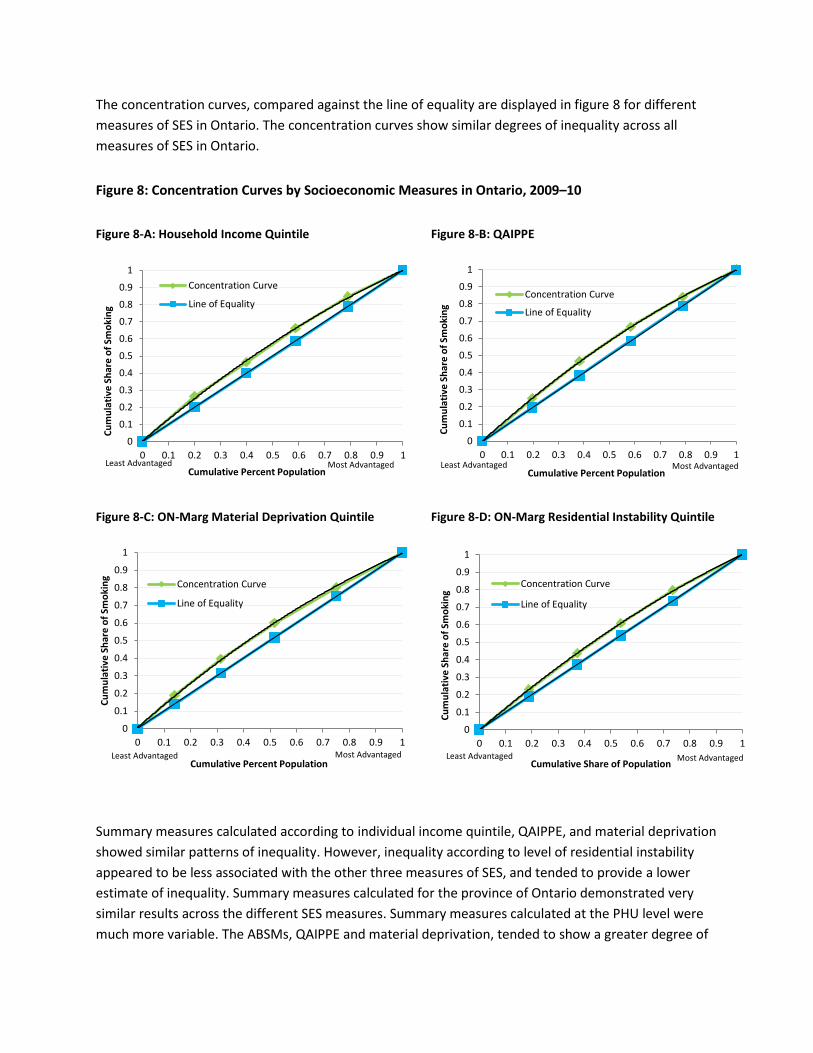
The concentration curves, compared against the line of equality are displayed in figure 8 for different
measures of SES in Ontario. The concentration curves show similar degrees of inequality across all
measures of SES in Ontario.
Figure 8: Concentration Curves by Socioeconomic Measures in Ontario, 2009–10
Figure 8-A: Household Income Quintile
Figure 8-B: QAIPPE
Figure 8-C: ON-Marg Material Deprivation Quintile
Figure 8-D: ON-Marg Residential Instability Quintile
Summary measures calculated according to individual income quintile, QAIPPE, and material deprivation
showed similar patterns of inequality. However, inequality according to level of residential instability
appeared to be less associated with the other three measures of SES, and tended to provide a lower
estimate of inequality. Summary measures calculated for the province of Ontario demonstrated very
similar results across the different SES measures. Summary measures calculated at the PHU level were
much more variable. The ABSMs, QAIPPE and material deprivation, tended to show a greater degree of
0
0.1
0.2
0.3
0.4
0.5
0.6
0.7
0.8
0.9
1
0 0.1 0.2 0.3 0.4 0.5 0.6 0.7 0.8 0.9 1
Cu
mu
lati
ve S
har
e o
f Sm
oki
ng
Cumulative Percent Population
Concentration Curve
Line of Equality
Least Advantaged Most Advantaged
0
0.1
0.2
0.3
0.4
0.5
0.6
0.7
0.8
0.9
1
0 0.1 0.2 0.3 0.4 0.5 0.6 0.7 0.8 0.9 1C
um
ula
tive
Sh
are
of
Smo
kin
g
Cumulative Percent Population
Concentration Curve
Line of Equality
Least Advantaged Most Advantaged
0
0.1
0.2
0.3
0.4
0.5
0.6
0.7
0.8
0.9
1
0 0.1 0.2 0.3 0.4 0.5 0.6 0.7 0.8 0.9 1
Cu
mu
lati
ve S
har
e o
f Sm
oki
ng
Cumulative Percent Population
Concentration Curve
Line of Equality
Least Advantaged Most Advantaged
0
0.1
0.2
0.3
0.4
0.5
0.6
0.7
0.8
0.9
1
0 0.1 0.2 0.3 0.4 0.5 0.6 0.7 0.8 0.9 1
Cu
mu
lati
ve S
har
e o
f Sm
oki
ng
Cumulative Share of Population
Concentration Curve
Line of Equality
Least Advantaged Most Advantaged

Summary Measures of Socioeconomic Inequalities in Health | 40
inequality compared to inequality measured by household income quintile; this result was shown
consistently for the QAIPPE measure but was more variable for inequality as measured by material
deprivation.
Analysis Limitations and Strengths
Limitations of the analysis include insufficient CCHS sample size to generate interpretable results for
some PHUs. For example, the datasets for PHU B (small population, sparsely populated urban/rural mix)
and PHU C (small population, urban/rural mix) contained 359 and 919 respondents respectively. The
number of smokers in each socioeconomic group was often small, particularly for the more advantaged
socioeconomic groups where smoking rates were low. For most data at the PHU level, high sampling
variability, (i.e., coefficient of variation>16.6) requires that results are interpreted with caution. For PHU
B, most smoking rates and measures of inequality were not releasable due to extreme sampling
variability (coefficient of variation >33.3).
The time period used to measure individual smoking (2009–10) is different from the time period used in
the calculation of the ABSMs (derived from the 2006 census). This is an important limitation which
reduces comparability between area based and individual measures of SES, as smoking rates have been
decreasing and individual level income may change over time. Another concern is the self-reported
nature of the data which could result in an under- or over-reporting bias. For example, due to social
desirability, people may under-report smoking habits. This could bias results if under-reporting of
smoking differs between socioeconomic groups. Another issue with the CCHS dataset is the high number
of subjects with missing information on income. For Ontario overall, information on income is missing
for 19% of respondents. This could importantly bias results if those with missing information on income
have characteristics which relate to risk of smoking. Those who did not provide information on income
were found to resemble those in more deprived income quintiles. However, all significant inequalities
found by household income quintile were also significant when measured by ABSMs, for which missing
information was not a major concern (missing information ranging from 0.2 – 0.8% of respondents).
This analysis did not adjust for potential confounders such as age, sex and ethnicity. However, socio-
demographic profiles showed that some of these variables differed between socioeconomic groups.
Some of these variables are shown in the literature to be related to increased risk of smoking, including
male sex, white ethnicity, and lower educational attainment.50,51,59-61 Therefore, confounding may
contribute to the relationship observed between SES and smoking. Future analyses could use age and
sex standardized rates when calculating summary measures of inequality as well as adjusting for other
potential confounders such as ethnicity. Calculation of the index of inequality measures rely on the
assumption of linearity. A linear association seems to hold for smoking rates by SES for Ontario.
However, at the PHU level, a linear model did not fit the data as well.
Strengths of this study include the large, representative sample size for Ontario. The larger sample size
allowed for sufficient power to detect significant inequalities by SES for the province of Ontario overall.

Summary Measures of Socioeconomic Inequalities in Health | 41
Because the CCHS data are representative at the PHU level, inferences could be made to PHUs. Another
strength of the study was the use of multiple measures of SES, which allowed for comparisons to be
made and potential biases to be identified relating to the use of area based SES data. Similarly, the use
of multiple summary measures of inequality allowed for comparisons and the identification of potential
biases relating to the use of the different summary measures.

Summary Measures of Socioeconomic Inequalities in Health | 42
Discussion
This report aimed to identify summary measures which could be used effectively in the identification of
health inequalities by SES. A review of the literature identified five commonly used summary measures
of health inequalities: the range, the PAF, the SII, the RII, and the HCI. All of these summary measures
have been employed in the scientific literature to measure health inequalities, as well as being identified
as important summary measure of health inequalities in reviews of the literature,3,5 and practical guides
by governing and surveillance bodies 1,8,47,62. The summary measures identified in this report are limited
to already available commonly used measures of health inequalities. However, each of these measures
has been well researched with a body of literature to support their use. Additionally, the common
strengths and limitations of these measures are well understood and therefore could be assessed in this
report.
Following the recommendation made by Keppel et al.,1 summary measures provided include both
absolute and relative measures of inequality to give a full description of the extent of inequalities.
Certain summary measures have absolute and relative forms (i.e., the range and the SII/RII).
Additionally, measures which would be relevant from a decision-makers perspective such as the PAF are
provided which give context to inequalities in health. As each summary measure has different strengths
and limitations in measuring inequalities, consideration should be given to providing more than one
summary measure, if possible. In particular, providing both an absolute and relative measure of
inequality provides a more complete understanding of the magnitude of the inequalities.1,5
Health inequalities were found to be significant across all summary measures for the province of Ontario
for all measures of SES. When applied to an analysis of smoking inequalities by SES in Ontario overall
and for selected PHUs of various sizes and geographies. Results suggest that the index of inequality
measures are very effective at identifying inequalities when the sample size is large and the average rate
of the health outcome is high. However, the more simple measures of inequality, such as the range,
effectively identify inequalities where the population is small and the rate of the health outcome is
lower.
Effect sizes were highly variable between different summary measures and different measures of SES.
This suggests that for PHUs with small populations, computing summary measures of inequality may
present a challenge. This problem may be overcome through combinations of CCHS cycles to achieve
greater sample sizes.
In general, the summary measures of inequality were found to be consistent with one another,
particularly, the slope and relative index of inequality and the HCI. This is expected as the index of
inequality measures and the HCI are related through a simple equation.3 Therefore, either of these
complex measures can be chosen to provide a more rigorous method of measuring health inequalities.
Choice of measure may depend on personal preference or the intention of the analysis. While, it is
easier to calculate measures of precision and control for confounding for the SII/RII measures, the HCI

Summary Measures of Socioeconomic Inequalities in Health | 43
provides a very effective visual display of inequalities. The range measures were also shown to be
consistent with the SII and the RIIratio. This relationship was observed despite the fact that the range
does not consider the distribution of the population across socioeconomic groups and the status of the
in-between socioeconomic groups.5,11 Because socioeconomic groups were divided into quintiles,
splitting the population of Ontario fairly equally between socioeconomic groups (though more
advantaged quintiles contained a larger proportion of the population when using the ON-Marg indexes),
differences between the range measures and the index of inequality measures were reduced. However,
the SII does seem to provide a higher estimate than the absolute difference even when the population
groups are roughly equivalent and when the health gradient is clearly linear. The RIIratio generally
provided a higher estimate than the DRR as predicted in the literature.1,48 . Another potential issue
arises from the use of the RIIratio which provided very unstable estimates when inequalities were large.
Therefore, caution is recommended when using the RIIratio as a summary measure of inequality. The PAF
was generally less consistent with other measures of inequality. Therefore, providing the PAF along with
another summary measure is important when describing inequalities.
There is a debate in the literature discussing whether ABSMs provide an appropriate proxy for individual
level socioeconomic information. As described by Geronimus and Bound,43,63 ABSMs can overestimate
individual level effects when there is an additional contextual effect of area level SES on health
outcomes. In this analysis, there was likely a strong contextual effect of area-level SES as ABSMs
generally provided a higher estimate as compared to individual-level effects. This effect was found
despite a possible non-differential misclassification bias, (i.e., area level deprivation does not always
correctly identify individual level deprivation), which would tend to bias results towards the null.43,63 The
strong effect of area level factors on smoking rates may reflect the heavy influence of social context and
peer groups on the decision to smoke.44 It is therefore clear that providing area-level information on SES
helps to inform the study of health inequalities. It also suggests that ABSMs can help to identify areas
where the population is at increased risk of poor health outcomes. Caution is advised when using ABSMs
as a proxy for individual level data, as differences in summary measures were observed.
Determining the presence of a health inequality is a first step in identifying an inequity. Examining the
causes and context of a health inequality can help to determine whether it is an inequity and whether it
is socially produced. Therefore, the technical process of measuring health inequalities is one step in
identifying a priority population, (i.e., a population at increased risk), for which to target public health
programs and services.
In conclusion, measuring health inequalities at the public health unit level is a first step in fulfilling the
OPHS requirements of identifying health inequalities and priority populations. Health inequalities can be
examined using various individual measures and area-based measures of SES.
Each of the summary measure of inequality displays a different dimension of inequality. The more
complex measures such as the slope and relative index of inequality and the HCI provide a more
accurate assessment of inequality as they consider the distribution of inequalities between
socioeconomic groups and the health outcomes in the middle income groups.3 These measures can be
used to compare inequalities over time and between populations with different socioeconomic

Summary Measures of Socioeconomic Inequalities in Health | 44
distributions. However, as demonstrated in this analysis, the more complex measures may fail to detect
an effect when sample sizes are small. The range and PAF measures are both quick and easy to calculate
and provide information that is easily interpretable for other public health professionals as well as
decision-makers. Visual displays of information, such as the concentration curve, may also be useful
when advising decision-makers and other public health professionals. The choice of methodology will
depend on a number of factors including the data available and the research question or intended
purpose of the analysis. This report explores the commonly used summary measures to aid public health
epidemiologists in establishing a sound scientific and technical process for analyzing inequalities. A
framework which aids in choosing measures, such as a decision-making table may be a future product
that can be used in the measure of inequalities at the provincial and PHU level.

Summary Measures of Socioeconomic Inequalities in Health | 45
References
1. Keppel K, Pamuk E, Lynch J, Carter-Pokras O, Kim I, Mays V, et al. Methodological issues in measuring health disparities. Vital Health Stat 2. 2005;2(141):1-16.
2. Denny K, Davidson MJ. Area-based socio-economic measures as tools for health disparities reseach, policy and planning. Can J Public Health. 2012;103(8):S4-6.
3. Wagstaff A, Paci P, van Doorslaer E. On the measurement of inequalities in health. Soc Sci Med. 1991;33(5):545-57.
4. World Health Organization [Internet]. Health impact assesment: glossary of terms used: Geneva, Switzerland; 2013 [cited February 8, 2013]. Available from: http://www.who.int/hia/about/glos/en/index1.html
5. Mackenbach JP, Kunst AE. Measuring the magnitude of socio-economic inequalities in health: An overview of available measures illustrated with two examples from Europe. Soc Sci Med. 1997;44(6):757-71.
6. Matheson FI, Dunn JR, Smith KLW, Moineddin R, Glazier RH. Development of the Canadian marginalization index: A new tool for the study of inequality. Can J Public Health. 2012;103 Suppl 2:S12-.
7. Wilkins R. PCCF + version 5F: User's guide. Ottawa:, ON: Statistics Canada; 2010 [cited 2013 Apr 17]. Available from: http://abacus.library.ubc.ca/bitstream/10573/42738/3/MSWORD.PCCF5K.pdf
8. Canadian Institute for Health Information; Statistics Canada. Health indicators 2011: definitions, data sources and rationale. Ottawa, ON: CIHI; 2011 [cited 2013 Apr 17]. Available from: https://goto.oahpp.ca/areas/ke/libraryteamsite/Published/Referencing%20Guide%20Vancouver%202011.pdf
9. Ministry of Health and Long-Term Care. Ontario public health standards. Toronto, ON: Queen`s Printer for Ontario; 2008 [cited 2013 Apr 17]. Available from: http://www.health.gov.on.ca/en/pro/programs/publichealth/oph_standards/docs/ophs_2008.pdf.
10. Labrosse, E, Laclé S, Isabelle M, Snelling S, Warren C, Westhave S. Sudbury & district health unit OPHS planning path: Pilot version for 2010 planning. Sudbury: Sudbury & District Health Unit; 2009 [cited 2013 June 7]. Available from: http://www.phred-redsp.on.ca/Docs/Reports/OPHSPlanningPath.pdf
11. Pamuk ER. Social class inequality in mortality from 1921 to 1972 in England and Wales. Popul Stud (Camb). 1985;39(1):17-31.
12. Kunst AE, Geurts JJ, van den Berg J. International variation in socioeconomic inequalities in self reported health. J Epidemiol Commun H. 1995;49(2):117-23.
13. Low A, Low A. Measuring the gap: Quantifying and comparing local health inequalities. J Public Health. 2004;26(4):388-95.

Summary Measures of Socioeconomic Inequalities in Health | 46
15. Commission on Social Determinants of Health. Closing the gap in a generation: Health equity through action on the social determinants of health. Final report of the commission on social determinants of health. Geneva: World Health Organization; 2008 [cited 2013 May 31]. Available from: http://www.who.int/social_determinants/thecommission/finalreport/en/index.html
16. Department of Health and Social Security. Inequalities in health: report of a research working group. London: Alexander Fleming House; 1980.
17. Marmot MG. Social determinants of health inequalities. Lancet. 2005;365(9464):1099-104.
18. Braveman P, Gruskin S. Defining equity in health. J Epidemiol Comm H. 2003;57(4):254-8.
19. Whitehead M. The concepts and principles of equity and health. Int J Health Serv. 1992;22(3):429-45.
20. Kawachi I, Subramanian SV, Almeida-Filho N. A glossary for health inequalities. J Epidemiol Commun H. 2002;56(9):647-52.
21. Braveman PA. Monitoring equity in health and healthcare: A conceptual framework. J Health Popul Nutr. 2003;21(3):181-92.
22. Mackenbach JP. Socio-economic health differences in the Netherlands: A review of recent empirical findings. Soc Sci Med. 1992;34(3):213-26.
23. Pamuk ER. Social-class inequality in infant mortality in England and Wales from 1921 to 1980. European Journal of Population / Revue Européenne de Démographie. 1988;4(1):1-21.
24. Public Health Agency of Canada. The chief public health officer's report on the state of public health in Canada . Ottawa, ON: Queen’s Printer; 2008 [cited 2012 Apr 17]. Available from: http://www.phac-aspc.gc.ca/cphorsphc-respcacsp/2008/fr-rc/pdf/CPHO-Report-e.pdf
25. Pan-Canadian Public Health Network. Indicators of health inequalities.; 2009 [cited 2012 Apr 17]. Available from: http://www.phn-rsp.ca/pubs/ihi-idps/pdf/Indicators-of-Health-Inequalities-Report-PHPEG-Feb-2010-EN.pdf
26. Schutte S, Chastang JF, Parent-Thirion A, Vermeylen G, Niedhammer I. Social differences in self-reported health among men and women in 31 countries in Europe. Scand J Public Health. 2013;41(1):51-7.
27. Heitmann BL. Occurrence and development of overweight and obesity among adult Danes aged 30-60 years. Ugeskr Laeger. 1999;161(31):4380-4.
28. Moyses SJ. Inequalities in oral health and oral health promotion. Braz Oral Res. 2012;26 Suppl 1:86-93.
29. Brownell MD, Derksen SA, Jutte DP, Roos NP, Ekuma O, Yallop L. Socio-economic inequities in children's injury rates: Has the gradient changed over time? Can J Public Health. 2010;101 Suppl 3:S28-31.
30. Burrows S, Auger N, Gamache P, St-Laurent D, Hamel D. Influence of social and material individual and area deprivation on suicide mortality among 2.7 million Canadians: A prospective study. BMC Public Health. 2011;11(577).
31. Hawkins NM, Jhund PS, McMurray JJ, Capewell S. Heart failure and socioeconomic status: Accumulating evidence of inequality. Eur J Heart Fail. 2012;14(2):138-46.

Summary Measures of Socioeconomic Inequalities in Health | 47
32. Hosseinpoor AR, Bergen N, Mendis S, Harper S, Verdes E, Kunst A, et al. Socioeconomic inequality in the prevalence of noncommunicable diseases in low- and middle-income countries: Results from the world health survey. BMC Public Health. 2012;12(474).
33. Lumme S, Sund R, Leyland AH, Keskimaki I. Socioeconomic equity in amenable mortality in Finland 1992-2008. Soc Sci Med. 2012;75(5):905-13.
34. Geronimus AT. Invited commentary: Using area-based socioeconomic measures--think conceptually, act cautiously. Am J Epidemiol. 2006;164(9):835,40; discussion 841-3.
35. Hosseinpoor AR, Stuart Williams JA, Lynn I, Chatterji, S. Socioeconomic inequality in domains of health: Results from the world health surveys. Geneva: World Health Organization;2012 [cited 2013, May 31].
36. Lumme S, Leyland AH, Keskimaki I. Multilevel modeling of regional variation in equity in health care. Med Care. 2008;46(9):976-83.
37. Pampalon R, Hamel D, Gamache P. A comparison of individual and area-based socio-economic data for monitoring social inequalities in health. Health Rep. 2009;20(4):85-94.
38. O'Donnell O, van Doorslaer E, Wagstaff A, Lindelow M. Analyzing health equity using household survey data. Washington D.C.: The World Bank; 2008 [cited 2013 Apr 17]. Available from: http://siteresources.worldbank.org/INTPAH/Resources/Publications/459843-1195594469249/HealthEquityFINAL.pdf
39. Subramanian SV, Chen JT, Rehkopf DH, Waterman PD, Krieger N. Comparing individual- and area-based socioeconomic measures for the surveillance of health disparities: A multilevel analysis of Massachusetts births, 1989-1991. Am J Epidemiol. 2006;164(9):823-34.
40. Mikkonen J, Raphael D. Social determinants of health: The Canadian facts. Toronto: York University School of Health Policy and Management; 2010 [cited 2013, May 31]. Available from: http://www.thecanadianfacts.org/The_Canadian_Facts.pdf
41. Walker AE, Becker NG. Health inequalities across socio-economic groups: Comparing geographic-area-based and individual-based indicators. Public Health. 2005;119(12):1097-104.
42. Statistics Canada. Census dictionary, census year 2011. Ottawa, ON: Minister of Industry; 2011 [cited 2013 Apr 17]. Available from: http://www12.statcan.gc.ca/census-recensement/2011/ref/dict/98-301-X2011001-eng.pdf
43. Holowaty E, Norwood T, Wanigaratne S, Abellan J, Beale L. Feasibility and utility of mapping disease risk at the neighbourhood level within a Canadian public health unit: An ecological study. Intl J Health Geogr. 2010;9(1):21.
44. Geronimus AT, Bound J. Use of census-based aggregate variables to proxy for socioeconomic group: Evidence from national samples. Am J Epidemiol. 1998;148(5):475-86.
45. U.S. Department of Health and Human Services. Preventing tobacco use among young people: A report of the surgeon general. Washington D.C.: U.S. Department of Health and Human Services; Public Health Service; Centers for Disease Control and Prevention; National Centre for Chronic Disease Prevention and Health Promotion; Office on Smoking and Health; 1994 [cited 2013 Apr 17]. Available from: http://profiles.nlm.nih.gov/NN/B/C/F/T/_/nnbcft.pdf
46. Gamache P, Pampalon R, Hamel D. The material and social deprivation index: A summary. Institut National de Santé Publique de Québec; 2010 [cited 2013 May 30]. Available from: http://www.inspq.qc.ca/santescope/documents/Guide_Metho_Indice_defavo_Sept_2010_A.pdf

Summary Measures of Socioeconomic Inequalities in Health | 48
47. Schneider MC, Castillo-Salgado C, Bacallao J, Loyola E, Mujica OJ, Vidaurre M, et al. Methods for measuring inequalities in health. Rev Panam Salud Publica. 2002;12(6):398-414.
48. Munoz-Arroyo R, Sutton M. Measuring socio-economic inequalities in health: A practical guide. Glasgow, Scotland: Scotland Public Health Observatory; 2007 [cited 2013 Apr 17]. Available from: http://www.scotpho.org.uk/downloads/scotphoreports/scotpho071009_measuringinequalities_rep.pdf
49. Cheng NF, Han PZ, Gansky SA. Methods and software for estimating health disparities: The case of children's oral health. Am J Epidemiol. 2008;168(8):906-14.
50. Koolman X, van Doorslaer E. On the interpretation of a concentration index of inequality. Health Econ. 2004;13(7):649-56.
51. Cavelaars AE, Kunst AE, Geurts JJ, Crialesi R, Grotvedt L, Helmert U, et al. Educational differences in smoking: International comparison. BMJ. 2000;320(7242):1102-7.
52. Huisman M, Kunst AE, Mackenbach JP. Educational inequalities in smoking among men and women aged 16 years and older in 11 European countries. Tob Control. 2005;14(2):106-13.
53. Jarvis M, Wardle J. Social patterning of individual health behaviours: The case of cigarette smoking. In: Marmot M, Wilkinson R, editors. Social determinants of health. Oxford: Oxford University Press; 2006. p. 225-37.
54. Adler NE, Boyce WT, Chesney MA, Folkman S, Syme SL. Socioeconomic inequalities in health. No easy solution. JAMA. 1993;269(24):3140-5.
55. Huisman M, Kunst AE, Bopp M, Borgan J, Borrell C, Costa G, et al. Educational inequalities in cause-specific mortality in middle-aged and older men and women in eight western European populations. Lancet;365(9458):493-500.
56. Jha P, Peto R, Zatonski W, Boreham J, Jarvis MJ, Lopez AD. Social inequalities in male mortality, and in male mortality from smoking: Indirect estimation from national death rates in England and Wales, Poland, and North America. Lancet. 2006;368(9533):367-70.
57. Statistics Canada. Canadian community health survey (CCHS) annual component: User guide 2010 and 2009-2010 microdata files. Ottawa, ON: Statistics Canada; 2011 [cited 2013 Apr 17]. Available from: http://www23.statcan.gc.ca/imdb-bmdi/pub/document/3226_D7_T9_V8-eng.htm#a1
58. Matheson,F.I. Dunn, J.R. Smith, K.L.W. Moineddin, R. Glazier, R.H. ON-Marg user guide: version 1.0. Toronto, ON: Centre for Research on Inner City Health; 2011 [cited 2013 Apr 17]. Available from: http://www.crunch.mcmaster.ca/documents/ON-Marg_user_guide_1.0_FINAL_MAY2012.pdf
59. Statistics Canada [homepage on the Internet]. Ottawa. Health profile; 2013 [cited March 8, 2013]. Available from: http://www12.statcan.gc.ca/health-sante/82-228/search-recherche/lst/page.cfm?Lang=E&GeoLevel=PR&GeoCode=35.
60. Bergen AW, Caporaso N. Cigarette smoking. J Natl Cancer I. 1999;91(16):1365-75.
61. Novotny TE, Warner KE, Kendrick JS, Remington PL. Smoking by blacks and whites: Socioeconomic and demographic differences. Am J Public Health. 1988;78(9):1187-9.
62. Tucker JS, Ellickson PL, Klein DJ. Predictors of the transition to regular smoking during adolescence and young adulthood. J Adolescent Health. 2003;32(4):314-24.
Summary Measures of Socioeconomic Inequalities in Health | 49
64. Baker A, Fryers P, Fitzpatrick J, Jephson D. Health inequality indicators for local authorities and primary care organisations: Guide to interpretation. London: Association of Public Health Observatories; 2011 [cited 2013 May 28]. Available from: www.apho.org.uk/resource/view.aspx?RID=110505
65. Geronimus AT, Bound J, Neidert LJ. On the validity of using census geocode characteristics to proxy individual socioeconomic characteristics. J Am Stat Assoc. 1996;91(434):529-37.
66. Kakwani N, Wagstaff A, van Doorslaer E. Socioeconomic inequalities in health: Measurement, computation, and statistical inference. J Econ. 1997;77(1):87-103.

Summary Measures of Socioeconomic Inequalities in Health | 50
Appendix A: Literature Review Search Strategy
Search strategy: MEDLINE (indexed records)
# Searches Results
1 Socioeconomic Factors/ or Health Status Disparities/ or Healthcare Disparities/ or Social Justice/ or Vulnerable Populations/ or Minority Groups/
128020
2 *Health Status Indicators/ or *Population Surveillance/methods or *Statistics as Topic/ or *Health Surveys/methods
31252
3 1 and 2 1684
4 *Socioeconomic Factors/ or *Health Status Disparities/ or *Healthcare Disparities/ or *Social Justice/ or *Vulnerable Populations/ or *Minority Groups/
25648
5 Health Status Indicators/ or Population Surveillance/methods or Statistics as Topic/ or Health Surveys/methods
97781
6 4 and 5 1179
7 3 or 6 2238
8 ("News" or "Letter" or "Comment" or "Editorial").pt. 1348738
9 exp Africa/ or exp Asia/ or exp Caribbean Region/ or exp Central America/ or exp Gulf of Mexico/ or exp Latin America/ or exp South America/ or exp Europe, Eastern/
865905
10 8 or 9 2157748
11 7 not 10 1466
12 limit 11 to english language 1312

Summary Measures of Socioeconomic Inequalities in Health | 51
Search strategy: MEDLINE (non-indexed records)
# Searches Results
1
(((health or social or socioeconomic$ or economic$ or access$ or service$ or impact$ or intervention$) adj3 (equalit$ or equit$ or determinant$ or disparit$ or inequality$ or inequit$)) or ((priorit$ or minorit$ or vulnerab$ or disadvantage$ or marginal$ or underserv$ or under-serv$ or depriv$ or high risk or hard-to-reach) adj3 (group$ or population$))).mp.
75783
2
(indicator$ or measure$ or monitor$ or metric$ or index$ or indices or instrument$1 or variable$ or surveillance).ti. or (indicator$ or measure$ or monitor$ or metric$ or index$ or indices or instrument$1 or variable$ or surveillance).ab. /freq=3
816203
3 1 and 2 6554
4 limit 3 to ("in data review" or in process or "pubmed not medline") 416
5 limit 4 to english language 397

Summary Measures of Socioeconomic Inequalities in Health | 52
Search terms: health equity and indicators
Indicators Health equity
MEDLINE subject headings (MeSH)
Health Status Indicators/
Health Surveys/
Population Surveillance/methods
Statistics as Topic/
Socioeconomic Factors/
Health Status Disparities/
Healthcare Disparities/
Social Justice/
Vulnerable Populations/
Minority Groups/
Keywords indicator$
measure$
monitor$
metric$
index$
indices
instrument$1
variable$
surveillance
equalit$
equit$
determinant$
disparit$
inequality$
inequit$
disadvantage$
priorit$
minorit$
marginal$
underserv$
under-serv$
vulnerab$
minority group
depriv$
hard-to-reach
high risk

Summary Measures of Socioeconomic Inequalities in Health | 53
Appendix B: Excel SES Summary Measure Calculator
The ScotPHO Excel program uses data on rates of a health outcome by SES group to calculate summary
measures of inequality. This program analyzes populations divided into five SES groups.
Data is entered in the Data Tab on the first page of the program. Data should be entered according to
SES quintile with the most deprived quintile entered at the top and the least deprived quintile at the
bottom. Variables in the data tab include: population size per SES quintile, which should be weighted to
account for the total population represented by the quintile, number of respondents with a particular
health outcome, though this data is not used in calculations of the summary measures, and rates of the
health outcome by population group, this data should be calculated with complex survey designs
accounted for, and could be age and sex standardized.47 Additionally, one should enter the total number
experiencing the health outcome in the population.
The population by quintile should be entered under “Pop” in column C, the number of respondents
experiencing the health outcome in column D, and the rate of the health outcome per 100 people under
“Rates/100ppl” in column E. The total number of experiencing the health outcome should be entered in
cell D12, and the overall rate of the health outcome in the population in cell E10.

Summary Measures of Socioeconomic Inequalities in Health | 54
Figure B1: Data Tab, Ontario 2009–10 by QAIPPE
Following entry of the data, a bar graph will be produced demonstrating the rate of the health outcome
by SES quintile and summary measures will be calculated under the different tabs. The Range tab
calculates the disparity rate ratio and the absolute difference, the Population Attributable Fraction tab
calculates the population attributable fraction and the total number attributable, the SII & RII tab
calculates the SII, the RIImean and the RIIratio, and the Concentration Index tab calculates the
concentration index and the percent redistribution. Graphical displays of the data are found on the SII &
RII tab, displaying a scatter plot of the data with a linear trend line, as well as the Concentration Index
tab, displaying the health concentration curve as well as the line of equality. The Summary tab displays
all summary measures calculated.

Summary Measures of Socioeconomic Inequalities in Health | 55
Figure B2: Concentration Index Tab, Ontario 2009–10 by QAIPPE
Figure B3: Summary Data Tab, Ontario 2009–10 by QAIPPE

Summary Measures of Socioeconomic Inequalities in Health | 56
Appendix C: Working Application Results – Demographic Profiles
Tables C4: Demographic Characteristics of SES Measures in Ontario, 2009–10
Tables C4-A: Individual Household Income Quintile
Individual Household Income Quintile
Q1
Least Advantaged
Q2 Q3 Q4
Q5
Most Advantaged
Not Stated
Average
Population Proportion (%)
16 16 15 16 17 19 100
(Overall)
Age (Average) 44 45 43 42 44 43 44
Sex-Male (%) 43 47 50 53 55 46 49
Ethnicity-White (%) 57 67 79 85 90 59 72
Immigrant (%) 47 40 29 22 18 33 31
Married (%) 40 52 54 57 65 44 52
Urban (%) 90 87 83 82 71 82 82
Post-secondary (%) 50 57 64 71 80 46 61
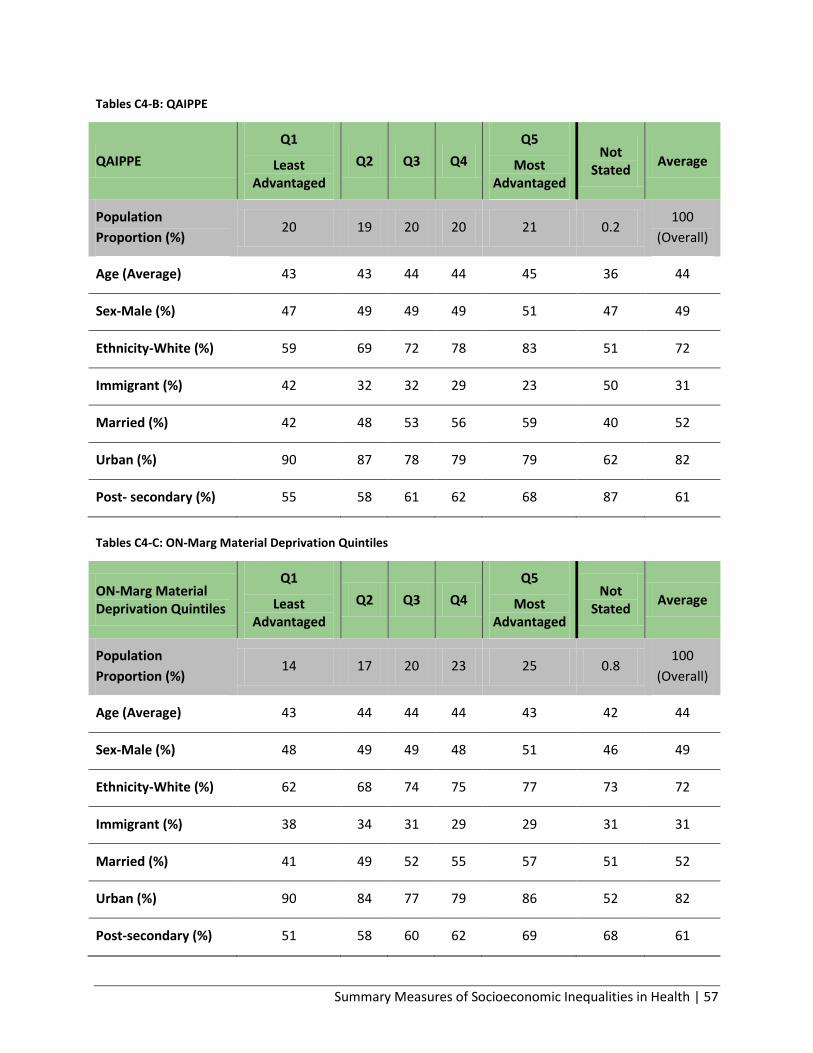
Summary Measures of Socioeconomic Inequalities in Health | 57
Tables C4-B: QAIPPE
Tables C4-C: ON-Marg Material Deprivation Quintiles
QAIPPE
Q1
Least Advantaged
Q2 Q3 Q4
Q5
Most Advantaged
Not Stated
Average
Population
Proportion (%) 20 19 20 20 21 0.2
100
(Overall)
Age (Average) 43 43 44 44 45 36 44
Sex-Male (%) 47 49 49 49 51 47 49
Ethnicity-White (%) 59 69 72 78 83 51 72
Immigrant (%) 42 32 32 29 23 50 31
Married (%) 42 48 53 56 59 40 52
Urban (%) 90 87 78 79 79 62 82
Post- secondary (%) 55 58 61 62 68 87 61
ON-Marg Material Deprivation Quintiles
Q1
Least Advantaged
Q2 Q3 Q4
Q5
Most Advantaged
Not Stated
Average
Population
Proportion (%) 14 17 20 23 25 0.8
100
(Overall)
Age (Average) 43 44 44 44 43 42 44
Sex-Male (%) 48 49 49 48 51 46 49
Ethnicity-White (%) 62 68 74 75 77 73 72
Immigrant (%) 38 34 31 29 29 31 31
Married (%) 41 49 52 55 57 51 52
Urban (%) 90 84 77 79 86 52 82
Post-secondary (%) 51 58 60 62 69 68 61
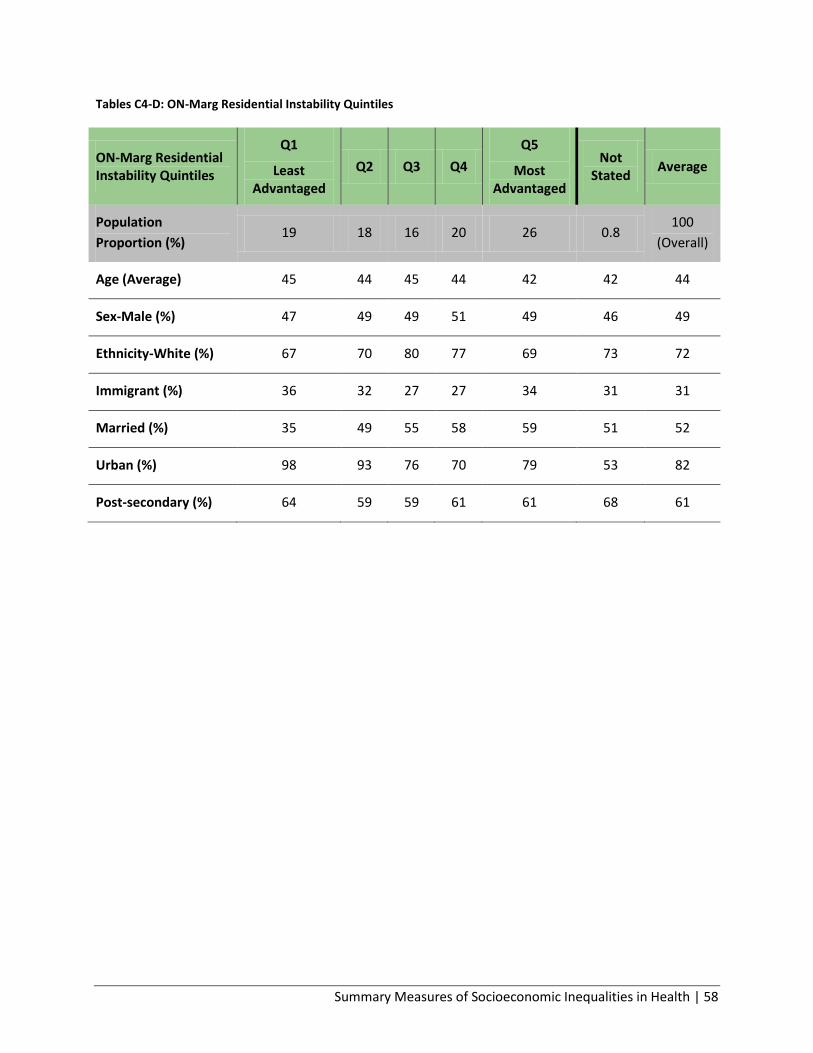
Summary Measures of Socioeconomic Inequalities in Health | 58
Tables C4-D: ON-Marg Residential Instability Quintiles
ON-Marg Residential Instability Quintiles
Q1
Least Advantaged
Q2 Q3 Q4
Q5
Most Advantaged
Not Stated
Average
Population
Proportion (%) 19 18 16 20 26 0.8
100
(Overall)
Age (Average) 45 44 45 44 42 42 44
Sex-Male (%) 47 49 49 51 49 46 49
Ethnicity-White (%) 67 70 80 77 69 73 72
Immigrant (%) 36 32 27 27 34 31 31
Married (%) 35 49 55 58 59 51 52
Urban (%) 98 93 76 70 79 53 82
Post-secondary (%) 64 59 59 61 61 68 61

Summary Measures of Socioeconomic Inequalities in Health | 59
Appendix D: Working Application Results – Smoking Rates by SES group
Table D5: Rates of smoking by socioeconomic group and by public health unit, 2009–10
Table D5-A: Smoking Rates by Individual Household Income Quintile
Smoking Rates by Individual Household Income Quintile
Q1% (95% CI)
Q2% (95% CI)
Q3% (95% CI)
Q4% (95% CI)
Q5% (95% CI)
PHU A, Large urban/rural mix
28.9
(20.5 – 37.3)
27.9
(19.2 – 36.6)
21.1
(13.6 – 28.6)
20.3
(13.8 – 26.8)
7.5
(3.7 – 11.2)
PHU B, Sparsely populated urban/rural mix
** 34.2
(15.0 – 53.4) **
23.7
(9.2 – 38.1) **
PHU C, Small urban/rural mix
31.3
(22.6 – 39.9)
17.0
(9.1 – 24.8)
15.4
(7.5 – 23.3)
13.2
(5.5 – 21.0)
13.4
(5.1 – 21.7)
PHU D, Large metro centre
14.5
(11.0 – 18.0)
20.6
(15.7 – 25.6)
22.3
(16.6 – 27.9)
16.5
(10.0 – 23.0)
10.1
(6.7 – 13.5)
Ontario 25.4
(23.6 – 27.2)
19.2
(17. 6 – 20.8)
20.3
(18.5 – 22.1)
17.7
(16.0 – 19.4)
14.0
(12.8 – 15.1)

Summary Measures of Socioeconomic Inequalities in Health | 60
Table D5-B: Smoking Rates by QAIPPE
Smoking Rates by QAIPPE
Q1% (95% CI)
Q2% (95% CI)
Q3% (95% CI)
Q4% (95% CI)
Q5% (95% CI)
PHU A, Large urban/rural mix
38.4
(28.8 – 48.0)
26.3
(18.3 – 34.3)
12.7
(7.8 – 17.6)
16.4
(8.8 – 24.0)
6.7
(4.0 – 9.3)
PHU B, Sparsely populated urban/rural mix
21.4
(11.2 – 31.6) ** ** **
21.2
(10.9 – 31.6)
PHU C, Small urban/rural mix
23.8
(14.4 – 33.2)
23.7
(12.7 – 34.8)
19.4
(12.0 – 26.8) **
9.6
(3.8 – 15.4)
PHU D, Large metro centre
16.1
(12.8 – 19.3)
18.25
(13.8 – 22.7)
17.6
(11.3 – 23.9)
17.4
(12.7 – 22.2)
10.3
(7.3 – 13.4)
Ontario 24.0
(22.3 – 25.7)
21.7
(20.0 – 23.3)
18.6
(17.0 – 20.2)
16.2
(14.8 – 17.6)
14.1
(12.7 – 15.5)
Table D5-C: Smoking Rates by ON-Marg Material Deprivation Quintile
Smoking Rates by ON-Marg Material Deprivation Quintile
Q1% (95% CI)
Q2% (95% CI)
Q3% (95% CI)
Q4% (95% CI)
Q5% (95% CI)
PHU A, Large urban/rural mix
46.6
(36.1 – 57.0)
27.9
(19.3 – 36.6)
19.8
(12.0 – 27.7)
10.7
(6.5 – 14.9)
10.1
(5.3 – 15.0)
PHU B, Sparsely populated urban/rural mix
24.1
(11.9 – 36.3)
19.9
(9.9 – 29.9) ** -
20.0
(7.7 – 32.3)
PHU C, Small urban/rural mix
22.6
(15.9 – 29.2)
20.9
(11.3 – 30.5)
27.5
(16.0 – 39.0)
16. 7
(6.5 – 26.9)
11.6
(7.0 – 16.3)
PHU D, Large metro centre
17.1
(13.0 – 21.2)
18.2
(14.0 – 22.5)
15.4
(11.4 – 19.4)
15.2
(10.3 – 20.0)
11.7
(7.4 – 16.0)
Ontario 25.5
(23.4 – 27.5)
22.2
(20.6 – 23.9)
19.0
(17.5 – 20.4)
16.3
(14.9 – 17.8)
14.9
(13.5 – 16.4)

Summary Measures of Socioeconomic Inequalities in Health | 61
Table D5-D: Smoking Rates by ON-Marg Residential Instability
Smoking Rates by ON-Marg Residential Instability
Q1% (95% CI)
Q2% (95% CI)
Q3% (95% CI)
Q4% (95% CI)
Q5% (95% CI)
PHU A, Large urban/rural mix
30.1
(21.4 – 38.9)
23.2
(15.9 – 30.5)
19.8
(10.2 – 29.4)
11.8
(6.6 – 17.0)
14.1
(7.9 – 20.3)
PHU B, Sparsely populated urban/rural mix
** 34.5
(14.2 – 54.7)
16.2
(8.1 – 24.4) **
18.7
(6.9 – 30.5)
PHU C, Small urban/rural mix
24.6
(15.7 – 33.5)
17.3
(6.2 – 28.4)
15.6
(7.3 – 23.9)
15.0
(8.1 – 22.0)
16.3
(7.2 – 25.3)
PHU D, Large metro centre
18.3
(14.7 – 21.9)
15.7
(12.2 – 19.1)
16.5
(11.0 – 21.9)
14.0
(9.1 – 18.9)
8.2
(4.1 – 12.2)
Ontario 22.8
(20.8 – 24.8)
21.3
(19.7 – 22.8)
19.5
(17.9 – 21.0)
18.0
(16.5 – 19.5)
14.5
(13.2 – 15.8)
Q1 represents the most advantaged quintile, Q5 represents the least advantaged quintile light green
shading indicates high sampling variability CV (16.6-33.3),
** data suppressed due to extreme sampling variability (CV>33.3)

Public Health Ontario
480 University Avenue, Suite 300,
Toronto, Ontario
M5G 1V2
647.260.7100
www.publichealthontario.ca