Embed Size (px)
Citation preview


Summary information of
vehicles fitted & registered with
PF2 units
2
Reports home page show ALL PF2
reports available : access restricted by PF2 service selected
& by PF2 version installed
Fleet Overview shows key fleet performance
indicators affecting fleets – Cost, Risk and Environmental impact. 20 of 46

Every key area (Cost, Risk, Footprint) has an overview page graphically summarising each report available on the left hand menu. Clicking a chart will allow you to “drill-down” to the underlying report data
3
21 of 46

A summary of vehicles where harsh acceleration events have been reported + the severity of the worst event for each vehicle. Harsh acceleration has a very significant effect on fuel consumption and consequently has an impact on your fleet costs.
4
Each report column is sortable
Specific date ranges can be selected for reports
and downloaded in CSV, Excel or PDF format
22 of 46

Summary of vehicles with harsh braking events + severity of the worst event for each of the listed vehicles. Harsh braking has a very significant effect on fuel consumption. Driving more smoothly saves fuel and therefore, money
5
23 of 46

This highlights all idling events in the current month + the severity of the worst event for each of the listed vehicles. When an engine is idling it’s wasting fuel.
6
24 of 46

A summary of vehicles with relevant speed events + the severity of the worst event for each vehicles. Driving above the speed limit is illegal, but also means more fuel is used. Staying within the 70mph speed limit on motorways can bring savings of around 10% for your fuel bill compared to driving at 80mph.
7
25 of 46

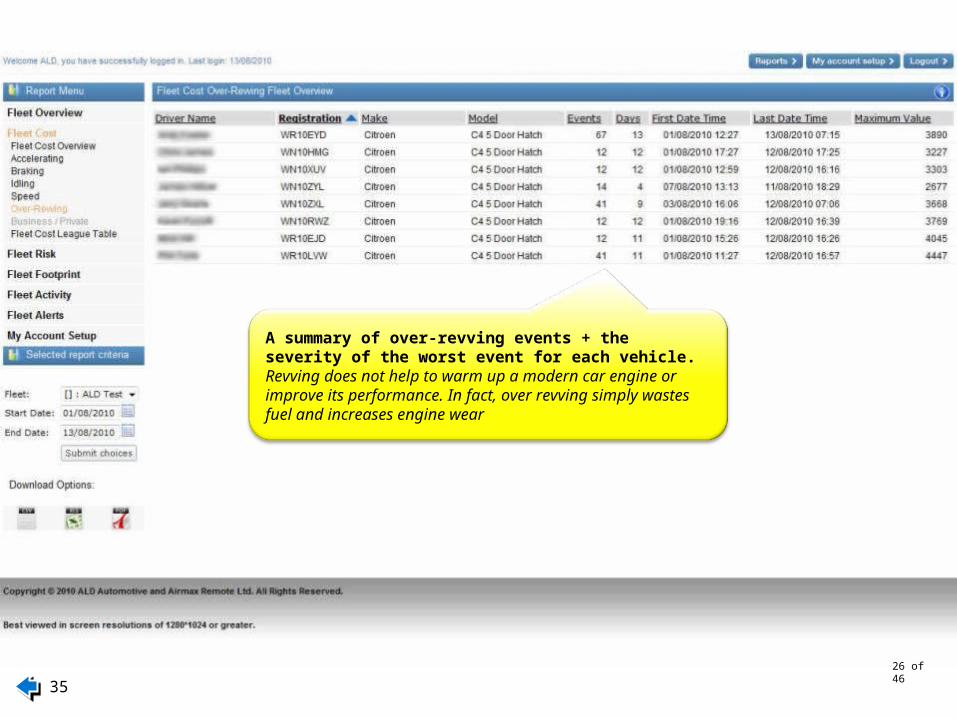
A summary of over-revving events + the severity of the worst event for each vehicle. Revving does not help to warm up a modern car engine or improve its performance. In fact, over revving simply wastes fuel and increases engine wear
8
26 of 46

A summary identifying relative performance of each driver & their impact on a fleet’s overall total cost index (TCI). Allows you to reward the best performing drivers and review the driving styles of those who are not performing well and reduce cost to thebusiness.
9
27 of 46
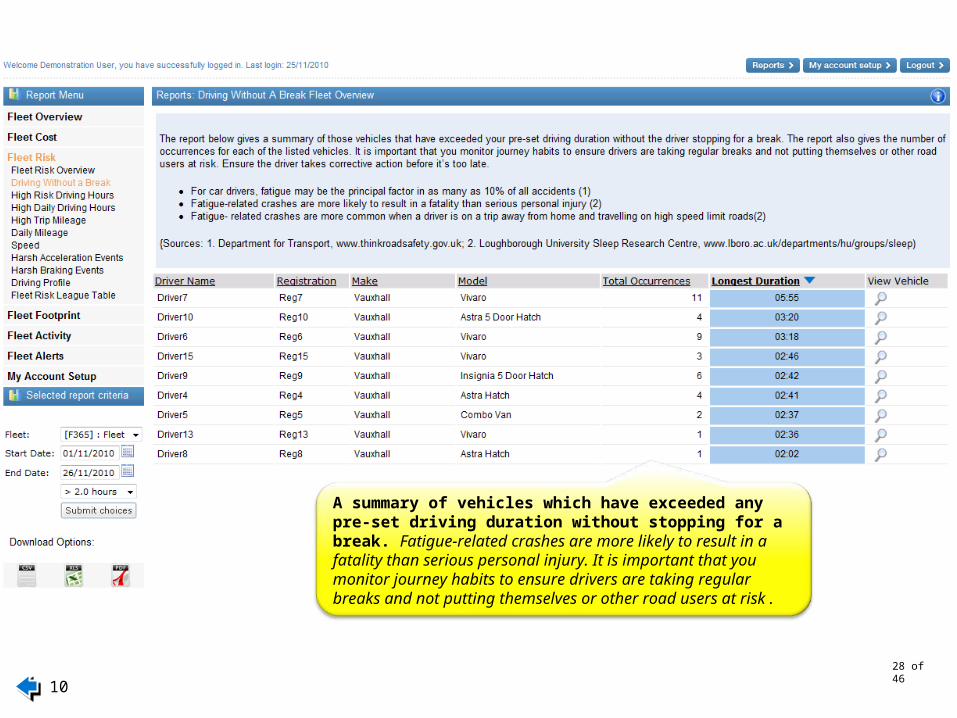
A summary of vehicles which have exceeded any pre-set driving duration without stopping for a break. Fatigue-related crashes are more likely to result in a fatality than serious personal injury. It is important that you monitor journey habits to ensure drivers are taking regular breaks and not putting themselves or other road users at risk .
10
28 of 46

A summary of vehicles which have driven during any pre-set ‘high risk’ hours + the severity of the worst event for each of the listed vehicles. One of the most common times for drivers (with normal sleep patterns) to fall asleep is early morning (midnight-6am).
11
29 of 46

The report provides a summary of vehicles which have exceeded any pre-set journey times + the longest duration for each vehicle. Ensure your drivers plan a break in their journey - 15 minutes for every two hours driving, or make provision to share the driving on lengthy journeys
12
30 of 46

The report highlights vehicles which have exceeded a pre-set journey distance in mileage + the longest journey for each vehicle. Remember that the risks of tiredness increase if a driver has to get up unusually early to begin their trip or if they have a long drive home after a full day’s work. It is important that you monitor journey habits to ensure drivers are taking proper precautions and not putting themselves or other road users at risk.
13
31 of 46

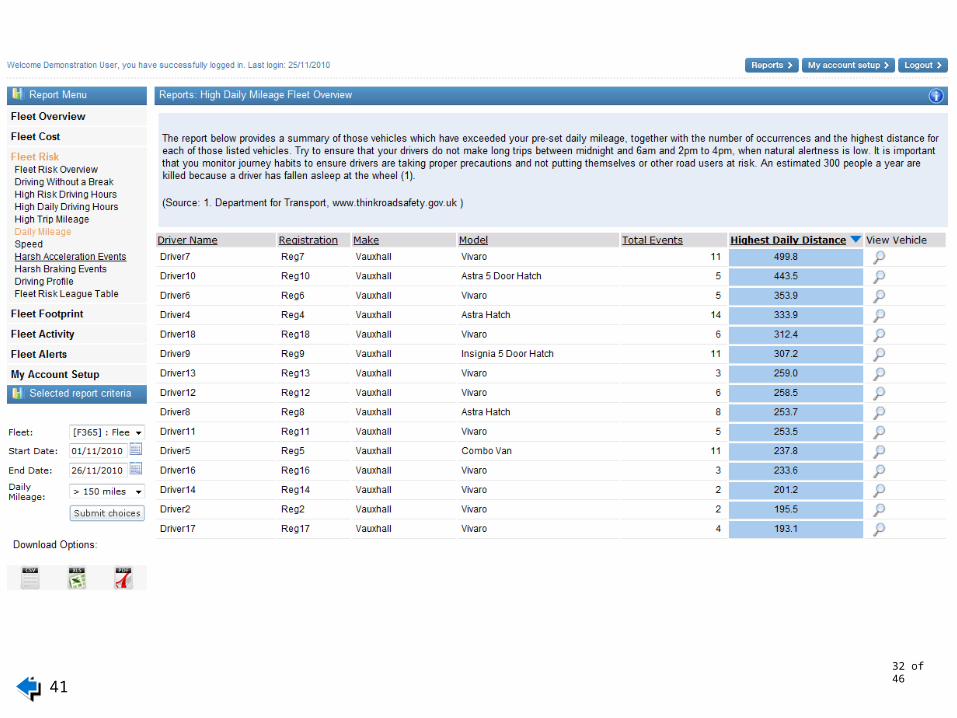
The report highlights vehicles which have exceeded a pre-set daily mileage + the longest distance. An estimated 300 people a year are killed because a driver has fallen asleep at the wheel (DfT). Try to ensure that your drivers do not make long trips between midnight and 6am and 2pm to 4pm, when natural alertness is low.
14
32 of 46

A summary journeys where a pre-defined speed has been exceeded + the highest reported speed for the vehicle. Driving above the speed limit is illegal, but also means increased risk to your drivers and other road users.Company car and van drivers are more likely to think that being on time is more important than seeing speeding as risky, according to the Royal Society for the Prevention of Accidents (RoSPA).
15
33 of 46

A summary of harsh acceleration events + the severity of the worst event for each of the listed vehicles. Harsh acceleration can be a sign of poor driving technique which may lead to increased risk to the driver and other road users.
16
34 of 46
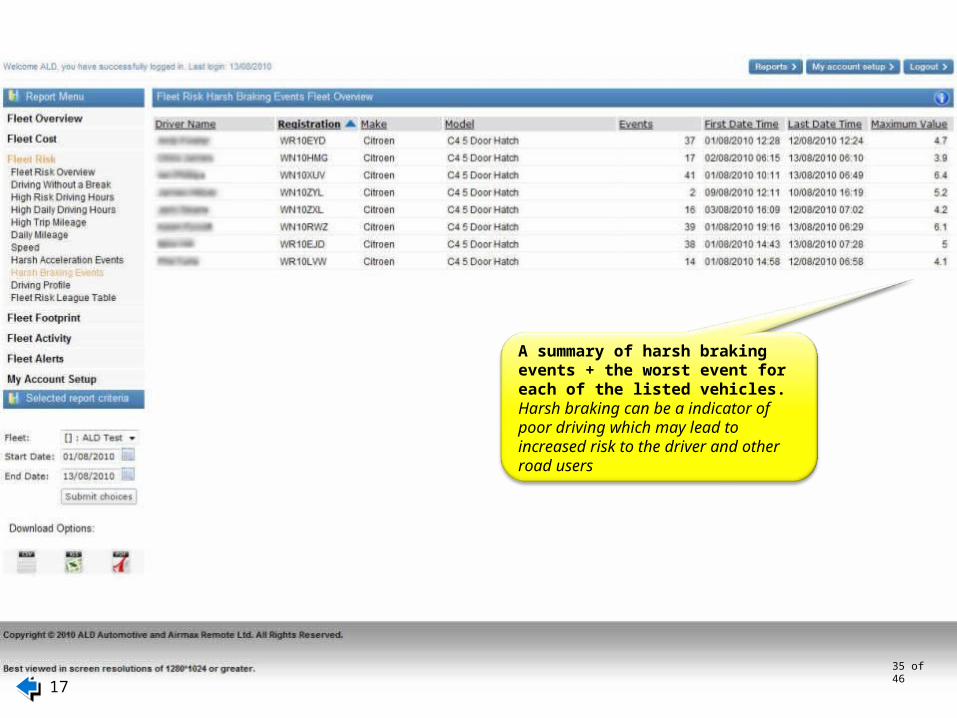
A summary of harsh braking events + the worst event for each of the listed vehicles. Harsh braking can be a indicator of poor driving which may lead to increased risk to the driver and other road users
17
35 of 46

18
36 of 46
Provides more detailed driver and vehicle performance data, especially useful in a risk management scenario providing users with a detailed insight into their behaviour whilst driving on business.

The league table provides the total events that contribute to your overall fleet risk by driver (Harsh Acceleration, Harsh Braking, Excessive Speed, Over-Revving and Driving without a break). This allows you to see your "best" and "worst" performing drivers in order that you can review driving styles and therefore reduce risks to your drivers and other road users.
19
37 of 46

The Fleet Footprint overview gives an ‘at a glance’ view of a fleet’s environmental performance. CO2 (from the mileage driven + VCA CO2 data) is automatically recorded, thereby maintaining an accurate log of carbon footprint to help with ongoing CSR reporting
20
38 of 46

The Fleet Footprint league table provides the total events that contribute to an overall fleet footprint by driver (Harsh Acceleration, Excessive Idling, Excessive Speed, Over-Revving and Business Mileage). This allows fleets to see the "best" and "worst" performing drivers in order that driving styles can be reviewed and carbon footprint.be improved.
21
39 of 46

A summary of the total number of trips, the average vehicle mileage, and the average business mileage for all the vehicles in your fleet, for the current and previous 3 months.22
40 of 46

This provides an up-to-the-minute view of the fleet
by location + ignition status.
23
41 of 46

Specific vehicles can be selected to view journey
details (“track and trace”) feature to + any
events (e.g. Idling / harsh braking
42 of 46
24

The Journey Summary page details all journeys for the time period and includes business/private mileage split, number of
journey’s made and total distance covered. Full details of each trip are available by
clicking on the magnifying glass
25
43 of 46

26
44 of 46
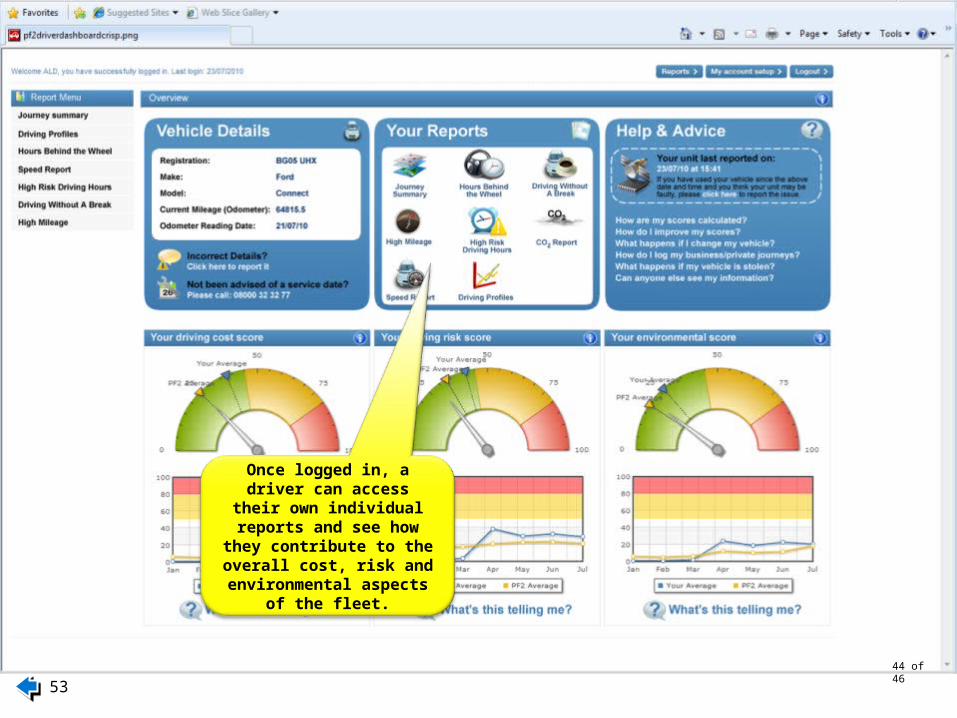
Once logged in, a driver can access their own individual reports and see how they contribute to the overall
cost, risk and environmental aspects of the fleet.

27
45 of 46
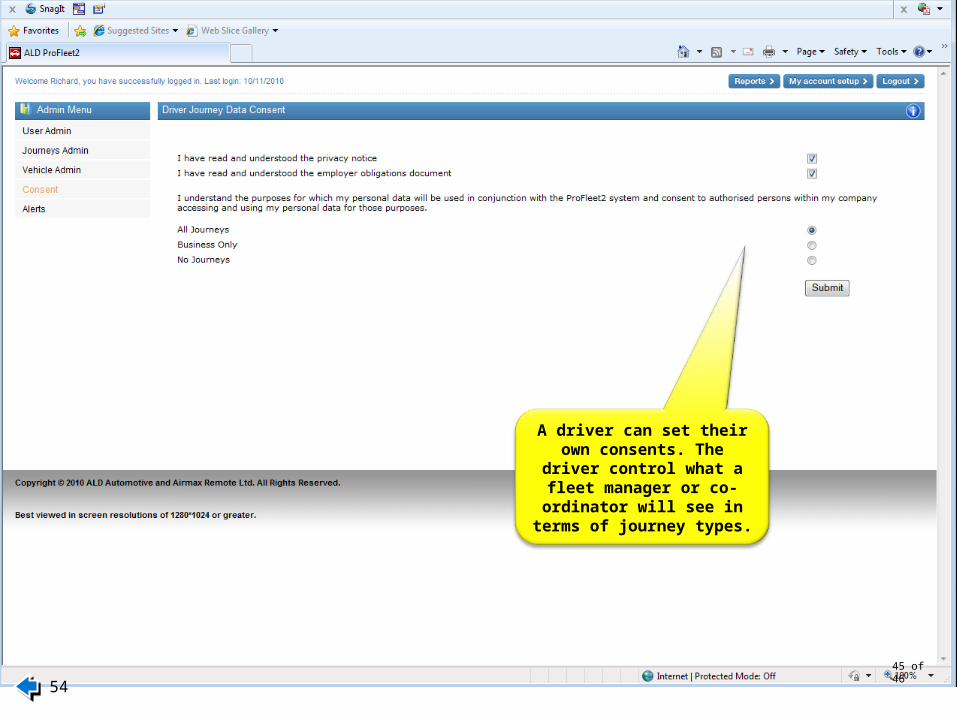
A driver can set their own consents. The driver control what a fleet manager or co-
ordinator will see in terms of journey types.

28
46 of 46
Drivers can log their journey’s and categorise
them by type, i.e. Business, Private. Drivers also have the ability to add their own categories, i.e. Customer
meeting, Head Office commute, etc
To make expense reporting easier and more
importantly, with greater accuracy, all journey details
are automatically logged.

Summary information of
vehicles fitted & registered with
PF2 units
29
Reports home page show ALL PF2
reports available : access restricted by PF2 service selected
& by PF2 version installed
Fleet Overview shows key fleet performance
indicators affecting fleets – Cost, Risk and Environmental impact. 20 of 46

Every key area (Cost, Risk, Footprint) has an overview page graphically summarising each report available on the left hand menu. Clicking a chart will allow you to “drill-down” to the underlying report data
30
21 of 46

A summary of vehicles where harsh acceleration events have been reported + the severity of the worst event for each vehicle. Harsh acceleration has a very significant effect on fuel consumption and consequently has an impact on your fleet costs.
31
Each report column is sortable
Specific date ranges can be selected for reports
and downloaded in CSV, Excel or PDF format
22 of 46

Summary of vehicles with harsh braking events + severity of the worst event for each of the listed vehicles. Harsh braking has a very significant effect on fuel consumption. Driving more smoothly saves fuel and therefore, money
32
23 of 46

This highlights all idling events in the current month + the severity of the worst event for each of the listed vehicles. When an engine is idling it’s wasting fuel.
33
24 of 46

A summary of vehicles with relevant speed events + the severity of the worst event for each vehicles. Driving above the speed limit is illegal, but also means more fuel is used. Staying within the 70mph speed limit on motorways can bring savings of around 10% for your fuel bill compared to driving at 80mph.
34
25 of 46
A summary of over-revving events + the severity of the worst event for each vehicle. Revving does not help to warm up a modern car engine or improve its performance. In fact, over revving simply wastes fuel and increases engine wear
35
26 of 46

A summary identifying relative performance of each driver & their impact on a fleet’s overall total cost index (TCI). Allows you to reward the best performing drivers and review the driving styles of those who are not performing well and reduce cost to thebusiness.
36
27 of 46

A summary of vehicles which have exceeded any pre-set driving duration without stopping for a break. Fatigue-related crashes are more likely to result in a fatality than serious personal injury. It is important that you monitor journey habits to ensure drivers are taking regular breaks and not putting themselves or other road users at risk .
37
28 of 46

A summary of vehicles which have driven during any pre-set ‘high risk’ hours + the severity of the worst event for each of the listed vehicles. One of the most common times for drivers (with normal sleep patterns) to fall asleep is early morning (midnight-6am).
38
29 of 46

The report provides a summary of vehicles which have exceeded any pre-set journey times + the longest duration for each vehicle. Ensure your drivers plan a break in their journey - 15 minutes for every two hours driving, or make provision to share the driving on lengthy journeys
39
30 of 46

The report highlights vehicles which have exceeded a pre-set journey distance in mileage + the longest journey for each vehicle. Remember that the risks of tiredness increase if a driver has to get up unusually early to begin their trip or if they have a long drive home after a full day’s work. It is important that you monitor journey habits to ensure drivers are taking proper precautions and not putting themselves or other road users at risk.
40
31 of 46
The report highlights vehicles which have exceeded a pre-set daily mileage + the longest distance. An estimated 300 people a year are killed because a driver has fallen asleep at the wheel (DfT). Try to ensure that your drivers do not make long trips between midnight and 6am and 2pm to 4pm, when natural alertness is low.
41
32 of 46

A summary journeys where a pre-defined speed has been exceeded + the highest reported speed for the vehicle. Driving above the speed limit is illegal, but also means increased risk to your drivers and other road users.Company car and van drivers are more likely to think that being on time is more important than seeing speeding as risky, according to the Royal Society for the Prevention of Accidents (RoSPA).
42
33 of 46

A summary of harsh acceleration events + the severity of the worst event for each of the listed vehicles. Harsh acceleration can be a sign of poor driving technique which may lead to increased risk to the driver and other road users.
43
34 of 46

A summary of harsh braking events + the worst event for each of the listed vehicles. Harsh braking can be a indicator of poor driving which may lead to increased risk to the driver and other road users
44
35 of 46

45
36 of 46
Provides more detailed driver and vehicle performance data, especially useful in a risk management scenario providing users with a detailed insight into their behaviour whilst driving on business.

The league table provides the total events that contribute to your overall fleet risk by driver (Harsh Acceleration, Harsh Braking, Excessive Speed, Over-Revving and Driving without a break). This allows you to see your "best" and "worst" performing drivers in order that you can review driving styles and therefore reduce risks to your drivers and other road users.
46
37 of 46

The Fleet Footprint overview gives an ‘at a glance’ view of a fleet’s environmental performance. CO2 (from the mileage driven + VCA CO2 data) is automatically recorded, thereby maintaining an accurate log of carbon footprint to help with ongoing CSR reporting
47
38 of 46

The Fleet Footprint league table provides the total events that contribute to an overall fleet footprint by driver (Harsh Acceleration, Excessive Idling, Excessive Speed, Over-Revving and Business Mileage). This allows fleets to see the "best" and "worst" performing drivers in order that driving styles can be reviewed and carbon footprint.be improved.
48
39 of 46

A summary of the total number of trips, the average vehicle mileage, and the average business mileage for all the vehicles in your fleet, for the current and previous 3 months.49
40 of 46

This provides an up-to-the-minute view of the fleet
by location + ignition status.
50
41 of 46

Specific vehicles can be selected to view journey
details (“track and trace”) feature to + any
events (e.g. Idling / harsh braking
42 of 46
51

The Journey Summary page details all journeys for the time period and includes business/private mileage split, number of
journey’s made and total distance covered. Full details of each trip are available by
clicking on the magnifying glass
52
43 of 46
53
44 of 46
Once logged in, a driver can access their own individual reports and see how they contribute to the overall
cost, risk and environmental aspects of the fleet.
54
45 of 46
A driver can set their own consents. The driver control what a fleet manager or co-
ordinator will see in terms of journey types.

55
46 of 46
Drivers can log their journey’s and categorise
them by type, i.e. Business, Private. Drivers also have the ability to add their own categories, i.e. Customer
meeting, Head Office commute, etc
To make expense reporting easier and more
importantly, with greater accuracy, all journey details
are automatically logged.