Embed Size (px)
Citation preview
amended version V1.4
1
Summary Findings of Uptake of the Seasonal Influenza Vaccine in
HSE-funded Hospitals and Nursing Homes and Other Disability
Facilities in Ireland in 2012-2013 Compared to the Uptake in 2011-
2012
September 2013
Amended 21/03/2014
A Report by the Health Protection Surveillance Centre
Note erratum: on page 3 of this report, in the summary results the following point incorrectly referred to 2011-2012 data, this has now been corrected.
Influenza vaccine uptake in long term care facilities (LTCFs) 2012-2013
There was variation in uptake by HSE region (range 9.6%- 22.5%) (now corrected to 2012-2013 data).
The highest was reported in HSE North-East.
________________________________________________________________________________________________________________ HSE-Health Protection Surveillance Centre (HPSC) Tel: +353 1 876 5300 www.hpsc.ie 25-27 Middle Gardiner Street, Dublin 1, Ireland Fax: +353 1 856 1299

amended version V1.4
2
Contents
Introducti ..................................................................................................................................... 3
Summary and key points ............................................................................................................... 3
Influenza vaccine uptake in Hospitals 2012-2013 ........................................................................ 3
Influenza vaccine uptake in long term care facilities (LTCFs) 2012-2013 ....................................... 3
Introduction ................................................................................................................................. 4
Methodology................................................................................................................................ 4
Results ......................................................................................................................................... 4
Hospitals .................................................................................................................................. 4
Participation in survey ........................................................................................................... 4
Hospital staff vaccine uptake by HSE region ............................................................................ 5
Hospital staff vaccine uptake by grade .................................................................................... 6
Long-term care facilities (Nursing Homes, mental health and other disability facilities) ................. 7
Participation in survey ........................................................................................................... 7
Facility staff vaccine uptake by HSE region .............................................................................. 8
Facility staff vaccine uptake by grade...................................................................................... 9
Vaccine uptake among long-stay and respite residents .......................................................... 10
Discussion .............................................................................................................................. 11
References ............................................................................................................................. 12
APPENDICES ........................................................................................................................... 14
Appendix 1: List of Hospitals and Percentage Uptake of Seasonal Influenza Vaccine Among
Hospital Staff in 2012-2013 by Grade.................................................................................... 15
Appendix 2: List of Hospitals and Percentage Uptake of Seasonal Influenza Vaccine Among
Hospital and Community Staff-2012-2013 and 2011-2012 Seasons Compared ........................ 17
Appendix 3: List of Nursing Homes and Other Facilities and Percentage Uptake of Seasonal
Influenza Vaccine Among Staff by Staff Grade in 2012-2013 Compared to 2011-2012 Season .. 18
amended version V1.4
3
Introducti
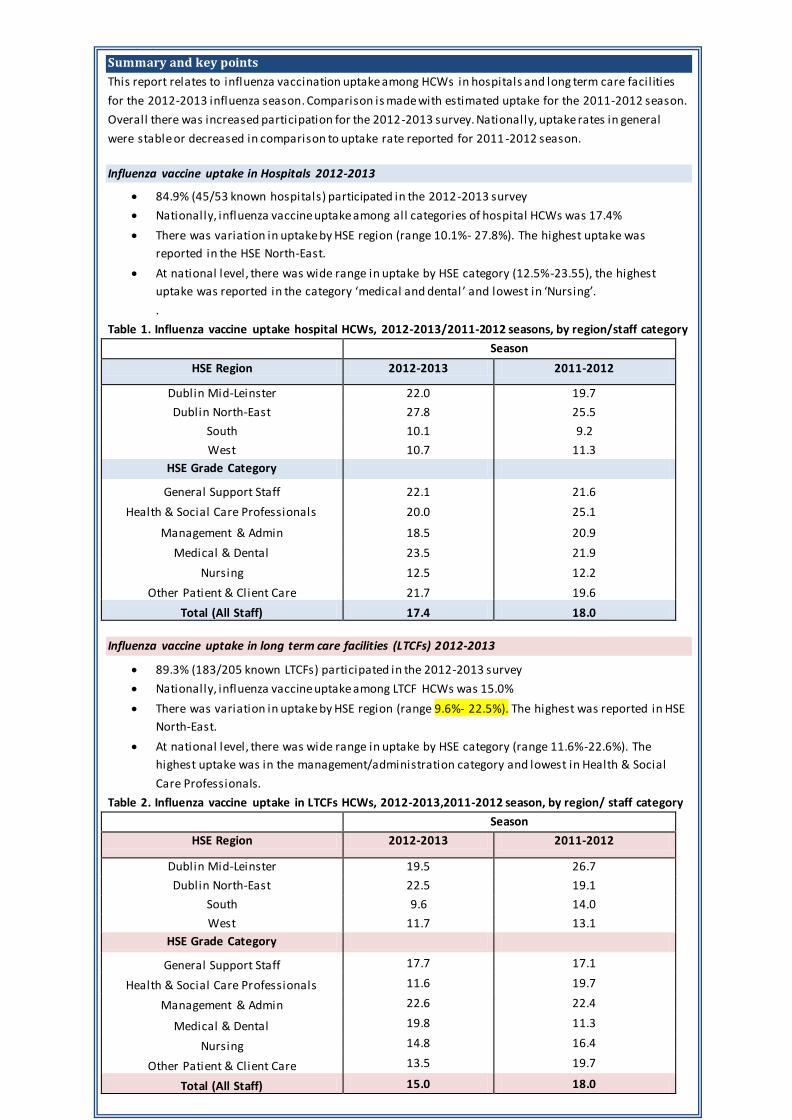
Summary and key points
This report relates to influenza vaccination uptake among HCWs in hospitals and long term care facil ities
for the 2012-2013 influenza season. Comparison is made with estimated uptake for the 2011-2012 season.
Overall there was increased participation for the 2012-2013 survey. Nationally, uptake rates in general
were stable or decreased in comparison to uptake rate reported for 2011 -2012 season.
Influenza vaccine uptake in Hospitals 2012-2013
84.9% (45/53 known hospitals) participated in the 2012-2013 survey
Nationally, influenza vaccine uptake among all categories of hospital HCWs was 17.4%
There was variation in uptake by HSE region (range 10.1%- 27.8%). The highest uptake was
reported in the HSE North-East.
At national level, there was wide range in uptake by HSE category (12.5%-23.55), the highest
uptake was reported in the category ‘medical and dental ’ and lowest in ‘Nursing’.
.
Table 1. Influenza vaccine uptake hospital HCWs, 2012-2013/2011-2012 seasons, by region/staff category
Season
HSE Region 2012-2013 2011-2012
Dublin Mid-Leinster 22.0 19.7
Dublin North-East 27.8 25.5
South 10.1 9.2
West 10.7 11.3
HSE Grade Category
General Support Staff 22.1 21.6
Health & Social Care Professionals 20.0 25.1
Management & Admin 18.5 20.9
Medical & Dental 23.5 21.9
Nursing 12.5 12.2
Other Patient & Client Care 21.7 19.6
Total (All Staff) 17.4 18.0
Influenza vaccine uptake in long term care facilities (LTCFs) 2012-2013
89.3% (183/205 known LTCFs) participated in the 2012-2013 survey
Nationally, influenza vaccine uptake among LTCF HCWs was 15.0%
There was variation in uptake by HSE region (range 9.6%- 22.5%). The highest was reported in HSE
North-East.
At national level, there was wide range in uptake by HSE category (range 11.6%-22.6%). The
highest uptake was in the management/administration category and lowest in Health & Social
Care Professionals.
Table 2. Influenza vaccine uptake in LTCFs HCWs, 2012-2013,2011-2012 season, by region/ staff category
Season
HSE Region 2012-2013 2011-2012
Dublin Mid-Leinster 19.5 26.7
Dublin North-East 22.5 19.1
South 9.6 14.0
West 11.7 13.1
HSE Grade Category
General Support Staff 17.7 17.1
Health & Social Care Professionals 11.6 19.7
Management & Admin 22.6 22.4
Medical & Dental 19.8 11.3
Nursing 14.8 16.4
Other Patient & Client Care 13.5 19.7
Total (All Staff) 15.0 18.0

amended version V1.4
4
Introduction
This report summarises the uptake of seasonal influenza vaccine amongst healthcare workers
(HCWs) in HSE-funded hospitals and long term care facilities (LTCFs) (LTCFs included disability and
mental health facilities and care for the elderly units) for the 2012-2013 influenza season. This is the
second seasonal influenza vaccination uptake survey to be carried out by the HPSC. Each year HSE
recommends that all HCWs in Irish health services should receive the seasonal influenza vaccination.
Striving to achieve high uptake of influenza vaccination among HCWs is recognised as an important
infection control intervention, to reduce the risk of influenza transmission between patients and
HCWs with the potential for severe disease in patients and staff. However, in recent years in Ireland,
influenza outbreaks in healthcare settings have occurred, the majority of which have been
characterised with low uptake among HCWs working in these units.
Methodology
Survey forms were designed in MS-Excel and sent to hospitals and long term care facilities via the
HSE Regional Directors of Operations (RDOs) twice during the influenza season (January 2013 and
May 2013). Aggregate data was collected on the number of staff (one of six categories used by HSE:
management and administration, medical and dental, nursing, health and social care professional,
other patient and client care, general support staff) eligible for vaccination and the number
vaccinated during the season.
For hospitals, occupational health departments provided data on the number and category of HCWs
vaccinated by the service. The HR department provided data on the numbers of staff and
community-based staff employed in the hospital by category.
In the long term care facilities, the number of staff vaccinated was provided either by senior
management in these units or by the occupational health department which provided vaccination
services. The number of staff employed by each facility during the influenza season was provided by
senior management. For the long term care residential facilities, information was also sought on the
number of residents and respite care patients present and vaccinated during this time period. For
the analyses, aggregate end of season data were used for both hospitals and long-term care
facilities. Statistical analysis was performed in MS-Excel.
Instructions on how to complete the forms, how to calculate the numerator (number vaccinated)
and denominator (number eligible) of staff and clients, and a descripti on of staff categories were
included in protocols specifically developed for this project by the HSE partners (National Hospitals
Office, representatives from occupational health physicians, National Immunisation Office (NIO) and
the HPSC).
Results
Hospitals
Participation in survey
In the 2012-2013 season, a total of 53 known hospitals were eligible for inclusion in the analyses, 45
(84.9%) of which responded by submitting a return. Two surveys were conducted during the 2012-
2013 season, 27 (60.0%) of participating hospitals provided provisional data in January and 33
(73.3%) in May. Fifteen (33.3%) hospitals submitted returns from both surveys. Where more than
one return form was submitted by a hospital, only the most recent, end of season, set of figures
amended version V1.4
5
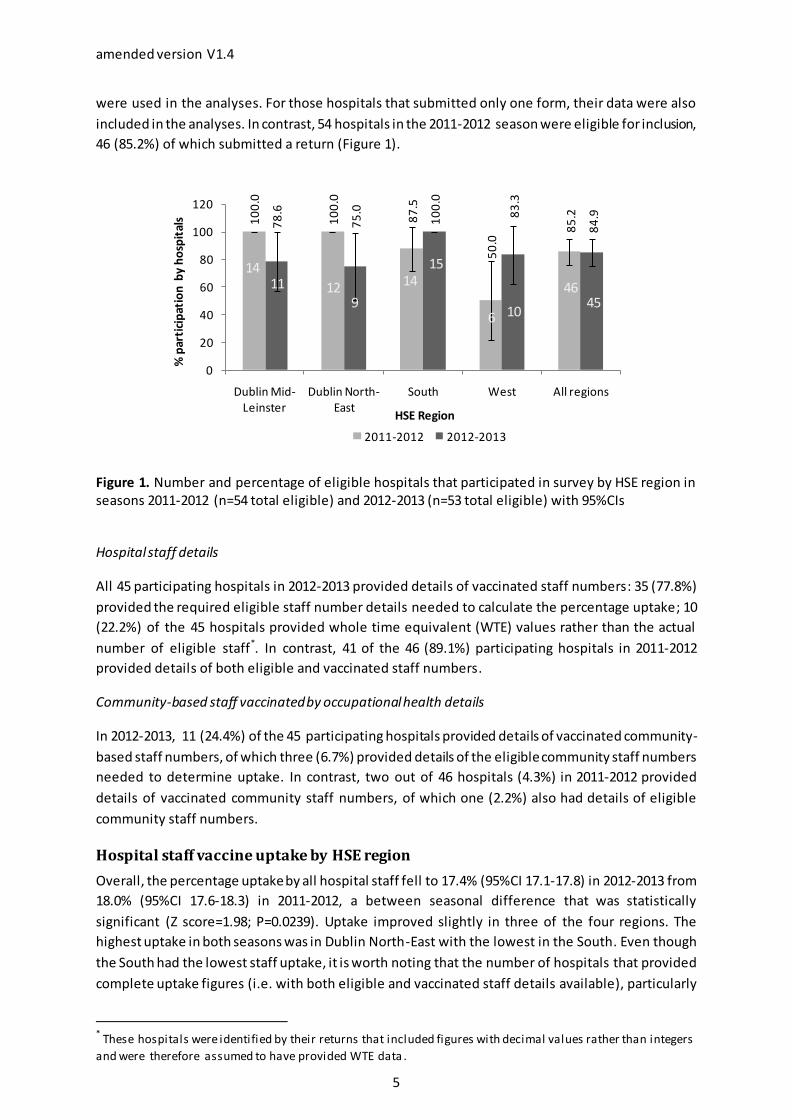
were used in the analyses. For those hospitals that submitted only one form, their data were also
included in the analyses. In contrast, 54 hospitals in the 2011-2012 season were eligible for inclusion,
46 (85.2%) of which submitted a return (Figure 1).
10
0.0
10
0.0
87
.5
50
.0
85
.2
78
.6
75
.0
10
0.0
83
.3
84
.9
0
20
40
60
80
100
120
Dublin Mid-Leinster
Dublin North-East
South West All regions
% p
arti
cip
atio
n b
y h
osp
ital
s
HSE Region
2011-2012 2012-2013
14 15
10
11
459
14
6
12 46
Figure 1. Number and percentage of eligible hospitals that participated in survey by HSE region in seasons 2011-2012 (n=54 total eligible) and 2012-2013 (n=53 total eligible) with 95%CIs
Hospital staff details
All 45 participating hospitals in 2012-2013 provided details of vaccinated staff numbers: 35 (77.8%)
provided the required eligible staff number details needed to calculate the percentage uptake; 10
(22.2%) of the 45 hospitals provided whole time equivalent (WTE) values rather than the actual
number of eligible staff*. In contrast, 41 of the 46 (89.1%) participating hospitals in 2011-2012
provided details of both eligible and vaccinated staff numbers.
Community-based staff vaccinated by occupational health details
In 2012-2013, 11 (24.4%) of the 45 participating hospitals provided details of vaccinated community-
based staff numbers, of which three (6.7%) provided details of the eligible community staff numbers
needed to determine uptake. In contrast, two out of 46 hospitals (4.3%) in 2011-2012 provided
details of vaccinated community staff numbers, of which one (2.2%) also had details of eligible
community staff numbers.
Hospital staff vaccine uptake by HSE region
Overall, the percentage uptake by all hospital staff fell to 17.4% (95%CI 17.1-17.8) in 2012-2013 from
18.0% (95%CI 17.6-18.3) in 2011-2012, a between seasonal difference that was statistically
significant (Z score=1.98; P=0.0239). Uptake improved slightly in three of the four regions. The
highest uptake in both seasons was in Dublin North-East with the lowest in the South. Even though
the South had the lowest staff uptake, it is worth noting that the number of hospitals that provided
complete uptake figures (i.e. with both eligible and vaccinated staff details available), particularly
* These hospitals were identified by their returns that included figures with decimal values rather than integers
and were therefore assumed to have provided WTE data .

amended version V1.4
6
during the 2012-2013 season, was also highest in the South. In contrast, the number of hospitals
providing complete uptake figures in Dublin Mid-Leinster and Dublin North-East fell markedly (Figure
2).
Compared to the national uptake level in both seasons, the percentage uptake among hospital staff
was significantly higher in Dublin Mid-Leinster and Dublin North-East and significantly lower in the
South and West regions (Figure 2).
19
.7
25
.5
9.2 11
.3
18
.022
.0
27
.8
10
.1
10
.7
17
.4
0
5
10
15
20
25
30
35
Dublin Mid-Leinster
Dublin North-East
South West All regions
% S
taff
Vac
cin
ate
d
HSE Region
2011-2012 2012-2013
1310 12 6
1214 4 5
41 35
Figure 2. Percentage uptake of the seasonal influenza vaccine by hospital staff with 95%CIs and number of hospitals that provided details of both eligible and vaccinated staff numbers in seasons 2011-2012 (n=41 hospitals) and 2012-2013 (n=35 hospitals)
When comparing only hospitals that provided details of eligible and vaccinated staff numbers in both
the 2011-2012 and 2012-2013 seasons, a total of 29 hospitals were identified. Seven out of these 29
hospitals (24%) increased their staff vaccination uptake by 2% or more between seasons; no hospital
increased their uptake by more than 10%.
Hospital staff vaccine uptake by grade
In those hospitals where both eligible and vaccinated staff numbers were available (n=29), increased
uptake between seasons was evident in some staff categories: general support staff (+0.5%);
medical and dental staff (+1.6%); nursing (+0.3%); and other patient and client care professionals
(+2.1%). However none of these increases were statistically significant (Figure 3, Appendix 1).
Reductions in uptake were observed among health and social care professionals ( -5.1%) and among
management and administration staff (-2.4%), both of which were statistically significant (Figure 3,
Appendix 1).

amended version V1.4
7
21
.6
25
.1
20
.9
21
.9
12
.2
19
.6
18
.0
22
.1
20
.0
18
.5
23
.5
12
.5
21
.7
17
.4
0
5
10
15
20
25
30
General Support Staff
Health & Social Care
Professionals
Management & Admin
Medical & Dental Nursing Other Patient & Client Care
Total (All Staff)
% S
taff
Vac
cin
ate
d
Grade Category
2011-2012 2012-2013
Figure 3. Percentage uptake of the seasonal influenza vaccine in hospitals (n=29) by HSE grade
category in the 2011-2012 and 2012-2013 seasons with 95%CIs (excludes hospitals that had nul l returns for
ei ther el igible or vaccinated s taff numbers or both)
Uptake in community-based staff vaccinated by occupational health
Information received on the uptake of the vaccine among community–based hospital staff was
minimal in 2012-2013 with three hospitals providing details, two of which provided details of both
eligible and vaccinated staff numbers (Appendix 2). This was a slight improvement on the previous
2011-2012 season when only one hospital provided this information.
Long-term care facilities (Nursing Homes, mental health and other disability
facilities)
Participation in survey
A total of 205 known nursing homes, mental health and disability facilities were eligible for inclusion
in the survey, of which 183 (89.3%) responded by submitting a return. Two surveys were conducted
during the season, 98 (53.6%) of the participating facilities provided provisional data in January and
146 (79.8%) in May. Sixty-one (33.3%) facilities submitted returns from both surveys. Where more
than one return form was submitted by a facility, only the most recent, end of season, set of figures
were used in the analyses. For those facilities that submitted one form only, their data were also
included in the analyses. In contrast, 157 facilities in the 2011-2012 season were eligible for
inclusion, of which 120 (76.4%) submitted a return (Figure 4).

amended version V1.4
8
37
.9
93
.3
67
.6
91
.8
76
.467
.9 88
.4
10
0.0
88
.2
89
.3
0
20
40
60
80
100
120
Dublin Mid-Leinster
Dublin North-East
South West All regions
% p
arti
cip
atio
n b
y fa
cilit
ies
HSE Region
2011-2012 2012-2013
11
28
2556
1938 66
60120
183
Figure 4. Percentage and number of eligible long-term care facilities that participated in survey by
HSE region in seasons 2011-2012 (n=157 total eligible) and 2012-2013 (n=205 total eligible) with
95%CIs
A total of 183 facilities participated in the 2012-2013 season compared to 120 in the 2011-2012
season, an increase of 52.5%, most of which can be attributed to increased participation by mental
health and other disability units. Among the 205 eligible facilities in 2012-2013, 41 (22.4%) were
mental health or other disability units, of which 38 (92.7%) submitted a return. Eleven of these 38
facilities (28.9%) submitted a provisional return in January and 35 (92.1%) an end of season return in
May; eight (21.0%) submitted returns on both occasions.
Facility staff and patient resident details
In 2012-2013, details of eligible staff numbers were provided by 157 of the 183 (85.8%) participating
facilities; 137 (74.9%) of which also provided the required vaccinated staff number details necessary
to calculate the percentage uptake of the vaccine. Four (1.1%) of the 183 facilities provided WTE
values rather than the actual number of eligible staff. Of the participating facilities, 168 (91.8%)
submitted information on either long term or respite residents or both. In contrast, in 2011-2013
details of eligible staff numbers were provided by 90 facilities, of which 70 (77.8%) also provided the
required vaccinated staff number details.
Facility staff vaccine uptake by HSE region
Overall, the percentage uptake in 2012-2013 by all staff (in hospitals that provided both eligible and
vaccinated staff numbers only) fell from 18.0% (95%CI 16.9-19.1) in 2011-2012 to 15.0% (95%CI
14.4-15.6) in 2012-2013, a between seasonal difference that was statistically significant (Z
score=4.96; P<0.00001) (Figure 5). Uptake improved in one region (Dublin North-East). The highest
uptake in both seasons was in Dublin North-East and Dublin Mid-Leinster. Even though the South
had the lowest staff uptake in 2012-2013, this region had the highest number of facilities providing
complete uptake figures, increasing from 13 during the previous season to 45 in the latest (Figure 5,
Appendix 3).
amended version V1.4
9
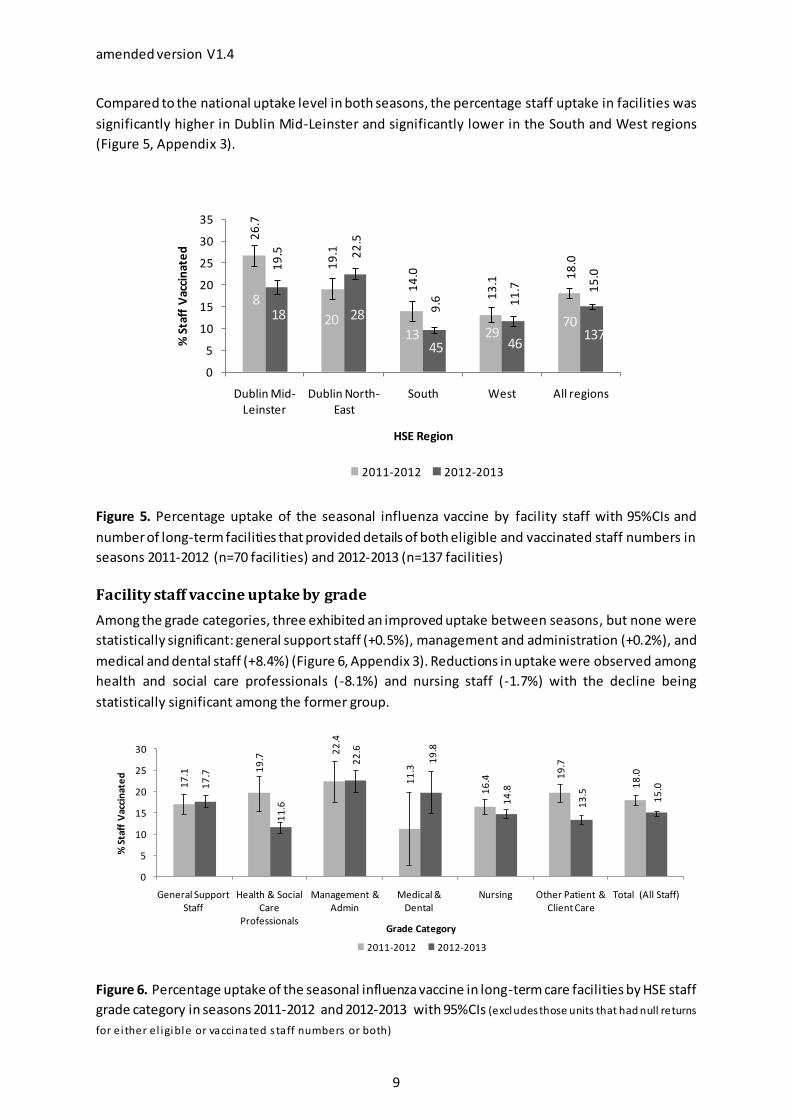
Compared to the national uptake level in both seasons, the percentage staff uptake in facilities was
significantly higher in Dublin Mid-Leinster and significantly lower in the South and West regions
(Figure 5, Appendix 3).
26
.7
19
.1
14
.0
13
.1 18
.019
.5 22
.5
9.6 1
1.7 1
5.0
0
5
10
15
20
25
30
35
Dublin Mid-Leinster
Dublin North-East
South West All regions
% S
taff
Vac
cin
ate
d
HSE Region
2011-2012 2012-2013
818 20 28
1345
2946
70137
Figure 5. Percentage uptake of the seasonal influenza vaccine by facility staff with 95%CIs and
number of long-term facilities that provided details of both eligible and vaccinated staff numbers in
seasons 2011-2012 (n=70 facilities) and 2012-2013 (n=137 facilities)
Facility staff vaccine uptake by grade
Among the grade categories, three exhibited an improved uptake between seasons, but none were
statistically significant: general support staff (+0.5%), management and administration (+0.2%), and
medical and dental staff (+8.4%) (Figure 6, Appendix 3). Reductions in uptake were observed among
health and social care professionals (-8.1%) and nursing staff (-1.7%) with the decline being
statistically significant among the former group.
17
.1 19
.7
22
.4
11
.3
16
.4 19
.7
18
.0
17
.7
11
.6
22
.6
19
.8
14
.8
13
.5
15
.0
0
5
10
15
20
25
30
General Support Staff
Health & Social Care
Professionals
Management & Admin
Medical & Dental
Nursing Other Patient & Client Care
Total (All Staff)
% S
taff
Vac
cin
ate
d
Grade Category
2011-2012 2012-2013
Figure 6. Percentage uptake of the seasonal influenza vaccine in long-term care facilities by HSE staff
grade category in seasons 2011-2012 and 2012-2013 with 95%CIs (excludes those units that had null returns
for ei ther el igible or vaccinated s taff numbers or both)
amended version V1.4
10
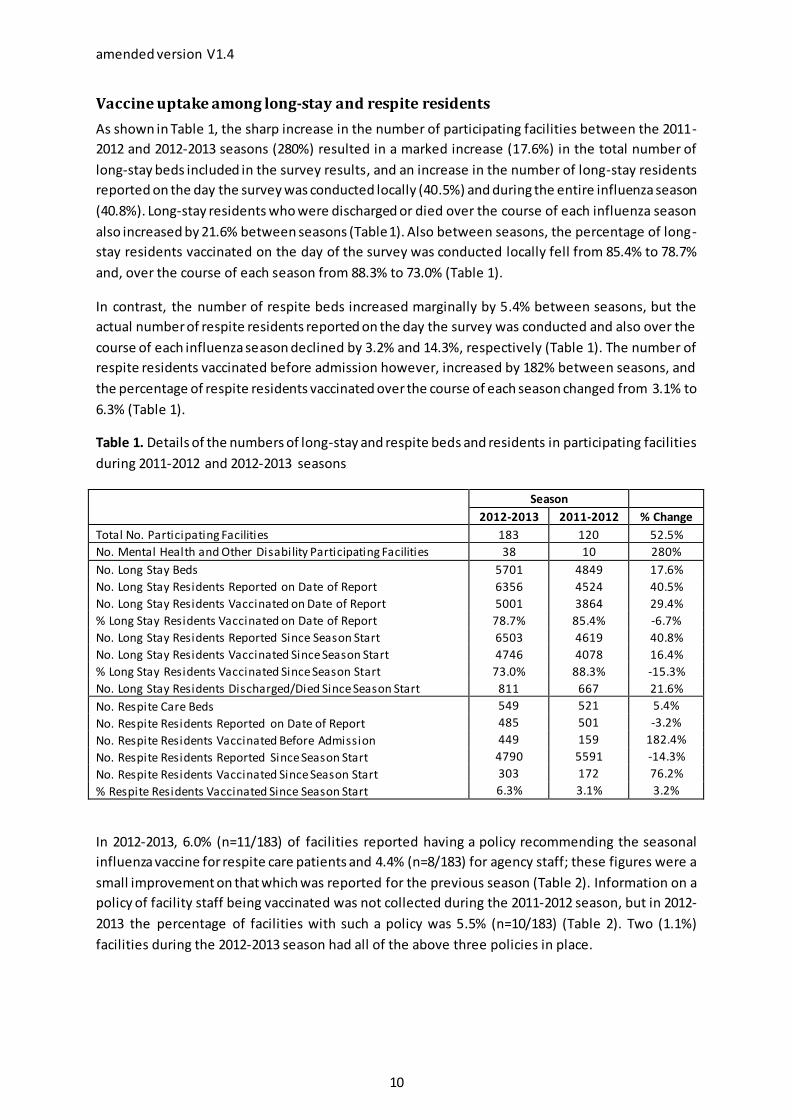
Vaccine uptake among long-stay and respite residents
As shown in Table 1, the sharp increase in the number of participating facilities between the 2011-
2012 and 2012-2013 seasons (280%) resulted in a marked increase (17.6%) in the total number of
long-stay beds included in the survey results, and an increase in the number of long-stay residents
reported on the day the survey was conducted locally (40.5%) and during the entire influenza season
(40.8%). Long-stay residents who were discharged or died over the course of each influenza season
also increased by 21.6% between seasons (Table 1). Also between seasons, the percentage of long-
stay residents vaccinated on the day of the survey was conducted locally fell from 85.4% to 78.7%
and, over the course of each season from 88.3% to 73.0% (Table 1).
In contrast, the number of respite beds increased marginally by 5.4% between seasons, but the
actual number of respite residents reported on the day the survey was conducted and also over the
course of each influenza season declined by 3.2% and 14.3%, respectively (Table 1). The number of
respite residents vaccinated before admission however, increased by 182% between seasons, and
the percentage of respite residents vaccinated over the course of each season changed from 3.1% to
6.3% (Table 1).
Table 1. Details of the numbers of long-stay and respite beds and residents in participating facilities
during 2011-2012 and 2012-2013 seasons
Season
2012-2013 2011-2012 % Change
Total No. Participating Facilities 183 120 52.5%
No. Mental Health and Other Disability Participating Facilities 38 10 280%
No. Long Stay Beds 5701 4849 17.6%
No. Long Stay Residents Reported on Date of Report 6356 4524 40.5%
No. Long Stay Residents Vaccinated on Date of Report 5001 3864 29.4%
% Long Stay Residents Vaccinated on Date of Report 78.7% 85.4% -6.7%
No. Long Stay Residents Reported Since Season Start 6503 4619 40.8%
No. Long Stay Residents Vaccinated Since Season Start 4746 4078 16.4%
% Long Stay Residents Vaccinated Since Season Start 73.0% 88.3% -15.3%
No. Long Stay Residents Discharged/Died Since Season Start 811 667 21.6%
No. Respite Care Beds 549 521 5.4%
No. Respite Residents Reported on Date of Report 485 501 -3.2%
No. Respite Residents Vaccinated Before Admission 449 159 182.4%
No. Respite Residents Reported Since Season Start 4790 5591 -14.3%
No. Respite Residents Vaccinated Since Season Start 303 172 76.2%
% Respite Residents Vaccinated Since Season Start 6.3% 3.1% 3.2%
In 2012-2013, 6.0% (n=11/183) of facilities reported having a policy recommending the seasonal
influenza vaccine for respite care patients and 4.4% (n=8/183) for agency staff; these figures were a
small improvement on that which was reported for the previous season (Table 2). Information on a
policy of facility staff being vaccinated was not collected during the 2011-2012 season, but in 2012-
2013 the percentage of facilities with such a policy was 5.5% (n=10/183) (Table 2). Two (1.1%)
facilities during the 2012-2013 season had all of the above three policies in place.

amended version V1.4
11
Table 2. Details of the percentage of participating facilities with vaccination policies in place for
facility staff (including agency staff) and respite residents during 2011-2012 (n=120) and 2012-2013
(n=183) seasons
Season
2012-2013 2011-2012
Vaccination policy question n
% of All 183 participating
facilities n
% of All 120 participating
facilities
‘Is there a policy that all elective respite residents should be vaccinated prior to admission?’ Yes
11 6.0% 5 4.2%
Is there a policy that all staff should be vaccinated? Yes 10 5.5% n/a n/a
‘Does your unit require that agency staff should be vaccinated prior to working in the service?’ Yes
8 4.4% 1 0.8%
Note: n/a data not col lected in 2011-2012 season
Discussion
The findings of this second annual survey on influenza vaccination uptake among HCWs working in
HSE hospitals and long term care facilities paint a picture of contrasts. Notable improvements since
the 2011-2012 survey include the increased participation by LTCFs (53%), especially in the Southern
region, and an increase (from 3% to 6%) in the percentage of respite residents vaccinated.
However, declines in uptake were observed between 2011-2012 and 2012-2013 among staff in
LTCFS from 18% to 15%, and a small decline was found in hospitals from 18% to 17%. In addition, the
percentage of long stay residents vaccinated in the 2012-2013 season was 73%, considerably less
than the 88% reported during the previous season.
These reductions occurred against a background when considerable efforts were made by NIO and
HPSC and others to highlight the importance of seasonal influenza vaccination for both staff and
patients. The absence of vaccination policies in LTCFs, despite national recommendations is also of
concern3.
The uptake figures reported here compare favourably with some and unfavourably with other
countries that monitor uptake in HCWs. For example, in England during the 2012-2013 season,
45.7% of all frontline HCWs (from all NHS trusts) with direct patient care received the seasonal
influenza vaccine (an increase in uptake compared with 44.6% during the in 2011-2012 season.1
However, as our survey sought information on all HCWs employed in the hospitals and LTCFS (and
was not limited to frontline HCWs) the HCW population in the UK is not completely comparable to
those in our survey. In comparison to other European countries Ireland was one of relatively few
countries that was able to provide data uptake in a recent European survey (2011-2012 data), with
the majority of EU countries not able to provide data on HCW uptake. 2 In this EU funded study ten
countries provided data on HCW influenza uptake, ranging from 6.4% (Poland) to 54.4% (Romania).
From this study it is evident that recommendations and requirements for HCW vaccination differ
somewhat across Europe, although all recommend influenza vaccine for this work group.
Possible limitations of the estimates of influenza uptake presented here include incomplete data
relating to staff numbers of those eligible and vaccinated in participating hospitals (78% of hospitals
and 75% of LTCFs provided the data needed to calculate uptake for the 2012-2013 survey). In
addition, a small number of units provided WTE details during the 2012-2013 season rather than

amended version V1.4
12
actual numbers of staff (as requested in the circulated protocols), thereby potentially inflating
reported uptake figures.
Another possible limitation of these estimates is the assumption that the data provided by all
occupational health departments (hospitals) and LTCF management accurately reflects uptake of
HCWs employed in their units. Such information may underestimate the uptake if substantial
numbers of HCWs are vaccinated outside the occupational health service. However, although some
staff may seek influenza vaccination from a GP or local pharmacy (for convenience purposes) we
consider the likelihood of this to be low as costs would be normally be incurred to the HCWs in
these settings.
In the LTCF setting, the data reported by the LTCFs was based on data available to the person
completing the survey. Obtaining accurate uptake data may have been more difficult in LTCFs in the
absence of standard data collation system, particularly if the service provided was not on site .
However, national guidance does recommend that all LTCFs should collect data on staff
immunisation annually.3
In the international literature there is growing evidence of strategies that can improve uptake
including: improved access to vaccination clinics (e.g. through mobile units operating on-site, in the
wards for all shifts); improve knowledge and attitudes to vaccination; timely reminders; incentives;
assigning dedicated personnel to support the vaccination programme.2,4 The use of performance
indicators to monitor and encourage uptake is currently under discussion within the HSE as a means
to improve data reporting and monitor trends.
In order to gain greater insight into the challenges faced by both hospitals and long-term care
facilities into achieving high uptake levels, the HPSC is currently conducting a survey with HSE
facilities, the results of which will be made available before the end of the 2013.
References
1. Das S & Pebody R. Department of Health (DH) and Health Protection Agency (HPA). Seasonal
influenza vaccine uptake amongst frontline healthcare workers (HCWs) in England. Winter
season 2012/13. https://www.gov.uk/government/publications/seasonal-influenza-vaccine-
uptake-in-healthcare-workers-winter-2012-to-2013
2. VENICE II Consortium. Seasonal influenza vaccination in EU/EEA, influenza season 2011‐12.
Developed by O’Flanagan D, Cotter S & Mereckiene J. September 2012‐February 2013.
http://venice.cineca.org/VENICE_Seasonal_Influenza_2011-12_1.0v.pdf (in press)
3. HSE, HPSC. Public Health Guidelines on the Prevention and Management of Influenza
Outbreaks in Residential Care Facilities in Ireland 2013/2014 available at
http://www.hpsc.ie/hpsc/A-
Z/Respiratory/Influenza/SeasonalInfluenza/Guidance/ResidentialCareFacilitiesGuidance/
4. Riphagen-Dalhuisen J, Frijstein G, Geest-Blankert N, Danhof-Pont M, de Jager H, Bos N,
Smeets E, de Vries M, Gallee P, Hak E. Planning and process evaluation of a multi-faceted
influenza vaccination implementation strategy for health care workers in acute health care

amended version V1.4
13
settings. BMC Infect Dis. 2013; 13: 235. Available at
http://www.ncbi.nlm.nih.gov/pmc/articles/PMC3680164/

amended version V1.4
14
APPENDICES
amended version V1.4
15
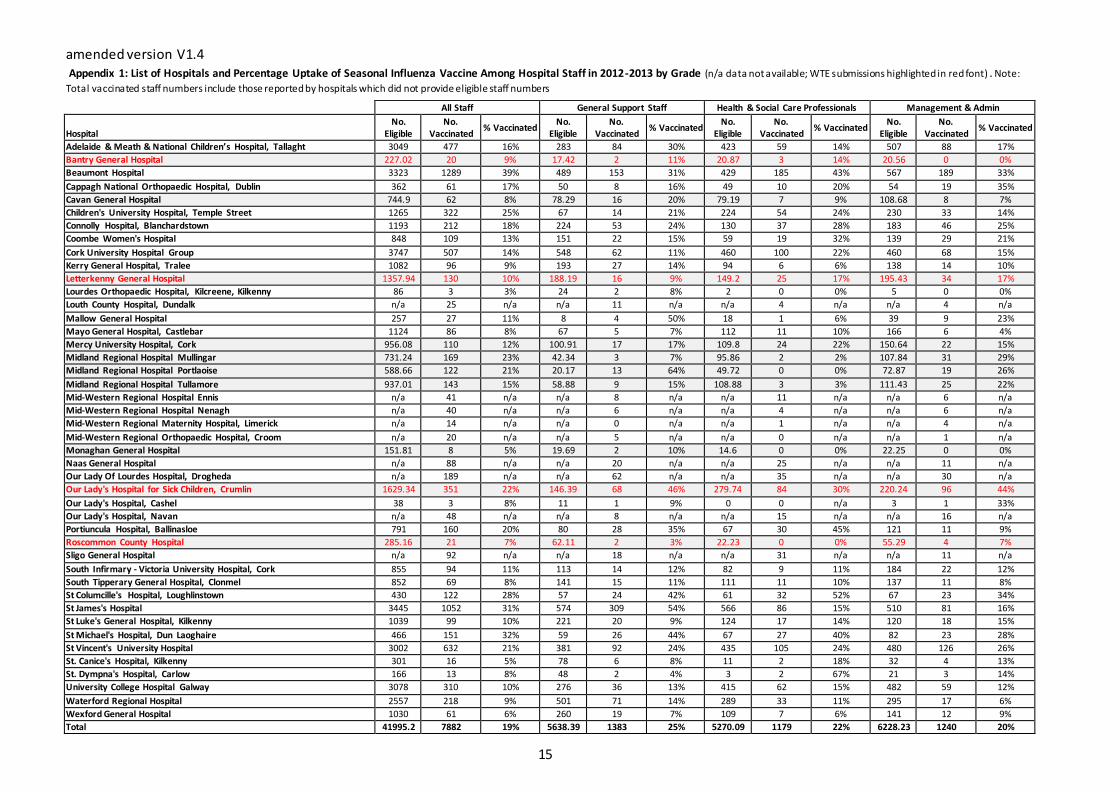
Appendix 1: List of Hospitals and Percentage Uptake of Seasonal Influenza Vaccine Among Hospital Staff in 2012-2013 by Grade (n/a data not available; WTE submissions highlighted in red font) . Note: Total vaccinated staff numbers include those reported by hospitals which did not provide eligible staff numbers
All Staff General Support Staff Health & Social Care Professionals Management & Admin
Hospital No.
Eligible No.
Vaccinated % Vaccinated
No. Eligible
No. Vaccinated
% Vaccinated No.
Eligible No.
Vaccinated % Vaccinated
No. Eligible
No. Vaccinated
% Vaccinated
Adelaide & Meath & National Children’s Hospital, Tallaght 3049 477 16% 283 84 30% 423 59 14% 507 88 17%
Bantry General Hospital 227.02 20 9% 17.42 2 11% 20.87 3 14% 20.56 0 0%
Beaumont Hospital 3323 1289 39% 489 153 31% 429 185 43% 567 189 33%
Cappagh National Orthopaedic Hospital, Dublin 362 61 17% 50 8 16% 49 10 20% 54 19 35%
Cavan General Hospital 744.9 62 8% 78.29 16 20% 79.19 7 9% 108.68 8 7%
Children's University Hospital, Temple Street 1265 322 25% 67 14 21% 224 54 24% 230 33 14%
Connolly Hospital, Blanchardstown 1193 212 18% 224 53 24% 130 37 28% 183 46 25%
Coombe Women's Hospital 848 109 13% 151 22 15% 59 19 32% 139 29 21%
Cork University Hospital Group 3747 507 14% 548 62 11% 460 100 22% 460 68 15%
Kerry General Hospital, Tralee 1082 96 9% 193 27 14% 94 6 6% 138 14 10%
Letterkenny General Hospital 1357.94 130 10% 188.19 16 9% 149.2 25 17% 195.43 34 17%
Lourdes Orthopaedic Hospital, Kilcreene, Kilkenny 86 3 3% 24 2 8% 2 0 0% 5 0 0%
Louth County Hospital, Dundalk n/a 25 n/a n/a 11 n/a n/a 4 n/a n/a 4 n/a
Mallow General Hospital 257 27 11% 8 4 50% 18 1 6% 39 9 23%
Mayo General Hospital, Castlebar 1124 86 8% 67 5 7% 112 11 10% 166 6 4%
Mercy University Hospital, Cork 956.08 110 12% 100.91 17 17% 109.8 24 22% 150.64 22 15%
Midland Regional Hospital Mullingar 731.24 169 23% 42.34 3 7% 95.86 2 2% 107.84 31 29%
Midland Regional Hospital Portlaoise 588.66 122 21% 20.17 13 64% 49.72 0 0% 72.87 19 26%
Midland Regional Hospital Tullamore 937.01 143 15% 58.88 9 15% 108.88 3 3% 111.43 25 22%
Mid-Western Regional Hospital Ennis n/a 41 n/a n/a 8 n/a n/a 11 n/a n/a 6 n/a
Mid-Western Regional Hospital Nenagh n/a 40 n/a n/a 6 n/a n/a 4 n/a n/a 6 n/a
Mid-Western Regional Maternity Hospital, Limerick n/a 14 n/a n/a 0 n/a n/a 1 n/a n/a 4 n/a
Mid-Western Regional Orthopaedic Hospital, Croom n/a 20 n/a n/a 5 n/a n/a 0 n/a n/a 1 n/a
Monaghan General Hospital 151.81 8 5% 19.69 2 10% 14.6 0 0% 22.25 0 0%
Naas General Hospital n/a 88 n/a n/a 20 n/a n/a 25 n/a n/a 11 n/a
Our Lady Of Lourdes Hospital, Drogheda n/a 189 n/a n/a 62 n/a n/a 35 n/a n/a 30 n/a
Our Lady's Hospital for Sick Children, Crumlin 1629.34 351 22% 146.39 68 46% 279.74 84 30% 220.24 96 44%
Our Lady's Hospital, Cashel 38 3 8% 11 1 9% 0 0 n/a 3 1 33%
Our Lady's Hospital, Navan n/a 48 n/a n/a 8 n/a n/a 15 n/a n/a 16 n/a
Portiuncula Hospital, Ballinasloe 791 160 20% 80 28 35% 67 30 45% 121 11 9%
Roscommon County Hospital 285.16 21 7% 62.11 2 3% 22.23 0 0% 55.29 4 7%
Sligo General Hospital n/a 92 n/a n/a 18 n/a n/a 31 n/a n/a 11 n/a
South Infirmary - Victoria University Hospital, Cork 855 94 11% 113 14 12% 82 9 11% 184 22 12%
South Tipperary General Hospital, Clonmel 852 69 8% 141 15 11% 111 11 10% 137 11 8%
St Columcille's Hospital, Loughlinstown 430 122 28% 57 24 42% 61 32 52% 67 23 34%
St James's Hospital 3445 1052 31% 574 309 54% 566 86 15% 510 81 16%
St Luke's General Hospital, Kilkenny 1039 99 10% 221 20 9% 124 17 14% 120 18 15%
St Michael's Hospital, Dun Laoghaire 466 151 32% 59 26 44% 67 27 40% 82 23 28%
St Vincent's University Hospital 3002 632 21% 381 92 24% 435 105 24% 480 126 26%
St. Canice's Hospital, Kilkenny 301 16 5% 78 6 8% 11 2 18% 32 4 13%
St. Dympna's Hospital, Carlow 166 13 8% 48 2 4% 3 2 67% 21 3 14%
University College Hospital Galway 3078 310 10% 276 36 13% 415 62 15% 482 59 12%
Waterford Regional Hospital 2557 218 9% 501 71 14% 289 33 11% 295 17 6%
Wexford General Hospital 1030 61 6% 260 19 7% 109 7 6% 141 12 9%
Total 41995.2 7882 19% 5638.39 1383 25% 5270.09 1179 22% 6228.23 1240 20%

amended version V1.4
16
Medical & Dental Nursing Other Patient & Client Care
Hospital No.
Eligible No.
Vaccinated % Vaccinated
No. Eligible
No. Vaccinated
% Vaccinated No.
Eligible No.
Vaccinated % Vaccinated
Adelaide & Meath & National Children’s Hospital, Tallaght 384 79 21% 1231 147 12% 221 20 9%
Bantry General Hospital 15.1 4 26% 102.57 10 10% 50.5 1 2%
Beaumont Hospital 445 226 51% 1199 440 37% 194 96 49%
Cappagh National Orthopaedic Hospital, Dublin 48 1 2% 150 23 15% 11 0 0%
Cavan General Hospital 90.28 7 8% 323.75 20 6% 64.71 4 6%
Children's University Hospital, Temple Street 199 49 25% 468 118 25% 77 54 70%
Connolly Hospital, Blanchardstown 139 26 19% 517 50 10% 0 0 n/a
Coombe Women's Hospital 65 5 8% 385 26 7% 49 8 16%
Cork University Hospital Group 497 99 20% 1681 160 10% 101 18 18%
Kerry General Hospital, Tralee 103 34 33% 528 15 3% 26 0 0%
Letterkenny General Hospital 147.82 19 13% 661.3 31 5% 16 5 31%
Lourdes Orthopaedic Hospital, Kilcreene, Kilkenny 3 0 0% 52 1 2% 0 0 n/a
Louth County Hospital, Dundalk n/a 0 n/a n/a 5 n/a n/a 1 n/a
Mallow General Hospital 21 0 0% 119 9 8% 52 4 8%
Mayo General Hospital, Castlebar 141 26 18% 541 29 5% 97 9 9%
Mercy University Hospital, Cork 137.9 18 13% 368.94 29 8% 87.89 0 0%
Midland Regional Hospital Mullingar 108.33 18 17% 259.24 43 17% 117.63 72 61%
Midland Regional Hospital Portlaoise 74.28 25 34% 224.07 28 12% 147.55 37 25%
Midland Regional Hospital Tullamore 112.72 18 16% 359.02 26 7% 186.08 62 33%
Mid-Western Regional Hospital Ennis n/a 6 n/a n/a 9 n/a n/a 1 n/a
Mid-Western Regional Hospital Nenagh n/a 3 n/a n/a 8 n/a n/a 13 n/a
Mid-Western Regional Maternity Hospital, Limerick n/a 2 n/a n/a 7 n/a n/a 0 n/a
Mid-Western Regional Orthopaedic Hospital, Croom n/a 1 n/a n/a 11 n/a n/a 2 n/a
Monaghan General Hospital 16.51 1 6% 50.85 5 10% 27.91 0 0%
Naas General Hospital n/a 11 n/a n/a 8 n/a n/a 13 n/a
Our Lady Of Lourdes Hospital, Drogheda n/a 30 n/a n/a 31 n/a n/a 1 n/a
Our Lady's Hospital for Sick Children, Crumlin 189.5 25 13% 704.14 71 10% 89.33 7 8%
Our Lady's Hospital, Cashel 1 0 0% 23 1 4% 0 0 n/a
Our Lady's Hospital, Navan n/a 7 n/a n/a 2 n/a n/a 0 n/a
Portiuncula Hospital, Ballinasloe 96 52 54% 375 30 8% 52 9 17%
Roscommon County Hospital 32.77 5 15% 102.24 7 7% 10.52 3 29%
Sligo General Hospital n/a 12 n/a n/a 9 n/a n/a 11 n/a
South Infirmary - Victoria University Hospital, Cork 77 8 10% 354 35 10% 45 6 13%
South Tipperary General Hospital, Clonmel 86 16 19% 377 16 4% 0 0 n/a
St Columcille's Hospital, Loughlinstown 66 27 41% 147 12 8% 32 4 13%
St James's Hospital 426 182 43% 1369 394 29% 0 0 n/a
St Luke's General Hospital, Kilkenny 101 21 21% 473 23 5% 0 0 n/a
St Michael's Hospital, Dun Laoghaire 35 9 26% 198 59 30% 25 7 28%
St Vincent's University Hospital 476 125 26% 1050 156 15% 180 28 16%
St. Canice's Hospital, Kilkenny 19 0 0% 161 4 2% 0 0 n/a
St. Dympna's Hospital, Carlow 0 0 n/a 94 6 6% 0 0 n/a
University College Hospital Galway 479 47 10% 1211 89 7% 215 17 8%
Waterford Regional Hospital 260 36 14% 1212 61 5% 0 0 n/a
Wexford General Hospital 93 8 9% 427 15 4% 0 0 n/a
Total 5185.21 1288 25% 17498.1 2279 13% 2175.12 513 24%
amended version V1.4
17
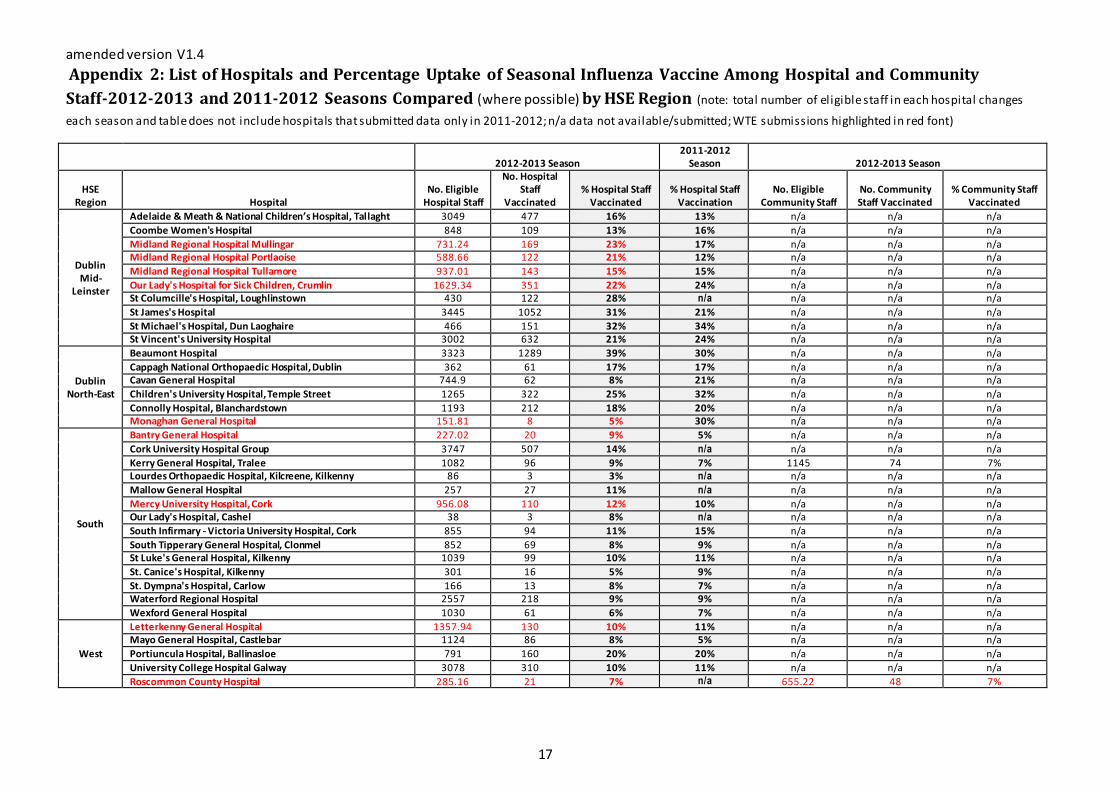
Appendix 2: List of Hospitals and Percentage Uptake of Seasonal Influenza Vaccine Among Hospital and Community
Staff-2012-2013 and 2011-2012 Seasons Compared (where possible) by HSE Region (note: total number of eligible staff in each hospital changes
each season and table does not include hospitals that submitted data only in 2011-2012; n/a data not available/submitted; WTE submissions highlighted in red font)
2012-2013 Season
2011-2012 Season 2012-2013 Season
HSE Region Hospital
No. Eligible Hospital Staff
No. Hospital Staff
Vaccinated % Hospital Staff
Vaccinated % Hospital Staff
Vaccination No. Eligible
Community Staff No. Community Staff Vaccinated
% Community Staff Vaccinated
Dublin Mid-
Leinster
Adelaide & Meath & National Children’s Hospital, Tallaght 3049 477 16% 13% n/a n/a n/a
Coombe Women's Hospital 848 109 13% 16% n/a n/a n/a
Midland Regional Hospital Mullingar 731.24 169 23% 17% n/a n/a n/a Midland Regional Hospital Portlaoise 588.66 122 21% 12% n/a n/a n/a
Midland Regional Hospital Tullamore 937.01 143 15% 15% n/a n/a n/a
Our Lady's Hospital for Sick Children, Crumlin 1629.34 351 22% 24% n/a n/a n/a St Columcille's Hospital, Loughlinstown 430 122 28% n/a n/a n/a n/a
St James's Hospital 3445 1052 31% 21% n/a n/a n/a
St Michael's Hospital, Dun Laoghaire 466 151 32% 34% n/a n/a n/a St Vincent's University Hospital 3002 632 21% 24% n/a n/a n/a
Dublin North-East
Beaumont Hospital 3323 1289 39% 30% n/a n/a n/a
Cappagh National Orthopaedic Hospital, Dublin 362 61 17% 17% n/a n/a n/a Cavan General Hospital 744.9 62 8% 21% n/a n/a n/a
Children's University Hospital, Temple Street 1265 322 25% 32% n/a n/a n/a
Connolly Hospital, Blanchardstown 1193 212 18% 20% n/a n/a n/a Monaghan General Hospital 151.81 8 5% 30% n/a n/a n/a
South
Bantry General Hospital 227.02 20 9% 5% n/a n/a n/a
Cork University Hospital Group 3747 507 14% n/a n/a n/a n/a
Kerry General Hospital, Tralee 1082 96 9% 7% 1145 74 7% Lourdes Orthopaedic Hospital, Kilcreene, Kilkenny 86 3 3% n/a n/a n/a n/a
Mallow General Hospital 257 27 11% n/a n/a n/a n/a
Mercy University Hospital, Cork 956.08 110 12% 10% n/a n/a n/a Our Lady's Hospital, Cashel 38 3 8% n/a n/a n/a n/a
South Infirmary - Victoria University Hospital, Cork 855 94 11% 15% n/a n/a n/a
South Tipperary General Hospital, Clonmel 852 69 8% 9% n/a n/a n/a St Luke's General Hospital, Kilkenny 1039 99 10% 11% n/a n/a n/a
St. Canice's Hospital, Kilkenny 301 16 5% 9% n/a n/a n/a
St. Dympna's Hospital, Carlow 166 13 8% 7% n/a n/a n/a Waterford Regional Hospital 2557 218 9% 9% n/a n/a n/a
Wexford General Hospital 1030 61 6% 7% n/a n/a n/a
West
Letterkenny General Hospital 1357.94 130 10% 11% n/a n/a n/a Mayo General Hospital, Castlebar 1124 86 8% 5% n/a n/a n/a
Portiuncula Hospital, Ballinasloe 791 160 20% 20% n/a n/a n/a
University College Hospital Galway 3078 310 10% 11% n/a n/a n/a
Roscommon County Hospital 285.16 21 7% n/a 655.22 48 7%
amended version V1.4
18
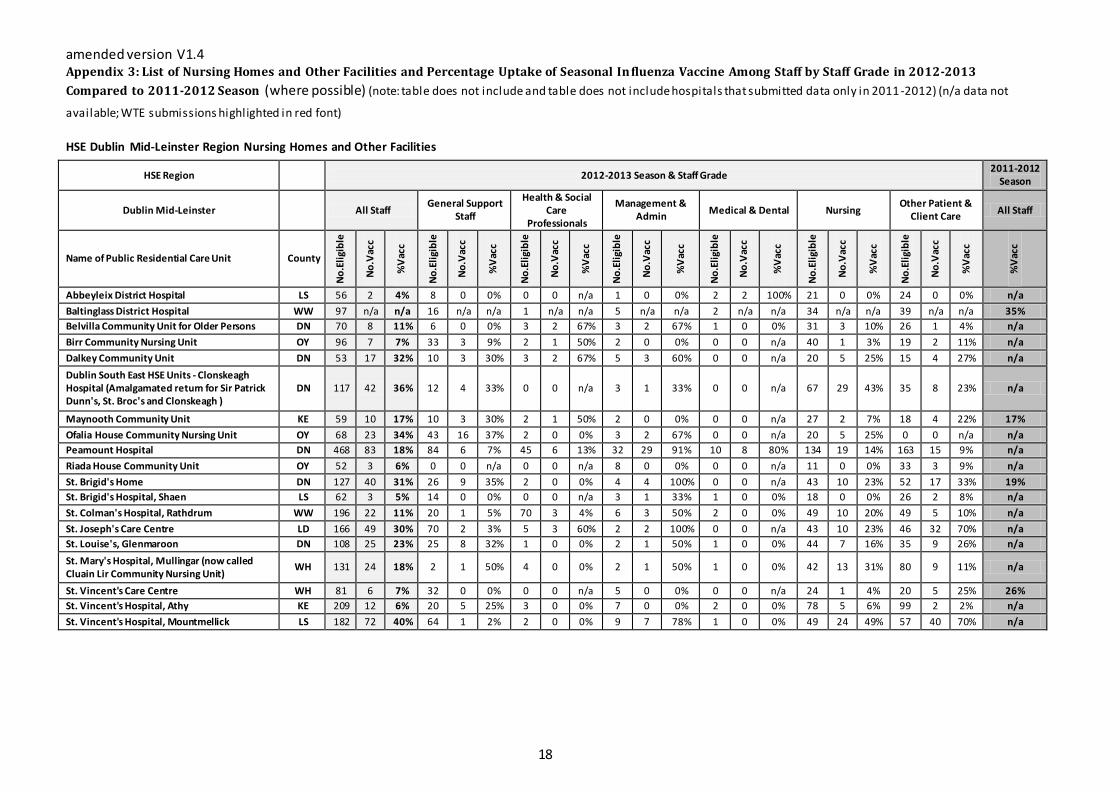
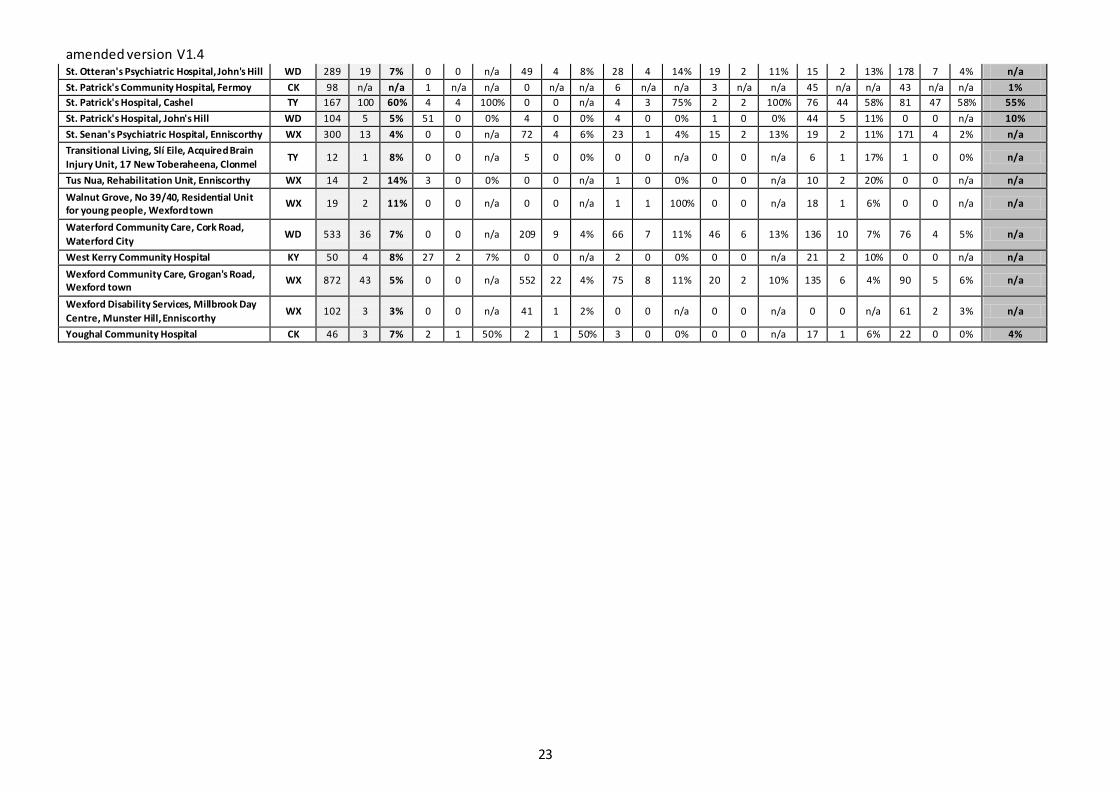
Appendix 3: List of Nursing Homes and Other Facilities and Percentage Uptake of Seasonal Influenza Vaccine Among Staff by Staff Grade in 2012-2013
Compared to 2011-2012 Season (where possible) (note: table does not include and table does not include hospitals that submitted data only in 2011-2012) (n/a data not
available; WTE submissions highlighted in red font)
HSE Dublin Mid-Leinster Region Nursing Homes and Other Facilities
HSE Region 2012-2013 Season & Staff Grade 2011-2012
Season
Dublin Mid-Leinster All Staff General Support
Staff
Health & Social Care
Professionals
Management & Admin
Medical & Dental Nursing Other Patient &
Client Care All Staff
Name of Public Residential Care Unit County
No
.Eli
gib
le
No
.Vac
c
%V
acc
No
.Eli
gib
le
No
.Vac
c
%V
acc
No
.Eli
gib
le
No
.Vac
c
%V
acc
No
.Eli
gib
le
No
.Vac
c
%V
acc
No
.Eli
gib
le
No
.Vac
c
%V
acc
No
.Eli
gib
le
No
.Vac
c
%V
acc
No
.Eli
gib
le
No
.Vac
c
%V
acc
%V
acc
Abbeyleix District Hospital LS 56 2 4% 8 0 0% 0 0 n/a 1 0 0% 2 2 100% 21 0 0% 24 0 0% n/a
Baltinglass District Hospital WW 97 n/a n/a 16 n/a n/a 1 n/a n/a 5 n/a n/a 2 n/a n/a 34 n/a n/a 39 n/a n/a 35%
Belvilla Community Unit for Older Persons DN 70 8 11% 6 0 0% 3 2 67% 3 2 67% 1 0 0% 31 3 10% 26 1 4% n/a
Birr Community Nursing Unit OY 96 7 7% 33 3 9% 2 1 50% 2 0 0% 0 0 n/a 40 1 3% 19 2 11% n/a
Dalkey Community Unit DN 53 17 32% 10 3 30% 3 2 67% 5 3 60% 0 0 n/a 20 5 25% 15 4 27% n/a
Dublin South East HSE Units - Clonskeagh Hospital (Amalgamated return for Sir Patrick Dunn's, St. Broc's and Clonskeagh )
DN 117 42 36% 12 4 33% 0 0 n/a 3 1 33% 0 0 n/a 67 29 43% 35 8 23% n/a
Maynooth Community Unit KE 59 10 17% 10 3 30% 2 1 50% 2 0 0% 0 0 n/a 27 2 7% 18 4 22% 17%
Ofalia House Community Nursing Unit OY 68 23 34% 43 16 37% 2 0 0% 3 2 67% 0 0 n/a 20 5 25% 0 0 n/a n/a
Peamount Hospital DN 468 83 18% 84 6 7% 45 6 13% 32 29 91% 10 8 80% 134 19 14% 163 15 9% n/a
Riada House Community Unit OY 52 3 6% 0 0 n/a 0 0 n/a 8 0 0% 0 0 n/a 11 0 0% 33 3 9% n/a
St. Brigid's Home DN 127 40 31% 26 9 35% 2 0 0% 4 4 100% 0 0 n/a 43 10 23% 52 17 33% 19%
St. Brigid's Hospital, Shaen LS 62 3 5% 14 0 0% 0 0 n/a 3 1 33% 1 0 0% 18 0 0% 26 2 8% n/a
St. Colman's Hospital, Rathdrum WW 196 22 11% 20 1 5% 70 3 4% 6 3 50% 2 0 0% 49 10 20% 49 5 10% n/a
St. Joseph's Care Centre LD 166 49 30% 70 2 3% 5 3 60% 2 2 100% 0 0 n/a 43 10 23% 46 32 70% n/a
St. Louise's, Glenmaroon DN 108 25 23% 25 8 32% 1 0 0% 2 1 50% 1 0 0% 44 7 16% 35 9 26% n/a
St. Mary's Hospital, Mullingar (now called Cluain Lir Community Nursing Unit)
WH 131 24 18% 2 1 50% 4 0 0% 2 1 50% 1 0 0% 42 13 31% 80 9 11% n/a
St. Vincent's Care Centre WH 81 6 7% 32 0 0% 0 0 n/a 5 0 0% 0 0 n/a 24 1 4% 20 5 25% 26%
St. Vincent's Hospital, Athy KE 209 12 6% 20 5 25% 3 0 0% 7 0 0% 2 0 0% 78 5 6% 99 2 2% n/a
St. Vincent's Hospital, Mountmellick LS 182 72 40% 64 1 2% 2 0 0% 9 7 78% 1 0 0% 49 24 49% 57 40 70% n/a

amended version V1.4
19
HSE Dublin North-East Region Nursing Homes and Other Facilities
HSE Region 2012-2013 Season & Staff Grade 2011-2012
Season
Dublin North-East All Staff General Support
Staff Health & Social
Care Professionals Management &
Admin Medical & Dental Nursing
Other Patient & Client Care
All Staff
Name of Public Residential Care Unit County
No
.Eli
gib
le
No
.Vac
c
%V
acc
No
.Eli
gib
le
No
.Vac
c
%V
acc
No
.Eli
gib
le
No
.Vac
c
%V
acc
No
.Eli
gib
le
No
.Vac
c
%V
acc
No
.Eli
gib
le
No
.Vac
c
%V
acc
No
.Eli
gib
le
No
.Vac
c
%V
acc
No
.Eli
gib
le
No
.Vac
c
%V
acc
%V
acc
Avalon House 15/16 Beechmount Vale MH 15 8 53% 0 0 n/a 7 5 71% 1 0 0% 0 0 n/a 7 3 43% 0 0 n/a n/a
Ballyconnel Community Services CN n/a n/a n/a n/a n/a n/a n/a n/a n/a n/a n/a n/a n/a n/a n/a n/a n/a n/a n/a n/a n/a n/a
Beaufort House, Navan Community Health Unit, Athboy Road
MH 70 12 17% 17 5 29% 4 1 25% 5 0 0% 1 0 0% 22 3 14% 21 3 14% 9%
Blackwater House, St. Davnet's Hospital MN 53 1 2% 16 0 0% 3 0 0% 1 0 0% 7 0 0% 24 1 4% 2 0 0% n/a
Boyne View House LH 36 3 8% 14 1 7% 10 1 10% 0 0 n/a 0 0 n/a 12 1 8% 0 0 n/a n/a
Caradas House, Drumconrath MH 13 4 31% 0 0 n/a 7 2 29% 1 0 0% 0 0 n/a 5 2 40% 0 0 n/a n/a
Cavan/Monaghan Disability Services, Cavan
CN n/a n/a n/a n/a n/a n/a n/a n/a n/a n/a n/a n/a n/a n/a n/a n/a n/a n/a n/a n/a n/a n/a
Clanntara House, Meath Disability Services, Athboy Road, Trim
MH 6 4 67% 6 4 67% 0 0 n/a 0 0 n/a 0 0 n/a 0 0 n/a 0 0 n/a n/a
Coill Darach MH 22 7 32% 0 0 n/a 14 4 29% 1 0 0% 0 0 n/a 7 3 43% 0 0 n/a n/a
Connolly Hospital (Silver Birch & Woodland Units)
DN 43 10 23% 6 4 67% 9 2 22% 0 0 n/a 0 0 n/a 28 4 14% 0 0 n/a 29%
Connolly Hospital (Sycamore Psychiatry of Old Age Unit)
DN 32 6 19% 6 2 33% 5 1 20% 0 0 n/a 0 0 n/a 21 3 14% 0 0 n/a n/a
Cottage Hospital LH 43 5 12% 21 1 5% 2 2 100% 3 0 0% 0 0 n/a 17 2 12% 0 0 n/a 26%
Ivy House, Proudstown Road MH 15 7 47% 9 4 44% 0 0 n/a 0 0 n/a 0 0 n/a 6 3 50% 0 0 n/a n/a
Lios na Greine, Disability Unit LH n/a n/a n/a n/a n/a n/a n/a n/a n/a n/a n/a n/a n/a n/a n/a n/a n/a n/a n/a n/a n/a 11%
Lisdarn Unit for the Elderly CN 48 n/a n/a 2 n/a n/a 0 n/a n/a 7 n/a n/a 0 n/a n/a 15 n/a n/a 24 n/a n/a 45%
Lusk Community Unit DN 62 23 37% 29 10 34% 0 0 n/a 3 1 33% 1 0 0% 28 12 43% 1 0 0% 31%
NaDriseoga Respite Unit, Commons Road MH 16 2 13% 9 0 0% 0 0 n/a 1 0 0% 0 0 n/a 6 2 33% 0 0 n/a n/a
No 25, Grand Priory MH 4 3 75% 4 3 75% 0 0 n/a 0 0 n/a 0 0 n/a 0 0 n/a 0 0 n/a n/a
Oriel House MN 22 3 14% 12 1 8% 0 0 n/a 2 1 50% 0 0 n/a 8 1 13% 0 0 n/a 0%
Raheny Community Nursing Unit DN 128 68 53% 27 16 59% 4 3 75% 4 2 50% 4 4 100% 47 21 45% 42 22 52% 39%
Seanchara Community Unit DN 65 19 29% 24 1 4% 4 1 25% 7 1 14% 1 0 0% 17 10 59% 12 6 50% 1%
Southside Intellectual Disability Unit DN 155 41 26% 7 5 71% 78 21 27% 6 0 0% 1 1 100% 63 14 22% 0 0 n/a 16%
St. Clare's Home DN 36 10 28% 9 3 33% 0 1 n/a 6 1 17% 1 0 0% 20 5 25% 0 0 n/a n/a
St. Ita's Psychiatric Hospital, Portrane DN 263 n/a n/a 72 n/a n/a 0 n/a n/a 0 n/a n/a 0 n/a n/a 191 n/a n/a 0 n/a n/a n/a
St. Joseph's Centre, Daughters of Charity, Grange Road
DN 315 78 25% 81 5 6% 2 0 0% 13 1 8% 0 0 n/a 132 31 23% 87 41 47% n/a
St. Joseph's Disability Service, Portrane DN 492.5 n/a n/a 0 n/a n/a 211 n/a n/a 0 n/a n/a 5.5 n/a n/a 263 n/a n/a 13 n/a n/a n/a
St. Joseph's Hospital, Ardee LH 41 10 24% 13 6 46% 0 0 n/a 4 3 75% 1 0 0% 14 0 0% 9 1 11% 13%
St. Joseph's Hospital, Trim MH 117 n/a n/a 15 n/a n/a 4 n/a n/a 1 n/a n/a 1 n/a n/a 48 n/a n/a 48 n/a n/a 14%
St. Mary's Hospital, Castleblaney MN 135 n/a n/a 22 n/a n/a 1 n/a n/a 4 n/a n/a 1 n/a n/a 37 n/a n/a 70 n/a n/a n/a

amended version V1.4
20
St. Mary's Hospital, Drogheda LH 41 9 22% 22 4 18% 1 1 100% 3 2 67% 1 1 100% 14 1 7% 0 0 n/a 6%
St. Mary's Hospital, Phoenix Park DN 494 64 13% 82 33 40% 29 4 14% 22 4 18% 15 1 7% 210 17 8% 136 5 4% n/a
St. Michaels House, Ballymun Road DN 1528 325 21% 338 108 32% 95 60 63% 133 51 38% 14 6 43% 258 26 10% 690 74 11% n/a
St. Oliver Plunkett Hospital LH n/a n/a n/a n/a n/a n/a n/a n/a n/a n/a n/a n/a n/a n/a n/a n/a n/a n/a n/a n/a n/a n/a
St. Rosalie's, Convent Lane DN 28 12 43% 7 2 29% 0 0 n/a 1 1 100% 0 0 n/a 10 6 60% 10 3 30% n/a
St. Vincent's Centre, Navan Road DN 533 127 24% 58 25 43% 51 11 22% 51 14 27% 7 3 43% 164 43 26% 202 31 15% n/a
Sullivan Memorial Home CN 28 1 4% 7 0 0% 0 0 n/a 3 1 33% 0 0 n/a 6 0 0% 12 0 0% 17%
The Coastguards Disability Unit, 194 Lower Point Road,
LH 15 7 47% 0 4 n/a 0 0 n/a 1 0 0% 0 3 n/a 6 0 0% 8 0 0% 43%
Virginia Community Services CN n/a n/a n/a n/a n/a n/a n/a n/a n/a n/a n/a n/a n/a n/a n/a n/a n/a n/a n/a n/a n/a 4%

amended version V1.4
21
HSE South Region Nursing Homes and Other Facilities
HSE Region 2012-2013 Season & Staff Grade 2011-2012
Season
South All Staff General Support
Staff
Health & Social Care
Professionals
Management & Admin
Medical & Dental Nursing Other Patient &
Client Care All Staff
Name of Public Residential Care Unit County
No
.Eli
gib
le
No
.Vac
c
%V
acc
No
.Eli
gib
le
No
.Vac
c
%V
acc
No
.Eli
gib
le
No
.Vac
c
%V
acc
No
.Eli
gib
le
No
.Vac
c
%V
acc
No
.Eli
gib
le
No
.Vac
c
%V
acc
No
.Eli
gib
le
No
.Vac
c
%V
acc
No
.Eli
gib
le
No
.Vac
c
%V
acc
%V
acc
55 Westlands (Flats), St John's Road, Wexford Town
WX n/a n/a n/a n/a n/a n/a n/a n/a n/a n/a n/a n/a n/a n/a n/a n/a n/a n/a n/a n/a n/a n/a
56 Westlands Hostel, St John's Road, Wexford Town
WX n/a n/a n/a n/a n/a n/a n/a n/a n/a n/a n/a n/a n/a n/a n/a n/a n/a n/a n/a n/a n/a n/a
58 Westlands, St John's Road, Wexford Town
WX 8 n/a n/a 0 n/a n/a 0 n/a n/a 0 n/a n/a 0 n/a n/a 6 n/a n/a 2 n/a n/a n/a
Ardamine Community Mental Health Hostel, Ardamine, Gorey
WX 8 0 0% 3 0 0% 0 0 n/a 0 0 n/a 0 0 n/a 5 0 0% 0 0 n/a n/a
Ballincollig Community Nursing Unit CK 124 6 5% 0 0 n/a 40 5 13% 4 0 0% 0 0 n/a 40 1 3% 40 0 0% n/a
Bandon Community Hospital CK 35 1 3% 0 0 n/a 0 0 n/a 5 0 0% 0 0 n/a 16 0 0% 14 1 7% n/a
Bantry General Hospital CK 28.5 0 0% 9 0 0% 3 0 0% 2.5 0 0% 0 0 n/a 13 0 0% 1 0 0% n/a
Beech Lodge, Residential unit for young people, Drinagh
WX 22 1 5% 0 0 n/a 1 0 0% 1 0 0% 0 0 n/a 20 1 5% 0 0 n/a n/a
Brownswood Hostel, St. Senan's Hospital, Enniscorthy
WX n/a n/a n/a n/a n/a n/a n/a n/a n/a n/a n/a n/a n/a n/a n/a n/a n/a n/a n/a n/a n/a n/a
Caherciveen Community Hospital KY 61 0 0% 11 0 0% 1 0 0% 4 0 0% 5 0 0% 22 0 0% 18 0 0% n/a
Carlow District Hospital CW 35 1 3% 12 1 8% 3 0 0% 3 0 0% 2 0 0% 15 0 0% 0 0 n/a n/a
Carlow/Kilkenny Community Care, James's Green, Kilkenny City
KK 964 79 8% 0 0 n/a 586 57 10% 85 4 5% 23 2 9% 141 9 6% 129 7 5% n/a
Carrick on Suir District Hospital (St. Brigid's) TY 24 5 21% 13 2 15% 0 0 n/a 0 0 n/a 0 0 n/a 11 3 27% 0 0 n/a 21%
Castlecomer District Hospital KK 39 0 0% 15 0 0% 0 0 n/a 3 0 0% 2 0 0% 19 0 0% 0 0 n/a n/a
Castletownbere Community Hospital (St. Joseph's)
CK 42 n/a n/a 0 n/a n/a 0 n/a n/a 4 n/a n/a 0 n/a n/a 19 n/a n/a 19 n/a n/a 0%
Clogheen District Hospital (St. Theresa's) TY 23 2 9% 14 2 14% 0 0 n/a 1 0 0% 0 0 n/a 8 0 0% 0 0 n/a n/a
Clonakilty Community Hospital and Long Stay Unit (Mount Carmel Home and Hospital)
CK n/a n/a n/a n/a n/a n/a n/a n/a n/a n/a n/a n/a n/a n/a n/a n/a n/a n/a n/a n/a n/a n/a
Cluain Arainn Community Nursing Unit TY 32 12 38% 17 4 24% 0 0 n/a 4 3 75% 2 1 50% 9 4 44% 0 0 n/a 4%
Cois Abhainn CK 19 n/a n/a 0 n/a n/a 0 n/a n/a 0 n/a n/a 0 n/a n/a 7 n/a n/a 12 n/a n/a n/a
Coolnaboy Hostel, St. Senan's Hostel, Enniscorthy
WX n/a n/a n/a n/a n/a n/a n/a n/a n/a n/a n/a n/a n/a n/a n/a n/a n/a n/a n/a n/a n/a n/a
Damien House, Disability Unit TY 38 n/a n/a 3 n/a n/a 21 n/a n/a 5 n/a n/a 0 n/a n/a 9 n/a n/a 0 n/a n/a 10%
Dunabbey House WD n/a n/a n/a n/a n/a n/a n/a n/a n/a n/a n/a n/a n/a n/a n/a n/a n/a n/a n/a n/a n/a n/a

amended version V1.4
22
Dunamanway Community Hospital (St. Anthony's)
CK 27 n/a n/a 13 n/a n/a 0 n/a n/a 3 n/a n/a 1 n/a n/a 10 n/a n/a 0 n/a n/a n/a
Dungarvan Community Care, Dungarvan WD 244 19 8% 0 0 n/a 161 6 4% 7 3 43% 6 2 33% 23 3 13% 47 5 11% n/a
Dungarvan Community Hospital - incorporting St. Josephs Hospital and Dungarvan District Hospital (St. Vincent's)
WD 190 25 13% 96 13 14% 21 4 19% 7 1 14% 0 0 n/a 66 7 11% 0 0 n/a n/a
Gorey District Hospital WX 36 n/a n/a 16 n/a n/a 0 n/a n/a 1 n/a n/a 0 n/a n/a 19 n/a n/a 0 n/a n/a 0%
Grove House, Intellectual Disability Service, St. Mary's Health Campus
CK 33 5 15% 5 1 20% 0 0 n/a 1 0 0% 0 0 n/a 27 4 15% 0 0 n/a n/a
Haywood Lodge, Community Nursing Unit TY 39 n/a n/a 4 n/a n/a 0 n/a n/a 1 n/a n/a 4 n/a n/a 30 n/a n/a 0 n/a n/a n/a
Heather House CK 73 5 7% 7 0 0% 0 0 n/a 4 0 0% 2 0 0% 23 2 9% 37 3 8% 0%
Hostel, 82 Moran Park, Enniscorthy WX n/a n/a n/a n/a n/a n/a n/a n/a n/a n/a n/a n/a n/a n/a n/a n/a n/a n/a n/a n/a n/a n/a
Kanturk Community Hospital CK 53 4 8% 1 1 100% 0 0 n/a 4 2 50% 0 0 n/a 22 1 5% 26 0 0% 31%
Kenmare Community Hospital KY 31 7 23% 1 0 0% 1 0 0% 3 1 33% 1 0 0% 11 1 9% 14 5 36% n/a
Kinsale Community Hospital CK 57 13 23% 26 3 12% 0 0 n/a 8 2 25% 0 0 n/a 23 8 35% 0 0 n/a n/a
Lakefield House, Residential unit for children, Dunmore Road, Waterford City
WD 16 1 6% 0 0 n/a 0 0 n/a 1 0 0% 0 0 n/a 15 1 7% 0 0 n/a n/a
Leeside, Tullamaine, Callan, Co. Kilkenny KK 19 0 0% 0 0 n/a 19 0 0% 0 0 n/a 0 0 n/a 0 0 n/a 0 0 n/a n/a
Listowel Community Hospital KY 62 12 19% 7 2 29% 3 2 67% 2 0 0% 7 0 0% 18 3 17% 25 5 20% n/a
Loher/Dinis Wards - Kerry General Hospital KY 42 2 5% 3 0 0% 16 0 0% 1 0 0% 0 0 n/a 21 2 10% 1 0 0% n/a
Macroom Community Hospital CK 45 2 4% 22 1 5% 0 0 n/a 3 0 0% 0 0 n/a 20 1 5% 0 0 n/a n/a
Midleton Community Hospital and Long Stay Unit (Our Lady of Lourdes)
CK 75 41 55% 28 15 54% 0 0 n/a 2 1 50% 0 0 n/a 45 25 56% 0 0 n/a n/a
Millview, St. John's Hospital Grounds, Enniscorthy
WX 15 n/a n/a 4 n/a n/a 0 n/a n/a 0 n/a n/a 0 n/a n/a 11 n/a n/a 0 n/a n/a n/a
New Haughton Hospital WX 63 15 24% 5 1 20% 6 5 83% 2 0 0% 1 1 100% 24 5 21% 25 3 12% n/a
Re Nua, Adult Acquired Brain Injury Services, Our Lady's Campus, Cashel
TY 17 2 12% 4 1 25% 0 0 n/a 0 0 n/a 0 0 n/a 13 1 8% 0 0 n/a n/a
Sacred Heart Centre, Disability centre for children, Lady Lane, Waterford City
WD 12 1 8% 0 0 n/a 6 1 17% 1 0 0% 0 0 n/a 0 0 n/a 5 0 0% n/a
Sacred Heart Hospital, Old Dublin Road CW 121 17 14% 0 0 n/a 65 9 14% 2 1 50% 1 0 0% 6 2 33% 47 5 11% n/a
Schull Community Hospital (St. Gabriel's)
CK 38 n/a n/a 16 n/a n/a 1 n/a n/a 5 n/a n/a 2 n/a n/a 14 n/a n/a 0 n/a n/a n/a
Skibbereen Community Hospital (St. Anne's) CK 51 n/a n/a 4 n/a n/a 4 n/a n/a 4 n/a n/a 2 n/a n/a 17 n/a n/a 20 n/a n/a 0%
Springhill Hostels, Kilagoley, St. Senan's Hospital, Enniscorthy
WX n/a n/a n/a n/a n/a n/a n/a n/a n/a n/a n/a n/a n/a n/a n/a n/a n/a n/a n/a n/a n/a n/a
St. Columbanus Home incorporating Killarney Community Hospital
KY 181 n/a n/a 63 n/a n/a 0 n/a n/a 6 n/a n/a 0 n/a n/a 72 n/a n/a 40 n/a n/a n/a
St. Columba's Hospital KK 150 2 1% 84 0 0% 3 1 33% 4 0 0% 1 0 0% 58 1 2% 0 0 n/a 4%
St. Finbarr's Hospital CK n/a 68 n/a n/a 0 n/a n/a 2 n/a n/a 11 n/a n/a 0 n/a n/a 37 n/a n/a 18 n/a n/a
St. John's Hospital & St. John's Ward Ely Hosp.
WX 228 19 8% 122 10 8% 8 1 13% 6 0 0% 0 0 n/a 92 8 9% 0 0 n/a n/a
St. Joseph's Community Hospital, Millstreet CK 26 1 4% 13 0 0% 0 0 n/a 3 1 33% 2 0 0% 8 0 0% 0 0 n/a n/a
St. Joseph's School, Ferryhouse, Clonmel TY 113 4 4% 0 0 n/a 25 0 0% 9 1 11% 0 0 n/a 77 3 4% 2 0 0% n/a
amended version V1.4
23
St. Otteran's Psychiatric Hospital, John's Hill WD 289 19 7% 0 0 n/a 49 4 8% 28 4 14% 19 2 11% 15 2 13% 178 7 4% n/a
St. Patrick's Community Hospital, Fermoy CK 98 n/a n/a 1 n/a n/a 0 n/a n/a 6 n/a n/a 3 n/a n/a 45 n/a n/a 43 n/a n/a 1%
St. Patrick's Hospital, Cashel TY 167 100 60% 4 4 100% 0 0 n/a 4 3 75% 2 2 100% 76 44 58% 81 47 58% 55%
St. Patrick's Hospital, John's Hill WD 104 5 5% 51 0 0% 4 0 0% 4 0 0% 1 0 0% 44 5 11% 0 0 n/a 10%
St. Senan's Psychiatric Hospital, Enniscorthy WX 300 13 4% 0 0 n/a 72 4 6% 23 1 4% 15 2 13% 19 2 11% 171 4 2% n/a
Transitional Living, Slí Eile, Acquired Brain
Injury Unit, 17 New Toberaheena, Clonmel TY 12 1 8% 0 0 n/a 5 0 0% 0 0 n/a 0 0 n/a 6 1 17% 1 0 0% n/a
Tus Nua, Rehabilitation Unit, Enniscorthy WX 14 2 14% 3 0 0% 0 0 n/a 1 0 0% 0 0 n/a 10 2 20% 0 0 n/a n/a
Walnut Grove, No 39/40, Residential Unit for young people, Wexford town
WX 19 2 11% 0 0 n/a 0 0 n/a 1 1 100% 0 0 n/a 18 1 6% 0 0 n/a n/a
Waterford Community Care, Cork Road,
Waterford City WD 533 36 7% 0 0 n/a 209 9 4% 66 7 11% 46 6 13% 136 10 7% 76 4 5% n/a
West Kerry Community Hospital KY 50 4 8% 27 2 7% 0 0 n/a 2 0 0% 0 0 n/a 21 2 10% 0 0 n/a n/a
Wexford Community Care, Grogan's Road, Wexford town
WX 872 43 5% 0 0 n/a 552 22 4% 75 8 11% 20 2 10% 135 6 4% 90 5 6% n/a
Wexford Disability Services, Millbrook Day
Centre, Munster Hill, Enniscorthy WX 102 3 3% 0 0 n/a 41 1 2% 0 0 n/a 0 0 n/a 0 0 n/a 61 2 3% n/a
Youghal Community Hospital CK 46 3 7% 2 1 50% 2 1 50% 3 0 0% 0 0 n/a 17 1 6% 22 0 0% 4%

amended version V1.4
24
HSE West Region Nursing Homes and Other Facilities
HSE Region 2012-2013 Season & Staff Grade 2011-2012
Season
West All Staff General Support
Staff Health & Social Care
Professionals Management &
Admin Medical & Dental Nursing
Other Patient & Client Care
All Staff
Name of Public Residential Care Unit
County
No
.Eli
gib
le
No
.Vac
c
%V
acc
No
.Eli
gib
le
No
.Vac
c
%V
acc
No
.Eli
gib
le
No
.Vac
c
%V
acc
No
.Eli
gib
le
No
.Vac
c
%V
acc
No
.Eli
gib
le
No
.Vac
c
%V
acc
No
.Eli
gib
le
No
.Vac
c
%V
acc
No
.Eli
gib
le
No
.Vac
c
%V
acc
%V
acc
Adult Mental Health Unit, Mayo General Hospital, Castlebar, Co. Mayo
MO n/a n/a n/a n/a n/a n/a n/a n/a n/a n/a n/a n/a n/a n/a n/a n/a n/a n/a n/a n/a n/a n/a
An Coillin, Westport Road, Castlebar
MO n/a n/a n/a n/a n/a n/a n/a n/a n/a n/a n/a n/a n/a n/a n/a n/a n/a n/a n/a n/a n/a n/a
Aras Attracta Intellectual Disability Services
MO 148.6 n/a n/a 0 n/a n/a 0 n/a n/a 9.6 n/a n/a 2 n/a n/a 99 n/a n/a 38 n/a n/a n/a
Aras Mac Dara GW 61 3 5% 31 3 10% 0 0 n/a 7 0 0% 0 0 n/a 21 0 0% 2 0 0% n/a
Aras Mathair Pol Community Nursing Unit
RN 34 3 9% 8 1 13% 8 0 0% 2 0 0% 0 0 n/a 11 0 0% 5 2 40% n/a
Aras Mhuire Community Nursing Unit
GW 27 5 19% 10 2 20% 0 0 n/a 2 1 50% 0 0 n/a 15 2 13% 0 0 n/a 29%
Aras Ronan GW 25 19 76% 6 5 83% 1 1 100% 2 1 50% 0 0 n/a 7 6 86% 9 6 67% 84%
Arus Breffni LM 23 4 17% 1 0 0% 4 0 0% 0 0 n/a 0 0 n/a 8 3 38% 10 1 10% n/a
Arus Carolan LM 34 3 9% 0 0 n/a 0 0 n/a 2 1 50% 0 0 n/a 14 0 0% 18 2 11% 4%
Ballydevitt Group Home, Donegal Town
DL n/a n/a n/a n/a n/a n/a n/a n/a n/a n/a n/a n/a n/a n/a n/a n/a n/a n/a n/a n/a n/a 0%
Belmullet District Hospital (including Aras Deirbhile)
MO 52 4 8% 35 2 6% 0 0 n/a 3 0 0% 1 0 0% 13 2 15% 0 0 n/a 0%
Buncrana Community Nursing Unit
DL 55 6 11% 1 1 100% 0 0 n/a 3 1 33% 0 0 n/a 14 2 14% 37 2 5% n/a
Carndonagh Community Hospital
DL 75 7 9% 1 1 100% 6 1 17% 8 1 13% 0 0 n/a 22 2 9% 38 2 5% 9%
Carndonagh JCM Residential Unit
DL n/a n/a n/a n/a n/a n/a n/a n/a n/a n/a n/a n/a n/a n/a n/a n/a n/a n/a n/a n/a n/a n/a
Cill Aoibhinn Group Home, Donegal Town
DL n/a n/a n/a n/a n/a n/a n/a n/a n/a n/a n/a n/a n/a n/a n/a n/a n/a n/a n/a n/a n/a 7%
Cleary House Supervised Residential Unit, Mental Health Services
DL 10 2 20% 0 0 n/a 0 0 n/a 0 0 n/a 0 0 n/a 10 2 20% 0 0 n/a 13%
Clifden District Hospital GW 37 0 0% 7 0 0% 0 0 n/a 3 0 0% 2 0 0% 14 0 0% 11 0 0% 0%
Cloonamahon Community Group Homes
SO 61 3 5% 33 1 3% 0 0 n/a 1 0 0% 0 0 n/a 27 2 7% 0 0 n/a n/a
Cloonamahon Learning Disability Services
SO 116 12 10% 64 4 6% 0 0 n/a 12 2 17% 0 0 n/a 39 6 15% 1 0 0% 14%
Dalton Community Nursing Unit
MO 45 1 2% 10 0 0% 4 0 0% 4 0 0% 0 0 n/a 12 1 8% 15 0 0% n/a
amended version V1.4
25
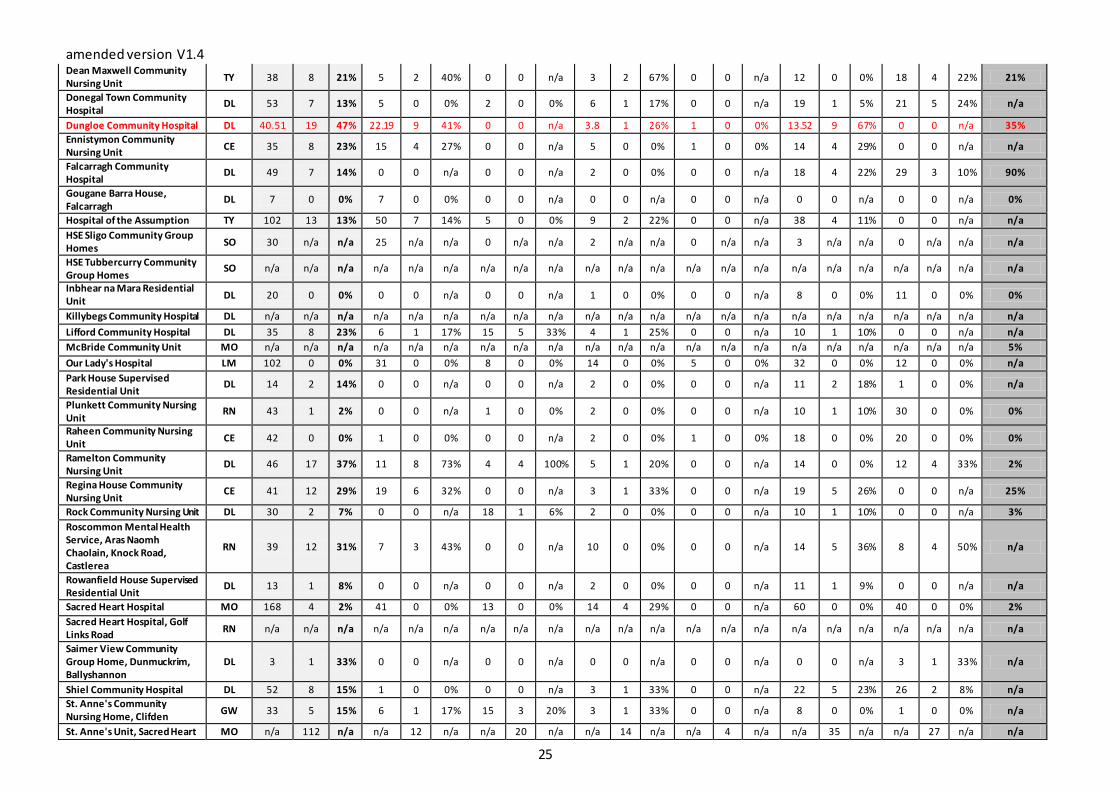
Dean Maxwell Community Nursing Unit
TY 38 8 21% 5 2 40% 0 0 n/a 3 2 67% 0 0 n/a 12 0 0% 18 4 22% 21%
Donegal Town Community Hospital
DL 53 7 13% 5 0 0% 2 0 0% 6 1 17% 0 0 n/a 19 1 5% 21 5 24% n/a
Dungloe Community Hospital DL 40.51 19 47% 22.19 9 41% 0 0 n/a 3.8 1 26% 1 0 0% 13.52 9 67% 0 0 n/a 35%
Ennistymon Community Nursing Unit
CE 35 8 23% 15 4 27% 0 0 n/a 5 0 0% 1 0 0% 14 4 29% 0 0 n/a n/a
Falcarragh Community Hospital
DL 49 7 14% 0 0 n/a 0 0 n/a 2 0 0% 0 0 n/a 18 4 22% 29 3 10% 90%
Gougane Barra House, Falcarragh
DL 7 0 0% 7 0 0% 0 0 n/a 0 0 n/a 0 0 n/a 0 0 n/a 0 0 n/a 0%
Hospital of the Assumption TY 102 13 13% 50 7 14% 5 0 0% 9 2 22% 0 0 n/a 38 4 11% 0 0 n/a n/a
HSE Sligo Community Group Homes
SO 30 n/a n/a 25 n/a n/a 0 n/a n/a 2 n/a n/a 0 n/a n/a 3 n/a n/a 0 n/a n/a n/a
HSE Tubbercurry Community Group Homes
SO n/a n/a n/a n/a n/a n/a n/a n/a n/a n/a n/a n/a n/a n/a n/a n/a n/a n/a n/a n/a n/a n/a
Inbhear na Mara Residential Unit
DL 20 0 0% 0 0 n/a 0 0 n/a 1 0 0% 0 0 n/a 8 0 0% 11 0 0% 0%
Killybegs Community Hospital DL n/a n/a n/a n/a n/a n/a n/a n/a n/a n/a n/a n/a n/a n/a n/a n/a n/a n/a n/a n/a n/a n/a
Lifford Community Hospital DL 35 8 23% 6 1 17% 15 5 33% 4 1 25% 0 0 n/a 10 1 10% 0 0 n/a n/a
McBride Community Unit MO n/a n/a n/a n/a n/a n/a n/a n/a n/a n/a n/a n/a n/a n/a n/a n/a n/a n/a n/a n/a n/a 5%
Our Lady's Hospital LM 102 0 0% 31 0 0% 8 0 0% 14 0 0% 5 0 0% 32 0 0% 12 0 0% n/a
Park House Supervised Residential Unit
DL 14 2 14% 0 0 n/a 0 0 n/a 2 0 0% 0 0 n/a 11 2 18% 1 0 0% n/a
Plunkett Community Nursing Unit
RN 43 1 2% 0 0 n/a 1 0 0% 2 0 0% 0 0 n/a 10 1 10% 30 0 0% 0%
Raheen Community Nursing Unit
CE 42 0 0% 1 0 0% 0 0 n/a 2 0 0% 1 0 0% 18 0 0% 20 0 0% 0%
Ramelton Community Nursing Unit
DL 46 17 37% 11 8 73% 4 4 100% 5 1 20% 0 0 n/a 14 0 0% 12 4 33% 2%
Regina House Community Nursing Unit
CE 41 12 29% 19 6 32% 0 0 n/a 3 1 33% 0 0 n/a 19 5 26% 0 0 n/a 25%
Rock Community Nursing Unit DL 30 2 7% 0 0 n/a 18 1 6% 2 0 0% 0 0 n/a 10 1 10% 0 0 n/a 3%
Roscommon Mental Health Service, Aras Naomh Chaolain, Knock Road, Castlerea
RN 39 12 31% 7 3 43% 0 0 n/a 10 0 0% 0 0 n/a 14 5 36% 8 4 50% n/a
Rowanfield House Supervised Residential Unit
DL 13 1 8% 0 0 n/a 0 0 n/a 2 0 0% 0 0 n/a 11 1 9% 0 0 n/a n/a
Sacred Heart Hospital MO 168 4 2% 41 0 0% 13 0 0% 14 4 29% 0 0 n/a 60 0 0% 40 0 0% 2%
Sacred Heart Hospital, Golf Links Road
RN n/a n/a n/a n/a n/a n/a n/a n/a n/a n/a n/a n/a n/a n/a n/a n/a n/a n/a n/a n/a n/a n/a
Saimer View Community Group Home, Dunmuckrim, Ballyshannon
DL 3 1 33% 0 0 n/a 0 0 n/a 0 0 n/a 0 0 n/a 0 0 n/a 3 1 33% n/a
Shiel Community Hospital DL 52 8 15% 1 0 0% 0 0 n/a 3 1 33% 0 0 n/a 22 5 23% 26 2 8% n/a
St. Anne's Community Nursing Home, Clifden
GW 33 5 15% 6 1 17% 15 3 20% 3 1 33% 0 0 n/a 8 0 0% 1 0 0% n/a
St. Anne's Unit, Sacred Heart MO n/a 112 n/a n/a 12 n/a n/a 20 n/a n/a 14 n/a n/a 4 n/a n/a 35 n/a n/a 27 n/a n/a

amended version V1.4
26
Hospital, Castlebar
St. Augustine's Community Nursing Unit
MO 38 0 0% 2 0 0% 0 0 n/a 4 0 0% 0 0 n/a 14 0 0% 18 0 0% n/a
St. Brendan's Home GW 107 20 19% 46 9 20% 4 0 0% 5 2 40% 0 0 n/a 40 9 23% 12 0 0% n/a
St. Camillus' Community Hospital
LK n/a 24 n/a n/a 1 n/a n/a 3 n/a n/a 4 n/a n/a 0 n/a n/a 6 n/a n/a 10 n/a n/a
St. Conlon's Community Nursing Unit
TY 36 5 14% 19 3 16% 0 0 n/a 2 1 50% 0 0 n/a 15 1 7% 0 0 n/a 10%
St. Ita's Community Hospital LK 156 27 17% 7 2 29% 7 1 14% 14 6 43% 1 0 0% 62 7 11% 65 11 17% n/a
St. John's Community Hospital
SO 224 7 3% 66 1 2% 11 3 27% 13 0 0% 2 0 0% 90 2 2% 42 1 2% 4%
St. Joseph's Community Hospital
CE 176 15 9% 0 0 n/a 0 0 n/a 0 0 n/a 3 0 0% 99 8 8% 74 7 9% n/a
St. Joseph's Community Hospital, Stranorlar
DL 105 4 4% 67 0 0% 0 0 n/a 11 1 9% 1 1 100% 26 2 8% 0 0 n/a n/a
St. Patrick's Community Hospital
LM 153 21 14% 43 6 14% 4 2 50% 12 4 33% 2 0 0% 55 4 7% 37 5 14% 10%
Swinford District Hospital MO 39 0 0% 0 0 n/a 1 0 0% 4 0 0% 0 0 n/a 16 0 0% 18 0 0% 5%
Swinford Treatment Centre, The Lodge, Dublin Road, Swinford
MO 15 10 67% 6 4 67% 0 0 n/a 0 0 n/a 0 0 n/a 9 6 67% 0 0 n/a n/a
Teach Aisling, Westport Road, Castlebar
MO n/a n/a n/a n/a n/a n/a n/a n/a n/a n/a n/a n/a n/a n/a n/a n/a n/a n/a n/a n/a n/a n/a

amended version V1.4
27
Appendix 4: List of hospitals and known nursing homes and other facilities that did not provide uptake data during the 2012-2013 season
Hospitals:
Mater Misericordiae University Hospital, Dublin
Mid-Western Regional Hospital, Dooradoyle, Limerick
National Maternity Hospital, Holles Street, Dublin
Rotunda Hospital , Dublin
Royal Victoria Eye & Ear Hospital, Dublin
St John’s Hospital, Limerick
St Luke's Hospital, Dublin
Clontarf Hospital, Dublin
Nursing Homes and Other Facilities:
• Clarehaven Nursing Home, St. Canice's Road, Dublin 11 • Community Unit, Bridge Street, Navan, Co. Meath • Our Lady's Hospice, Harold's Cross , Dublin 6W • St. James' Hospital, Dublin 8 (nursing home unit), Dublin 8
• Meath Community Hospital, 1-9 Heytesbury Street, Dublin 8 • Leopardstown Park Hospital, Foxrock, Dublin 18 • The Royal Hospital, Morehampton Road, Donnybrook, Dublin 4 • Cherry Orchard Hospital, Ballyfermot Road, Dublin 10
• Loughloe House, Abbey Road, Athlone, Co. Westmeath • Wicklow District Hospital, Ball alley, Co. Wicklow • The Orchard Welfare Home, Bray, Co. Wicklow
• Units 5 and 6 - Merlin Park Hospital, Dublin Road, Co. Galway • St. Fionnan's Community Nursing Unit, Achill Sound, Achill Island, Co. Mayo • St. Joseph's District Hospital, Ballina, Co. Mayo • The Moorings Hostel, Mental Health Unit, Dundalk, Co. Louth
• An Solasan, Priorsland Road, Louth PCCC, Dundalk, Co. Louth • St. Mary's Residence, Louth/Meath Mental Health Unit, Drogheda, Co. Louth • Ballymacool Respite House, Letterkenny, Co. Donegal
• Sean O'Hare Unit & Associated (Learning Disability) Services, Stranorlar , Co. Donegal • Carndonagh Supervised Residential Unit, Co. Donegal • Wisdom Services Cregg House Group Homes, Co. Sligo • Wisdom Services Cregg House, Co. Sligo