Embed Size (px)
Citation preview
1
CDP Nordic 260 Climate Change Report 2013
Summary Findings
October 2013
2
The evolution of CDP
With great pleasure, CDP announced an exciting change this year.
Over ten years ago CDP pioneered the only global disclosure system for companies to report their environmental impacts and strategies to investors. In that time, and with your support, CDP has accelerated climate change and natural resource issues to the boardroom and has moved beyond the corporate world to engage with cities and governments.
The CDP platform has evolved significantly, supporting multinational purchasers to build more sustainable supply chains. It enables cities around the world to exchange information, take best practice action and build climate resilience. We assess the climate performance of companies and drive improvements through shareholder engagement.
Our offering to the global marketplace has expanded to cover a wider spectrum of the earth’s natural capital, specifically water and forests, alongside carbon, energy and climate.
For these reasons, we have outgrown our former name of the Carbon Disclosure Project and rebranded to CDP. Many of you already know and refer to us in this way. Our rebrand denotes our progress as we continue to catalyze action and respond to business, finance, investment and environmental needs globally.
We now have a bolder, more dynamic look and logo that reflects the scale of the work we must undertake in the coming years to move the markets ahead of where they would otherwise be on these issues and realize truly sustainable economies.
Over 5,000 companies from all over the world have been asked to report on climate change through CDP this year;
81% of the world’s 500 largest public companies listed on the Global 500 engage with CDP to enable effective measurement of their carbon footprint and climate change action;
CDP is a not-for-profit organization. If you would like to support our vital work through donations or sponsorship opportunities, please email [email protected] or telephone +44 (0) 7703 184 312.
3
CEO Foreword
This year we passed a significant landmark of 400ppm of carbon dioxide in the atmosphere and are rapidly heading towards 450ppm, accepted by many governments as the upper limit to avoid dangerous climate change. The Intergovernmental Panel on Climate Change (IPCC) 5th assessment report (AR5) strengthens the scientific case for action.
Fears are increasing over future climate change impacts as we see more extreme weather events, Hurricane Sandy the most noted with damages totalling some $42 billion1. The unprecedented melting of the Arctic ice is a clear climate alarm bell, while the first 10 years of this century have been the world’s hottest since records began, according to the World Meteorological Organization.
The result is a seismic shift in corporate awareness of the need to assess physical risk from climate change and to build resilience.
For investors, the risk of stranded assets has been brought to the fore by the work of Carbon Tracker. They calculate around 80 % of coal, oil and gas reserves are unburnable, if governments are to meet global commitments to keep the temperature rise below 2°C. This has serious implications for institutional investors’ portfolios and valuations of companies with fossil fuel reserves.
The economic case for action is strengthening. This year, we published the 3% Solution2 with WWF showing that the US corporate sector could reduce emissions by 3% each year between 2010 and 2020 and deliver $780 billion in savings above costs as a result. 79% of US companies responding to CDP report higher ROI on emission reductions
As countries around the world seek economic growth, strong employment and safe environments, corporations have a unique responsibility to deliver that growth in a way that uses natural resources wisely. The opportunity is enormous and it is the only growth worth having.
investments than on the average business investment. Meanwhile, governments are taking new action: The US Administration has launched its Climate Action Plan, with a new emphasis on reducing emissions from utilities; China is developing air pollution measures and moving toward pilot cap and trade schemes; the UK Government has mandated greenhouse gas emissions reporting for all large listed companies; the EU is looking at improving environmental and other reporting.
The pressure on corporations, investors and governments to act continues. At CDP, we have broadened our work to add forests to climate and water so our programs now extend to an estimated 79% of natural capital, by value3. To reflect this, we rebranded at the start of the year from the Carbon Disclosure Project to CDP and are increasing our focus on projects to accelerate action. One explores how corporations influence public policy on climate change both positively and negatively. Some corporations are still acting – both directly and through trade associations – to prevent the inevitable: nations need sensible climate regulation that protects the public interest over the long term.
As countries around the world seek economic growth, strong employment and safe environments, corporations have a unique responsibility to deliver that growth in a way that uses natural resources wisely. The opportunity is enormous and it is the only growth worth having.
Paul Simpson CEO CDP
1 New York State Hurricane Sandy Damage Assessment; Governor Andrew Cuomo; November 12, 2012 http://www.governor.ny.gov/press/11262012-damageassessment 2 https://www.cdproject.net/CDPResults/3-percent-solution-report.pdf 3 Based on findings from the report Natural Capital at Risk: The Top 100 Externalities of Business, published by TEEB for Business Coalition in April 2013
4
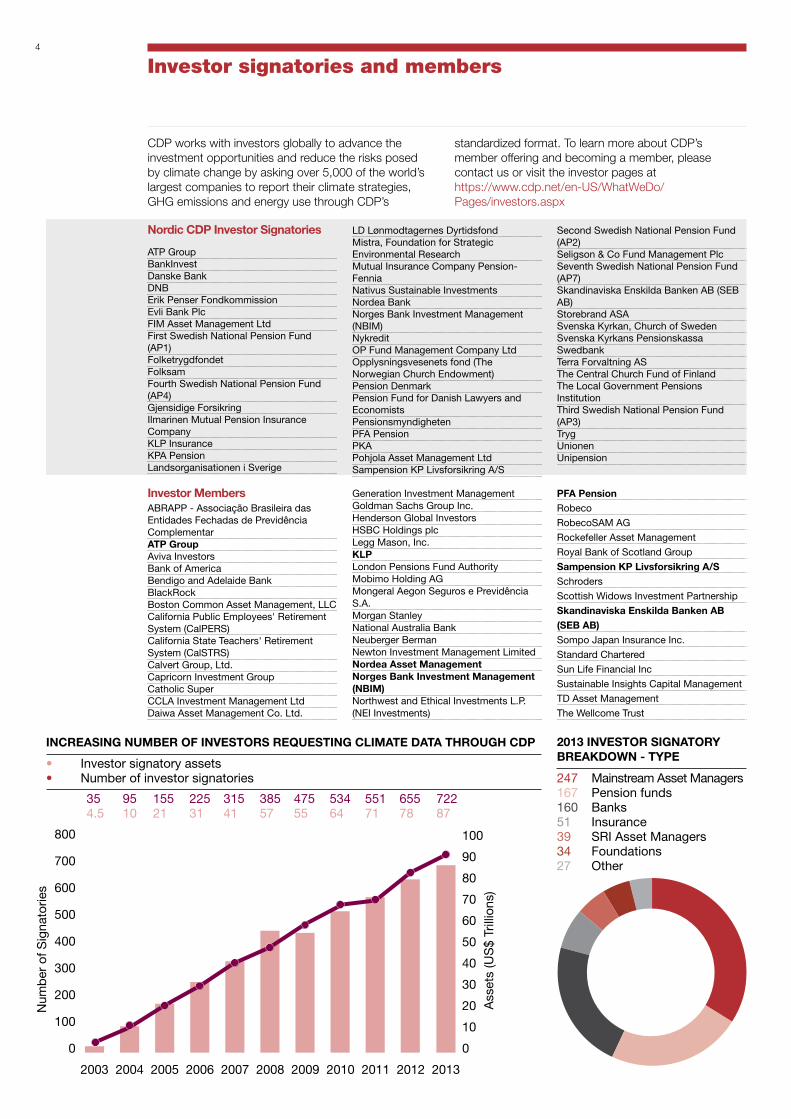
2013 INVESTOR SIGNATORY BREAkdOwN - TYPE
247 Mainstream Asset Managers167 Pension funds160 Banks51 Insurance39 SRI Asset Managers34 Foundations27 Other
Investor signatories and members
CDP works with investors globally to advance the investment opportunities and reduce the risks posed by climate change by asking over 5,000 of the world’s largest companies to report their climate strategies, GHG emissions and energy use through CDP’s
standardized format. To learn more about CDP’s member offering and becoming a member, please contact us or visit the investor pages at https://www.cdp.net/en-US/WhatWeDo/Pages/investors.aspx
ABRAPP - Associação Brasileira das Entidades Fechadas de Previdência ComplementarATP GroupAviva InvestorsBank of AmericaBendigo and Adelaide BankBlackRockBoston Common Asset Management, LLCCalifornia Public Employees' Retirement System (CalPERS)California State Teachers' Retirement System (CalSTRS)Calvert Group, Ltd.Capricorn Investment GroupCatholic SuperCCLA Investment Management LtdDaiwa Asset Management Co. Ltd.
Generation Investment ManagementGoldman Sachs Group Inc.Henderson Global InvestorsHSBC Holdings plcLegg Mason, Inc.kLPLondon Pensions Fund AuthorityMobimo Holding AGMongeral Aegon Seguros e Previdência S.A.Morgan StanleyNational Australia BankNeuberger BermanNewton Investment Management LimitedNordea Asset ManagementNorges Bank Investment Management (NBIM)Northwest and Ethical Investments L.P. (NEI Investments)
PFA PensionRobeco
RobecoSAM AG
Rockefeller Asset Management
Royal Bank of Scotland Group
Sampension kP Livsforsikring A/SSchroders
Scottish Widows Investment Partnership
Skandinaviska Enskilda Banken AB (SEB AB)Sompo Japan Insurance Inc.
Standard Chartered
Sun Life Financial Inc
Sustainable Insights Capital Management
TD Asset Management
The Wellcome Trust
INCREASING NUMBER OF INVESTORS REQUESTING CLIMATE dATA THROUGH CdP
• Investor signatory assets• Number of investor signatories
1 CDP INVESTOR SIGNATORIES & ASSETS (US$ TRILLION) AGAINST TIME
• Investor CDP Signatories• Investor CDP Signatory Assets
354.5
9510
15521
22531
31541
38557
47555
53464
55171
65578
72287
2003 2004 2007 2008 2009 2010 2011 2012 201320062005
800
700
600
500
400
300
200
100
0
100
90
80
70
60
50
40
30
20
10
0
Ass
ets
(US
$ Tr
illio
ns)
Num
ber
of S
igna
torie
s
ATP GroupBankInvestDanske BankDNBErik Penser FondkommissionEvli Bank PlcFIM Asset Management LtdFirst Swedish National Pension Fund (AP1)FolketrygdfondetFolksamFourth Swedish National Pension Fund (AP4)Gjensidige ForsikringIlmarinen Mutual Pension Insurance CompanyKLP InsuranceKPA PensionLandsorganisationen i Sverige
LD Lønmodtagernes DyrtidsfondMistra, Foundation for Strategic Environmental ResearchMutual Insurance Company Pension-FenniaNativus Sustainable InvestmentsNordea BankNorges Bank Investment Management (NBIM)NykreditOP Fund Management Company Ltd Opplysningsvesenets fond (The Norwegian Church Endowment) Pension DenmarkPension Fund for Danish Lawyers and Economists PensionsmyndighetenPFA PensionPKAPohjola Asset Management Ltd Sampension KP Livsforsikring A/S
Second Swedish National Pension Fund (AP2)Seligson & Co Fund Management PlcSeventh Swedish National Pension Fund (AP7)Skandinaviska Enskilda Banken AB (SEB AB)Storebrand ASASvenska Kyrkan, Church of Sweden Svenska Kyrkans PensionskassaSwedbankTerra Forvaltning AS The Central Church Fund of Finland The Local Government Pensions InstitutionThird Swedish National Pension Fund (AP3)TrygUnionenUnipension
Nordic CdP Investor Signatories
Investor Members
5
Key findings
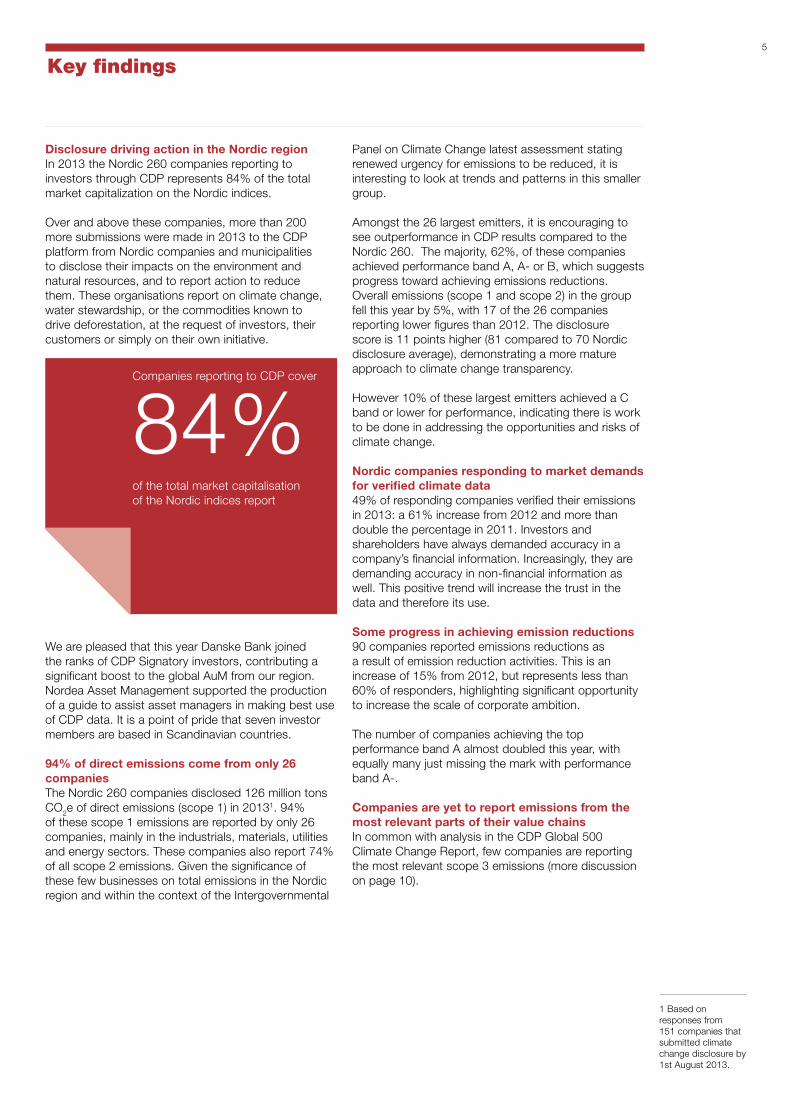
disclosure driving action in the Nordic regionIn 2013 the Nordic 260 companies reporting to investors through CDP represents 84% of the total market capitalization on the Nordic indices.
Over and above these companies, more than 200 more submissions were made in 2013 to the CDP platform from Nordic companies and municipalities to disclose their impacts on the environment and natural resources, and to report action to reduce them. These organisations report on climate change, water stewardship, or the commodities known to drive deforestation, at the request of investors, their customers or simply on their own initiative.
We are pleased that this year Danske Bank joined the ranks of CDP Signatory investors, contributing a significant boost to the global AuM from our region. Nordea Asset Management supported the production of a guide to assist asset managers in making best use of CDP data. It is a point of pride that seven investor members are based in Scandinavian countries.
94% of direct emissions come from only 26 companiesThe Nordic 260 companies disclosed 126 million tons CO2e of direct emissions (scope 1) in 20131. 94% of these scope 1 emissions are reported by only 26 companies, mainly in the industrials, materials, utilities and energy sectors. These companies also report 74% of all scope 2 emissions. Given the significance of these few businesses on total emissions in the Nordic region and within the context of the Intergovernmental
Panel on Climate Change latest assessment stating renewed urgency for emissions to be reduced, it is interesting to look at trends and patterns in this smaller group.
Amongst the 26 largest emitters, it is encouraging to see outperformance in CDP results compared to the Nordic 260. The majority, 62%, of these companies achieved performance band A, A- or B, which suggests progress toward achieving emissions reductions. Overall emissions (scope 1 and scope 2) in the group fell this year by 5%, with 17 of the 26 companies reporting lower figures than 2012. The disclosure score is 11 points higher (81 compared to 70 Nordic disclosure average), demonstrating a more mature approach to climate change transparency.
However 10% of these largest emitters achieved a C band or lower for performance, indicating there is work to be done in addressing the opportunities and risks of climate change.
Nordic companies responding to market demands for verified climate data49% of responding companies verified their emissions in 2013: a 61% increase from 2012 and more than double the percentage in 2011. Investors and shareholders have always demanded accuracy in a company’s financial information. Increasingly, they are demanding accuracy in non-financial information as well. This positive trend will increase the trust in the data and therefore its use.
Some progress in achieving emission reductions90 companies reported emissions reductions as a result of emission reduction activities. This is an increase of 15% from 2012, but represents less than 60% of responders, highlighting significant opportunity to increase the scale of corporate ambition.
The number of companies achieving the top performance band A almost doubled this year, with equally many just missing the mark with performance band A-.
Companies are yet to report emissions from the most relevant parts of their value chainsIn common with analysis in the CDP Global 500 Climate Change Report, few companies are reporting the most relevant scope 3 emissions (more discussion on page 10).
1 Based on responses from 151 companies that submitted climate change disclosure by 1st August 2013.
Companies reporting to CDP cover
of the total market capitalisation of the Nordic indices report
84%
6
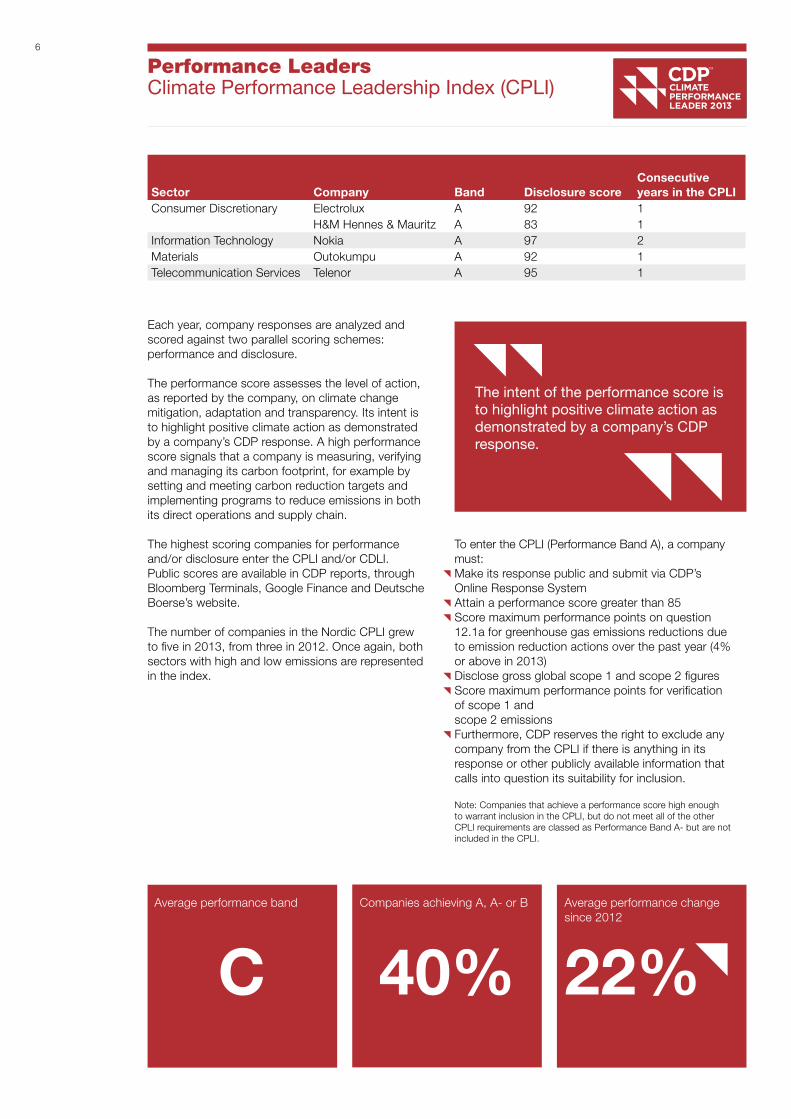
Performance LeadersClimate Performance Leadership Index (CPLI)
Sector Company Band disclosure scoreConsecutive years in the CPLI
Consumer Discretionary Electrolux A 92 1H&M Hennes & Mauritz A 83 1
Information Technology Nokia A 97 2Materials Outokumpu A 92 1Telecommunication Services Telenor A 95 1
Each year, company responses are analyzed and scored against two parallel scoring schemes: performance and disclosure.
The performance score assesses the level of action, as reported by the company, on climate change mitigation, adaptation and transparency. Its intent is to highlight positive climate action as demonstrated by a company’s CDP response. A high performance score signals that a company is measuring, verifying and managing its carbon footprint, for example by setting and meeting carbon reduction targets and implementing programs to reduce emissions in both its direct operations and supply chain.
The highest scoring companies for performance and/or disclosure enter the CPLI and/or CDLI. Public scores are available in CDP reports, through Bloomberg Terminals, Google Finance and Deutsche Boerse’s website.
The number of companies in the Nordic CPLI grew to five in 2013, from three in 2012. Once again, both sectors with high and low emissions are represented in the index.
To enter the CPLI (Performance Band A), a company must:Make its response public and submit via CDP’s Online Response SystemAttain a performance score greater than 85Score maximum performance points on question 12.1a for greenhouse gas emissions reductions due to emission reduction actions over the past year (4% or above in 2013)Disclose gross global scope 1 and scope 2 figuresScore maximum performance points for verification of scope 1 andscope 2 emissionsFurthermore, CDP reserves the right to exclude any company from the CPLI if there is anything in its response or other publicly available information that calls into question its suitability for inclusion.
Note: Companies that achieve a performance score high enough to warrant inclusion in the CPLI, but do not meet all of the other CPLI requirements are classed as Performance Band A- but are not included in the CPLI.
Average performance band
C 40% 22%Companies achieving A, A- or B Average performance change
since 2012
The intent of the performance score is to highlight positive climate action as demonstrated by a company’s CDP response.
7
Disclosure LeadersClimate Disclosure Leadership Index (CDLI)
Sector Companydisclosure score
Performance band
Consecutive years in the CdLI
CdLI ranking
Consumer Discretionary Alma Media 92 B 1 23Electrolux 92 A 3 23Ekornes 91 B 1 26
Consumer Staples Kesko 98 B 3 6Marine Harvest 94 B 1 17
Energy DNO International 94 D 1 17Financials Nordea Bank 93 B 3 19
Storebrand 93 B 1 19Health Care Novo Nordisk 96 B 6 9Industrials Metso 100 A- 2 1
Kone 98 A- 3 6Finnair 96 B 2 9D/S Norden 96 B 4 9Outotec 95 B 5 14Skanska 95 B 1 14Atlas Copco 93 B 1 19
Information Technology Tieto Oyj 99 B 3 3Nokia 97 A 5 8
Materials Novozymes 99 A- 3 3UPM-Kymmene 99 A- 5 3Kemira 96 B 1 9Stora Enso 93 B 4 19Outokumpu 92 A 4 23SCA 91 B 4 26
Telecommunication Services Elisa 96 B 2 9Telenor 95 A 1 14
Utilities Fortum 100 A- 6 1
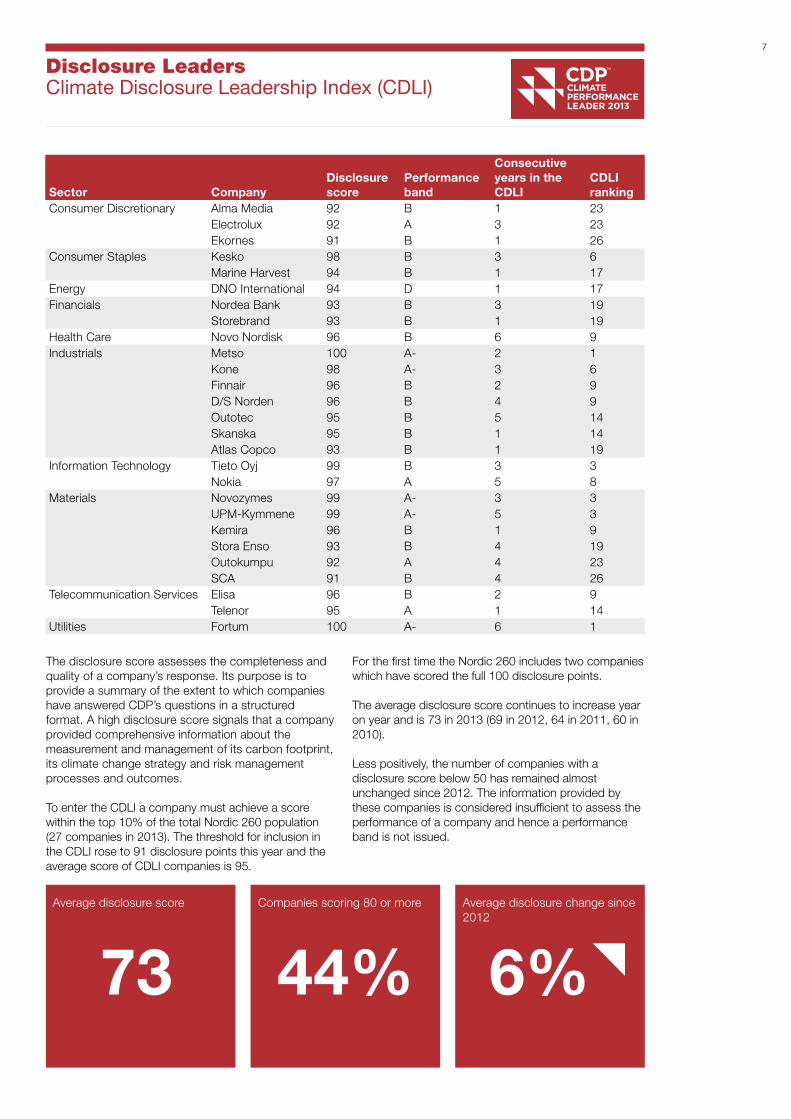
The disclosure score assesses the completeness and quality of a company’s response. Its purpose is to provide a summary of the extent to which companies have answered CDP’s questions in a structured format. A high disclosure score signals that a company provided comprehensive information about the measurement and management of its carbon footprint, its climate change strategy and risk management processes and outcomes.
To enter the CDLI a company must achieve a score within the top 10% of the total Nordic 260 population (27 companies in 2013). The threshold for inclusion in the CDLI rose to 91 disclosure points this year and the average score of CDLI companies is 95.
For the first time the Nordic 260 includes two companies which have scored the full 100 disclosure points.
The average disclosure score continues to increase year on year and is 73 in 2013 (69 in 2012, 64 in 2011, 60 in 2010).
Less positively, the number of companies with a disclosure score below 50 has remained almost unchanged since 2012. The information provided by these companies is considered insufficient to assess the performance of a company and hence a performance band is not issued.
Average disclosure score
73 44% 6%Companies scoring 80 or more Average disclosure change since
2012
8
Key statistics
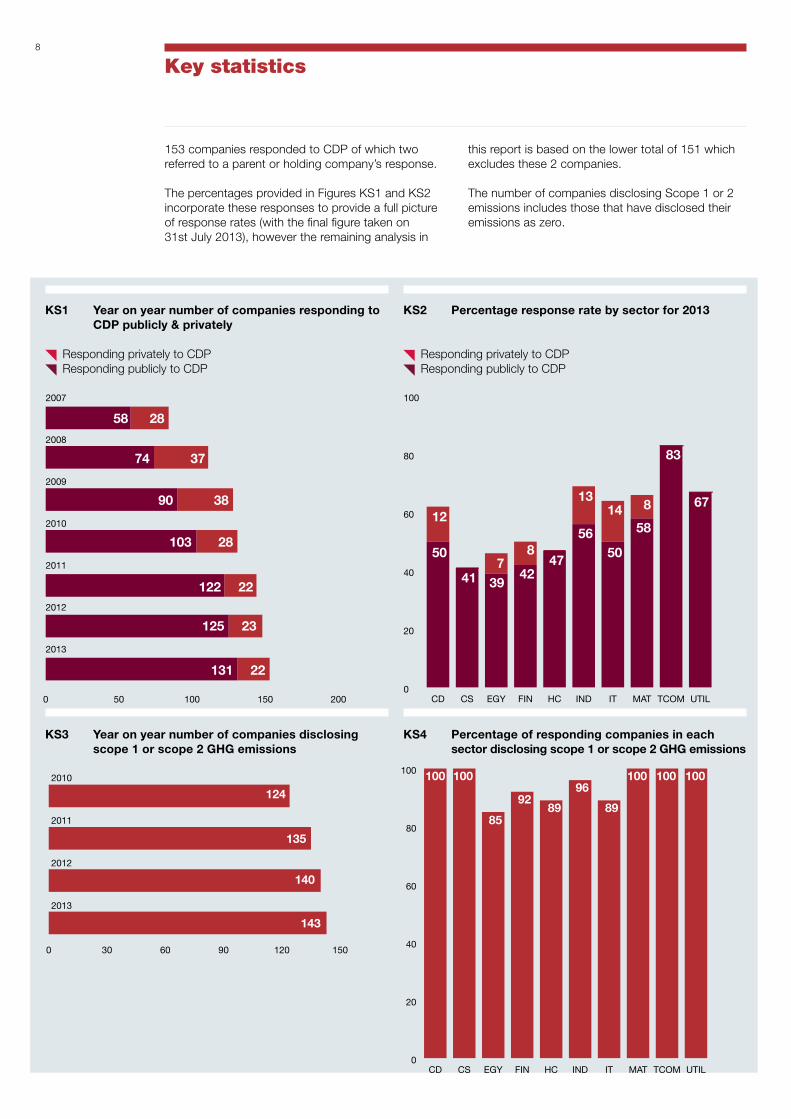
kS1 Year on year number of companies responding to CdP publicly & privately
Responding privately to CDP Responding publicly to CDP
kS3 Year on year number of companies disclosing scope 1 or scope 2 GHG emissions
kS4 Percentage of responding companies in each sector disclosing scope 1 or scope 2 GHG emissions
kS2 Percentage response rate by sector for 2013
Responding privately to CDP Responding publicly to CDP
153 companies responded to CDP of which two referred to a parent or holding company’s response.
The percentages provided in Figures KS1 and KS2 incorporate these responses to provide a full picture of response rates (with the final figure taken on 31st July 2013), however the remaining analysis in
this report is based on the lower total of 151 which excludes these 2 companies.
The number of companies disclosing Scope 1 or 2 emissions includes those that have disclosed their emissions as zero.
0 50 100 150 200
Responding privately to CDP
Responding publicly to CDP
2007
2008
2009
2010
2011
2012
2013
131 22
125 23
122 22
103 28
90 38
74 37
58 28
0 30 60 90 120 150
2010
2011
2012
2013
Companies disclosing Scope 1 or 2 emissions
124
135
140
143
0
20
40
60
80
100
UTILTCOMMATITINDHCFINEGYCSCD
100 100
85
9289
96
89
100 100 100
0
20
40
60
80
100
Not public
Public
UTILTCOMMATITINDHCFINEGYCSCD
12
50
41 397
8
4247
13
56
14
50
8
58
83
67
9
FIN IT HC
TCOM CS CD
EGY UTIL MAT
IND
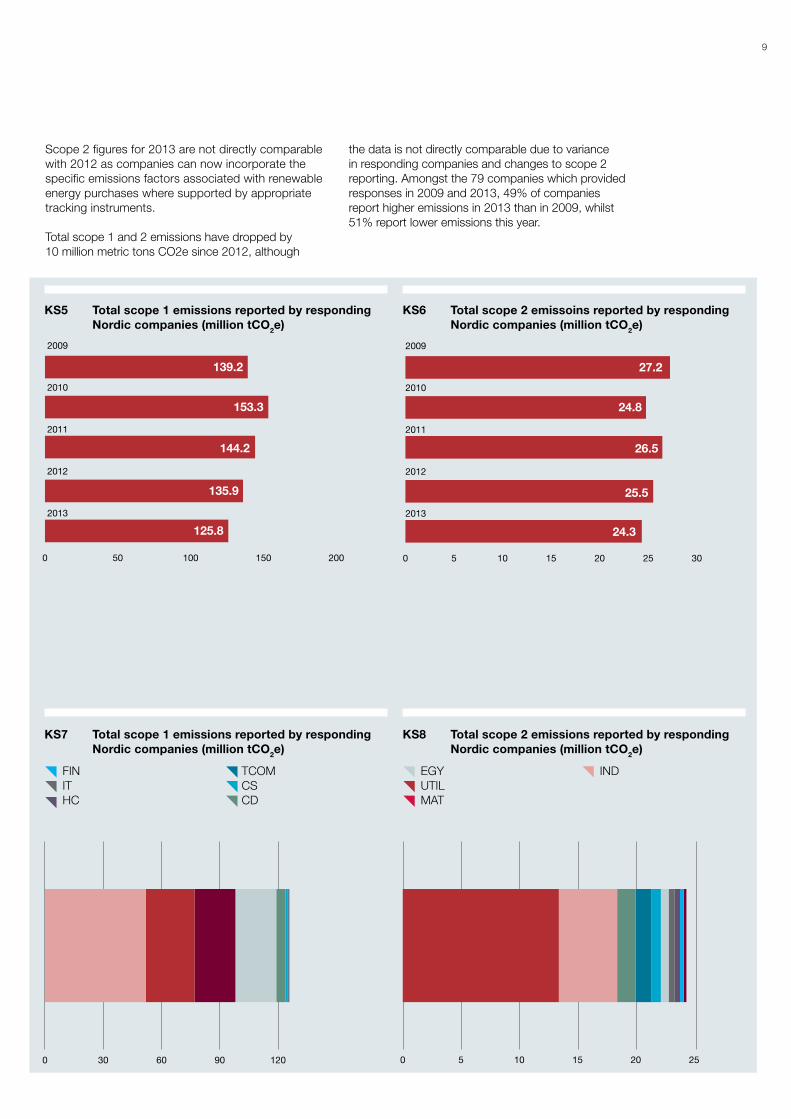
kS5 Total scope 1 emissions reported by responding Nordic companies (million tCO2e)
kS7 Total scope 1 emissions reported by responding Nordic companies (million tCO2e)
kS8 Total scope 2 emissions reported by responding Nordic companies (million tCO2e)
kS6 Total scope 2 emissoins reported by responding Nordic companies (million tCO2e)
Scope 2 figures for 2013 are not directly comparable with 2012 as companies can now incorporate the specific emissions factors associated with renewable energy purchases where supported by appropriate tracking instruments.
Total scope 1 and 2 emissions have dropped by 10 million metric tons CO2e since 2012, although
the data is not directly comparable due to variance in responding companies and changes to scope 2 reporting. Amongst the 79 companies which provided responses in 2009 and 2013, 49% of companies report higher emissions in 2013 than in 2009, whilst 51% report lower emissions this year.
2009
2010
2011
2012
2013
0 50 100 150 200
139.2
153.3
144.2
135.9
125.8
0 30 60 90 120
FIN
IT
HC
TCOM
CS
CD
EGY
UTIL
MAT
IND
2009
2010
2011
2012
2013
0 5 10 15 20 25 30
27.2
24.8
26.5
25.5
24.3
0 5 10 15 20 25
UTIL
FIN
HC
IT
EGY
CS
TCOM
CD
IND
MAT
10
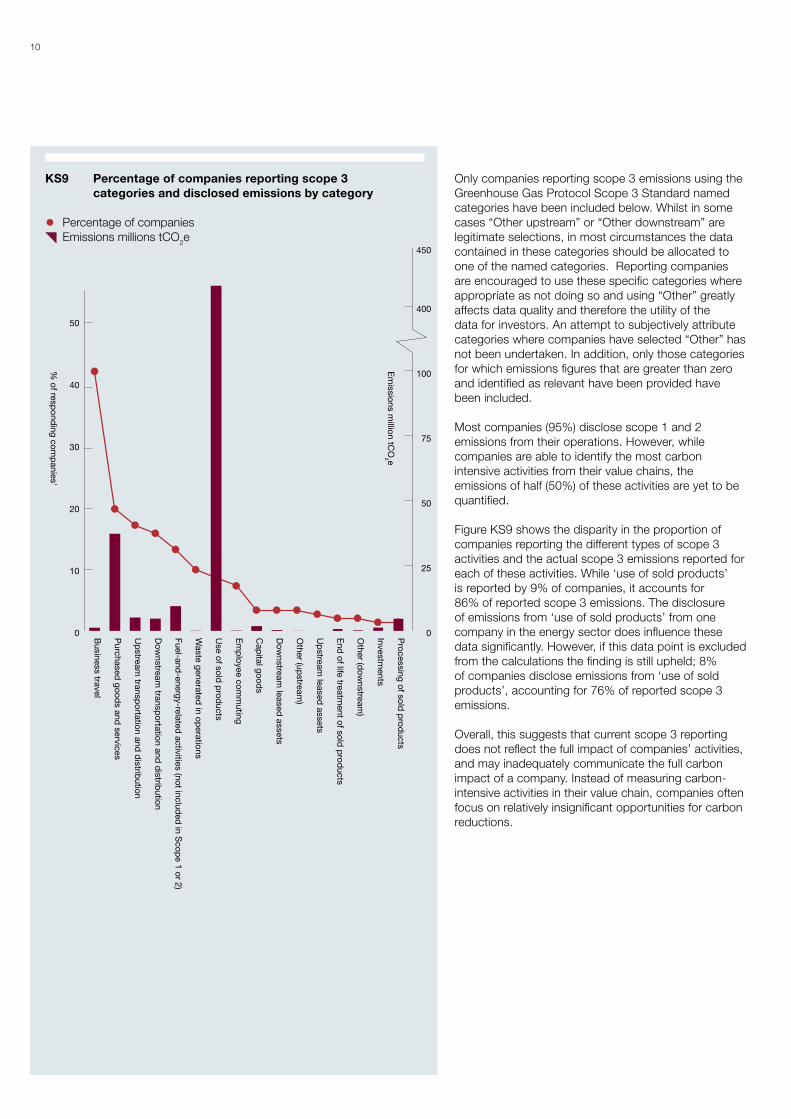
kS9 Percentage of companies reporting scope 3 categories and disclosed emissions by category
Percentage of companies Emissions millions tCO2e
Only companies reporting scope 3 emissions using the Greenhouse Gas Protocol Scope 3 Standard named categories have been included below. Whilst in some cases “Other upstream” or “Other downstream” are legitimate selections, in most circumstances the data contained in these categories should be allocated to one of the named categories. Reporting companies are encouraged to use these specific categories where appropriate as not doing so and using “Other” greatly affects data quality and therefore the utility of the data for investors. An attempt to subjectively attribute categories where companies have selected “Other” has not been undertaken. In addition, only those categories for which emissions figures that are greater than zero and identified as relevant have been provided have been included.
Most companies (95%) disclose scope 1 and 2 emissions from their operations. However, while companies are able to identify the most carbon intensive activities from their value chains, the emissions of half (50%) of these activities are yet to be quantified.
Figure KS9 shows the disparity in the proportion of companies reporting the different types of scope 3 activities and the actual scope 3 emissions reported for each of these activities. While ‘use of sold products’ is reported by 9% of companies, it accounts for 86% of reported scope 3 emissions. The disclosure of emissions from ‘use of sold products’ from one company in the energy sector does influence these data significantly. However, if this data point is excluded from the calculations the finding is still upheld; 8% of companies disclose emissions from ‘use of sold products’, accounting for 76% of reported scope 3 emissions.
Overall, this suggests that current scope 3 reporting does not reflect the full impact of companies’ activities, and may inadequately communicate the full carbon impact of a company. Instead of measuring carbon-intensive activities in their value chain, companies often focus on relatively insignificant opportunities for carbon reductions.
0
10
20
30
40
50
Processing of sold
prod
ucts
Investments
Other (d
ownstream
)
End
of life treatment of sold
prod
ucts
Up
stream leased
assets
Other (up
stream)
Dow
nstream leased
assets
Cap
ital goods
Em
ployee com
muting
Use of sold
prod
ucts
Waste generated
in operations
Fuel-and-energy-related
activities (not included
in Scop
e 1 or 2)
Dow
nstream transp
ortation and d
istribution
Up
stream transp
ortation and d
istribution
Purchased
goods and
services
Business travel
% of resp
onding com
panies'
Em
issions million tC
O2 e
0
25
50
75
100
400
450
11
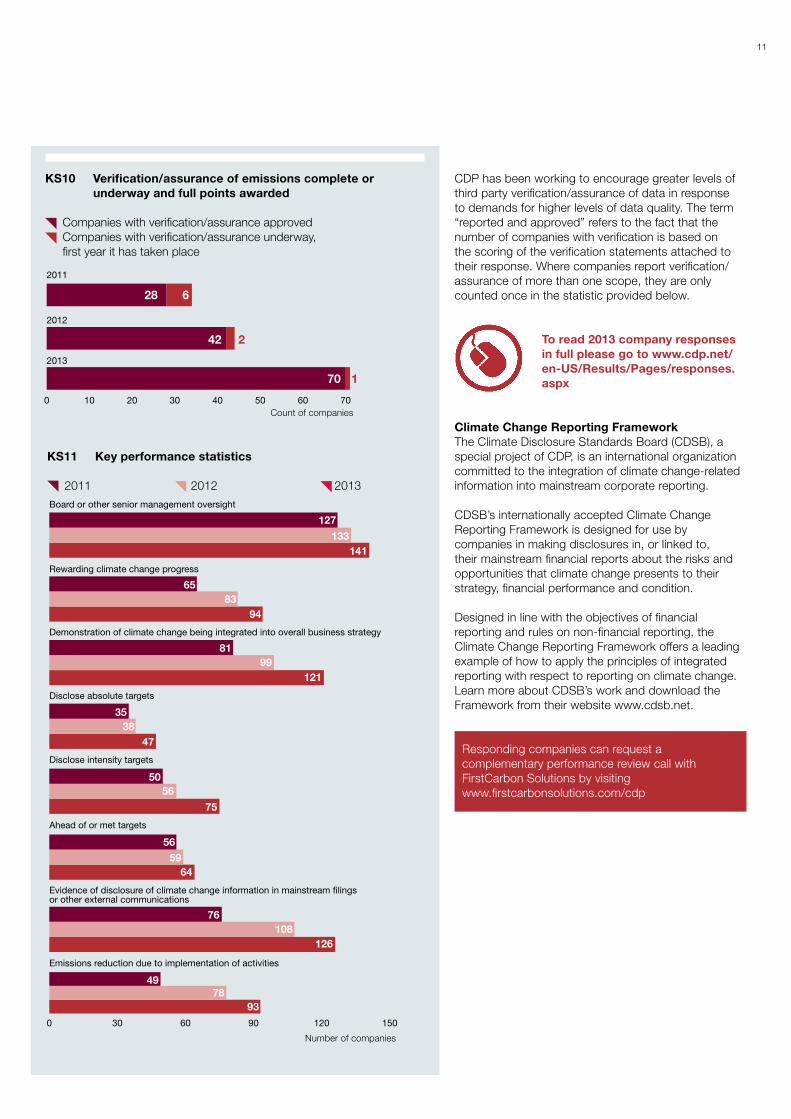
kS10 Verification/assurance of emissions complete or underway and full points awarded
Companies with verification/assurance approved Companies with verification/assurance underway, first year it has taken place
kS11 key performance statistics
2011 2012 2013
CDP has been working to encourage greater levels of third party verification/assurance of data in response to demands for higher levels of data quality. The term “reported and approved” refers to the fact that the number of companies with verification is based on the scoring of the verification statements attached to their response. Where companies report verification/assurance of more than one scope, they are only counted once in the statistic provided below.
Count of companies
Number of companies
Climate Change Reporting FrameworkThe Climate Disclosure Standards Board (CDSB), a special project of CDP, is an international organization committed to the integration of climate change-related information into mainstream corporate reporting.
CDSB’s internationally accepted Climate Change Reporting Framework is designed for use by companies in making disclosures in, or linked to, their mainstream financial reports about the risks and opportunities that climate change presents to their strategy, financial performance and condition.
Designed in line with the objectives of financial reporting and rules on non-financial reporting, the Climate Change Reporting Framework offers a leading example of how to apply the principles of integrated reporting with respect to reporting on climate change. Learn more about CDSB’s work and download the Framework from their website www.cdsb.net.
To read 2013 company responses in full please go to www.cdp.net/en-US/Results/Pages/responses.aspx
2011
2012
2013
0 10 20 30 40 50 60 70 80
628
42 2
170
0 30 60 90 120 150
Board or other senior management oversight
127
133141
Rewarding climate change progress
6583
94
Demonstration of climate change being integrated into overall business strategy
8199
121
Disclose absolute targets
3538
47
Disclose intensity targets
5056
75
Ahead of or met targets
5659
64
Evidence of disclosure of climate change information in mainstream �lings or other external communications
76108
126
Emissions reduction due to implementation of activities
4978
93
Responding companies can request a complementary performance review call with FirstCarbon Solutions by visiting www.firstcarbonsolutions.com/cdp
12
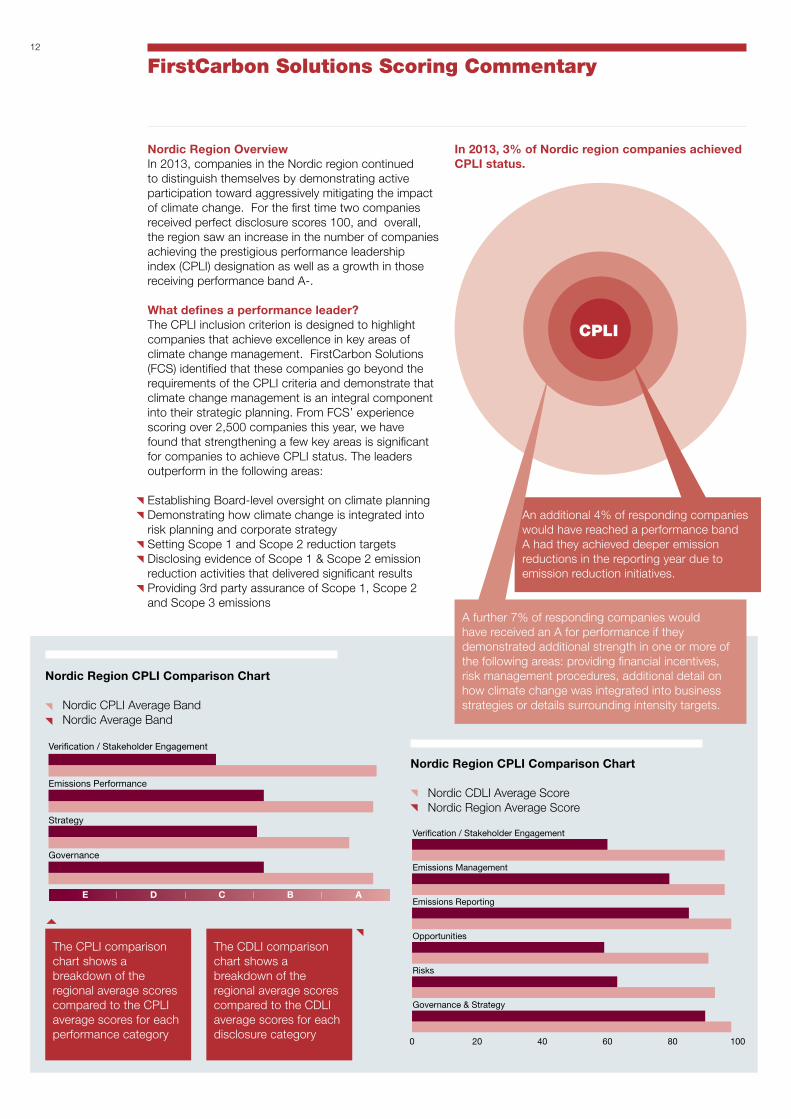
FirstCarbon Solutions Scoring Commentary
Nordic Region OverviewIn 2013, companies in the Nordic region continued to distinguish themselves by demonstrating active participation toward aggressively mitigating the impact of climate change. For the first time two companies received perfect disclosure scores 100, and overall, the region saw an increase in the number of companies achieving the prestigious performance leadership index (CPLI) designation as well as a growth in those receiving performance band A-.
what defines a performance leader?The CPLI inclusion criterion is designed to highlight companies that achieve excellence in key areas of climate change management. FirstCarbon Solutions (FCS) identified that these companies go beyond the requirements of the CPLI criteria and demonstrate that climate change management is an integral component into their strategic planning. From FCS’ experience scoring over 2,500 companies this year, we have found that strengthening a few key areas is significant for companies to achieve CPLI status. The leaders outperform in the following areas:
Establishing Board-level oversight on climate planningDemonstrating how climate change is integrated into risk planning and corporate strategySetting Scope 1 and Scope 2 reduction targetsDisclosing evidence of Scope 1 & Scope 2 emission reduction activities that delivered significant resultsProviding 3rd party assurance of Scope 1, Scope 2 and Scope 3 emissions
An additional 4% of responding companies would have reached a performance band A had they achieved deeper emission reductions in the reporting year due to emission reduction initiatives.
The CPLI comparison chart shows a breakdown of the regional average scores compared to the CPLI average scores for each performance category
The CDLI comparison chart shows a breakdown of the regional average scores compared to the CDLI average scores for each disclosure category
A further 7% of responding companies would have received an A for performance if they demonstrated additional strength in one or more of the following areas: providing financial incentives, risk management procedures, additional detail on how climate change was integrated into business strategies or details surrounding intensity targets.
In 2013, 3% of Nordic region companies achieved CPLI status.
CPLI
Governance
Strategy
Emissions Performance
Veri�cation / Stakeholder Engagement
E D C B A
0 20 40 60 80 100
Nordic CDLI Average Score
Nordic Region Avg Score
Governance & Strategy
Risks
Opportunities
Emissions Reporting
Emissions Management
Veri�cation / Stakeholder Engagement
Nordic Region CPLI Comparison Chart
Nordic CPLI Average Band Nordic Average Band
Nordic Region CPLI Comparison Chart
Nordic CDLI Average Score Nordic Region Average Score
13
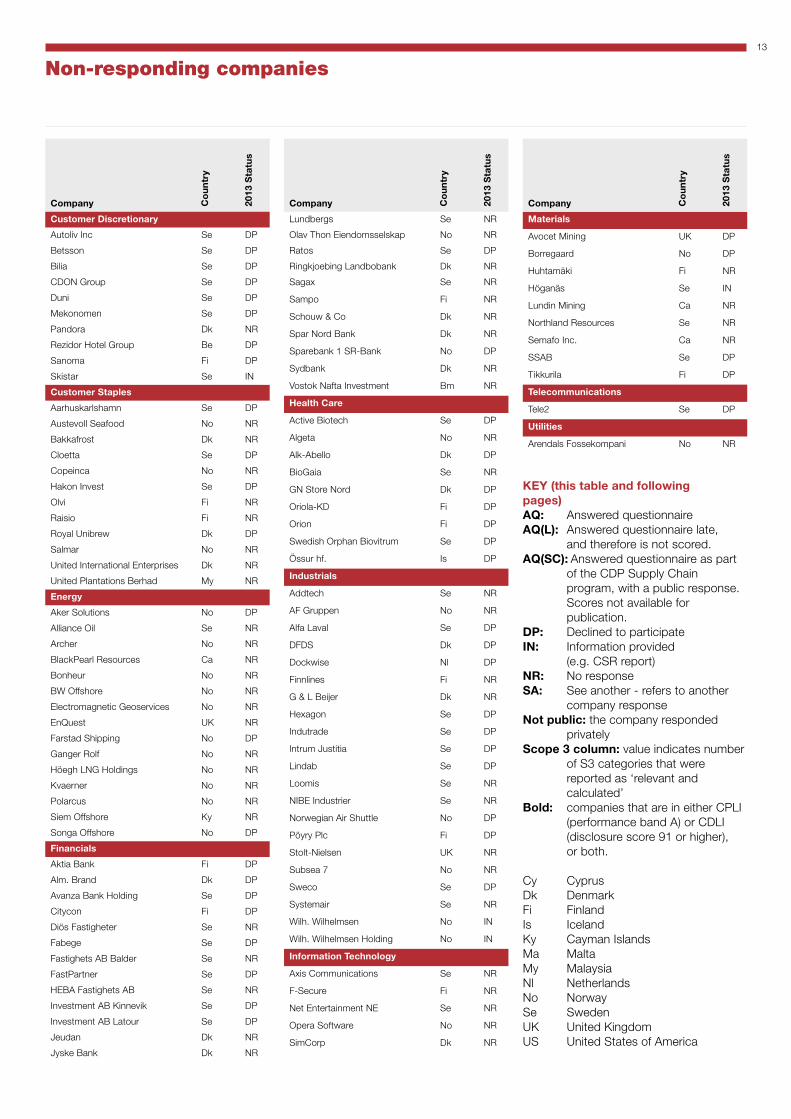
Non-responding companies
kEY (this table and following pages) AQ: Answered questionnaireAQ(L): Answered questionnaire late, and therefore is not scored.AQ(SC): Answered questionnaire as part of the CDP Supply Chain program, with a public response. Scores not available for publication.dP: Declined to participateIN: Information provided (e.g. CSR report)NR: No responseSA: See another - refers to another company responseNot public: the company responded privatelyScope 3 column: value indicates number of S3 categories that were reported as ‘relevant and calculated’Bold: companies that are in either CPLI (performance band A) or CDLI (disclosure score 91 or higher), or both.
Cy CyprusDk DenmarkFi FinlandIs IcelandKy Cayman IslandsMa MaltaMy MalaysiaNl NetherlandsNo NorwaySe SwedenUK United KingdomUS United States of America
Company Co
un
try
2013
Sta
tus
Customer discretionary
Autoliv Inc Se DP
Betsson Se DP
Bilia Se DP
CDON Group Se DP
Duni Se DP
Mekonomen Se DP
Pandora Dk NR
Rezidor Hotel Group Be DP
Sanoma Fi DP
Skistar Se IN
Customer Staples
Aarhuskarlshamn Se DP
Austevoll Seafood No NR
Bakkafrost Dk NR
Cloetta Se DP
Copeinca No NR
Hakon Invest Se DP
Olvi Fi NR
Raisio Fi NR
Royal Unibrew Dk DP
Salmar No NR
United International Enterprises Dk NR
United Plantations Berhad My NR
Energy
Aker Solutions No DP
Alliance Oil Se NR
Archer No NR
BlackPearl Resources Ca NR
Bonheur No NR
BW Offshore No NR
Electromagnetic Geoservices No NR
EnQuest UK NR
Farstad Shipping No DP
Ganger Rolf No NR
Höegh LNG Holdings No NR
Kvaerner No NR
Polarcus No NR
Siem Offshore Ky NR
Songa Offshore No DP
Financials
Aktia Bank Fi DP
Alm. Brand Dk DP
Avanza Bank Holding Se DP
Citycon Fi DP
Diös Fastigheter Se NR
Fabege Se DP
Fastighets AB Balder Se NR
FastPartner Se DP
HEBA Fastighets AB Se NR
Investment AB Kinnevik Se DP
Investment AB Latour Se DP
Jeudan Dk NR
Jyske Bank Dk NR
Lundbergs Se NR
Olav Thon Eiendomsselskap No NR
Ratos Se DP
Ringkjoebing Landbobank Dk NR
Sagax Se NR
Sampo Fi NR
Schouw & Co Dk NR
Spar Nord Bank Dk NR
Sparebank 1 SR-Bank No DP
Sydbank Dk NR
Vostok Nafta Investment Bm NR
Health Care
Active Biotech Se DP
Algeta No NR
Alk-Abello Dk DP
BioGaia Se NR
GN Store Nord Dk DP
Oriola-KD Fi DP
Orion Fi DP
Swedish Orphan Biovitrum Se DP
Össur hf. Is DP
Industrials
Addtech Se NR
AF Gruppen No NR
Alfa Laval Se DP
DFDS Dk DP
Dockwise Nl DP
Finnlines Fi NR
G & L Beijer Dk NR
Hexagon Se DP
Indutrade Se DP
Intrum Justitia Se DP
Lindab Se DP
Loomis Se NR
NIBE Industrier Se NR
Norwegian Air Shuttle No DP
Pöyry Plc Fi DP
Stolt-Nielsen UK NR
Subsea 7 No NR
Sweco Se DP
Systemair Se NR
Wilh. Wilhelmsen No IN
Wilh. Wilhelmsen Holding No IN
Information Technology
Axis Communications Se NR
F-Secure Fi NR
Net Entertainment NE Se NR
Opera Software No NR
SimCorp Dk NR
Materials
Avocet Mining UK DP
Borregaard No DP
Huhtamäki Fi NR
Höganäs Se IN
Lundin Mining Ca NR
Northland Resources Se NR
Semafo Inc. Ca NR
SSAB Se DP
Tikkurila Fi DP
Telecommunications
Tele2 Se DP
Utilities
Arendals Fossekompani No NR
Company Co
un
try
2013
Sta
tus
Company Co
un
try
2013
Sta
tus
14
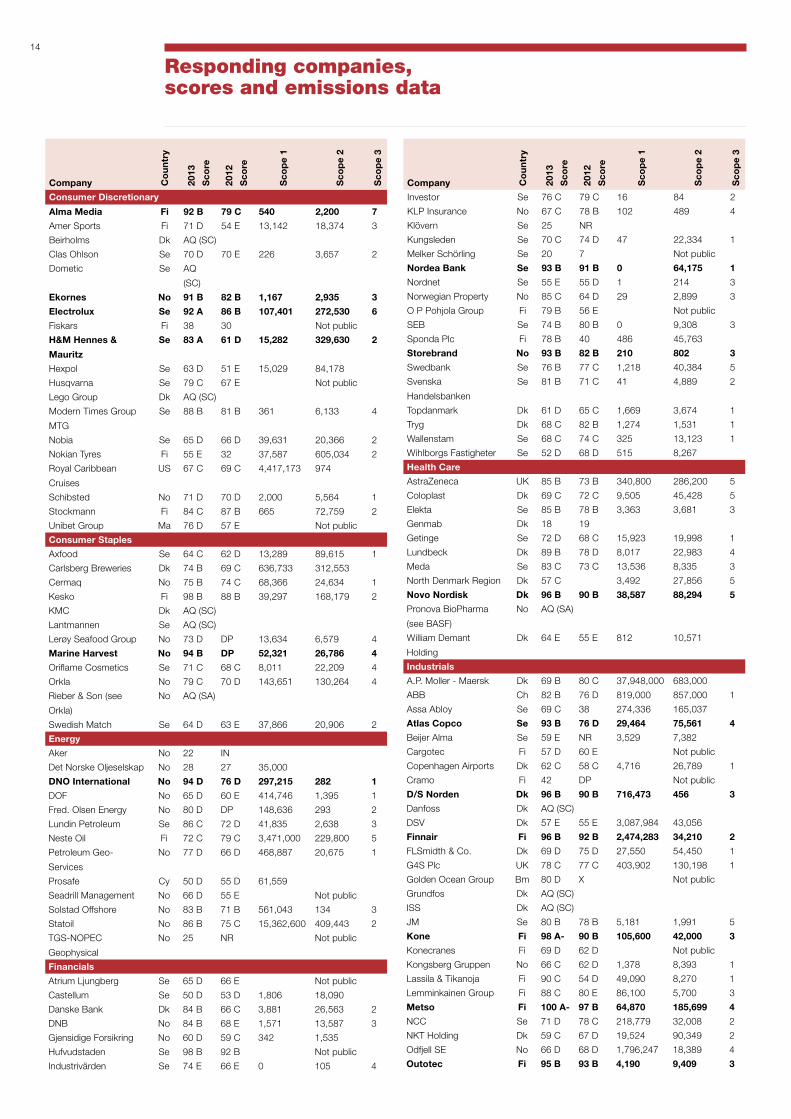
Responding companies,scores and emissions data
Company Co
un
try
2013
Sco
re
2012
Sco
re
Sco
pe
1
Sco
pe
2
Sco
pe
3
Consumer discretionary
Alma Media Fi 92 B 79 C 540 2,200 7
Amer Sports Fi 71 D 54 E 13,142 18,374 3
Beirholms Dk AQ (SC)
Clas Ohlson Se 70 D 70 E 226 3,657 2
Dometic Se AQ
(SC)
Ekornes No 91 B 82 B 1,167 2,935 3
Electrolux Se 92 A 86 B 107,401 272,530 6
Fiskars Fi 38 30 Not public
H&M Hennes &
Mauritz
Se 83 A 61 d 15,282 329,630 2
Hexpol Se 63 D 51 E 15,029 84,178
Husqvarna Se 79 C 67 E Not public
Lego Group Dk AQ (SC)
Modern Times Group
MTG
Se 88 B 81 B 361 6,133 4
Nobia Se 65 D 66 D 39,631 20,366 2
Nokian Tyres Fi 55 E 32 37,587 605,034 2
Royal Caribbean
Cruises
US 67 C 69 C 4,417,173 974
Schibsted No 71 D 70 D 2,000 5,564 1
Stockmann Fi 84 C 87 B 665 72,759 2
Unibet Group Ma 76 D 57 E Not public
Consumer Staples
Axfood Se 64 C 62 D 13,289 89,615 1
Carlsberg Breweries Dk 74 B 69 C 636,733 312,553
Cermaq No 75 B 74 C 68,366 24,634 1
Kesko Fi 98 B 88 B 39,297 168,179 2
KMC Dk AQ (SC)
Lantmannen Se AQ (SC)
Lerøy Seafood Group No 73 D DP 13,634 6,579 4
Marine Harvest No 94 B dP 52,321 26,786 4
Oriflame Cosmetics Se 71 C 68 C 8,011 22,209 4
Orkla No 79 C 70 D 143,651 130,264 4
Rieber & Son (see
Orkla)
No AQ (SA)
Swedish Match Se 64 D 63 E 37,866 20,906 2
Energy
Aker No 22 IN
Det Norske Oljeselskap No 28 27 35,000
dNO International No 94 d 76 d 297,215 282 1
DOF No 65 D 60 E 414,746 1,395 1
Fred. Olsen Energy No 80 D DP 148,636 293 2
Lundin Petroleum Se 86 C 72 D 41,835 2,638 3
Neste Oil Fi 72 C 79 C 3,471,000 229,800 5
Petroleum Geo-
Services
No 77 D 66 D 468,887 20,675 1
Prosafe Cy 50 D 55 D 61,559
Seadrill Management No 66 D 55 E Not public
Solstad Offshore No 83 B 71 B 561,043 134 3
Statoil No 86 B 75 C 15,362,600 409,443 2
TGS-NOPEC
Geophysical
No 25 NR Not public
Financials
Atrium Ljungberg Se 65 D 66 E Not public
Castellum Se 50 D 53 D 1,806 18,090
Danske Bank Dk 84 B 66 C 3,881 26,563 2
DNB No 84 B 68 E 1,571 13,587 3
Gjensidige Forsikring No 60 D 59 C 342 1,535
Hufvudstaden Se 98 B 92 B Not public
Industrivärden Se 74 E 66 E 0 105 4
Company Co
un
try
2013
Sco
re
2012
Sco
re
Sco
pe
1
Sco
pe
2
Sco
pe
3
Investor Se 76 C 79 C 16 84 2
KLP Insurance No 67 C 78 B 102 489 4
Klövern Se 25 NR
Kungsleden Se 70 C 74 D 47 22,334 1
Melker Schörling Se 20 7 Not public
Nordea Bank Se 93 B 91 B 0 64,175 1
Nordnet Se 55 E 55 D 1 214 3
Norwegian Property No 85 C 64 D 29 2,899 3
O P Pohjola Group Fi 79 B 56 E Not public
SEB Se 74 B 80 B 0 9,308 3
Sponda Plc Fi 78 B 40 486 45,763
Storebrand No 93 B 82 B 210 802 3
Swedbank Se 76 B 77 C 1,218 40,384 5
Svenska
Handelsbanken
Se 81 B 71 C 41 4,889 2
Topdanmark Dk 61 D 65 C 1,669 3,674 1
Tryg Dk 68 C 82 B 1,274 1,531 1
Wallenstam Se 68 C 74 C 325 13,123 1
Wihlborgs Fastigheter Se 52 D 68 D 515 8,267
Health Care
AstraZeneca UK 85 B 73 B 340,800 286,200 5
Coloplast Dk 69 C 72 C 9,505 45,428 5
Elekta Se 85 B 78 B 3,363 3,681 3
Genmab Dk 18 19
Getinge Se 72 D 68 C 15,923 19,998 1
Lundbeck Dk 89 B 78 D 8,017 22,983 4
Meda Se 83 C 73 C 13,536 8,335 3
North Denmark Region Dk 57 C 3,492 27,856 5
Novo Nordisk dk 96 B 90 B 38,587 88,294 5
Pronova BioPharma
(see BASF)
No AQ (SA)
William Demant
Holding
Dk 64 E 55 E 812 10,571
Industrials
A.P. Moller - Maersk Dk 69 B 80 C 37,948,000 683,000
ABB Ch 82 B 76 D 819,000 857,000 1
Assa Abloy Se 69 C 38 274,336 165,037
Atlas Copco Se 93 B 76 d 29,464 75,561 4
Beijer Alma Se 59 E NR 3,529 7,382
Cargotec Fi 57 D 60 E Not public
Copenhagen Airports Dk 62 C 58 C 4,716 26,789 1
Cramo Fi 42 DP Not public
d/S Norden dk 96 B 90 B 716,473 456 3
Danfoss Dk AQ (SC)
DSV Dk 57 E 55 E 3,087,984 43,056
Finnair Fi 96 B 92 B 2,474,283 34,210 2
FLSmidth & Co. Dk 69 D 75 D 27,550 54,450 1
G4S Plc UK 78 C 77 C 403,902 130,198 1
Golden Ocean Group Bm 80 D X Not public
Grundfos Dk AQ (SC)
ISS Dk AQ (SC)
JM Se 80 B 78 B 5,181 1,991 5
kone Fi 98 A- 90 B 105,600 42,000 3
Konecranes Fi 69 D 62 D Not public
Kongsberg Gruppen No 66 C 62 D 1,378 8,393 1
Lassila & Tikanoja Fi 90 C 54 D 49,090 8,270 1
Lemminkainen Group Fi 88 C 80 E 86,100 5,700 3
Metso Fi 100 A- 97 B 64,870 185,699 4
NCC Se 71 D 78 C 218,779 32,008 2
NKT Holding Dk 59 C 67 D 19,524 90,349 2
Odfjell SE No 66 D 68 D 1,796,247 18,389 4
Outotec Fi 95 B 93 B 4,190 9,409 3
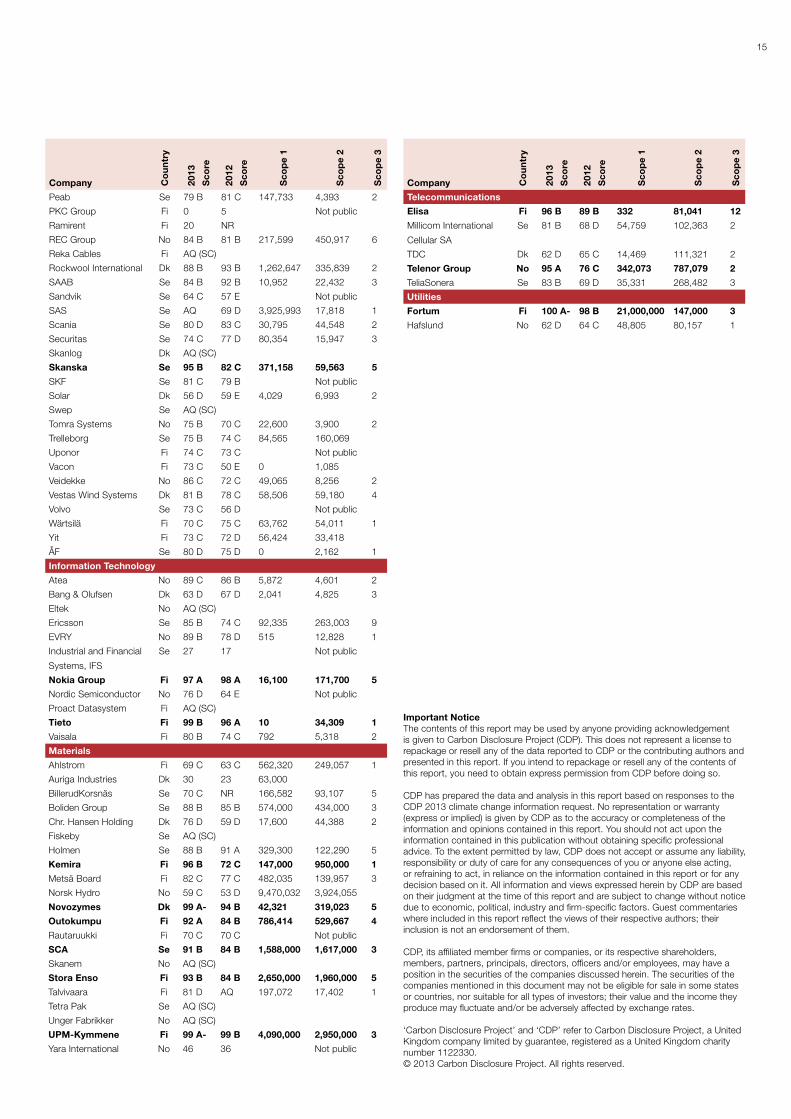
15
Company Co
un
try
2013
Sco
re
2012
Sco
re
Sco
pe
1
Sco
pe
2
Sco
pe
3
Company Co
un
try
2013
Sco
re
2012
Sco
re
Sco
pe
1
Sco
pe
2
Sco
pe
3
Peab Se 79 B 81 C 147,733 4,393 2
PKC Group Fi 0 5 Not public
Ramirent Fi 20 NR
REC Group No 84 B 81 B 217,599 450,917 6
Reka Cables Fi AQ (SC)
Rockwool International Dk 88 B 93 B 1,262,647 335,839 2
SAAB Se 84 B 92 B 10,952 22,432 3
Sandvik Se 64 C 57 E Not public
SAS Se AQ 69 D 3,925,993 17,818 1
Scania Se 80 D 83 C 30,795 44,548 2
Securitas Se 74 C 77 D 80,354 15,947 3
Skanlog Dk AQ (SC)
Skanska Se 95 B 82 C 371,158 59,563 5
SKF Se 81 C 79 B Not public
Solar Dk 56 D 59 E 4,029 6,993 2
Swep Se AQ (SC)
Tomra Systems No 75 B 70 C 22,600 3,900 2
Trelleborg Se 75 B 74 C 84,565 160,069
Uponor Fi 74 C 73 C Not public
Vacon Fi 73 C 50 E 0 1,085
Veidekke No 86 C 72 C 49,065 8,256 2
Vestas Wind Systems Dk 81 B 78 C 58,506 59,180 4
Volvo Se 73 C 56 D Not public
Wärtsilä Fi 70 C 75 C 63,762 54,011 1
Yit Fi 73 C 72 D 56,424 33,418
ÅF Se 80 D 75 D 0 2,162 1
Information Technology
Atea No 89 C 86 B 5,872 4,601 2
Bang & Olufsen Dk 63 D 67 D 2,041 4,825 3
Eltek No AQ (SC)
Ericsson Se 85 B 74 C 92,335 263,003 9
EVRY No 89 B 78 D 515 12,828 1
Industrial and Financial
Systems, IFS
Se 27 17 Not public
Nokia Group Fi 97 A 98 A 16,100 171,700 5
Nordic Semiconductor No 76 D 64 E Not public
Proact Datasystem Fi AQ (SC)
Tieto Fi 99 B 96 A 10 34,309 1
Vaisala Fi 80 B 74 C 792 5,318 2
Materials
Ahlstrom Fi 69 C 63 C 562,320 249,057 1
Auriga Industries Dk 30 23 63,000
BillerudKorsnäs Se 70 C NR 166,582 93,107 5
Boliden Group Se 88 B 85 B 574,000 434,000 3
Chr. Hansen Holding Dk 76 D 59 D 17,600 44,388 2
Fiskeby Se AQ (SC)
Holmen Se 88 B 91 A 329,300 122,290 5
kemira Fi 96 B 72 C 147,000 950,000 1
Metsä Board Fi 82 C 77 C 482,035 139,957 3
Norsk Hydro No 59 C 53 D 9,470,032 3,924,055
Novozymes dk 99 A- 94 B 42,321 319,023 5
Outokumpu Fi 92 A 84 B 786,414 529,667 4
Rautaruukki Fi 70 C 70 C Not public
SCA Se 91 B 84 B 1,588,000 1,617,000 3
Skanem No AQ (SC)
Stora Enso Fi 93 B 84 B 2,650,000 1,960,000 5
Talvivaara Fi 81 D AQ 197,072 17,402 1
Tetra Pak Se AQ (SC)
Unger Fabrikker No AQ (SC)
UPM-kymmene Fi 99 A- 99 B 4,090,000 2,950,000 3
Yara International No 46 36 Not public
Telecommunications
Elisa Fi 96 B 89 B 332 81,041 12
Millicom International
Cellular SA
Se 81 B 68 D 54,759 102,363 2
TDC Dk 62 D 65 C 14,469 111,321 2
Telenor Group No 95 A 76 C 342,073 787,079 2
TeliaSonera Se 83 B 69 D 35,331 268,482 3
Utilities
Fortum Fi 100 A- 98 B 21,000,000 147,000 3
Hafslund No 62 D 64 C 48,805 80,157 1
Important NoticeThe contents of this report may be used by anyone providing acknowledgement is given to Carbon Disclosure Project (CDP). This does not represent a license to repackage or resell any of the data reported to CDP or the contributing authors and presented in this report. If you intend to repackage or resell any of the contents of this report, you need to obtain express permission from CDP before doing so.
CDP has prepared the data and analysis in this report based on responses to the CDP 2013 climate change information request. No representation or warranty (express or implied) is given by CDP as to the accuracy or completeness of the information and opinions contained in this report. You should not act upon the information contained in this publication without obtaining specific professional advice. To the extent permitted by law, CDP does not accept or assume any liability, responsibility or duty of care for any consequences of you or anyone else acting, or refraining to act, in reliance on the information contained in this report or for any decision based on it. All information and views expressed herein by CDP are based on their judgment at the time of this report and are subject to change without notice due to economic, political, industry and firm-specific factors. Guest commentaries where included in this report reflect the views of their respective authors; their inclusion is not an endorsement of them.
CDP, its affiliated member firms or companies, or its respective shareholders, members, partners, principals, directors, officers and/or employees, may have a position in the securities of the companies discussed herein. The securities of the companies mentioned in this document may not be eligible for sale in some states or countries, nor suitable for all types of investors; their value and the income they produce may fluctuate and/or be adversely affected by exchange rates.
‘Carbon Disclosure Project’ and ‘CDP’ refer to Carbon Disclosure Project, a United Kingdom company limited by guarantee, registered as a United Kingdom charity number 1122330.© 2013 Carbon Disclosure Project. All rights reserved.
16
CdP
Amanda Haworth wiklundDirector, Nordic Region+46 (0)739 [email protected]
Emma HenningssonProject Manager, Nordic Region+46 (0)705 145726 [email protected]
Steven TebbeManaging Director, CDP Europe
CdP NordicBox 624810234 StockholmSweden
CdP EuropeReinhardtstrasse 1410117 BerlinGermany
CdP gGmbH;Executive Officers: Steven Tebbe,Sue Howells, Roy Wilson; Registered charity no. HRB119156 B; local court of Charlottenburg, Germany
CdP Board of Trustees
Chairman: Alan BrownSchroders
James CameronClimate Change Capital & ODI
Ben GoldsmithWHEB
Chris PageRockefeller Philanthropy Advisors
dr. Christoph Schroeder
Jeremy Smith
Takejiro Sueyoshi
Tessa Tennant
Martin wiseRelationship Capital Partners
Scoring Partner Contacts
FirstCarbon [email protected]
Co-funded by the LIFE+ programme of the European Union
The sole responsibility lies with the author and the Commission is not responsible for any use that may be made of the information contained therein.
Norway partner: