Embed Size (px)
Citation preview

SUMMARY FINANCIALSTATEMENTS
FOR THE YEAR ENDED
March 31, 2012
65


SECTION 1 SUMMARY FINANCIAL STATEMENTS
TABLE OF CONTENTS PAGE
Statement of Responsibility . . . . . . . . . . . . . . . . . . . . . . . . . . . . . . . . . . . . . . . . . . . . . . . . . . . . . . . . . . . 69
Auditor's Report . . . . . . . . . . . . . . . . . . . . . . . . . . . . . . . . . . . . . . . . . . . . . . . . . . . . . . . . . . . . . . . . . . . . 71
Consolidated Statement of Financial Position . . . . . . . . . . . . . . . . . . . . . . . . . . . . . . . . . . . . . . . . . . . . . 73
Consolidated Statement of Revenue and Expense . . . . . . . . . . . . . . . . . . . . . . . . . . . . . . . . . . . . . . . . . 74
Consolidated Statement of Accumulated Deficit . . . . . . . . . . . . . . . . . . . . . . . . . . . . . . . . . . . . . . . . . . . 75
Consolidated Statement of Change in Net Debt . . . . . . . . . . . . . . . . . . . . . . . . . . . . . . . . . . . . . . . . . . . 76
Consolidated Statement of Cash Flow . . . . . . . . . . . . . . . . . . . . . . . . . . . . . . . . . . . . . . . . . . . . . . . . . . . 77
Notes to the Summary Financial Statements . . . . . . . . . . . . . . . . . . . . . . . . . . . . . . . . . . . . . . . . . . . . . . 78
Schedules to the Summary Financial Statements Schedule 1 - Consolidated Statement of Amounts Receivable . . . . . . . . . . . . . . . . . . . . . . . . . . . . . 100 Schedule 2 - Consolidated Statement of Loans and Advances . . . . . . . . . . . . . . . . . . . . . . . . . . . . . 101 Schedule 3 - Government Business Enterprises Schedule of Consolidated Operating Results and Financial Position . . . . . . . . . . . . . . . . . . . . . . . . . . . . . . 102 Schedule 4 - Consolidated Statement of Borrowings . . . . . . . . . . . . . . . . . . . . . . . . . . . . . . . . . . . . . 103 Schedule 5 - Consolidated Statement of Accounts Payable, Accrued Charges, Provisions and Unearned Revenue . . . . . . . . . . . . . . . . . . . . . . . . . . . . . . . . . . . 104 Schedule 6 - Consolidated Statement of Pension Liability . . . . . . . . . . . . . . . . . . . . . . . . . . . . . . . . . 105 Schedule 7 - Consolidated Statement of Tangible Capital Assets . . . . . . . . . . . . . . . . . . . . . . . . . . . 107 Schedule 8 - Funds, Organizations and Business Enterprises Comprising the Government Reporting Entity . . . . . . . . . . . . . . . . . . . . . . . . . . . . . . . . . . . . . 108 Schedule 9 - Consolidated Statement of Operations by Sector . . . . . . . . . . . . . . . . . . . . . . . . . . . . . 112
67


PROVINCE OF MANITOBA PUBLIC ACCOUNTS 2011/12
($ millions)
SCHEDULE 2012 2011
FINANCIAL ASSETS
Cash and cash equivalents.................................................................................... 1,244 1,047 Temporary investments (Note 2)........................................................................... 286 345
1 Amounts receivable............................................................................................... 1,677 1,341 Inventories for resale............................................................................................. 65 61 Portfolio investments (Note 3)................................................................................ 2,784 2,765
2 Loans and advances.............................................................................................. 955 802 3 Equity in government business enterprises (Note 4)............................................. 3,617 3,570
Total Financial Assets 10,628 9,931
LIABILITIES
4 Borrowings............................................................................................................. 19,603 17,150 5 Accounts payable, accrued charges, provisions and unearned revenue............... 3,902 3,575 6 Pension liability (Note 5)........................................................................................ 1,634 1,731
Total Liabilities 25,139 22,456
NET DEBT (14,511) (12,525)
NON-FINANCIAL ASSETS Inventories held for use.......................................................................................... 59 50 Prepaid expenses.................................................................................................. 50 51
7 Tangible capital assets.......................................................................................... 9,097 8,187
Total Non-Financial Assets 9,206 8,288
ACCUMULATED DEFICIT (5,305) (4,237)
Contingencies (Note 6)Contractual Obligations (Note 7)Subsequent Event (Note 15)
The accompanying notes and schedules are an integral part of these financial statements.
73
SUMMARY FINANCIAL STATEMENTS CONSOLIDATED STATEMENT OF FINANCIAL POSITION
As at March 31, 2012

2011Budget Actual Actual
REVENUE Income taxes: Corporation income tax.............................................................................................................................................................................................423 424 330 Individual income tax..................................................................................................................................................................................................2,725 2,700 2,592 Other taxes: Retail sales tax...........................................................................................................................................................................................................................1,671 1,702 1,618 Fuel taxes.......................................................................................................................................................................................................................................................................267 269 256 Levy for health and education...............................................................................................................................................................................294 292 269 Mining tax.............................................................................................................................................................................................................................35 62 42 Education property tax................................................................................................................................. 728 691 690 Other taxes.......................................................................................................................................................................................................................515 515 531 Fees and other revenue......................................................................................................................1,771 1,906 1,828 Federal transfers: Equalization................................................................................................................................................................................................................1,942 1,942 2,001 Canada Health and Canada Social Transfers..................................................................................................................................................................1,418 1,426 1,365 Shared cost and other....................................................................................................................................................................................................612 964 681 Net income from government business enterprises (Schedule 3).................................................................................................................................... 781 713 807 Sinking funds and other investment earnings................................................................................................................................................ 239 249 230
Total Revenue (Schedule 9)...........................................................................................................13,421 13,855 13,240
EXPENSES Health and Healthy Living.....................................................................................................................................................5,361 5,328 5,044 Education .................................................................................................................................................................................................................3,561 3,489 3,330 Family Services......................................................................................................................1,017 1,013 978 Community, Economic and Resource Development............................................................................................................................................................2,340 2,771 2,400 Justice and Other Expenditures........................................................................................................................................................................774 1,438 894 Debt Servicing (Note 8)...................................................................................................................................806 815 773
Total Expenses (Schedule 9)..........................................................................................................13,859 14,854 13,419
NET LOSS FOR THE YEAR (438) (999) (179)
The accompanying notes and schedules are an integral part of these financial statements.
PROVINCE OF MANITOBAPUBLIC ACCOUNTS 2011/12
74
($ millions)
SUMMARY FINANCIAL STATEMENTSCONSOLIDATED STATEMENT OF REVENUE AND EXPENSE
For the Year Ended March 31, 2012
2012

2011Budget Actual Actual
Opening accumulated deficit, as previously reported.......................................... (4,503) (4,503) (4,374)
Restatements (Note 9)
First time adoption of IFRS................................................................................ - (30) (18)
Inclusion of new entities into the government reporting entity........................... - 164 147
Correction of Sick Pay benefit liabilities............................................................. - (62) (62)
Correction of Healthcare liabilities..................................................................... - 133 63
Correction of Pension liability............................................................................. - 41 32
Other.................................................................................................................. - 20 12
Opening accumulated deficit, as restated............................................................ (4,503) (4,237) (4,200)
Other Comprehensive Income (Schedule 3)........................................................ - (77) 142
Amalgamation of controlled entity (Schedule 3).................................................. - 8 -
Net Loss for the year............................................................................................ (438) (999) (179)
Closing accumulated deficit, as restated............................................................. (4,941) (5,305) (4,237)
The accompanying notes and schedules are an integral part of these financial statements.
SUMMARY FINANCIAL STATEMENTS
For the Year Ended March 31, 2012
75
PROVINCE OF MANITOBAPUBLIC ACCOUNTS 2011/12
($ millions)
CONSOLIDATED STATEMENT OF ACCUMULATED DEFICIT
2012
PROVINCE OF MANITOBAPUBLIC ACCOUNTS 2011/12
2011Budget Actual Actual
Net Loss for the year........................................................................................................ (438) (999) (179)
Tangible Capital Assets (Schedule 7) Acquisition and reclassification of tangible capital assets.................................. (1,561) (1,441) (1,361) Amortization of tangible capital assets............................................................... 439 476 438 Disposal of tangible capital assets..................................................................... - 55 15
Net Acquisition of Tangible Capital Assets....................................................................... (1,122) (910) (908)
Other Non-Financial Assets Decrease (Increase) in inventories.................................................................... - (9) 32 Decrease (Increase) in prepaid expenses......................................................... - 1 (5)
Net Acquisition of Other Non-Financial Assets - (8) 27
Other Comprehensive Income (Schedule 3).................................................................... - (77) 142 Net assets acquired on amlgamation (Schedule 3).......................................................... - 8 -
(Increase) in Net Debt...................................................................................................... (1,560) (1,986) (918)
Net Debt, beginning of year, as restated (Note 9)............................................................ (13,244) (12,525) (11,607)
Net Debt, end of year....................................................................................................... (14,804) (14,511) (12,525)
The accompanying notes and schedules are an integral part of these financial statements.
76
2012
($ millions)
SUMMARY FINANCIAL STATEMENTSCONSOLIDATED STATEMENT OF CHANGE IN NET DEBT
For the Year Ended March 31, 2012
PROVINCE OF MANITOBAPUBLIC ACCOUNTS 2011/12
($ millions)
2012 2011
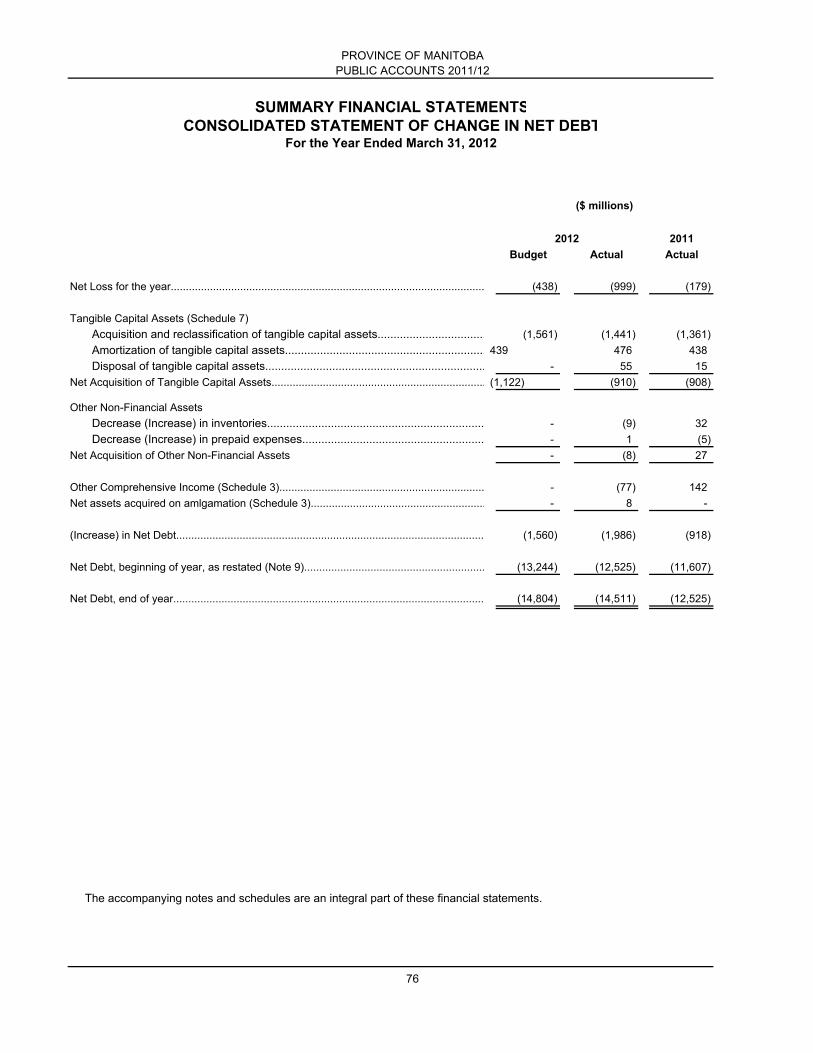
Cash and cash equivalents provided by (used in)
Operating Activities
Net loss for the year.......................................................................................................... (999) (179)
Changes in non-cash items:
Temporary investments................................................................................................... 59 206
Amounts receivable......................................................................................................... (428) (82)
Valuation allowance........................................................................................................ 93 3
Inventories....................................................................................................................... (13) 16
Prepaids.......................................................................................................................... 1 (5)
Accounts payable, accrued charges, provisions
and deferrals................................................................................................................. 327 38
Pension liability................................................................................................................ (97) (37)
Amortization of foreign currency fluctuation.................................................................... 6 6
Amortization of debt discount.......................................................................................... (16) (21)
Unamortized losses on derivative contracts.................................................................... 52 -
Loss on disposal of tangible capital assets..................................................................... 55 15
Amortization of tangible capital assets............................................................................ 476 438
(484) 398
Other Comprehensive Income (Schedule 3)................................................................... (77) 142
Net assets acquired on amalgamation (Schedule 3)...................................................... 8 -
Changes in equity in government business enterprises.................................................. (47) (371)
Cash provided by (used in) operating activities (600) 169
Capital Activities
Acquisition of tangible capital assets................................................................................ (1,441) (1,361)
Cash used in capital activities (1,441) (1,361)
Investing Activities
Investments purchased..................................................................................................... (1,567) (2,082)
Investments sold or matured............................................................................................. 838 1,672
Cash used in investing activities (729) (410)
Financing Activities
Debt issued....................................................................................................................... 5,424 3,639
Debt redeemed.................................................................................................................. (2,457) (2,450)
Cash provided by financing activities 2,967 1,189
Increase (Decrease) in cash and cash equivalents 197 (413)
Cash and cash equivalents, beginning of year.................................................................... 1,047 1,460
Cash and cash equivalents, end of year.............................................................................. 1,244 1,047
Supplementary information:
Interest received................................................................................................................. 252 232
Interest paid........................................................................................................................ 786 825
The accompanying notes and schedules are an integral part of these financial statements.
77
SUMMARY FINANCIAL STATEMENTS
For the Year Ended March 31, 2012CONSOLIDATED STATEMENT OF CASH FLOW

PROVINCE OF MANITOBA PUBLIC ACCOUNTS 2011/12
78
NOTES TO THE SUMMARY FINANCIAL STATEMENTS For the Year Ended March 31, 2012
1. SIGNIFICANT ACCOUNTING POLICIES A. General Basis of Accounting The summary financial statements have been prepared in accordance with Canadian generally accepted
accounting principles (GAAP) for the public sector as recommended by the Public Sector Accounting Board (PSAB) of the Canadian Institute of Chartered Accountants (CICA).
B. The Government Reporting Entity Various funds, Crown organizations (Crowns) and government business enterprises (GBEs) comprising the
Government Reporting Entity (GRE) are listed in Schedule 8 to the Summary financial statements. To be considered a part of the GRE, an organization must be controlled by the Government. Control, as
defined by PSAB, is the power to govern the financial and operating policies of another organization with expected benefits or the risk of loss to the Government from the other organization’s activities.
C. Basis of Consolidation Crowns are consolidated after adjusting their accounting policies to a basis consistent with the accounting
policies of the GRE as outlined in note 1D of the significant accounting policies. Inter-entity accounts and transactions are eliminated upon consolidation, except for retail sales tax. Where the fiscal year-end dates of Crowns are not the same as that of the GRE, and their transactions significantly affect the financial statements, their financial results are updated to March 31.
GBEs, whose principal activity is carrying on a business, maintain their accounts in accordance with
accounting principles which are generally accepted for business enterprises and which are considered appropriate to their individual objectives and circumstances. They derive the majority of their revenue from sources outside the GRE. They are reported in these summary financial statements using the modified equity method of accounting. Under the modified equity method, the original investment of the Government, in GBEs, is initially recorded at cost and adjusted annually to include the net income or losses and other net equity changes of these enterprises, without adjusting their accounting policies to a basis consistent with that of the GRE.
The financial results of GBEs are not updated to March 31, where their fiscal year end is not the same as
that of the GRE, except when transactions which, would significantly affect the summary financial statements, occur during the intervening period. Inter-entity accounts and transactions with GBEs are not eliminated. Supplementary financial information describing the financial position and results of operations of these enterprises is presented in Schedule 3 to the Summary financial statements.
The CICA’s Accounting Standards Board has announced that effective January 1, 2011 Canadian publicly accountable enterprises will adopt International Financial Reporting Standards (IFRS), as issued by the International Accounting Standards Board. For those entities currently reporting their operations under rate regulated accounting, that are now required to adopt IFRS as their basis of reporting, the CICA has allowed an extension to January 1, 2013 for the adoption of IFRS. Manitoba Hydro-Electric Board has opted to exercise this extension. GBEs are required to adopt IFRS for their financial reporting. IFRS standards are not required to be adopted by senior governments and will not be adopted for the summary financial statements.

PROVINCE OF MANITOBA PUBLIC ACCOUNTS 2011/12
79
D. Basis of Specific Accounting Policies (i) Gross Accounting Concept Revenues and expenses are recorded as gross amounts with the following exceptions:
(1) Refunds of revenue are treated as reductions of current year revenue. (2) Decreases in valuation allowances are treated as reductions to expense.
(3) Where there is sufficient evidence that the borrowings undertaken by the Government are specifically on behalf of a GBE, the recoveries of the debt servicing costs on self-sustaining debt of GBEs are recorded as a reduction of debt servicing expense.
(ii) Revenue
(1) Government transfers
Transfer payments from the Government of Canada include all accruals determined for current year entitlements that have been authorized by March 31, for which any eligibility criteria have been met and that can be reasonably estimated. (2) Individual and corporation income tax
Revenues from individual and corporation income tax are accrued in the year earned based upon estimates made by the Government of Canada using statistical models. Tax revenues are recorded at estimated amounts after considering adjustments for tax credits and other adjustments from the Government of Canada.
(3) Other revenue All other revenues are recorded on an accrual basis except when the accruals cannot be determined
with a reasonable degree of certainty or when their estimation is impracticable.
PSAB has issued new standards with respect to the recognition and measurement of tax revenues and accounting for government transfers, effective for year ends commencing on April 1, 2012. The impact of changes between this new standard and the Government’s current policy has not been reflected in these statements.
(iii) Expenses (1) Accrual accounting All expenses incurred for goods or services received are recorded on an accrual basis. Expenses include provisional amounts recorded in anticipation of costs, which are quantifiable and
have been identified as obligations. (2) Government transfers Government transfers are recognized as expenses in the period in which the transfer is authorized
and any eligibility criteria are met and the amounts can be reasonably estimated. (iv) Financial Assets (1) Loans and advances
Loans and advances are recorded at cost less valuation allowances. A valuation allowance is provided to reduce the value of the assets to their estimated realizable value or to reflect the impact of significant concessionary terms on outstanding loans. Valuation allowances are made when collection is considered doubtful. Premiums that may arise from the early repayment of loans or

PROVINCE OF MANITOBA PUBLIC ACCOUNTS 2011/12
80
advances are reflected as deferred revenue and are amortized monthly to debt servicing expense over the term of the loan or advance.
(2) Investments Investments denominated in foreign currency are translated to the Canadian dollar equivalent at the
exchange rate in effect at March 31, unless the rate of exchange or a forward foreign exchange contract fixing the value has been negotiated, in which case that rate or amount is used. The year end investment translation adjustments reflecting the foreign currency fluctuation between year ends are amortized monthly over the remaining life of the investment and are included with debt servicing expense. Expenses and other transaction charges incurred on the purchase of investments during the year are charged to debt servicing expense. Those expenses incurred in a foreign currency are translated at the exchange rate in effect on the transaction date. Gains and losses on terminated derivative contracts are deferred and amortized on a straight-line basis over the remaining term of the contract.
(3) Inventories for resale Inventories held for resale are recorded at the lower of cost and net realizable value.
(v) Liabilities
Liabilities are present obligations to outside parties and GBEs as a result of transactions and events occurring prior to the end of the fiscal year. The settlement of the liabilities will result in the future transfer or use of assets or other form of settlement. Liabilities are recorded at the estimated amount ultimately payable.
(1) Borrowings
All borrowings are expressed in Canadian dollars and are shown net of unamortized debt issue costs and debt of the Government held as provincial investments. Foreign borrowings are converted at the exchange rate in effect at March 31, adjusted for any forward foreign exchange contract entered into for settlement after the fiscal year end. Discounts or premiums, and commissions incurred at the time of the issue of debt are amortized monthly to debt servicing expense over the term of the debt.
The yearend translation adjustments, reflecting the foreign currency fluctuation from the value at the issue date, are recorded through the unamortized foreign currency fluctuation account and amortized monthly to debt servicing expense over the remaining term of the debt. The unamortized portion of foreign currency fluctuation also reflects the gains or losses on the conversion of foreign currency debt called prior to maturity using the rates in effect at the time of the call. These gains or losses are amortized over the original remaining term of the debt or over the term of the replacement issue, whichever is shorter. Premiums on interest rate options are amortized monthly over the period of the applicable agreement. If the option is exercised, the premium will continue to be amortized to the maturity date of the agreement. If the option is not exercised, any unamortized premium will be immediately taken into revenue or expense. Gains and losses on terminated derivative contracts are deferred and amortized on a straight-line basis over the remaining term of the contract.
(2) Pension liability
The Government accounts for employee pension plans by recognizing a liability and an expense in the reporting period in which the employee has provided service using the accrued benefit actuarial cost method, except as disclosed in Note 5. The value of plan assets is determined using a moving average fair value method. Under this method, fair value is the underlying basis, with any excess (or shortfall) of investment returns over (or below) the expected long-term rate being amortized over a five year period. When actual experience varies from actuarial estimates, for both the accrued benefit obligation and plan assets, the difference is amortized over the expected average remaining service life of the related employee group. Past service costs from plan amendments are recognized in full as expenses in the year of the amendment.

PROVINCE OF MANITOBA PUBLIC ACCOUNTS 2011/12
81
(3) Other future employee benefit obligations
The amount of the liabilities for severance, the Long Term Disability Income Plan and workers
compensation claims are based upon actuarial calculations. The periodic actuarial valuations of these liabilities may determine that adjustments are needed to the actuarial calculations because actual experience is different from that expected and/or because of changes in the actuarial assumptions used. The resulting actuarial gains or losses for the severance liability are amortized over the expected average remaining service life of the related employee group. Actuarial gains and losses for the Long Term Disability Income Plan and the workers compensation claims are recognized as they arise.
(4) Guarantees
Guarantees by the Government are made through specific agreements or legislation to repay promissory notes, bank loans, lines of credit, mortgages and other securities. Provision for losses on these guarantees are recorded when it is likely that a loss will occur. The amount of the loss provision represents the Government's best estimate of future payments less recoveries.
(5) Environmental liabilities
An environmental liability for contaminated sites is recorded when contamination is identified, and when the Government is obligated, or likely to become obligated, to incur remediation costs due to reasons of public health and safety, contractual arrangements, or compliance with environmental standards which are set out in any act or regulation (federal, provincial, municipal) recognized by the Government. The liability is based upon remediation costs determined on a site-by-site basis, measured as incremental direct costs, reduced by estimated recoveries from third parties, and discounted, where possible, to reflect the time value of money.
PSAB has issued a new standard with respect to the recognition and measurement of liabilities related to contaminated sites, effective for year ends commencing on April 1, 2014. The impact of changes between this new standard and the Government’s current policy has not been reflected in these statements.
(vi) Non-Financial Assets
(1) Recognition and measurement
In the public sector, recognition and measurement of tangible capital and other non-financial assets are based on their future service potential. Generally, such assets do not generate future net cash inflows. Therefore, these assets will not provide resources to discharge the liabilities of the Government. For non-financial assets, the future economic benefit consists of their capacity to render service to fulfill the Government’s objectives. (2) Inventories Inventories held for resale are classified as non-financial assets if it is anticipated that the sale will not be completed within one year of the reporting date. Inventories held for use are classified as non-financial assets. (3) Prepaid expenses
Prepaid expenses are payments for goods or services which will provide economic benefits in future periods. The prepaid amount is recognized as an expense in the year the goods or services are used or consumed. (4) Tangible capital assets
The cost of tangible capital assets purchased includes the purchase price as well as costs such as installation costs, design and engineering fees, survey and site preparation costs and other costs incurred to put the asset into service. The cost of tangible capital assets constructed by the

PROVINCE OF MANITOBA PUBLIC ACCOUNTS 2011/12
82
Government includes all direct construction costs such as materials, labour, design, installation, engineering, architectural fees, and survey and site preparation costs, as well as overhead costs directly attributable to the construction activity such as licenses, inspection fees, indirect labour costs, and amortization expense of any equipment which was used in the construction project. Any carrying costs associated with the development and construction of tangible capital assets is included for projects whose cost exceeds $20 million.
Certain assets, which have historical or cultural value, including works of art, historical documents as well as historical and cultural artifacts are not recognized as tangible capital assets because a reasonable estimate of the future benefits associated with such property cannot be made. Intangible assets and items inherited by right of the Crown, such as Crown lands, forests, water and other mineral resources are not recognized in the Government’s financial statements. Tangible capital assets are amortized on a straight-line basis over their estimated useful lives as follows: General Tangible Assets: Land Indefinite Buildings and Leasehold Improvements Buildings 10 to 60 years Leasehold improvements Life of lease Vehicles and Equipment Vehicles 5 years Aircraft and vessels 5 to 24 years Machinery, equipment and furniture 3 to 20 years Maintenance and road construction equipment 15 years Computer hardware, software licences 4 to 15 years Infrastructure Assets: Land Indefinite Land Improvements 30 years Transportation Bridges and Structures 40 to 75 years Provincial Highways, Roads and Airstrips 10 to 40 years Dams and Water Management Structures 40 to 100 years One-half of the annual amortization is charged in the year of acquisition and in the year of disposal. Assets under construction are not amortized until the asset is put into service.
(vii) Classification by Sector
The Province reports operational results under the following sectors; health and healthy living, education, family services, community economic and resource development, justice and other expenditures and general government. The entities and departments included in each sector are identified in Schedule 8 to the summary financial statements.
The health and healthy living sector includes provincial health care programs and includes all health related entities and services.
The education sector includes all education services including elementary, secondary and post-secondary services, including the pension related expenses associated with this sector.
The family services sector includes all social services related to employment and income support for individuals in need as well as a comprehensive range of social services and financial assistance programs provided to Manitobans throughout the Province.
The community economic and resource development sector includes the promotion and development of the Province’s natural resources including the support of industries within this sector. It also includes the operation and maintenance of transportation systems including highway infrastructure and other Government infrastructure. The sector also contains the management and administration of housing policies and benefits for low to moderate income renters and
PROVINCE OF MANITOBA PUBLIC ACCOUNTS 2011/12
83
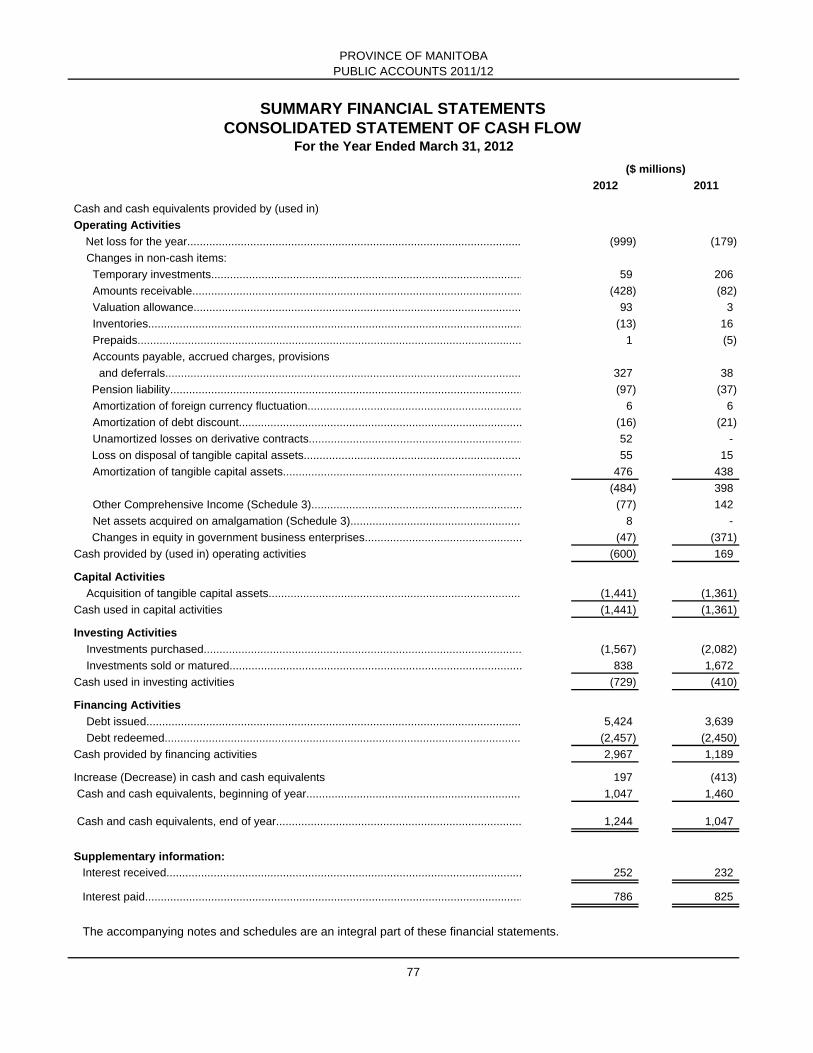
homeowners. The justice and other expenditures sector include general administration, finance, executive and legislature, cultural and sport related activities. The sector contains criminal and civil legal services and programs that protect the rights of Manitobans. Also included in the sector, are all general government pension related expenses.
The general government sector is comprised of those activities that cannot to be allocated to the specific sectors noted above. Inter-segment transfers between sectors are measured at the exchange amount.
E. Measurement Uncertainty
Estimates are used to accrue revenues and expenses in circumstances where the actual accrued revenues and expenses are unknown at the time the financial statements are prepared. Uncertainty in the determination of the amount at which an item is recognized in the financial statements is known as measurement uncertainty. Such uncertainty exists when there is a variance between the recognized amount and another reasonable amount, as there is whenever estimates are used.
Measurement uncertainty in these financial statements exists in the accrual of individual and corporate
income taxes, Canada Health Transfer and Canada Social Transfer entitlements, accruals for pension obligations, accruals for environmental obligations, allowances for doubtful loans, accruals for liabilities valued through actuarial valuations, such as long term disability, severance, sick pay obligations and workers compensation claims and advances and provision for losses on guarantees.
The nature of the uncertainty related to the accrual of health and social transfer payments from the
Government of Canada and individual and corporate income taxes arises because of the possible differences between the estimates for the economic factors used in calculating the accruals and actual economic results. The uncertainty related to accruals for pension obligations arises because actual results may differ significantly from the Government’s best estimates of expected results based on variables such as earnings on the pension investments, salary increases and the life expectancy of claimants. The uncertainty related to the accrual of environmental obligations is based upon the identification of all sites where environmental damages have occurred that are the Government’s responsibility to mitigate and the quantification of what the actual liability will be based upon impact studies. Uncertainty concerning the allowance for doubtful loans and advances is based upon actual collectability and changes in economic conditions.
While management’s best estimates have been used for reporting items subject to measurement
uncertainty, it is possible that changes in future conditions in the near term could require a material change in the valuation of the reported amounts. Near term is defined as a period of time not to exceed one year from the date of the financial statements.
2. TEMPORARY INVESTMENTS
($ millions) 2012 2011
Temporary investments 286 345 Temporary investments are recorded at cost, which approximates market value. Temporary investments consist
of investments with financial institutions, government bonds and other short term investment vehicles. All of the securities have terms to maturity of less than one year.
PROVINCE OF MANITOBA PUBLIC ACCOUNTS 2011/12
84
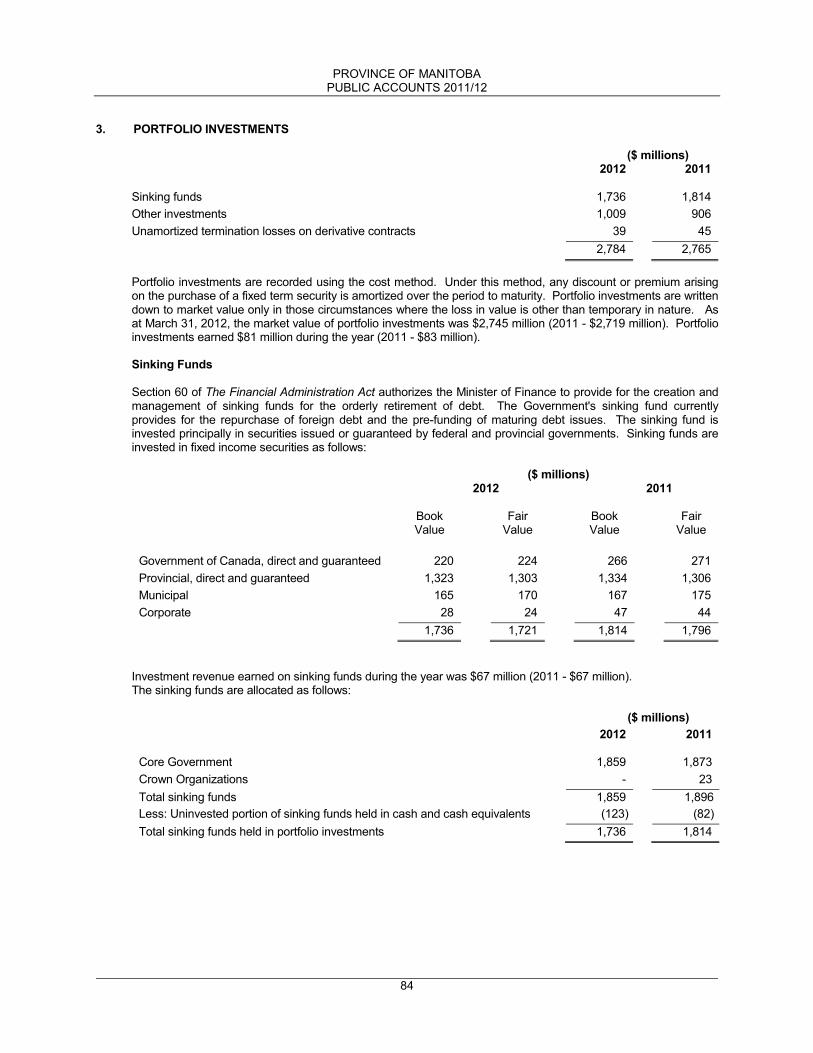
3. PORTFOLIO INVESTMENTS
($ millions) 2012 2011
Sinking funds 1,736 1,814 Other investments 1,009 906 Unamortized termination losses on derivative contracts 39 45
2,784 2,765
Portfolio investments are recorded using the cost method. Under this method, any discount or premium arising on the purchase of a fixed term security is amortized over the period to maturity. Portfolio investments are written down to market value only in those circumstances where the loss in value is other than temporary in nature. As at March 31, 2012, the market value of portfolio investments was $2,745 million (2011 - $2,719 million). Portfolio investments earned $81 million during the year (2011 - $83 million). Sinking Funds Section 60 of The Financial Administration Act authorizes the Minister of Finance to provide for the creation and management of sinking funds for the orderly retirement of debt. The Government's sinking fund currently provides for the repurchase of foreign debt and the pre-funding of maturing debt issues. The sinking fund is invested principally in securities issued or guaranteed by federal and provincial governments. Sinking funds are invested in fixed income securities as follows:
($ millions) 2012 2011 Book
Value Fair
Value Book
Value Fair
Value Government of Canada, direct and guaranteed 220 224 266 271
Provincial, direct and guaranteed 1,323 1,303 1,334 1,306 Municipal 165 170 167 175
Corporate 28 24 47 44 1,736 1,721 1,814 1,796
Investment revenue earned on sinking funds during the year was $67 million (2011 - $67 million). The sinking funds are allocated as follows: ($ millions)
2012 2011 Core Government 1,859 1,873 Crown Organizations - 23 Total sinking funds 1,859 1,896 Less: Uninvested portion of sinking funds held in cash and cash equivalents (123) (82) Total sinking funds held in portfolio investments 1,736 1,814

PROVINCE OF MANITOBA PUBLIC ACCOUNTS 2011/12
85
Other Investments
($ millions) 2012 2011 Guaranteed investment certificates 81 5 Bonds – Government of Canada, provincial and municipal 368 284 Bonds – Corporate 422 490 Equity Investments 118 107 Investments in real estate 20 20 1,009 906
As at March 31, 2012, the market value of other investments was $1,024 million (2011 - $923 million). Other investments earned $14 million during the year (2011 - $16 million).
4. EQUITY IN GOVERNMENT BUSINESS ENTERPRISES The GBEs that are included in the summary financial statements are listed in Schedule 8 and are classified as
follows:
Category Definition
Utility An enterprise which provides public utility services for a fee.
Insurance An enterprise which provides insurance coverage services to the public for a fee.
Finance Enterprises which provide regulatory control and are revenue generating or enterprises which use economy of scale to deliver goods and services to the public.
The operating results and financial position of each GBE category are reported in Schedule 3 to the Summary financial statements.
Included in the equity in GBEs are equities, which are restricted for use by provincial legislation and thereby not available to discharge Government liabilities or to finance other Government programs. The equity in GBEs is comprised of:
($ millions)
2012 2011
Restricted Equity in Government Business Enterprises:
Deposit Guarantee Corporation of Manitoba 190 162 Manitoba Hydro-Electric Board 2,777 2,756 Manitoba Lotteries Corporation - 5 Manitoba Public Insurance Corporation 422 424 Workers Compensation Board 213 208 3,602 3,555 Unrestricted Equity in Government Business Enterprises: Manitoba Lotteries Corporation 5 5 Manitoba Public Insurance Corporation 10 10 15 15 Equity in Government Business Enterprises
3,617
3,570

PROVINCE OF MANITOBA PUBLIC ACCOUNTS 2011/12
86
5. PENSION PLANS
The Government participates in various pension plans. The two primary plans, in which the Government directly participates, are the Civil Service Superannuation Plan, and the Teachers’ Pension Plan. As per the Acts that administer these plans, the Government is responsible for 50% of pension benefits earned by employees. The Government’s pension liability reflects its share of the actuarial present values of pension benefits attributed to services rendered by employees and former employees, net of any plan assets which are set aside by the Government in an irrevocable trust. As of March 31, 2012, the pension liability for the Civil Service Superannuation Plan was $613 million (2011 - $794 million) and the pension liability for the Teachers’ Pension Plan was $1,009 million (2011 - $903 million). Other pension plans in which the Government participates include the Members of the Legislative Assembly Plan, the Legislative Assembly Pension Plan, the Judges’ Supplemental Pension Plan and the Winnipeg Child and Family Services Employee Benefits Retirement Plan. The Government is responsible for any excess of accrued pension benefits over pension fund assets for these plans.
The Government also includes several other pension plans in its pension liability. These other plans include post-secondary education pension plans and public school divisions’ pension plans. Post-secondary education pension plans include the University of Manitoba Pension Plans, the University of Winnipeg Pension Plan and the Brandon University Retirement Plan. Public school divisions’ pension plans include the Winnipeg School Division Pension Fund for Employees Other Than Teachers, Retirement Plan for Non-Teaching Employees of the St. James-Assiniboia School Division and Retirement Plan for Employees of Frontier School Division.
Employees in the health sector are members of the Health Care Employees Pension Plan, a multi-employer
defined benefit pension plan established between employees and participating boards. Because the Government does not sponsor this plan, the accrued benefit liability of this plan is not recognized in these financial statements. The annual net benefit plan expense is the amount of required contributions provided for employees’ services rendered during the year. During the year, the Government expensed contributions to this plan of $129 million (2011 - $113 million). At December 31, 2011 the Plan had a deficiency of net assets available for benefits over pension obligations of $547 million. The Plan is addressing this deficiency through increased employer and employee contributions and exercising due diligence in evaluating investment and other management decisions.
As at March 31, 2012, the total pension liability being reflected in the summary financial statements was $1,634
million (2011 - $1,731 million). Details related to the pension liability are provided in Schedule 6 to the Summary financial statements. The following provides general information on the contributions and benefit formulae of the various pension plans, which are included in this schedule.
A. Civil Service Superannuation Plan
The Civil Service Superannuation Act (CSSA) established a defined benefit plan to provide benefits to
employees of the Manitoba Civil Service and to participating agencies of the Government through the Civil Service Superannuation Fund (CSSF).
The lifetime pension calculation equals 2% of a member's best five-year average yearly pensionable
earnings multiplied by pensionable service, minus 0.4% of the average Canada Pension Plan (CPP) earnings multiplied by pensionable service since January 1, 1966.
The CSSA requires employees to contribute 6.0% of pensionable earnings up to the CPP maximum pensionable earnings, and 7.0% on pensionable earnings above the maximum. Commencing on July 1, 2012 employee contributions will be increasing by .5% per year until the 2015 calendar year. At that time employees will be required to contribute 8.0% of pensionable earnings up to the CPP maximum pensionable earnings, and 9.0% on pensionable earnings above the maximum. 89.8% of employee contributions are used to fund basic benefits and 10.2% of employee contributions are allocated to funding indexing benefits. The Government funds 50% of the monthly pension retirement benefits paid to retirees.
Indexing benefits are not guaranteed and are paid only to the extent that the indexing adjustment account in CSSF can finance one-half of the cost-of-living increases granted. The maximum annual adjustment is limited by legislation to two-thirds of the increase in the Consumer Price Index for Canada.

PROVINCE OF MANITOBA PUBLIC ACCOUNTS 2011/12
87
B. Teachers' Pension Plan
The Teachers' Pensions Act (TPA) established a defined benefit plan to provide pension benefits to teachers who have taught in public schools in Manitoba. The lifetime pension calculation is generally based upon 2% of a member's average salary of the best five of the final 12 years of service (best seven prior to July 1, 1980) multiplied by pensionable service, minus the years of service multiplied by 0.6% of the annual salary up to the yearly maximum pensionable earnings. The pension amount is subject to a maximum of 70% of the average annual salary used above.
The TPA requires that teachers contribute 6.8% of pensionable earnings up to the CPP maximum earnings, and 8.4% of pensionable earnings above the maximum. Commencing September 1, 2012 teacher contributions will be increasing at .5% per year until September 1, 2015. At that time the TPA will require teachers to contribute 8.8% of pensionable earnings up to the CPP maximum pensionable earnings and 10.4% of pensionable earnings above the maximum. 83.3% of teacher’s contributions are used to fund basic benefits and 16.7% of teachers contributions are allocated for funding indexing benefits. The Government funds 50% of the monthly pension retirement benefits paid to retirees.
Indexing benefits are not guaranteed and are paid only to the extent that the indexing adjustment account in Teachers’ Retirement Allowances Fund can finance one half of the cost-of-living increases granted. The maximum annual adjustment is limited by legislation to two-thirds of the increase in the Consumer Price Index for Canada.
C. Other Government Plans
(i) Members of the Legislative Assembly Plan
The pension plan for Members of the Legislative Assembly (MLAs) is established and governed by The Legislative Assembly Act (LAA).
For MLAs elected prior to the dissolution of the Assembly of the 35th Legislature, the LAA provides for
defined pension benefits based on years of service to April 1995. The calculation for defined pension benefits is equal to 3% of the average annual indemnities for the last five years served as a member or all the years served; if less than five, multiplied by the number of years of pensionable service up to April 1995. These entitlements are fully indexed to cost of living increases.
For those MLA’s elected after the 35th Legislature in April 1995, the LAA provides for matching contributions. Under the matching contributions provisions, MLAs may contribute up to 7% of their remuneration toward a Registered Retirement Savings Plan (RRSP) of their choice. The Government matches the member's contributions on a current basis; consequently, there is no liability for past service benefits under this component of the plan. In the event that a member withdraws money from the RRSP, while an active member of the Legislative Assembly, the Government's contribution would be refundable back to the Government.
(ii) Legislative Assembly Pension Plan
The Members’ Ret irement Benefits Regu lation of The Legislative Assembly Act established a defined benefit plan, effective April 1, 2004 that provides pension benefits to eligible MLAs who elect to participate in the plan.
The pension benefits accumulate up to a maximum period of 35 years at 2% per year of pensionable service based upon the average of the best five-year annual salaries, reduced by an amount equal to 0.25% times the number of months before the member’s 60 th birthday that the first pension payment is made. These entitlements are indexed to 2/3 of cost of living increases.
Active members must contribute 7% of their earned salary to the plan. The Government makes contributions as necessary to ensure the pension fund has sufficient assets to cover the monthly pension payments to retirees as well as ensuring there are sufficient funds to cover any of the plans liabilities. Any surplus of plan assets over the pension obligation can be used by the Government to reduce future contributions.

PROVINCE OF MANITOBA PUBLIC ACCOUNTS 2011/12
88
(iii) Judges’ Supplemental Pension Plan
Manitoba Provincial Court Judges and Masters are members of the Civil Service Superannuation Plan; however, they also receive enhanced pension benefits under the Manitoba Provincial Court Judges and Masters’ Supplemental Pension Plan. T hese supplemental pension benefits for judges are the difference between the total pension benefits for judges, including the amendments introduced by Judicial Compensation Committees, and the formula pension available under The Civil Service Superannuation Act(CSSA) as described above in Note 5A.
The supplemental pension is generally based upon an accrual rate of 3% for each year of service, as a judge, up to a maximum of 23.5 years, reduced by the pension provided under the CSSA. The combined total of the Judges’ Supplem ental Pension and C ivil Serv ice Superannuation Pen sion i s subject to a maximum of 70% of earnings. These enhanced benefits are entirely funded by the Government.
(iv) Winnipeg Child and Family Services Employee Benefits Retirement Plan
Established effective December 29, 2003, the Winnipeg Child and Family Services Employee Benefits Retirement Plan (WCFSP) applies to employees of the former Winnipeg Child and Family Services Agency, who transferred to the Department of Family Services and Labour.
The lifetime pension cal culation equals 2% of the mem ber’s highest average pensionable earnings in any three non-overlapping periods of 12 consecutive months, less 0.6% of the average CPP earnings for the same period multiplied by years of pensionable service. Indexing payments are subject to approval by the Trustees, subject to increases in the Consumer Price Index.
Members are required to contribute 4.5% of pensionable earnings up to the CPP maximum and 6% on pensionable earnings over the maximum. Any surplus of plan assets over the pension obligation can be used by the Government to reduce future contributions.
D. Other Pension Plans
(a) Post-Secondary
(i) University of Manitoba Pension Plan
The University of Manitoba administers The University of Manitoba Pension Plan (1970), The University of Manitoba Pension Plan (1993), and The University of Manitoba GFT Pension Plan (1986). These are trusteed pension plans. The Trustees are responsible for the custody of the plans' assets and issuance of annual financial statements. The December 2009 funding valuation indicated that the University of Manitoba Pension Plan (1993) was in a funding deficiency position which the University is funding over fifteen years at an annual additional payment of $4 million. In addition the Plan was amended effective January 1, 2011 to provide for increases in employee and employer of .5% effective January 1, 2011, .5% effective January 1, 2012 and 1.0% effective January 1, 2013.
University of Manitoba Pension Plan (1993) is a money purchase plan with a defined benefit minimum. The funding for the plan requires a matching contribution from the University and the employees. The plan is not indexed. Retirement benefit is calculated by using the greater of the two methods: Formula and Plan Annuity. For each year of pensionable service, Formula benefit equals 2.0% of the average best five year salary, less 0.7% of the average best five year salary under the YMPE in the year of retirement, to a maximum of 1/9 of the Pension Plans money purchase limit. The benefit is reduced by ¼% for each month between the actual pension commencement date and the age of 65. Plan Annuity benefit is based on contribution account balance, age of the retirement, and the annuity factor determined by the plan actuary.
The University of Manitoba Pension Plan (1970) operates as a defined contribution or money purchase arrangement for service since 2003. Certain members retain an entitlement to a hybrid formula for the service prior to 2003, similar to the 1993 Plan.
The University of Manitoba GFT Pension Plan (1986) is a defined contribution pension plan; therefore there is no requirement for an actuarial valuation of this plan.

PROVINCE OF MANITOBA PUBLIC ACCOUNTS 2011/12
89
(ii) University of Winnipeg Pension Plan The University of Winnipeg administers the University of Winnipeg Pension Plan (UWPP), which is comprised of a defined benefit segment and a defined contribution segment. The assets of the Plan are held in trust by independent custodians. The UWPP was established as a contributory defined benefit pension plan at September 1, 1972 and covers all eligible employees of the University, except those who are members of the United Church of Canada Pension Plan. The funding for the plan requires a matching contribution from the University and the employees. Annual pension equals 2.0% of the final five year average earnings multiplied by the years of pensionable service, less 0.6% of CPP average earnings for each year of pensionable service. The pension benefit is subject to a plan benefit maximum limit of $1,722.22 per year of pensionable service. At December 2010 the Plan had a going-concern deficiency of $25 million which the University is addressing by making annual deficiency payments of $3 million until the deficiency is eliminated.
Since December 31, 2000, when the defined contribution segment of the Plan was introduced, approximately one-quarter of the eligible members converted to that plan. The obligation for pension benefits under the defined contribution segment of the Plan will always be equal to net assets in each member’s account. Therefore, no surplus or deficiency arises from fluctuations in the investment market.
(iii) Brandon University Retirement Plan Brandon University administers the Brandon University Retirement Plan, which is a trusteed pension plan. The Trustees are responsible for the custody of the Plan's assets and issuance of annual financial statements. The Brandon University Retirement Plan is a final average contributory defined benefit pension plan established April 1, 1974 for the benefit of the employees of Brandon University. The funding for the plan requires a matching contribution from the University and the employees. Annual pension equals 2.0% of the final five year average earnings multiplied by the years of pensionable service, less 0.6% of CPP average earnings for each year of pensionable service. The pension benefit is subject to a plan benefit maximum limit of $1,722.22 per year of pensionable service for members retired on or before April 1, 2009, and $1,975.00 for those retiring after that date.
(b) Public School Divisions
(i) The Winnipeg School Division Pension Fund for Employees Other Than Teachers The Winnipeg School Division Pension Fund for Employees Other Than Teachers is a defined benefit pension plan for employees that meet specified employment conditions. The fund was created by By-law 196 of the Winnipeg School Division (replaced by By-law 1017 on January 1, 1992) and is subject to the applicable regulations. The pension calculation is based on an amount equal to 1.6% of a member's average pensionable salary and 2.0% of a member's average salary over the pensionable salary, multiplied by a member's years of pensionable service. The average salary is determined by averaging the best five years of employment salary in the last twelve years of service. Employee contributions equal 6.5% of pensionable salary and 7.8% of the earnings in excess of pensionable salary up to the yearly maximum pensionable earnings, effective January 1, 2008. The percentages changed to 7.0% and 8.2% respectively, effective January 1, 2009. The Winnipeg School Division matches employee contributions and pays an additional 27.4% of employee contributions less the amount needed to finance the Disability Income Plan benefits (approximately 10%). As a result, employer contributions equal approximately 117.4% of employee contributions. (ii) Retirement Plan for Non-Teaching Employees of the St. James-Assiniboia School Division The St. James-Assiniboia School Division Retirement Plan for Non-teaching Employees is a defined

PROVINCE OF MANITOBA PUBLIC ACCOUNTS 2011/12
90
benefit pension plan that was established on January 1, 1978 and is subject to the applicable regulations.
The pension calculation is based on an amount equal to 1.4% of a member's average employment earnings below CPP earnings and 2.0% of a member's employment earnings in excess of the CPP earnings, multiplied by a member's years of contributory service. The average employment earnings are determined by averaging the best six years of employment earnings in the last 12 years of service. Employee contributions equal 5.7% of CPP earnings and 7.3% of the employment earnings in excess of CPP earnings. The St. James-Assiniboia School Division matches employee contributions. (iii) Retirement Plan for Employees of Frontier School Division The Frontier School Division Retirement Plan is a defined benefit pension plan for non-teaching employees. The pension benefit is based on an amount equal to 2.0% of a member's best average earnings, multiplied by a member's years of credited service. The average employment earnings are determined by averaging the best five years of employment earnings in the last ten years of service. Employee contributions equal 6.0% of CPP earnings, with the Frontier School Division matching employee contributions. The Frontier School Division is responsible for the balance of the pension cost, of which a portion can be financed by an allocation from pension surplus.
E. Government Business Enterprises
Manitoba Hydro-Electric Board, Manitoba Liquor Control Commission, Manitoba Public Insurance Corporation and Manitoba Lotteries Corporation are members of the CSSF. The net pension liabilities for these GBEs are disclosed in Schedule 3.
6. CONTINGENCIES A. Contingent Liabilities
i) Legal Actions The Government has been named in various legal actions. No provision has been made at March 31, 2012 in the accounts where the final results are uncertain. ii) Northern Development Projects The Government is contingently liable for legal claims associated with past Manitoba Hydro-Electric Board (Hydro) related northern development projects. The outcome of these claims is not determinable at this time.
Hydro is party to an agreement dated December 16, 1977, with Canada, the Province of Manitoba and the
Northern Flood Committee Inc., representing the five First Nations in the communities of Cross Lake, Nelson House, Norway House, Split Lake and York Landing. This agreement, in part, provides for compensation and remedial measures necessary to ameliorate the impacts of the Churchill River diversion and the Lake Winnipeg Regulation projects.
In recognition of all anticipated payments, Hydro has recorded a total liability of $251 million (2011 - $185
million). Reassessments of these liabilities will be made as settlements are achieved. There are other mitigation issues, the outcomes of which are not determinable at this time. iii) Canadian Blood Services
The majority of provincial and territorial governments of Canada, including Manitoba, are members of, and provide funding to, Canadian Blood Services, which operates the Canadian blood system. The March 31,

PROVINCE OF MANITOBA PUBLIC ACCOUNTS 2011/12
91
2012 audited financial statements of Canadian Blood Services indicate that a wholly owned subsidiary, CBS Insurance Company Limited, provides for the contingent liabilities for risks related to operations of the blood system. The actuarially determined provisions for future insurance claims, reported and unreported, related to insured events that occurred prior to March 31, 2012 is $250 million (2011 - $250 million). The related assets as at March 31, 2012 total $349 million (2011 - $333 million). The subsidiary also had a re-insurance contract for additional coverage of $750 million.
Based upon the above, the Government’s share of the provision for future claims as at March 31, 2012 is
offset with designated assets, which at that point exceed the provision. In addition, there is re-insurance to cover an additional $750 million in claims of insured events occurring on or before March 31, 2012. The Government is not aware of any proceedings that could lead to a claim against it given the existing arrangement in place.
iv) Treaty Land Entitlement Obligations
To meet the Government’s obligation under treaty land entitlement agreements, approximately 590,212 acres of provincial Crown lands have been transferred to the Government of Canada for First Nations. The Government’s obligations under the treaty land entitlement agreements require the setting aside of 1,426,454 acres of Crown lands and Other Lands (Acquisition). To date, approximately 980,845 acres of Crown lands have been selected by the Entitlement First Nations. The Crown lands will be transferred according to the Natural Resources Transfer Agreement, and the transfer will include mines and minerals and other interests normally reserved for the Government, under The Crown Land Act or any other statute.
v) Credit Union Guarantees
The Deposit Guarantee Corporation of Manitoba has guaranteed $18.8 billion (2011 - $16.2 billion) in credit union deposits at the end of their current fiscal year. Based upon ongoing monitoring procedures, the Corporation has concluded that a provision for such contingencies does not need to be established at this time.
vi) Environmental Issues
The Manitoba Hydro-Electric Board will incur future costs associated with the assessment and remediation of contaminated lands and for the phase-out and destruction of polychlorinated biphenyl contaminated mineral oil from electrical equipment. A reasonable estimate of the associated costs cannot be made at this time.
B. Loan Guarantees
The Government has guaranteed the repayment of debt, promissory notes, bank loans, lines of credit, mortgages and securities held by others. Debt guaranteed by the Government is guaranteed, as to principal and interest, until the debt is matured or redeemed. The authorized limits and the outstanding guarantees are summarized as follows:
Authorized ($ millions)
Limit 2012 2011
Manitoba Business Start Program 5 4 2 Manitoba Agricultural Services Corporation (Note 6B.a) - 82 90 Manitoba Student Aid Program (Note 6B.b) 20 1 1 Manitoba Housing and Renewal Corporation (Note 6B.c) - 14 4 Multi-Material Stewardship Manitoba Inc. 1 - - Rural Municipality of Richot 1 - -
101 97 Manitoba Grow Bonds 3 3
Total guarantees outstanding 104 100 87
A provision for future losses on guarantees in the amount of $19 million (2011 - $21 million) has been recorded in the accounts. The provisions for losses on guaranteed loans are determined by a review of

PROVINCE OF MANITOBA PUBLIC ACCOUNTS 2011/12
92
individual guarantees. The provision represents the best estimate of probable claims against the guarantees. Where circumstances indicate the likelihood of claims arising, provisions are established for those loan guarantees.
Manitoba HydroBonds Guarantees
Outstanding Manitoba HydroBonds as at March 31, 2012 totalled $330 million (2011 - $241 million). These bonds carry fixed and variable coupon rates that range from 1.75% to 9.38%. Manitoba HydroBonds are redeemable at the option of the holder. The Government guarantees $254 million (2011 - $163 million) of these outstanding bonds.
Note 6B.a) Manitoba Agricultural Services Corporation
The Manitoba Agricultural Services Corporation has guaranteed loans under the following programs:
Program General Terms and Conditions
Operating Credit Guarantee
Each participating lending institution is guaranteed 25% of the respective value of loans made under this program.
Manitoba Livestock Associations Loan Guarantees
Each association is guaranteed 25% of the loan to a maximum guarantee of $5 million.
Diversification Loan Guarantee Program
Each participating lender is guaranteed 25% of the loan made for the diversification or farm value-added activities, to a maximum individual guaranteed loan allowable of $3 million.
Enhanced Diversification Loan Guarantee Program
Guarantees are based on 25% of the original principal amount of each individual loan, with no maximum loan amount.
Rural Entrepreneur Assistance (REA) Program
Each participating lender is guaranteed up to 80% of the loan made to small rural non-agricultural business to a maximum guarantee of $0.2 million.
Note 6B.b) Manitoba Student Aid Program
The Government guarantees three types of student loans, issued in the past 19 years, as follows:
Loan type Nature of loan
Guaranteed loans
Issued by the Canadian Imperial Bank of Commerce (CIBC) from April 1, 1993 to December 31, 1994. These loans are fully guaranteed, if the loan is deemed to be in default.
Limited risk loans Issued by the CIBC from January 2, 1995 to December 31, 1997 and issued by the Royal Bank from June 2, 1997 to July 31, 2000. The Government only guarantees those loans in default that have been issued to credit abusers, insolvent creditors and minors.
Non-risk loans Issued by the Royal Bank from August 1, 2000 to July 31, 2001. The Government has agreed to guarantee and purchase any loan deemed to be in default.
Note 6B.c) Manitoba Housing and Renewal Corporation
The Government has guaranteed the repayment of mortgages and has issued letters of credit which guarantee the terms and conditions of land development agreements and construction contracts.

PROVINCE OF MANITOBA PUBLIC ACCOUNTS 2011/12
93
7. CONTRACTUAL OBLIGATIONS
The Government has entered into a number of multi-year contracts and agreements for the delivery of services and the acquisition or construction of assets. These contractual obligations will become liabilities in the future when the terms of the contracts are met. The following represents the amounts required to satisfy the contractual obligations, by the year that it is anticipated that the terms of the contract will be met, as at March 31: ($ millions) 2013 2014 2015 2016 2017 2018
and beyond
Total
Government departments, Crowns and Special Funds
503 142 98 78 65 204 1,090
Government Business Enterprises
812 7 6 6 5 36 872
Total 1,315 149 104 84 70 240 1,962
Manitoba Hydro Commitments
Manitoba Hydro-Electric Board (Hydro) purchased the net assets of Winnipeg Hydro from the City of Winnipeg in 2002. Winnipeg Hydro was an electric utility with 94,000 customers and annual revenues of $125 million. The purchase consideration principally consisted of annual payments by Hydro to the City of Winnipeg of $25 million in years 2002 to 2006, $20 million per annum in years 2007 to 2011, and $16 million per annum in year 2012 and each year thereafter. The net assets and related financing obligations are reflected in Hydro’s financial statements. Hydro has energy purchase commitments of $1,651 million (2011 - $1,562 million) that relate to future purchases of wind, natural gas (including transportation and storage contracts), coal and electricity. Commitments are primarily for wind, which expire in 2038, and natural gas purchases, which expire in 2013.
Stadium Loan BBB Stadium Inc. is a non-profit corporation established to develop, own and operate a stadium as a venue for professional and university football and community athletics. The sole members of BBB Stadium Inc. are the City of Winnipeg, the University of Manitoba and the Winnipeg Football Club. Activities of BBB Stadium Inc. are managed by the directors comprised of the University of Manitoba, the City of Winnipeg, the Province of Manitoba and the Winnipeg Football Club. The University of Manitoba has an economic interest in BBB Stadium Inc. related to the use of the stadium for university football games and events at no charge. The Government has committed up to $160 million as a loan to the University of Manitoba, and the University of Manitoba has committed to loan $160 million to BBB Stadium Inc. As at March 31, 2012, $128 million (2011 - $24 million) of the committed loan had been advanced to BBB Stadium Inc.
8. DEBT SERVICING Debt servicing costs of $815 million (2011 - $773 million) are net of interest recoveries from GBEs of $494 million
(2011 - $468 million) and include $42 million (2011 - $32 million) representing interest expense of Crown organizations. GBEs debt servicing costs of $430 million (2011 - $433 million) are reported in Schedule 3.

PROVINCE OF MANITOBA PUBLIC ACCOUNTS 2011/12
94
9. ADJUSTMENTS TO ACCUMULATED DEFICIT
In the March 31, 2012 fiscal year, restatements of the March 31, 2011 accumulated deficit and net income for the year were made in compliance with the Government’s accounting policies or for the correction of errors. A. First Time Adoption of IFRS
The CICA’s Accounting Standards Board has announced that effective January 1, 2011 Canadian publicly accountable enterprises will adopt International Financial Reporting Standards (IFRS), as issued by the International Accounting Standards Board. GBEs, with the exception of rate regulated entities, as noted in Note 1C, are required to adopt IFRS for their financial reporting. This has resulted in an increase in the opening accumulated deficit and net debt of $30 million (2011 - $18 million).
B. Inclusion of New Entities into the Government Reporting Entity
Adjustments were made to the opening accumulated deficit for the March 31, 2011 fiscal year to account for the addition of additional entities identified through a review of existing entities and the application of public sector accounting standards. The entities included the Deposit Guarantee Corporation of Manitoba which has been classified as a government business enterprise. This has resulted in a decrease in the opening accumulated deficit and net debt of $164 million (2011 - $147 million decrease).
C. Correction of Accrued Sick Pay Benefit liabilities
During the previous year, it was noted that a liability for accrued sick pay benefit obligations was not reported on the summary financial statements in accordance with public sector accounting standards. Under public sector accounting standards, liabilities are to be reported when there is an appropriate basis of measurement of the value of the liability. This was accomplished during the current fiscal year. The correction of this misstatement has resulted in an increase to the opening accumulated deficit and net debt of $62 million (2011 - $62 million increase).
D. Correction of Healthcare liabilities
During the year, it was noted that a liability for healthcare related expenses was overstated resulting in a duplication of certain expenditures. The correction of this misstatement has resulted in a decrease to the opening accumulated deficit and net debt of $133 million (2011 - $63 million).
E. Correction of Pension liability
When certain funded pensions are in a surplus position and the government does not have access to the use of the surpluses a surplus adjustment or allowance is required correctly reflect the government’s overall pension obligation. During the year it was noted that the surplus adjustments that were recorded in previous years were incorrectly calculated and had been overstated. The correction of this misstatement has resulted in a decrease to the opening accumulated deficit and net debt of $41 million (2011 - $32 million) and an increase in the 2011 income of $9 million.
F. Other
During the year, the Government identified and corrected errors related to the valuation of certain accounts payable and the duplication of expenditures recognized in previous years. This correction resulted in an increase in opening financial assets of $55 million, a decrease in opening tangible capital assets of $46 million, a decrease in opening accumulated deficit of $10 million (2011 - $2 million) and net debt of $56 million (2011 - $31 million) and an increase of 2011 income of $8 million. During the year a correction was made to reduce deferred revenue for income earned in a previous year. This correction resulted in a decrease in opening accounts payable of $10 million, a decrease in opening accumulated deficit and net debt of $10 million (2011 - $10 million) and no change to the 2011 income.
As a result of the above noted changes, the opening net debt has decreased by $312 million (2011 - $203 million) from the previously reported balances of $12,837 million (2011 - $11,810 million). In addition, the combined effect of the above changes has increased 2011 financial assets by $219 million, decreased 2011 non-

PROVINCE OF MANITOBA PUBLIC ACCOUNTS 2011/12
95
financial assets by $46 million and decreased 2011 financial liabilities by $93 million. 10. AMOUNTS DUE TO THE GOVERNMENT OF CANADA The March 31, 2003 financial statements disclosed that the net impact of the federal settlement related to the
Federal accounting error for the period of 1997 to 1999 was a $91 million loan payable owing to the Government over a ten-year period commencing in 2004/05. As at March 31, 2012, this loan payable has been reduced to $18 million (2011 - $27 million).
To offset negative adjustments to the 2004 Equalization payments, the Government of Canada provided a loan
payable to the Government of $38 million repayable over a ten-year period, commencing in April 2006. As at March 31, 2012, this loan payable had been reduced to $15 million (2011 - $19 million). Similarly, to offset negative adjustments to the 2004 Canada Health and Social Transfer (CHST) entitlements, the Government of Canada provided a loan payable to the Government of $9 million repayable over a ten-year period, commencing in April 2006. As at March 31, 2012 this loan payable had been reduced to $4 million (2011 - $4 million). These loans are non-interest bearing.
Through the Manitoba Opportunities Fund Ltd., the Government holds and invests deposits made through the
Federal Department of Citizenship and Immigration, Canada’s Immigrant Investor Program. As at March 31, 2012, the Government has loans payable of $299 million (2011 - $267 million) to be repaid to the Government of Canada five years after receipt. The Government is charged an administrative fee for each loan.
11. AMOUNTS HELD IN TRUST
Amounts held in trust are assets over which the Manitoba Legislature has no power of appropriation. The amounts are not included in the summary financial statements because the Government has no equity in the amounts and administers them according to trust or other agreed-upon arrangements. As at March 31, 2012 amounts held in trust were as follows:
($ millions)
2012 2011
Fiduciary Trusts 593 538 Custodial Trusts 111 114 704 652
Fiduciary Trusts The Government holds certain interest bearing deposits as fiduciary trusts. These deposits are pooled with the Government’s investments in order to earn a market rate of interest.
Custodial Trusts The Government holds custodial trust funds in the form of bonds and other securities.
12. RISK MANAGEMENT AND THE USE OF DERIVATIVE FINANCIAL INSTRUMENTS
Borrowings in both Canadian and foreign financial markets result in exposure to risks, which include foreign exchange risk, interest rate risk, credit risk and liquidity risk. The Government employs various risk management strategies and operates within fixed risk exposure limits to ensure exposure to risk is managed in a prudent and cost effective manner. A variety of strategies are used, including the use of derivative financial instruments (derivatives). Derivatives are financial contracts, the value of which is derived from underlying instruments. The Government uses derivatives to hedge and to mitigate foreign exchange risk and interest rate risk. The Government does not use derivatives for speculative purposes.

PROVINCE OF MANITOBA PUBLIC ACCOUNTS 2011/12
96
Foreign exchange risk Foreign exchange risk is the risk that the cash flows needed to repay the interest and principal on loans in foreign currencies will vary due to fluctuations in foreign exchange rates. To manage this risk, the Government uses derivative contracts, including foreign exchange forward contracts as well as swaps, to convert foreign currency principal and interest cash flows into Canadian dollar denominated cash flows. The current portfolio of foreign debt is fully hedged through the use of derivatives and U.S. dollar sinking funds, except for the impact of the unamortized foreign exchange fluctuation account of $44 million (2011 - $50 million). This account is fixed with no sensitivity to future foreign exchange rates. Derivative contracts hedge the underlying debt by matching the critical terms to achieve effectiveness. The current policy has hedged the foreign currency debt principal and interest payments through the use of derivatives in relation to general purpose debt.
Manitoba Hydro-Electric Board (Hydro) has exposure to U.S. dollar foreign exchange fluctuations primarily through the sale and purchase of electricity and fuel in the U.S. This exposure is managed through a long-term natural hedge between U.S. dollar cash inflows from export revenues and U.S. dollar cash outflows for long-term debt coupon and principal payments and thermal fuel purchases. For its U.S. debt retirement purposes, Hydro has a hedging relationship between U.S. dollar long-term debt balances and U.S. sinking funds. As a means to bridge temporary timing differences between inflows and outflows to future years’ U.S. dollar requirements, Hydro also utilizes derivative foreign exchange forward contracts as required.
Interest rate risk Interest rate risk is the risk that debt servicing costs will vary unfavourably according to interest rate fluctuations. To reduce its exposure to interest rate risk, the Government uses derivatives to manage the fixed and floating interest rate mix of its debt portfolio. After taking into account derivatives used to manage interest rate risk, investments held as sinking funds and eliminating debt incurred on behalf of Manitoba Hydro-Electric Board, the structure of the core debt as at March 31, 2012 was 90% at fixed rates and 10% at floating rates (2011 – 90% at fixed rates and 10% at floating rates). A one percent (100 basis points) movement in interest rates on the 10% floating rate core debt for an entire year would increase/decrease debt servicing costs, net of recoveries, by $18 million (2011 - $16 million). Credit risk Credit risk is the risk that a counterparty will default on its contractual obligations. The Government manages its credit risk exposure from derivatives by, among other activities, dealing only with high credit quality counterparties and regularly monitoring compliance to credit limits. In addition, the Government enters into contractual agreements (“master agreements”) with all of its counterparties. As at March 31, 2012 the Government has a gross credit risk exposure related to derivatives of $105 million (2011 - $138 million).
Liquidity risk Liquidity risk is the risk that the Government will not be able to meet its financial commitments over the short term. To reduce liquidity risk, the Government maintains liquid reserves (i.e. cash and cash equivalents) at levels that will meet future cash requirements and will give the Government flexibility in the timing of issuing debt. In addition, the Government has short-term note programs, bank lines and sinking funds as alternative sources of liquidity. This risk is also managed by distributing debt maturities over many years.

PROVINCE OF MANITOBA PUBLIC ACCOUNTS 2011/12
97
Derivative portfolio The following table presents the fair value of derivative financial instruments with contractual or notional principal amounts outstanding at March 31:
($ millions)
2012 2011 Notional
Value Fair
Value Notional
Value Fair
Value Interest rate and cross currency swaps………………………………
35,965
( 1,121)
32,157
( 593)
Notional amounts of derivatives contracts represent the contractual amounts to which a rate or price applied for computing the cash flows to be exchanged. The notional amounts are used to determine the gains/losses and fair value of the contracts and are generally a measure of the exposure to the asset class to which the contract relates. They are not recorded as assets or liabilities on the statement of financial position. Notional amounts do not represent the potential gain or loss associated with the market risk or credit risk associated with the derivative contract.
Fair values of the swap agreements are the estimated amount that the Government would receive or pay, based on market factors, if the agreements were terminated on March 31. They are established by discounting the expected cash flows of the swap agreements using year-end market interest and exchange rates. A positive (negative) fair value indicates that the government would receive (make) a payment if the agreements were terminated.
13. SIGNIFICANT TRANSACTIONS WITH GOVERNMENT BUSINESS ENTERPRISES
Transactions with GBEs are not eliminated for purposes of summary reporting because they are reported in these summary financial statements using the modified equity method of accounting. These financial statements include the following transactions between the Government and GBEs: A. Accounts Receivable
Amounts receivable includes receivables from GBEs as reported in Schedule 1 to the Summary financial statements. Loans and advances to GBEs are reflected in Schedule 2 to the Summary financial statements.
B. Borrowings
Borrowings include $508 million (2011 - $475 million) owed to Manitoba Public Insurance Corporation (MPIC) relating to the capital financing of school board and health care facilities. Borrowings also include debt in the amount of $233 million (2011 - $289 million) and $40 million (2011 - $40 million) owed to MPIC and Manitoba Hydro-Electric Board respectively, related to the financing of other Government programs. These borrowings are repayable over a term from 2012 to 2042 at varying interest rates ranging from 1.28% to 10.75%.
C. Water Power Rentals
Water power rental fees charged to the Manitoba Hydro-Electric Board (Hydro), in the amount of $111 million (2011 - $114 million), are included in the Consolidated Statement of Revenue and Expense under the fees and other revenue category. Water power rental rates are authorized by Regulation 25/88 and 197/2001 under The Water Power Act. Rentals are paid to the Government for the use of water resources in the operation of Hydro's hydroelectric generating stations.
D. Fees and Government Guarantees
The Manitoba Hydro-Electric Board (Hydro) remitted $85 million (2011 - $80 million) to the Government based on the Hydro debt that is guaranteed by the Government. The fees are included in the Consolidated Statement of Revenue and Expense under the sinking funds and other investment earnings category.

PROVINCE OF MANITOBA PUBLIC ACCOUNTS 2011/12
98
E. Driver Licensing Operations
The Government, by agreement, paid $28 million (2011 - $21 million) to Manitoba Public Insurance Corporation (MPIC) for the management and administration of driver licensing. MPIC, on behalf of the Government, collected driver licensing fees totalling $23 million (2011 - $21 million) and motor vehicle registration fees totalling $137 million (2011 - $131 million). The fees received by the Government are included in the Consolidated Statement of Revenue and Expense under the fees and other revenue category.
F. Other Revenue
Under The Workplace Safety and Health Act of Manitoba, the Workers Compensation Board supports the
administrative expenses incurred by the Government’s Department of Labour and Immigration for the Workplace Safety and Health program and the Worker Advisor Office. The amount for the year ended March 31, 2012 was $9 million (2011 - $9 million).
The Manitoba Lotteries Corporation provided $4 million in funding for the year ended March 31, 2012 (2011
- $4 million) to the Addictions Foundation of Manitoba for problem gambling services programs.
Manitoba Hydro-Electric Board paid Corporation Capital Tax of $51 million for the year ended March 31, 2012 (2011 - $51 million). These amounts received by the Government are included in the Statement of Revenue and Expense under the fees and other revenue and other taxes categories.
14. EXPENSES IN EXCESS OF LEGISLATIVE AUTHORITY
In addition to producing a summary budget as presented on the summary financial statements, Consolidated Statement of Revenue and Expense, the Government continues to provide budget estimates for the Core Government revenue and expenses. PSAB accounting standards recommend disclosure of information where a government has exceeded its revenue, borrowing, investing, expense or expenditure authority limits. The budget estimate presented on the Consolidated Statement of Revenue and Expense, exclude $929 million in supplemental estimates and special warrants related to the Core Government. The original budget estimate amounts plus the $929 million in supplemental estimates and special warrants becomes the revised estimates, against which expenses in excess of legislative authority are determined. Based upon the revised estimates, the following voted appropriations were over-expended as a result of adjustments made after March 31, 2012: ($ millions) Education Education and School Tax Credits
21
Finance Net Tax Credit Payments
5
Infrastructure and Transportation Water Stewardship Initiatives
1
Innovation, Energy and Mines Mineral Resources
22
Justice Corrections
1
Local Government Financial Assistance to Communities
1
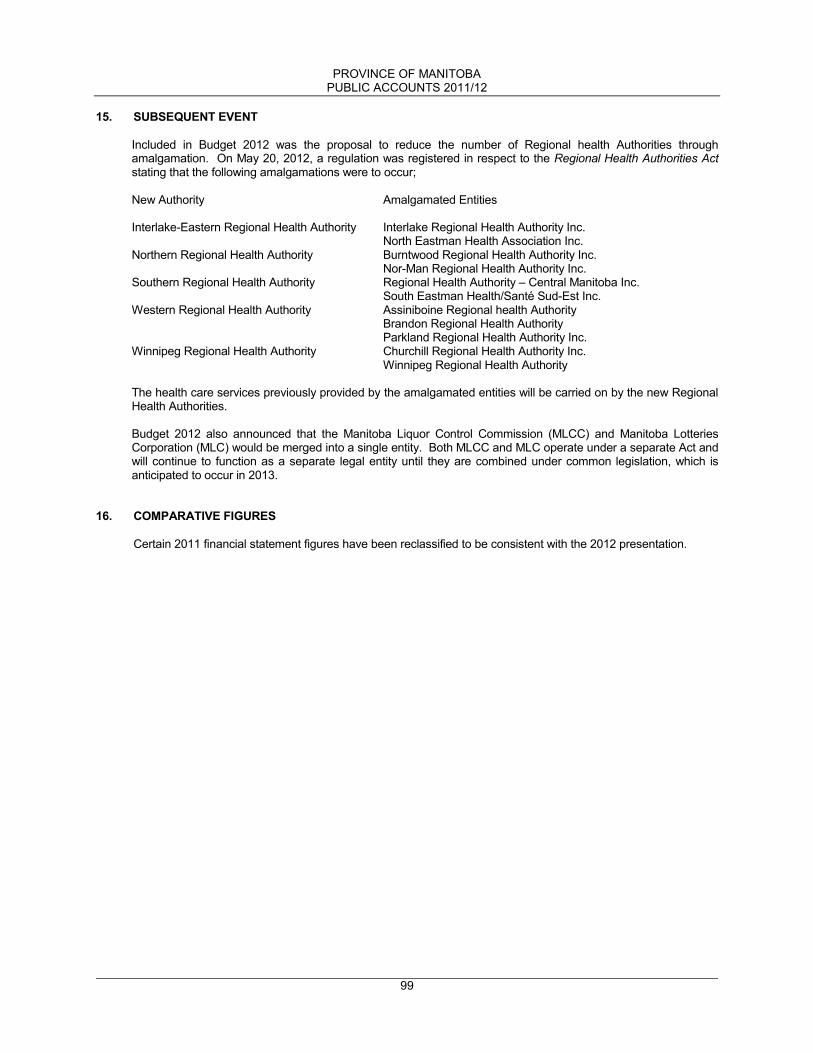
PROVINCE OF MANITOBA PUBLIC ACCOUNTS 2011/12
99
15. SUBSEQUENT EVENT
Included in Budget 2012 was the proposal to reduce the number of Regional health Authorities through amalgamation. On May 20, 2012, a regulation was registered in respect to the Regional Health Authorities Act stating that the following amalgamations were to occur; New Authority Amalgamated Entities Interlake-Eastern Regional Health Authority Interlake Regional Health Authority Inc. North Eastman Health Association Inc. Northern Regional Health Authority Burntwood Regional Health Authority Inc. Nor-Man Regional Health Authority Inc. Southern Regional Health Authority Regional Health Authority – Central Manitoba Inc. South Eastman Health/Santé Sud-Est Inc. Western Regional Health Authority Assiniboine Regional health Authority Brandon Regional Health Authority Parkland Regional Health Authority Inc. Winnipeg Regional Health Authority Churchill Regional Health Authority Inc. Winnipeg Regional Health Authority The health care services previously provided by the amalgamated entities will be carried on by the new Regional Health Authorities. Budget 2012 also announced that the Manitoba Liquor Control Commission (MLCC) and Manitoba Lotteries Corporation (MLC) would be merged into a single entity. Both MLCC and MLC operate under a separate Act and will continue to function as a separate legal entity until they are combined under common legislation, which is anticipated to occur in 2013.
16. COMPARATIVE FIGURES
Certain 2011 financial statement figures have been reclassified to be consistent with the 2012 presentation.

SCHEDULE 1
($ millions)
2012 2011
TAXATION REVENUE:
Corporation capital tax............................................................................................................................. 3 -
Gasoline tax............................................................................................................................................. - 13
Levy for health and education.................................................................................................................. 37 37
Individual income tax............................................................................................................................... 173 165
Insurance corporations tax...................................................................................................................... 20 16
Motive fuel tax.......................................................................................................................................... 23 10
Oil and natural gas tax............................................................................................................................. 1 4
Retail sales tax........................................................................................................................................ 167 163
Tobacco tax............................................................................................................................................. 30 25
454 433
GOVERNMENT OF CANADA AND OTHER GOVERNMENTS:
Municipal corporations............................................................................................................................. 214 209
Government of Canada shared cost programs/agreements.................................................................... 592 256
Other........................................................................................................................................................ 54 46
860 511
INTEREST:
Sinking fund............................................................................................................................................. 15 16
Other investments.................................................................................................................................... 3 5
18 21
OTHER:
Health and social services....................................................................................................................... 123 121
Manitoba Hydro-Electric Board................................................................................................................ 9 15
Manitoba Liquor Control Commission...................................................................................................... 39 39
Manitoba Lotteries Corporation............................................................................................................... 19 19
Sundry departmental revenue................................................................................................................. 177 111
Other........................................................................................................................................................ 184 185
551 490
1,883 1,455
Less: Allowances..................................................................................................................................... 206 114
Total Amounts Receivable 1,677 1,341
PROVINCE OF MANITOBAPUBLIC ACCOUNTS 2011/12
100
SUMMARY FINANCIAL STATEMENTSCONSOLIDATED STATEMENT OF AMOUNTS RECEIVABLE
As at March 31, 2012
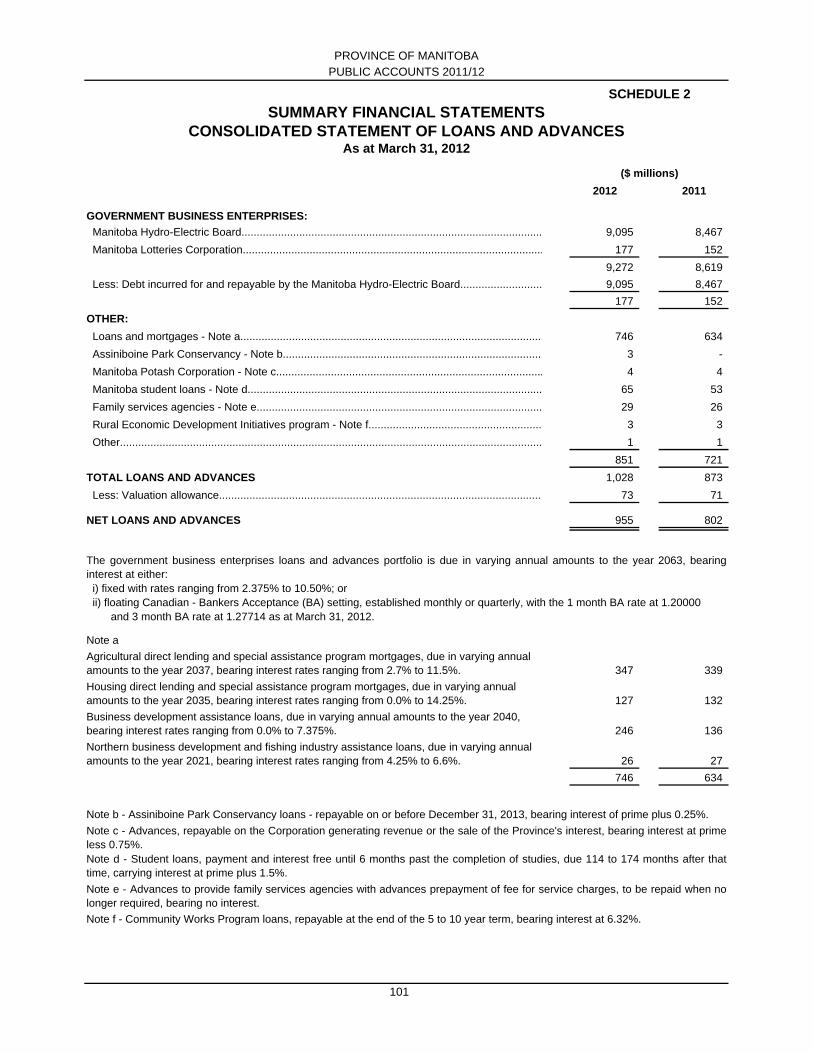
SCHEDULE 2
($ millions)
2012 2011
GOVERNMENT BUSINESS ENTERPRISES:
Manitoba Hydro-Electric Board................................................................................................... 9,095 8,467
Manitoba Lotteries Corporation................................................................................................... 177 152
9,272 8,619
Less: Debt incurred for and repayable by the Manitoba Hydro-Electric Board........................... 9,095 8,467
177 152
OTHER:
Loans and mortgages - Note a.................................................................................................... 746 634
Assiniboine Park Conservancy - Note b...................................................................................... 3 -
Manitoba Potash Corporation - Note c........................................................................................ 4 4
Manitoba student loans - Note d................................................................................................. 65 53
Family services agencies - Note e.............................................................................................. 29 26
Rural Economic Development Initiatives program - Note f......................................................... 3 3
Other........................................................................................................................................... 1 1
851 721
TOTAL LOANS AND ADVANCES 1,028 873
Less: Valuation allowance........................................................................................................... 73 71
NET LOANS AND ADVANCES 955 802
i) fixed with rates ranging from 2.375% to 10.50%; or
Note a
347 339
127 132
246 136
26 27
746 634
101
PROVINCE OF MANITOBAPUBLIC ACCOUNTS 2011/12
The government business enterprises loans and advances portfolio is due in varying annual amounts to the year 2063, bearinginterest at either:
Agricultural direct lending and special assistance program mortgages, due in varying annual amounts to the year 2037, bearing interest rates ranging from 2.7% to 11.5%.
Housing direct lending and special assistance program mortgages, due in varying annual amounts to the year 2035, bearing interest rates ranging from 0.0% to 14.25%.
SUMMARY FINANCIAL STATEMENTSCONSOLIDATED STATEMENT OF LOANS AND ADVANCES
As at March 31, 2012
ii) floating Canadian - Bankers Acceptance (BA) setting, established monthly or quarterly, with the 1 month BA rate at 1.20000 and 3 month BA rate at 1.27714 as at March 31, 2012.
Business development assistance loans, due in varying annual amounts to the year 2040, bearing interest rates ranging from 0.0% to 7.375%.
Northern business development and fishing industry assistance loans, due in varying annual amounts to the year 2021, bearing interest rates ranging from 4.25% to 6.6%.
Note f - Community Works Program loans, repayable at the end of the 5 to 10 year term, bearing interest at 6.32%.
Note b - Assiniboine Park Conservancy loans - repayable on or before December 31, 2013, bearing interest of prime plus 0.25%.
Note c - Advances, repayable on the Corporation generating revenue or the sale of the Province's interest, bearing interest at primeless 0.75%.Note d - Student loans, payment and interest free until 6 months past the completion of studies, due 114 to 174 months after thattime, carrying interest at prime plus 1.5%.
Note e - Advances to provide family services agencies with advances prepayment of fee for service charges, to be repaid when nolonger required, bearing no interest.

SUMMARY FINANCIAL STATEMENTS SCHEDULE 3
GOVERNMENT BUSINESS ENTERPRISES
SCHEDULE OF CONSOLIDATED OPERATING RESULTS AND FINANCIAL POSITION
For the Year Ended March 31, 2012
($ millions)
TOTAL TOTALCHANGES IN EQUITY UTILITY INSURANCE FINANCE 2012 2011
Results from Operations Revenues from operations 1,902 1,412 1,449 4,763 4,867
Expenses: From operations 1,418 1,352 850 3,620 3,627 Debt servicing 423 - 7 430 433 Total expenses 1,841 1,352 857 4,050 4,060 Net income 61 60 592 713 807 Transfers to the Government - - (592) (592) (582)
61 60 - 121 225 Other Comprehensive Income (Loss) (40) (37) - (77) 142 Net assets acquired on amalgamation - 8 - 8 - Equity restatement on contributed surplus - - (5) (5) - Net increase in equity in government business enterprises 21 31 (5) 47 367
FINANCIAL POSITION Assets: Cash and temporary investments 50 148 41 239 185 Amounts receivable 332 341 38 711 769 Portfolio investments - Due from Government organizations 372 - - 372 290 Due from others - 3,370 - 3,370 3,567 Capital assets 11,479 144 222 11,845 11,010 Other assets 1,240 189 51 1,480 1,429 Total assets 13,473 4,192 352 18,017 17,250 Liabilities: Accounts payable, accrued liabilities and deferred revenue 1,187 676 144 2,007 2,155 Long-term debt: Owing to Government organizations 9,095 - 177 9,272 8,620 Other borrowings, discounts and deferred transaction costs 287 5 - 292 185 Provision for future benefits: Pension obligations 127 260 22 409 366 Future cost of existing claims - 2,416 4 2,420 2,354 Total liabilities 10,696 3,357 347 14,400 13,680
Equity in government business enterprises 2,777 835 5 3,617 3,570
For government business enterprises whose fiscal year end is prior to March 31, the amounts reflected are as at their fiscal year end.
10
2
PR
OV
INC
E O
F M
AN
ITO
BA
PU
BLIC
AC
CO
UN
TS
2011/12

SUMMARY FINANCIAL STATEMENTS SCHEDULE 4
CONSOLIDATED STATEMENT OF BORROWINGSAs at March 31, 2012
($ millions)
Canada Promissory NotesPension Loans and and
Fiscal Year of Maturity Bonds and Debentures Plan Mortgages Treasury Bills TotalsCdn US Cdn Cdn Cdn 2012 2011
2012......................................................................................................... - - - - - - 3,349 2013......................................................................................................... 2,101 - 73 72 1,435 3,681 2,104 2014......................................................................................................... 1,650 738 - 72 - 2,460 2,438 2015......................................................................................................... 2,345 100 - 66 - 2,511 1,792 2016......................................................................................................... 1,982 - - 71 - 2,053 2,155 2017......................................................................................................... 2,028 500 - 55 - 2,583 1,278
2012-2017................................................................................................ 10,106 1,338 73 336 1,435 13,288 13,116
2018-2022................................................................................................ 5,537 699 15 - - 6,251 4,794 2023-2032................................................................................................ 2,289 - - 210 - 2,499 2,510 2033-2064................................................................................................ 6,084 - 404 - - 6,488 5,096 2012-2043 Crown Organizations.............................................................. 505 - - 266 - 771 757
2018-2064................................................................................................ 14,415 699 419 476 - 16,009 13,157 Total borrowings....................................................................................... 24,521 2,037 492 812 1,435 29,297 26,273
Reduced by: Debt incurred for and repayable by The Manitoba Hydro-Electric Board...................................................................................................... (9,095) (8,467) Unamortized debt issue costs.................................................................. (54) (38) Unamortized foreign currency fluctuation................................................. (44) (50) Unamortized gains and losses on derivative contracts............................ 98 46 Province of Manitoba debt issues held as investments in sinking funds and cash and cash equivalents.................................... (599) (614)
19,603 17,150
March 31/12 March 31/11Cdn $ Valuation Cdn $ Valuation
(See Notes) (See Notes)Borrowings payable in:
Canadian dollars 22,410 20,101 Foreign issues hedged to Canadian dollars 4,850 4,288 U.S. dollars 1,699 1,555 Foreign issues hedged to U.S. dollars 338 329 Total borrowings 29,297 26,273 -
Note a: The hedges are derivative contracts which include swaps and forward foreign exchange contracts.
Note b: The Canadian dollar valuation is calculated using the foreign currency exchange rates in effect at each March 31 adjusted for any forward foreign exchange contracts entered into for
settlement after year-end.
Note c: Interest rates on these borrowings fall into one of three categories: i) Fixed with rates ranging from 1.54% to 10.68%. ii) Floating Canadian - Bankers Acceptance (BA) setting, established quarterly or monthly, with the lowest rate currently set at 1.027% and the highest set at 4.56% as at March 31, 2012. iii) Floating U.S. - U.S. Dollar London Interbank Offering Rate (LIBOR) setting, established quarterly, with the lowest rate currently set at 0.57% and the highest set at 0.87% as at March 31,2012.
103
PR
OV
INC
EO
FM
AN
ITO
BA
PU
BLIC
AC
CO
UN
TS
2011/12

SCHEDULE 5
($ millions)2012 2011
Accounts payable.............................................................................................................................................................................................................................. 1,300 1,224
Accrued charges: Interest accrued on borrowings.................................................................................................................................................................................... 198 213 Canadian Agricultural Income Stabilization / AgriInvest........................................................................................................................................................................................................ 87 73 Compensation for Victims of Crime......................................................................................................................................................................................................... 22 23 Disaster assistance............................................................................................................................................................................................................................. 211 28 Flood claims................................................................................................................................................................................................................................. 16 17 Infrastructure works program....................................................................................................................................................................................................................... 8 20 Long term disability income plan............................................................................................................................................................... 21 20 Environmental liabilities......................................................................................................................................................................................................................... 467 487 Salaries and benefits........................................................................................................................................................................................................................ 691 667 Severance pay..................................................................................................................................................................................................... 367 342 Workers Compensation Board claims........................................................................................................................................................................................................................ 25 25 Other.................................................................................................................................................................................................................. 105 55
2,218 1,970
Provision for future losses on guarantees (Note 6)................................................................................................................................................ 19 21
Unearned Revenue: Deferred contributions related to future expense................................................................................................................................................. 42 32 Government of Canada - Advances re: shared-cost programs not yet claimed.............................................................................................. 100 100 Research and Special Funds........................................................................................................................................................................................................................................ 88 104 Tuition and education fees...................................................................................................................................................................................... 32 28 Vehicle registration............................................................................................................................................................................................ 62 59 Other......................................................................................................................................................................................................................................................................... 41 37
365 360
Total Accounts Payable, Accrued Charges, Provisions and Unearned Revenue 3,902 3,575
104
As at March 31, 2012
PROVINCE OF MANITOBAPUBLIC ACCOUNTS 2011/12
SUMMARY FINANCIAL STATEMENTSCONSOLIDATED STATEMENT OF ACCOUNTS PAYABLE,
ACCRUED CHARGES, PROVISIONS AND UNEARNED REVENUE

SUMMARY FINANCIAL STATEMENTS SCHEDULE 6
CONSOLIDATED STATEMENT OF PENSION LIABILITYAs at March 31, 2012
Civil Post- PublicService Teachers' Secondary School
Superannuation Pension Education Division Other Total TotalPlan Plan Plans Plans Plans 2012 2011
(Note A) (Note A) (Note A)
ACCRUED BENEFIT OBLIGATIONObligation at beginning of year........................................ 2,372 2,982 1,293 374 97 7,118 6,625 Current service costs....................................................... 63 74 48 16 2 203 197 Interest cost on benefit obligation.................................... 142 191 57 23 5 418 404 Change in actuarial (gains) losses and reserves............. (47) - 44 (2) - (5) 254 Plan amendment.............................................................. - - (12) - - (12) - Benefits paid.................................................................... (112) (158) (90) (19) (5) (384) (362) Obligation at end of year.................................................. 2,418 3,089 1,340 392 99 7,338 7,118
PLAN ASSETSPlan assets at beginning of year...................................... 1,458 1,773 1,162 388 37 4,818 4,351 Employer contributions.................................................... 63 74 36 8 4 185 178 Employee contributions................................................... - - 21 8 - 29 27 Transfer of plan assets ................................................... 3 - - - - 3 1 Plan asset contributions................................................... 240 - - - - 240 180 Benefits paid.................................................................... (112) (158) (90) (19) (5) (384) (362) Expected return on plan assets....................................... 84 115 69 22 2 292 278 Experience gains (losses)................................................ (122) (36) (97) (13) (3) (271) 165 Market value of plan assets............................................. 1,614 1,768 1,101 394 35 4,912 4,818 Deferred investment losses (gains)................................. 60 22 62 12 2 158 10 Market related value of plan assets................................. 1,674 1,790 1,163 406 37 5,070 4,828
PENSION LIABILITYPlan deficit (surplus)........................................................ 744 1,299 177 (14) 62 2,268 2,290 Unamortized actuarial gains (losses)............................... (131) (290) (205) (19) 4 (641) (573) Surplus adjustments (Note B).......................................... - - - 7 - 7 14 Pension liability................................................................ 613 1,009 (28) (26) 66 1,634 1,731
PENSION EXPENSEDefined benefit pension plan expense:
Current service cost......................................................... 63 74 48 16 2 203 197 Interest cost on benefit obligation.................................... 142 191 57 23 5 418 405 Return on plan assets...................................................... (84) (115) (69) (22) (2) (292) (278) Employee contributions................................................... - - (21) (8) - (29) (27) Amortization of actuarial (gains) losses........................... 4 30 15 2 (1) 50 24 Plan amendment.............................................................. - - (12) - - (12) - Change in surplus adjustments....................................... - - - (6) (1) (7) 2 Defined benefit pension plan expense............................. 125 180 18 5 3 331 323
Defined contribution pension plan expense..................... - - 4 15 129 148 132
10
5
PU
BL
IC A
CC
OU
NT
S 2
01
1/1
2P
RO
VIN
CE
OF
MA
NIT
OB
A
($ millions)

SUMMARY FINANCIAL STATEMENTS SCHEDULE 6
CONSOLIDATED STATEMENT OF PENSION LIABILITY (cont'd)
As at March 31, 2012
Civil Post- PublicService Teachers' Secondary School
Superannuation Pension Education Division Other Total TotalPlan Plan Plans Plans Plans 2012 2011
MEMBER DATADefined benefit pension plan
Number of active and deferred members........................ 33,100 22,100 5,600 4,300 300 65,400 64,100 Number of pensioners..................................................... 17,100 12,400 1,700 1,500 300 33,000 32,000 Total number of plan members........................................ 50,200 34,500 7,300 5,800 600 98,400 96,100
ACTUARIAL ASSUMPTIONSDiscount rate on accrued benefits................................... 6.00% 6.50% 5.00 - 5.75% 6.00% 5.00 - 5.50%Expected long-term rate of return.................................... 6.00% 6.50% 5.30 - 6.00% 6.00% 5.00 - 5.50%Inflation............................................................................ 2.00% 2.25% 2.00 - 2.75% 2.00 - 2.50% 2.00 - 2.50%Real rate of return............................................................ 4.00% 4.25% 2.50 - 3.00% 3.50 - 4.00% 3.00 - 3.50%Rate of salary increase.................................................... 3.75% 3.00% 3.40 - 4.00% 4.00 - 4.25% 3.00 - 3.50%Latest valuation................................................................ Dec 2010 Jan 2009 (Note C) (Note C) (Note C)
Note A:
Note B:
Note C: Latest actuarial valuation report dates are as follows: - University of Manitoba Pension Plans......................................................................... Dec 2009 - University of Winnipeg Pension Plan........................................................................... Dec 2010 - Brandon University Retirement Plan............................................................................ Dec 2011 - Winnipeg School Division Pension Fund for Employees
Other than Teachers................................................................................................ Dec 2010- Retirement Plan for Non-Teaching Employees of the
St. James-Assiniboia School Division...................................................................... Dec 2009 - Retirement Plan for Employees of Frontier School Division........................................ Dec 2009 - Members of Legislative Assembly Pension Plan......................................................... Mar 2011 - Legislative Assembly Pension Plan............................................................................. Dec 2010 - Judges' Supplemental Pension Plan........................................................................... Mar 2010 - Winnipeg Child and Family Services
Employee Benefits Retirement Plan........................................................................ Dec 2010
PR
OV
INC
E O
F M
AN
ITO
BA
10
6
PU
BL
IC A
CC
OU
NT
S 2
01
1/1
2
For those plans that the Government is unable to access surplus funds within the plan, adjustments are made to record an allowance against these surplus amounts. Thesepension surplus allowances represent the excess of the adjusted benefit asset over the employers' share of the expected future benefit
Post-Secondary Education plans include the University of Manitoba Pension Plans, the University of Winnipeg Pension Plan and the Brandon University Retirement Plan.
Public School Division plans include the Winnipeg School Division Pension Fund for Employees Other Than Teachers, Retirement Plan for Non-Teaching Employees of theSt. James-Assiniboia School Division and Retirement Plan for Employees of Frontier School Division.
Other plans include the Members of Legislative Assembly Pension Plan, the Legislative Assembly Pension Plan, the Judges' Supplemental Pension Plan, and the WinnipegChild and Family Services Employee Benefits Retirement Plan.

SCHEDULE 7
CONSOLIDATED STATEMENT OF TANGIBLE CAPITAL ASSETS
For the Year Ended March 31, 2012($ millions)
Buildings Computer Dams and
and Vehicles Hardware Assets Land and Water Assets
Leasehold and and Under Land Management Under
Land Improvements Equipment Software Construction Improvements Transportation Structures Construction 2012 2011
Cost232 6,026 2,133 663 849 300 3,227 133 669 14,232 12,925 (51) 3 4 - (1) - - - - (45) (45)
Reclassifications 24 (121) - - 97 - - - - - - Opening cost restated 205 5,908 2,137 663 945 300 3,227 133 669 14,187 12,880 Add:
9 596 203 78 80 18 228 51 178 1,441 1,361 Less:
- (25) (32) (10) (42) - - - (1) (110) (54) Settlements and reclassifications - 100 17 21 (140) 8 163 336 (505) - -
Closing cost 214 6,579 2,325 752 843 326 3,618 520 341 15,518 14,187
Accumulated amortization- 2,638 1,461 419 - 53 1,365 63 - 5,999 5,600
- (3) 4 - - - - - - 1 1 Reclassifications - - (1) 1 - - - - - - -
- 2,635 1,464 420 - 53 1,365 63 - 6,000 5,601 Add:
- 158 137 56 - 4 116 5 - 476 438 Less:
- (16) (29) (10) - - - - - (55) (39)
- 2,777 1,572 466 - 57 1,481 68 - 6,421 6,000
214 3,802 753 286 843 269 2,137 452 341 9,097 8,187
During the year, the Province capitalized $16 million of interest relating to assets under construction (2011 - $18 million).
PU
BL
IC A
CC
OU
NT
S 2
01
1/1
2P
RO
VIN
CE
OF
MA
NIT
OB
A
Restatements, (Note 9)
Restatements, (Note 9)
Disposals and write downs
Opening, as previously reported
Opening cost, as previously reported
Additions during the year
SUMMARY FINANCIAL STATEMENTS
General Capital Assets Infrastructure Totals
10
7
Opening accumulated amortization restated
Net Book Value of Tangible Capital Assets
Amortization
Accumulated amortization on disposals, write downs
Closing accumulated amortization

SCHEDULE 8
FUNDS, ORGANIZATIONS AND BUSINESS ENTERPRISESCOMPRISING THE GOVERNMENT REPORTING ENTITY
HEALTH AND HEALTHY LIVING
Manitoba Health
Manitoba Healthy Living, Seniors and Consumer Affairs
Addictions Foundation of Manitoba
Funeral Board of Manitoba
CancerCare Manitoba
Companies Office
Diagnostic Services of Manitoba Inc.
Financial Literacy Fund
Insurance Council of Manitoba
Land Titles Assurance Fund
Manitoba Health Services Insurance Plan
Manitoba Hospital Capital Financing Authority
Not-for-Profit Personal Care Homes
Regional Health Authorities (including controlled organizations)
Assiniboine Regional Health Authority
Brandon Regional Health Authority
Burntwood Regional Health Authority Inc.
Churchill Regional Health Authority Inc.
Interlake Regional Health Authority Inc.
Nor-Man Regional Health Authority Inc.
North Eastman Health Association Inc.
Parkland Regional Health Authority Inc.
Regional Health Authority - Central Manitoba Inc.
South Eastman Health/Santé Sud-Est Inc.
Winnipeg Regional Health Authority
Rehabilitation Centre for Children Inc.
St. Amant Centre
The Property Registry
Vital Statistics Agency
EDUCATION
Manitoba Advanced Education and Literacy
Manitoba Education
Assiniboine Community College
Brandon University
Université de Saint-Boniface
Council on Post-Secondary Education
Manitoba Text Book Bureau
Public School Divisions
Public Schools Finance Board
Red River College
PROVINCE OF MANITOBA
108
PUBLIC ACCOUNTS 2011/12

SCHEDULE 8
(cont'd)
EDUCATION, cont'd
University College of The North
University of Manitoba
University of Winnipeg
FAMILY SERVICES
Manitoba Children and Youth Opportunities
Manitoba Family Services and Labour
First Nations of Northern Manitoba Child & Family Services Authority
First Nations of Southern Manitoba Child & Family Services Authority
General Child and Family Services Authority
Métis Child and Family Services Authority Inc.
Office of the Fire Commissioner
Workplace Safety and Health Public Education Fund
COMMUNITY, ECONOMIC AND RESOURCE DEVELOPMENT
Manitoba Aboriginal and Northern Affairs
Manitoba Agriculture, Food and Rural Initiatives
Manitoba Conservation and Water Stewardship
Manitoba Entrepreneurship, Training and Trade
Manitoba Housing and Community Development
Manitoba Infrastructure and Transportation
Manitoba Innovation, Energy and Mines
Manitoba Local Government
Abandonment Reserve Fund
Communities Economic Development Fund
Community Revitalization Fund
Co-operative Loans and Loans Guarantee Board
Cooperative Promotion Board
Crown Lands and Property Agency
Economic Innovation and Technology Council
Ethanol Fund
Farm Machinery and Equipment Act Fund
Food Development Centre
Green Manitoba Eco Solutions
Manitoba Horse Racing Commission
Industrial Technology Centre
Leaf Rapids Town Properties Ltd.
Manitoba Agricultural Services Corporation
Manitoba Cattle Enhancement Council
Manitoba Community Services Council Inc.
Manitoba Development Corporation
Manitoba Education, Research and Learning
Information Networks (MERLIN)
PROVINCE OF MANITOBAPUBLIC ACCOUNTS 2011/12
109

SCHEDULE 8
(cont'd)
COMMUNITY, ECONOMIC AND RESOURCE DEVELOPMENT, cont'd
Manitoba Floodway and East Side Road Authority
Manitoba Gaming Control Commission
Manitoba Habitat Heritage Corporation
Manitoba Health Research Council
Manitoba Housing and Renewal Corporation
Manitoba Opportunities Fund Ltd.
Manitoba Trade and Investment Corporation
Manitoba Trucking Productivity Improvement Fund
Manitoba Water Services Board
Materials Distribution Agency
Mining Community Reserve
Mining Rehabilitation Reserve Fund
Pineland Forest Nursery
Quarry Rehabilitation Reserve Fund
Taking Charge! Inc. / Se Prendre En Main! Inc
Vehicle and Equipment Management Agency
Veterinary Science Scholarship Fund
Waste Reduction and Recycling Support Fund
JUSTICE AND OTHER EXPENDITURES
Legislative Assembly
Executive Council
Civil Service Commission
Manitoba Culture, Heritage and Tourism
Manitoba Finance
Manitoba Immigration and Multiculturalism
Manitoba Justice
Manitoba Sport
Civil Legal Services
Crown Corporations Council
Helen Betty Osborne Memorial Foundation
Le Centre culturel franco-manitobain
Legal Aid Manitoba
Manitoba Arts Council
Manitoba Boxing Commission
Manitoba Centennial Centre Corporation
Manitoba Film & Sound Recording Development Corporation
Manitoba Law Reform Commission
Manitoba Securities Commission
PROVINCE OF MANITOBAPUBLIC ACCOUNTS 2011/12
110

SCHEDULE 8
(cont'd)
JUSTICE AND OTHER EXPENDITURES, cont'd
Organization and Staff Development
Pension Assets Fund
Public Trustee of Manitoba
Special Operating Agencies Financing Authority
Sport Manitoba Inc.
Travel Manitoba
Venture Manitoba Tours Ltd.
Victims Assistance Fund
GOVERNMENT BUSINESS ENTERPRISES: (Schedule 3) (Note 4)
Utility:
Manitoba Hydro-Electric Board
Insurance:
Deposit Guarantee Corporation of Manitoba
Manitoba Public Insurance Corporation
Workers Compensation Board
Finance:
Manitoba Liquor Control Commission
Manitoba Lotteries Corporation
SPECIAL ACCOUNTS, not attached to a Sector or Department
Debt Retirement Account
Fiscal Stabilization Account
111
PROVINCE OF MANITOBAPUBLIC ACCOUNTS 2011/12

SUMMARY FINANCIAL STATEMENTS SCHEDULE 9
CONSOLIDATED STATEMENT OF OPERATIONS BY SECTORFor the Year Ended March 31, 2012
($ millions)
2012 2011 2012 2011 2012 2011 2012 2011$ $ $ $ $ $ $ $
REVENUEIncome taxes.......................................................... - - - - - - - - Other taxes............................................................ - - 691 690 - - 29 14 Fees and other revenue......................................... 585 487 571 544 46 59 643 630 Federal transfers.................................................... 1,018 970 122 128 3 5 438 450 Contributions from entities within the Government Reporting Entity............................ 7 32 70 155 - - 41 2 Sinking funds and other investment earnings........ 4 2 7 (3) - - 41 45
TOTAL REVENUE 1,614 1,491 1,461 1,514 49 64 1,192 1,141
EXPENSEPersonnel services................................................ 3,046 2,905 2,406 2,365 190 187 418 390 Grants/Transfer payments..................................... 1,061 891 191 215 264 215 708 575 Transportation........................................................ 62 43 31 30 6 4 34 71 Communication...................................................... 15 11 24 25 5 4 18 15 Supplies and services............................................ 637 745 365 363 38 34 372 300 Social assistance related....................................... - 4 4 3 531 901 842 100 Other operating...................................................... 407 381 330 291 19 27 188 347 Debt servicing........................................................ 51 44 128 122 1 1 208 190 Minor capital........................................................... 19 11 52 46 1 1 15 14 Amortization........................................................... 148 142 122 115 5 4 187 165
TOTAL EXPENSE 5,446 5,177 3,653 3,575 1,060 1,378 2,990 2,167
NET INCOME (LOSS) FOR THE YEAR (3,832) (3,686) (2,192) (2,061) (1,011) (1,314) (1,798) (1,026)
Health andHealthy Living Education
112
PR
OV
INC
E O
F M
AN
ITO
BA
PU
BLIC
AC
CO
UN
TS
2011/12
Family Servicesand Labour
and ResourceDevelopment
Community, Economic

SUMMARY FINANCIAL STATEMENTS SCHEDULE 9
CONSOLIDATED STATEMENT OF OPERATIONS BY SECTOR (cont'd)
For the Year Ended March 31, 2012
($ millions)
2012 2011 2012 2011 2012 2011 2012 2011$ $ $ $ $ $ $ $
REVENUEIncome taxes.......................................................... - - 3,124 2,922 - - 3,124 2,922 Other taxes............................................................ - - 2,811 2,702 - - 3,531 3,406 Fees and other revenue......................................... 101 132 - 2 (40) (26) 1,906 1,828 Federal transfers.................................................... 51 50 2,699 2,444 1 - 4,332 4,047 Contributions from entities within the Government Reporting Entity............................ 6 - 740 832 (151) (214) 713 807 Sinking funds and other investment earnings........ 197 189 - - - (3) 249 230
TOTAL REVENUE 355 371 9,374 8,902 (190) (243) 13,855 13,240
EXPENSEPersonnel services................................................ 467 469 38 12 6 4 6,571 6,332 Grants/Transfer payments..................................... 67 68 157 25 (251) (436) 2,197 1,553 Transportation........................................................ 10 10 17 24 1 1 161 183 Communication...................................................... 14 14 1 1 - - 77 70 Supplies and services............................................ 202 175 203 34 53 185 1,870 1,836 Social assistance related....................................... 32 30 - - - - 1,409 1,038 Other operating...................................................... 39 44 199 24 6 7 1,188 1,121 Debt servicing........................................................ 436 424 - - (9) (8) 815 773 Minor capital........................................................... 3 2 - - - 1 90 75 Amortization........................................................... 7 7 3 2 4 3 476 438
TOTAL EXPENSE 1,277 1,243 618 122 (190) (243) 14,854 13,419
NET INCOME (LOSS) FOR THE YEAR (922) (872) 8,756 8,780 - - (999) (179)
Note a: The general government category includes revenue from sources that cannot be attributed to a particular sector. Note b: Consolidation adjustments are necessary to conform sectors to Government accounting policies and to eliminate transactions between sectors.
(Note b)Justice and General Government
113
Note c: 2010/11 expenses have not been restated to reflect the impact of the 2011/12 reorganization. Had the 2010/11 expenses been restated then overall Health and Healthy Living expenses would have decreased by $5 million, Education would have decreased by $2 million, Family Services and Labour would have decreased $385 million, Community economic and Resource Development would have increased by $433 million and Justice and Other would have decreased by $41 million.
PR
OV
INC
E O
F M
AN
ITO
BA
Adjustments
PU
BLIC
AC
CO
UN
TS
2011/12
TotalOther Expenditures (Note a)


OTHER FINANCIAL REPORTS
FOR THE YEAR ENDED
March 31, 2012
115


SECTION 2 OTHER FINANCIAL REPORTS
TABLE OF CONTENTS PAGE
Fiscal Stabilization Account (Audited). . . . . . . . . . . . . . . . . . . . . . . . . . . . . . . . . . . . . . . . . . . . . . . . . . . . . . . . . . . . . . . . . . . . . . . . . . . . . . . . . . . . . . . . . . . 119
Debt Retirement Account (Audited). . . . . . . . . . . . . . . . . . . . . . . . . . . . . . . . . . . . . . . . . . . . . . . . . . . . . . . . . . . . . . . . . . . . . . . . . . . . . . . . . . . . . . . . . . . 125
Consolidated Details and Reconciliation to Core Government Results (Unaudited). . . . . . . . . . . . . . . . . . . . . . . . . . . . . . . . . . . . . . . . . . . . . . . . . . . . . . . . . . . . . . . . . 129
117

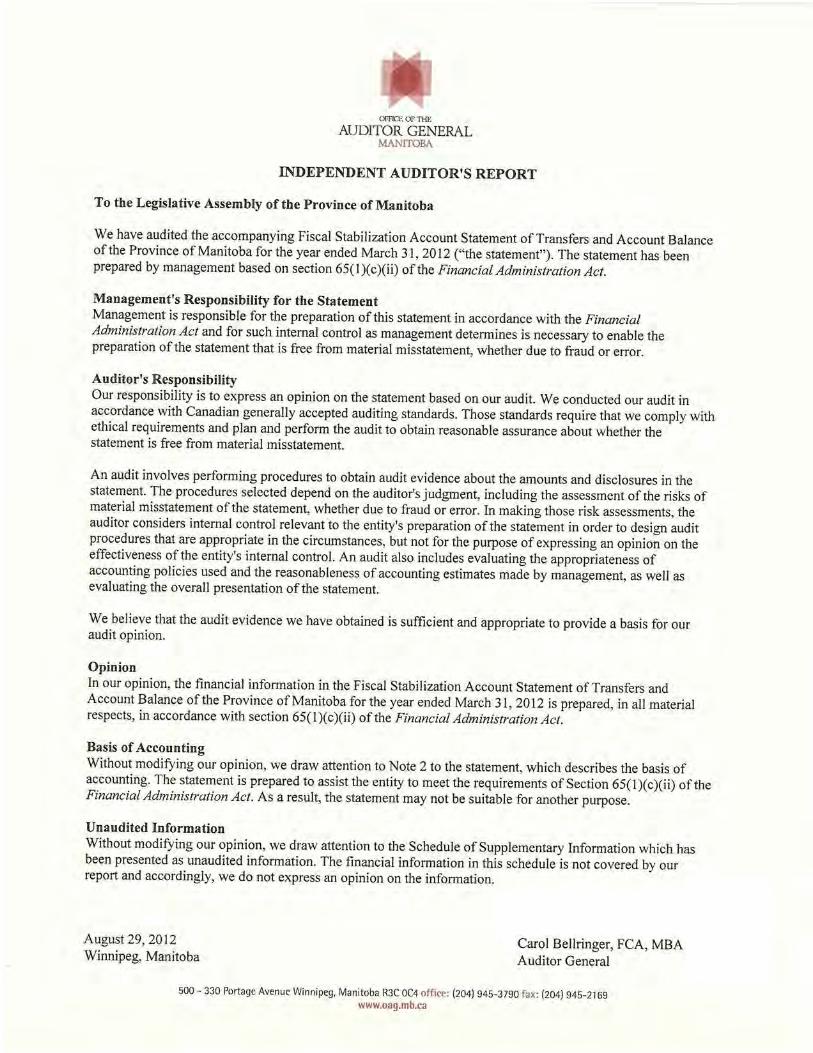


PROVINCE OF MANITOBA
OTHER FINANCIAL REPORTS 2011/12
FISCAL STABILIZATION ACCOUNT STATEMENT OF TRANSFERS
AND ACCOUNT BALANCE For the Year Ended March 31, 2012
($ thousands)
2012 2011
Transfer to Core Government operations (155,401) (125,315)
Account Balance, beginning of year 681,939 807,254
Account Balance, end of year 526,538 681,939
121

PROVINCE OF MANITOBA OTHER FINANCIAL REPORTS 2011/12
FISCAL STABILIZATION ACCOUNT NOTES TO STATEMENT OF TRANSFERS
AND ACCOUNT BALANCE For the Year Ended March 31, 2012
1.
2
3
4
122
The Fiscal Stabilization Account was established under the authority of subsection 26.1(1) of The FinancialAdministration Act. The Fiscal Stabilization Fund established under The Fiscal Stabilization Fund Act is continued asthe Fiscal Stabilization Account. The legislated purpose of the Account is to assist in stabilizing the fiscal position bysupporting core government operations in a fiscal year or to repay debt. Under subsection 26.1(3) the Minister ofFinance, with the approval of the Lieutenant Governor in Council, may deposit in the Account any part of the revenueor other financial assets received in the core government in any fiscal year. Under subsection 26.1(4), the Minister ofFinance may, with the approval of the Lieutenant Governor in Council, transfer all or part of the Account balance to thecore government.
Transactions in the Fiscal Stabilization Account are accounted for on an accrual basis and reflect the transfers made under Section 26.1(3) and 26.1(4) of The Financial Administration Act. Transfers are determined by the Minister of Finance and are authorized with an Order in Council. The report on these transactions is made in accordance with Section 65(1)(c)(ii) of The Financial Administration Act.
It is the Government's policy to divide the Fiscal Stabilization Account into two programs, the Health Program and theGeneral Program, as presented in the attached, unaudited Schedule of Supplementary Information. Funds wereallocated to the Health Program based upon funds received from the Federal Government for Wait Time Reductionprogramming and Other Health Related programming.
Subsection 26.1(2) of The Financial Administration Act stipulates that the Minister of Finance shall make every effortto ensure that the balance of the Account at the end of each fiscal year is at least 5% of the core governmentexpenditures for that year. As authorized under amendments to The Balanced Budget, Fiscal Management andTaxpayer Accountability Act, Part 4.1, during the 5 year economic recovery period the Minister is directed to transferat least $600 million from the Fiscal Stabilization Account to the core government to support the amortization ofincreases in general purposes debt, including related interest expenses, attributable to negative net results for fiscalyears within that period.

PROVINCE OF MANITOBA OTHER FINANCIAL REPORTS 2011/12
FISCAL STABILIZATION ACCOUNT SCHEDULE OF SUPPLEMENTARY INFORMATION
(Unaudited)
($ thousands)
Fiscal Stabilization Account by Program 2012 2011
Health Program
Account Balance, beginning of year 32,834 57,834 Health Program Transfers - Wait Time reduction Programming (25,000) (25,000)
Account Balance, end of year 7,834 32,834
General Program
Account Balance, beginning of year 649,105 749,420 General Program Transfers - Health Program 25,000 25,000 - ecoTrust (6,401) - - Transfer for General Purpose debt reduction (110,000) (90,000) - Transfer for General Purpose debt servicing costs (14,000) (5,990) - Transfer to Core Government - allocated to general purposes (25,000) (29,325)
Account Balance, end of year 518,704 649,105
Total Account Balance, end of year 526,538 681,939
123
For the Year Ended March 31, 2012


PROVINCE OF MANITOBA OTHER FINANCIAL REPORTS 2011/12
DEBT RETIREMENT ACCOUNT STATEMENT OF TRANSFERS
AND ACCOUNT BALANCE
For the Year Ended March 31, 2012
($ thousands)
2012 2011
Transfers
Allocation for Interest - 14 Transfer for General Purpose debt reduction - (145,304)
Net results for the year after transfers - (145,290)
Account Balance, beginning of year - 145,290
Account Balance, end of year - -
Notes to Financial Information
1.
2
3
4
127
The Debt Retirement Account was established under the authority of The Balanced Budget, Fiscal Managementand Taxpayer Accountability Act (Act). The Debt Retirement Fund established under the Act is continued as theDebt Retirement Account. The purpose of the Account was to assist in the orderly repayment of debt pursuant tothe Act.
Subsection 13(2) of the Act was amended to not apply to those periods falling within the economic recoveryperiod, ending March 31, 2014, and as a result there was no transfer from Core Government operations for thespecific purpose of reducing general purpose debt and pension obligations. Consequently there was no transferfrom the Debt Retirement Account for the specific purpose of providing for the future retirement of pensionobligations in accordance with subsection 14(1) of the Act.
In accordance with subsection 14(2) of the Act, which requires the balance of the debt retirement account to betransferred to the Core Government at least once every five years for the purpose of reducing general purposedebt, the Government transferred $145 million from the Debt Retirement Account to the Core Government onApril 14, 2010.
Transactions in the Debt Retirement Account are accounted for on an accrual basis. Transfers to the account are made in accordance with Sections 13(2) and 13(3) of the Act. Transfers from the account are made in accordance with Section 14(1) and 14(2) of the Act. The report on these transactions is made in accordance with Section 65(1)(c)(i) of The Financial Administration Act.


SUMMARY FINANCIAL STATEMENTSCONSOLIDATED DETAILS AND RECONCILIATION
TO CORE GOVERNMENT RESULTSFor the Year ended March 31, 2012
($ millions)
Core Consolidation Summary Core Consolidation SummaryGovernment Impacts 2012 Government Impacts 2011
REVENUE Income taxes........................................................................................................................................3,107 17 3,124 2,922 - 2,922 Other taxes........................................................................................................................................ 2,916 615 3,531 2,807 599 3,406 Fees and other revenue......................................................................................................................515 1,391 1,906 511 1,317 1,828 Federal transfers.................................................................................................................4,053 279 4,332 3,726 321 4,047 Net income from government business enterprises.......................................................... 597 116 713 583 224 807 Sinking funds and other investment earnings................................................................................................................. - 249 249 - 230 230
TOTAL REVENUE......................................................................................................................................................................................11,188 2,667 13,855 10,549 2,691 13,240
EXPENSES Health and Healthy Living.....................................................................................................................................................4,901 427 5,328 4,724 320 5,044 Education .................................................................................................................................................................................................................2,262 1,227 3,489 2,128 1,202 3,330 Family Services....................................................................................................................................................................................1,049 (36) 1,013 983 (5) 978 Community, Economic and Resource Development............................................................................................................................................................2,290 481 2,771 2,004 396 2,400 Justice and Other Expenditures................................................................................................................................................................................1,360 78 1,438 816 78 894 Debt Servicing..........................................................................................................236 579 815 233 540 773
TOTAL EXPENSES..............................................................................................................................12,098 2,756 14,854 10,888 2,531 13,419
Net Income (Loss) before Transfers for Expense Recovery........................................................................................................................................ (910) (89) (999) (339) 160 (179) Transfer (to) from Fiscal Stabilization Account.................................................................................................. 45 (45) - 35 (35) - Net Result before Transfers for Debt Repayment........................................................................................................................................ (865) (134) (999) (304) 125 (179) Transfer (to) from Debt Retirement Account............................................................... - - - 145 (145) - Transfer (to) from Fiscal Stabilization Account..................................................................................................110 (110) - 90 (90) -
NET RESULT FOR THE YEAR AFTER TRANSFERS (755) (244) (999) (69) (110) (179)
129
OTH
ER FIN
ANC
IAL REPO
RTS 2011/12
PRO
VINC
E OF M
ANITO
BA
2012 2011
Unaudited