Embed Size (px)
Citation preview
Quick Start – 7150 Series Management Fundamentals
Arista Whitepaper – June 2013
1
Summary
Several mechanisms exist to manage Arista Networks’ devices, ranging from industry standard SNMP counters to more Arista EOS or platform specific functionality and deep debugging capabilities. The 7150 has the following management tools available:
1. Syslog and Console Logging
2. SNMP Versions 1,2 and 3
3. Hardware Specific ‘show’ Commands
4. System and Process Level Logging
5. VRF Aware Management
6. Arista EOS API
7. tcpdump
8. EOS Process Tracing
9. Advanced Event Management
10. Installing and removing EOS Extensions
11. sFLOW
12. Port Mirroring
13. LANZ
This document serves to highlight the basic configuration required to automate monitoring of an EOS based device, while providing a high level overview of additional, more advanced functionality for low level troubleshooting and application specific monitoring.
Many of the topics in this document are discussed in greater detail at the Arista EOS Central webpage, eos.aristanetworks.com. EOS Central offers access to development tools, script examples, and interactive support in an open collaborative environment.
Quick Start – 7150 Series Management Fundamentals
Arista Whitepaper – June 2013
2
Configuring Syslog and Console Logging
For common system logging, EOS follows industry standard configuration semantics:
Console logging defaults to error and higher level messages:
Note: By default console/monitor logging will not be printed to the terminal (SSH/Telnet), it can be enabled using the command ‘terminal monitor’.
7150S(config)#logging ? buffered Set buffered logging parameters console Set console logging parameters event Global events facility Set logging facility format Set logging format parameters host Set syslog server IP address and parameters level Configure logging severity on Enable logging to all supported destinations relogging-interval Configure relogging-interval for critical log messages source-interface Use IP Address of interface as source IP of log messages synchronous Set synchronizing unsolicited with solicited messages trap Set syslog server logging level
7150S(config)#logging console ? alerts Immediate action needed (severity=1) critical Critical conditions (severity=2) debugging Debugging messages (severity=7) emergencies System is unusable (severity=0) errors Error conditions (severity=3) informational Informational messages (severity=6) notifications Normal but significant conditions (severity=5) warnings Warning conditions (severity=4) <0-7> Severity level value <cr>
Quick Start – 7150 Series Management Fundamentals
Arista Whitepaper – June 2013
3
SNMP Configuration and Overview
EOS supports a growing number of both Arista specific and standards based MIBs providing the ability to quickly integrate devices into 3rd party monitoring solutions. The current list of supported MIBs can be accessd at the following URL:
http://www.aristanetworks.com/en/support/aristasnmpmibs
Configuring SNMP support on the device follows industry standard syntax (e.g. for SNMPv2)
EOS also natively provides the ability to walk and search local MIBs enabling easy location of specific OIDs
7150S#conf t 7150S(config)#snmp-server community public 7150S(config)#snmp-server host trap.foo.com public
7150S(config)#show snmp mib ? get Get one object get-next Get the next object ifmib Show SNMP IF-MIB contents table Get the contents of a table translate Translate between OID <-> name walk Walk a subtree 7150S(config)#show snmp mib walk ? OID An object-ID (e.g., IP-MIB::ipAddrTable) > Redirect output to URL >> Append redirected output to URL | Output modifiers <cr> 7150S#sh snmp mib walk . | grep -i ifmtu IF-MIB::ifMtu[1] = INTEGER: 9214 IF-MIB::ifMtu[2] = INTEGER: 9214 IF-MIB::ifMtu[3] = INTEGER: 9214 IF-MIB::ifMtu[4] = INTEGER: 9214 IF-MIB::ifMtu[5] = INTEGER: 9214 IF-MIB::ifMtu[6] = INTEGER: 9214 IF-MIB::ifMtu[7] = INTEGER: 9214 IF-MIB::ifMtu[8] = INTEGER: 9214 IF-MIB::ifMtu[9] = INTEGER: 9214 IF-MIB::ifMtu[10] = INTEGER: 9214 IF-MIB::ifMtu[11] = INTEGER: 9214 IF-MIB::ifMtu[12] = INTEGER: 9214 IF-MIB::ifMtu[13] = INTEGER: 9214 IF-MIB::ifMtu[14] = INTEGER: 9214 IF-MIB::ifMtu[15] = INTEGER: 9214 IF-MIB::ifMtu[16] = INTEGER: 9214 IF-MIB::ifMtu[17] = INTEGER: 9214 IF-MIB::ifMtu[18] = INTEGER: 9214 IF-MIB::ifMtu[19] = INTEGER: 9214 IF-MIB::ifMtu[20] = INTEGER: 9214
Quick Start – 7150 Series Management Fundamentals
Arista Whitepaper – June 2013
4
Suggested SNMP OIDs for General System Health
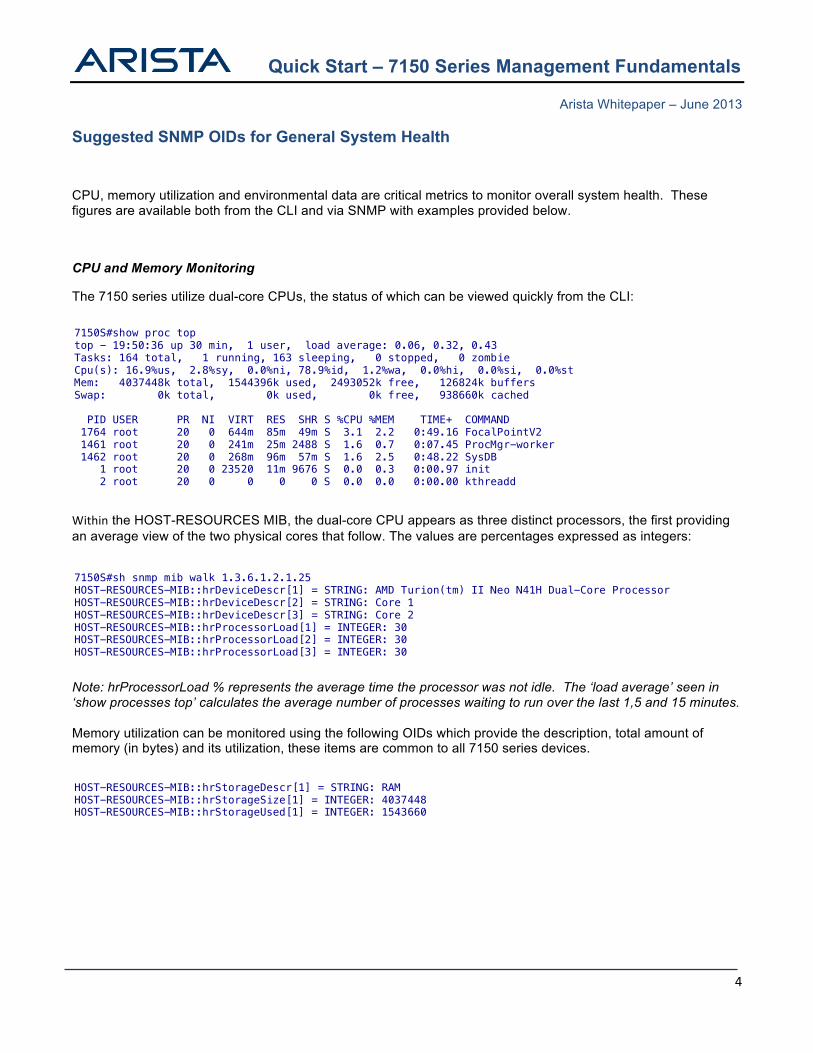
CPU, memory utilization and environmental data are critical metrics to monitor overall system health. These figures are available both from the CLI and via SNMP with examples provided below.
CPU and Memory Monitoring
The 7150 series utilize dual-core CPUs, the status of which can be viewed quickly from the CLI:
Within the HOST-RESOURCES MIB, the dual-core CPU appears as three distinct processors, the first providing an average view of the two physical cores that follow. The values are percentages expressed as integers:
Note: hrProcessorLoad % represents the average time the processor was not idle. The ‘load average’ seen in ‘show processes top’ calculates the average number of processes waiting to run over the last 1,5 and 15 minutes. Memory utilization can be monitored using the following OIDs which provide the description, total amount of memory (in bytes) and its utilization, these items are common to all 7150 series devices.
7150S#show proc top top - 19:50:36 up 30 min, 1 user, load average: 0.06, 0.32, 0.43 Tasks: 164 total, 1 running, 163 sleeping, 0 stopped, 0 zombie Cpu(s): 16.9%us, 2.8%sy, 0.0%ni, 78.9%id, 1.2%wa, 0.0%hi, 0.0%si, 0.0%st Mem: 4037448k total, 1544396k used, 2493052k free, 126824k buffers Swap: 0k total, 0k used, 0k free, 938660k cached PID USER PR NI VIRT RES SHR S %CPU %MEM TIME+ COMMAND 1764 root 20 0 644m 85m 49m S 3.1 2.2 0:49.16 FocalPointV2 1461 root 20 0 241m 25m 2488 S 1.6 0.7 0:07.45 ProcMgr-worker 1462 root 20 0 268m 96m 57m S 1.6 2.5 0:48.22 SysDB 1 root 20 0 23520 11m 9676 S 0.0 0.3 0:00.97 init 2 root 20 0 0 0 0 S 0.0 0.0 0:00.00 kthreadd
7150S#sh snmp mib walk 1.3.6.1.2.1.25 HOST-RESOURCES-MIB::hrDeviceDescr[1] = STRING: AMD Turion(tm) II Neo N41H Dual-Core Processor HOST-RESOURCES-MIB::hrDeviceDescr[2] = STRING: Core 1 HOST-RESOURCES-MIB::hrDeviceDescr[3] = STRING: Core 2 HOST-RESOURCES-MIB::hrProcessorLoad[1] = INTEGER: 30 HOST-RESOURCES-MIB::hrProcessorLoad[2] = INTEGER: 30 HOST-RESOURCES-MIB::hrProcessorLoad[3] = INTEGER: 30
HOST-RESOURCES-MIB::hrStorageDescr[1] = STRING: RAM HOST-RESOURCES-MIB::hrStorageSize[1] = INTEGER: 4037448 HOST-RESOURCES-MIB::hrStorageUsed[1] = INTEGER: 1543660
Quick Start – 7150 Series Management Fundamentals
Arista Whitepaper – June 2013
5
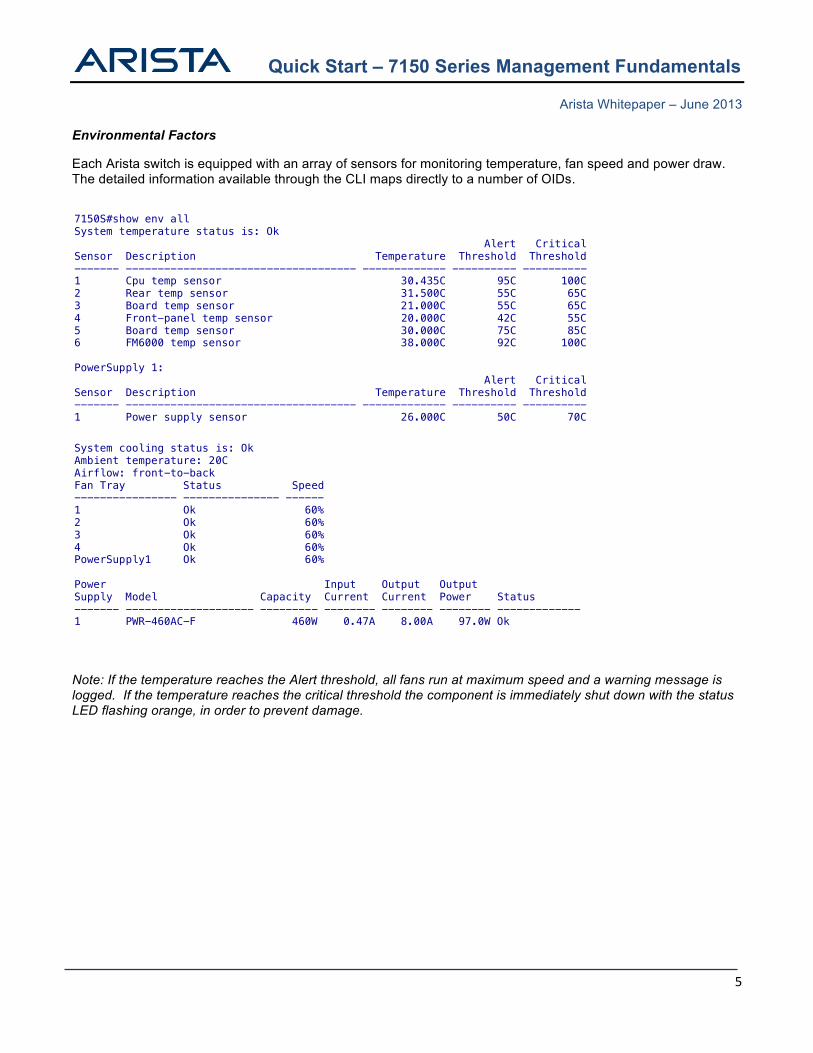
Environmental Factors
Each Arista switch is equipped with an array of sensors for monitoring temperature, fan speed and power draw. The detailed information available through the CLI maps directly to a number of OIDs.
Note: If the temperature reaches the Alert threshold, all fans run at maximum speed and a warning message is logged. If the temperature reaches the critical threshold the component is immediately shut down with the status LED flashing orange, in order to prevent damage.
7150S#show env all System temperature status is: Ok Alert Critical Sensor Description Temperature Threshold Threshold ------- ------------------------------------ ------------- ---------- ---------- 1 Cpu temp sensor 30.435C 95C 100C 2 Rear temp sensor 31.500C 55C 65C 3 Board temp sensor 21.000C 55C 65C 4 Front-panel temp sensor 20.000C 42C 55C 5 Board temp sensor 30.000C 75C 85C 6 FM6000 temp sensor 38.000C 92C 100C PowerSupply 1: Alert Critical Sensor Description Temperature Threshold Threshold ------- ------------------------------------ ------------- ---------- ---------- 1 Power supply sensor 26.000C 50C 70C System cooling status is: Ok Ambient temperature: 20C Airflow: front-to-back Fan Tray Status Speed ---------------- --------------- ------ 1 Ok 60% 2 Ok 60% 3 Ok 60% 4 Ok 60% PowerSupply1 Ok 60% Power Input Output Output Supply Model Capacity Current Current Power Status ------- -------------------- --------- -------- -------- -------- ------------- 1 PWR-460AC-F 460W 0.47A 8.00A 97.0W Ok
Quick Start – 7150 Series Management Fundamentals
Arista Whitepaper – June 2013
6
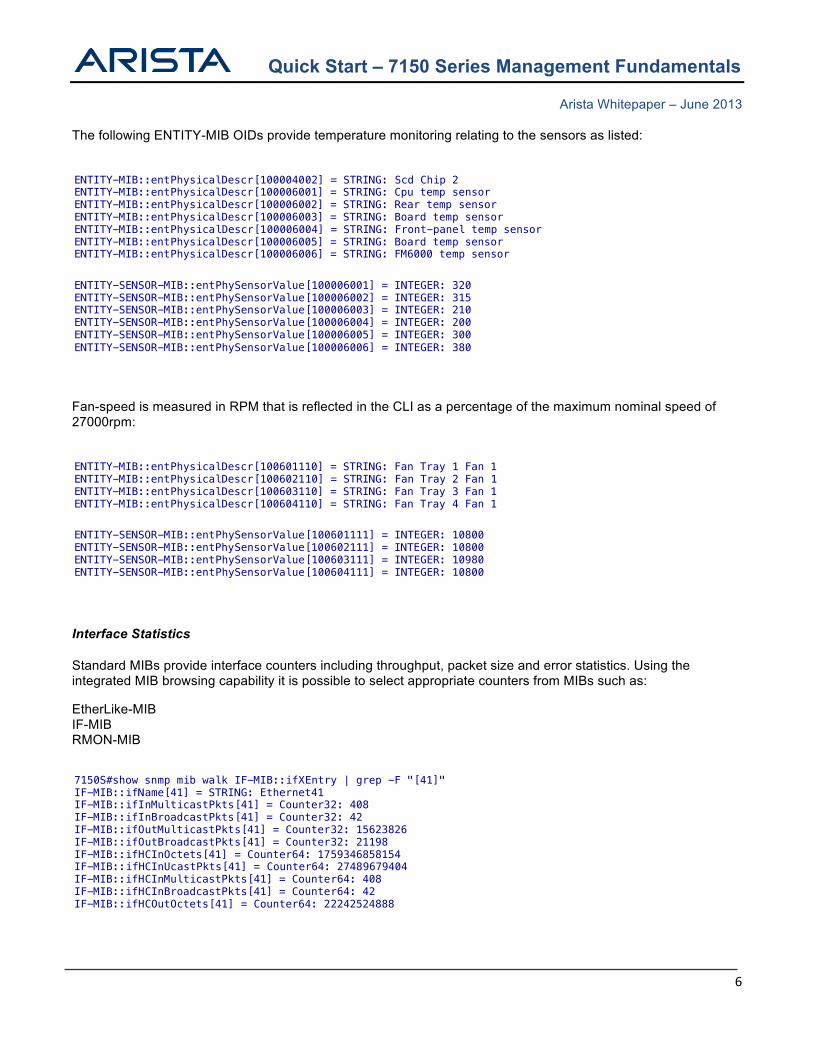
The following ENTITY-MIB OIDs provide temperature monitoring relating to the sensors as listed:
Fan-speed is measured in RPM that is reflected in the CLI as a percentage of the maximum nominal speed of 27000rpm:
Interface Statistics Standard MIBs provide interface counters including throughput, packet size and error statistics. Using the integrated MIB browsing capability it is possible to select appropriate counters from MIBs such as:
EtherLike-MIB IF-MIB RMON-MIB
7150S#show snmp mib walk IF-MIB::ifXEntry | grep -F "[41]" IF-MIB::ifName[41] = STRING: Ethernet41 IF-MIB::ifInMulticastPkts[41] = Counter32: 408 IF-MIB::ifInBroadcastPkts[41] = Counter32: 42 IF-MIB::ifOutMulticastPkts[41] = Counter32: 15623826 IF-MIB::ifOutBroadcastPkts[41] = Counter32: 21198 IF-MIB::ifHCInOctets[41] = Counter64: 1759346858154 IF-MIB::ifHCInUcastPkts[41] = Counter64: 27489679404 IF-MIB::ifHCInMulticastPkts[41] = Counter64: 408 IF-MIB::ifHCInBroadcastPkts[41] = Counter64: 42 IF-MIB::ifHCOutOctets[41] = Counter64: 22242524888 IF-MIB::ifHCOutUcastPkts[41] = Counter64: 1758550
ENTITY-MIB::entPhysicalDescr[100601110] = STRING: Fan Tray 1 Fan 1 ENTITY-MIB::entPhysicalDescr[100602110] = STRING: Fan Tray 2 Fan 1 ENTITY-MIB::entPhysicalDescr[100603110] = STRING: Fan Tray 3 Fan 1 ENTITY-MIB::entPhysicalDescr[100604110] = STRING: Fan Tray 4 Fan 1 ENTITY-SENSOR-MIB::entPhySensorValue[100601111] = INTEGER: 10800 ENTITY-SENSOR-MIB::entPhySensorValue[100602111] = INTEGER: 10800 ENTITY-SENSOR-MIB::entPhySensorValue[100603111] = INTEGER: 10980 ENTITY-SENSOR-MIB::entPhySensorValue[100604111] = INTEGER: 10800
ENTITY-MIB::entPhysicalDescr[100004002] = STRING: Scd Chip 2 ENTITY-MIB::entPhysicalDescr[100006001] = STRING: Cpu temp sensor ENTITY-MIB::entPhysicalDescr[100006002] = STRING: Rear temp sensor ENTITY-MIB::entPhysicalDescr[100006003] = STRING: Board temp sensor ENTITY-MIB::entPhysicalDescr[100006004] = STRING: Front-panel temp sensor ENTITY-MIB::entPhysicalDescr[100006005] = STRING: Board temp sensor ENTITY-MIB::entPhysicalDescr[100006006] = STRING: FM6000 temp sensor ENTITY-SENSOR-MIB::entPhySensorValue[100006001] = INTEGER: 320 ENTITY-SENSOR-MIB::entPhySensorValue[100006002] = INTEGER: 315 ENTITY-SENSOR-MIB::entPhySensorValue[100006003] = INTEGER: 210 ENTITY-SENSOR-MIB::entPhySensorValue[100006004] = INTEGER: 200 ENTITY-SENSOR-MIB::entPhySensorValue[100006005] = INTEGER: 300 ENTITY-SENSOR-MIB::entPhySensorValue[100006006] = INTEGER: 380
Quick Start – 7150 Series Management Fundamentals
Arista Whitepaper – June 2013
7
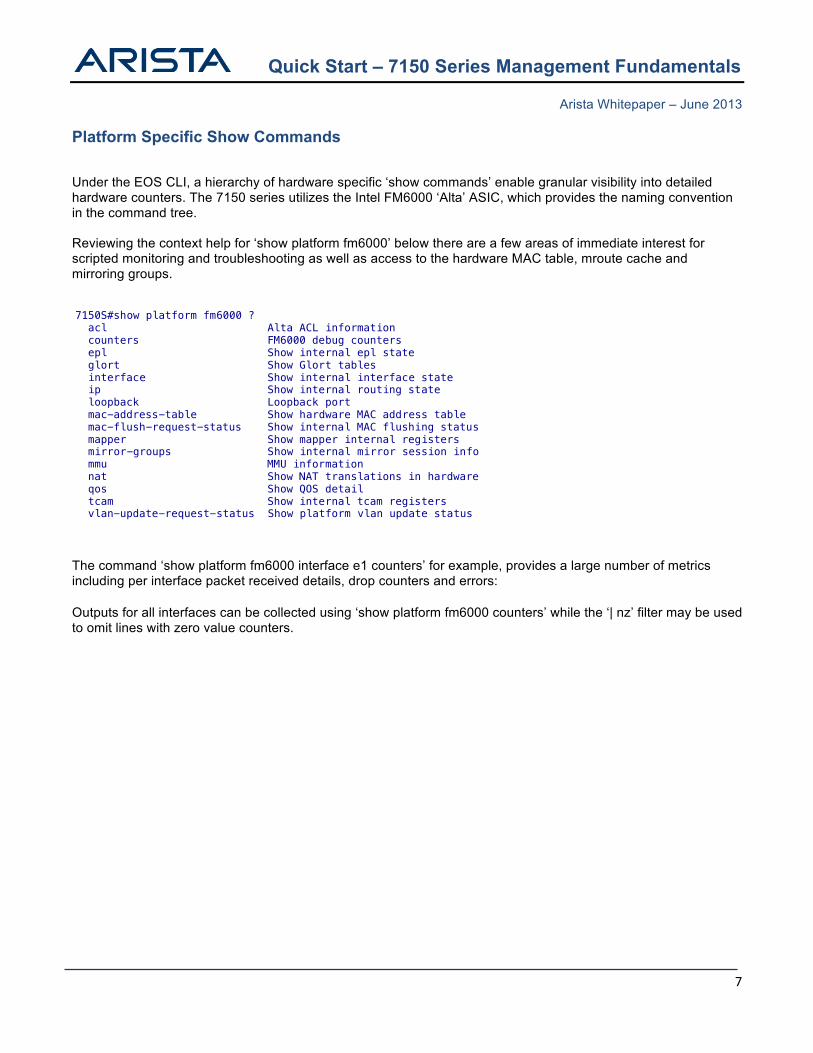
Platform Specific Show Commands
Under the EOS CLI, a hierarchy of hardware specific ‘show commands’ enable granular visibility into detailed hardware counters. The 7150 series utilizes the Intel FM6000 ‘Alta’ ASIC, which provides the naming convention in the command tree. Reviewing the context help for ‘show platform fm6000’ below there are a few areas of immediate interest for scripted monitoring and troubleshooting as well as access to the hardware MAC table, mroute cache and mirroring groups.
The command ‘show platform fm6000 interface e1 counters’ for example, provides a large number of metrics including per interface packet received details, drop counters and errors: Outputs for all interfaces can be collected using ‘show platform fm6000 counters’ while the ‘| nz’ filter may be used to omit lines with zero value counters.
7150S#show platform fm6000 ? acl Alta ACL information counters FM6000 debug counters epl Show internal epl state glort Show Glort tables interface Show internal interface state ip Show internal routing state loopback Loopback port mac-address-table Show hardware MAC address table mac-flush-request-status Show internal MAC flushing status mapper Show mapper internal registers mirror-groups Show internal mirror session info mmu MMU information nat Show NAT translations in hardware qos Show QOS detail tcam Show internal tcam registers vlan-update-request-status Show platform vlan update status
Quick Start – 7150 Series Management Fundamentals
Arista Whitepaper – June 2013
8
System and Process Logging
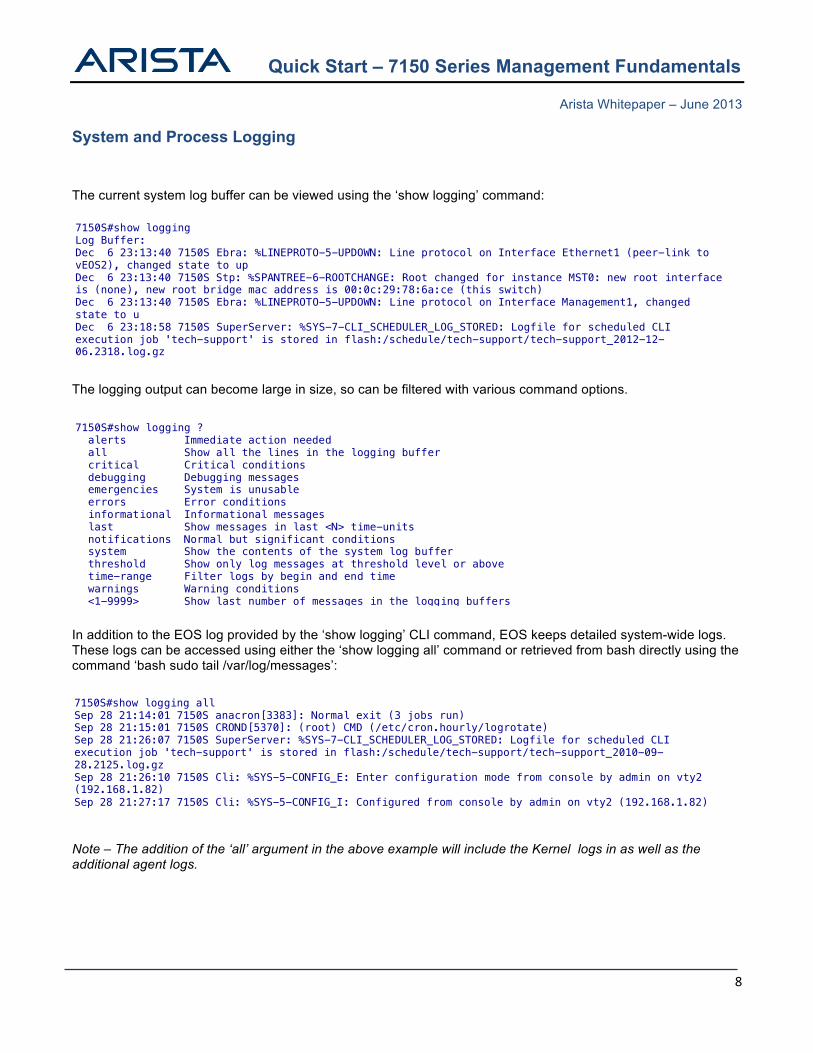
The current system log buffer can be viewed using the ‘show logging’ command:
The logging output can become large in size, so can be filtered with various command options.
In addition to the EOS log provided by the ‘show logging’ CLI command, EOS keeps detailed system-wide logs. These logs can be accessed using either the ‘show logging all’ command or retrieved from bash directly using the command ‘bash sudo tail /var/log/messages’:
Note – The addition of the ‘all’ argument in the above example will include the Kernel logs in as well as the additional agent logs.
7150S#show logging all Sep 28 21:14:01 7150S anacron[3383]: Normal exit (3 jobs run) Sep 28 21:15:01 7150S CROND[5370]: (root) CMD (/etc/cron.hourly/logrotate) Sep 28 21:26:07 7150S SuperServer: %SYS-7-CLI_SCHEDULER_LOG_STORED: Logfile for scheduled CLI execution job 'tech-support' is stored in flash:/schedule/tech-support/tech-support_2010-09-28.2125.log.gz Sep 28 21:26:10 7150S Cli: %SYS-5-CONFIG_E: Enter configuration mode from console by admin on vty2 (192.168.1.82) Sep 28 21:27:17 7150S Cli: %SYS-5-CONFIG_I: Configured from console by admin on vty2 (192.168.1.82)
7150S#show logging Log Buffer: Dec 6 23:13:40 7150S Ebra: %LINEPROTO-5-UPDOWN: Line protocol on Interface Ethernet1 (peer-link to vEOS2), changed state to up Dec 6 23:13:40 7150S Stp: %SPANTREE-6-ROOTCHANGE: Root changed for instance MST0: new root interface is (none), new root bridge mac address is 00:0c:29:78:6a:ce (this switch) Dec 6 23:13:40 7150S Ebra: %LINEPROTO-5-UPDOWN: Line protocol on Interface Management1, changed state to u Dec 6 23:18:58 7150S SuperServer: %SYS-7-CLI_SCHEDULER_LOG_STORED: Logfile for scheduled CLI execution job 'tech-support' is stored in flash:/schedule/tech-support/tech-support_2012-12-06.2318.log.gz
7150S#show logging ? alerts Immediate action needed all Show all the lines in the logging buffer critical Critical conditions debugging Debugging messages emergencies System is unusable errors Error conditions informational Informational messages last Show messages in last <N> time-units notifications Normal but significant conditions system Show the contents of the system log buffer threshold Show only log messages at threshold level or above time-range Filter logs by begin and end time warnings Warning conditions <1-9999> Show last number of messages in the logging buffers
Quick Start – 7150 Series Management Fundamentals
Arista Whitepaper – June 2013
9
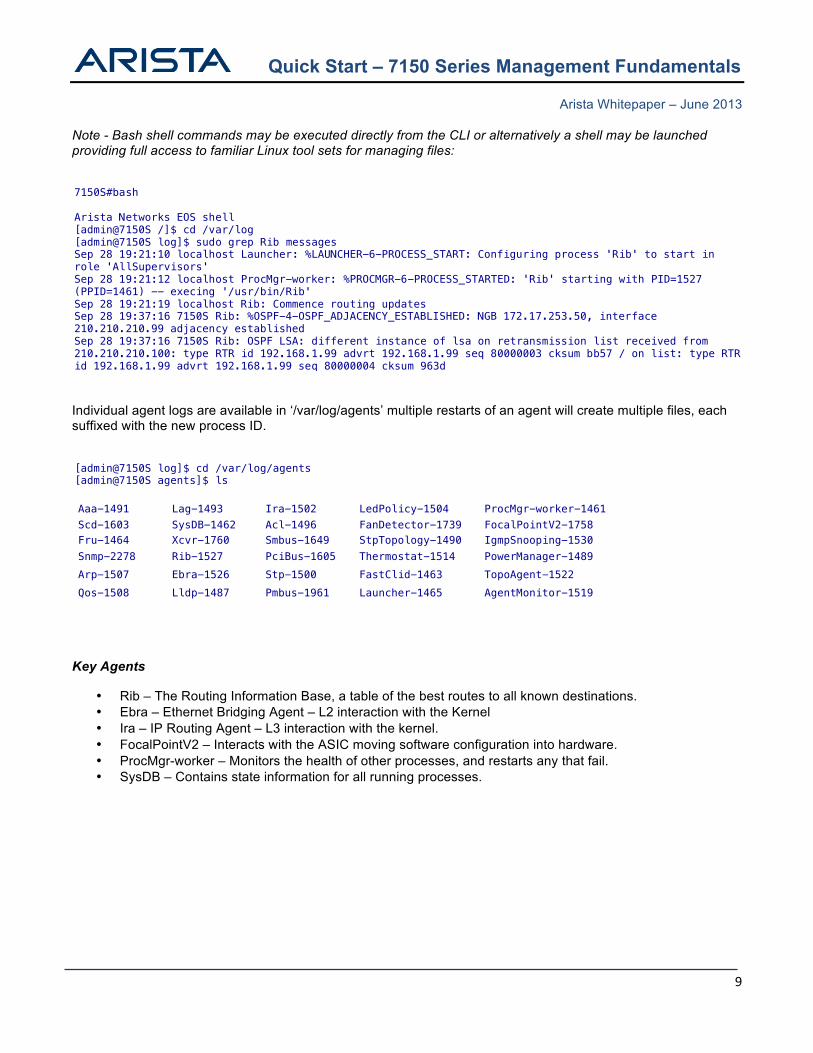
Note - Bash shell commands may be executed directly from the CLI or alternatively a shell may be launched providing full access to familiar Linux tool sets for managing files:
Individual agent logs are available in ‘/var/log/agents’ multiple restarts of an agent will create multiple files, each suffixed with the new process ID.
Aaa-1491 Lag-1493 Ira-1502 LedPolicy-1504 ProcMgr-worker-1461 Scd-1603 SysDB-1462 Acl-1496 FanDetector-1739 FocalPointV2-1758 Fru-1464 Xcvr-1760 Smbus-1649 StpTopology-1490 IgmpSnooping-1530 Snmp-2278 Rib-1527 PciBus-1605 Thermostat-1514 PowerManager-1489 Arp-1507 Ebra-1526 Stp-1500 FastClid-1463 TopoAgent-1522 Qos-1508 Lldp-1487 Pmbus-1961 Launcher-1465 AgentMonitor-1519
Key Agents
• Rib – The Routing Information Base, a table of the best routes to all known destinations. • Ebra – Ethernet Bridging Agent – L2 interaction with the Kernel • Ira – IP Routing Agent – L3 interaction with the kernel. • FocalPointV2 – Interacts with the ASIC moving software configuration into hardware. • ProcMgr-worker – Monitors the health of other processes, and restarts any that fail. • SysDB – Contains state information for all running processes.
7150S#bash Arista Networks EOS shell [admin@7150S /]$ cd /var/log [admin@7150S log]$ sudo grep Rib messages Sep 28 19:21:10 localhost Launcher: %LAUNCHER-6-PROCESS_START: Configuring process 'Rib' to start in role 'AllSupervisors' Sep 28 19:21:12 localhost ProcMgr-worker: %PROCMGR-6-PROCESS_STARTED: 'Rib' starting with PID=1527 (PPID=1461) -- execing '/usr/bin/Rib' Sep 28 19:21:19 localhost Rib: Commence routing updates Sep 28 19:37:16 7150S Rib: %OSPF-4-OSPF_ADJACENCY_ESTABLISHED: NGB 172.17.253.50, interface 210.210.210.99 adjacency established Sep 28 19:37:16 7150S Rib: OSPF LSA: different instance of lsa on retransmission list received from 210.210.210.100: type RTR id 192.168.1.99 advrt 192.168.1.99 seq 80000003 cksum bb57 / on list: type RTR id 192.168.1.99 advrt 192.168.1.99 seq 80000004 cksum 963d
[admin@7150S log]$ cd /var/log/agents [admin@7150S agents]$ ls
Quick Start – 7150 Series Management Fundamentals
Arista Whitepaper – June 2013
10
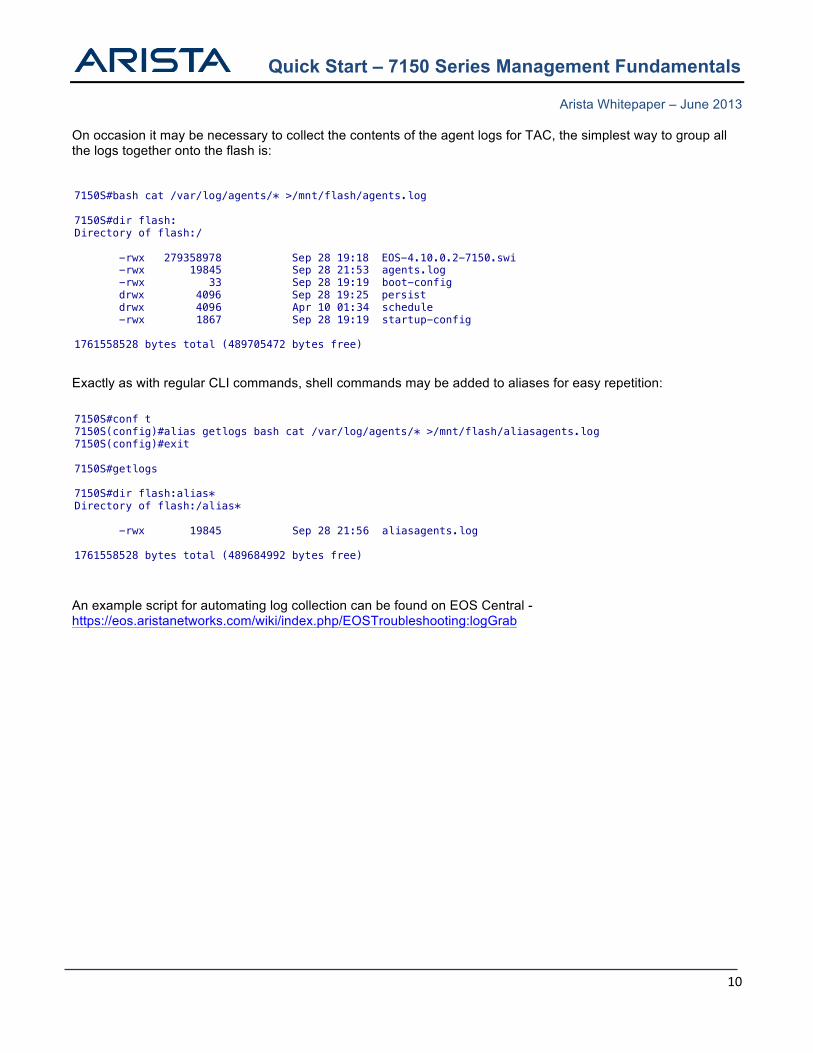
On occasion it may be necessary to collect the contents of the agent logs for TAC, the simplest way to group all the logs together onto the flash is:
Exactly as with regular CLI commands, shell commands may be added to aliases for easy repetition:
An example script for automating log collection can be found on EOS Central - https://eos.aristanetworks.com/wiki/index.php/EOSTroubleshooting:logGrab
7150S#bash cat /var/log/agents/* >/mnt/flash/agents.log 7150S#dir flash: Directory of flash:/ -rwx 279358978 Sep 28 19:18 EOS-4.10.0.2-7150.swi -rwx 19845 Sep 28 21:53 agents.log -rwx 33 Sep 28 19:19 boot-config drwx 4096 Sep 28 19:25 persist drwx 4096 Apr 10 01:34 schedule -rwx 1867 Sep 28 19:19 startup-config 1761558528 bytes total (489705472 bytes free)
7150S#conf t 7150S(config)#alias getlogs bash cat /var/log/agents/* >/mnt/flash/aliasagents.log 7150S(config)#exit 7150S#getlogs 7150S#dir flash:alias* Directory of flash:/alias* -rwx 19845 Sep 28 21:56 aliasagents.log 1761558528 bytes total (489684992 bytes free)
Quick Start – 7150 Series Management Fundamentals
Arista Whitepaper – June 2013
11
VRF Aware Management
As of release 4.10.1, EOS supports the addition of a management VRF. This enables the user to separate management based functions from the data plane. This feature does not change the capability for the device to be managed either via inband front panel interfaces or the out of band Management1 interface.
The inclusion of this management VRF has several configuration implications for management features, such as SNMP, TACACs, syslog etc.
In order to use the management VRF it first must be created, and have a route distinguisher assigned, in order to internally identify routes belonging to the management VRF and distinguish any overlapping IP address ranges.
Note: The name of the management VRF is user configurable.
Management interfaces can then be assigned into this VRF
Note: When moving interfaces between VRFs the IP addresses will be removed. It is therefore not recommended to move an interface between VRFs if that is the interface used to access the device.
Once the management interface has been moved into the appropriate VRF the various management services must be notified of this change.
SNMP
If SNMP traps should be generated from within the management VRF it is required that SNMP is disabled in the main VRF, then re-enabled in the management VRF.
Software Control Plane Protection (SW-CPP)
In order for the SW-CPP ACL to apply to traffic received on the MGMT VRF it must be additionally applied to that VRF. Alternatively, a different ACL could be used on a per VRF basis.
7150S#conf t 7150S(config)#vrf definition MGMT 7150S(config)#rd 100:100
7150S(config)#interface management1 7150S(config)#vrf forwarding MGMT
7150S(config)#no snmp-server vrf main 7150S(config)#snmp-server vrf MGMT
7150S(config)#control-plane 7150S(config)#ip access-group default-control-plane-acl vrf MGMT in
Quick Start – 7150 Series Management Fundamentals
Arista Whitepaper – June 2013
12
TACACS+
If the TACACS+ server is located in the MGMT VRF a VRF argument should be appended to the tacacs-server host configuration command.
Syslog
If the Syslog server is located in the MGMT VRF a VRF argument should be appended to the logging configuration statement.
NTP
If the NTP server is located in the MGMT VRF a VRF argument should be appended to the ntp server configuration command.
7150S(config)#tacacs-server host 192.168.1.1 vrf MGMT
7150S(config)#logging vrf MGMT host 192.168.1.1
7150S(config)#ntp server vrf MGMT 192.168.1.1
Quick Start – 7150 Series Management Fundamentals
Arista Whitepaper – June 2013
13
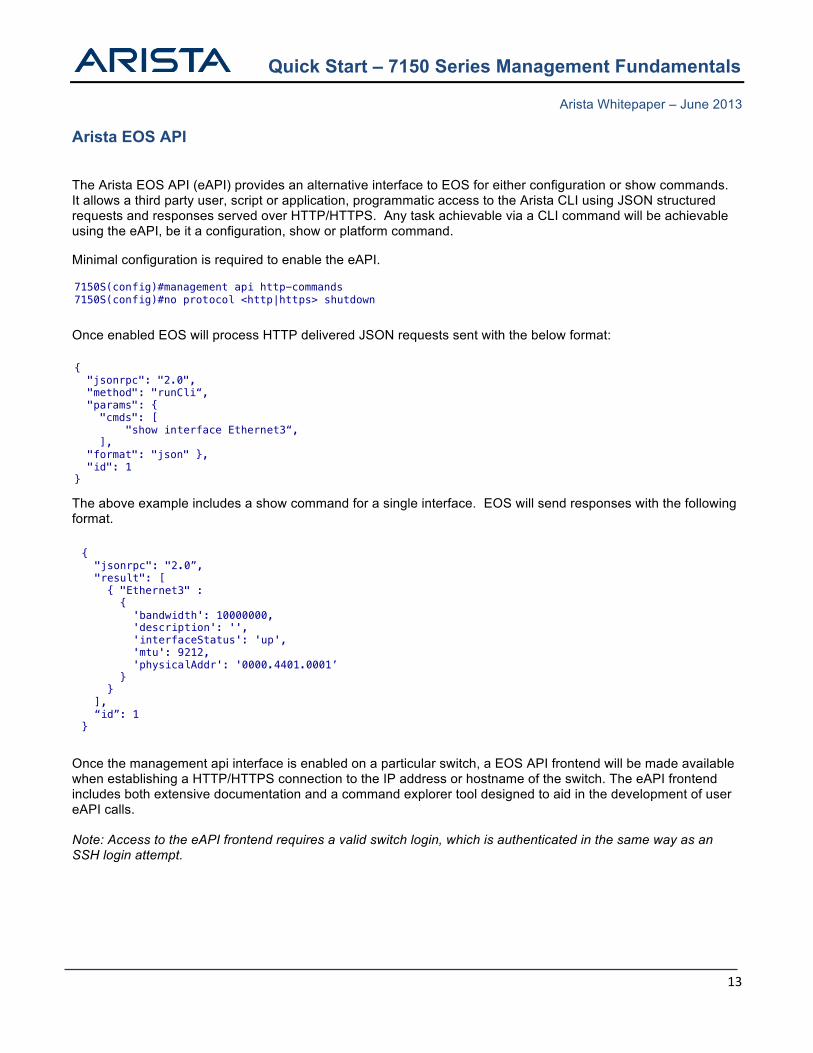
Arista EOS API
The Arista EOS API (eAPI) provides an alternative interface to EOS for either configuration or show commands. It allows a third party user, script or application, programmatic access to the Arista CLI using JSON structured requests and responses served over HTTP/HTTPS. Any task achievable via a CLI command will be achievable using the eAPI, be it a configuration, show or platform command.
Minimal configuration is required to enable the eAPI.
Once enabled EOS will process HTTP delivered JSON requests sent with the below format:
The above example includes a show command for a single interface. EOS will send responses with the following format.
Once the management api interface is enabled on a particular switch, a EOS API frontend will be made available when establishing a HTTP/HTTPS connection to the IP address or hostname of the switch. The eAPI frontend includes both extensive documentation and a command explorer tool designed to aid in the development of user eAPI calls. Note: Access to the eAPI frontend requires a valid switch login, which is authenticated in the same way as an SSH login attempt.
{ "jsonrpc": "2.0", "method": "runCli“, "params": { "cmds": [ "show interface Ethernet3“, ], "format": "json" }, "id": 1 }
7150S(config)#management api http-commands 7150S(config)#no protocol <http|https> shutdown
{ "jsonrpc": "2.0”, "result": [ { "Ethernet3" : { 'bandwidth': 10000000, 'description': '', 'interfaceStatus': 'up', 'mtu': 9212, 'physicalAddr': '0000.4401.0001’ } } ], “id”: 1 }
Quick Start – 7150 Series Management Fundamentals
Arista Whitepaper – June 2013
14
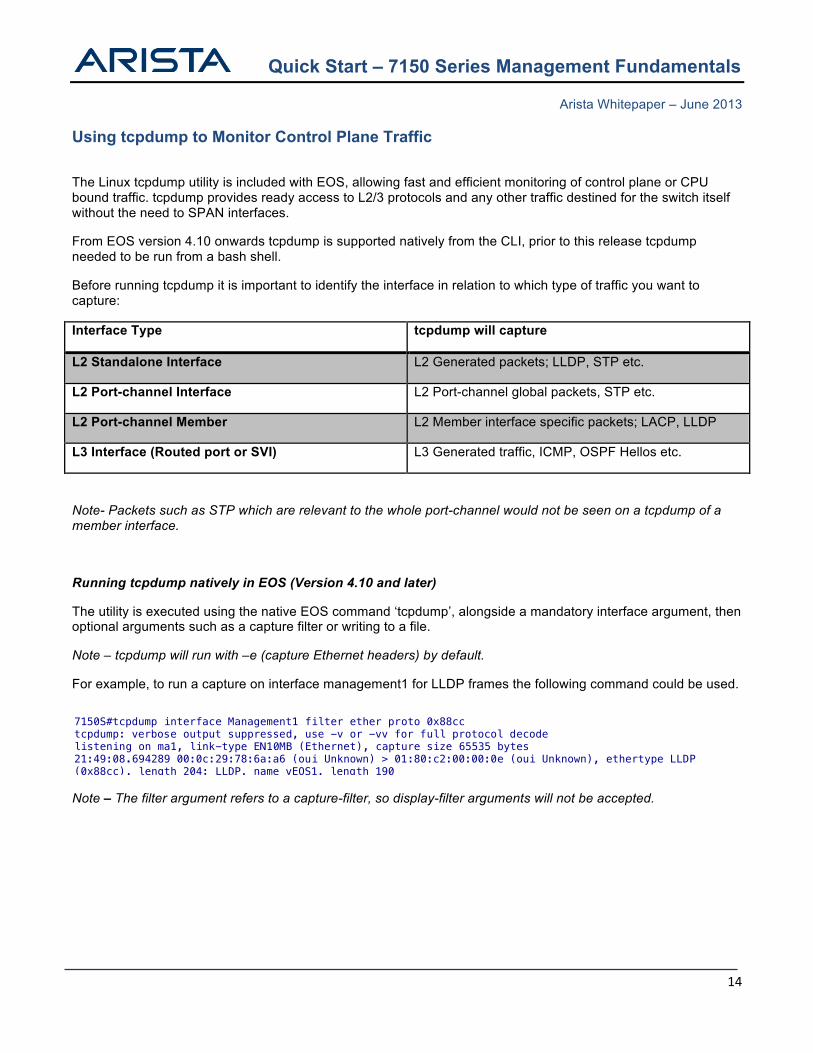
Using tcpdump to Monitor Control Plane Traffic
The Linux tcpdump utility is included with EOS, allowing fast and efficient monitoring of control plane or CPU bound traffic. tcpdump provides ready access to L2/3 protocols and any other traffic destined for the switch itself without the need to SPAN interfaces.
From EOS version 4.10 onwards tcpdump is supported natively from the CLI, prior to this release tcpdump needed to be run from a bash shell.
Before running tcpdump it is important to identify the interface in relation to which type of traffic you want to capture:
Interface Type tcpdump will capture
L2 Standalone Interface L2 Generated packets; LLDP, STP etc.
L2 Port-channel Interface L2 Port-channel global packets, STP etc.
L2 Port-channel Member L2 Member interface specific packets; LACP, LLDP
L3 Interface (Routed port or SVI) L3 Generated traffic, ICMP, OSPF Hellos etc.
Note- Packets such as STP which are relevant to the whole port-channel would not be seen on a tcpdump of a member interface.
Running tcpdump natively in EOS (Version 4.10 and later)
The utility is executed using the native EOS command ‘tcpdump’, alongside a mandatory interface argument, then optional arguments such as a capture filter or writing to a file.
Note – tcpdump will run with –e (capture Ethernet headers) by default.
For example, to run a capture on interface management1 for LLDP frames the following command could be used.
Note – The filter argument refers to a capture-filter, so display-filter arguments will not be accepted.
7150S#tcpdump interface Management1 filter ether proto 0x88cc tcpdump: verbose output suppressed, use -v or -vv for full protocol decode listening on ma1, link-type EN10MB (Ethernet), capture size 65535 bytes 21:49:08.694289 00:0c:29:78:6a:a6 (oui Unknown) > 01:80:c2:00:00:0e (oui Unknown), ethertype LLDP (0x88cc), length 204: LLDP, name vEOS1, length 190
Quick Start – 7150 Series Management Fundamentals
Arista Whitepaper – June 2013
15
Running tcpdump from Bash (All versions of EOS)
To tcpdump an interface, first find out the Linux name for the interface (note, L2, L3 and management interfaces are listed individually):
7150S#bash ifconfig cpu Link encap:Ethernet HWaddr 00:1C:73:00:46:42 UP BROADCAST RUNNING MULTICAST MTU:9216 Metric:1 RX packets:4 errors:0 dropped:0 overruns:0 frame:0 TX packets:2 errors:0 dropped:0 overruns:0 carrier:0 collisions:0 txqueuelen:1000 RX bytes:260 (260.0 b) TX bytes:136 (136.0 b) et1 Link encap:Ethernet HWaddr 00:1C:73:00:46:42 UP BROADCAST RUNNING MULTICAST MTU:9214 Metric:1 RX packets:316 errors:0 dropped:0 overruns:0 frame:0 TX packets:4595 errors:0 dropped:0 overruns:0 carrier:0 collisions:0 txqueuelen:1000 RX bytes:58992 (57.6 KiB) TX bytes:582885 (569.2 KiB) fabric Link encap:Ethernet HWaddr 00:1C:73:00:46:42 UP BROADCAST RUNNING MULTICAST MTU:9216 Metric:1 RX packets:915 errors:0 dropped:0 overruns:0 frame:0 TX packets:881 errors:0 dropped:0 overruns:0 carrier:0 collisions:0 txqueuelen:1000 RX bytes:78498 (76.6 KiB) TX bytes:76002 (74.2 KiB) lo Link encap:Local Loopback inet addr:127.0.0.1 Mask:255.255.255.0 inet6 addr: ::1/128 Scope:Host UP LOOPBACK RUNNING MTU:16436 Metric:1 RX packets:239587 errors:0 dropped:0 overruns:0 frame:0 TX packets:239587 errors:0 dropped:0 overruns:0 carrier:0 collisions:0 txqueuelen:0 RX bytes:37848633 (36.0 MiB) TX bytes:37848633 (36.0 MiB) ma1 Link encap:Ethernet HWaddr 00:1C:73:00:46:41 inet addr:192.168.1.99 Bcast:255.255.255.255 Mask:255.255.255.0 UP BROADCAST RUNNING MULTICAST MTU:1500 Metric:1 RX packets:8123 errors:0 dropped:0 overruns:0 frame:0 TX packets:5060 errors:0 dropped:0 overruns:0 carrier:0 collisions:0 txqueuelen:1000 RX bytes:787667 (769.2 KiB) TX bytes:2197372 (2.0 MiB) Interrupt:21 vlan10 Link encap:Ethernet HWaddr 00:1C:73:00:46:42 inet addr:210.210.210.99 Bcast:255.255.255.255 Mask:255.255.255.0 UP BROADCAST RUNNING MULTICAST MTU:1500 Metric:1 RX packets:883 errors:0 dropped:0 overruns:0 frame:0 TX packets:881 errors:0 dropped:0 overruns:0 carrier:0 collisions:0 txqueuelen:0 RX bytes:63740 (62.2 KiB) TX bytes:72430 (70.7 KiB)
Quick Start – 7150 Series Management Fundamentals
Arista Whitepaper – June 2013
16
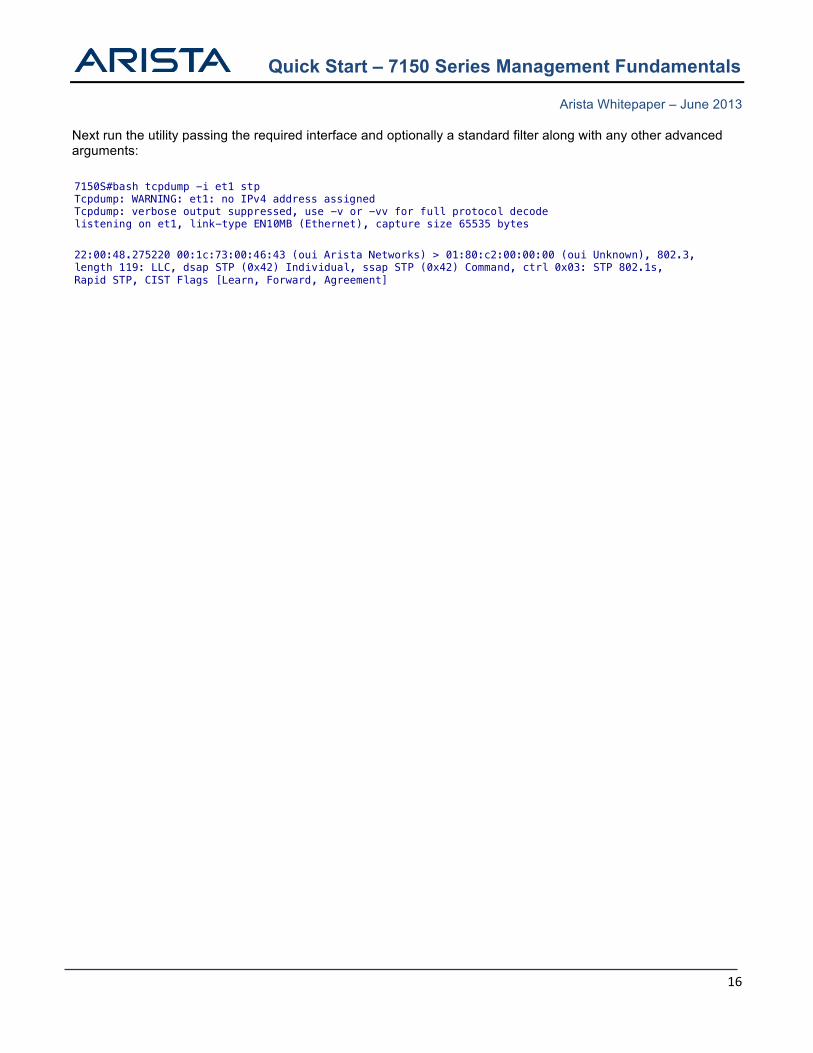
Next run the utility passing the required interface and optionally a standard filter along with any other advanced arguments:
7150S#bash tcpdump -i et1 stp Tcpdump: WARNING: et1: no IPv4 address assigned Tcpdump: verbose output suppressed, use -v or -vv for full protocol decode listening on et1, link-type EN10MB (Ethernet), capture size 65535 bytes 22:00:48.275220 00:1c:73:00:46:43 (oui Arista Networks) > 01:80:c2:00:00:00 (oui Unknown), 802.3, length 119: LLC, dsap STP (0x42) Individual, ssap STP (0x42) Command, ctrl 0x03: STP 802.1s, Rapid STP, CIST Flags [Learn, Forward, Agreement]
Quick Start – 7150 Series Management Fundamentals
Arista Whitepaper – June 2013
17
Tracing Processes with EOS
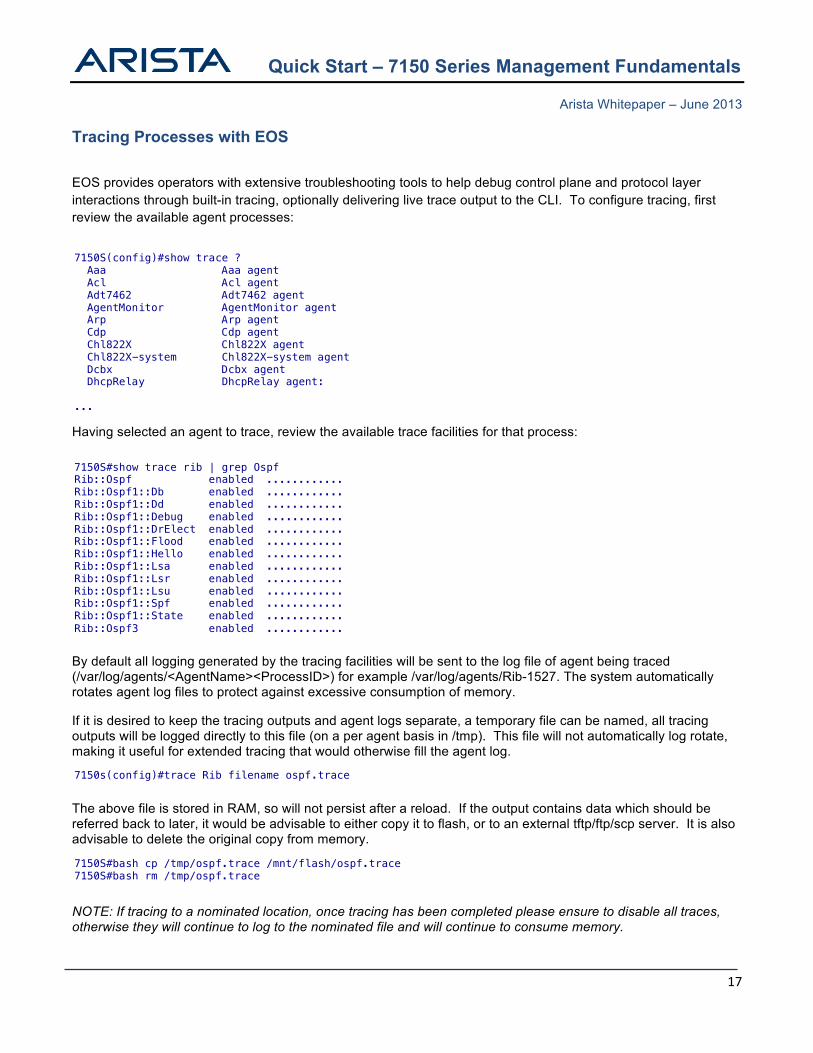
EOS provides operators with extensive troubleshooting tools to help debug control plane and protocol layer interactions through built-in tracing, optionally delivering live trace output to the CLI. To configure tracing, first review the available agent processes:
Having selected an agent to trace, review the available trace facilities for that process:
By default all logging generated by the tracing facilities will be sent to the log file of agent being traced (/var/log/agents/<AgentName><ProcessID>) for example /var/log/agents/Rib-1527. The system automatically rotates agent log files to protect against excessive consumption of memory.
If it is desired to keep the tracing outputs and agent logs separate, a temporary file can be named, all tracing outputs will be logged directly to this file (on a per agent basis in /tmp). This file will not automatically log rotate, making it useful for extended tracing that would otherwise fill the agent log.
The above file is stored in RAM, so will not persist after a reload. If the output contains data which should be referred back to later, it would be advisable to either copy it to flash, or to an external tftp/ftp/scp server. It is also advisable to delete the original copy from memory.
NOTE: If tracing to a nominated location, once tracing has been completed please ensure to disable all traces, otherwise they will continue to log to the nominated file and will continue to consume memory.
7150S(config)#show trace ? Aaa Aaa agent Acl Acl agent Adt7462 Adt7462 agent AgentMonitor AgentMonitor agent Arp Arp agent Cdp Cdp agent Chl822X Chl822X agent Chl822X-system Chl822X-system agent Dcbx Dcbx agent DhcpRelay DhcpRelay agent: ...
7150S#show trace rib | grep Ospf Rib::Ospf enabled ............ Rib::Ospf1::Db enabled ............ Rib::Ospf1::Dd enabled ............ Rib::Ospf1::Debug enabled ............ Rib::Ospf1::DrElect enabled ............ Rib::Ospf1::Flood enabled ............ Rib::Ospf1::Hello enabled ............ Rib::Ospf1::Lsa enabled ............ Rib::Ospf1::Lsr enabled ............ Rib::Ospf1::Lsu enabled ............ Rib::Ospf1::Spf enabled ............ Rib::Ospf1::State enabled ............ Rib::Ospf3 enabled ............
7150s(config)#trace Rib filename ospf.trace
7150S#bash cp /tmp/ospf.trace /mnt/flash/ospf.trace 7150S#bash rm /tmp/ospf.trace
Quick Start – 7150 Series Management Fundamentals
Arista Whitepaper – June 2013
18
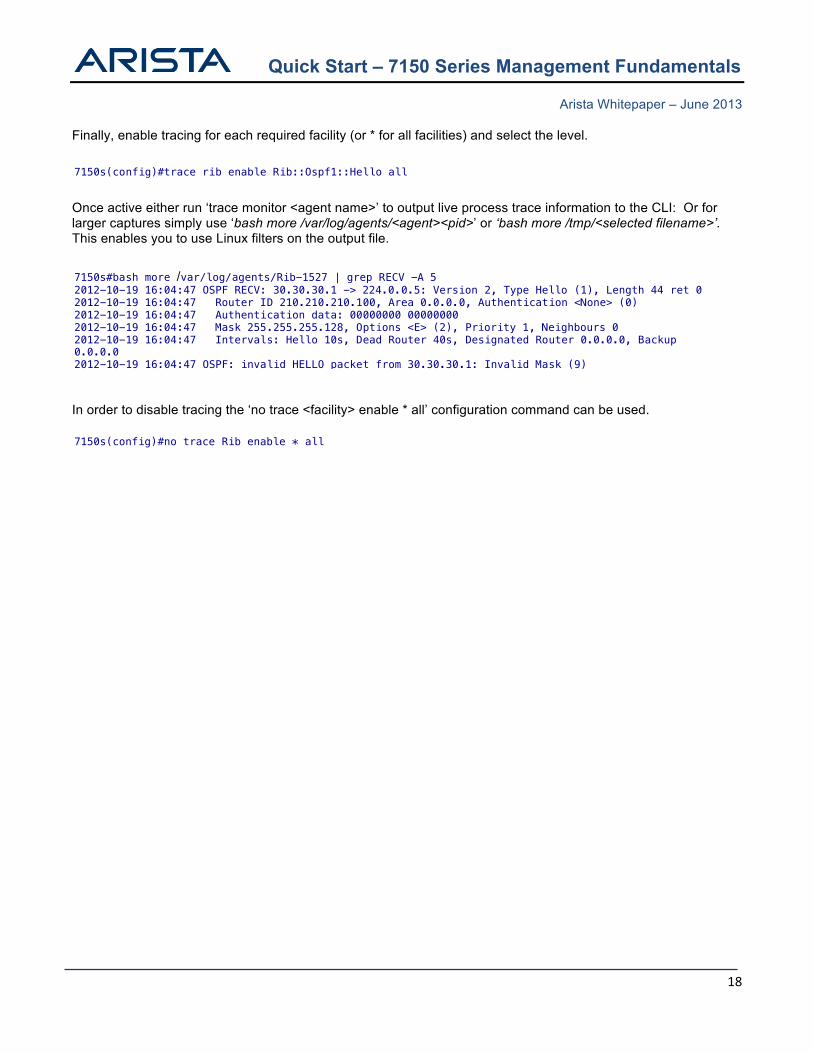
Finally, enable tracing for each required facility (or * for all facilities) and select the level.
Once active either run ‘trace monitor <agent name>’ to output live process trace information to the CLI: Or for larger captures simply use ‘bash more /var/log/agents/<agent><pid>’ or ‘bash more /tmp/<selected filename>’. This enables you to use Linux filters on the output file.
In order to disable tracing the ‘no trace <facility> enable * all’ configuration command can be used.
7150s(config)#trace rib enable Rib::Ospf1::Hello all
7150s#bash more /var/log/agents/Rib-1527 | grep RECV -A 5 2012-10-19 16:04:47 OSPF RECV: 30.30.30.1 -> 224.0.0.5: Version 2, Type Hello (1), Length 44 ret 0 2012-10-19 16:04:47 Router ID 210.210.210.100, Area 0.0.0.0, Authentication <None> (0) 2012-10-19 16:04:47 Authentication data: 00000000 00000000 2012-10-19 16:04:47 Mask 255.255.255.128, Options <E> (2), Priority 1, Neighbours 0 2012-10-19 16:04:47 Intervals: Hello 10s, Dead Router 40s, Designated Router 0.0.0.0, Backup 0.0.0.0 2012-10-19 16:04:47 OSPF: invalid HELLO packet from 30.30.30.1: Invalid Mask (9)
7150s(config)#no trace Rib enable * all
Quick Start – 7150 Series Management Fundamentals
Arista Whitepaper – June 2013
19
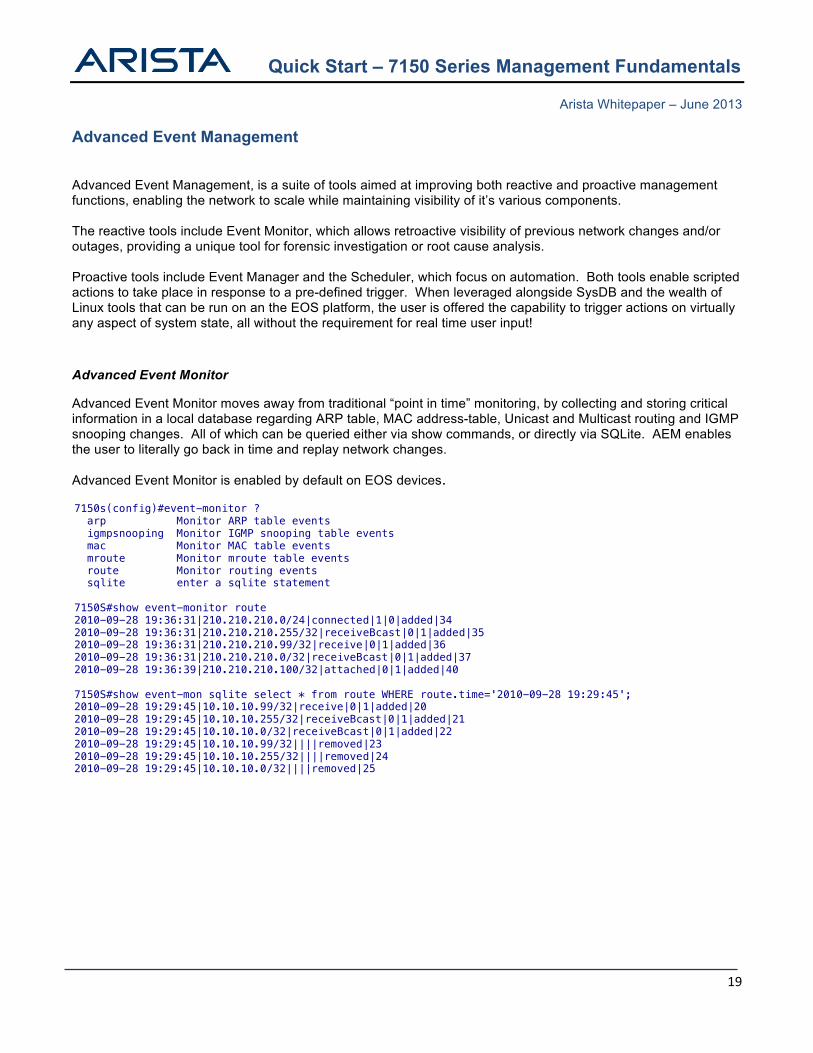
Advanced Event Management
Advanced Event Management, is a suite of tools aimed at improving both reactive and proactive management functions, enabling the network to scale while maintaining visibility of it’s various components. The reactive tools include Event Monitor, which allows retroactive visibility of previous network changes and/or outages, providing a unique tool for forensic investigation or root cause analysis. Proactive tools include Event Manager and the Scheduler, which focus on automation. Both tools enable scripted actions to take place in response to a pre-defined trigger. When leveraged alongside SysDB and the wealth of Linux tools that can be run on an the EOS platform, the user is offered the capability to trigger actions on virtually any aspect of system state, all without the requirement for real time user input! Advanced Event Monitor
Advanced Event Monitor moves away from traditional “point in time” monitoring, by collecting and storing critical information in a local database regarding ARP table, MAC address-table, Unicast and Multicast routing and IGMP snooping changes. All of which can be queried either via show commands, or directly via SQLite. AEM enables the user to literally go back in time and replay network changes.
Advanced Event Monitor is enabled by default on EOS devices.
7150s(config)#event-monitor ? arp Monitor ARP table events igmpsnooping Monitor IGMP snooping table events mac Monitor MAC table events mroute Monitor mroute table events route Monitor routing events sqlite enter a sqlite statement 7150S#show event-monitor route 2010-09-28 19:36:31|210.210.210.0/24|connected|1|0|added|34 2010-09-28 19:36:31|210.210.210.255/32|receiveBcast|0|1|added|35 2010-09-28 19:36:31|210.210.210.99/32|receive|0|1|added|36 2010-09-28 19:36:31|210.210.210.0/32|receiveBcast|0|1|added|37 2010-09-28 19:36:39|210.210.210.100/32|attached|0|1|added|40 7150S#show event-mon sqlite select * from route WHERE route.time='2010-09-28 19:29:45'; 2010-09-28 19:29:45|10.10.10.99/32|receive|0|1|added|20 2010-09-28 19:29:45|10.10.10.255/32|receiveBcast|0|1|added|21 2010-09-28 19:29:45|10.10.10.0/32|receiveBcast|0|1|added|22 2010-09-28 19:29:45|10.10.10.99/32||||removed|23 2010-09-28 19:29:45|10.10.10.255/32||||removed|24 2010-09-28 19:29:45|10.10.10.0/32||||removed|25
Quick Start – 7150 Series Management Fundamentals
Arista Whitepaper – June 2013
20
Advanced Event Manager Advanced Event Manager provides a platform to enable automation of actions in response to pre-defined event triggers. It allows the creation of an event, the definition of under which circumstances the event should trigger and what action should occur in such a situation. As of 4.12.0 Advanced Event Manager contains four types of trigger:
1) on-boot triggers an action upon device bootup. Typically this can be used to daemonize python scripts or load user configured scripts. on-boot represents the most powerful trigger mechanism, as the script you call can be run as a daemon then mount any section of SysDB, allowing you to trigger based on essentially any value or attribute.
2) on-intf, as seen in the above example. OnIntf consists of 3 pre-defined sub-triggers, Operational state, IP information or interface name. It provides an easy access trigger for events induced by some sort of change to an interface.
3) on-startup-config will trigger an action whenever any changes are made to the startup-config file. This could be used for situations such as generating an alert, or backing up the configuration whenever a change is made.
4) The final trigger vm-tracer leverages VM visibility offered through the VM Tracer feature. This trigger activates when a VM is added, removed, or moved. An example for this trigger would be having routing-policy automatically applied to your infrastructure based on the location of various virtual machines.
Once an event has been triggered the configured action will be executed, this action will be initiated natively from the Linux bash shell, which means the action is not limited by the EOS CLI syntax, but rather any function or action which can be achieved using a bash shell. Typical examples of actions would be to execute a native bash command, run a user provided shell script or execute EOS CLI commands using the FastCli program.
• Call a bash script – action bash /mnt/flash/EmailOnLinkDown • Call a python script to run as a daemon – action bash daemonize /mnt/flash/IntfMonitor • Execute a single CLI command, which sends an IM to all Network admins – action bash FastCli -p15 -c
'xmpp send NetworkAdmins command Interface Ethernet1 is down' • Execute a series of CLI commands, which bring down a particular interface – action bash FastCli -p15 -c
$'conf\n interface ethernet2\n shut' Due to the ability to trigger on anything, and carry out any action, the use cases for event-manager are incredibly vast, providing a powerful option for automating a huge range of proactive tasks, or reactive actions. One example use case would be dynamically changes the PIM DR and VRRP priority of a switch based on the presence of a nominated uplink interface. Event – PIM DR & VRRP Active Failover Trigger – If the uplinks go down, Action – Call a bash script stored in flash that reduces the PIM and VRRP priority so the impacted device is no longer the DR/Active Forwarder.
Quick Start – 7150 Series Management Fundamentals
Arista Whitepaper – June 2013
21
The contents of the drchange.sh script are included below.
A more in-depth look at event-handler can be found in the following EOS article - https://eos.aristanetworks.com/2012/01/email-alerts/
7150s(config)#event-handler pim-vrrp-switch 7150s(config-handler-pim-dr-switch)#? action Define event-handler action delay Configure event-handler delay trigger Configure event trigger condition 7150s(config-handler-pim-dr-switch)#trigger onintf Et1 operstatus 7150s(config-handler-pim-dr-switch)#action bash drchange.sh 7150s#dir Directory of flash:/ -rwx 1170 Oct 9 22:15 drchange.sh
#!/bin/bash #create an alias for the current event time NOW=$(date) #set an action for the operstate trigger if [ $OPERSTATE = "linkdown" ] ; then Cli -p 15 -c' conf t int vlan 10 ip pim dr 1 vrrp 1 pri 1 #create a syslog message for the failover event send log level notifications message DR/VRRP failover initiated by Event-handler
pim-dr-switch wr mem ' elif [ $OPERSTATE = "linkup" ] ; then Cli -p 15 -c' conf t int vlan 10 ip pim dr 1000000 vrrp 1 pri 254 #create a syslog message for the failback event send log level notifications message DR/VRRP failback initiated by Event-handler
pim-dr-switch wr mem ' fi
Quick Start – 7150 Series Management Fundamentals
Arista Whitepaper – June 2013
22
Scheduler While the Advanced Event Manager enables actions based on complex triggers, the scheduler triggers actions at regular time intervals. Scheduleder also captures the standard output of an action to compressed, timestamped file in flash, enablng the user to configure how many of these files they wish to keep at any one time and automatically deleting older copies. To create a scheduled job, a user simply defines how often a task should run, how many log file to store and what the job should be. Optionally the user can also define a time and/or date when the scheduled task should run for the first time, enabling post dated or synchronous execution of tasks over multiple devices.
Unlike Event-manager, this command is executed natively in EOS, however by prepending the ‘bash’ argument we can execute bash commands and call scripts, for example ‘command bash /mnt/flash/ConfigBackup’. By default EOS has a scheduled task configured to collect a show tech every 60 minutes and store up to 100 instances of the show tech, ensuring that platform data is available both prior and following a network issue is available to assist with analysis.
7150S#show run all | grep schedule schedule tech-support interval 60 max-log-files 100 command show tech-support
schedule <name> [at <hh:mm:ss> <mm:dd:yyyy>] interval <minutes> max-log-files <files> command <command to execute>
Quick Start – 7150 Series Management Fundamentals
Arista Whitepaper – June 2013
23
Installing and Removing EOS Extensions
The most simple and efficient way to make the most of the extensibility on which EOS is built is through the use of extensions. An extension is a pre-packaged optional feature or set of scripts in an RPM or SWIX format. A variety of extensions are available from the EOS Central page found at http://eos.aristanetworks.com. First download the desired extension and copy it onto the device’s flash.
Next copy the file from flash to the extensions partition.
Finally install the extension
As the CloudVision extension adds additional CLI commands to EOS the CLI session must be restarted in order from them to appear. To verify the extension has been installed correctly use the ‘show extensions’ command.
Note: The I in the status field indicates the extension has been installed correctly. By default the extension will not persist between reloads. If extension persistence is required the extension must also be copied into the boot-extensions file.
7150S#dir flash: Directory of flash:/ -rwx 279358978 Sep 28 19:18 EOS-4.10.0.2-7150.swi -rwx 664531 Jan 18 11:03 CloudVision-1.2.3_4.10.swix -rwx 19845 Sep 28 21:53 agents.log -rwx 33 Sep 28 19:19 boot-config drwx 4096 Sep 28 19:25 persist drwx 4096 Apr 10 01:34 schedule -rwx 1867 Sep 28 19:19 startup-config
7150S#copy flash:CloudVision-1.2.3_4.10.swix extension:
7150S#extension CloudVision-1.2.3_4.10.swix If this extension modifies the behavior of the Cli, any running Cli sessions will need to be reset in order for the Cli modifications to take effect.
7150S#sh extensions Name Version/Release Status RPMs --------------------------- ------------------------ ----- ---- CloudVision-1.2.3_4.10.swix 1.2.3/772419.EOS410XMPP A, I 2 A: available | NA: not available | I: installed | NI: not installed | F: forced
7150S#copy installed-extensions boot-extensions
Quick Start – 7150 Series Management Fundamentals
Arista Whitepaper – June 2013
24
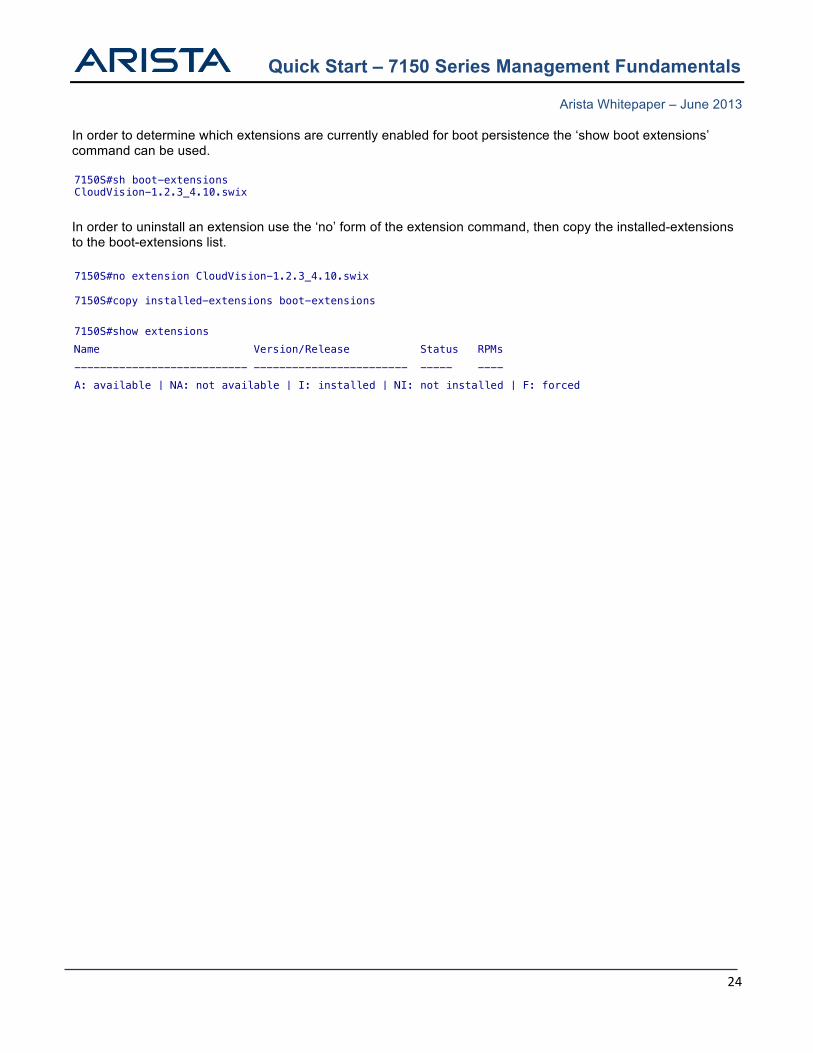
In order to determine which extensions are currently enabled for boot persistence the ‘show boot extensions’ command can be used.
In order to uninstall an extension use the ‘no’ form of the extension command, then copy the installed-extensions to the boot-extensions list.
7150S#sh boot-extensions CloudVision-1.2.3_4.10.swix
7150S#no extension CloudVision-1.2.3_4.10.swix 7150S#copy installed-extensions boot-extensions 7150S#show extensions Name Version/Release Status RPMs --------------------------- ------------------------ ----- ---- A: available | NA: not available | I: installed | NI: not installed | F: forced
Quick Start – 7150 Series Management Fundamentals
Arista Whitepaper – June 2013
25
sFlow
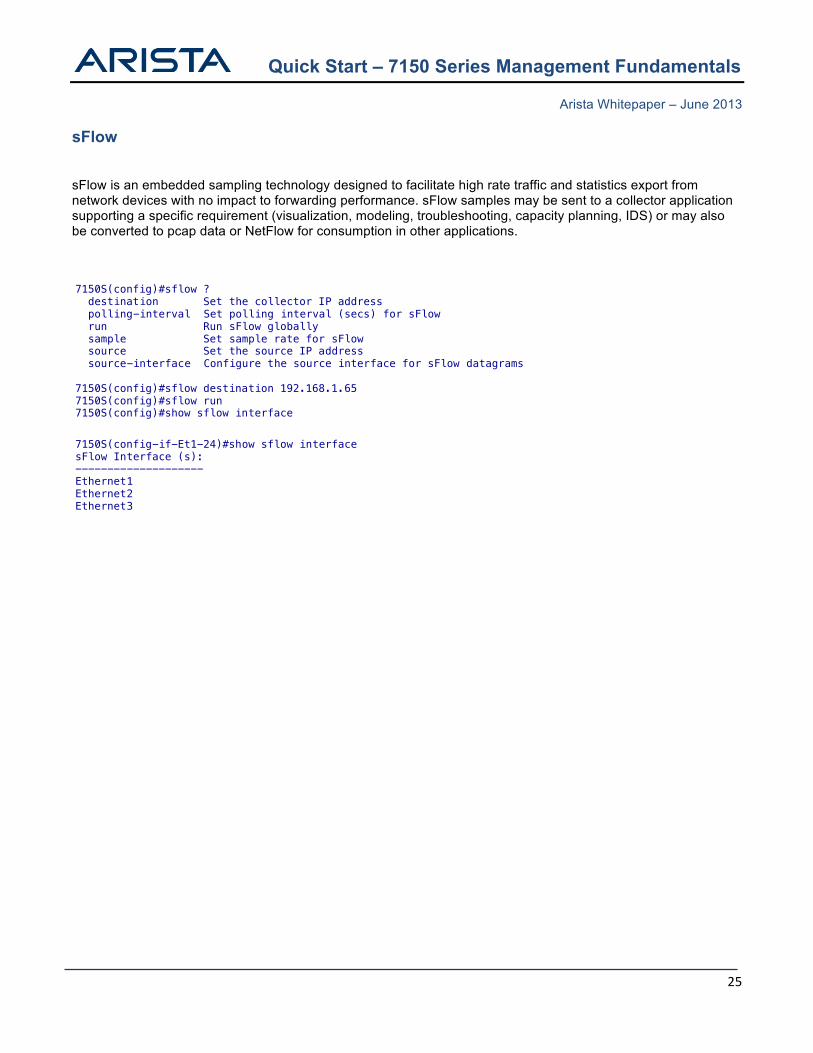
sFlow is an embedded sampling technology designed to facilitate high rate traffic and statistics export from network devices with no impact to forwarding performance. sFlow samples may be sent to a collector application supporting a specific requirement (visualization, modeling, troubleshooting, capacity planning, IDS) or may also be converted to pcap data or NetFlow for consumption in other applications.
7150S(config)#sflow ? destination Set the collector IP address polling-interval Set polling interval (secs) for sFlow run Run sFlow globally sample Set sample rate for sFlow source Set the source IP address source-interface Configure the source interface for sFlow datagrams 7150S(config)#sflow destination 192.168.1.65 7150S(config)#sflow run 7150S(config)#show sflow interface 7150S(config-if-Et1-24)#show sflow interface sFlow Interface (s): -------------------- Ethernet1 Ethernet2 Ethernet3 :
Quick Start – 7150 Series Management Fundamentals
Arista Whitepaper – June 2013
26
Port Mirroring
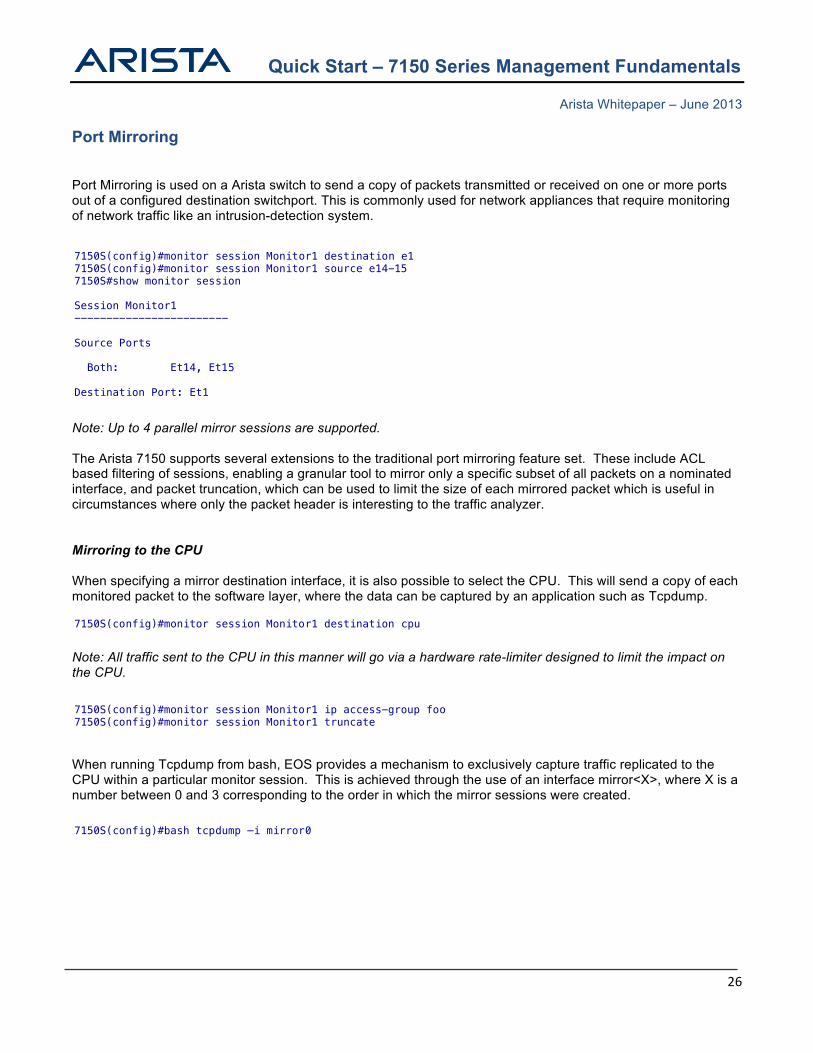
Port Mirroring is used on a Arista switch to send a copy of packets transmitted or received on one or more ports out of a configured destination switchport. This is commonly used for network appliances that require monitoring of network traffic like an intrusion-detection system.
Note: Up to 4 parallel mirror sessions are supported. The Arista 7150 supports several extensions to the traditional port mirroring feature set. These include ACL based filtering of sessions, enabling a granular tool to mirror only a specific subset of all packets on a nominated interface, and packet truncation, which can be used to limit the size of each mirrored packet which is useful in circumstances where only the packet header is interesting to the traffic analyzer. Mirroring to the CPU When specifying a mirror destination interface, it is also possible to select the CPU. This will send a copy of each monitored packet to the software layer, where the data can be captured by an application such as Tcpdump.
Note: All traffic sent to the CPU in this manner will go via a hardware rate-limiter designed to limit the impact on the CPU.
When running Tcpdump from bash, EOS provides a mechanism to exclusively capture traffic replicated to the CPU within a particular monitor session. This is achieved through the use of an interface mirror<X>, where X is a number between 0 and 3 corresponding to the order in which the mirror sessions were created.
7150S(config)#monitor session Monitor1 destination e1 7150S(config)#monitor session Monitor1 source e14-15 7150S#show monitor session Session Monitor1 ------------------------ Source Ports Both: Et14, Et15 Destination Port: Et1
7150S(config)#monitor session Monitor1 ip access-group foo 7150S(config)#monitor session Monitor1 truncate
7150S(config)#monitor session Monitor1 destination cpu
7150S(config)#bash tcpdump –i mirror0
Quick Start – 7150 Series Management Fundamentals
Arista Whitepaper – June 2013
27
LANZ
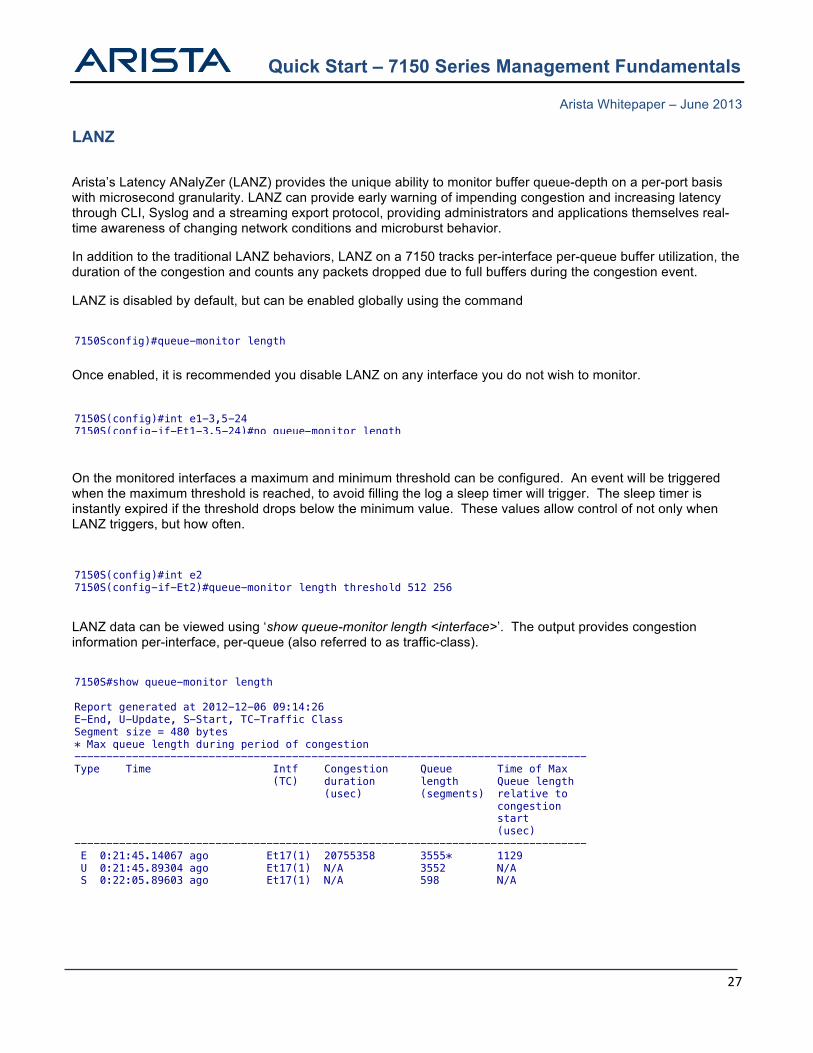
Arista’s Latency ANalyZer (LANZ) provides the unique ability to monitor buffer queue-depth on a per-port basis with microsecond granularity. LANZ can provide early warning of impending congestion and increasing latency through CLI, Syslog and a streaming export protocol, providing administrators and applications themselves real-time awareness of changing network conditions and microburst behavior.
In addition to the traditional LANZ behaviors, LANZ on a 7150 tracks per-interface per-queue buffer utilization, the duration of the congestion and counts any packets dropped due to full buffers during the congestion event.
LANZ is disabled by default, but can be enabled globally using the command
Once enabled, it is recommended you disable LANZ on any interface you do not wish to monitor.
On the monitored interfaces a maximum and minimum threshold can be configured. An event will be triggered when the maximum threshold is reached, to avoid filling the log a sleep timer will trigger. The sleep timer is instantly expired if the threshold drops below the minimum value. These values allow control of not only when LANZ triggers, but how often.
LANZ data can be viewed using ‘show queue-monitor length <interface>’. The output provides congestion information per-interface, per-queue (also referred to as traffic-class).
7150Sconfig)#queue-monitor length
7150S(config)#int e1-3,5-24 7150S(config-if-Et1-3,5-24)#no queue-monitor length
7150S(config)#int e2 7150S(config-if-Et2)#queue-monitor length threshold 512 256
7150S#show queue-monitor length Report generated at 2012-12-06 09:14:26 E-End, U-Update, S-Start, TC-Traffic Class Segment size = 480 bytes * Max queue length during period of congestion -------------------------------------------------------------------------------- Type Time Intf Congestion Queue Time of Max (TC) duration length Queue length (usec) (segments) relative to congestion start (usec) -------------------------------------------------------------------------------- E 0:21:45.14067 ago Et17(1) 20755358 3555* 1129 U 0:21:45.89304 ago Et17(1) N/A 3552 N/A S 0:22:05.89603 ago Et17(1) N/A 598 N/A
Quick Start – 7150 Series Management Fundamentals
Arista Whitepaper – June 2013
28
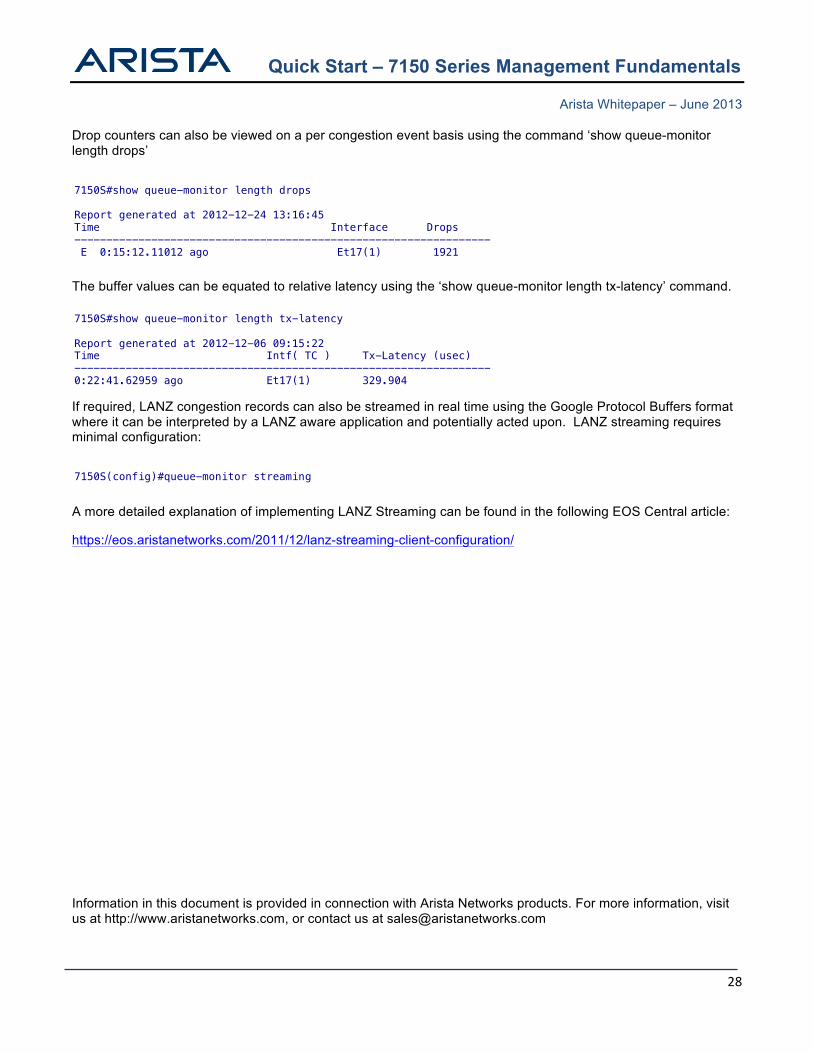
Drop counters can also be viewed on a per congestion event basis using the command ‘show queue-monitor length drops’
The buffer values can be equated to relative latency using the ‘show queue-monitor length tx-latency’ command.
If required, LANZ congestion records can also be streamed in real time using the Google Protocol Buffers format where it can be interpreted by a LANZ aware application and potentially acted upon. LANZ streaming requires minimal configuration:
A more detailed explanation of implementing LANZ Streaming can be found in the following EOS Central article:
https://eos.aristanetworks.com/2011/12/lanz-streaming-client-configuration/
Information in this document is provided in connection with Arista Networks products. For more information, visit us at http://www.aristanetworks.com, or contact us at [email protected]
7150S#show queue-monitor length tx-latency Report generated at 2012-12-06 09:15:22 Time Intf( TC ) Tx-Latency (usec) ----------------------------------------------------------------- 0:22:41.62959 ago Et17(1) 329.904
7150S#show queue-monitor length drops Report generated at 2012-12-24 13:16:45 Time Interface Drops ----------------------------------------------------------------- E 0:15:12.11012 ago Et17(1) 1921
7150S(config)#queue-monitor streaming


![NAME SYNOPSIS −AdDeflLnNOpqRStuUvxX ][esj/cnt4504/reading/tcpdump.1.pdf · TCPDUMP(8) TCPDUMP(8) Algorithms may bedes-cbc, 3des-cbc, blowfish-cbc, rc3-cbc, cast128-cbc,ornone.The](https://img.pdfslide.us/doc/110x75/604e8bc7dec7c8115c72cbfe/name-synopsis-aaddeilnnopqrstuuvxx-esjcnt4504readingtcpdump1pdf-tcpdump8.jpg)