Embed Size (px)
Citation preview
2016 Biennial Assessment and Overview of Climate Finance Flows
1
I. CONTEXT AND MANDATES
The Standing Committee on Finance (SCF) assists
the Conference of the Parties (COP) in exercising its
functions with respect to the Financial Mechanism
of the Convention, including, inter alia, in terms of
measurement, reporting and verification of support
provided to developing country Parties, through activities
such as the biennial assessment and overview of climate
finance flows (BA).1
Subsequent to the 2014 BA, the COP requested the SCF to
consider: the relevant work of other bodies and entities on
measurement, reporting and verification of support and
the tracking of climate finance;2 ways of strengthening
methodologies for reporting climate finance;3 and ongoing
technical work on operational definitions of climate
finance, including private finance mobilized by public
interventions, to assess how adaptation and mitigation
needs can most effectively be met by climate finance.4
It also requested the Ad Hoc Working Group on the
Paris Agreement (APA), when developing the modalities,
procedures and guidelines for the transparency framework
for action and support, to consider, inter alia, information
in the BA and other reports of the SCF and other relevant
bodies under the Convention.
The 2016 BA outlines improvements made and identifies
areas for further improvements in the UNFCCC
reporting guidelines and formats for developed and
developing countries and for improvements in climate
finance tracking and reporting of data producers
and aggregators. The BA presents estimates of flows
from developed to developing countries, available
information on domestic climate finance and South–
South cooperation, as well as the other climate-related
flows that constitute global total climate finance flows. It
then considers the implications of these flows, including
composition, purpose and emergent trends relevant to
the UNFCCC objectives, including the new goals set out in
the Paris Agreement.
The 2016 BA comprises this summary and
recommendations, and a technical report. The summary
and recommendations was prepared by the SCF. The
technical report was prepared by experts under the
guidance of the SCF, and draws on information and
data from a range of sources. It was subject to extensive
stakeholder input and expert review, but remains a
product of the external experts.
II. CHALLENGES AND LIMITATIONS
The 2016 BA presents a picture of climate finance to
the extent possible. Due diligence has been undertaken
to utilize the best information available from the
most credible sources. Challenges were nevertheless
encountered in collecting, aggregating and analysing
information from diverse sources. The limited clarity
with regard to the use of different definitions of climate
finance limits comparability of data.
1) Decision 2/CP.17, paragraph 121(f).
2) Decision 1/CP.18, paragraph 71.
3) Decision 5/CP.18, paragraph 11.
4) Decision 3/CP.19, paragraph 11.
2016 Biennial Assessment and Overview of Climate Finance Flows
Summary and recommendations by the Standing Committee on Finance on the 2016 biennial assessment and overview of climate finance flows
UNFCCC Standing Committee on Finance
2
5) Decision 2/CP.17.
6) Ibid.
There are uncertainties associated with each source
of data, and these have different underlying causes.
Uncertainties are related to the data on domestic public
investments, resulting from the lack of geographic
coverage and differences in the way methods are applied,
significant changes in the methods for estimating energy
efficiency every few years and the lack of available data
on sustainable private transport and other key sectors.
Uncertainties also arise from the lack of procedures
and data to determine private climate finance, methods
for estimating adaptation finance, differences in the
assumptions of underlying formulas to attribute finance
from multilateral development banks (MDBs) to developed
countries, the classification of data as ‘green finance’ and
incomplete data on non-concessional flows.
The limitations outlined above need to be taken into
consideration when deriving conclusions and policy
implications from this BA. The SCF will contribute,
through its activities, to the progressive improvement of
the measurement, reporting and verification of climate
finance information in future BAs, to help address these
challenges.
III. KEY FINDINGS
Methodological issues relating to measurement, reporting and verification of public and private climate finance
Improvements made in tracking and reporting of climate finance since the 2014 biennial assessment and overview of climate finance flows
Following the recommendations made by the SCF in the
2014 BA, the 2016 BA identifies the improvements listed
below in the tracking and reporting of information on
climate finance:
Developed countries
(a) Enabling Parties to provide additional information
on their underlying definitions, methodologies
and assumptions used, including on how they have
identified finance as being “climate-specific”, as
well as making these data more accessible to the
public and recipient Parties, thereby enhancing
consistency and transparency;
(b) Improving guidance on application of the Rio
Markers for adaptation and mitigation and
adjustments to the Rio Marker definitions for
adaptation;
International organizations
(c) Making available MDB and multilateral climate
fund activity-level data through the Development
Assistance Committee (DAC) of the Organisation
for Economic Co-operation and Development
(OECD);
(d) Applying common principles for tracking
mitigation and adaptation finance by MDBs and
International Development Finance Club (IDFC)
members;
(e) Making available data on climate co-financing
flows through utilization of a joint methodology for
tracking public and private climate co-finance by a
consortium of seven MDBs.
Insights into reporting by developed countries and developing countries
The current biennial report (BR) guidelines5 were
designed to accommodate reporting on a wide range of
climate finance instruments and activities. This required
a reporting architecture that was flexible enough to
accommodate a diversity of reporting approaches. In
some cases, limited clarity with regard to the diversity
in reporting approaches limits comparability in
climate finance reporting. Further improvements in
reporting guidelines and formats are needed to enhance
transparency on the approaches used by individual
Parties and to enable greater comparability across
reporting by Parties.
Current biennial update report (BUR) guidelines6
for reporting by developing countries on financial,
technical and capacity-building needs and support
received do not require information on the underlying
assumptions, definitions and methodologies used
in generating the information. Limited institutional
capacity to track climate finance received, as well as
the lack of data, can pose challenges in developing
country reporting.
Insights into broader reporting aspects
Information on domestic climate-related finance is
available including through a few BURs, Climate Public
Expenditure and Institutional Reviews (CPEIRs) and
other independent studies. However, such information is
difficult to compare.
There is a lack of systematic collection of data on climate-
related private finance flows globally, due to difficulties
in identifying climate-related finance, restrictions based
on confidentiality, and conceptual and accounting issues.
2016 Biennial Assessment and Overview of Climate Finance Flows
3
The primary sources cover mainly renewable energy and
draw upon industry and sector databases, relying on
voluntary disclosures. Efforts to develop methodologies
for estimating mobilized private finance by public
interventions are under way by the OECD DAC and the
Research Collaborative on Tracking Private Climate
Finance.
Ongoing efforts at the international and national
levels aimed at improving climate-related financial risk
disclosures are important for improving the transparency
and promoting the alignment of finance and investment
flows in accordance with Article 2.1(c) of the Paris
Agreement.
Insights related to review of climate finance information
Practices exist within the UNFCCC to review the
information on support provided by Parties, including
the international assessment and review of BRs and
the international consultation and analysis of BURs.
However, there are no internationally agreed methods for
reconciling financial support provided against support
received. Also, MDBs and IDFC do not have a standard
procedure to review their climate finance data. In
addition, BRs are not reviewed in time for aggregating
data for the BAs.
Overview of current climate finance flows in 2013–2014
Flows from developed to developing countries as reported in biennial reports
USD 25.4 billion in 2013 and USD 26.6 billion in 2014 of
climate-specific finance was reported in BRs, of which
USD 23.1 billion in 2013 and USD 23.9 billion in 2014
was channelled through bilateral, regional and other
channels (see Figure 1). This represents an increase of
about 50% from public finance reported through the
same channels in 2011–2012.
Multilateral climate funds
USD 1.9 billion in 2013 and USD 2.5 billion in 2014 was
channelled through the UNFCCC funds and multilateral
climate funds on the basis of their financial reports.
Although this is a small share of the total climate
finance, information on their activities is mostly
complete.
Climate finance from multilateral development banks
Climate finance provided by MDBs to developing
countries from their own resources was reported as
USD 20.8 billion in 2013 and USD 25.7 billion in 2014.
The methodology used in the 2014 BA to attribute
MDB finance from developed countries to developing
countries suggests that USD 11.4 billion in 2013 and
USD 12.7 billion in 2014 was delivered by developed
countries. A more advanced methodology, which
captures better the mobilization effect through the
MDBs, suggests that USD 14.9 billion in 2013 and USD
16.6 billion in 2014 can be attributed to developed
countries.
Private climate finance
The major source of uncertainty regarding flows to
developing countries relates to the amount of private
climate finance provided. Initial partial estimates of
direct and mobilized private finance are available.
Based on project-level data, renewable energy finance
by developed country companies in developing
countries is estimated at USD 1.8 billion in 2013 and
USD 2.1 billion in 2014. Foreign direct investment
in greenfield alternative and renewable energy in
developing countries was estimated at USD 26.4 billion
in 2013 and USD 21.6 billion in 2014. Both estimates
are likely to be conservative. OECD and the Climate
Policy Initiative (CPI) compiled an initial partial
estimate of private finance mobilized by developed
countries and identified USD 12.8 billion in 2013
and USD 16.7 billion in 2014 of private co-finance.
These figures include private finance mobilized from
international sources in addition to private finance
mobilized domestically in developing countries.
These partial estimates of direct private finance and
mobilized finance are distinct, and cannot simply be
aggregated.
Instruments
The mix of instruments used to channel support
differs by funding source (see table 1). About 35% of
the bilateral, regional and other finance reported
to the UNFCCC in BRs is spent as grants, 20% as
concessional loans, 10% as non-concessional loans, and
the remainder through equity and other instruments.
About 38% of the reported finance is channelled
through multilateral institutions, many of whom
are MDBs that utilize capital contributions and
commitments from member countries to raise low-
cost capital from other sources of funding, including
for donor contributions. This enables MDBs to offer a
range of instruments and financial products, including
grants (9%), loans, including concessional loans, (83%),
equity (2%) and other instruments (6%). About 53% of
funding from multilateral climate funds is provided
as grants, and the remainder is largely concessional
loans, which have increased as a share of approved
funding over time. 49% of bilateral climate finance
reported to the OECD is provided as grants, and 47%
as concessional loans.
Recipients
Climate finance goes to a wide range of governmental,
private and non-governmental entities in recipient
UNFCCC Standing Committee on Finance
4
countries. However, reporting on recipient institutions is
incomplete. For example, recipient data are available for
about 50% of the bilateral finance reported to the OECD
DAC. For 2013–2014, developing country governments
are specified as the recipients of about 40% of the
total flow. Climate finance channelled through other
intermediaries may also reach national governments,
but this is not captured in the data. Improving data on
the recipients of climate finance could be an area for
further work.
Global finance flows
On a comparable basis, global total climate finance has
increased by almost 15% since 2011–2012. In dollar terms
estimated global total climate finance increased from a
high bound estimate of USD 650 billion for 2011–2012
to USD 687 billion for 2013 and to 741 billion for 2014.
Private investment in renewable energy and energy
efficiency represents the largest share of the global total;
however, the energy efficiency data are much less certain
than the renewable energy data. Levels of finance have
increased as the costs of clean technology have continued
to fall. The coverage of data in the 2016 BA has increased
and improved since the 2014 BA, but nevertheless the
quality and completeness of data on global total flows are
lower than those for flows to developing countries.
The estimate of global total climate finance in the
2016 BA includes adjustments to the CPI estimate that
were not part of the 2011–2012 estimate reported in
the 2014 BA. Partial data on domestic public finance
expenditures of USD 192 billion per year were compiled.
If these additional adjustments are included, they raise
the upper end of the range to USD 880 billion in 2013
and USD 930 billion in 2014. However, the volume of the
climate-related finance and investment flows globally
may be higher, given that there are still significant
data gaps in critical sectors such as sustainable
transportation, agriculture, energy efficiency and
resilient infrastructure.
Domestic climate finance: Comprehensive data on
domestic climate expenditures are not available.
Limited information is included in the BURs; estimates
of climate-related finance included in national
budgets, domestic climate finance provided by national
development banks and commitments by developing
country national climate funds. These indicative
estimates suggest flows of USD 192 billion per year in
developed and developing countries.
Some studies suggest that most climate finance in
aggregate is mobilized and deployed domestically, both
in developed and developing countries. In the limited
number of developing countries for which information
on domestic public climate finance is available,
the data suggest that, in these countries, domestic
public finance significantly exceeds the inflows of
international public climate finance from bilateral and
multilateral sources.
South–South cooperation: Data are limited, and mainly
sourced from the OECD DAC, complemented with reports
from a small number of other countries. On this basis,
South–South cooperation was estimated to be in the
range USD 5.9–9.1 billion for 2013 and USD 7.2–11.7
billion for 2014, of which about half was channelled
through multilateral institutions.
Assessment of climate finance flows
An assessment of the data underlying the overview of
climate finance flows offers insights into key questions
of interest in the context of the UNFCCC negotiations,
including support for adaptation and mitigation, levels
of finance for different regions and how finance is
delivered. Key features of different channels of climate
finance for developing countries are summarized in
table 1.
Mitigation-focused finance represented more than 70%
of the public finance in developing countries reported
in 2013 and 2014. Adaptation finance provided to
developing countries accounted for about 25% of the total
finance. This is similar to 2011–2012, although there has
been a slight increase in the proportion of adaptation
finance from climate funds and bilateral concessional
channels. More than 80% of MDB investments focused on
mitigation, and less than 20% on adaptation.
There has been a significant role for grants in
adaptation finance. Grants represent 88% of
adaptation finance approved climate funds and 56%
of the bilateral finance reported to the OECD DAC
with adaptation as a principal objective. Some least
developed countries and small island developing
States in Africa and Asia have been among the largest
recipients of adaptation finance.
About 33% of funding from dedicated climate funds,
42% of climate-related finance in the OECD DAC and
31% of climate finance reported by MDBs is for Asia,
often in countries with attractive investment climates.
This funding has largely supported mitigation,
including REDD-plus7, reflecting the significant
7) In decision 1/CP.16, paragraph 70, the COP encouraged developing country Parties to contribute to mitigation actions in the forest sector by undertaking the following activities: reducing emissions from deforestation; reducing emissions from forest degradation; conservation of forest carbon stocks; sustainable management of forests; and enhancement of forest carbon stocks.
2016 Biennial Assessment and Overview of Climate Finance Flows
5
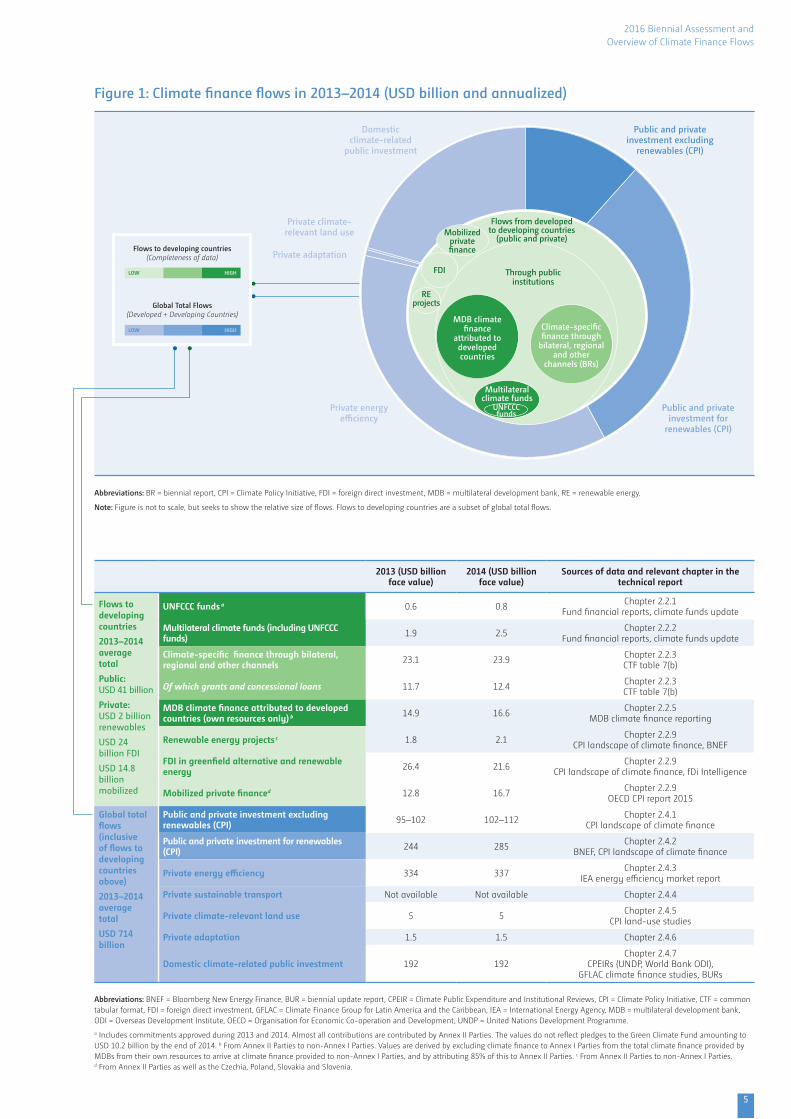
Figure 1: Climate finance flows in 2013–2014 (USD billion and annualized)
Global Total Flows (Developed + Developing Countries)
Flows to developing countries(Completeness of data)
LOW HIGH
LOW HIGH
Flows from developed to developing countries
(public and private)Mobilized
private �nance
MDB climate �nance
attributed to developed countries
Climate-speci�c �nance through
bilateral, regional and other
channels (BRs)
Multilateral climate funds
UNFCCC funds
Through public institutions
Public and private investment for
renewables (CPI)
Public and private investment excluding
renewables (CPI)
Domestic climate-related
public investment
Private climate-relevant land use
Private energy efficiency
Private adaptation
FDI
RE projects
Abbreviations:
BR = biennial report, CPI = Climate Policy Initiative, FDI = foreign direct investment,
MDB = multilateral development bank, RE = renewable energy.
2013 (USD billion face value)
2014 (USD billion face value)
Sources of data and relevant chapter in the technical report
Flows to developing countries
2013–2014 average total
Public: USD 41 billion
Private: USD 2 billion renewables
USD 24 billion FDI
USD 14.8 billion mobilized
UNFCCC funds a 0.6 0.8 Chapter 2.2.1Fund financial reports, climate funds update
Multilateral climate funds (including UNFCCC funds) 1.9 2.5 Chapter 2.2.2
Fund financial reports, climate funds update
Climate-specific finance through bilateral, regional and other channels 23.1 23.9 Chapter 2.2.3
CTF table 7(b)
Of which grants and concessional loans 11.7 12.4 Chapter 2.2.3CTF table 7(b)
MDB climate finance attributed to developed countries (own resources only) b 14.9 16.6 Chapter 2.2.5
MDB climate finance reporting
Renewable energy projects c 1.8 2.1 Chapter 2.2.9CPI landscape of climate finance, BNEF
FDI in greenfield alternative and renewable energy 26.4 21.6 Chapter 2.2.9
CPI landscape of climate finance, fDi Intelligence
Mobilized private financed 12.8 16.7 Chapter 2.2.9OECD CPI report 2015
Global total flows (inclusive of flows to developing countries above)
2013–2014 average total
USD 714 billion
Public and private investment excluding renewables (CPI) 95–102 102–112 Chapter 2.4.1
CPI landscape of climate finance
Public and private investment for renewables (CPI) 244 285 Chapter 2.4.2
BNEF, CPI landscape of climate finance
Private energy efficiency 334 337 Chapter 2.4.3IEA energy efficiency market report
Private sustainable transport Not available Not available Chapter 2.4.4
Private climate-relevant land use 5 5 Chapter 2.4.5CPI land-use studies
Private adaptation 1.5 1.5 Chapter 2.4.6
Domestic climate-related public investment 192 192Chapter 2.4.7
CPEIRs (UNDP, World Bank ODI), GFLAC climate finance studies, BURs
Abbreviations: BNEF = Bloomberg New Energy Finance, BUR = biennial update report, CPEIR = Climate Public Expenditure and Institutional Reviews, CPI = Climate Policy Initiative, CTF = common tabular format, FDI = foreign direct investment, GFLAC = Climate Finance Group for Latin America and the Caribbean, IEA = International Energy Agency, MDB = multilateral development bank, ODI = Overseas Development Institute, OECD = Organisation for Economic Co-operation and Development, UNDP = United Nations Development Programme.
a Includes commitments approved during 2013 and 2014. Almost all contributions are contributed by Annex II Parties. The values do not reflect pledges to the Green Climate Fund amounting to USD 10.2 billion by the end of 2014. b From Annex II Parties to non-Annex I Parties. Values are derived by excluding climate finance to Annex I Parties from the total climate finance provided by MDBs from their own resources to arrive at climate finance provided to non-Annex I Parties, and by attributing 85% of this to Annex II Parties. c From Annex II Parties to non-Annex I Parties. d From Annex II Parties as well as the Czechia, Poland, Slovakia and Slovenia.
Abbreviations: BR = biennial report, CPI = Climate Policy Initiative, FDI = foreign direct investment, MDB = multilateral development bank, RE = renewable energy.
Note: Figure is not to scale, but seeks to show the relative size of flows. Flows to developing countries are a subset of global total flows.
UNFCCC Standing Committee on Finance
6
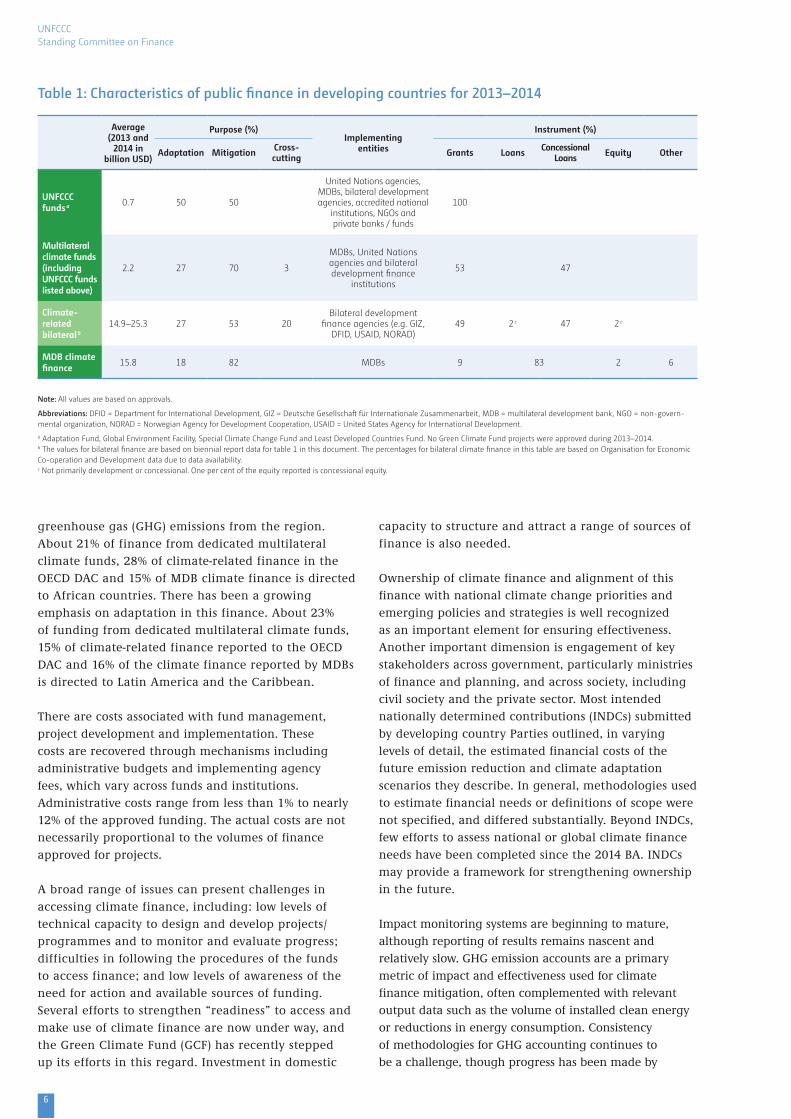
Average (2013 and
2014 in billion USD)
Purpose (%)Implementing
entities
Instrument (%)
Adaptation Mitigation Cross-cutting Grants Loans Concessional
Loans Equity Other
UNFCCC funds a 0.7 50 50
United Nations agencies, MDBs, bilateral development agencies, accredited national
institutions, NGOs and private banks / funds
100
Multilateral climate funds (including UNFCCC funds listed above)
2.2 27 70 3
MDBs, United Nations agencies and bilateral development finance
institutions
53 47
Climate-related bilateral b
14.9–25.3 27 53 20Bilateral development
finance agencies (e.g. GIZ, DFID, USAID, NORAD)
49 2 c 47 2 c
MDB climate finance
15.8 18 82 MDBs 9 83 2 6
Table 1: Characteristics of public finance in developing countries for 2013–2014
Note: All values are based on approvals.
Abbreviations: DFID = Department for International Development, GIZ = Deutsche Gesellschaft für Internationale Zusammenarbeit, MDB = multilateral development bank, NGO = non-govern-mental organization, NORAD = Norwegian Agency for Development Cooperation, USAID = United States Agency for International Development.
a Adaptation Fund, Global Environment Facility, Special Climate Change Fund and Least Developed Countries Fund. No Green Climate Fund projects were approved during 2013–2014. b The values for bilateral finance are based on biennial report data for table 1 in this document. The percentages for bilateral climate finance in this table are based on Organisation for Economic Co-operation and Development data due to data availability. c Not primarily development or concessional. One per cent of the equity reported is concessional equity.
greenhouse gas (GHG) emissions from the region.
About 21% of finance from dedicated multilateral
climate funds, 28% of climate-related finance in the
OECD DAC and 15% of MDB climate finance is directed
to African countries. There has been a growing
emphasis on adaptation in this finance. About 23%
of funding from dedicated multilateral climate funds,
15% of climate-related finance reported to the OECD
DAC and 16% of the climate finance reported by MDBs
is directed to Latin America and the Caribbean.
There are costs associated with fund management,
project development and implementation. These
costs are recovered through mechanisms including
administrative budgets and implementing agency
fees, which vary across funds and institutions.
Administrative costs range from less than 1% to nearly
12% of the approved funding. The actual costs are not
necessarily proportional to the volumes of finance
approved for projects.
A broad range of issues can present challenges in
accessing climate finance, including: low levels of
technical capacity to design and develop projects/
programmes and to monitor and evaluate progress;
difficulties in following the procedures of the funds
to access finance; and low levels of awareness of the
need for action and available sources of funding.
Several efforts to strengthen “readiness” to access and
make use of climate finance are now under way, and
the Green Climate Fund (GCF) has recently stepped
up its efforts in this regard. Investment in domestic
capacity to structure and attract a range of sources of
finance is also needed.
Ownership of climate finance and alignment of this
finance with national climate change priorities and
emerging policies and strategies is well recognized
as an important element for ensuring effectiveness.
Another important dimension is engagement of key
stakeholders across government, particularly ministries
of finance and planning, and across society, including
civil society and the private sector. Most intended
nationally determined contributions (INDCs) submitted
by developing country Parties outlined, in varying
levels of detail, the estimated financial costs of the
future emission reduction and climate adaptation
scenarios they describe. In general, methodologies used
to estimate financial needs or definitions of scope were
not specified, and differed substantially. Beyond INDCs,
few efforts to assess national or global climate finance
needs have been completed since the 2014 BA. INDCs
may provide a framework for strengthening ownership
in the future.
Impact monitoring systems are beginning to mature,
although reporting of results remains nascent and
relatively slow. GHG emission accounts are a primary
metric of impact and effectiveness used for climate
finance mitigation, often complemented with relevant
output data such as the volume of installed clean energy
or reductions in energy consumption. Consistency
of methodologies for GHG accounting continues to
be a challenge, though progress has been made by
2016 Biennial Assessment and Overview of Climate Finance Flows
7
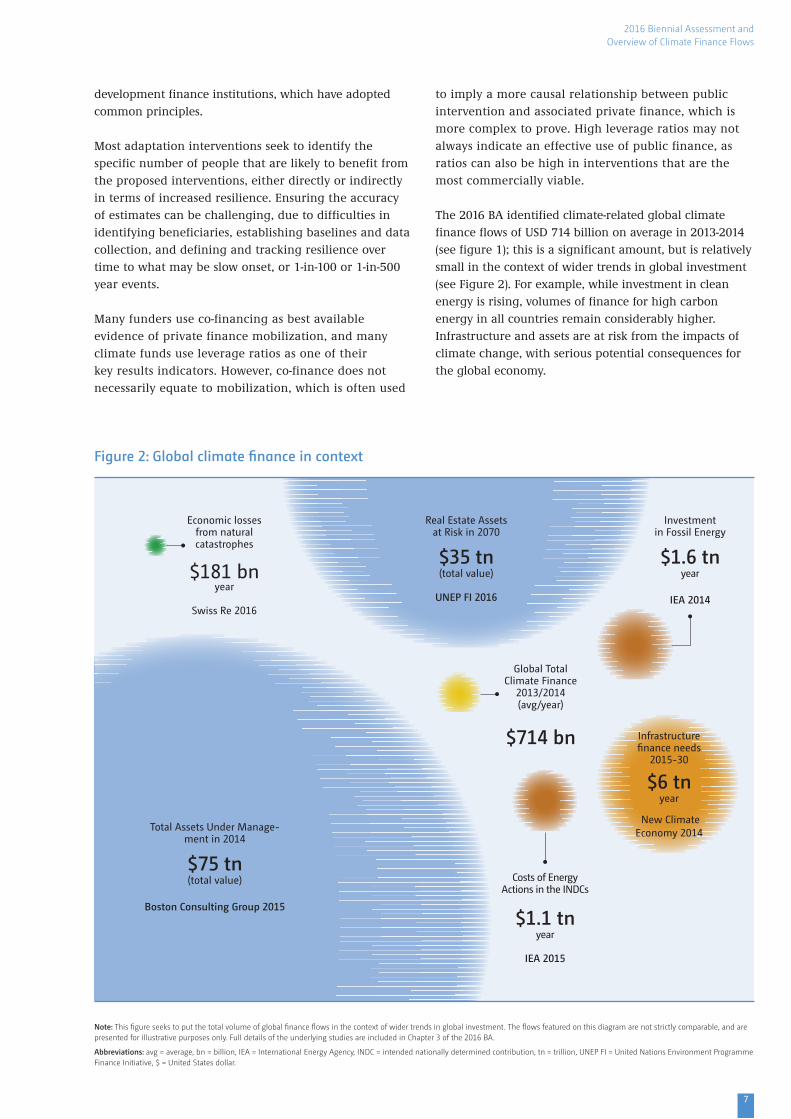
Figure 2: Global climate finance in context
Note: This figure seeks to put the total volume of global finance flows in the context of wider trends in global investment. The flows featured on this diagram are not strictly comparable, and are presented for illustrative purposes only. Full details of the underlying studies are included in Chapter 3 of the 2016 BA.
Abbreviations: avg = average, bn = billion, IEA = International Energy Agency, INDC = intended nationally determined contribution, tn = trillion, UNEP FI = United Nations Environment Programme Finance Initiative, $ = United States dollar.
Total Assets Under Manage-ment in 2014
$75 tn(total value)
Boston Consulting Group 2015
Real Estate Assets at Risk in 2070
$35 tn (total value)
UNEP FI 2016
Infrastructure �nance needs
2015-30
$6 tnyear
New Climate Economy 2014
Global Total Climate Finance
2013/2014 (avg/year)
$714 bn
Investment in Fossil Energy
$1.6 tn year
IEA 2014
Costs of Energy Actions in the INDCs
$1.1 tnyear
IEA 2015
Economic losses from natural catastrophes
$181 bnyear
Swiss Re 2016
development finance institutions, which have adopted
common principles.
Most adaptation interventions seek to identify the
specific number of people that are likely to benefit from
the proposed interventions, either directly or indirectly
in terms of increased resilience. Ensuring the accuracy
of estimates can be challenging, due to difficulties in
identifying beneficiaries, establishing baselines and data
collection, and defining and tracking resilience over
time to what may be slow onset, or 1-in-100 or 1-in-500
year events.
Many funders use co-financing as best available
evidence of private finance mobilization, and many
climate funds use leverage ratios as one of their
key results indicators. However, co-finance does not
necessarily equate to mobilization, which is often used
to imply a more causal relationship between public
intervention and associated private finance, which is
more complex to prove. High leverage ratios may not
always indicate an effective use of public finance, as
ratios can also be high in interventions that are the
most commercially viable.
The 2016 BA identified climate-related global climate
finance flows of USD 714 billion on average in 2013-2014
(see figure 1); this is a significant amount, but is relatively
small in the context of wider trends in global investment
(see Figure 2). For example, while investment in clean
energy is rising, volumes of finance for high carbon
energy in all countries remain considerably higher.
Infrastructure and assets are at risk from the impacts of
climate change, with serious potential consequences for
the global economy.
UNFCCC Standing Committee on Finance
8
IV. RECOMMENDATIONS
The SCF invites the COP to consider the following
recommendations:
(a) Invite Parties, the APA, the Subsidiary Body for
Scientific and Technological Advice, the Subsidiary
Body for Implementation and other relevant bodies
under the Convention to consider the 2016 BA,
particularly its key findings, in order to improve
guidelines for the preparation and reporting of
financial information,8 as well as to develop the
modalities, procedures and guidelines, as appropriate,
for the transparency of support in accordance with
Articles 9 and 13 of the Paris Agreement;
(b) Request the SCF, in fulfilling its function on
measurement, reporting and verification of support,
and in the context of its workplan, to cooperate with
relevant institutions and experts and to consider
ongoing work under the Convention;
Engaging with international organizations and the
private sector
(c) Encourage climate finance providers to enhance the
availability of granular, country-level data and for
the UNFCCC secretariat to make such information
more accessible, including via enhanced web-based
data platforms;
(d) Encourage relevant institutions and experts,
including from the private sector, to devise practical
options for estimating and collecting data on private
climate finance, taking into consideration ongoing
work by the OECD Research Collaborative on
Tracking Private Climate Finance and by MDBs;
Ownership, needs and impact
(e) Encourage developing countries to take advantage of the
resources available through the operating entities of the
Financial Mechanism to strengthen their institutional
capacity to programme their priority climate actions as
well as to track and report climate finance;
(f) Request the SCF in preparing future BAs to assess
available information on investment needs and
plans related to Parties’ nationally determined
contributions and national adaptation plans;
(g) Encourage Parties and relevant international
institutions to enhance the availability of information
that will be necessary for tracking global progress on
the goals outlined in Article 2 of the Paris Agreement;
(h) Invite the Board of the GCF to consider information
in the BA in its annual dialogues with climate
finance delivery channels in order to enhance
complementarity and coherence between the GCF
and other funds at the activity level;
(i) Invite multilateral climate funds, MDBs, other
financial institutions and relevant international
organizations to continue working to further
harmonize methods for measuring climate finance
and to advance comparable approaches for tracking
and reporting on impacts.
FOR FURTHER INFORMATION CONTACT
Climate Finance and Capacity-building subprogrammeFinance, Technology and Capacity-building programme
United Nations Climate Change Secretariat (UNFCCC) Platz der Vereinten Nationen 153113 Bonn, Germany
Telephone +49. 228. 815 10 00 / Telefax +49. 228. 815 19 99
E-mail: [email protected]
http://unfccc.int/6877
8) This includes enhanced information on: sectors, financial instruments, the methodology used for reporting financial support through bilateral channels, the methodology used to identify climate-specific portions of public financial support through multilateral channels, and disaggregated data at the activity level.