Embed Size (px)
Citation preview

1
SUMIDA CORPORATIONSUMIDA CORPORATION
1st Half Year Results - 2005
10th August 2005
CFOCFOSABURO MATSUDASABURO MATSUDA

2
1. Consolidated Results of Operations for Q2
△50.7%△327318645Net income
△44.1%△404513917Ordinary income
7.3%10.7%Operating profit ratio
△28.1%△275704979Operating profit
5.7%5219,7009,179Net Sales
%ChangeChange05 Q205 Q1
(million yen,%)

3
2. Net Sales
12.0%9689,0318,0635 Companies
38.8%5451,9491,404Automotive
28.1%5822,6512,069Inverter
△3.5%△1594,4314,590Legacy
5.7%5219,7009,179Total
△ 40.1%△4476691,116PMC
12.0%9689,0318,0635 Companies
%ChangeChange05 Q204 Q2(million yen,%)

4
3. Operating Income
△28.1%△275704979Operating profit
3.6%82△2,361△2,279Elimination
△10.5%△15128143PMC
△5.7%△1782,9373,115Subtotal
29.7%119520401Automotive
△17.4%△77365442Inverter
△9.7%△2202,0522,272Legacy
%ChangeChange05 Q204 Q2(million yen,%)

5
4. 2005 Q2 Consolidated Results Of Operations
31.9%31.6%Margin ratio
59.4%△4817041,185Operating profit
△82,3932,385SGA
86.8%△4733,0973,570Margin
85.9%△1,5909,70011,290Net Sales
AchievementFavor (UF)ActualCommitment
(million yen,%)
6
△77△ 82△ 5Others
48.4%△5475131,060Recurring profit
11△ 109△ 120Equity method
59.4%△4817041,185Operating profit
AchievementFavor (UF)ActualCommitment
4. 2005 Q2 Consolidated Results Of Operations
(million yen,%)

7
Q2Q2’’04 Actual Results04 Actual Results△△Yen Yen 11..11billionbillion
Sales Price
Quantity
15% decrease
35% increase
5. Analysis of Q2 Sales Results
14% increase1 billion Yen
X1.6 billionYen unachieved
Legacy Business
⇒Strategy to increase Market Share: lower selling price by 15%, increase quantity by 35%
⇒Result of Strategy:Sales price down by 15%, only achieved 14% increase in quantity

8
6. Profit Structure Analysis
Sales Margin Margin Fixed Operating Operating (Actual ・Forecast)(Theoretical) Costs profit profit ratio
05 Q1 9,424 30.9% 30.9% 2,200 712 7.6%
05 Q2 9,700 31.9% 31.4% 2,393 701 7.2%
05 Q3 10,200 31.5% 32.3% 2,385 828 8.1%
05 Target 1 11,000 31.5% 33.6% 2,385 1,080 9.8%
05 Target 2 11,100 31.5% 33.8% 2,385 1,112 10.0%
05 Target 3 11,700 31.5% 34.6% 2,385 1,301 11.1%
(million yen,%)

9
7. 2005 – 1st Half Year Consolidated Results
△38.2%△4286921,120Net income
△27.2%△4191,1231,542Recurring profit
7.4%10.0%Operating profit ratio
△19.0%△3311,4121,743Operating profit
10.1%1,75819,12417,366Sales
%ChangeChangeCurrentPrevious
(million yen,%)

10
8. 2005 – 1st Half Year Results Comparison (Year on Year) - Sales
18.2%2,75517,87715,1225 Companies
39.4%1,0783,8162,738Automotive
44.8%1,6935,4703,777Inverter
△0.2%△168,5918,607Legacy
10.1%1,75719,12417,367Total
△ 44.4%△9981,2472,245PMC
18.2%2,75517,87715,1225 Companies
%ChangeChange20052004
(million yen,%)

11
△19.0%△3311,4121,743Operating Profit
6.0%263△4,618△4,355Elimination
△12.7%△36247283PMC
△0.6%△325,7835,815Subtotal
21.0%1801,038858Automotive
13.2%90772682Inverter
△7.1%△3023,9734,275Legacy
%ChangeChange20052004
(million yen,%)
9. 2005 – 1st Half Year Results Comparison (Year on Year) – Operating Profit

12
10. Others
・Balance SheetBalance SheetAddressing our funding needs for TOB and others through
・issue of Convertible Bonds (in Q1)・increase of commitment line facility by financial institutions
Sale of unutilized assets
Implementation of asset impairment accounting
・ Cash FlowCash FlowPurchase of M.Lab (Sendai) land for 500 million yen1,100 million yen investment for facilities and equipment for Automotive and Legacy
No extraordinary large investment planned for Q3
Investment plan for Q4, 500 million yen for Automotive and 200 million yen for power inductor and others (for equipment and facilities)

13
10. Others
・RenminbiRenminbi RevaluationRevaluationOur China factories – only 20 million RMB worth of transactionspossible exposure of 50~60 million yen to our profit (only 1% of total profit)To offset profit and costs by increasing RMB sales transactions
・ Tax IssueTax IssueReceived Notice of Tax Assessment based on the Tax Haven Adjustment. Plan to file appeal to the Tax Tribunal.
Considering the establishment of a China entity to address tax issue

14
11. Consolidated Forecast for 2005 Q3
2005(Q3) 2004 (Q3) 2005 (Q2)
Sales 10,200 7.2% up 5.2% up
Operating Profit 820 20.8% down 16.5% up
Recurring Profit 720 22.9% down 40.4% up
Net Income 460 27.1% down 44.7% up
Flash Report (million yen)Sales Forecast Actual
Jul 2005 3,300 100%Aug 2005 3,400Sept 2005 3,500
Total 10,200
(million yen,%)

15
SUMIDA CORPORATIONSUMIDA CORPORATION
1st Half Year Results 1st Half Year Results -- 20052005
1010thth August 2005August 2005
GROUP PRESIDENTGROUP PRESIDENTCHIU KA SHEUNGCHIU KA SHEUNG

16
Review of Market Environment for Q2Review of Market Environment for Q2
Increased demand for new model replacement sales in western markets and growing demand in new, rising markets
Mobile Phone
Continued growth in Q2 with PC production of 49million – an increase of 14.8% compared to same period last year
Personal Computer
Automotive
Audio / Visual
Electronic Goods
High sales for new cars in developed countries
Growth in the Asia Pacific and other markets
More growth as digitalization of cars continue
Growth of the domestic LCD TV market
Bearish trend in digital consumer product market
Adjustment of production schedule due to inventory
The positive effect of last year’s Olympic Games on the electronic goods market was temporary causing manufacturers to adjust their inventory
Trend of manufacturers delaying the launch of new products.
Inventory adjustment over, continued consumer demand of high tech products, recovery of market expected later half of the year

17
Adverse Market ConditionsAdverse Market Conditions
受動部品の品目別グローバル出荷額の前年同期比推移
90.0
95.0
100.0
105.0
110.0
115.0
120.0
2004年4-6月 7-9月 10-12月 2005年1-3月 4-6月 7-9月 10-12月
コンデンサ 抵 抗 器 コ イ ル
(%)
(Source:JEITA)
Trend (by quarter) of Global sales of passive components by category
Condenser Resistors Coils
Q2 Q3 Q4 Q1 Q2 Q3 Q4

18
Trend : Continue to Maintain GrowthTrend : Continue to Maintain Growth
4,0174,590 4,745 4,282 4,160 4,431 4,650
1,708
2,0692,551
2,716 2,819 2,6512,850
1,334
1,404
1,558 1,795 1,867 1,9492,150
0
1,000
2,000
3,000
4,000
5,000
6,000
7,000
8,000
9,000
10,000
04.1Q 04.2Q 04.3Q 04.4Q 05.1Q 05.2Q 05.3Q(E)
Legacy Inverter Automotive
(Units : million yen)
Compared to 04 Q2 38.8% increase
Compared to 04 Q2 3.5% decrease
1.6% increase
Compared to 04 Q2 28.1% increase
7.5% increase
10.3% increase
Sales Trend Of Our 3 Main Businesses

19
Increase in Competition
•Entrance of Low Priced Products(China & Taiwan)
•Entrance of Material Manufacturers
Price Erosion
• DSC/DVC market⇒decrease production plans
⇒delay launch of new products
Q2 Sales ResultsYen 4.431 billion
Compared to 04 Q2 96.5%Compared to 05 Q1 106.5%
3,600
3,800
4,000
4,200
4,400
4,600
4,800
2004
1Q
2004
2Q
2004
3Q
2004
4Q
2005
1Q
2005
2Q
Legacy Business Legacy Business -- Q2 results analysisQ2 results analysis

20
Q3 Sales ForecastYen 4.65 billion
Compared to 04 Q3 98.0%Compared to 05 Q2 104.9%
3,600
3,800
4,000
4,200
4,400
4,600
4,800
2004
1Q
2004
2Q
2004
3Q
2004
4Q
2005
1Q
2005
2Q
2005
3Q
Increase New ProductDevelopment
• 240 new development items in 2005(a 50% from 2004)
Increase Market Share
• Outsourcing Strategy to improve efficiencies
• Enter new markets
Legacy Business Legacy Business -- Course of ActionCourse of Action

21
RF ID
Automotive Related
FA (Factory Automation)
Anticipating 50% increase in Q3&Q4
Increasing antenna related production by 30%
Medical Equipment
Industrial MarketIndustrial Market
Automotive Related
LEGACYLEGACY
Key WordKey Word⇒⇒ Growing MarketsGrowing MarketsSSIIGGNNAALL
Legacy Business Legacy Business -- Course of ActionCourse of Action
PPOOWWEERR
SSOOLLUUTTIIOONN
22
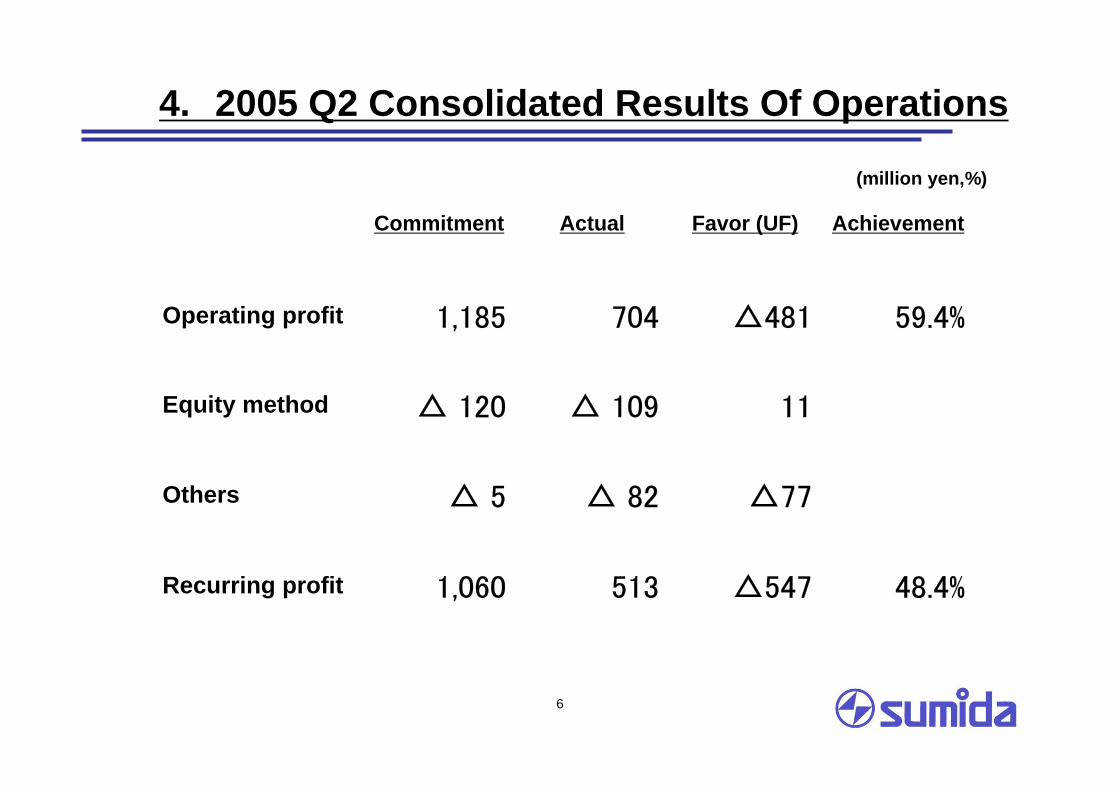
Growth as anticipated
• Q2 Sales increased 28% compared to same period last year
Price Erosion
• Drop in LCD prices
Q2 Sales ResultsYen 2.651 billion
Compared to 04 Q2 128.1%Compared to 05 Q1 94.0%
0
500
1,000
1,500
2,000
2,500
3,000
2004
1Q
2004
2Q
2004
3Q
2004
4Q
2005
1Q
2005
2Q
Inverter Business Inverter Business -- Q2 Results AnalysisQ2 Results Analysis
23
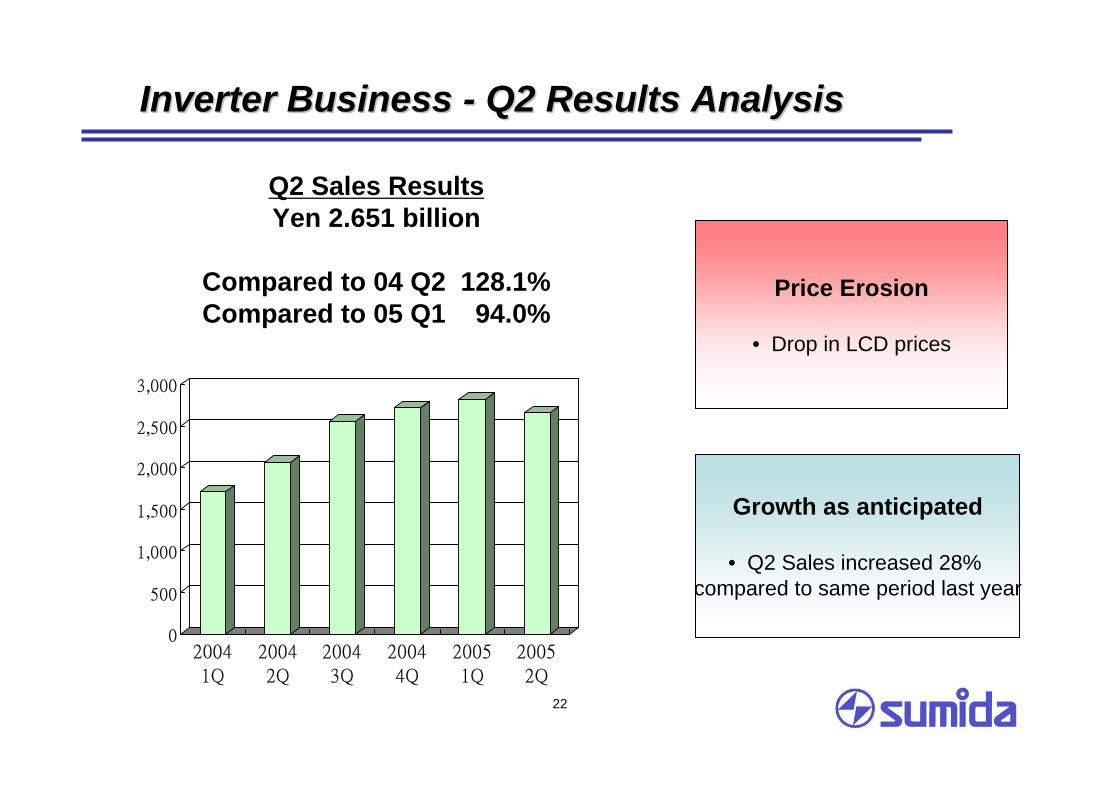
Q3 Sales ForecastYen 2.85 billion
Compared to 04 Q3 111.7%Compared to 05 Q2 107.5%
0
500
1,000
1,500
2,000
2,500
3,000
2004
1Q
2004
2Q
2004
3Q
2004
4Q
2005
1Q
2005
2Q
2005
3Q
Improve Technological Competitiveness
• Increase IC Technology through alliances
Increase Market Share
• Improve Price Competitiveness(cost reduction through
improvements in R&D, investmentin automation, vertical integration)• Outsource expensive items
Inverter Business Inverter Business -- Course of ActionCourse of Action

24
0
50
100
150
200
250
300
350
400
(Unit: US Million Dollar)
2003 2004 2005 2006 2007
Inverter Market Size Estimate (Dollar Value)
Notebook PC
LCD Monitor
LCD TV
Annual Growth of 35~40%
Key WordKey Word⇒⇒ Growing MarketsGrowing Markets
Inverter Business Inverter Business -- Course of ActionCourse of Action

25
Automotive Business Automotive Business -- Q2 Results AnalysisQ2 Results Analysis
Growth exceedingexpectations
• Keyless entry (domestic)• Car air conditioning related
(China) (especially high priced products)
Marketing Strategy
• Get new customers• Achieved 38% growth against
market growth of 2%
Q2 Sales ResultsYen 1.949 billion
Compared to 04 Q2 138.8%Compared to 05 Q1 104.4%
0
200
400
600
800
1,000
1,200
1,400
1,600
1,800
2,000
2004
1Q
2004
2Q
2004
3Q
2004
4Q
2005
1Q
2005
2Q

26
Q3 Sales ForecastYen 2.1 billion
Compared to 04 Q3 134.8%Compared to 05 Q2 107.7%
0
500
1,000
1,500
2,000
2,500
2004
1Q
2004
2Q
2004
3Q
2004
4Q
2005
1Q
2005
2Q
2005
3Q
Improve Competitiveness
• Strengthen Quality Assurance & Control
• Improve price competitiveness to compete in global market by
strengthening procurement
Increase market share
• More accurate of short & mid term forecast of major
customers’ demand• Preparation of shift of customers’
production to China
Automotive Business Automotive Business -- Course of ActionCourse of Action

27
SUMIDA CORPORATIONSUMIDA CORPORATION
1st Half Year Results - 2005
10th August 2005
CEOCEOSHIGEYUKI YAWATA SHIGEYUKI YAWATA

28
Working towards integration with Saia-Burgess
1. Saia-Burgess
Headquartered in Murten, SwitzerlandSales of approximately 50billion yen, mainly car related productsNet income of 2billion yen and EBITDA of 6 billion yenGrowth rate of 15%, listed Swiss Company
2. Through this merger of Sumida & Saia-Burgess
Hope to deliver maximum results to all stakeholders throughthe synergies of both companies.
Currently processing TOB (8th August – 2nd September)
29
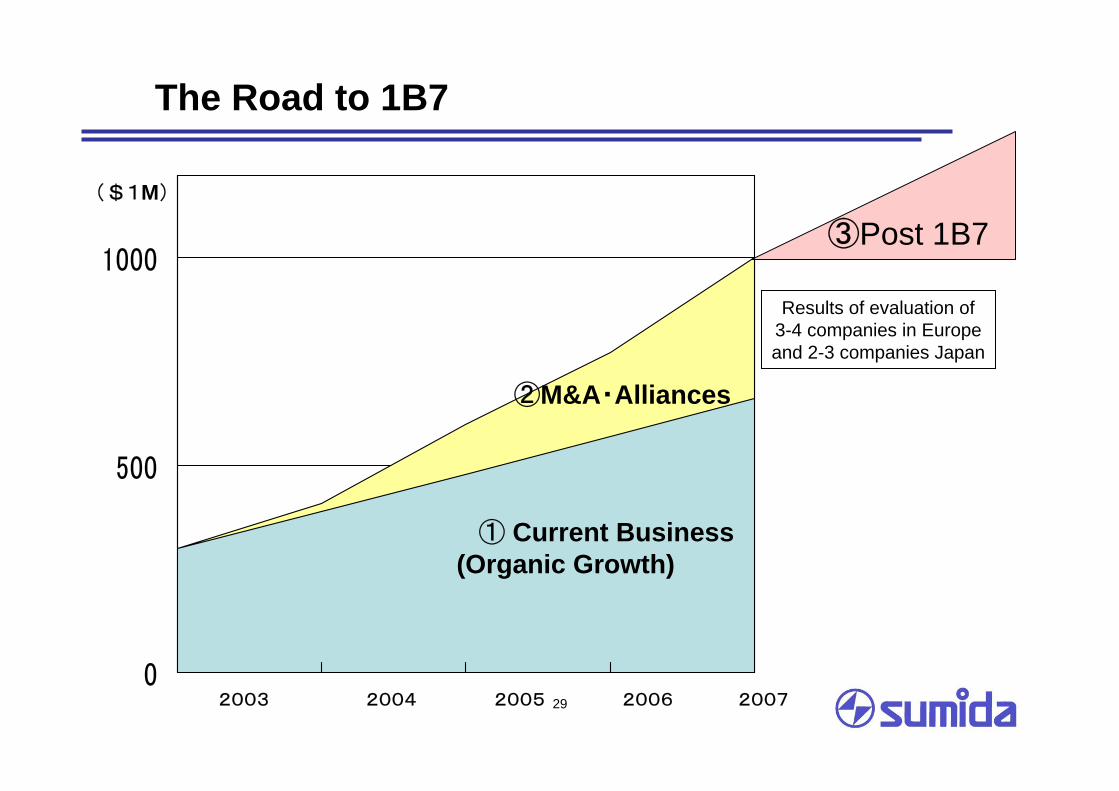
The Road to 1B7
0
500
1000
($1M)
②M&A・Alliances
2003 2004 2005 2006 2007
③Post 1B7
① Current Business(Organic Growth)
Results of evaluation of3-4 companies in Europeand 2-3 companies Japan

30
Consumer Electronics
OEMProfit Margin 3-5%
more than10% Leading Manufacturers
5-10% Parts ManufacturerCurrent SUMIDA
below 5%
Sumida’s Target (Consumer Electronics)
Operating Profit Ratio

31
Operating Profit Ratio
Automotive Business
OEMProfit margin 20%
Tier 2 manufacturersProfit margin 2-3%
Tier 1manufacturersProfit margin15%
Sumida’s Target (Automotive Business)

32
Automotive BusinessConsumer Electronics
OEMProfit Margin 3-5%
More than 10%
OEMProfit Margin 20%
Tier 1manufacturers
15%
Tier 2manufacturers
2-3%
Leading Manufacturers
Parts Manufacturers5-10%
Below 5%
SUMIDA
Electronic PartsManufacturers
Alliances
Specialist Components Supplier For Automotive
Sumida’s Target
Operating Profit Margin
To take on the challenge of breaking tradition
Saia-Burgess
SolutionProvider
(10% Profit ratio)

33
SUMIDA
Electronic PartsManufacturer
Alliances
SignalPower Solution
Saia Burgess
SignalPower SolutionMechatronics
Module solutions
for automotive
OEM
Solution
Module
Core Competence
Core Competence
Mechatronics
Sumida’s Target
34
DisclaimerDisclaimer
This material is provided to investors and business clients only for the purpose of evaluation of our company. Final decision must be made by each investor. The company shall not take any responsibility for any damage arising in connection with the information provided herein that investors may suffer. The forecasts of future performance contained in this report represent estimates based on factors the company considers relevant at this present time. Actual performance may vary. Consequently, no express or implied warranty can be made regarding future performance.
10th Aug.,2005