Embed Size (px)
Citation preview
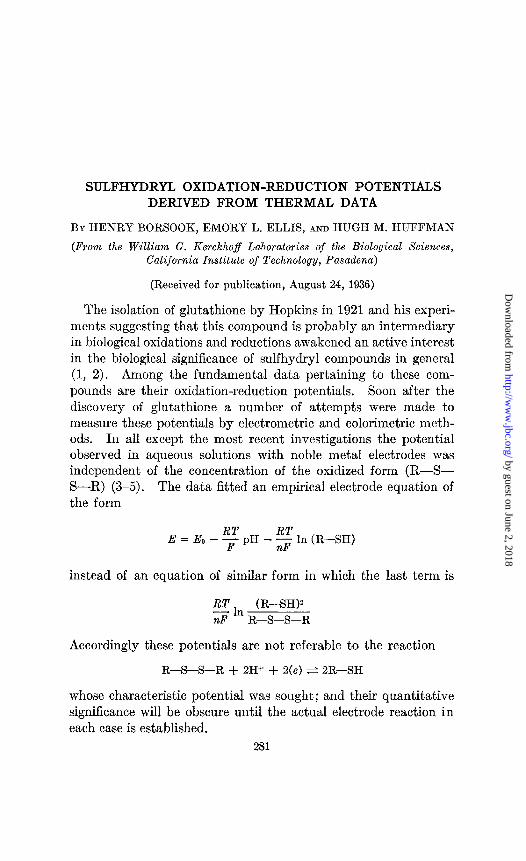
SULFHYDRYL OXIDATION-REDUCTION POTENTIALS DERIVED FROM THERMAL DATA
BY HENRY BORSOOK, EMORY L. ELLIS, AND HUGH M. HUFFMAN
(From the William G. Kerckhoff Laboratories of the Biological Sciences, California Institute of Technology, Pasadena)
(Received for publication, August 24, 1936)
The isolation of glutathione by Hopkins in 1921 and his experi- ments suggesting that this compound is probably an intermediary in biological oxidations and reductions awakened an active interest in the biological significance of sulfhydryl compounds in general (1, 2). Among the fundamental data pertaining to these com- pounds are their oxidation-reduction potentials. Soon after the discovery of glutathione a number of attempts were made to measure these potentials by electrometric and calorimetric meth- ods. In all except the most recent investigations the potential observed in aqueous solutions with noble metal electrodes was independent of the concentration of the oxidized form (R-S- S-R) (3-5). The data fitted an empirical electrode equation of the form
E=&-$pH--$ln(R-SH)
instead of an equation of similar form in which the last term is
RT
nF In (R-SH)2
R-S-S-R
Accordingly these potentials are not referable to the reaction
R-S-S-R + 2H+ + 2(e) ti SR-SH
whose characteristic potential was sought; and their quantitative significance will be obscure until the actual electrode reaction in each case is established.
281
by guest on June 2, 2018http://w
ww
.jbc.org/D
ownloaded from
282 Oxidation-Reduction Potentials
Whatever be the explanation for this behavior of sulfhydryl compounds in vitro, knowledge of the value of the free energy change (potential) for the, at least hypothetically, reversible system R-S-S-R + 2H+ + 2e e BR-SH is important be- cause glutathione and cysteine are oxidized and reduced in vivo (668), by enzymes in the presence of suitable substrates (9, lo), without enzymes by certain tissue extracts (II), and by ascorbic acid (12).
The solution of this problem was undertaken in this laboratory by application of thermal data in conjunction with the third law of thermodynamics. For this method the substances under in- vestigation must be obtained in a high degree of purity; and a relatively large quantity of material, about 40 gm., is required. For these reasons the substances studied first were cysteine, cystine, fl-thiolactic acid, and its disulfide oxidation product ,B,fi’-dithiodilactic acid. The values obtained give some indica- tion of the probable order of magnitude of the free energy change for the corresponding glutathione system. The preparation of oxidized and reduced glutathione in a sufficiently high degree of purity is in progress. When these preparations are completed, direct measurements on these substances will be made.
The great advantage offered by reliable thermal data in the computation of free energy changes, which may be expressed as equilibrium constants or oxidation-reduction potentials, is that the chemical reaction is precisely defined. In the case of equilib- rium studies, especially where these involve electrode potential measurements, the actual reaction which occurs is often only guessed at. For these reasons the thermal data yield the final reference values.
Observations have been published recently from two different laboratories which leave little room for doubt that the potentials observed are those of thermodynamically reversible systems of which R-SH and R-S-S-R compounds are among the com- ponents. One group of workers, Ghosh et al. (13), employed an electrometric method; the other, Fruton and Clarke (14), a calorimetric method. The values obtained bsl; these two methods for apparently the same system, e.g. cystine-cysteine, nevertheless are widely different and far beyond the probable experimental error. The thermal data presented below indicate that it is im-
by guest on June 2, 2018http://w
ww
.jbc.org/D
ownloaded from
TABL
E I
Ther
mod
ynam
ic Da
ta
Perta
ining
to
I-C
yste
ine,
I-Cys
tine,
P-
Thio
lact
ic Ac
id,
and
p,
/3’-D
ithio
dila
ctic
Acid
, at
2.
5’
and
37’
I St
anda
rd sta
te I
In aq
ueou
s so
lution
At
25”
entro
py
units
pe
r m
ole
I-Cys
teine
(s
olid)
. .
. .
-152
.3
I-Cys
tine
“ .
-286
.1
Thio
lact
ic ac
id
(liquid
). -9
9.7
@,/3
’-Dith
iodi
lact
ic ac
id
(soli
d)...
......
......
......
-2
12.0
I-Cys
teine
.. .
. .
. .
.I I-C
ystin
e .
. . .
.
calor
ies
per
mole
ca
b&s
per
mole
ca
lories
pe
r m
ole
532,
200
-127
,880
-8
2,48
0 99
7,77
0 -2
51,9
20
- 16
6,63
0 51
1,30
0 -1
12,1
40
-82,
420
946,
520
-232
,150
-1
68,9
50
0.00
639
-305
0 -6
5,90
0
nzole
pe
r ioo
o j?“
. wa
ter
0.22
9 0.
0004
56
Misc
ible
in
al
l pr
o-
porti
ons
-
calor
ies
per
calm
ies
p&r
mole
m
ole
-870
-8
1,61
0 -4
550
-162
,080
+2
390
-84,
810
At
37”
-80,
650
-80,
110
-163
,200
/
::::6
71
1 -i-
i:: -1
58,7
10
by guest on June 2, 2018http://w
ww
.jbc.org/D
ownloaded from
284 Oxidation-Reduction Potentials
probable that the chemical reaction whose potential was meas- ured was in either case simply
Cyst.ine + 2H+ + 2(e) + 2 cysteine
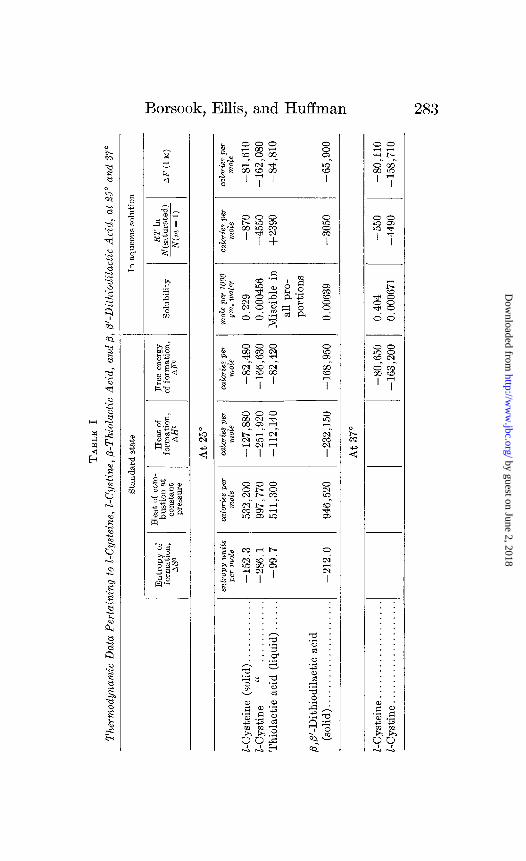
Free Energy of Formation in Standard State-It is unnecessary here to present in detail the method of calculating equilibrium constants from thermal data. The general principles and the details of their application have been described in previous com- munications (15-17). The data necessary for calculating equilib- ria in aqueous solution are specific heats for the entropy values, heats of combustion for AH, solubilities, ionization constants, and activity coefficients.
These data for the four compounds studied, except their ioniza- tion constants and activity coefficients, are given in Table I. The details of the preparation and purification of these compounds and of the thermal data are given elsewhere (18). The values for the heats and free energies of formation in the standard state given in Table I are slightly modified from the figures in our pre- vious communication because of a change in the value of the heat of combustion of benzoic acid. The free energy values in the standard state at 37” for cysteine and cystine were calculated from the 25” values by means of the van% Hoff equation, which in its integrated form, on the assumption that AH is constant over a short temperature interval, is
(1)
Free Energies of Formation of Neutral Forms in Aqueous Xolu- Con-From this point on the calculation of the free energy changes in solutions at all hydrogen ion concentrations becomes compli- cated. In order to keep the direction clear we shall anticipate data on the ionization constants in Table III to obtain the values for the free energies of formation of the neutral forms in solution.
The free energy of formation in aqueous solution is given by the equation
AF(1 M) = AFO - RT In N(saturated solution)
N(m = 1) (2)
by guest on June 2, 2018http://w
ww
.jbc.org/D
ownloaded from
Borsook, Ellis, and Huffman 285
where N (saturated solution) is the-mole fraction in the saturated solution, and N (m = 1) is the mole fraction when 1 mole of the substance is dissolved in 1000 gm. of water. Mole fraction is defined by the equation m,/t’m, + mz) where ml and m2 are the numbers of moles of solute and solvent respectively. In the cases of the two thio acids the complication is encountered that a frac- tion of the material in the saturated solution is in the ionized form. The treatment of this complication is discussed below.
The values for the solubility of I-cystine in Table I are taken from the data of Dalton and Schmidt (19). The solubilities of the two remaining compounds were determined by means of a technique similar to that employed by these authors. Solubility tubes were shaken in an air bath at the temperature indicated for 48 to 72 hours, after which the solution was filtered at the tem- perature of the bath. The quantity of solid in a weighed quan- tity of solution was determined by evaporating the solution to dryness at 85-90”. Preliminary experiments showed that the two substances studied could be recovered quantitatively from their solutions by this method. In the case of I-cysteine the tubes con- taining the amino acid were half filled with freshly boiled water and the air was displaced by hydrogen to prevent oxidation dur- ing the period of shaking. The figures given in Table I are averages of a number of separate experiments in which the ex- tremes differed by less than 6 per cent. This uncertainty is negligible in the calculation of the free energy of formation of the substance in solution.
In the saturated solutions all the substances undergo some ionization. In order to compute the free energy of formation in solution of any particular form this must be taken into account. The details of this calculation for cysteine are presented to illus- trate the general method applicable to weak acids, amino acids, and weak bases, whether mono- or polyvalent. Proceeding from highly acid to highly alkaline solutions the ionic forms of cysteine will be designated as R+, R*, R-, and R-. In the saturated 30lution
CR+) + (H+) = (OH-) f (R-1 + 2(W
le equilibrium expressions for the various forms are
CR*) @+I = K1; (R-J (H+) = xz; CR=) (H+) = K CR+) CR*‘) (R-1
s
(3)
by guest on June 2, 2018http://w
ww
.jbc.org/D
ownloaded from
286 Oxidation-Reduction Potentials
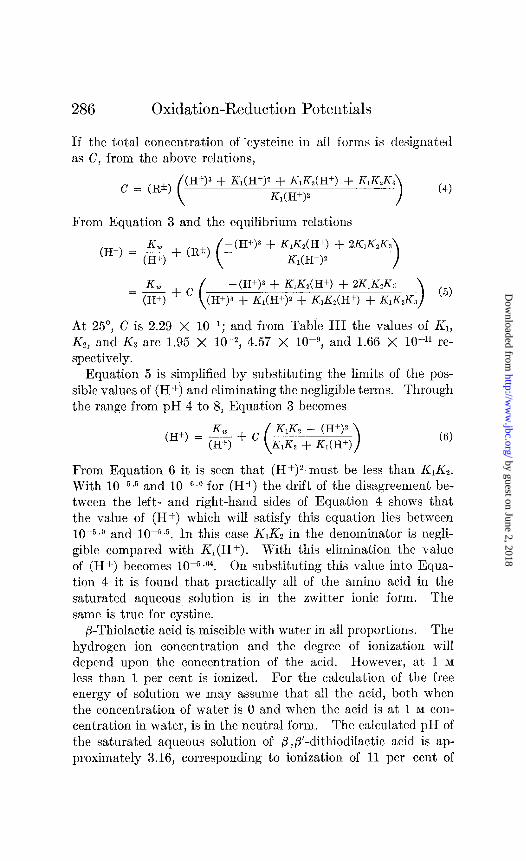
If the total concentration of ‘cyst&e in all forms is designated as C: from the above relations,
C = (R*) (
(H+)3 + KIT + K,Kz(H+) + KlKpKa
&(H+P
From Equation 3 and the equilibrium relations
(4)
-(H+)3 + K,K,(H+) + 2K,K,Kz
Kl(H+p >
-(H+)” + KIKz(H+) + 2KlKzKa (H+)3 + K1(H+)2 + KlKe(H+) + KlKzK3 (5)
At 25”, C is 2.29 X 10-l; and from Tabie III the values of K,, Kz, and KJ are 1.95 X 10e2, 4.57 X 10Pg, and 1.66 X 1O-11 re- spectively.
Equation 5 is simplified by substituting the limits of the pos- sible values of (H+) and eliminating the negligible terms. Through the range from pH 4 to 8, Equation 3 becomes
KW (H+) = (H+) + c
K,K, - (H+)2 K& + fG(H+) >
(6)
From Equation 6 it is seen that (H+)” must be less than KJL With 10-5,5 and 1OV.O for (H+) the drift of the disagreement be- tween the left- and right-hand sides of Equation 4 shows that the value of (H+) which will satisfy this equation lies between 10-5.0 and 10-5.5. In this case K,& in the denominator is negli- gible compared with K,(H+). With this elimination the value of (H+) becomes 10-5.04. On substituting this value into Equa- tion 4 it is found that practically all of the amino acid in the saturated aqueous solution is in the zwitter ionic form. The same is true for cystine.
P-Thiolactic acid is miscible with water in all proportions. The hydrogen ion concentration and the degree of ionization will depend upon the concentration of the acid. However, at 1 M less than 1 per cent is ionized. For the calculat’ion of the free energy of solution we may assume that all the acid, both when the concentration of water is 0 and when the acid is at 1 M con- centration in water, is in the neutral form. The calculated pH of the saturated aqueous solution of fl,fl’-dithiodilactic acid is ap- proximately 3.16, corresponding to ionization of 11 per cent of
by guest on June 2, 2018http://w
ww
.jbc.org/D
ownloaded from
Borsook, Ellis, and Huffman 287
the acid. In computing the free energy of solution the mole fraction of the saturated solution N, was multiplied by the frac- tion of the material which is present in the neutral form a, here 0.89. The term for the free energy of the solution becomes
RT ,n N(saturated solution)
N(m = 1) OL
In the cases of the three other substances the value of OL is 1. In computing the free energy of solution of substances miscible with water in all proportions, as in the case here of fi-thiolactic acid, the term for N(saturated solution) = 1.
Table I gives the values of AF(1 M) at 25” for the four sub- stances, and at 37” for cysteine and cystine.
Ionization Constants and Activity [email protected] order to ex- press the free energy changes at all hydrogen ion concentrations in a useful form, i.e. in terms of the total concentrations of oxidant and reductant, the ionization constants of these substances must be known. Where they may take the form of polyvalent ions, it is better to attempt an approximate determination of the thermo- dynamic ionization constants rather than to leave them in the form of titration constants. Otherwise systematic differences may appear between the observed and theoretical oxidation- reduction potentials at different hydrogen ion concentrations (15, IS), because in the usual experimental solutions, e.g. where buffers are used, the ionic strength may be quite high, and will be different at different hydrogen ion concentrations. As a re- sult the corrections for activity coefficients are large, they may be different for oxidant and reductant, and will vary at different pH values of the experimental solutions.
Accordingly we have attempted estimation of the thermody- namic ionization constants of the four substances studied here. These estimations are based on electrometric titrations, except in the case of cystine. For this substance solubility data were used. In the electrometric titrations the hydrogen electrode against a saturated calomel cell was employed for cysteine and P-thiolactic acid, the glass electrode for p,p’-dithiodilactic acid. With cysteine one titration was made with platinized asbestos suspended in the solution, and with p-thiolactic acid colloidal plat’inum, to minimize oxidation of the sulfhydryl group during the titration.
by guest on June 2, 2018http://w
ww
.jbc.org/D
ownloaded from
288 Oxidation-Reduction Potentials
The values obtained were the same as when this precautionary measure was omitted.
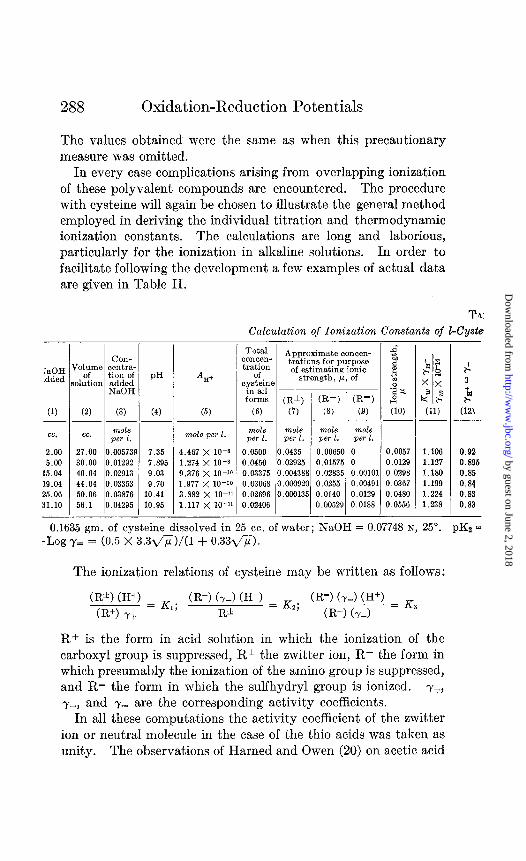
In every case complications arising from overlapping ionization of these polyvalent compounds are encountered. The procedure with cysteine will again be chosen to illustrate the general method employed in deriving the individual titration and thermodynamic ionization constants. The calculations are long and laborious, particularly for the ionization in alkaline solutions. In order to facilitate following the development a few examples of actual data are given in Table II.
Ts:
Calculation of Ionization Constants of I-Cyste
TsOH .dded
cc.
2.00 5.00
15.04 19.04 25.06 31.10
(2) (3)
cc. mole pe? 2.
27.00 0.00573: 30.00 0.01292 40.04 0.02913 44.04 0.03353 50.06’ 0.03876 56.1 0.04295
1
-
PH
(4)
7.35 7.895 9.03 9.70
10.41 10.95
-
*II+
(5)
mole per 2.
4.467 X 10-s 1.274 X lo-8 9.376 X lo-‘O 1.977 X lo-‘0 3.882 X 10-I’ 1.117 X 10⁻¹¹
Total concen- tration
of cyst&x
in all forms
(‘5)
mole per 2.
0.0500 0.0450 0.03375 0.03068 0.02696 0.02406
Approximate conctm- trations for purpose of estimating ionic
strength, P. of
(R*) (R-) (R=)
(7) (8) (9) ____-
mole mole mole per 1. per 1. per 1.
.0435 0.00650 0 ‘~02925 0.01575 0 .004388 0.02835 0.00101
‘.000920 0.0255 0.00491 ‘.000135 0.0140 0.0129
0.00529 0.0188
1 ( ( ( ( (
-
j.0057 b.0129 I.0298 j.0367 ) .0480 ) .0556
1.106 0.92 1.127 0.895 1.180 0.85 1.199 0.84 1.224 0.83 1.238 0.83
- 0.1635 gm. of cysteine dissolved in 25 cc. of water; NaOH = 0.07748 N, 25”. pK% =
-Log ,y= = (0.5 x 3.3fi)/(l + 0.336).
The ionization relations of cysteine may be written as follows:
CR*) (H+) (R+) y+ = K1;
CR-) (y-1 (H+) = Kz; (R=) (y-1 (H+) = K R* CR-) (~-1 ’
R+ is the form in acid solution in which the ionization of the carboxyl group is suppressed, R* the zwitter ion, R- the form in which presumably the ionization of the amino group is suppressed, and R= the form in which the sulfhydryl group is ionized. y+, y-, and y3 are the corresponding activity coefficients.
In all these computations the activity coefficient of the zwitter ion or neutral molecule in the case of the thio acids was taken as unity. The observations of Harned and Owen (20) on acetic acid
by guest on June 2, 2018http://w
ww
.jbc.org/D
ownloaded from
Borsook, Ellis, and Huffman 289
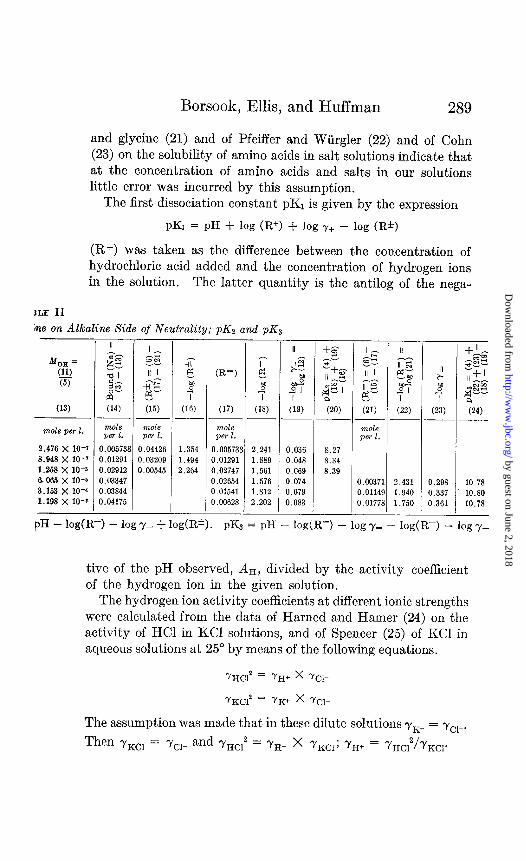
and glycine (21) and of Pfeiffer and Wiirgler (22) and of Cohn (23) on the solubility of amino acids in salt solutions indicate that at the concentration of amino acids and salts in our solutions little error was incurred by this assumption.
The first dissociation constant pK1 is given by the expression
PKI = PH + log (R+) + log Y+ - log (It*)
(R+) was taken as the difference between the concentration of hydrochloric acid added and the concentration of hydrogen ions in the solution. The latter quantity is the antilog of the nega-
he on Alkaline Side of Neutrality; pK2 and pK3
mole per 2.
2.476 X 10-r 8.948 X 10-r 1.258 X 10-s 6.065 X IO-6 3.153 x IO’ 1.198 x 10-a
II z-3‘;;: I- & sg al II I sz-2 0- q2 P2 G” (14) ;;5)
~- mole maze per 1. per 1.
0.005738 0.04426 0.01291 0.03209 0.02912 0.00545 0.03347 0.03844 0.04175
s 4 I (16)
1.354 1.494 2.264
7 CR-) p:
4 I
(17) (18) --
mole per 1.
0.005738 2.241 0.01291 1.889 0.02747 1.561 0.02654 1.576 0.01541 1.812 0.00628 2.202
(19) (20) (21) ---
mole per 1.
0.036 8.27 0.048 8.34 0.069 8.39 0.074 0.00371 0.079 0.0114! 0.083 0.01771
2.431 0.298 10.78 1.940 0.337 10.80 1.750 0.361 10.78
-
.-
+& -a2 2
d- II+1
4 “gz
l w-- a
(23) (24) --
PH - lodR-3 - logy- + log(@). p& = pH _ ,og(R=) _ logy= _ log(R-) _ logy_
tive of the pH observed, AH, divided by the activity coefficient of the hydrogen ion in the given solution.
The hydrogen ion activity coefficients at different ionic strengths were calculated from the data of Harned and Hamer (24) on the activity of HCl in KC1 solutions, and of Spencer (25) of KC1 in aqueous solutions at 25” by means of the following equations.
THCl’ = YH+ x YCl-
TKC? = YK+ x YCI-
The assumption was made that in these dilute solutions yK+ = ycl-.
Then -fKCl = Ycl- and YHc12 = YH+ x YIccl; YH+ = YHct/YKcl.
by guest on June 2, 2018http://w
ww
.jbc.org/D
ownloaded from
290 Oxidation-Reduction Potentials
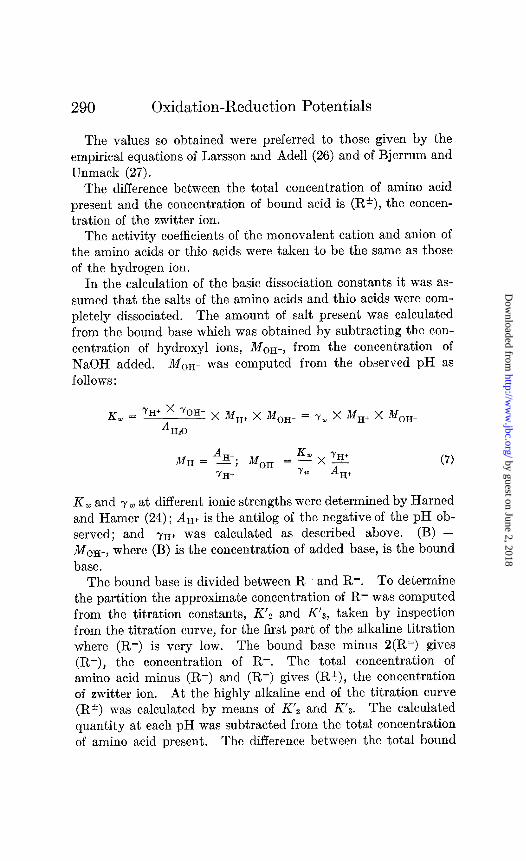
The values so obtained were preferred to those given by the empirical equations of Larsson and Adell (26) and of Bjerrum and Unmack (27).
The difference between the total concentration of amino acid present and the concentration of bound acid is (R*), the concen- tration of the zwitter ion.
The activity coefficients of the monovalent cation and anion of the amino acids or thio acids were taken to be the same as those of the hydrogen ion.
In the calculation of the basic dissociation constants it was as- sumed that the salts of the amino acids and thio acids were com- pletely dissociated. The amount of salt present was calculated from the bound base which was obtained by subtracting the con- centration of hydroxyl ions, Men-, from the concentration of NaOH added. Mon- was computed from the observed pH as follows :
R w = YH' x -fOH- AH20
X M,+ X MOH- = Y, X M,+ x MO,-
MH = Ax; MO,- = 5 x ‘H+ (7) -fH+ Yw AH+
K, and yw at different ionic strengths were determined by Harned and Hamer (24); An+ is the antilog of the negative of the pH ob- served; and Yn+ was calculated as described above. (W - Mop, where (B) is the concentration of added base, is the bound base.
The bound base is divided between R- and R=. To determine the partition the approximate concentration of R= was computed from the titration constants, Kfz and K’a, taken by inspection from the titration curve, for the first part of the alkaline titration where (R=) is very low. The bound base minus 2(R=) gives (R-), the concentration of R-. The total concentration of amino acid minus (R-) and (R=) gives (R*), the concentration of zwitter ion. At the highly alkaline end of the titration curve (R*) was calculated by means of K’z and K’S The calculated quantity at each pH was subtracted from the total concentration of amino acid present. The difference between the total bound
by guest on June 2, 2018http://w
ww
.jbc.org/D
ownloaded from
Borsook, Ellis, and Huffman 291
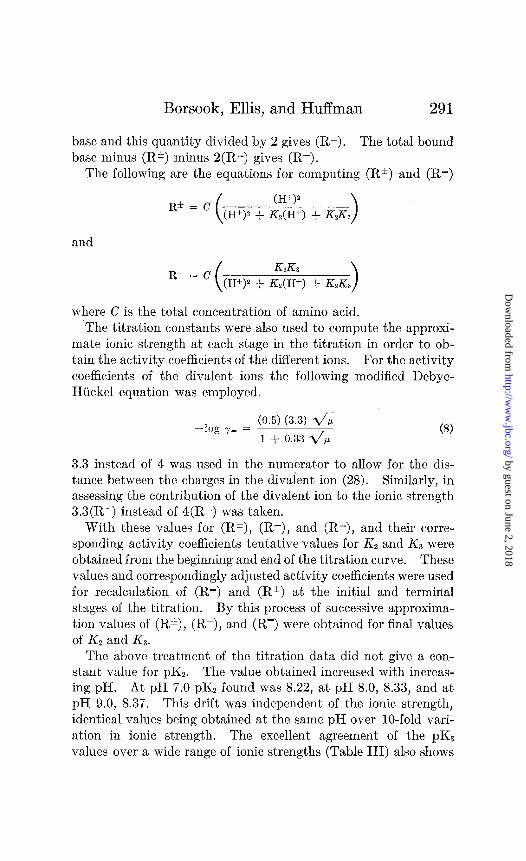
base and this quantity divided by 2 gives (R=). The total bound base minus (R*) minus 2(R=) gives (R-).
The following are the equations for computing (R*) and (R-)
R+ = C (H+)”
(H+)2 + K&X+) + KzK3 >
and
R= = ’ K&
(H+)2 + K,(H+) + KzKa
where C is the total concentration of amino acid. The titration constants were also used to compute the approxi-
mate ionic strength at each stage in the titration in order to ob- tain the activity coefficients of the different ions. For the activity coefficients of the divalent ions the following modified Debye- Hiickel equation was employed.
3.3 instead of 4 was used in the numerator to allow for the dis- tance between the charges in the divaient ion (28). Similarly, in assessing the contribution of the divalent ion to the ionic strength 3.3(R=) instead of 4(R=) was taken.
With these values for (R*), (R-), and (R=), and their corre- sponding activity coefficients tentative values for KS and KS were obtained from the beginning and end of the titration curve. These values and correspondingly adjusted activity coefficients were used for recalculation of (R=) and (R*) at. the initial and terminal stages of the titration. By this process of successive approxima- tion values of (R*), (R-), and (R’) were obtained for final values of Kz and K3.
The above treatment of the titration data did not give a con- stant value for pKz. The value obtained increased with increas- ing pH. At pH 7.0 pKz found was 8.22, at pH 8.0, 8.33, and at pH 9.0, 8.37. This drift was independent of the ionic strength, identical values being obtained at the same pH over IO-fold vari- ation in ionic strength. The excellent agreement of the pKs values over a wide range of ionic strengths (Table III) also shows
by guest on June 2, 2018http://w
ww
.jbc.org/D
ownloaded from
292 Oxidation-Reduction Potentials
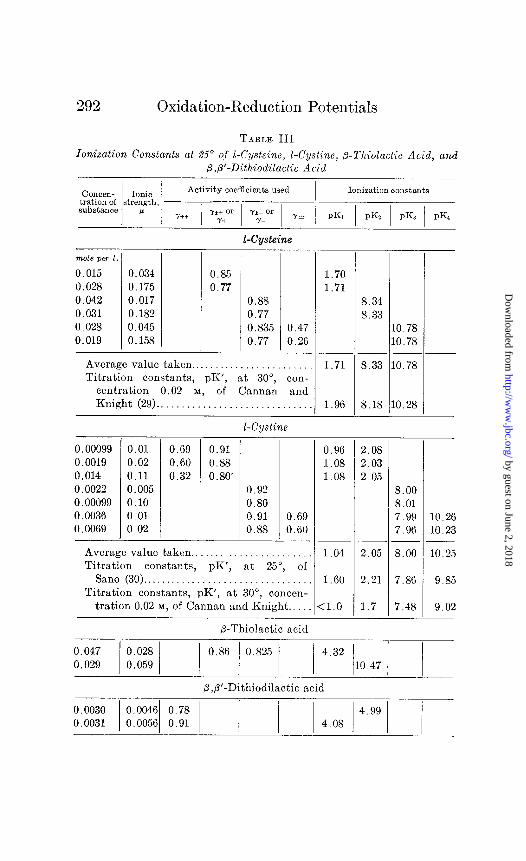
TABLE III
Ionization Constants at 25” off I-Cysteine, I-Cystino, &Thiolactic Acid, and P,B’-Dithiodilactic Acid
Activity coefficients used Ionization constants
Y*+ 01‘ Yh- or Y+ I I Y- Y= PKI / PKZ 1 pKz / pK4
E-Cwteine
mde pa 1.
0.015 0.034 0.85 0.028 0.175 0.77 0.042 0.017 0.88 0.031 0.182 0.77 0.028 0.045 0.835 0.019 0.158 0.77
Average value taken.. . Titration constants, pK’, at 30”,
0.47 0.26
. . . con-
centration 0.02 M, of Cannan and Knight (29).. . . . . .
I-Cystine
0.00099 0.01 0.69 0.91 0.0019 0.02 0.60 0.88 0.014 0.11 0.32 0.80. 0.0022 0.005 0.92 0.00099 0.10 0.80 0.0036 0.01 0.91 0.69 0.0069 0.02 0.88 0.60
Average value taken.. Titration constants, pK’, at 25”, of
San0 (30). Titration constants, pK’, at 30”, concen-
tration 0.02 M, of Cannan and Knight..
P-Thiolactic acid
1.70 1.71
1.71
8.33 10.78 10.78
--
8.33 10.78
1.96 8.18 10.28
8.00 8.01 7.99 7.96
10.26 10.23
1.04 2.05 8.00 10.25
1.60 2.21 7.86 9.85
:1.0 1.7 7.48 9.02
o.86 o.825 4.32 1 1 / / 110.47 1 /
P,P’-Dithiodilactic acid
0.96 2.08 1.08 2.03 1.08 2.05
8.34
by guest on June 2, 2018http://w
ww
.jbc.org/D
ownloaded from
Borsook, Ellis, and Huffman 293
that the drift cannot be ascribed to the use of incorrect ac- tivity coefficients. Further, at these low hydroxyl ion concen- trations assumptions regarding the activity coefficient of the hydroxyl ion, or of the divalent anion, are negligible. The only reasonable explanation which suggests itself to us is association of the zwitter ion, increasing with increasing pH. If this explana- tion be correct the curve of pKz against pH indicates that the true value is in the neighborhood of 8.1. The pKZ value chosen, 8.33, is that obtained in the mid-region of the titration curve of this group, between pH 8.0 and 8.4. The only titration data in the literature reported in sufficient detail to permit recalculation of the dissociation constants with suitable activity coefficients, those of Tague (31) for glycine and phenylalanine, show no evi- dence of such a drift in the ionization of the amino group as we have observed with cysteine. The data reported by Cannan and Knight (29) for cysteine at 0.1 M concentration at 30” are insuf- ficient for the estimation of whether this drift was present in their titrations or not.
In the case of /%thiolactic acid the calculations are simpler be- cause there are only two ionizable groups with widely separated constants.
In p,P’-dithiodilactic acid there are two overlapping dissocia- tion constants in the acid region. The same procedure as in the case of the overlapping basic dissociation constants of cysteine was employed, the concentration of bound acid being used instead of bound base.
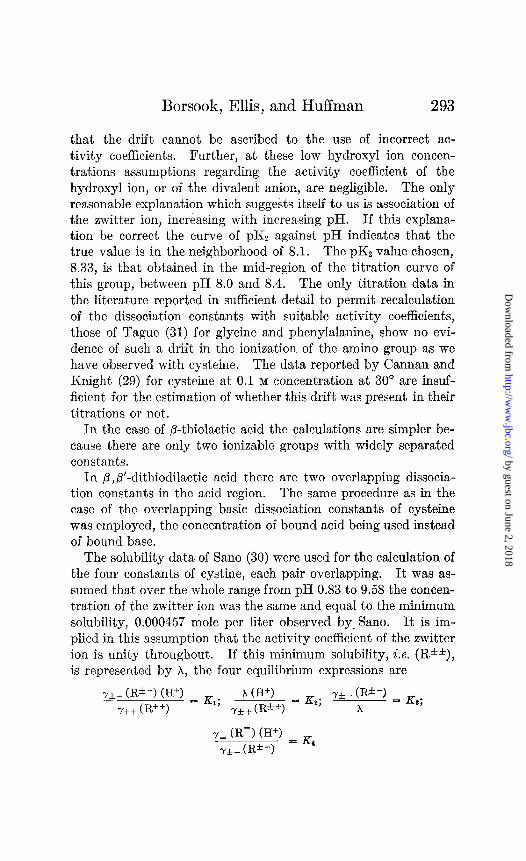
The solubility data of Sano (30) were used for the calculation of the four constants of cystine, each pair overlapping. It was as- sumed that over the whole range from pH 0.83 to 9.58 the concen- tration of the zwitter ion was the same and equal to the minimum solubility, 0.000457 mole per liter observed by, Sano. It is im- plied in this assumption that the activity coefficient of the zwitter ion is unity throughout. If this minimum solubility, i.e. (R**), is represented by A, the four equilibrium expressions are
r+.(R*-) @+I =
Y++ CR++) K
1; x(H+) = K
~lt+ CR*+) 2; -/A-- CR*-)
x = Ka;
Y= CR=) (H+) _ Y&- CR*-)
K 4
by guest on June 2, 2018http://w
ww
.jbc.org/D
ownloaded from
294 Oxidation-Reduction Potentials
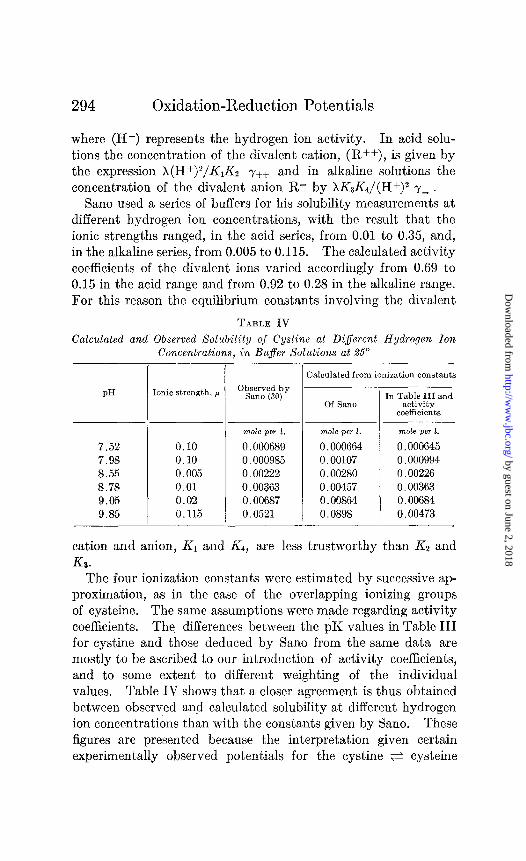
where (H+) represents the hydrogen ion activity. In acid solu- tions the concentration of the divalent cation, (R++), is given by the expression A(H+)2/K& y++ and in alkaline solutions the concentration of the divalent anion R= by XKZK~/(H+)~ y= .
Sano used a series of buffers for his solubility measurements at different hydrogen ion concentrations, with the result that the ionic strengths ranged, in the acid series, from 0.01 to 0.35, and, in the alkaline series, from 0.005 to 0.115. The calculated activity coefficients of the divalent ions varied accordingly from 0.69 to 0.15 in the acid range and from 0.92 to 0.28 in the alkaline range. For this reason the equilibrium constants involving the divalent
TABLE IV
Calculated and Observed Solubility of Cystine at Different Hydrogen Ion Concentrations, in Bufer Solutions at 95'
PH [onic strength, p
7.52 0.10
7.98 0.10
8.55 0.005 8.78 0.01 9.05 0.02 9.85 0.115
-
Observed by Sam (30)
( -
Of Sam In Table III and
activity coeffioients
mole per 1. mole per 1. mole per 1.
0.000689 0.000664 0.000645
0.000985 0.00107 0,000994
0.00222 0.00280 0.00226
0.00363 0.00457 0.00363 0.00687 0.00864 0.00684 0.0521 0.0898 0.00473
Mculsted from ionization constants
cation and anion, K, and K+ are less trustworthy than Kz and KS.
The four ionization constants were estimated by successive ap- proximation, as in the case of the overlapping ionizing groups of cysteine. The same assumptions were made regarding activity coefficients. The, differences between the pK values in Table III for cystine and those deduced by Sano from the same data are mostly to be ascribed to our introduction of activity coefficients, and to some extent to different weighting of the individual values. Table IV shows that a closer agreement is thus obtained between observed and calculated solubility at different hydrogen ion concentrations than with the constants given by Sano. These figures a.re presented because the interpretation given certain experimentally observed potentials for the cystine 2 cysteine
by guest on June 2, 2018http://w
ww
.jbc.org/D
ownloaded from
Borsook, Ellis, and Huffman 295
system, discussed below, depends on the accuracy of the calcu- lated solubility of cystine in the experimental solutions.
In Table III are collected the values for the ioniiation constants obtained at the extremes of ionic strengths. The averages given are of a considerably larger number of determinations than t’hose shown. The titration constants of Cannan and Knight and of Sano are given for comparison. The agreement in the calculated ionization constants even where there were large differences in activity coefficients shows that the values used for these are nearly correct or that the errors are compensatory.
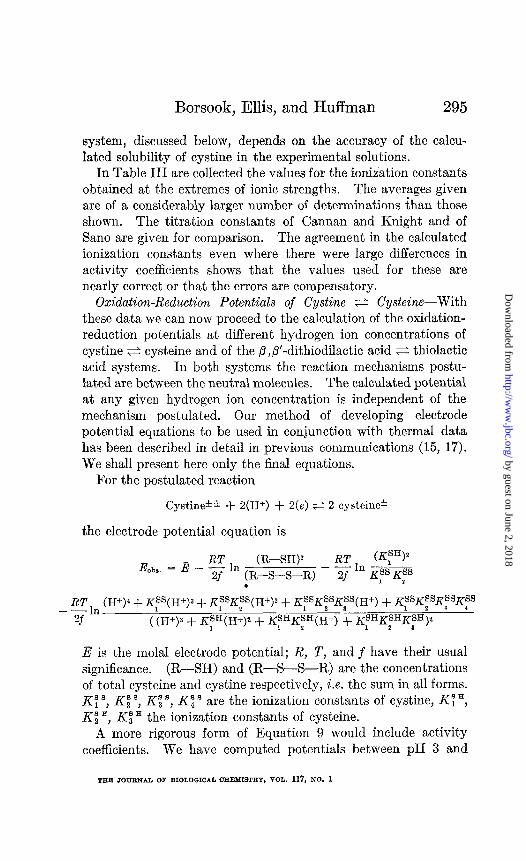
Oxidation-Reduction Potentials of Cystine s Cysteine-With these data we can now proceed to the calculation of the oxidation- reduction potentials at different hydrogen ion concentrations of cystine + cysteine and of the p,/?‘-dithiodilactic acid + thiolactic acid systems. In both systems the reaction mechanisms postu- lated are between the neutral molecules. The calculated potential at any given hydrogen ion concentration is independent of the mechanism postulated. Our method of developing electrode potential equations to be used in conjunction with thermal data has been described in detail in previous communications (15, 17). We shall present here only the final equations.
For the postulated reaction
Cystinekf + Z(H+) + 2(e) + 2 cysteine*
the electrode potential equation is
&bs. = j? - 5 In (R-SH)z (KSH)Z !R-S-S-R)
-!!$A Kss Kss
1 2
RT
-P
(H+)” + Kss(H+)3 +K,SSK~S(H+)z+K~SK~SK~s(H+,+K~SK~SK;SK~s
((H+)” + K;H(H+)2 + KFHKfH(H+) + KfHKfHKfH>2
E is the molal electrode potential; R, T, and j have their usual significance. (R-SH) and (R-S-S-R) are the concentrations of total cysteine and cystine respectively, i.e. the sum in all forms. KT ‘, Ki ‘, Ki ‘, Ki ’ are the ionization constants of cystine, KY =, K g a, Ki H the ionization constants of cysteine.
A more rigorous form of Equation 9 would include activity coefficients. We have computed potentials between pH 3 and
by guest on June 2, 2018http://w
ww
.jbc.org/D
ownloaded from
296 Oxidation-Reduction Potentials
pH 9, with ionic strengths varying from 0 to 0.2, and have found that the difference, when activity coefficients are taken into ac- count, is negligible. The activity coefficients used were those given in Tables II and IV.
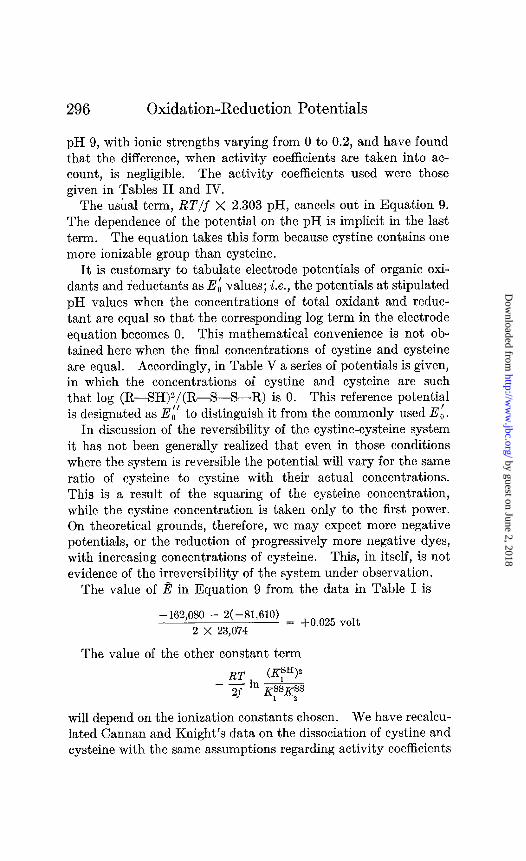
The usual term, RT/f X 2.303 pH, cancels out in Equation 9. The dependence of the potential on the pH is implicit in the last term. The equation takes this form because cystine contains one more ionizable group than cysteine.
It is customary to tabulate electrode potentials of organic oxi- dants and ieductants as Ei values; i.e., the potentials at stipulated pH values when the concentrations of total oxidant and reduc- tant are equal so that the corresponding log term in the electrode equation becomes 0. This mathematical convenience is not ob- tained here when the final concentrations of cystine and cysteine are equal. Accordingly, in Table V a series of potentials is given, in which the concentrations of cystine and cysteine are such that log (R-SH)2/(R-S-S-R) is 0. This reference potentia.1 is designated as Ei’ to distinguish it from the commonly used EL.
In discussion of the reversibility of the cystine-cysteine system it has not been generally realized that even in those conditions where the system is reversible the potential will vary for the same ratio of cysteine to cystine with their actual concentrations. This is a result of the squaring of the cysteine concentration, while the cystine concentration is taken only to the first power. On theoretical grounds, therefore, we may expect more negative potentials, or the reduction of progressively more negative dyes, with increasing concentrations of cysteine. This, in itself, is not evidence of the irreversibility of the system under observation.
The value of B in Equation 9 from the data in Table I is
-162,080 - 2(--81,610) = +. 025 volt
2 X 23,074
The value of the other constant term
(IPy -E$L p3sps
1 2
will depend on the ionization constants chosen. We have recalcu- lated Cannan and Knight’s data on the dissociation of cystine and cysteine with the same assumptions regarding activity coefficients
by guest on June 2, 2018http://w
ww
.jbc.org/D
ownloaded from
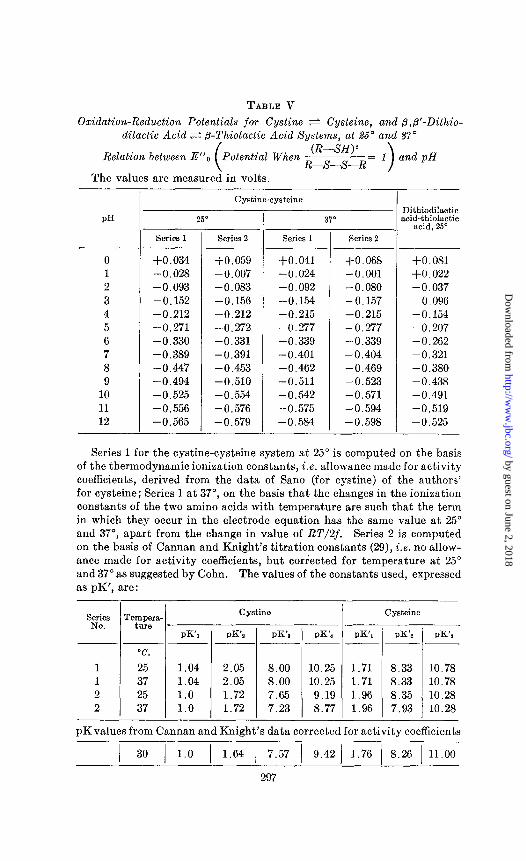
TABLE V
Oxidation-Reduction Potentials for Cystine e Cysteine, and fl,@‘-Dithio- dilactic Acid G p-Thiolactic Acid Systems, at 85” and bY”
Relation between E”o Potential When (R-SHJz
R-S-S-R The values are measured‘ in volts.
PH I- Series 1
-- 0 +0.034 1 -0.028 2 -0.093 3 -0.152 4 -0.212 5 -0.271 6 -0.330 7 -0.389 8 -0.447 9 -0.494
10 -0.525 11 -0.556 12 -0.565
I Cystine-cyst&m
-
250 -
-
Series 2 Series 1 Series 2
+0.059 +0.041 +0.068 +0.081 -0.007 -0.024 -0.001 +0.022 -0.083 -0.092 -0.080 -0.037 -0.156 -0.154 -0.157 -0.096 -0.212 -0.215 -0.215 -0.154 -0.272 -0.277 -0.277 -0.207 -0.331 -0.339 -0.339 -0.262 -0.391 -0.401 -0.404 -0.321 -0.453 -0.462 -0.469 -0.380 -0.510 -0.511 -0.523 -0.438 -0.554 -0.542 -0.571 -0.491 -0.576 -0.575 -0.594 -0.519 -0.579 -0.584 -0.598 -0.525
- 37” r Dithiodilactic
acid-thiolsctic acid. 25”
Series 1 for the cystine-cysteine system at 25” is computed on the basis of the thermodynamic ionization constants, i.e. allowance made for activity coefficients, derived from the data of Sano (for cystine) of the authors’ for cysteine; Series 1 at 37”, on the basis that the changes in the ionization constants of the two amino acids with temperature are such that the term in which they occur in the electrode equation has the same value at 25” and 37”, apart from the change in value of RT/2f. Series 2 is computed on the basis of Cannan and Knight’s titration constants (29), i.e. no allow- ance made for activity coefficients, but corrected for temperature at 25” and 37” as suggested by Cohn. The values of the constants used, expressed as pK’, are:
“i?:, 0 TeruQra-
~- “C.
1 25 1 37 2 25 2 37
Cystine
PK’I PK’S PK’S PK’~ ___~
1 PK’I PK’* PK’J
1.04 2.05 8.00 10.25 1.71 8.33 10.78 1.04 2.05 8.00 10.25 1.71 8.33 10.78 1.0 1.72 7.65 9.19 1.96 8.35 10.28 1.0 1.72 7.23 8.77 1.96 7.93 10.28
Cyst&e
pKvalues from Cannan and Knight’s data corrected for activity coefficients
( 30 1 1.0 1 1.64 1 7.57 1 9.42 1 1.76 ( 8.26 Ill.00
297
by guest on June 2, 2018http://w
ww
.jbc.org/D
ownloaded from
298 Oxidation-Reduction Potentials
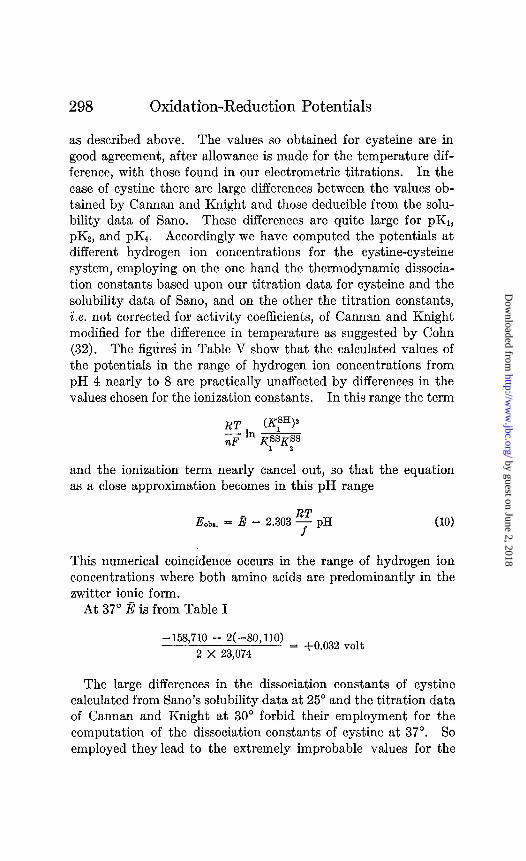
as described above. The values so obtained for cysteine are in good agreement, after allowance is made for the temperature dif- ference, with those found in our electrometric titrations. In the case of cystine there are large differences between the values ob- tained by Cannan and Knight and those deducible from the solu- bility data of Sano. These differences are quite large for pK,, pKZ, and pK4. Accordingly we have computed the potentials at different hydrogen ion concentrations for the cystine-cysteine system, employing on the one hand the thermodynamic dissocia- tion constants based upon our titration data for cysteine and the solubility data of Sano, and on the other the titration constants, i’.e. not corrected for activity coefficients, of Cannan and Knight modified for the difference in temperature as suggested by Cohn (32). The figures in Table V show that the calculated values of the potentials in the range of hydrogen ion concentrations from pH 4 nearly to 8 are practically unaffected by differences in the values chosen for the ionization constants. In this range the term
RT (KSH)2 no In L @x3&3s
12
and the ionization term nearly cancel out, so that the equation as a close approximation becomes in this pH range
RT Eob,. = E - 2.303 I pH (10)
This numerical coincidence occurs in the range of hydrogen ion concentrations where both amino acids are predominantly in the zwitter ionic form.
At 37” E is from Table I
-158,710 - a---80,110) = +. 032 ““lt
2 X 23,074
The large differences in the dissociation constants of cystine calculated from Sano’s solubility data at 25” and the titration data of Cannan and Knight at 30” forbid their employment for the computation of the dissociation constants of cystine at 37”. So employed they lead to the extremely improbable values for the
by guest on June 2, 2018http://w
ww
.jbc.org/D
ownloaded from
Borsook, Ellis, and Huffman 299
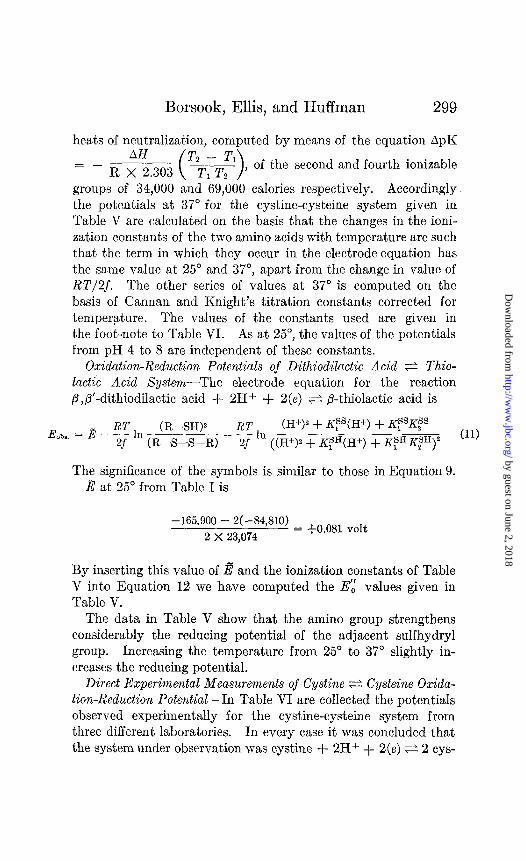
heats of neutralizat,ion, computed by means of the equation ApK
of the second and fourth ionizable
groups of 34,000 and 69,000 calories respectively. Accordingly the potentials at 37” for the cystine-cysteine system given in Table V are calculated on the basis that the changes in the ioni- zation constants of the two amino acids with temperature are such that the term in which they occur in the electrode equation has the same value at 25” and 37”, apart from the change in value of RT/2f. The other series of values at 37” is computed on the basis of Cannan and Knight’s titration constants corrected for temperature. The values of the constants used are given in the foot-note to Table VI. As at 25”, the values of the potentials from pH 4 to 8 are independent of these constants.
Oxidation-Reduction Potentials of Dithiodilactic Acid ti Thio- lactic Acid System-The electrode equation for the reaction /3,/Y-dithiodilactic acid + 2H+ + 2(e) f /3-thiolactic acid is
RT (R--~H)z %h.. = B - g In (R-s-s-R)
_ f"_~ ln (H+)" + @'@+I + K,s'K;' 2f ((H+)' + K,SH(H+) + KfHK,SH)' ("I
The significance of the symbols is similar to those in Equation 9. $ at 25” from Table I is
-165,900 - 2(-84,810) = +. 081 volt 2 X 23,074
By inserting this value of 8 and the ionization constants of Table V into Equation 12 we have computed the Ey values given in Table V.
The data in Table V show that the amino group strengthens considerably the reducing potential of the adjacent sulfhydryl group. Increasing the temperature from 25” to 37” slightly in- creases the reducing potential.
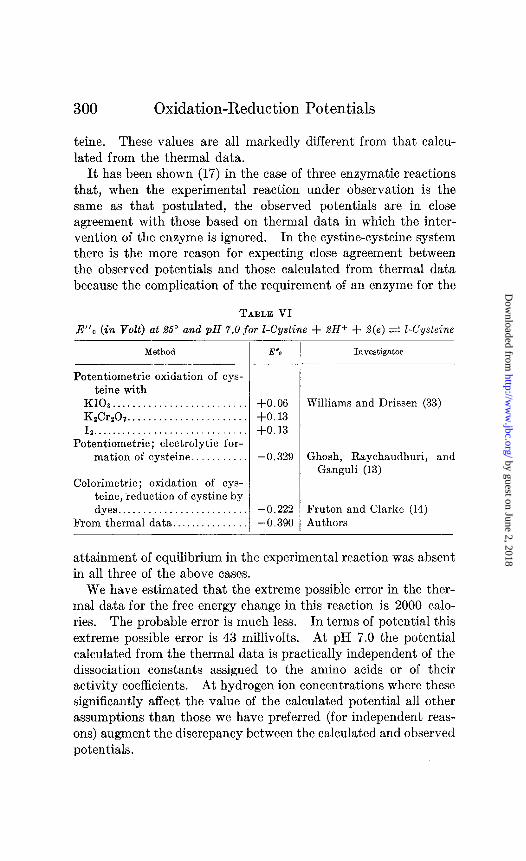
Direct Experimental Measurements of Cystine f Cysteine Oxida- tion-Reduction Potential-In Table VI are collected the potentials observed experimentally for the cystine-cysteine system from three different laboratories. In every case it was concluded that the system under observation was cystine + 2H+ + 2(e) --“, 2 cys-
by guest on June 2, 2018http://w
ww
.jbc.org/D
ownloaded from
300 Oxidation-Reduction Potentials
teine. These values are all markedly different from that calcu- lated from the thermal data.
It has been shown (17) in the case of three enzymatic reactions that, when the experimental reaction under observation is the same as that postulated, the observed potentials are in close agreement with those based on thermal data in which the inter- vention of the enzyme is ignored. In the cystine-cysteine system there is the more reason for expecting close agreement between the observed potentials and those calculated from thermal data because the complication of the requirement of an enzyme for the
TABLE VI
E’lo (in VoZt) at 2.5’ and pH 7.Ofor I-Cystine + 2H+ + 2(e) S I-Cysteine
Method
Potentiometric oxidation of cys- teine with
KIO 3.......................... K&rzOr.. . . . . . . 12.. . . . . . . . . . .
Potentiometi-ic; electrolytic for- mation of cysteine..
Calorimetric; oxidation of cys- teine, reduction of cystine by dyes. . . . . . . .
From thermal data.. .
E”Q Investigator
+0.06 +0.13 +0.13
-0.329
Williams and Drissen (33)
Ghosh, Raychaudhuri, and Ganguli (13)
-0.222 Fruton and Clarke (14) -0.390 Authors
attainment of equilibrium in the experimental reaction was absent in all three of the above cases.
We have estimated that the extreme possibie error in the ther- mal data for the free energy change in this reaction is 2000 calo- ries. The probable error is much less. In terms of potential this extreme possible error is 43 millivolts. At pH 7.0 the potential calculated from the thermal data is practically independent of the dissociation constants assigned to the amino acids or of their activity coefficients. At hydrogen ion concentrations where these significantly affect the value of the calculated potential all other assumptions than those we have preferred (for independent reas- ons) augment the discrepancy between the calculated and observed potentials.
by guest on June 2, 2018http://w
ww
.jbc.org/D
ownloaded from
Borsook, Ellis, and Huffman 301
It is certain that the calculated potential corresponds to the reaction which has been formulated only in the case of the ther- mal value. The reason for the large discrepancies in Table VI must therefore be sought in the experimental conditions in which the different values were obtained. In two of the three studies under consideration here the data given show conclusively that the potentials observed were significantly dependent on other re- actions which were not taken into account.
In the experiments of Williams and Drissen (33) the shape of the titration curves, and the variation of the E’,, values with the nature of the oxidizing agent indicate that what was actually measured, for example in the case of the iodine titration of cys- teine, was the reduction potential of the system IZ + 21-. This conclusion is corroborated by the behavior of cysteine toward dyes (14, 34). 0.01 N cysteine for example at 30” and pH 7.0 completely reduces indigomonosulfonate whose E’o is -0.16 volt. This would be impossible if the values of Williams and Drissen were even approximately correct.
There can be little doubt that the potentials observed by Ghosh, Raychaudhuri, and Ganguli (13) refer to a system in which cystine and cysteine are participants. These authors varied the concentrations of cystine and cysteine by electrolytic reduction of the cystine at the same mercury electrodes which were used to measure the potentials. The electrolysis also achieves, according to Ghosh and Ganguli, the necessary removal of the film of oxygen on the electrode. The potentials which they observed have been confirmed quantitatively by Green (34). He also confirmed their finding that the potential is 60 millivolts more negative after elec- trolysis than before.
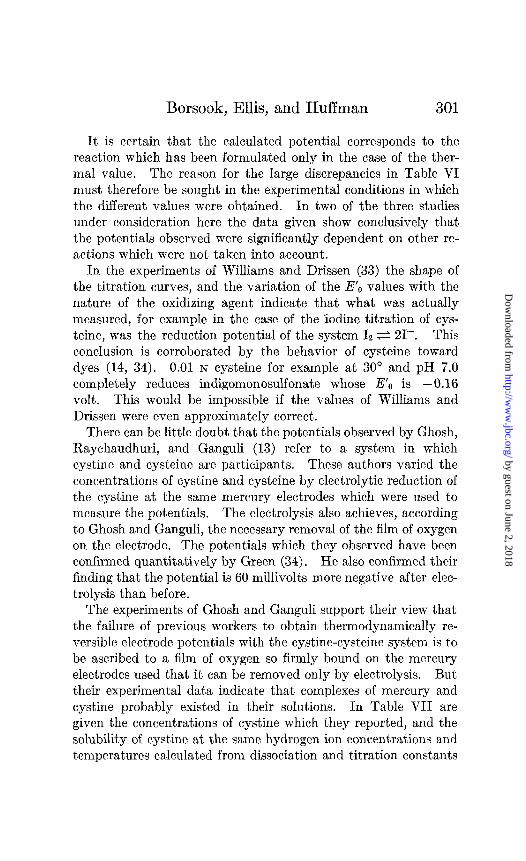
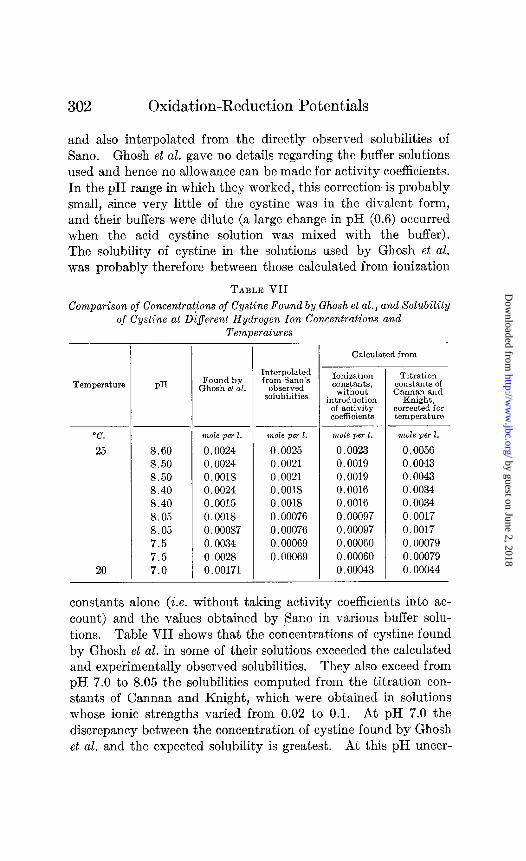
The experiments of Ghosh and Ganguli support their view that the failure of previo,us workers to obtain thermodynamically re- versible electrode potentials with the cystine-cysteine system is to be ascribed to a film of oxygen so firmly bound on the mercury electrodes used that it can be removed only by electrolysis. But their experimental data indicate that complexes of mercury and cystine probably existed in their solutions. In Table VII are given the concentrations of cystine which they reported, and the solubility of cystine at the same hydrogen ion concentrations and temperatures calculated from dissociation and titration constants
by guest on June 2, 2018http://w
ww
.jbc.org/D
ownloaded from
302 Oxidation-Reduction Potentials
and also interpolated from the directly observed solubilities of Sano. Ghosh et al. gave no details regarding the buffer solutions used and hence no allowance can be made for activity coefficients. In the pH range in which they worked, this correction is probably small, since very little of the cystine was in the divalent form, and their buffers were dilute (a large change in pH (0.6) occurred when the acid cystine solution was mixed with the buffer). The solubility of cystine in the solutions used by Ghosh et al. was probably therefore between those calculated from ionization
TABLE VII
Comparison of Concentrations of Cystine Found by Ghosh et al., and Xolubility of Custine at Different Hydrogen Ion Concentrations and
Temperatures T
Temperature PH
“C.
25
20
8.60 8.50 8.50 8.40 8.40 8.05 8.05 7.5 7.5 7.0
Found by Ghosh et al.
mole per 1.
0.0024 0.0024 0.0018 0.0024 0.0015 0.0018 0.00087 0.0034 0.0028 0.00171
Interpolated from Sano’s
observed solubilities
mole per 1.
0.0025 0.0021 0.0021 0.0018 0.0018 0.00076 0.00076 0.00069 0 00069
CiLlculated from
Ionization constants,
without introduction
of activity coeilicients
Titration constants of Ca~n~;h~d
corrected for temperature
mole per 1. mole per 2.
0.0023 0.0056 0.0019 0.0043 0.0019 0.0043 0.0016 0.0034 0.0016 0.0034 0.00097 0.0017 0.00097 0.0017 0.00060 0.00079 0.00060 0.00079 0.00043 0.00044
constants alone (i.e. without taking activity coefficients into ac- count) and the values obtained by Sano in various buffer solu- tions. Table VII shows that the concentrations of cystine found by Ghosh et al. in some of their solutions exceeded the calculated and experimentally observed solubilities. They also exceed from pH 7.0 to 8.05 the solubilities computed from the titration con- stants of Cannan and Knight, which were obtained in solutions whose ionic strengths varied from 0.02 to 0.1. At pH 7.0 the discrepancy between the concentration of cystine found by Ghosh et al. and the expected solubility is greatest. At this pH uncer-
by guest on June 2, 2018http://w
ww
.jbc.org/D
ownloaded from
Borsook, Ellis, and Huffman 303
tainties regarding dissociation constants and activity coefficients affect the value of the calculated solubility only to a slight extent. If the pH values of the solutions of Ghosh et al. were those re- ported, it follows that a large fraction of the cystine (supersatura- tion being excluded) was not free in solution. The obvious sug- gestion is that it existed in the form of a mercury-cystine complex.
An alternative hypothesis to complex formation, to account for the discrepancy between the solubility data and the concentration of cystine found by Ghosh et al., is that in the course of the elec- trolysis, not only was cysteine formed, but the solutions also became much more alkaline. This possibility is excluded by the concordance of the E. values obtained by Ghosh, Raychaudhuri, and Ganguli, by Green, and by Ghosh and Ganguli, calculated on the basis of initial pH (before electrolysis) in buffer solutions rang- ing from pH 7.0 to 9.2, and secondly by the observation of Green, that an electrolyzed solution gave the usual more positive poten- tial against fresh mercury.
In spite of the fact, therefore, that Ghosh et al. observed no precipitate when they passed H&S through their solutions, their data indicate that a mercury complex of cystine, and probably also therefore of cysteine, existed in their solutions. As a result their standard electrode potential, Eo, is composed not only of the molal electrode potential of the cystine-cysteine reaction, and the log of the ratio of their ionization constants, but also of a term for the ratio of the equilibrium constants of the two amino acids with mercury. It is improbable that the equilibria between cystine and cysteine and mercury are such that they exactly cancel each other.
We must call attention here to the combustion values for cys- tine and cysteine reported by Becker and Roth (35). These are lower than those given in Table I obtained in this laboratory. They yield standard free energy values, AP, of -82,480 and -166,630 for cysteine and cystine respectively, which lead to a value of +0.096 volt for B instead of +0.025 volt calculated from the thermal data in Table I. The higher figure for ,!8 gives E”o values in reasonably close agreement with those given of Ghosh et al. Thus at pH 7.0, E”, from our thermal data is -0.390 volt, according to Ghosh et al. it is -0.329 volt, and from the combustion data of Becker and Roth it is -0.319 volt.
by guest on June 2, 2018http://w
ww
.jbc.org/D
ownloaded from
304 Oxidation-Reduction Potentials
Nevertheless this agreement in the last two values is only for- tuitous. In a private communication Professor Roth agreed that their combustion values are less reliable than ours. Only a small amount of material was supplied them, and they burned it with- out either testing its purity or purifying it further. That it con- tained considerable impurity is indicated by the lower percentages of sulfur which they found, by their lower values for the heats of combustion, and by the large variations in the individual deter- minations.
Fruton and Clarke (14) measured the potential of the cystine- cysteine system calorimetrically. They measured the equilibrium degree of reduction of dyes with known oxidation-reduction poten- tials by different concentrations of cysteine at different hydrogen ion concentrations. The following evidence attested to the ther- modynamic reversibility and the accuracy of the observed poten- tials. The same E’o values (corresponding to E”O in Tables VI and VII) were obtained with different dyes and with different con- centrations of cysteine. The dyes in their reduced form were reoxidized by cystine, and the final degree of reoxidation attained was in accord with the E’, values given by the reduction experi- ments with cysteine.
From these observations the E”. value of the cystine-cysteine system at pH 7.0 and 25” is -0.22 volt, which is 100 millivolts more positive than the value given by Ghosh et al. and 170 milli- volts more positive than our thermal value.
These discrepancies are far beyond the possible experimental errors. We accordingly undertook a repetition of the experi- ments of Fruton and Clarke, and have confirmed them in principle, \Ihough we have been unable to confirm them in detail. We have found that an equilibrium is attained in vucuo, of which at least some, if not all, of the components are cysteine, cystine, and the oxidized and reduced forms of the dye. The E”o values we ob- tained were approximately 50 millivolts more negative than those reported by Fruton and Clarke.
We shall describe only the general features of our experimental procedure which was not essentially different in the reduction experiments from that of Fruton and Clarke. The cysteine was measured into the overhang of a Thunberg tube and the other solutions-dye, buffer, and cystine-into the lower compartment.
by guest on June 2, 2018http://w
ww
.jbc.org/D
ownloaded from
Borsook, Ellis, and Huffman
The vessel was evacuated and then the contents of the upper and lower compartments were mixed. The vessels containing different mixtures were then kept in a vacuum desiccator which was con- tinuously evacuated by an oil pump. The dyes and amino acids used were recrystallized specimens. The dyes finally chosen, indigodisulfonate and brilliant alizarin blue, were used in concen- trations of 0.00005 M and 0.0001 M. The final concentration of cysteine was varied from 0.0001 to 0.001 M, and of cystine up to 0.002 M. The experiments were carried out at room temperature and in buffer solutions at pH 7.5 (phosphate), 8.0, and 8.5 (borate). After equilibrium was attained, in 2 to 3 days, the vacuum in the desiccator was broken by admitting purified hydrogen or nitro- gen, and the colors in the Thunberg tubes compared with previ- ously prepared dilutions of the dye. The desiccator technique with continuous evacuation was used because we were unable otherwise to maintain a sufficiently high vacuum for the length of time required for the attainment of equilibrium. With these low concentrations of reactants an air leak giving a pressure of 1 mm. of Hg radically distorted the results.
We observed that in solutions containing the same concentra- tion of cysteine and different concentrations of added cystine that the degree of reduction finally attained was always less the higher the initial concentration of cystine. This was the case with bril- liant alizarin blue and with indigodisulfonate. On the assump- tion that the reaction here was simply 2 cysteine + oxidized dye ti cystine + reduced dye the calculated E”, value at pH 8.0 ‘was between -0.29 and -0.30. The corresponding value of Fruton and Clarke at 25” is approximately -0.27 volt. At pH 8.5, with brilliant alizarin blue, the E”o value we have found was between -0.32 and -0.34; that of Fruton and Clarke is -0.29 volt.
In most of the experiments the effect of the added cystine on the equilibrium degree of reduction was less than the theoretical amount calculated on the basis of the reaction 2 cysteine + reduced dye + cystine + oxidized dye. We do not at present attach more than semiquantitative significance to these observations and the above Efto values. The range of concentrations of cysteine, which gave degrees of reduction which were neither too low nor too high to be measured, was small, between 0.0004 M and 0.0007 M, with 0.0001 M indigodisulfonate; the maximum possible concentration
by guest on June 2, 2018http://w
ww
.jbc.org/D
ownloaded from
306 Oxidation-Reduction Potentials
of cystine at pH 8.5 is only approximately 0.002 M; and the method for measuring the color is crude.
In every instance, with and without added cystine, and with indigodisulfonate, brilliant alizarin blue, and cresyl violet, we observed a greater degree of reduction than the E”o values of Fruton and Clarke call for. In further disagreement with their observations we have been unable to observe any reoxidation of reduced dyes by cystine with concentrations of reactants and hydrogen ion concentration identical with theirs.
Nevertheless, in confirmation of Fruton and Clarke’s observa- tions, the dye-reducing potency of cysteine, which we have ob- served, fell far short of that called for by the Ey values of Ghosh et al., let alone the thermal values. The present situation of this problem may be summarized therefore as follows: *Two experi- mental systems have been found, those of Ghosh et al. and of Fruton and Clarke, in which cysteine and cystine participate in an oxidation-reduction equilibrium. The potentials obtained in these two systems differ by 100 millivolts, much too large a quan- tity to be ascribed to experimental. error. Both these directly obtained experimental values are more positive than the potential calculated from thermal data. The potential of Ghosh et al. is nearer to the thermal value, but even it differs by 70 millivolts. This difference is within the possible error of the thermal data. Yet the experimental data presented by Ghosh et al. show con- clusively that important reactions were not taken into account in their calculation of the potential. In view of the even greater difference, 170 millivolts, between the calorimetric and thermal values, it is highly probable that in these calorimetric measure- ments also there are important side reactions. The only possible doubt of the thermal value is regarding the accuracy of the actual experimental measurements. It is improbable that any correc- tions here would bring it into accord with one of the experimental values. While, as stated above, the final referenGe value for the stated reaction is the thermal value, its usefulness is limited. In any set of experimental conditions the experimental oxidation- reduction potential may be more pertinent. But the difference between it and the thermal value is an indication that the reaction is not simply the reduction of cystine to cysteine or vice versa.
Catalytic Action of Selenium Dioxide on Oxidation of Cysteine-
by guest on June 2, 2018http://w
ww
.jbc.org/D
ownloaded from
Borsook, Ellis, and Huffman
In the course of our calorimetric experiments we observed that small amounts of selenium dioxide catalyze the reduction of indi- godisulfonate by cysteine. Thus with 0.00005 M dye, 0.001 M
cysteine, and 0.00001 M SeOz, the dye is completely reduced in 1 hour at room temperature, whereas without the selenium dioxide nearly a week is required. Salts of iron, copper, cobalt, nickel, or magnesium do not possess this catalytic property. With high concentrations of cysteine (0.1 M) and SeOn (0.01 M) a white crystalline complex precipitates out of solution. Dissolved in strong HCl, red selenium and cystine precipitate out. The same degree of reduction of dyes was attained with selenium dioxide as without, both with and without added cystine. The only dyes we could use with this catalyst in the range of hydrogen ion con- centrations from pH 7.0 to 8.5 were indigodisulfonate and pheno- saf ranine . Brilliant alizarin blue, gallophenine, and cresyl violet appeared to be destroyed by it.
SUMMARY
1. Data are presented from which the oxidation-reduction po- tentials of the systems, cystine $ cysteine, and dithiodilactic acid + thiolactic acid, have been calculated.
2. These values and other evidence show that the potentials previously obtained for the cystine G cysteine system by direct measurement are not referable exclusively to this system.
3. Some experiments are described in which addition of cystine has been observed to affect the degree of reduction of dyes by cysteine.
4. Selenium dioxide is a catalyst for the reduction of indigodi- sulfonate (and probably other dyes not attacked by the selenium dioxide) by cysteine. A cysteine-selenium dioxide complex has been isolated.
BIBLIOGRAPHY
1. Hopkins, F. G., Biochem. J., 16, 286 (1921); 19, 787 (1925). 2. Hopkins, F. G., and Dixon, M., J. Biol. Chem., 64, 527 (1922). 3. Dixon, M., and Quastel, J. H., J. Chem. Sot., 123, 2943 (1923). 4. Dixon, M., Proc. Roy. Sot. London, Series B, 101, 57 (1927). 5. Michaelis, L., and Flexner, L. B., J. Biol. Chem., 79, 689 (1928). 6. Lewis, H. B., and McGinty, D. A., J. Biol. Chem., 63, 349 (1922). 7. Fabre, R., and Simonnet, H., Corn@ rend. Acad., 190, 1233 (1930).
by guest on June 2, 2018http://w
ww
.jbc.org/D
ownloaded from
308 Oxidation-Reduction Potentials
8. Hopkins, F. G., and Elliott, K. A. C., Proc. Roy. Sot. London, Series B, 109, 58 (1931).
9. Mann, P. J. G., Biochem. J., 26, 785 (1932). 10. Meldrum, N. U., Biochem. J., 26, 817 (1932). Meldrum, N. U., and
Tarr, H. L. A., Biochem. J., 29, 108 (1935). 11. Unpublished observations in this laboratory. 12. Borsook, H., Davenport, H. W., Jeffreys, C. E. P., and Warner, R. C.,
J. Biol. Chem., 117, 237 (1937). 13. Ghosh, J. C., Raychaudhuri, S. N., and Ganguli, S. C., J. Indian Chem.
Sot., 9, 43 (1932). Ghosh, J. C., and Ganguli, S. C., Biochem. J., 28, 381 (1934).
14. Fruton, J. S., and Clarke, H. T., J. Biol. Chem., 106, 667 (1934). 15. Borsook, H., and Schott, H. F., J. .BioZ. Chem., 92, 535, 559 (1931). 16. Borsook, H., and Huffman, H. M., J. Biol. Chem., 99, 663 (1932-33). 17. Borsook, H., in Nord, F. F., and Weidenhagen, R., Ergebnisse der
Enzymforschung, Leipsic, 4, 1 (1935). 18. Huffman, H. M., and Ellis, E. L., J. Am. Chem. Sot., 67,41,46 (1935). 19. Dalton, J. B., and Schmidt, C. L. A., J. BioZ. Chem., 103, 549 (1933);
109, 241 (1935). 20. Harned, H. S., and Owen, B. B., J. Am. Chem. Sot., 62, 5079 (1930). 21. Harned, H. S., and Owen, B. B., J. Am. Chem. Sot., 62, 5091 (1930). 22. Pfeiffer, P., and Wtirgler, J., Z. physiol. Chem., 97, 128 (1916). 23. Cohn, E. J., Naturwissenschaften, 20, 663 (1932). 24. Harned, H. S., and Hamer, W. J., J. Am. Chem. Sot., 66, 2194 (1933). 25. Spencer, H. M., J. Am. Chem. Sot., 64, 4490 (1932). 26. Larsson, E., and Adell, B., 2. physik. Chem., Abt. A, 166, 352 (1931). 27, Bjerrum, N., and Unmack, A., K. Dan&e Vidensk. Selsk., Math.-fysik.
Me&Z., 9, 1 (1929), cited by Larsson and Adell. 28. Simms, H. S., J. Physic. Chem., 32, 1121 (1928). 29. Cannan, R. K., and Knight, C. J. G., Biochem. J., 21, 1384 (1927). 30. Sano, K., B&hem. Z., 168, 14 (1926). 31. Tague, E. L., J. Am. Chem. Xoc., 42, 173 (1920). 32. Cohn, E. J., Ergebn. Physiol., 33, 781 (1931). 33. Williams, J. W., and Drissen, E. M., J. BioZ. Chem., 87, 441 (1930). 34. Green, D. E., Biochem. J., 27, 678 (1933). 35. Becker, G., and Roth, W. A., 2. physik. Chem., 169, 287 (1934).
by guest on June 2, 2018http://w
ww
.jbc.org/D
ownloaded from
HuffmanHenry Borsook, Emory L. Ellis and Hugh M.
THERMAL DATAPOTENTIALS DERIVED FROM
OXIDATION-REDUCTION SULFHYDRYL
1937, 117:281-308.J. Biol. Chem.
http://www.jbc.org/content/117/1/281.citation
Access the most updated version of this article at
Alerts:
When a correction for this article is posted•
When this article is cited•
alerts to choose from all of JBC's e-mailClick here
tml#ref-list-1
http://www.jbc.org/content/117/1/281.citation.full.haccessed free atThis article cites 0 references, 0 of which can be
by guest on June 2, 2018http://w
ww
.jbc.org/D
ownloaded from