Embed Size (px)
Citation preview
125
Data Analysis
Suggested Time: 2 Weeks
This is the first explicit focus on Data Analysis in Grade 3 but, as with other outcomes, it is ongoing throughout the year.

Grade 3 mathematics curriculum Guide - interim126
data analYsis
Unit OverviewFocus and Context
Math Connects
Students live in an increasingly complex world of information in which they need to learn how to make sense of the data that surrounds them. Students will be given opportunities to collect, organize, display, and interpret data to answer questions and solve problems. Previously, students have constructed and interpreted concrete graphs and pictographs to solve problems. In Grade 3, students will use tally marks, lists, charts, line plots, and bar graphs to organize data and interpret information relevant to their everyday life. Use the natural curiosity of students to incorporate data analysis as opportunities arise throughout the year, e.g. putting students’ names on a birthday graph to display in the classroom, deciding on a lunchtime activity, or comparing bedtimes, etc. When working with data, students discover not only answers to questions, but meaningful information that can evoke change in their world.
Data plays an important role in the information we receive on a daily basis from environmental print, newspapers, television, magazines, the Internet, etc. Other areas of mathematics are deeply embedded into this strand of the curriculum. When working through data analysis activities, students naturally draw upon other mathematical skills such as understanding of number, operations, patterning, and various problem solving strategies. Students view various forms of data in many other areas of the curriculum, such as prediction charts in Science, population graphs in Social Studies, or informational text in Language Arts. For students, the process of data analysis is not only interesting, but constitutes real problem solving linked to many aspects of their environment.
Grade 3 mathematics curriculum Guide - interim
data analYsis
127
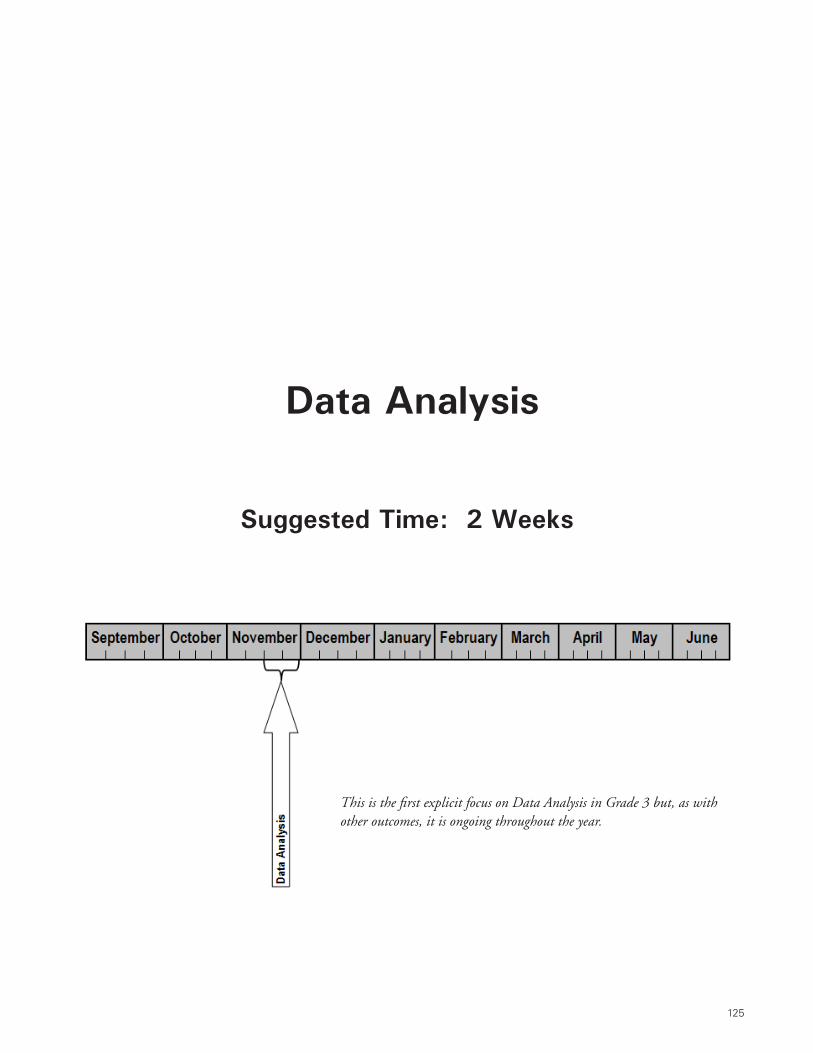
STRAND OUTCOME PROCESS STANDARDS
Statistics and Probability
(Data Analysis)
3SP1 Collect first-hand data and organize it using:
• tally marks• line plots• charts• liststo answer questions.
[C, CN, PS, V]
Statistics and Probability
(Data Analysis)
3SP2 Construct, label and interpret bar graphs to solve problems.
[C, PS, R, V]
Process Standards Key
Curriculum Outcomes
[C] Communication [PS] Problem Solving[CN] Connections [R] Reasoning [ME] Mental Mathematics [T] Technology and Estimation [V] Visualization
128 Grade 3 mathematics curriculum Guide - interim
Outcomes
data analYsis
elaborations—strategies for learning and teaching
Students will be expected to
strand: statistics and Probability (data analysis)
3SP1 Collect first-hand data and organize it using:
• tally marks
• line plots
• charts
• lists
to answer questions.
[C, CN, PS, V]
The key goal in the collection of data is to present information in a form that enables clear analysis and provides answers to otherwise obscure questions. Students have a natural tendency to ask questions and are keenly aware of the interests of their peers. Help students develop this interest through various forms of data collection and organization such as surveys, tallies, and graphical representations. It is important that data collection be relevant to their world, e.g., favourite season, shoe size, bedtimes, etc. Learning how to make inferences, develop and answer questions, and draw conclusions based on organized data, is integral to this strand of mathematics. These early skills provide students with a foundation for future critical viewing of various forms of informational and visual texts.
You may wish to use the book “Zoo Animals” by Eliza Collins (provided with Grade 2 implementation).
Achievement Indicator:
3SP1.1 Record the number of objects in a given set, using tally marks.
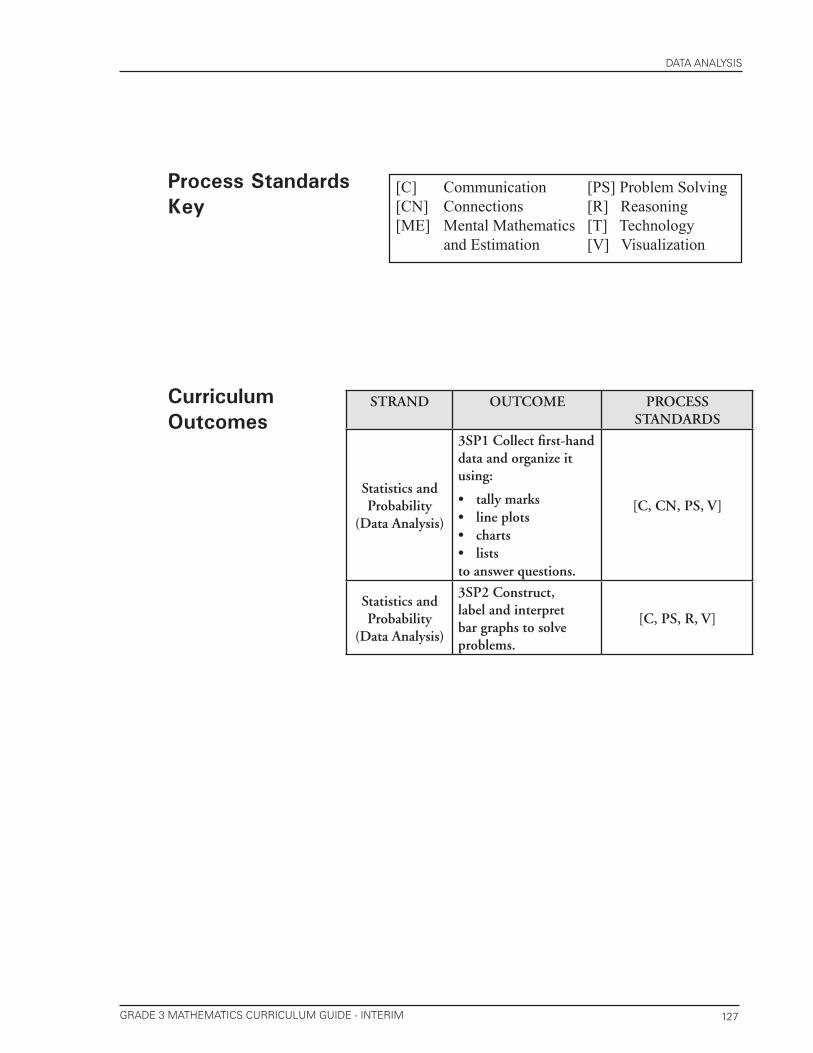
Gathering data requires an organized system of collecting the information. Using tally marks is a simple way for students to keep track of information as they collect it. Tally marks are most effective when recorded in an organized column chart like the one below. Grouping the tally marks in 5s makes it easier for students to total the numbers in each category by skip counting. Remind students to keep their bundles of 5 separate from each other. Tally charts should always be given a title to inform the reader about the meaning of the data.
Look at the following recording systems and discuss why it is easier to compare the numbers when presented in the second situation below.

129Grade 3 mathematics curriculum Guide - interim
suggested assessment strategies resources/notes
data analYsis
General Outcome: collect, display and analyze data to solve Problems
Journal
What do you know about graphs? When do we use graphs? Why do we use graphs? Draw a graph and tell about it. (3SP1)
Student - Teacher Dialogue
Ask students why it is easier to count the “yes” responses when they are shown like this, , rather than like this,
(3SP1.1)
Performance
Ask pairs of students to design a survey and a method of recording data that will show favourite school subjects. (3SP1.3, 3SP1.5)
Ask small groups to brainstorm a list of interesting questions for possible surveys. (3SP1.5)
Using a dot cube, ask students to roll 20 times, tallying each roll on an organized chart as they go. Ask them to write three questions that could be asked of their data. (3SP1.3, 3SP1.5)
•
•
•
•
•
Math Makes Sense 3
Launch: At the Vet
TG pp. 2 - 3
Lesson 1: Collecting and Organizing Data
3SP1
TG pp. 4 - 7
The “Explore” activity on TG pp. 4 is optional.
Additional Activity:
Colour Count
TG: p. v and 37
Children’s Literature: Collins, Eliza. Zoo Animals (provided with Gr. 2 implementation)

130 Grade 3 mathematics curriculum Guide - interim
Outcomes
data analYsis
elaborations—strategies for learning and teaching
Students will be expected to
strand: statistics and Probability (data analysis)
3SP1 Continued
Achievement Indicator:
3SP1.2 Answer questions using collected data.
“Once a graph is constructed, the most important activity is discussing what it tells the people who see it, especially those who were not involved in making the graph”. (Van de Walle and Lovin, p. 318, 2006)
A good graph should communicate some overall impressions of the data to a reader ‘at a glance’. It is important that the graph accurately represents the data and includes clear labelling and a title. Teachers use visual displays of data so students can make inferences about what they see in a graph with appropriate justification.
131Grade 3 mathematics curriculum Guide - interim
suggested assessment strategies resources/notes
data analYsis
General Outcome: collect, display and analyze data to solve Problems
Presentation
Ask students to select a topic, survey family members and/or friends and neighbours, and present their findings to the class in an organized way. Prepare three questions for the class based on their data. (3SP1.5, 3SP1.2)
Portfolio
Ask students to keep track of weather conditions over the period of one month and to design a way to present the information in an organized way. Ask students to provide three conclusions about their data. (3SP1.5, 3SP1.2)
Paper and Pencil
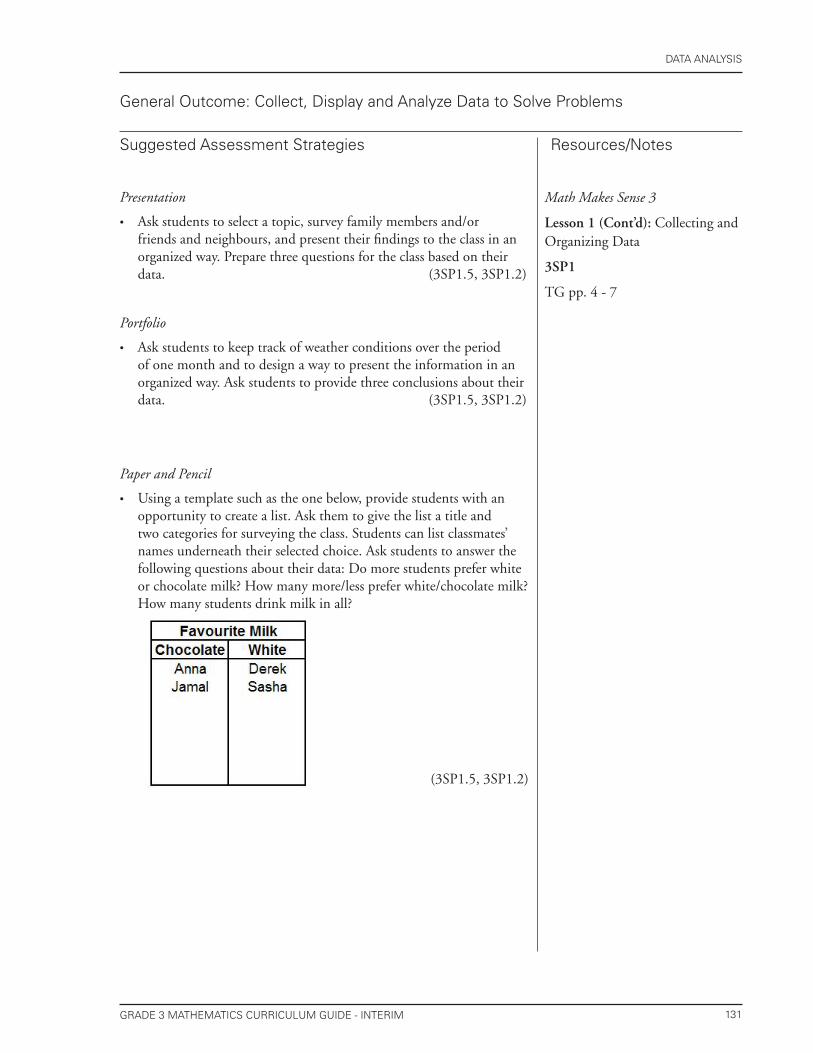
Using a template such as the one below, provide students with an opportunity to create a list. Ask them to give the list a title and two categories for surveying the class. Students can list classmates’ names underneath their selected choice. Ask students to answer the following questions about their data: Do more students prefer white or chocolate milk? How many more/less prefer white/chocolate milk? How many students drink milk in all?
(3SP1.5, 3SP1.2)
•
•
•
Math Makes Sense 3
Lesson 1 (Cont’d): Collecting and Organizing Data
3SP1
TG pp. 4 - 7
132 Grade 3 mathematics curriculum Guide - interim
Outcomes
data analYsis
elaborations—strategies for learning and teaching
Students will be expected to
strand: statistics and Probability (data analysis)
3SP1 ContinuedAchievement Indicators:
3SP1.3 Organize a given set of data, using tally marks, line plots, charts or lists.
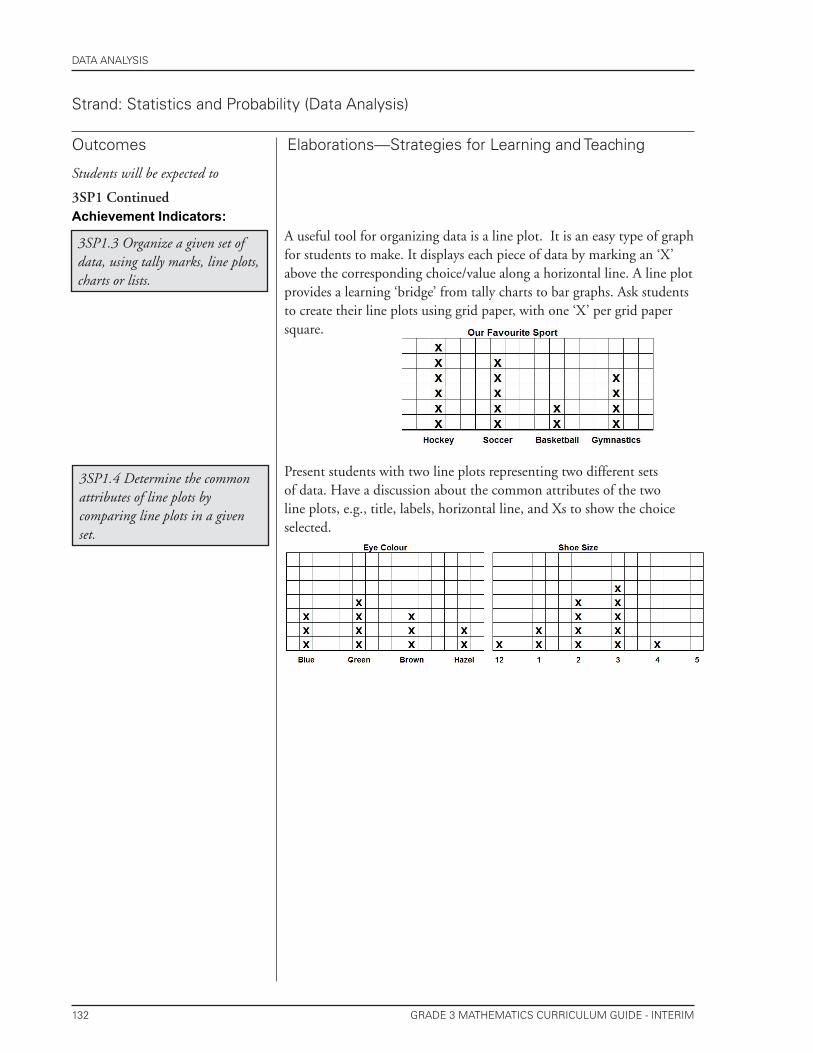
A useful tool for organizing data is a line plot. It is an easy type of graph for students to make. It displays each piece of data by marking an ‘X’ above the corresponding choice/value along a horizontal line. A line plot provides a learning ‘bridge’ from tally charts to bar graphs. Ask students to create their line plots using grid paper, with one ‘X’ per grid paper square.
3SP1.4 Determine the common attributes of line plots by comparing line plots in a given set.
Present students with two line plots representing two different sets of data. Have a discussion about the common attributes of the two line plots, e.g., title, labels, horizontal line, and Xs to show the choice selected.
133Grade 3 mathematics curriculum Guide - interim
suggested assessment strategies resources/notes
data analYsis
General Outcome: collect, display and analyze data to solve Problems
Paper and Pencil
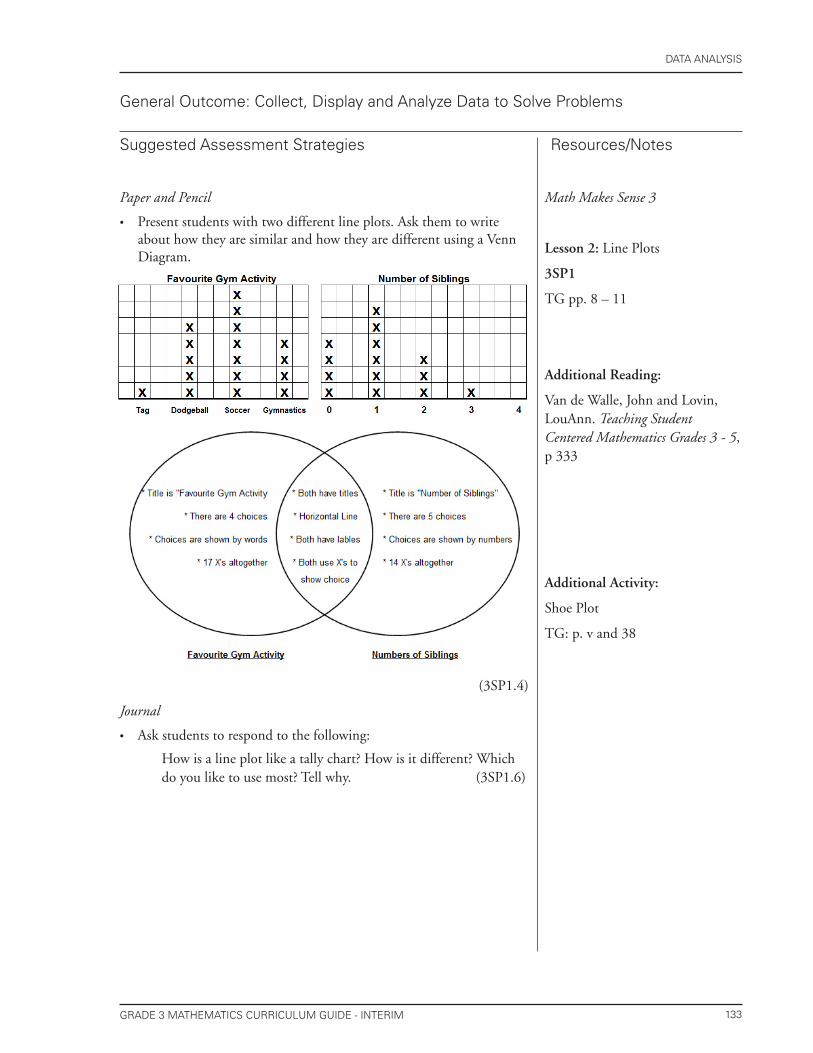
Present students with two different line plots. Ask them to write about how they are similar and how they are different using a Venn Diagram.
(3SP1.4)
Journal
Ask students to respond to the following:
How is a line plot like a tally chart? How is it different? Which do you like to use most? Tell why. (3SP1.6)
•
•
Math Makes Sense 3
Lesson 2: Line Plots
3SP1
TG pp. 8 – 11
Additional Reading:
Van de Walle, John and Lovin, LouAnn. Teaching Student Centered Mathematics Grades 3 - 5, p 333
Additional Activity:
Shoe Plot
TG: p. v and 38
134 Grade 3 mathematics curriculum Guide - interim
Outcomes
data analYsis
elaborations—strategies for learning and teaching
Students will be expected to
strand: statistics and Probability (data analysis)
3SP1 Continued
Achievement Indicator:
3SP1.5 Collect and organize data, using tally marks, line plots, charts and lists.
At this level, students should be encouraged to become more independent in the selection of appropriate strategies for collecting and organizing data. Ask pairs of students to decide on the procedure they will use to collect and organize data that will show interesting information about classmates.
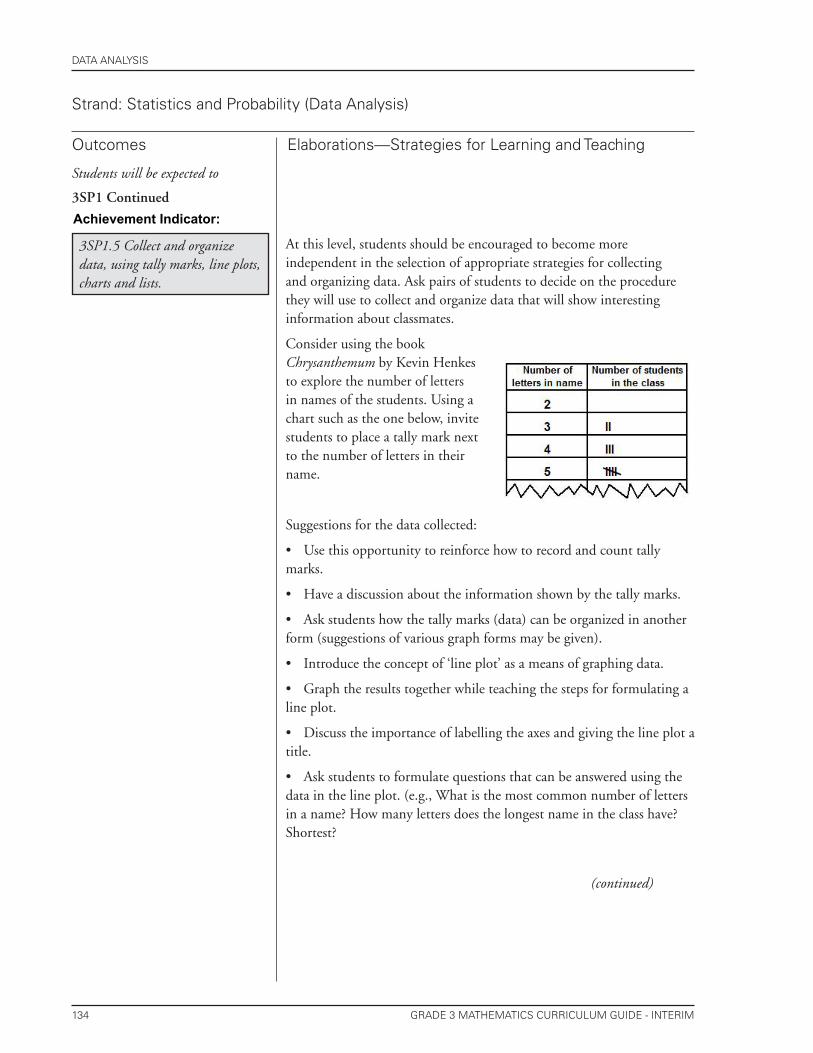
Consider using the book Chrysanthemum by Kevin Henkes to explore the number of letters in names of the students. Using a chart such as the one below, invite students to place a tally mark next to the number of letters in their name.
Suggestions for the data collected:
• Use this opportunity to reinforce how to record and count tally marks.
• Have a discussion about the information shown by the tally marks.
• Ask students how the tally marks (data) can be organized in another form (suggestions of various graph forms may be given).
• Introduce the concept of ‘line plot’ as a means of graphing data.
• Graph the results together while teaching the steps for formulating a line plot.
• Discuss the importance of labelling the axes and giving the line plot a title.
• Ask students to formulate questions that can be answered using the data in the line plot. (e.g., What is the most common number of letters in a name? How many letters does the longest name in the class have? Shortest?
(continued)
135Grade 3 mathematics curriculum Guide - interim
suggested assessment strategies resources/notes
data analYsis
General Outcome: collect, display and analyze data to solve Problems
Math Makes Sense 3
Lesson 2 (Cont’d): Line Plots
3SP1
TG pp. 8 – 11
Children’s Literature (not provided):
Henkes, Kevin. Chrysanthemum
ISBN 0-688-09699-9
136 Grade 3 mathematics curriculum Guide - interim
Outcomes
data analYsis
elaborations—strategies for learning and teaching
Students will be expected to
strand: statistics and Probability (data analysis)
The following activity can be done in groups of three or four:
• Brainstorm a list of interesting questions for possible surveys. (Survey questions may include: favourite TV show, favourite sport, favourite genre of movie, bedtimes, popular cafeteria choices, etc).
• Each group will select a question and a method for collecting their data.
• Allow each group to choose another classroom in which to carry out their survey.
• Each group will organize their collected data for presentation to the class.
• Ask the groups to prepare three questions for analysis of their data.
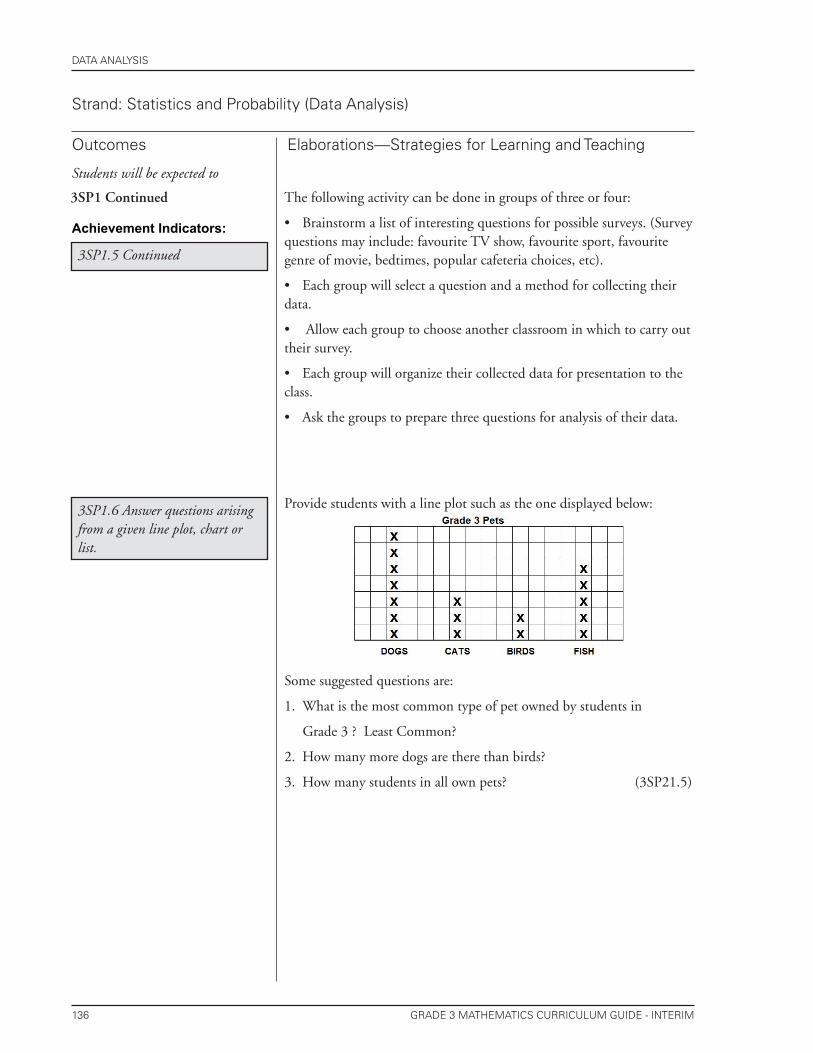
3SP1.6 Answer questions arising from a given line plot, chart or list.
Provide students with a line plot such as the one displayed below:
Some suggested questions are:
1. What is the most common type of pet owned by students in
Grade 3 ? Least Common?
2. How many more dogs are there than birds?
3. How many students in all own pets? (3SP21.5)
3SP1 Continued
Achievement Indicators:
3SP1.5 Continued
137Grade 3 mathematics curriculum Guide - interim
suggested assessment strategies resources/notes
data analYsis
General Outcome: collect, display and analyze data to solve Problems
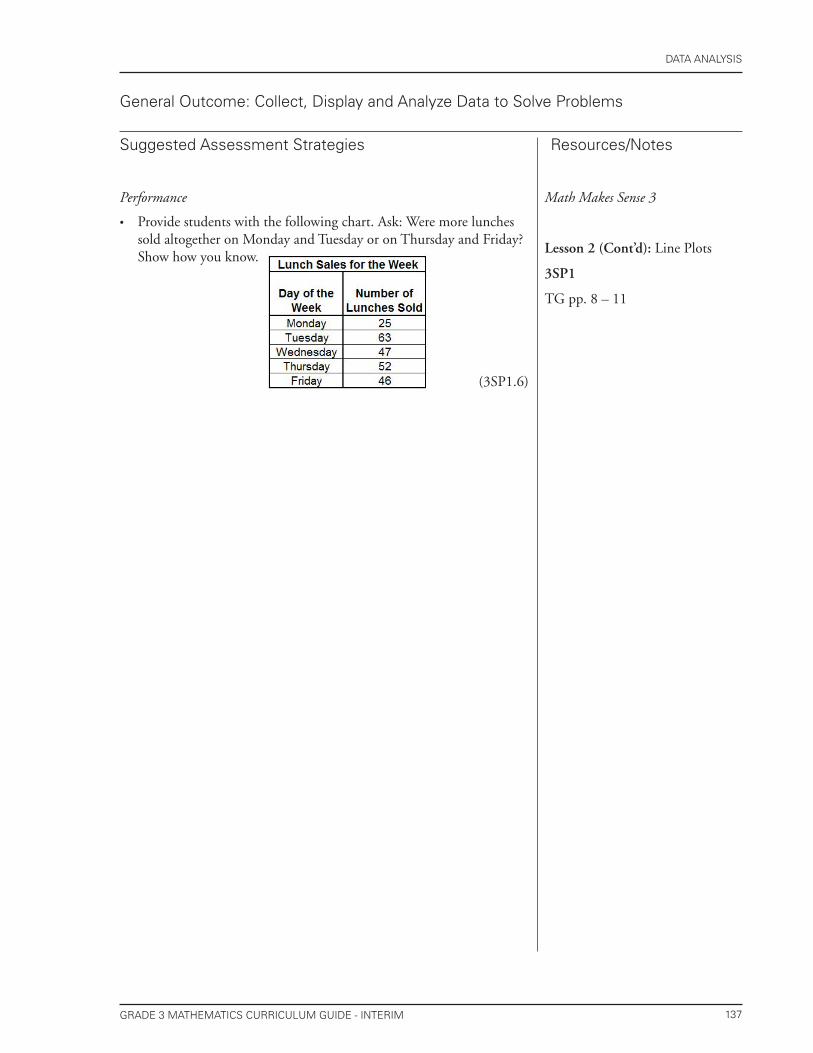
Performance
Provide students with the following chart. Ask: Were more lunches sold altogether on Monday and Tuesday or on Thursday and Friday? Show how you know.
(3SP1.6)
•
Math Makes Sense 3
Lesson 2 (Cont’d): Line Plots
3SP1
TG pp. 8 – 11

138 Grade 3 mathematics curriculum Guide - interim
Outcomes
data analYsis
elaborations—strategies for learning and teaching
Students will be expected to
strand: statistics and Probability (data analysis)
3SP2 Construct, label and interpret bar graphs to solve problems.
[C, PS, R, V]
Initially, students will focus on reading and interpreting given bar graphs, but will later construct bar graphs.
A bar graph is another useful tool for organizing data. Students will explore both vertical and horizontal bar graphs, making the connection that the height or length of the bars represents a number. Ensure that all graphing activities are based on one-to-one correspondence. Many-to-one correspondence will be introduced in Grade 4. Spacing the bars on a graph makes it easier for students to read, and also shows that each bar represents a separate category. When reading a bar graph, teach students to use a ruler, index card, or finger to find the number on the axis that aligns with each bar.
Using multi link cubes is an effective way to model a bar graph before students create their own, on paper. Remind students of the book, Chrysanthemum. Create a bar of 13 multilinks with one block representing each letter of Chrysanthemum’s name. Provide multi link cubes for each student to make a bar to represent his/her own name. In groups of 4 or 5, ask students to arrange their ‘bars’ in a horizontal or vertical bar graph. Ask them what they notice about the information represented in their multilink bar graphs. Ask each group to share their findings, using appropriate mathematical language such as ‘more than’, ‘ less than’ or ‘fewest’ instead of ‘taller’, ‘smaller’ and ‘shortest’. You may extend this activity and ask students to create a whole class name graph (with multi links).
Keep the multilink bars together and after students have had some experience with constructing bar graphs, you may ask them to transfer the information to paper. Brainstorm an appropriate title for the graph and how to label the axes.

139Grade 3 mathematics curriculum Guide - interim
suggested assessment strategies resources/notes
data analYsis
General Outcome: collect, display and analyze data to solve Problems
Journal
Ask students to respond to the following: What would happen if the bars in a graph got rearranged? Would the graph still give you the same information? Explain. (3SP2.4)
Student –Teacher Dialogue
Ask students to look at the following bar graph and suggest a reasonable title based on the data presented. Ask for three conclusions that can be drawn from the data.
(3SP2.1, 3SP2.3)
Provide students with two bar graphs that have no titles or labels. Ask students to infer what they think the graphs might be about. Ask: Which graph might compare the number of children on a team to coaches? Which graph might compare the number of 8-year-olds to 9-year-olds on a team? Ask them to explain their thinking. Ask why they think the second graph makes it obvious that they are comparing the number of coaches to children on a team? (3SP2.3)
•
•
•
Math Makes Sense 3
Lesson 3: Reading Bar Graphs
3SP2
TG pp. 12 - 15
140 Grade 3 mathematics curriculum Guide - interim
Outcomes
data analYsis
elaborations—strategies for learning and teaching
Students will be expected to
strand: statistics and Probability (data analysis)
3SP2 Continued
Achievement Indicator:
3SP2.1 Determine the common attributes, titles and axes of bar graphs by comparing bar graphs in a given set.
Present students with vertical and horizontal bar graphs that represent two different sets of data. Discuss what common attributes the two bar graphs have, e.g., title, axes, labels for the axes, numerical scale, and bars. Discuss how the two bar graphs are different, e.g., the titles of the graphs, labels for the axes, lengths of the bars, and how some graphs have horizontal bars and others have vertical bars.
141Grade 3 mathematics curriculum Guide - interim
suggested assessment strategies resources/notes
data analYsis
General Outcome: collect, display and analyze data to solve Problems
Paper and Pencil
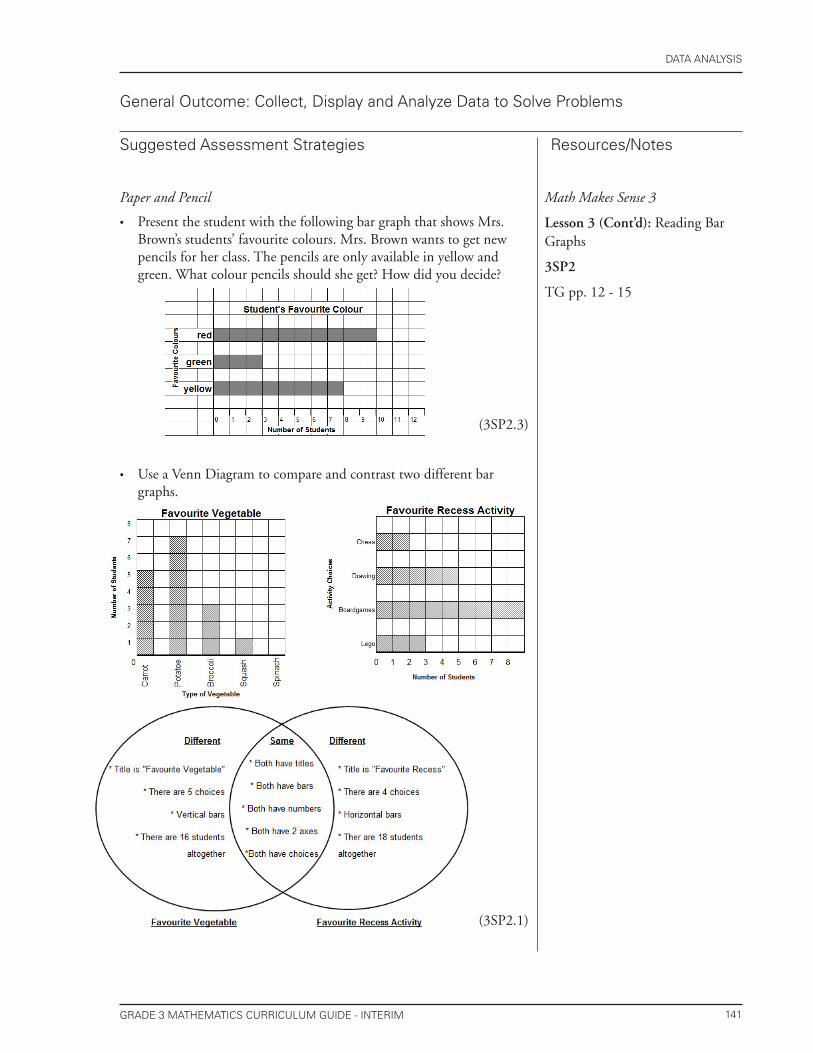
Present the student with the following bar graph that shows Mrs. Brown’s students’ favourite colours. Mrs. Brown wants to get new pencils for her class. The pencils are only available in yellow and green. What colour pencils should she get? How did you decide?
(3SP2.3)
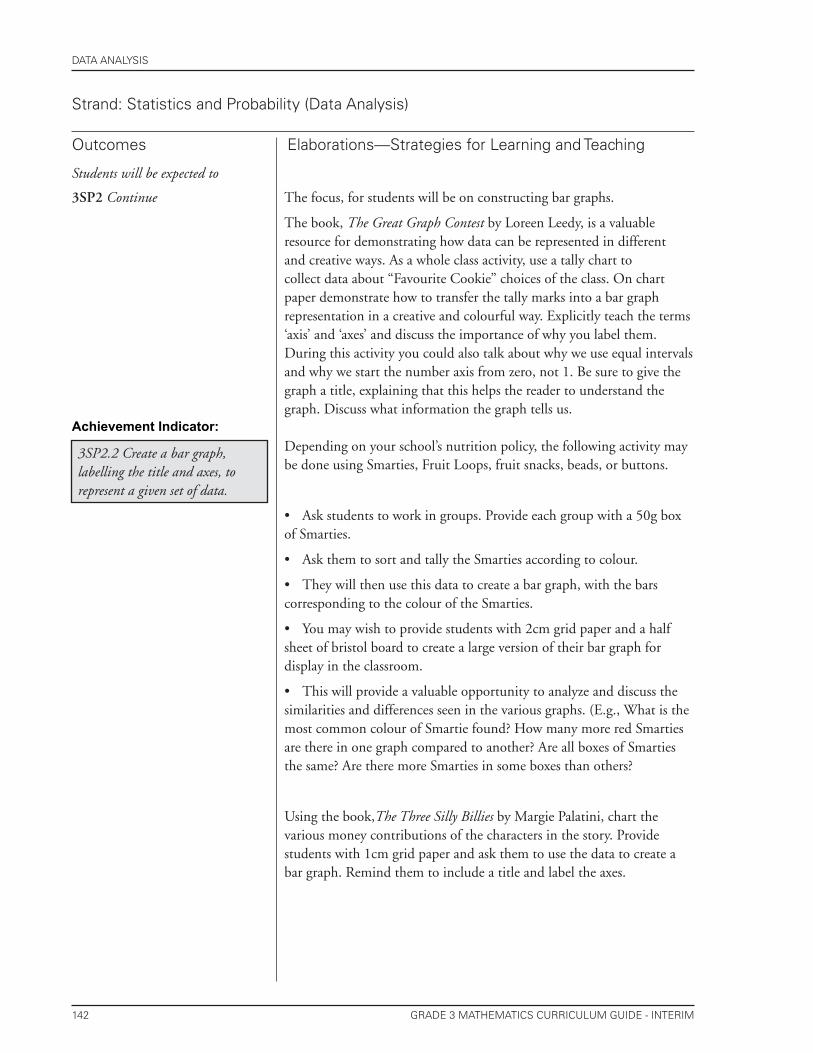
Use a Venn Diagram to compare and contrast two different bar graphs.
(3SP2.1)
•
•
Math Makes Sense 3
Lesson 3 (Cont’d): Reading Bar Graphs
3SP2
TG pp. 12 - 15
142 Grade 3 mathematics curriculum Guide - interim
Outcomes
data analYsis
elaborations—strategies for learning and teaching
Students will be expected to
strand: statistics and Probability (data analysis)
3SP2 Continue The focus, for students will be on constructing bar graphs.
The book, The Great Graph Contest by Loreen Leedy, is a valuable resource for demonstrating how data can be represented in different and creative ways. As a whole class activity, use a tally chart to collect data about “Favourite Cookie” choices of the class. On chart paper demonstrate how to transfer the tally marks into a bar graph representation in a creative and colourful way. Explicitly teach the terms ‘axis’ and ‘axes’ and discuss the importance of why you label them. During this activity you could also talk about why we use equal intervals and why we start the number axis from zero, not 1. Be sure to give the graph a title, explaining that this helps the reader to understand the graph. Discuss what information the graph tells us.
Achievement Indicator:
3SP2.2 Create a bar graph, labelling the title and axes, to represent a given set of data.
Depending on your school’s nutrition policy, the following activity may be done using Smarties, Fruit Loops, fruit snacks, beads, or buttons.
• Ask students to work in groups. Provide each group with a 50g box of Smarties.
• Ask them to sort and tally the Smarties according to colour.
• They will then use this data to create a bar graph, with the bars corresponding to the colour of the Smarties.
• You may wish to provide students with 2cm grid paper and a half sheet of bristol board to create a large version of their bar graph for display in the classroom.
• This will provide a valuable opportunity to analyze and discuss the similarities and differences seen in the various graphs. (E.g., What is the most common colour of Smartie found? How many more red Smarties are there in one graph compared to another? Are all boxes of Smarties the same? Are there more Smarties in some boxes than others?
Using the book,The Three Silly Billies by Margie Palatini, chart the various money contributions of the characters in the story. Provide students with 1cm grid paper and ask them to use the data to create a bar graph. Remind them to include a title and label the axes.
143Grade 3 mathematics curriculum Guide - interim
suggested assessment strategies resources/notes
data analYsis
General Outcome: collect, display and analyze data to solve Problems
Performance
Ask students to collect data, tally the results and create a bar graph ensuring they include proper labelling of axes and title.
E.g., - kinds of footwear students are wearing
- favourite after school activities (3SP2.2)
•
Math Makes Sense 3
Lesson 4: Drawing Bar Graphs
3SP2
TG pp. 16 - 19
Activity 5 on TG, pp.19 deals with body lengths using the standard unit metre. Please note that the measurement strand is not developed until later in the year.
Additional Activity:
Boys or Girls
TG: p. v and 39
Children’s Literature (not provided):
Leedy, Loreen. The Great Graph Contest ISBN 0823417107
Children’s Literature: (provided) Palatini, Margie. The Three Silly Billies
144 Grade 3 mathematics curriculum Guide - interim
Outcomes
data analYsis
elaborations—strategies for learning and teaching
Students will be expected to
strand: statistics and Probability (data analysis)
3SP2 Continued
Achievement Indicators:
3SP2.3 Draw conclusions from a given bar graph to solve problems.
Although students may be able to create bar graphs, some may experience difficulty with interpreting them correctly.
As much as possible, ensure that there are reasons for collecting data. Data may be collected to answer questions, to discover something of interest, or most importantly, to solve a problem such as any of the following:
• What should students be allowed to do during the lunch break on inside days?
• What foods should be available on the cafeteria menu? Removed from the cafeteria menu?
• What activities would you like to do in the gym?
As a class, develop a survey that can be conducted school wide, primary/elementary level, grade level, or in the class.
Carry out the survey using a tally chart. Once the data has been collected, combine and total the data for organizing into a bar graph. Analyze the data and present findings to the school principal, another class, or at grade level.
3SP2.4 Solve problems by constructing and interpreting a bar graph.
145Grade 3 mathematics curriculum Guide - interim
suggested assessment strategies resources/notes
data analYsis
General Outcome: collect, display and analyze data to solve Problems
Paper and Pencil
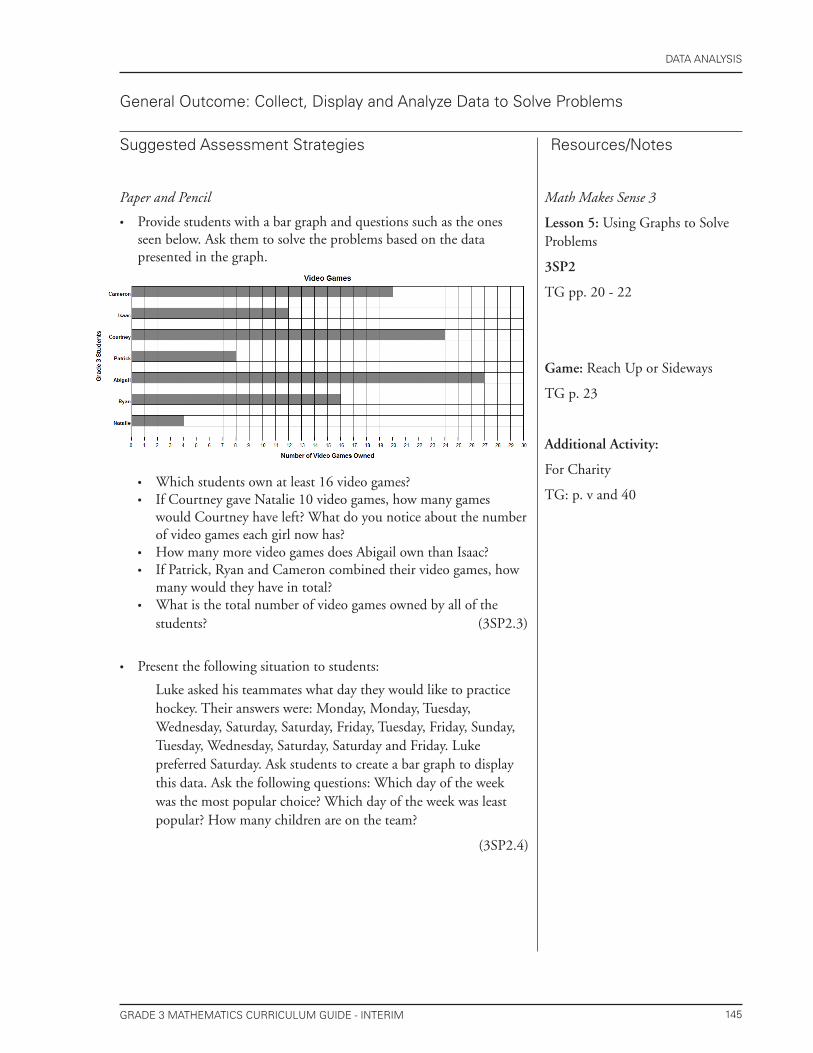
Provide students with a bar graph and questions such as the ones seen below. Ask them to solve the problems based on the data presented in the graph.
Which students own at least 16 video games?If Courtney gave Natalie 10 video games, how many games would Courtney have left? What do you notice about the number of video games each girl now has?How many more video games does Abigail own than Isaac?If Patrick, Ryan and Cameron combined their video games, how many would they have in total?What is the total number of video games owned by all of the students? (3SP2.3)
Present the following situation to students:
Luke asked his teammates what day they would like to practice hockey. Their answers were: Monday, Monday, Tuesday, Wednesday, Saturday, Saturday, Friday, Tuesday, Friday, Sunday, Tuesday, Wednesday, Saturday, Saturday and Friday. Luke preferred Saturday. Ask students to create a bar graph to display this data. Ask the following questions: Which day of the week was the most popular choice? Which day of the week was least popular? How many children are on the team?
(3SP2.4)
•
••
••
•
•
Math Makes Sense 3
Lesson 5: Using Graphs to Solve Problems
3SP2
TG pp. 20 - 22
Game: Reach Up or Sideways
TG p. 23
Additional Activity:
For Charity
TG: p. v and 40
146 Grade 3 mathematics curriculum Guide - interim
Outcomes
data analYsis
elaborations—strategies for learning and teaching
strand: statistics and Probability (data analysis)
Problem Solving Strategy:
Solve a Simpler Problem
Learning how to solve problems in mathematics begins with knowing what to look for. Math problems often require more than one step and knowing what strategy to apply to get started.
Previously, students have been introduced to the strategies of ‘Use a Pattern’ and ‘Make an Organized List’.
An additional strategy that can be used is to ‘Solve a Simpler Problem’. To use this strategy, first solve a simpler or more familiar part of the problem. Then use the information learned to solve the bigger problem. This strategy is useful when solving more complex problems. It allows students to reduce large numbers to smaller numbers. It can also reduce the number of items given in the problem thus providing a more manageable starting point. Sometimes a simpler representation will show a pattern which can help solve a problem.
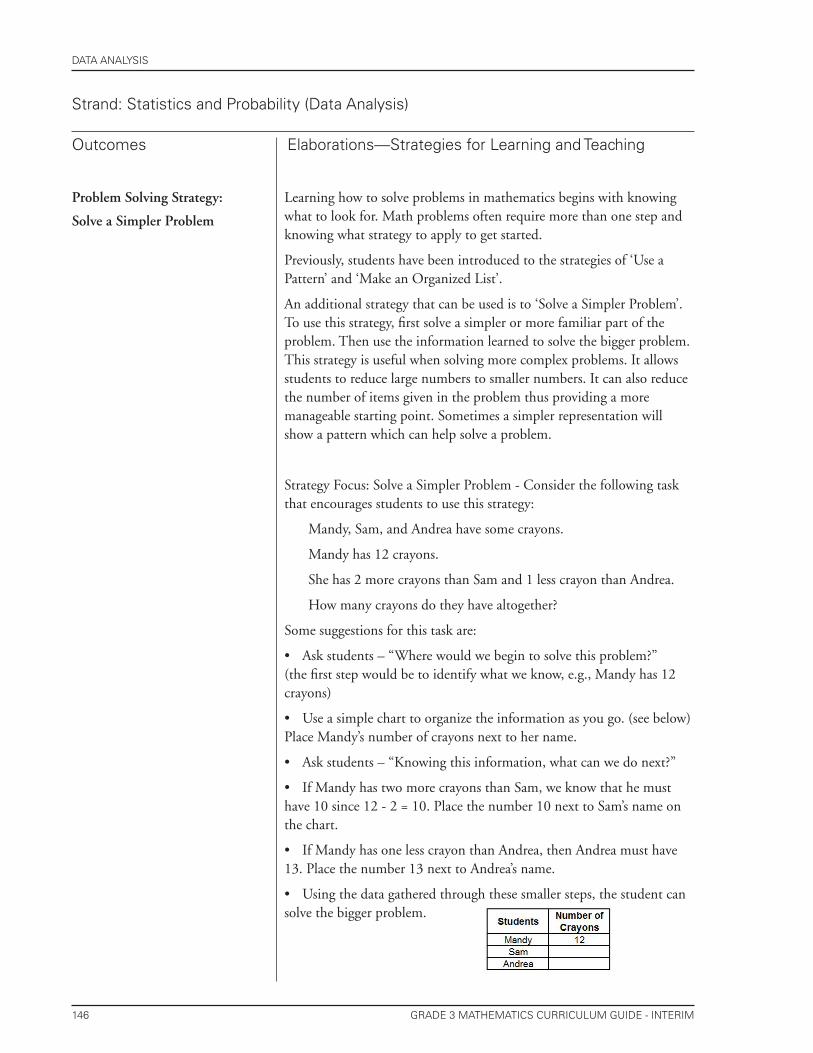
Strategy Focus: Solve a Simpler Problem - Consider the following task that encourages students to use this strategy:
Mandy, Sam, and Andrea have some crayons.
Mandy has 12 crayons.
She has 2 more crayons than Sam and 1 less crayon than Andrea.
How many crayons do they have altogether?
Some suggestions for this task are:
• Ask students – “Where would we begin to solve this problem?” (the first step would be to identify what we know, e.g., Mandy has 12 crayons)
• Use a simple chart to organize the information as you go. (see below) Place Mandy’s number of crayons next to her name.
• Ask students – “Knowing this information, what can we do next?”
• If Mandy has two more crayons than Sam, we know that he must have 10 since 12 - 2 = 10. Place the number 10 next to Sam’s name on the chart.
• If Mandy has one less crayon than Andrea, then Andrea must have 13. Place the number 13 next to Andrea’s name.
• Using the data gathered through these smaller steps, the student can solve the bigger problem.
147Grade 3 mathematics curriculum Guide - interim
suggested assessment strategies resources/notes
data analYsis
Performance
Using a large ‘walk on’ number line, ask students to enact the following problem:
Jane climbed 15 steps up the giant slide. She climbed down 6 steps to talk to her friend, Laura. Then she climbed up 8 steps to get to the top. How many steps does the slide have?
Using play coins, ask students to work through the following problem demonstrating the various coin amounts as they go:
Samantha had 73 cents.
She found 25 cents on the sidewalk.
She bought one small milk for 55 cents.
How much money did Samantha have left?
Journal
Ask students to solve the following problems:
(i) The movie theatre has 95 seats. 51 children and 24 adults went to the early show.How many seats were empty?
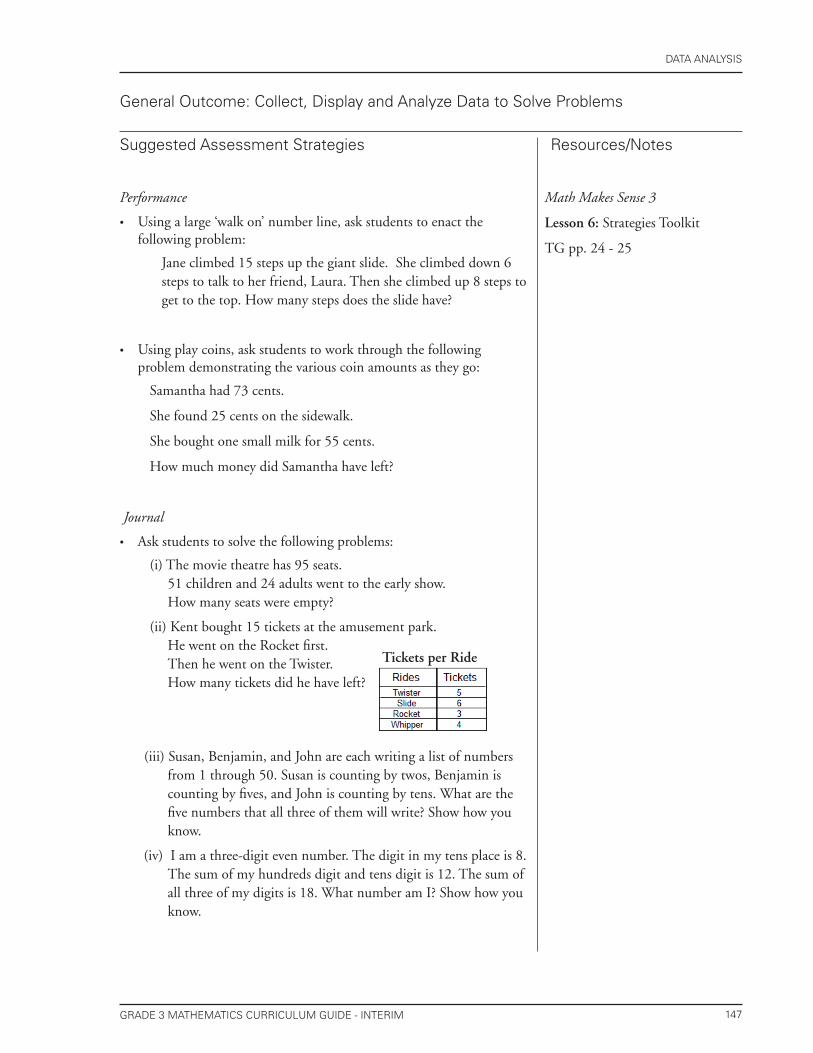
(ii) Kent bought 15 tickets at the amusement park. He went on the Rocket first.Then he went on the Twister.How many tickets did he have left?
(iii) Susan, Benjamin, and John are each writing a list of numbers from 1 through 50. Susan is counting by twos, Benjamin is counting by fives, and John is counting by tens. What are the five numbers that all three of them will write? Show how you know.
(iv) I am a three-digit even number. The digit in my tens place is 8. The sum of my hundreds digit and tens digit is 12. The sum of all three of my digits is 18. What number am I? Show how you know.
•
•
•
Math Makes Sense 3
Lesson 6: Strategies Toolkit
TG pp. 24 - 25
Tickets per Ride
General Outcome: collect, display and analyze data to solve Problems

Grade 3 mathematics curriculum Guide - interim148
data analYsis