Embed Size (px)
Citation preview
1
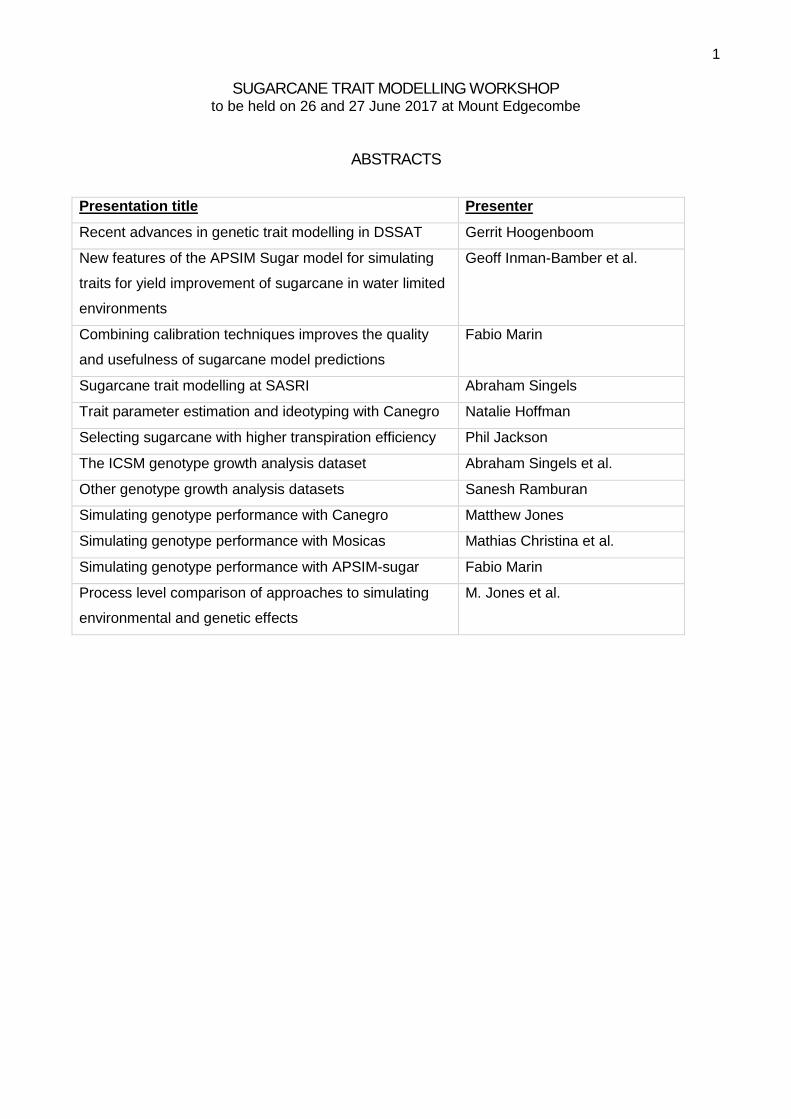
SUGARCANE TRAIT MODELLING WORKSHOP to be held on 26 and 27 June 2017 at Mount Edgecombe
ABSTRACTS
Presentation title Presenter
Recent advances in genetic trait modelling in DSSAT Gerrit Hoogenboom
New features of the APSIM Sugar model for simulating
traits for yield improvement of sugarcane in water limited
environments
Geoff Inman-Bamber et al.
Combining calibration techniques improves the quality
and usefulness of sugarcane model predictions
Fabio Marin
Sugarcane trait modelling at SASRI Abraham Singels
Trait parameter estimation and ideotyping with Canegro Natalie Hoffman
Selecting sugarcane with higher transpiration efficiency Phil Jackson
The ICSM genotype growth analysis dataset Abraham Singels et al.
Other genotype growth analysis datasets Sanesh Ramburan
Simulating genotype performance with Canegro Matthew Jones
Simulating genotype performance with Mosicas Mathias Christina et al.
Simulating genotype performance with APSIM-sugar Fabio Marin
Process level comparison of approaches to simulating
environmental and genetic effects
M. Jones et al.
2
RECENT ADVANCES IN GENETIC TRAIT MODELING IN DSSAT
Gerrit Hoogenboom Institute for Sustainable Food Systems & Department of Agricultural and Biological Engineering
University of Florida, Gainesville, Florida, U.S.A. [email protected]; www.GerritHoogenboom.com
The application of crop growth simulation to enhance plant breeding so far has been limited. One of the most challenging aspects of crop modeling for these and other applications is to obtain the values of the genetic coefficients or Genotype-Specific Parameters (GSPs), especially for new breeding lines or varieties. In crop models, the GSPs define the physiological responses and morphological characteristics of a species and allow the model to differentiate among the traits of a cultivar, variety or hybrids. Crop models range in complexity with respect to these GSPs. This includes “generic models with no reference to species (1), a species-specific model with no reference to cultivars (2), genetic differences presented by cultivar-specific coefficients (3), genetic differences represented by specific alleles, with gene-action represented through linear effects on model parameters (4), and genetic differences represented by genotypes with gene action explicitly simulated based on knowledge of gene expression and effects of gene products (5)” (Hoogenboom et al., 2004). In the Cropping System Model (CSM) of the Decision Support System for Agrotechnology Transfer (DSSAT; Jones et al, 2003; Hoogenboom et al., 2015) most of the modules that allow for the simulation of growth, development and yield of a crop include species, ecotype and cultivar-specific genetic coefficients, representing level 3 as presented by Hoogenboom et al. (2004). White and Hoogenboom (1996; 2003) were the first to develop a gene-based crop simulation model at level 4. GeneGro was implemented using the BEANGRO model of DSSAT for common bean as a framework (Hoogenboom et al., 1994) and included seven genes that affect the physiological processes of common bean. Messina et al. (2006) developed CSM-GeneGro-Soybean that incorporated the effects of six loci from for 48 near-isogenic soybean lines, while White et al. (2008) introduced two loci for simulating the effect on flowering in wheat. Since then, not much progress has been made in further advancing this technology, partially because of a lack of communication and interest among the biotechnology, plant breeding, and crop modeling communities. Technow et al (2015) recently reported on advances with the integration of crop modeling in plant breeding in the private sector. The most recent work with respect to DSSAT has been the development of simple vegetative and reproductive development models using genetic marker information (QTL) based on Recombinant Inbred Lines (RIL) of common bean generated from a cross between Jamapa and Calima (Hwang et al., 2017). The underlying idea of this approach is to develop simple modules that can be inserted into the existing CSM-CROPGRO-Dry bean model and to use QTL information for each unique line as input for the prediction of flowering and node appearance, replacing the GSPs. This approach is promising but still limiting, as it only applies to the RILs and cannot be extracted to other lines unless their QTL information is available. It also requires very detailed data collection for a diverse range of environments in order to be able to develop these simple models. Despite these limitation this might be the future for integrating detailed genetics into dynamic crop simulation models. References
Hoogenboom, G., J. W. White, J. W. Jones, K. J. Boote. 1994. BEANGRO, a process oriented dry bean model with a versatile user interface. Agronomy Journal 86(1):182-190.
Hoogenboom, G., J.W. White, and C.D. Messina. 2004. From genome to crop: Integration through simulation modeling. Field Crops Research 90(1):145-163.
Hoogenboom, G., J.W. Jones, P.W. Wilkens, C.H. Porter, K.J. Boote, L.A. Hunt, U. Singh, J.I. Lizaso,
J.W. White, O. Uryasev, R. Ogoshi, J. Koo, V. Shelia, and G.Y. Tsuji. 2015. Decision Support System for
Agrotechnology Transfer (DSSAT) Version 4.6 (www.DSSAT.net). DSSAT Foundation, Prosser,
Washington.
Hwang, C., M.J. Correll, G.S.A. Gezan, L. Zhang, M.S. Bhakta, C.E. Vallejos, K.J. Boote, J.A. Clavijo-
Michelangeli, and J.W. Jones. 2017. Next generation crop models: A modular approach to model early
vegetative and reproductive development of common bean (Phaseolus vulgaris L.). Agricultural Systems.
(In Press).
Jones, J.W., G. Hoogenboom, C.H. Porter, K.J. Boote, W.D. Batchelor, L.A. Hunt, P.W. Wilkens, U.
Singh, A.J. Gijsman, and J.T. Ritchie. 2003. DSSAT Cropping System Model. European Journal of
Agronomy 18:235‐265.
Messina, C.D., J.W. Jones, K.J. Boote, and C.E. Vallejos. 2006. A gene-based model to simulate soybean
development and yield responses to environment. Crop Science 46 (1):456-466.
Technow, F., C.D. Messina, L.R. Totir, and M. Cooper. 2015. Integrating crop growth models with whole
genome prediction through approximate Bayesian computation. Plos One 10 (6): e0130855.
doi:10.1371/journal.pone.0130855.

3 White, J. W., and G. Hoogenboom. 1996. Simulating effects of genes for physiological traits in a process-
oriented crop model. Agronomy Journal 88(3):416-422.
White, J.W., and G. Hoogenboom. 2003. Gene-based approaches to crop simulation: experiences and
future opportunities. Agronomy Journal 95(1):52-64.
White, J.W., M. Herndl, L.A. Hunt, T. S. Payne and G. Hoogenboom. 2008. Simulation-based analysis of
effects of Vrn and Ppd loci on flowering in wheat. Crop Science 48(2):678-687.
4
NEW FEATURES OF THE APSIM SUGAR MODEL FOR SIMULATING TRAITS FOR YIELD IMPROVEMENT OF SUGARCANE IN WATER LIMITED ENVIRONMENTS
G. Inman-Bamber, P. Jackson, C. Stokes, S. Verrall, P. Lakshmanan, J. Basnayake
Australian sugar production relies on irrigation to a greater or lesser extent for about 60% of the area under
sugarcane. Alleviation of water stress through better irrigation or plant improvement could raise yields by 15%
amounting to about $250 M in revenue each year. Initial modelling with the APSIM Sugar model showed that
some traits could lead to substantially higher yields in water limited conditions. A field research program was
funded for about seven years in search of traits that would help to improve yield in such conditions. Vigour traits
including canopy and yield components were measured in over 100 clones at three locations. Leaf conductance
was measured frequently in all clones, transpiration efficiency (TE) in 18 clones and root water uptake in 10
clones. These data were used to define canopy traits, radiation use efficiency (RUE), hydraulic conductance
and root function traits in the APSIM model in an attempt to explain the observed variation in crop biomass at
two sites with different levels of irrigation. The modelling was restricted to the 40 clones that were common to
the two sites. Environment (climate, soil and management) had an overwhelming effect on crop biomass.
Varietal traits in the model accounted for only 3% additional variation in yield. However with individual
environments, up to 87% of the yield variation was explained when all traits were simulated (for only 10 clones).
RUE and canopy traits alone accounted for significant variation in yield of 40 clones in 10 out of 12
environments.
At this point it was clear that the APSIM model required improvement particularly for simulation of TE. Four
key features were added to enable genetic variation in TE traits and root water supply (RWS) known to exist, to
be modelled and assessed for predicted impact. These features were 1) the response of TE to water stress, 2)
the midday flattening of hourly transpiration when plants are stressed, 3) conductance limits to hourly
transpiration, which can apply even without stress and 4) the separation of soil hydraulic conductivity (k) and
root length density (l) rather than the use of combined kl for determining RWS. A dataset of 182 observations
of above ground biomass from 13 field experiments of sugarcane were used to check firstly that the new
sugarcane module did not affect the simulation results when all the new features were disabled (model stability),
secondly to check that the new features did not greatly reduce model performance, and thirdly, to determine the
response or sensitivity of yields to the new features. Variation in parameter settings for the new features were
based on the best evidence available for genetic variation in these traits, and were set before any testing against
observations were made. With these features enabled in partial factorial combinations, the accuracy of the
simulation of observed biomass, changed only to a minor extent compared to when no features were enabled.
Separating k and l had the most consistent effect on improving model performance.
Three additional published experiments with varying levels of imposed water stress were also simulated, with
and without the new features. The simulation of biomass yield from two of the experiments was remarkably
accurate regardless of which features were used in the simulation. Dry stalk yields reported for the third
experiment were simulated accurately when no features were enabled and when midday flattening of
transpiration was enabled and separate k and l enabled, one at a time. When a limit was placed on hourly
transpiration, simulated TE and yield increased substantially when water was limiting but not in well-watered
conditions; where yield was reduced.
The new APSIM-Sugar features address the limitations of the original module (developed in 1999) for assessing
water use related traits, including TE component traits and root growth. Effects of conductance on TE can now
be simulated by limiting maximum hourly transpiration at the leaf level or k and specific root length at the root
level. The new sugar module will also allow for better discrimination between sugarcane cultivars, now that
vigour traits such leaf area development and radiation use efficiency are linked to root water uptake.
5
COMBINING CALIBRATION TECHNIQUES IMPROVES THE QUALITY AND USEFULNESS OF SUGARCANE MODEL PREDICTIONS
Fabio R Marin
Dept. of Biosystems Engineering, College of Agriculture “Luiz de Queiroz” (ESALQ), University of São Paulo,
Brazil
The usefulness of a crop model depends on how well the model is calibrated. Therefore, the calibration
procedure must be conducted carefully to maximize the reliability of the model. In general, manual procedures
for calibration can be time consuming and this might a factor inhibiting the widespread use of models, in special
for beginners. Unsupervised methods for calibration, in the other hand, can result in undesired parameter values
and unrealistic crop model behavior. Here we describe the GLUE method for automatic calibration and compare
it with the classical eye-fitting calibration based on our previous experience for sugarcane crops models, both
for academic (Marin et al.,2015) and applied used of sugarcane crop models. Recently, System TEMPOCAMPO
(www.tempocampo.org) was developed at University of Sao Paulo-ESALQ to be an on-time supporting system
for helping sugarcane growers, companies and government to take better decisions and understand how current
weather variability can influence the sugarcane crop along the main producing regions in Brazil and generates
future yield scenarios for the current/next season to give some advice for agronomic and trade planning. Finally,
we show how GLUE method can be used for improving the use of crop models including the quantification of
uncertainties of crop yield prediction (Marin et al., 2016). To do so, we have developed a method for considering
uncertainty in a crop model using a simple sugarcane (Saccharum spp.) model as a case study. A Bayesian
Monte Carlo approach (generalized likelihood uncertainty estimation was used to estimate model parameters,
their uncertainties, and correlations among them
References
Marin, FR; Thorburn, PJ; Nassif, DSP; Costa, LG. Sugarcane model intercomparison: Structural differences
and uncertainties under current and potential future climates. Environmental Modelling & Software, v. 72,
p. 372-386, 2015.
Marin, FR; Jones, JW; Boote, KJ. A Stochastic Method for Crop Models: Including Uncertainty in a
Sugarcane Model. Agronomy Journal, v. 109, n. 2, p. 483-495, MAR-APR 2017.
6
SUGARCANE TRAIT MODELLING AT SASRI
A. Singels, M. Jones and N. Hoffman
South African Sugarcane Research institute, Mount Edgecombe, South Africa
Crop models can be used to predict the impacts of genetically determined physiological traits on crop
performance for different environments. This could indicate the desirability of traits in target
environments and thus aid the formulation of ideotypes (breeding targets). This presentation will review
the progress made at SASRI regarding the development and application of crop models for gaining a
better understanding and prediction of genetic trait impacts on genotype response to environmental
factors.
Initial research on a small mapping population of genotypes showed that leaf-level photosynthetic
capacity was highly heritable and can be phenotyped conveniently using chlorophyll fluorescence.
Stable genetic markers (QTLs) were identified for leaf size and photosynthetic capacity, suggesting that
trait values could be estimated from genomic information (Singels et al., 2010).
The Canegro model has been used to explore the desirability of early stomatal closure in low and high
potential rainfed environments (Singels et al., 2016a, Jones & Singels, 2017). Results suggest early
stomatal closure reduces yield for most agro-climatic zones in South Africa under a current and future
climate (Jones & Singels, 2017). The research indicated that although trait impact modelling could
produce useful information that may benefit sugarcane breeding programs, it also pointed to
shortcomings in the Canegro model that needed attention. The disconnect between the carbon balance
and organ development routines were addressed with the development of the GTP-Canegro variant by
relating structural growth to carbon availability and partitioning carbon to different pools according to
the strength of the different sinks (Jones et al., 2011).
Manual phenotyping procedures have been developed to estimate trait parameter values for selected
SASRI cultivars (Hoffman et al., 2016). Parameter values have also been estimated using a
combination of experimental data and subjective expert ratings (Singels et al., 2016b). Preliminary
results showed that genotypic differences in yield of irrigated sugarcane were predicted successfully
using independently derived trait parameter values. A sensitivity analysis showed that maximum
radiation use efficiency, stalk fraction and duration of canopy formation were the most impactful traits.
Trait modelling research at SASRI has demonstrated the potential value to breeding and has
highlighted areas where further research and development are needed, namely further model
improvement and the development of rapid phenotyping for impactful traits.
References
Hoffman, N., Singels, A., Patton, A. and Jones, M.R. 2016. Pot trial phenotyping to predict
genotype field performance with the Canegro model. Proc. S. Afr. Sug. Technol. Ass. 89: 149-
153
Jones, M.R., Singels, A. & Inman-Bamber, N.G., 2011. Simulating source and sink control of
structural growth and development and sugar accumulation in sugarcane. Proc. S. Afr. Sug.
Technol. Ass. 84: 157-163
Jones, M.R. and Singels, A. 2017. Climate change imapcts and adaptation in South Africa. Internal
SASRI report.
Singels, A., Smit, M.A., Butterfield, M.K., van Heerden, P.D.R. and van den Berg, M., 2010.
Identifying quantitative trait alleles for physiological traits in sugarcane: an exploratory study. Proc.
Int. Soc. Sugar Cane Technol., 27. (Also published in Sugar Cane International 28: 53-55.)
Singels, A.*, Jones, M.R., van der Laan, M. 2016a. Modelling impacts of stomatal drought sensitivity
and root growth rate on sugarcane yield. iCROPM2016 International Crop Modelling Symposium
held from 15 to 17 March 2016 in Berlin.
Singels, A.*, Hoffman, N., Paraskevopoulos, A. and Ramburan, S. 2016. Sugarcane genetic trait
parameter estimation. Proceedings of the iCROPM2016 International Crop Modelling Symposium
held from 15 to 17 March 2016 in Berlin, 143-144.
7
TRAIT PARAMETER ESTIMATION AND IDEOTYPING WITH CANEGRO
N. Hoffman, A. Singels, A. Patton, M. Jones and S. Ramburan
South African Sugarcane Research Institute, Mount Edgecombe, South Africa
The Canegro sugarcane model (Inman-Bamber 1991; Singels et al. 2016) has the potential to support plant
breeding by identifying desirable genetic traits for improved crop performance. The suitability of Canegro for
this application has not been tested because genetic trait parameter (TP) values for many genotypes are lacking,
and appropriate phenotyping methods for obtaining these data have not been developed. This presentation will
review the findings of an M.Sc study which evaluated the ability of Canegro to (1) simulate genetic differences
in crop growth and yield observed in field trials using TP values estimated from pot trial data (phenotyping), and
(2) identify a set of ideal TP values for a target environment (ideotyping) (Hoffman, 2016).
Phenotyping was conducted in a well-watered pot trial at Mount Edgecombe comprising 14 genotypes. TP
values were estimated from monthly measurements of leaf and stalk development, leaf gas exchange measured
on two occasions, and destructive sampling of biomass components at harvest. TP values for the different
genotypes were determined directly from phenotypic data where possible, or through normalization with respect
to the reference genotype (NCo376), for which statistically calibrated TP values were already available.
The study estimated the values of 10 TPs, and phenotyping procedures were developed for generating data
required for TP estimation. Reference stalk elongation rate (SERo) showed the greatest genetic variation (range
of 78% of the mean), followed by maximum leaf area (MXLFAREA, 73%), the leaf number at which MXLFAREA
occurs (MXLFARNO, 63%) and phyllochron interval 2 (PI2, 52%). Maximum PAR conversion efficiency
(PARCEmax) also showed significant variation with a range of 47% of the mean. Phyllochron interval 1 (PI1,
24%), maximum number of green leaves (LFMAX, 23%) and maximum sucrose content (SUCA, 15%) showed
less variation, although these were still significant. A range of 17% for the maximum stalk partitioning fraction
(STKPFMAX) was not statistically significant. The range for thermal time required to the start of stalk elongation
(CHUPIBASE) was 30%, although this could not be tested for significance.
The model showed some potential for simulating genetic differences observed in field trials using TP values
estimated from pot trial data. It predicted the genotype rankings for stalk dry mass (SDM) observed for an
irrigated field trial in Pongola well (r=0.75*). There were no significant genotype differences in observed SDM in
three other field trials at Komatipoort and Mount Edgecombe, and model simulations also showed small
differences in SDM for these. The model was unable to predict genotype differences in canopy development
observed in field trials.
A trait impact study identified three traits (PARCEmax, STKPFMAX and CHUPIBASE) which were most
impactful on simulated SDM. Combining optimal values for these three traits in a single genotype could result
in a SDM increase of 12 t ha-1 when compared to the mean SDM value of genotypes with single optimal values
only. Results suggest that these could be candidate traits for screening in early plant breeding stages.
The Canegro model in its present form is not suitable for exploring trait impacts on canopy development, a key
process in sugarcane yield formation, as discussed by Jones et al. (2011). The knowledge generated in this
study will be useful for improving the suitability of the Canegro model for supporting sugarcane breeding, and
for developing procedures for screening sugarcane populations for desirable traits using high-throughput
phenotyping (HTP). The procedures identified, particularly for measuring stomatal conductance, will be used to
ground-truth HTP data in screening for drought tolerant genotypes in a follow-on Ph.D. project at SASRI.
References
Hoffman, N. 2016. Pot trial phenotyping to predict sugarcane genotype field performance with the
Canegro model. M.Sc. thesis, University of KwaZulu-Natal, Pietermaritzburg.
Inman-Bamber, N.G. 1991. A growth model for sugar-cane based on a simple carbon balance and the
CERES-Maize water balance. South African Journal of Plant and Soil 8:93-99.
Jones, M.R., Singels, A. & Inman-Bamber, N.G. 2011. Simulating source and sink control of structural
growth and development and sugar accumulation in sugarcane. Proceedings of the South African Sugar
Technologists Association 84:157-163.
Singels, A., Jones, M.R., Hoffman, N., Olivier, F. & Khambule, S. 2016. Canegro model refinement and
calibration. Internal report. South African Sugarcane Research Institute, Mount Edgecombe, KwaZulu-
Natal, RSA.
8
SELECTING SUGARCANE WITH HIGHER TRANSPIRATION EFFICIENCY
P. Jackson
Commonwealth Scientific and Industrial Research Organisation, Townsville, Australia
In the past four years we have been conducting research to examine and better understand genetic variation in
transpiration efficiency in sugarcane (TE, defined as growth per unit of water used) in Australia and China, with
an ultimate aim to develop better ways to select sugarcane for water stress environments.
TE measured in a wide range of (100) sugarcane clones was found to vary about ±20% around the mean. Crop
growth simulation modelling indicated a 1% variation in TE translated to about 0.5 to 1.5% variation in final cane
yield in commercial production environments in Australia, highlighting the potential value of this trait.
Physiological mechanisms underlying genetic variation in TE were examined. This highlighted a complication
in selecting for high TE in that genetic variation in TE was found to be driven in part by genetic variation in mean
stomatal conductance levels: such that genotypes with lowest conductance having higher TE on average.
However, genetic variation in photosynthesis capacity at mean operating levels of conductance were also found,
indicating that improvements in TE are possible in sugarcane without necessarily compromising growth rates.
However, the significant contribution of conductance in affecting TE means that selecting for high TE alone (and
without regard to growth rates) may in many cases act to reduce overall growth rates and therefore yield. This
prediction is consistent with papers reporting results from strong selection pressure for TE in other crops such
as wheat.
From a theoretical point of view it is argued that the use of well established (but arguably under-utilized) selection
index theory could be used to help address these complications in practice. It is shown how combining
measurements of yield and TE in optimal selection indices could in many situations provide greater realised
selection gains for yield for water limited environments compared with customary approaches in breeding
programs using direct selection for yield alone. This prediction has been supported by early empirical results
in field trials (in China) which have shown that a combination of high yield and low leaf conductance or high leaf
temperature (both of which may be related to reduced rates of water use), all measured under non-stress, was
predictive of yield under the limited water treatments, with prediction levels better than either yield or leaf based
measurements alone. This is suggestive of a potentially valuable role for this combination of measurements in
optimal selection indices in early stages of selection in sugarcane breeding programs.
A practical problem in using measurements at leaf level for screening clones in commercial breeding programs
was found to be high sampling error variance. This means measurements at a leaf level are too costly for
screening large numbers of clones. However advances in aerial image capture and analysis technologies
means that it may be possible to relatively cheaply and accurately screen clones in field trials for relative rates
of canopy conductance. This approach is now being explored in follow up research to this project, and this is
required to deliver practical impact on breeding programs and industry outcomes. Results from this project,
including the predicted benefits of improving TE in different environments, should be used to guide this further
research.
In separate experiments we have also shown that increasing CO2 levels increased TE but genotypes ranked
similarly for TE at different CO2 levels, indicating selection at current atmospheric CO2 levels will likely translate
to improvements, and be amplified, in future years when CO2 is higher.
9
THE ICSM GENOTYPE GROWTH ANALYSIS DATASET
A. Singels1, A. Patton1, S. Chinorumba2, J. Shine3, C. Poser4
1South African Sugarcane Research institute, Mount Edgecombe, South Africa 2Zimbabwe Sugar Association Experiment Station, Chiredzi, Zimbabwe
3Sugarcane Industry Research Committee, Florida, U.S.A 4Centre De Coopération Internationale En Recherche Agronomique Pour Le Développement,
Reunion Island, France
The ICSM is conducting a collaborative project to gain a better understanding of the physiological mechanisms
underlying the genetic variation in sugarcane response to environmental factors by monitoring key plant
processes contributing to yield in a common set of diverse cultivars grown in diverse environments from around
the world. This presentation reports on the status of the field experiments and processing of data collected so
far, and will highlight emerging trends.
Field experiments were planted in Pongola, South Africa; Chiredzi, Zimbabwe; La Mare, Reunion Island and
Belle Glade, Florida using cultivars N41, R570, CP88-1762, HoCP96-540 and ZN7. In some cases NCo376 and
Q183 were also planted.
Crop growth and development were monitored on a regular basis in irrigated plant and first ratoon crops. Non-
destructive measurements included shoot emergence, tiller population and height, leaf number and dimensions,
leaf area index and fractional interception of photosynthetically active radiation. Aboveground biomass
components were destructively sampled on three or four occasions and stalk composition was sampled at
harvest. Associated daily weather data, soil chemical and physical data and management data were also
recorded. Other ad hoc measurements included leaf N and chlorophyll content, stomatal conductance, soil
water content, leaf angle, and canopy reflectance. Data have been entered into customized data storage files
with a common, standardised template.
The diverse climate of the different environments are illustrated by the differences in seasonal thermal time (2040 oCd at Pongola vs. 3200 oCd at La Mare) and seasonal ranges in temperature maxima (19.5 - 48.2 oC at Chiredzi vs. 21.4 - 32.8 oC at La Mare) and minima (-0.9 – 24.1 oC at Belle Glade vs. 14.5 - 26.7 oC at La Mare) recorded in the plant crop. Preliminary analyses of the plant and ratoon crop results reveal that:
N41 generally produced the highest stalk population, and R570 the lowest,
Q183 often developed canopy cover the quickest,
cultivars often produced the highest cane yield in the environment that they were selected for (N41 in Pongola, CP88-1762 in Belle Glade and ZN7 in Chiredzi)
yield ranking of cultivars at Pongola and Chiredzi, differed from that at Belle Glade and La Mare. Each project participant will have an opportunity to highlight important aspects of their respective experiments.
The presentation will conclude with a comparative overview of climate, canopy formation and cane yields.
10
OTHER GENOTYPE GROWTH ANALYSIS DATASETS TO COMPLEMENT THE ICSM PROJECT
Sanesh Ramburan
South African Sugarcane Research Institute, Mount Edgecombe, South Africa [email protected]
SASRI is currently conducting a project to identify genetic traits associated with good ratooning ability (RA) in
sugarcane. Twelve contrasting SASRI varieties have been planted in replicated field trials in each of the three
major production regions of the industry (coastal, irrigated, midlands). Trials have been planted as three series
(2011, 2012 and 2013 planting years) i.e. repeated three times at each site to eliminate confounding year effects
when identifying traits associated with good RA.
A range of morpho-phenological characteristics have been measured from these trials at approximate two-week
intervals, together with biomass component estimates at 3, 5, 7, 9, and 12 months of age. Measurements were
used to derive traits that could be linked to RA and that could be easily implemented in a breeding program.
Some of the traits are also embedded in sugarcane crop models as genetic coefficients. However, coefficient
values are currently limited to one variety only. Therefore, this dataset presented an opportunity to assess the
realistic range values of genetic coefficients (traits) for a more diverse set of genotypes. Additionally, information
on genetic principles associated with the traits were lacking at SASRI.
A sub-study was therefore initiated at the MSc. level to evaluate the G x E effects associated with the traits,
evaluate their stability across crops and sites, and estimate heritability. This presentation will briefly describe
the traits derived from the above dataset, illustrate the nature and reliability of the data collected thus far, and
outline plans for further analyses of the available data. The presentation will also highlight some key
considerations for the use of crop model traits in a functional breeding program. Opportunities for this dataset
to complement the ICSM project will also be discussed.
11
SIMULATING GENOTYPE PERFORMANCE WITH DSSAT-CANEGRO
M.R. Jones
South African Sugarcane Research Institute, Mount Edgecombe, South Africa
This presentation deals with the evaluation of the DSSAT-Canegro model for simulating the development and
growth of three contrasting sugarcane cultivars (N41, R570, CP88-1762) at four sites in South Africa (Pongola),
Zimbabwe (Chiredzi), Florida USA (Belle Glade) and Reunion Island (La Mare). The objectives were to (1) gain
an understanding of the capability of the model for simulating observed interactions between genotype and
environment in canopy development and cane yield, and (2) to evaluate the suitability of the experimental data
and the DSSAT software for model parametrization, development and evaluation.
The model was set up to reflect the management and environmental conditions as accurately as possible for
each of the sites for plant and first ratoon crops. Trait parameters for each cultivar were calibrated manually
across all sites, per plant process, focussing first on crop phenology and development processes, and then
biomass accumulation and partitioning processes. Crop phenology/development parameters examined, in
order, were: TTPLTNEM and TTRATNEM (thermal time to shoot emergence), TAR0 (tiller appearance rate per
unit thermal time), POPTT16 (final stalk population), PI1 and PI2 (leaf phyllocron intervals), LFMAX (maximum
number of green leaves), CHUPIBASE (thermal time to start of stalk elongation), and MXLFAREA (maximum
leaf area per leaf). Biomass accumulation and partitioning parameters investigated included MaxPARCE
(maximum photosynthetic conversion efficiency), STKPFMAX (maximum stalk partitioning fraction), and SUCA
(maximum stalk sucrose concentration).
Time series graphs of simulated and observed values, as well as statistical measures of model performance
(RMSE and R2) will be presented. Comparisons of simulated and observed cultivar rankings for different crop
variables will also be shown.
A number of difficulties were encountered in this model calibration process. Subtle differences in the definitions
(units and measurement methods) of observed variables, along with differences in naming conventions,
required manual intervention to prepare consistent observation datasets. Some of the green leaf area index
data seemed unrealistically low for several of the experiments. The DSSAT GenCalc automatic calibration tool
does not support for the use of time-series observations when used in conjunction with DSSAT-Canegro model.
Finally, the Belle Glade site presented some unique modelling challenges: the water-table irrigation system
could not be simulated by DSSAT; estimating soil water-holding characteristics from a ‘soil’ with > 80% organic
matter was beyond the capabilities of the DSSAT SBuild software, and observations of drained upper limit,
lower limit etc were not provided; and damage caused by very cold conditions is not simulated by the DSSAT-
Canegro model.
It is hoped that the outcomes of this work will include improved data templates and data capture/verification
protocols. It is clear that a robust automatic calibration tool will need to be developed for the DSSAT-Canegro
model.
12
SIMULATING GENOTYPE PERFORMANCE WITH MOSICAS
M. Christina, C. Poser, J-F. Martine
Centre De Coopération Internationale En Recherche Agronomique Pour Le Développement, France
The Mosicas model (Martine & Todoroff, 2004) is one of the growth simulation models under consideration for
the ICSM project on “Modelling worldwide GxE interaction”. The presentation will focus on the simulations of
different genotype of sugarcane based on datasets from Reunion Island and Pongola. The model has been
calibrated on 7 cultivars, three common between Reunion Islands and Pongola (R570, N41 & CP881762), and
four cultivars specific to Reunion Island experiments (NCo376 & Q183) or Pongola experiments (ZN7 &
HoCP96). For each genotype, simulations will be presented for both crop plants and ratoon plants. Simulations
and calibrations were performed on different processes:
• The green leaf area index and the light interception efficiency dynamics over growth
• The processes driving the production of:
- The total dry mass of aboveground biomass including trash and dead stalks
- The dry mass of millable stalks,
- The sucrose production
Model performances will be compared based on RMSE and normalized RMSE depending on the considered
processes, the genotype (e.i. variety), the environment (Reunion is. & Pangola) as well as the crop stage (plant
or ratoon). Model performance differed depending on the processes (e.g. dry mass production RMSE < sucrose
production RMSE), the genotype (e.g. CP881762 RMSE > R570 RMSE) as well as the environment (Reunion
is. RMSE < Pangola RMSE).
These preliminary results highlighted the need to choose a common calibration approach between models, as
well as specific recommendations (ex zero observed values required at the beginning of the growth for
calibration). A better understanding of environmental data in both Reunion is. and Pongola are also required to
understand the discrepancy of model performance depending on the environment.
References
• Martine, J.F. and Todoroff, P. 2004. Le mod`ele de croissance MOSICAS et sa plateforme de simulation
simulex: ´etat des lieux et perspectives. Revue agricole et sucri`ere de l’ˆıleMaurice, 80, 133–147 [in
French].
13
SIMULATING GENOTYPE PERFORMANCE WITH APSIM-SUGAR
Fábio R Marin, Leandro G Costa
Dept. of Biosystems Engineering, College of Agriculture “Luiz de Queiroz” (ESALQ), University of São Paulo,
Brazil
Crop models are increasingly being used for different purposes, including for assisting the understanding of
genotype by environment (GXE) interaction and its underlying physiological mechanisms (Hammer & Jordan,
2007). One of the sugarcane models available for end-users is the APSIM-Sugar (AS) (Keating et al., 1999)
which interacts with weather data and soil (Probert et al., 1998) and crop residue (Thorburn et al., 2001) models
to mechanistically simulate soil–crop growth and development.
The main goal of the paper was to determine model trait parameters (genetic coefficients) for five cultivars (N41,
ZN7, R570, CP88-1762, HoCP96) growing at the South African Sugarcane Research Institute (SASRI) research
farm in Pongola, South Africa, derived from development, growth and water use measurements. To do so, the
AS model was calibrated and its predictions evaluated using observed data from a crops planted in Pongola,
South Africa.
Hydraulic soil parameters were measured at the experimental site and a weather station was installed near to
the field trial. Model parameters were manually adjusted by eye-fitting with focus in the measured data of LAI,
stalk and aerial dry mass, being predictions statistically evaluated. Exception was the cultivar R570, which had
already been calibrated for APSIM and no change in parameters was required. AS simulated genotype
responses to weather variation well, with performance comparable with that found in other sugarcane models.
Predictions were best for above ground dry mass, stalk dry mass and leaf area index.
References
Hammer, G.L. & Jordan, D.R. (2007) An integrated systems approach to crop improvement. In: Scale and
Complexity in Plant Systems Research: Gene-plant-crop Relations. (eds. J.H.J. Spiertz, P.C. Struik &
H.H. van Laar), pp. 45-61. Wageningen UR Frontier Series Vol. 21, Springer, Dordrecht.
Keating, B.A., Robertson, M.J., Muchow, R.C., Huth, N.I., 1999. Modelling sugarcane production systems.
I. Description and validation of the sugarcane module. Field Crop Res. 61, 253–271.
Probert, M.E., Dimes, J.P., Keating, B.A., Dalal, R.C., Strong, W.M., 1998. APSIM’s water and nitrogen
modules and simulation of the dynamics of water and nitrogen in fallow systems. Agric. Syst. 56, 1–28.
Thorburn, P.J., Probert, M.E., Robertson, F.A., 2001. Modelling decomposition of sugarcane surface
residues with APSIM-Residue. Field Crop Res. 70, 223–232.
14
PROCESS-LEVEL COMPARISON OF APPROACHES TO SIMULATING ENVIRONMENTAL AND GENETIC EFFECTS
M.R. Jones1, M. Christina2, J-F. Martine2, F. Marin3, A. Singels1
1 South African Sugarcane Research institute, Mount Edgecombe 2 Centre De Coopération Internationale En Recherche Agronomique Pour Le Développement
3Dept. of Biosystems Engineering, ESALQ, University of São Paulo, Brazil
Several sugarcane growth simulation models are under consideration for the ICSM project on “Modelling
worldwide GxE interaction”: DSSAT-Canegro (Jones & Singels, 2017; Singels et al., 2008; Inman-Bamber,
1991), APSIM-Sugar (Keating et al., 1999), Mosicas (Martine & Todoroff, 2004), CASUPRO (F. Royce,
pers.comm.) and Canesim (Singels & Paraskevopoulos, 2017). In order to understand model differences in the
simulation outcomes, it is necessary to have some understanding of how each of the models simulates major
plant processes, and how these are driven by environmental (E) factors, and controlled by genetic (G) effects.
Major plant processes considered are: bud sprouting (germination) and shoot emergence; canopy development
(including leaf and tiller dynamics, development of leaf area and fractional interception of photosynthetically
active radiation (FiPAR)); root development and growth; biomass accumulation (photosynthesis and respiration)
and its partitioning between various plant organs; water and nitrogen uptake and estimation of water contents
of plant components.
Similarities are apparent between models in the simulation of certain processes. For example, most models
use some concept of thermal time to determine the timing of phenological events and temperature-related
process rates. In the simulation of some other processes, however, a much greater degree of variation is
evident. For example, Canesim uses a simple method for simulating canopy development and FiPAR directly
as a function of thermal time (modified by a water stress factor). Mosicas simulates green leaf area index (LAI)
as a function of thermal time, and then converts this to FiPAR via a radiation extinction coefficient. DSSAT-
Canegro is the most complex, and simulates the appearance, senescence and growth of individual leaves on
individual tiller cohorts from which LAI is derived and FiPAR determined via a radiation extinction coefficient
which increases with the number of leaves appeared. Other differences include: (1) presence or absence of
simulating maintenance respiration, (2) simulating biomass partitions through allometry or dynamic source-sink
interactions, and (3) simulation of water uptake.
Different modelling approaches lead to different ways in which genetic effects are accounted for. All model use
trait parameters (“genetic coefficients”) to capture genotypic differences but the type and number of genetic trait
parameters, how they are organized (e.g. species vs cultivar), how their values can be determined, may differ.
This will be elaborated in the presentation and the availability of estimates of parameter values for germplasm
will be explored.
The modelling approaches for each of the key simulated processes will be presented in detail for the DSSAT-
Canegro, Mosicas and APSIM-Sugar models. Highlights and unique approaches from other models will also
be discussed.
References
• Jones MR and Singels A (2017). Upgrading the Canegro model for improved simulation of climate change
impacts on sugarcane. Under review (Eur. J. Agronomy).
• Keating, B.A., Robertson, M.J. and Muchow, R.C. 1999. Modeling sugarcane production systems I.
Development and performance of the sugarcane module. Field Crops Research 61: 253-271.
• Martine, J.F. and Todoroff, P. 2004. Le mod`ele de croissance MOSICAS et sa plateforme de simulation
simulex: ´etat des lieux et perspectives. Revue agricole et sucri`ere de l’ˆıleMaurice, 80, 133–147 [in
French].
• Singels, A., Jones, M., van den Berg, M. 2008. DSSAT v4.5 Canegro Sugarcane Plant Module: Scientific
documentation. SASRI, Mount Edgecombe, South Africa. pp 34.
• Singels, A. and Paraskevopoulos A.L., 2017. The Canesim Book: Scientific Documentation of the
Canesim Sugarcane Crop Model. Published by the South African Sugarcane Research Institute, Mount
Edgecombe.