Embed Size (px)
Citation preview
Paulo Sotero, Director Brazil Institute
Sugarcane Ethanol Production in Brazil
Presentation 05/15/2008“Betting on Biofuels: Opportunities and Implications”

Brazilian Biomes and States
AM
MT
PA
MS
RS
TO
GO
MA
PI
SC
PRSP
MG
BARO
APAP
CE RNPB
PEAL
SE
ES
RJ
AC
3
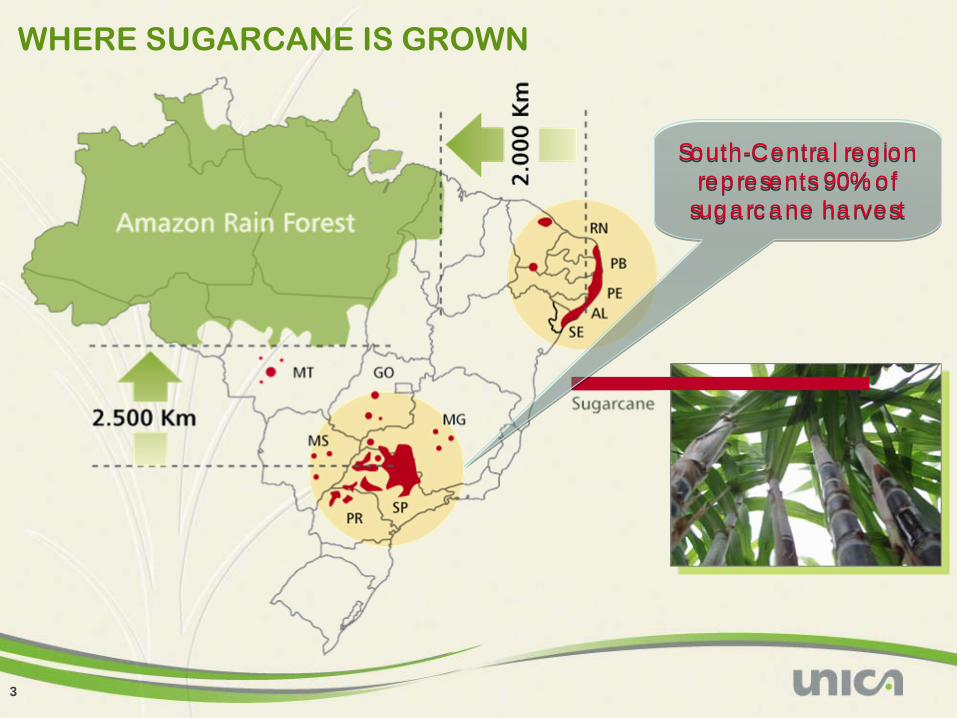
WHERE SUGARCANE IS GROWN
South-Central region represents 90% of
sugarcane harvest
South-Central region represents 90% of
sugarcane harvest
4
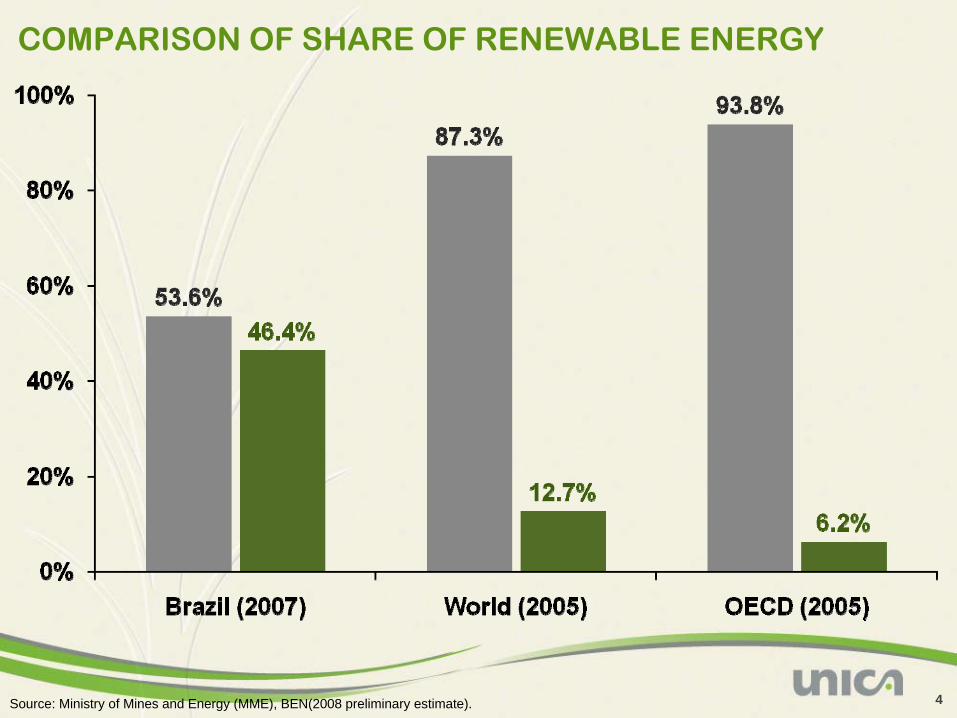
COMPARISON OF SHARE OF RENEWABLE ENERGY
Source: Ministry of Mines and Energy (MME), BEN(2008 preliminary estimate).
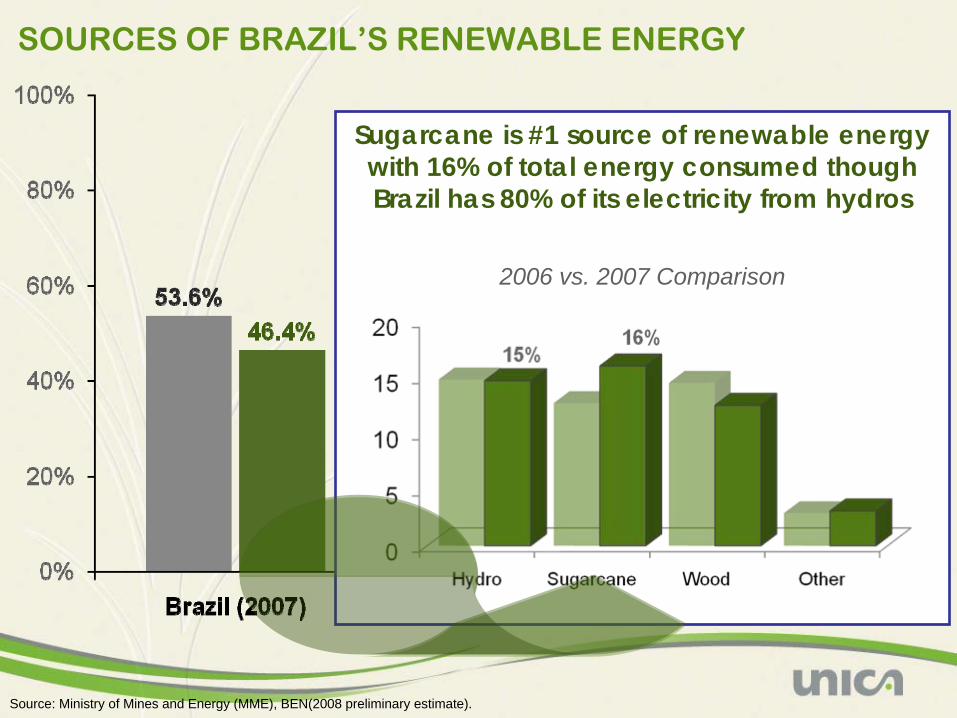
Sugarcane is #1 source of renewable energy with 16% of total energy consumed though Brazil has 80% of its electricity from hydros
SOURCES OF BRAZIL’S RENEWABLE ENERGY
Source: Ministry of Mines and Energy (MME), BEN(2008 preliminary estimate).
2006 vs. 2007 Comparison
6
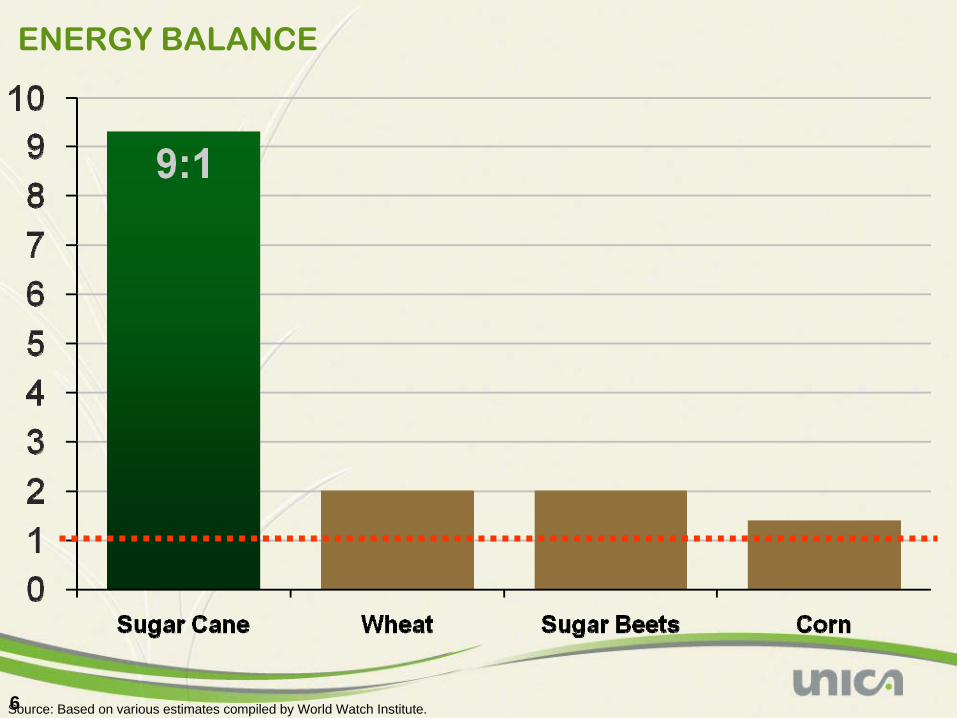
ENERGY BALANCE
Source: Based on various estimates compiled by World Watch Institute.

7Source: IEA – International Energy Agency (2005), USDA, MTEC. Elaboration: ICONE and UNICA.
Liters per hectareAVERAGE PRODUCTION YIELDS
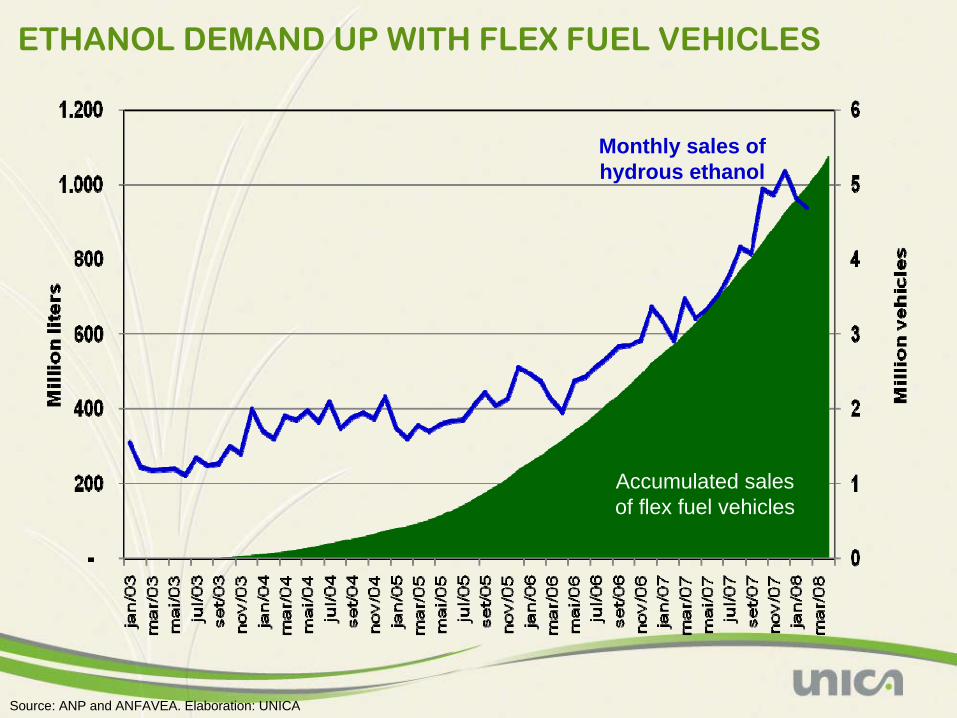
ETHANOL DEMAND UP WITH FLEX FUEL VEHICLES
Accumulated sales of flex fuel vehicles
Monthly sales of hydrous ethanol
Source: ANP and ANFAVEA. Elaboration: UNICA
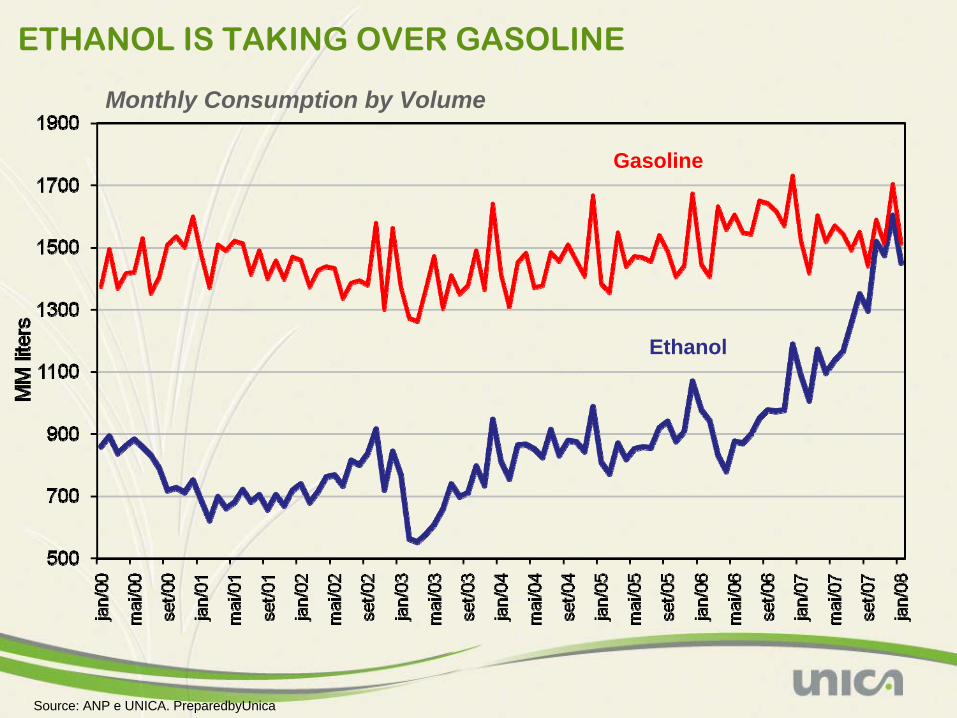
Gasoline
Ethanol
Source: ANP e UNICA. PreparedbyUnica
ETHANOL IS TAKING OVER GASOLINE
Monthly Consumption by Volume
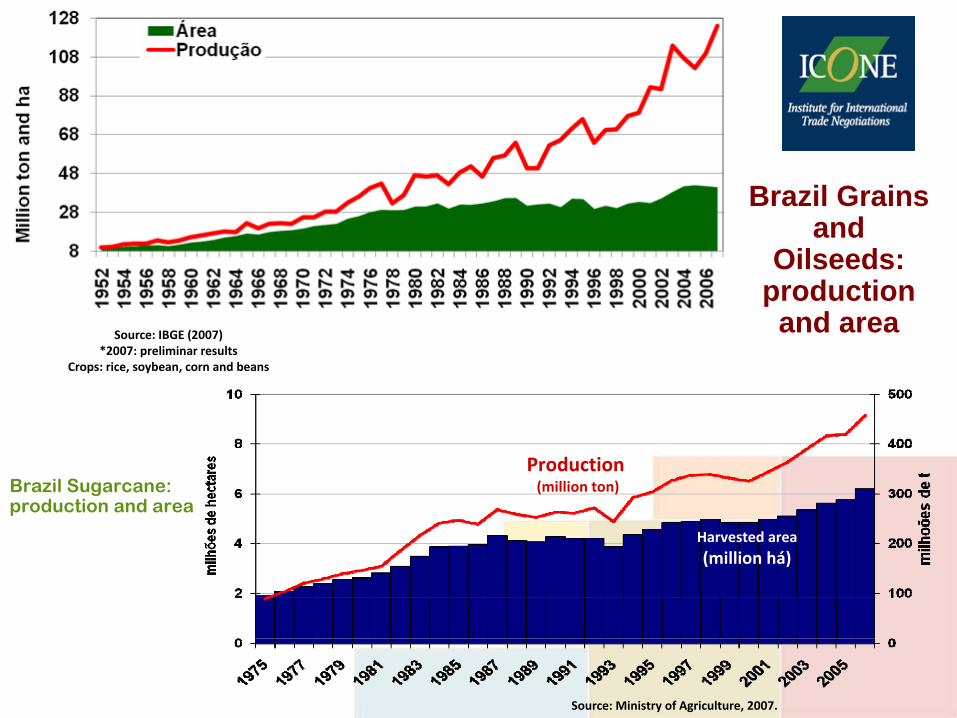
Brazil Sugarcane: production and area
Source: Ministry of Agriculture, 2007.
Production (million ton)
Harvested area(million há)
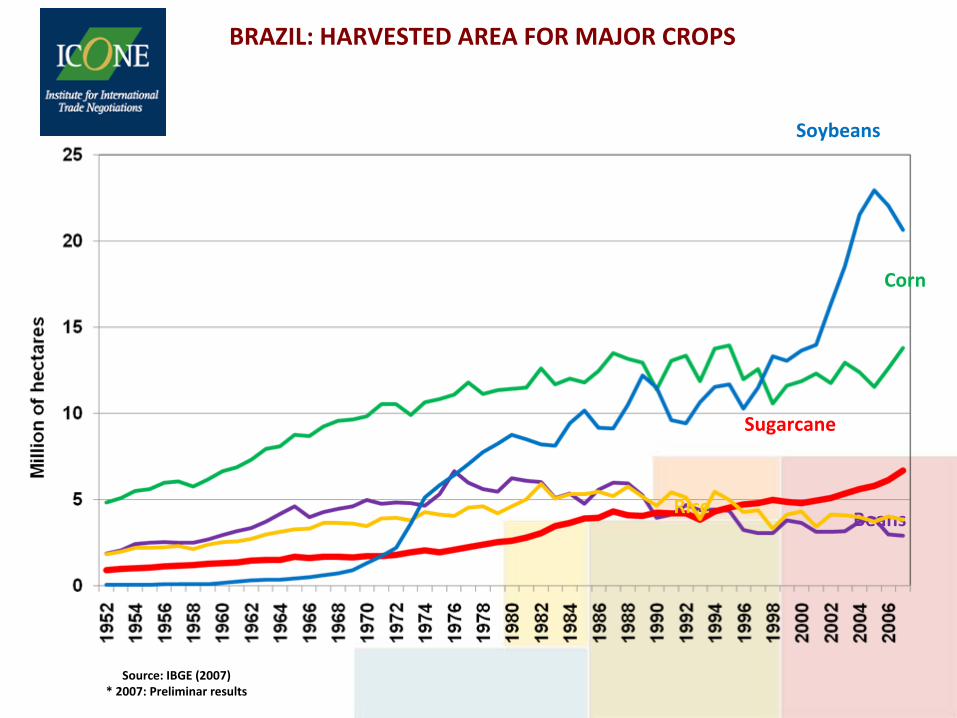
Source: IBGE (2007)*2007: preliminar results
Crops: rice, soybean, corn and beans
Brazil Grains and
Oilseeds: production
and area
Source: IBGE (2007)* 2007: Preliminar results
BRAZIL: HARVESTED AREA FOR MAJOR CROPS
Soybeans
Sugarcane
Beans
Corn
Rice

Land Availability in Selected Regions of Brazil: Preliminary Results
(1,000 hectares, 2006)
Source: IBGE; MMA; CONAB; EMBRAPA. Elaboration: ICONE.Notes:1. Conservation parks, indigenous reserves and legal reserve provisions have been excluded from the agricultural land available.2. N.a. (not applicable). (e) estimation.
Planted Area Pasture Area
Total Land Used for
Agriculture
Agricultural Land
Available(e)
Potential Land(p)
Legal Reserv
eSugarcan e Grains Total
CropsSao Paulo 3,285 1,522 6,611 8,780 15,391 15,391 negligible 20%
Parana 433 5,515 9,247 5,560 14,807 14,807 negligible 20%Minas Gerais
(Cerrado) 431 2,446 4,725 10,161 14,886 22,455 7,570 20%
Goias 238 3,151 4,077 19,050 23,127 24,684 1,557 20%Mato Grosso do
Sul (Cerrado) 153 2,084 3,010 11,713 14,723 16,424 1,701 20%
Mato Grosso (Cerrado) 202 6,647 6,884 6,442 13,327 20,727 7,401 35%
Tocantins (Cerrado) 4 528 604 11,390 11,994 14,033 2,040 35%
Piaui (Cerrado) 10 688 1,169 negligible 1,169 6,079 4,910 20%Maranhao (Cerrado) 39 1,264 1,645 1,049 2,694 7,264 4,570 35%
Bahia 106 1,931 3,398 909 4,307 10,538 6,232 20%Total 4,901 25,776 41,371 75,053 116,424 152,404 35,980 n.a.
Brazil Total 6,179 36,032 62,353 172,333 217,456 n.a. n.a. n.a.
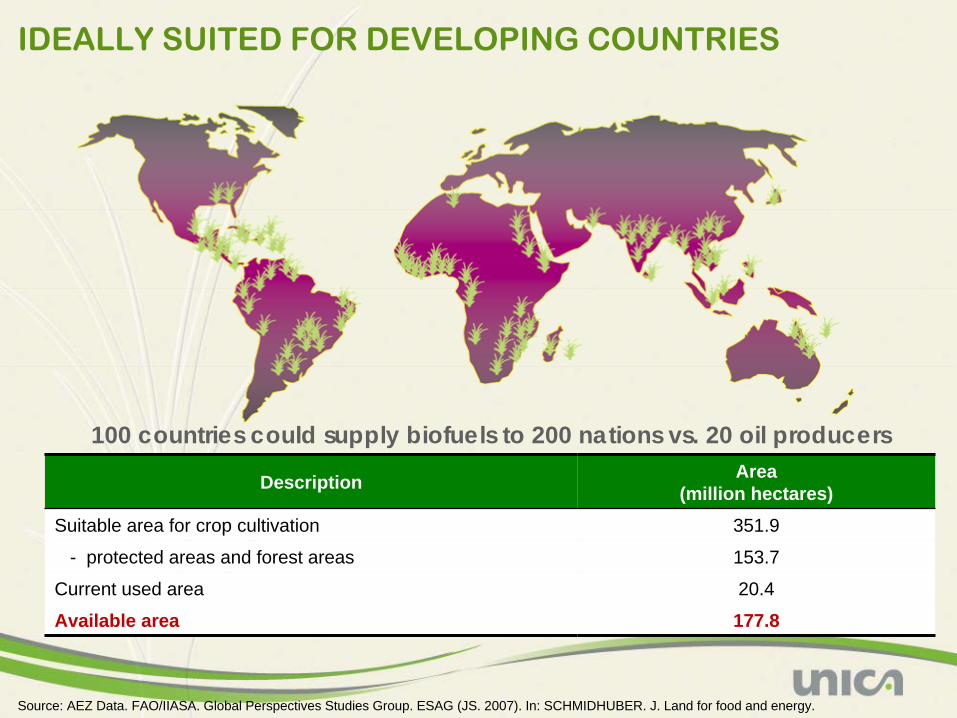
IDEALLY SUITED FOR DEVELOPING COUNTRIES
Source: AEZ Data. FAO/IIASA. Global Perspectives Studies Group. ESAG (JS. 2007). In: SCHMIDHUBER. J. Land for food and energy.
Description Area (million hectares)
Suitable area for crop cultivation 351.9
- protected areas and forest areas 153.7
Current used area 20.4
Available area 177.8
100 countries could supply biofuels to 200 nations vs. 20 oil producers

CONCLUSIONS
14
1. Sugarcane production in the Center-Southregion will increase with a bias toward ethanol
2. Domestic demand for ethanol should continue to increase due to increase of flex-fuel cars
3. Half of gasoline consumption is being replaced by ethanol is produced on 1.5 % of the Brazilian arable land
4. Biofuels represent an opportunity for developing, tropical countries but require reduction in tariff and non-tariff barriers
5. There’s no competition between biofuels and food in Brazil though oil prices have a disproportionate impact on food prices