Embed Size (px)
Citation preview
Annual Report 2018
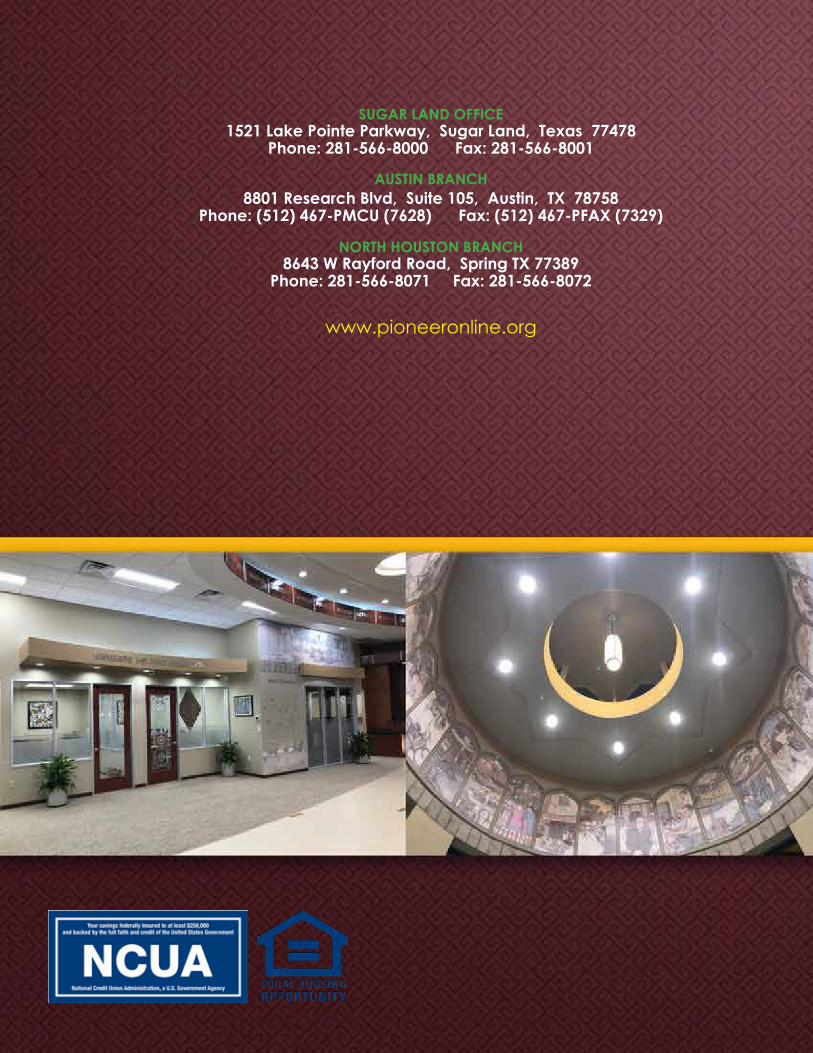
1521 Lake Pointe Parkway, Sugar Land, Texas 77478Phone: 281-566-8000 Fax: 281-566-8001
www.pioneeronline.org
8801 Research Blvd, Suite 105, Austin, TX 78758Phone: (512) 467-PMCU (7628) Fax: (512) 467-PFAX (7329)
SUGAR LAND OFFICE
AUSTIN BRANCH
8643 W Rayford Road, Spring TX 77389Phone: 281-566-8071 Fax: 281-566-8072
NORTH HOUSTON BRANCH
Members Helping Members

Board of Directors 2018
Faheem N PraslaSecretary
Altaf A PraslaChairman,
Supervisory Committee
Shaheen N MominTreasurer
Moiz N Dhuka Convenor,
Collection Committee
Mustakali R MominMember,
Credit Committee
Mahendi K PraslaConvenor,
BSA Committee
Salman S KadiwalMember,
Credit Committee
Saddiq M SunesraChairman,
Credit & Business Loan Committee
Shaukat AliPresident/CEO
Naushad Ali DhukkaChairman
Riyaz R SunesaraVice Chairman
2018 Annual Report |
Chairman's Message 1
Supervisory Committee's Report 2
Credit & Business Loan Committee’s Report 2
Statement of Financial Position 3
Statement of Operations 4
Statement of Cash Flows 5
Statement of Equity / Key Financial Ratios 6
Notes to Financial Statements:
Nature of Business 7
ClassificationsofLoans 8
SignificantAccountingPolicies 9
Bar Charts & Key Indicators 10
Products and Services 11
CONTENTS
DESCRIPTION PAGE #
| 2018 Annual Report
Dear Members,
Year after year, Pioneer Mutual Federal Credit Union (PMFCU) has made tremendous progress and so have its members. The community that PMFCU serves has advanced a great deal as well. In the most recent 7 years of its 37-year life, PMFCU’s assets have increased by 200% from $56.45 Million in 2011 to $169.29 Million in 2018. Over that same time period, PMFCU’s loan portfolio has grown from $44.97 Million to $100.41 Million. Such outstanding growth could not have been achieved without our members’ trust, confidence and unconditional loyalty. Additionally, these achievements were made possible through the remarkable contribution of time and resources from our hard working, caring, committed and intelligent staff and management team. And behind all these successes has been a single driving force – the Board of Directors of PMFCU. The board, current and past, has always made it a top priority to ensure that the credit union not only remains healthy, stable and progressive, but also to reassure that its directors are fully cognizant of their duties and fiduciary responsibilities at all times. The board is always eager to help members by all means possible and by being fair to each and every member. This would not be possible if the board was not to create, maintain and periodically review policies and procedures that can aid the staff and management team in delivering quality work product.
Whether it is a $500 unsecured loan as in the early days of the credit union or $100K unsecured loans and $2.5M+ commercial loans from more recent days, Pioneer has undoubtedly come a long way. 26% of all loans issued since inception were in just last 3 years alone i.e. $120 Million out of $465 Million in loans since the inception. Pioneer also recorded the lowest delinquency rate of 0.14% in 2018. All of this growth and activity has come responsibly and methodically. Members now seem to be more organized and more efficient in preparing loan applications and supporting documents. While all operating departments work smoothly and seamlessly, the compliance department has its iron grip
on all methods and areas of operation. It is these checks and balances between the operations and compliance teams that help Pioneer pass all the audits and rigorous examinations by the NCUA (at both the District and the Federal levels) with flying colors. For that, the examiners have always commended Pioneer’s staff, management and the board.
Additionally, now that our North Houston location is open, MSB and other services to member businesses are in full effect. Pioneer is grateful to all members and member businesses in North Houston for welcoming our newest branch there and benefiting from all the products and services offered. Of course, MSB and other similar products are subject to a higher level of scrutiny and more stringent regulatory requirements. In response, Pioneer has been holding educational seminars/town-hall meetings for MSB accounts. We thank the members for their full support and cooperation in helping Pioneer stay compliant in all areas including member privacy, BSA, AML, lending, saving, ACH and other transactional activity.
Lastly, I must acknowledge all the volunteers, staff members and the management team for their hard work and commitment to serve with a smile, the founders of PMFCU for their remarkably ambitious vision, all the past directors who paved the way for PMFCU and all the current directors with whom I had the pleasure and honor of serving alongside for past 7 years. I am absolutely convinced that tomorrow’s leadership and board will bring more success to this fine institution and will put PMFCU in an even better position to serve the community.
With best wishes to Pioneer and to its members,
Naushad Dhukka
Chairman
1
CHAIRMAN’S MESSAGE

2018 Annual Report | 2
The Supervisory Committee of Pioneer Mutual Federal Credit Union (PMFCU) is responsible for assessing the activities of the credit union. The committee ensures that the credit union operations are effective in safeguarding credit union assets and maintaining accurate member records. It verifies that the adequate policies and procedures are established and regularly reviewed by the Board as per the NCUA rules and regulations; and are followed by the staff of the credit union. It also oversees the financial statements to confirm that they represent a fair and reasonably accurate picture of the financial condition of the credit union. The committee is appointed by the Board annually which include Supervisory Chairman from the Board and two committee members from general membership. During 2018, the committee was comprised of the following individuals:Altaf A. Prasla – Chairman; Irfan K. Ali – Member; and Altaf A. Dholasaniya – MemberThe committee meets regularly to discuss and perform internal audit. The audit findings are reported to the Board and communicated to the management and staff. The committee ensures that the external audits for NCUA Annual Examination, Money Service Business (MSB), Bank Secrecy Act (BSA), Automatic Clearing House (ACH), Customer Identification Program (CIP), Office of Foreign Assets Control (OFAC), and Supervisory Committee Annual Review are performed regularly and reports are reviewed by the Board. The management has also engaged with third-party consulting firm to seek advice during the year 2018 for the operations and compliance of Money Services Business (MSB) portfolio.Based on the various internal and external audits, the committee is pleased to report that the credit union maintains firm internal control to protect member assets and information. The credit union is operating with strict adherence to NCUA rules and regulations; and in compliance with the policies and procedures set by the Board. The committee would like to extend its appreciation to NCUA examiners for their continues guidance during the year and to the staff for assisting in the audit process. We are grateful to the members and Board of Directors for the continuous support and confidence in the committee.Altaf A. Prasla,Chairman, Supervisory Committee
The Credit & Business Loan Committee of Pioneer Mutual Federal Credit Union plays an important role in maintaining the loan portfolio as per policies and procedures and as required by regulatory requirement of the NCUA. The Credit & Business Loan Committee is elected by the Board of Directors and consists of five members. The Committee meets regularly on a weekly basis to review and approve the loan applications.
I take this privilege in informing our members that our Credit Union offers the best competitive interest rates across our league while maintaining a safe and secure capital base.
In the year 2018, the committee received and reviewed 769 loan applications, of which 760 loans totaling $37,975,050 were approved. Overall loan portfolio stood at $100,410,707 in the year 2018 as compared to $85,790,912 for the year 2017 with an increase of 17.04%. During the last 3 years, our Credit Union has loaned out loans as follows: Year 2016: $41.02M. Year 2017: $40.76M and in the Year 2018: $37.97M.
The increase in the Loan portfolio reveals our continued ability to meet financial needs of our members. Special promotions were offered to the members to gain benefits on availing the lower and competitive interest rates on various loan products and also providing cash back incentives on Home Mortgage loans. We will continue to focus on meeting the financial needs of our members by offering various financial loan products and services.
On behalf of the Credit & Business Loan Committee Members, I would like to express my appreciation to the Board of Directors and the Staff members for their continuous support and also to all our members, without you it would have not been possible to achieve our objectives and goals. We look forward in providing our excellent service and serve you better in the years ahead.
Saddiq SunesraChairman, Credit & Business Loan Committee
SUPERVISORY COMMITTEE’S REPORT
CREDIT & BUSINESS LOAN COMMITTEE’S REPORT
| 2018 Annual Report
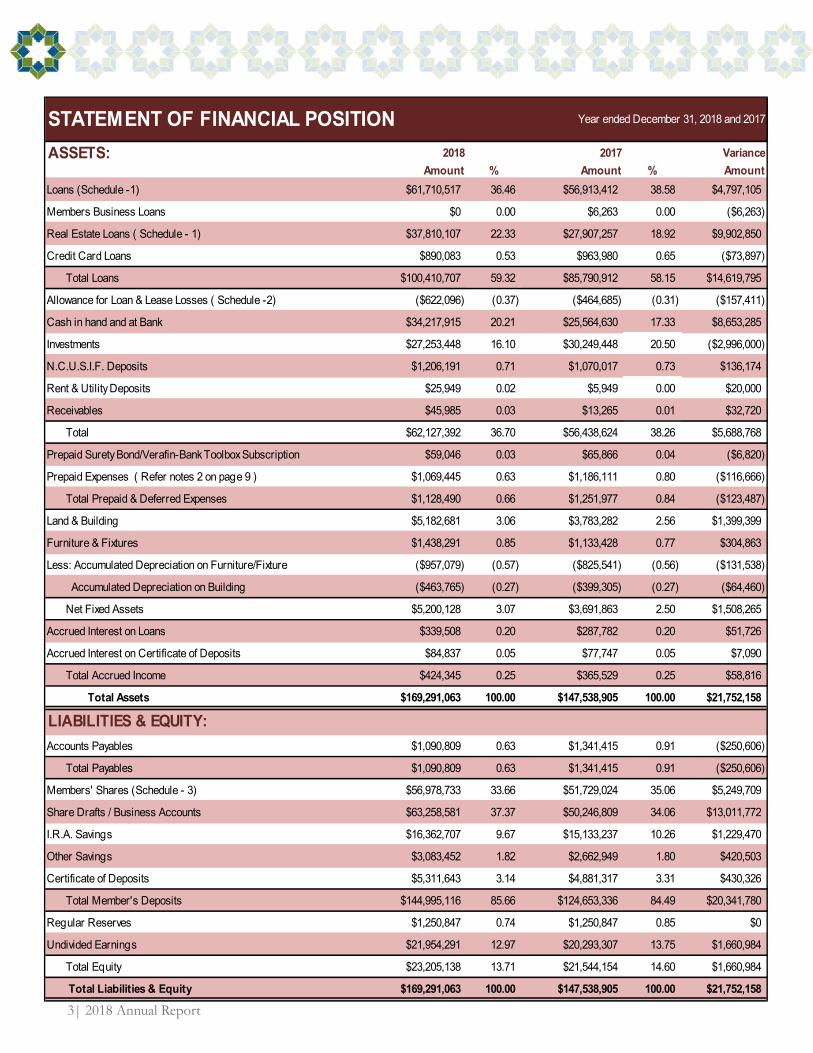
STATEMENT OF FINANCIAL POSITIONASSETS: 2018 2017 Variance Amount % Amount % AmountLoans (Schedule -1) $61,710,517 36.46 $56,913,412 38.58 $4,797,105
Members Business Loans $0 0.00 $6,263 0.00 ($6,263)
Real Estate Loans ( Schedule - 1) $37,810,107 22.33 $27,907,257 18.92 $9,902,850
Credit Card Loans $890,083 0.53 $963,980 0.65 ($73,897)
Total Loans $100,410,707 59.32 $85,790,912 58.15 $14,619,795
Allowance for Loan & Lease Losses ( Schedule -2) ($622,096) (0.37) ($464,685) (0.31) ($157,411)
Cash in hand and at Bank $34,217,915 20.21 $25,564,630 17.33 $8,653,285
Investments $27,253,448 16.10 $30,249,448 20.50 ($2,996,000)
N.C.U.S.I.F. Deposits $1,206,191 0.71 $1,070,017 0.73 $136,174
Rent & Utility Deposits $25,949 0.02 $5,949 0.00 $20,000
Receivables $45,985 0.03 $13,265 0.01 $32,720
Total $62,127,392 36.70 $56,438,624 38.26 $5,688,768
Prepaid Surety Bond/Verafin-Bank Toolbox Subscription $59,046 0.03 $65,866 0.04 ($6,820)
Prepaid Expenses ( Refer notes 2 on page 9 ) $1,069,445 0.63 $1,186,111 0.80 ($116,666)
Total Prepaid & Deferred Expenses $1,128,490 0.66 $1,251,977 0.84 ($123,487)
Land & Building $5,182,681 3.06 $3,783,282 2.56 $1,399,399
Furniture & Fixtures $1,438,291 0.85 $1,133,428 0.77 $304,863
Less: Accumulated Depreciation on Furniture/Fixture ($957,079) (0.57) ($825,541) (0.56) ($131,538)
Accumulated Depreciation on Building ($463,765) (0.27) ($399,305) (0.27) ($64,460)
Net Fixed Assets $5,200,128 3.07 $3,691,863 2.50 $1,508,265
Accrued Interest on Loans $339,508 0.20 $287,782 0.20 $51,726
Accrued Interest on Certificate of Deposits $84,837 0.05 $77,747 0.05 $7,090
Total Accrued Income $424,345 0.25 $365,529 0.25 $58,816
Total Assets $169,291,063 100.00 $147,538,905 100.00 $21,752,158
LIABILITIES & EQUITY:Accounts Payables $1,090,809 0.63 $1,341,415 0.91 ($250,606)
Total Payables $1,090,809 0.63 $1,341,415 0.91 ($250,606)
Members' Shares (Schedule - 3) $56,978,733 33.66 $51,729,024 35.06 $5,249,709
Share Drafts / Business Accounts $63,258,581 37.37 $50,246,809 34.06 $13,011,772
I.R.A. Savings $16,362,707 9.67 $15,133,237 10.26 $1,229,470
Other Savings $3,083,452 1.82 $2,662,949 1.80 $420,503
Certificate of Deposits $5,311,643 3.14 $4,881,317 3.31 $430,326
Total Member's Deposits $144,995,116 85.66 $124,653,336 84.49 $20,341,780
Regular Reserves $1,250,847 0.74 $1,250,847 0.85 $0
Undivided Earnings $21,954,291 12.97 $20,293,307 13.75 $1,660,984
Total Equity $23,205,138 13.71 $21,544,154 14.60 $1,660,984
Total Liabilities & Equity $169,291,063 100.00 $147,538,905 100.00 $21,752,158
Year ended December 31, 2018 and 2017
3
2018 Annual Report |
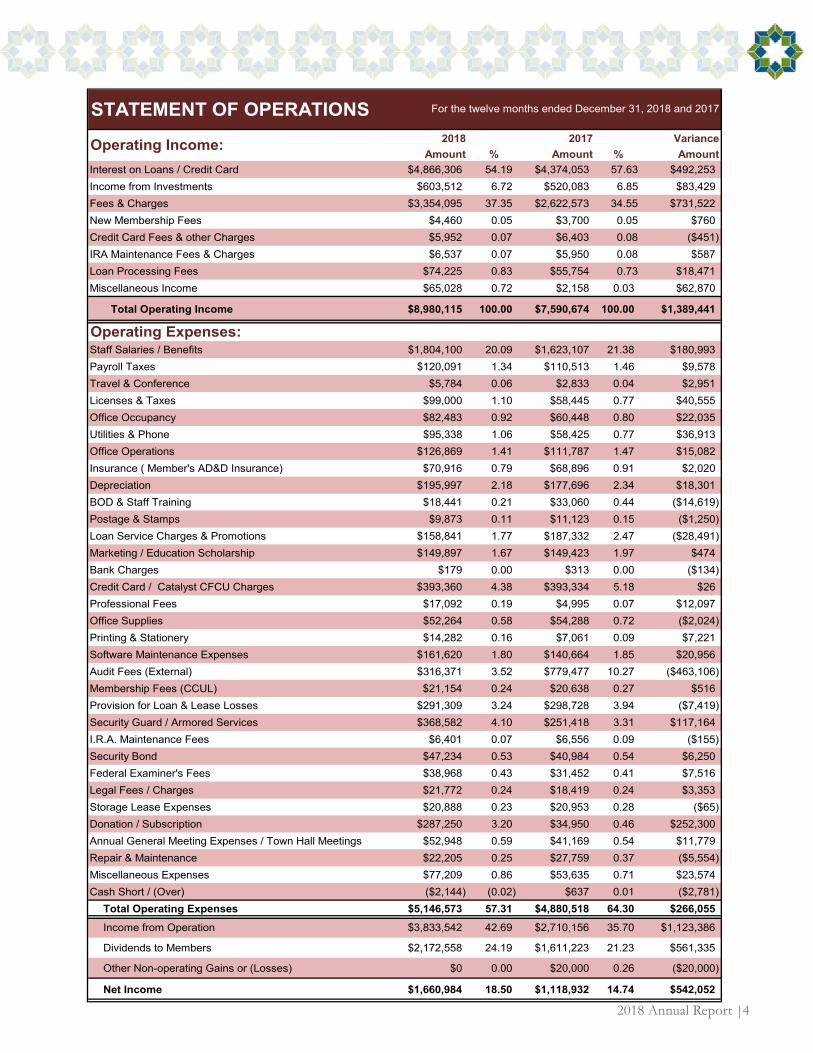
STATEMENT OF OPERATIONS2018 2017 Variance
Amount % Amount % AmountInterest on Loans / Credit Card $4,866,306 54.19 $4,374,053 57.63 $492,253Income from Investments $603,512 6.72 $520,083 6.85 $83,429Fees & Charges $3,354,095 37.35 $2,622,573 34.55 $731,522New Membership Fees $4,460 0.05 $3,700 0.05 $760Credit Card Fees & other Charges $5,952 0.07 $6,403 0.08 ($451)IRA Maintenance Fees & Charges $6,537 0.07 $5,950 0.08 $587Loan Processing Fees $74,225 0.83 $55,754 0.73 $18,471Miscellaneous Income $65,028 0.72 $2,158 0.03 $62,870
Total Operating Income $8,980,115 100.00 $7,590,674 100.00 $1,389,441
Operating Expenses:Staff Salaries / Benefits $1,804,100 20.09 $1,623,107 21.38 $180,993Payroll Taxes $120,091 1.34 $110,513 1.46 $9,578Travel & Conference $5,784 0.06 $2,833 0.04 $2,951Licenses & Taxes $99,000 1.10 $58,445 0.77 $40,555Office Occupancy $82,483 0.92 $60,448 0.80 $22,035Utilities & Phone $95,338 1.06 $58,425 0.77 $36,913Office Operations $126,869 1.41 $111,787 1.47 $15,082Insurance ( Member's AD&D Insurance) $70,916 0.79 $68,896 0.91 $2,020Depreciation $195,997 2.18 $177,696 2.34 $18,301BOD & Staff Training $18,441 0.21 $33,060 0.44 ($14,619)Postage & Stamps $9,873 0.11 $11,123 0.15 ($1,250)Loan Service Charges & Promotions $158,841 1.77 $187,332 2.47 ($28,491)Marketing / Education Scholarship $149,897 1.67 $149,423 1.97 $474Bank Charges $179 0.00 $313 0.00 ($134)Credit Card / Catalyst CFCU Charges $393,360 4.38 $393,334 5.18 $26Professional Fees $17,092 0.19 $4,995 0.07 $12,097Office Supplies $52,264 0.58 $54,288 0.72 ($2,024)Printing & Stationery $14,282 0.16 $7,061 0.09 $7,221Software Maintenance Expenses $161,620 1.80 $140,664 1.85 $20,956Audit Fees (External) $316,371 3.52 $779,477 10.27 ($463,106)Membership Fees (CCUL) $21,154 0.24 $20,638 0.27 $516Provision for Loan & Lease Losses $291,309 3.24 $298,728 3.94 ($7,419)Security Guard / Armored Services $368,582 4.10 $251,418 3.31 $117,164I.R.A. Maintenance Fees $6,401 0.07 $6,556 0.09 ($155)Security Bond $47,234 0.53 $40,984 0.54 $6,250Federal Examiner's Fees $38,968 0.43 $31,452 0.41 $7,516Legal Fees / Charges $21,772 0.24 $18,419 0.24 $3,353Storage Lease Expenses $20,888 0.23 $20,953 0.28 ($65)Donation / Subscription $287,250 3.20 $34,950 0.46 $252,300Annual General Meeting Expenses / Town Hall Meetings $52,948 0.59 $41,169 0.54 $11,779Repair & Maintenance $22,205 0.25 $27,759 0.37 ($5,554)Miscellaneous Expenses $77,209 0.86 $53,635 0.71 $23,574Cash Short / (Over) ($2,144) (0.02) $637 0.01 ($2,781)
Total Operating Expenses $5,146,573 57.31 $4,880,518 64.30 $266,055Income from Operation $3,833,542 42.69 $2,710,156 35.70 $1,123,386
Dividends to Members $2,172,558 24.19 $1,611,223 21.23 $561,335
Other Non-operating Gains or (Losses) $0 0.00 $20,000 0.26 ($20,000)
Net Income $1,660,984 18.50 $1,118,932 14.74 $542,052
Operating Income:
For the twelve months ended December 31, 2018 and 2017
4
| 2018 Annual Report 5
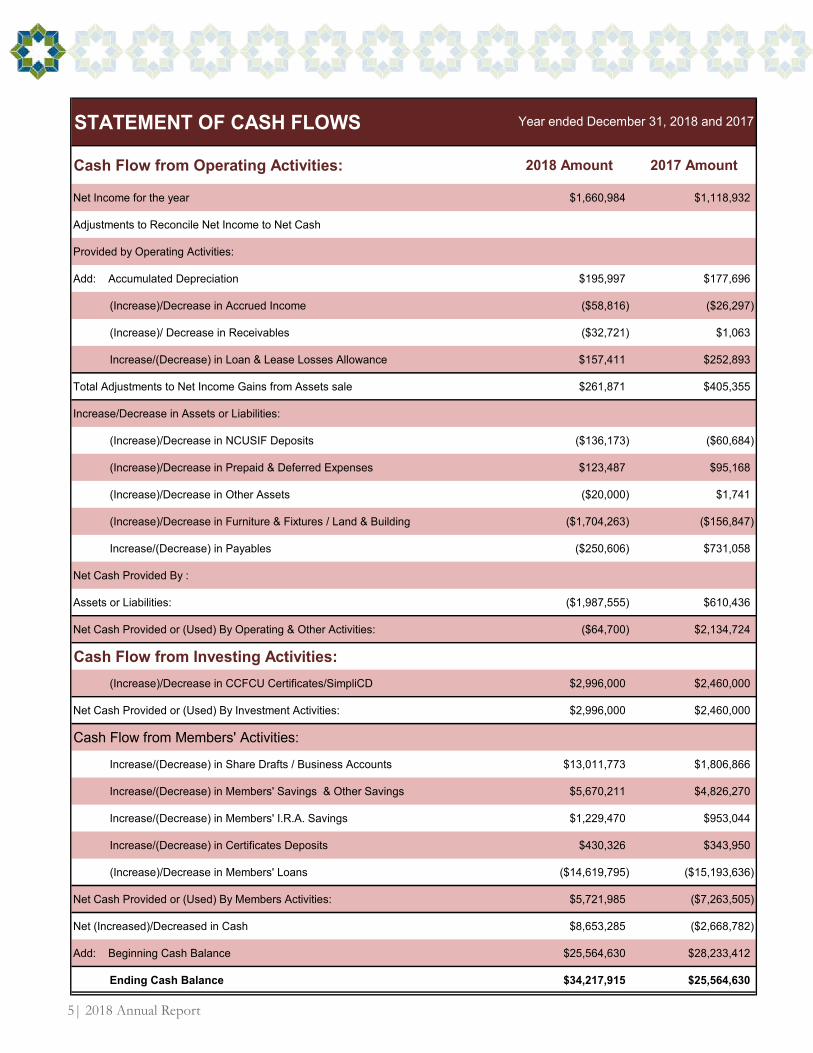
STATEMENT OF CASH FLOWS
Cash Flow from Operating Activities: 2018 Amount 2017 Amount
Net Income for the year $1,660,984 $1,118,932
Adjustments to Reconcile Net Income to Net Cash
Provided by Operating Activities:
Add: Accumulated Depreciation $195,997 $177,696
(Increase)/Decrease in Accrued Income ($58,816) ($26,297)
(Increase)/ Decrease in Receivables ($32,721) $1,063
Increase/(Decrease) in Loan & Lease Losses Allowance $157,411 $252,893
Total Adjustments to Net Income Gains from Assets sale $261,871 $405,355
Increase/Decrease in Assets or Liabilities:
(Increase)/Decrease in NCUSIF Deposits ($136,173) ($60,684)
(Increase)/Decrease in Prepaid & Deferred Expenses $123,487 $95,168
(Increase)/Decrease in Other Assets ($20,000) $1,741
(Increase)/Decrease in Furniture & Fixtures / Land & Building ($1,704,263) ($156,847)
Increase/(Decrease) in Payables ($250,606) $731,058
Net Cash Provided By :
Assets or Liabilities: ($1,987,555) $610,436
Net Cash Provided or (Used) By Operating & Other Activities: ($64,700) $2,134,724
Cash Flow from Investing Activities: (Increase)/Decrease in CCFCU Certificates/SimpliCD $2,996,000 $2,460,000
Net Cash Provided or (Used) By Investment Activities: $2,996,000 $2,460,000
Cash Flow from Members' Activities:
Increase/(Decrease) in Share Drafts / Business Accounts $13,011,773 $1,806,866
Increase/(Decrease) in Members' Savings & Other Savings $5,670,211 $4,826,270
Increase/(Decrease) in Members' I.R.A. Savings $1,229,470 $953,044
Increase/(Decrease) in Certificates Deposits $430,326 $343,950
(Increase)/Decrease in Members' Loans ($14,619,795) ($15,193,636)
Net Cash Provided or (Used) By Members Activities: $5,721,985 ($7,263,505)
Net (Increased)/Decreased in Cash $8,653,285 ($2,668,782)
Add: Beginning Cash Balance $25,564,630 $28,233,412
Ending Cash Balance $34,217,915 $25,564,630
Year ended December 31, 2018 and 2017
2018 Annual Report |
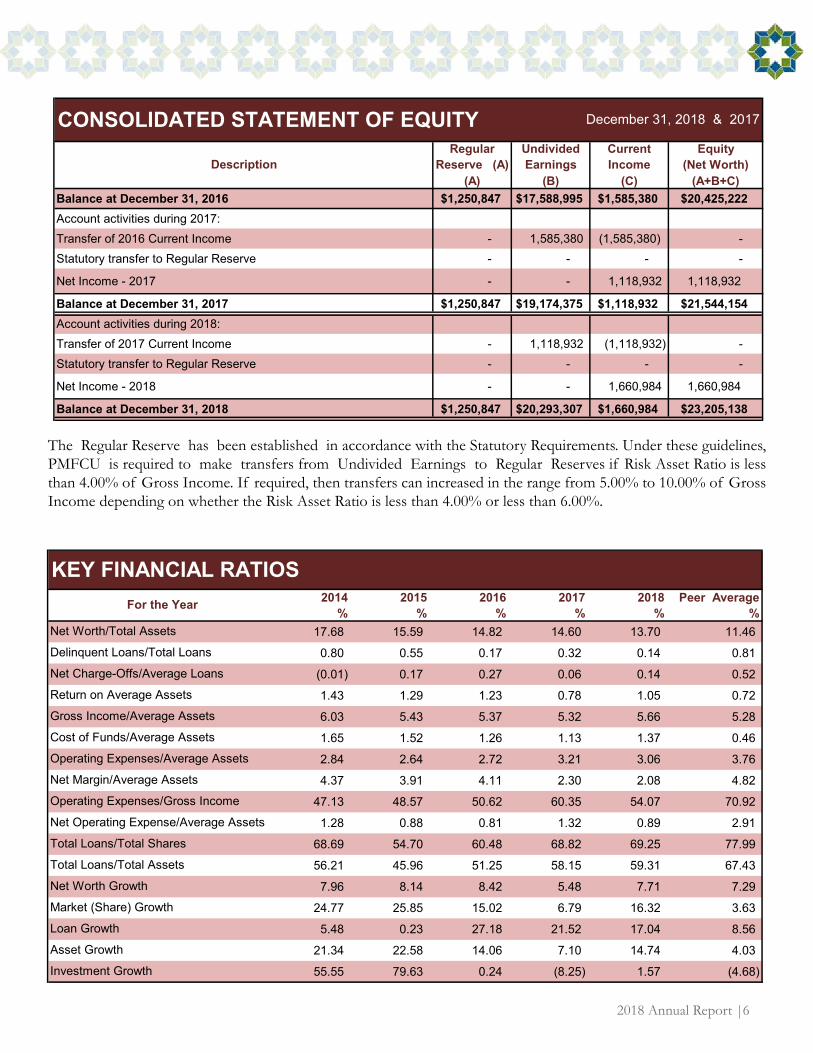
(A) (B) (C) (A+B+C)Balance at December 31, 2016 $1,250,847 $17,588,995 $1,585,380 $20,425,222Account activities during 2017:Transfer of 2016 Current Income - 1,585,380 (1,585,380) - Statutory transfer to Regular Reserve - - - -
Net Income - 2017 - - 1,118,932 1,118,932
Balance at December 31, 2017 $1,250,847 $19,174,375 $1,118,932 $21,544,154Account activities during 2018:Transfer of 2017 Current Income - 1,118,932 (1,118,932) - Statutory transfer to Regular Reserve - - - -
Net Income - 2018 - - 1,660,984 1,660,984
Balance at December 31, 2018 $1,250,847 $20,293,307 $1,660,984 $23,205,138
Equity(Net Worth)Description
CONSOLIDATED STATEMENT OF EQUITY December 31, 2018 & 2017
RegularReserve (A)
UndividedEarnings
CurrentIncome
6
2014 2015 2016 2017 2018 Peer Average% % % % % %
17.68 15.59 14.82 14.60 13.70 11.46
0.80 0.55 0.17 0.32 0.14 0.81
(0.01) 0.17 0.27 0.06 0.14 0.52
1.43 1.29 1.23 0.78 1.05 0.72
6.03 5.43 5.37 5.32 5.66 5.28
1.65 1.52 1.26 1.13 1.37 0.46
2.84 2.64 2.72 3.21 3.06 3.76
4.37 3.91 4.11 2.30 2.08 4.82
47.13 48.57 50.62 60.35 54.07 70.92
1.28 0.88 0.81 1.32 0.89 2.91
68.69 54.70 60.48 68.82 69.25 77.99
56.21 45.96 51.25 58.15 59.31 67.43
7.96 8.14 8.42 5.48 7.71 7.29
24.77 25.85 15.02 6.79 16.32 3.63
5.48 0.23 27.18 21.52 17.04 8.56
21.34 22.58 14.06 7.10 14.74 4.03
55.55 79.63 0.24 (8.25) 1.57 (4.68)
Asset Growth
Net Operating Expense/Average Assets
Total Loans/Total Shares
Net Worth Growth
Market (Share) Growth
Loan Growth
Total Loans/Total Assets
Net Worth/Total Assets
Delinquent Loans/Total Loans
Net Charge-Offs/Average Loans
Return on Average Assets
Net Margin/Average Assets
Operating Expenses/Gross Income
Gross Income/Average Assets
Cost of Funds/Average Assets
Investment Growth
Operating Expenses/Average Assets
For the Year
KEY FINANCIAL RATIOS
The Regular Reserve has been established in accordance with the Statutory Requirements. Under these guidelines, PMFCU is required to make transfers from Undivided Earnings to Regular Reserves if Risk Asset Ratio is less than 4.00% of Gross Income. If required, then transfers can increased in the range from 5.00% to 10.00% of Gross Income depending on whether the Risk Asset Ratio is less than 4.00% or less than 6.00%.
| 2018 Annual Report
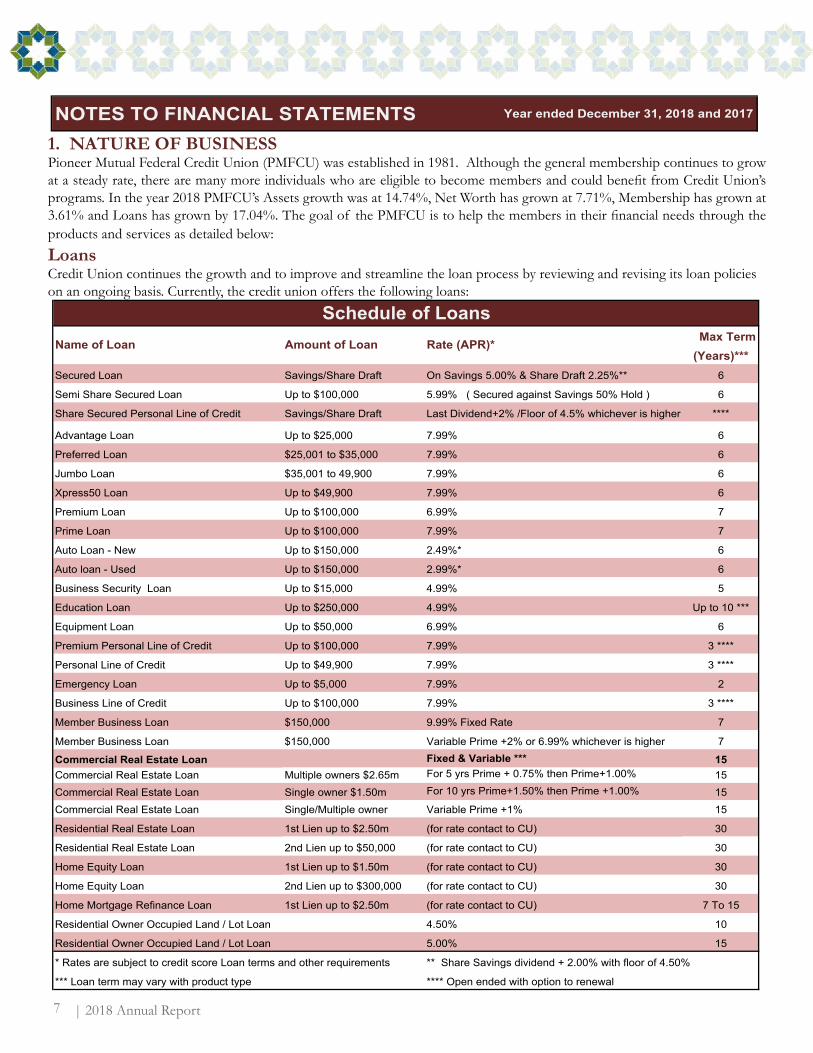
Max Term(Years)***
Secured Loan Savings/Share Draft On Savings 5.00% & Share Draft 2.25%** 6
Semi Share Secured Loan Up to $100,000 5.99% ( Secured against Savings 50% Hold ) 6
Share Secured Personal Line of Credit Savings/Share Draft Last Dividend+2% /Floor of 4.5% whichever is higher ****
Advantage Loan Up to $25,000 7.99% 6
Preferred Loan $25,001 to $35,000 7.99% 6
Jumbo Loan $35,001 to 49,900 7.99% 6
Xpress50 Loan Up to $49,900 7.99% 6
Premium Loan Up to $100,000 6.99% 7
Prime Loan Up to $100,000 7.99% 7
Auto Loan - New Up to $150,000 2.49%* 6
Auto loan - Used Up to $150,000 2.99%* 6
Business Security Loan Up to $15,000 4.99% 5
Education Loan Up to $250,000 4.99% Up to 10 ***
Equipment Loan Up to $50,000 6.99% 6
Premium Personal Line of Credit Up to $100,000 7.99% 3 ****
Personal Line of Credit Up to $49,900 7.99% 3 ****
Emergency Loan Up to $5,000 7.99% 2
Business Line of Credit Up to $100,000 7.99% 3 ****
Member Business Loan $150,000 9.99% Fixed Rate 7
Member Business Loan $150,000 Variable Prime +2% or 6.99% whichever is higher 7
Commercial Real Estate Loan Fixed & Variable *** 15Commercial Real Estate Loan Multiple owners $2.65m For 5 yrs Prime + 0.75% then Prime+1.00% 15Commercial Real Estate Loan Single owner $1.50m For 10 yrs Prime+1.50% then Prime +1.00% 15Commercial Real Estate Loan Single/Multiple owner Variable Prime +1% 15
Residential Real Estate Loan 1st Lien up to $2.50m (for rate contact to CU) 30
Residential Real Estate Loan 2nd Lien up to $50,000 (for rate contact to CU) 30
Home Equity Loan 1st Lien up to $1.50m (for rate contact to CU) 30
Home Equity Loan 2nd Lien up to $300,000 (for rate contact to CU) 30
Home Mortgage Refinance Loan 1st Lien up to $2.50m (for rate contact to CU) 7 To 15
Residential Owner Occupied Land / Lot Loan 4.50% 10
Residential Owner Occupied Land / Lot Loan 5.00% 15
**** Open ended with option to renewal *** Loan term may vary with product type
* Rates are subject to credit score Loan terms and other requirements ** Share Savings dividend + 2.00% with floor of 4.50%
Schedule of LoansName of Loan Amount of Loan Rate (APR)*
1. NATURE OF BUSINESSPioneer Mutual Federal Credit Union (PMFCU) was established in 1981. Although the general membership continues to grow at a steady rate, there are many more individuals who are eligible to become members and could benefit from Credit Union’s programs. In the year 2018 PMFCU’s Assets growth was at 14.74%, Net Worth has grown at 7.71%, Membership has grown at 3.61% and Loans has grown by 17.04%. The goal of the PMFCU is to help the members in their financial needs through the products and services as detailed below:LoansCredit Union continues the growth and to improve and streamline the loan process by reviewing and revising its loan policies on an ongoing basis. Currently, the credit union offers the following loans:
7
NOTES TO FINANCIAL STATEMENTS Year ended December 31, 2018 and 2017
2018 Annual Report |
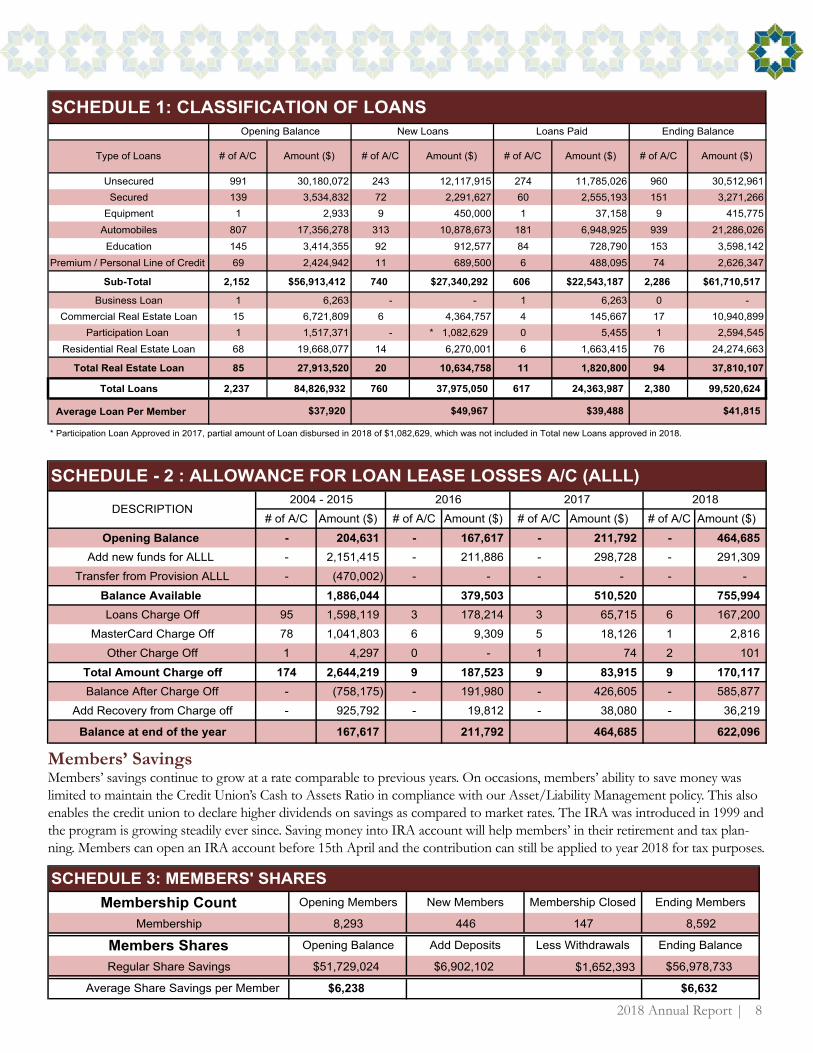
Unsecured 991 30,180,072 243 12,117,915 274 11,785,026 960 30,512,961Secured 139 3,534,832 72 2,291,627 60 2,555,193 151 3,271,266
Equipment 1 2,933 9 450,000 1 37,158 9 415,775Automobiles 807 17,356,278 313 10,878,673 181 6,948,925 939 21,286,026Education 145 3,414,355 92 912,577 84 728,790 153 3,598,142
Premium / Personal Line of Credit 69 2,424,942 11 689,500 6 488,095 74 2,626,347
Sub-Total 2,152 $56,913,412 740 $27,340,292 606 $22,543,187 2,286 $61,710,517
Business Loan 1 6,263 - - 1 6,263 0 - Commercial Real Estate Loan 15 6,721,809 6 4,364,757 4 145,667 17 10,940,899
Participation Loan 1 1,517,371 - * 1,082,629 0 5,455 1 2,594,545Residential Real Estate Loan 68 19,668,077 14 6,270,001 6 1,663,415 76 24,274,663
Total Real Estate Loan 85 27,913,520 20 10,634,758 11 1,820,800 94 37,810,107
Total Loans 2,237 84,826,932 760 37,975,050 617 24,363,987 2,380 99,520,624
Average Loan Per Member
* Participation Loan Approved in 2017, partial amount of Loan disbursed in 2018 of $1,082,629, which was not included in Total new Loans approved in 2018.
$37,920 $49,967 $39,488
# of A/C # of A/C# of A/C
$41,815
Amount ($)Amount ($) Amount ($)
SCHEDULE 1: CLASSIFICATION OF LOANSOpening Balance New Loans Loans Paid
Type of Loans Amount ($)# of A/C
Ending Balance
# of A/C Amount ($) # of A/C Amount ($) # of A/C Amount ($) # of A/C Amount ($)Opening Balance - 204,631 - 167,617 - 211,792 - 464,685
Add new funds for ALLL - 2,151,415 - 211,886 - 298,728 - 291,309 Transfer from Provision ALLL - (470,002) - - - - - -
Balance Available 1,886,044 379,503 510,520 755,994 Loans Charge Off 95 1,598,119 3 178,214 3 65,715 6 167,200
MasterCard Charge Off 78 1,041,803 6 9,309 5 18,126 1 2,816 Other Charge Off 1 4,297 0 - 1 74 2 101
Total Amount Charge off 174 2,644,219 9 187,523 9 83,915 9 170,117 Balance After Charge Off - (758,175) - 191,980 - 426,605 - 585,877
Add Recovery from Charge off - 925,792 - 19,812 - 38,080 - 36,219
Balance at end of the year 167,617 211,792 464,685 622,096
SCHEDULE - 2 : ALLOWANCE FOR LOAN LEASE LOSSES A/C (ALLL)
DESCRIPTION20182004 - 2015 2016 2017
Members’ SavingsMembers’ savings continue to grow at a rate comparable to previous years. On occasions, members’ ability to save money was limited to maintain the Credit Union’s Cash to Assets Ratio in compliance with our Asset/Liability Management policy. This also enables the credit union to declare higher dividends on savings as compared to market rates. The IRA was introduced in 1999 and the program is growing steadily ever since. Saving money into IRA account will help members’ in their retirement and tax plan-ning. Members can open an IRA account before 15th April and the contribution can still be applied to year 2018 for tax purposes.
8
Membership Count Opening Members New Members Membership Closed Ending Members
Membership 8,293 446 147 8,592
Members Shares Opening Balance Add Deposits Less Withdrawals Ending Balance
Regular Share Savings $51,729,024 $6,902,102 $1,652,393 $56,978,733
Average Share Savings per Member $6,238 $6,632
SCHEDULE 3: MEMBERS' SHARES
| 2018 Annual Report 9
2. SIGNIFICANT ACCOUNTING POLICESThe accounting policies of PMFCU are in conformity with Generally Accepted Accounting Principles (GAAP) in the United States of America. A description of the more significant of these policies is as follows:
Use of EstimatesThe preparation of financial statements in conformity with GAAP in the United States of America requires management to make estimates and assumptions that affect certain reported amounts of assets, liabilities, the reported amount revenues and expenses for the period.
Cash EquivalentsFor purposes of reporting cash flows, the Credit Union considers all investments in overnight to be cash equivalents and all investments purchased with original maturities of three month or less to be cash equivalents.
InvestmentsIn order to get better investment return on excess liquidity of $27.134 million, up to $248K each has been invested in ‘laddered’ form of certificate of deposits (SimpliCD with various banks) through Catalyst Corporate Federal Credit Union. These CDs mature in below 3 months interval up to 60 months. Currently we have invested $27.134 millions on an average rate at 2.19% as of December 31, 2018.
Prepaid ExpensesPioneer Mutual Federal Credit Union contributed $1.75 million to Community Focus Foundation for “Pioneer Community Center” for name branding as a Marketing Expenses, which is amortized for 15 years. Outstanding balance as of December 31, 2018 is $1,069,445.
3. LINE OF CREDITPMFCU has $15,000,000 line of credit facility at 3.5% interest rate with Catalyst Corporate Federal Credit Union (CCFCU) as of December 31, 2018. Interest is payable monthly based on the daily balance. There was no balance outstanding on the line of Credit as of December 31, 2018.
4. CONCENTRATIONS OF CREDIT RISKPMFCU maintains an account with Catalyst Corporate Federal Credit Union a balance $2,163,131 of as of December 31, 2018. This account is insured by the National Credit Union Share Insurance Fund (NCUSIF) up to $250,000. The Credit Union also maintains other account with Wallis Bank (WB). The total balances in the WB Checking Account was $1,877,042.51 as of December 31, 2018. The Checking account is insured up to $250,000.00 by the Federal Deposit Insurance Corporation (FDIC). Under the Personal Line of Credit and Credit Card Program members have different credit limits. At the year ended on December 31, 2018, approximately $2,525,663 and $4,765,705 respectively remained unused credit card limits.
Loans to membersLoans to members are stated at the current principal amount outstanding. Interest on loans is accrued on monthly basis on the amount of principal outstanding.
Premises and EquipmentsThe Credit Union occupies Austin premises of approximately 1,850 square feet for $3,700 and Compliance Department premises of approximately 1,768 square feet. for $3,173.56 monthly rent. The equipment is carried at cost less accumulated depreciation. Provisions for depreciation are computed using the straight-line method. Average useful lives used for depreciation with respect to major classifications of property are as follows:Furniture and Equipment 3 to10 years and Computer and Software 2 to 5 years.Expenses for maintenance and repairs are charged against operations. Assets and related amounts are removed from the accounts upon retirement or other disposition and any resulting gains or losses are recorded in the statement of activities.
Income TaxesPMFCU is exempted from Federal Income Taxes under Internal Revenue Code sections 501(c) (1) and are also exempted from State Sales Taxes.
2018 Annual Report |
0
20
40
60
80
100
120
140
160
180
2014 2015 2016 2017 2018
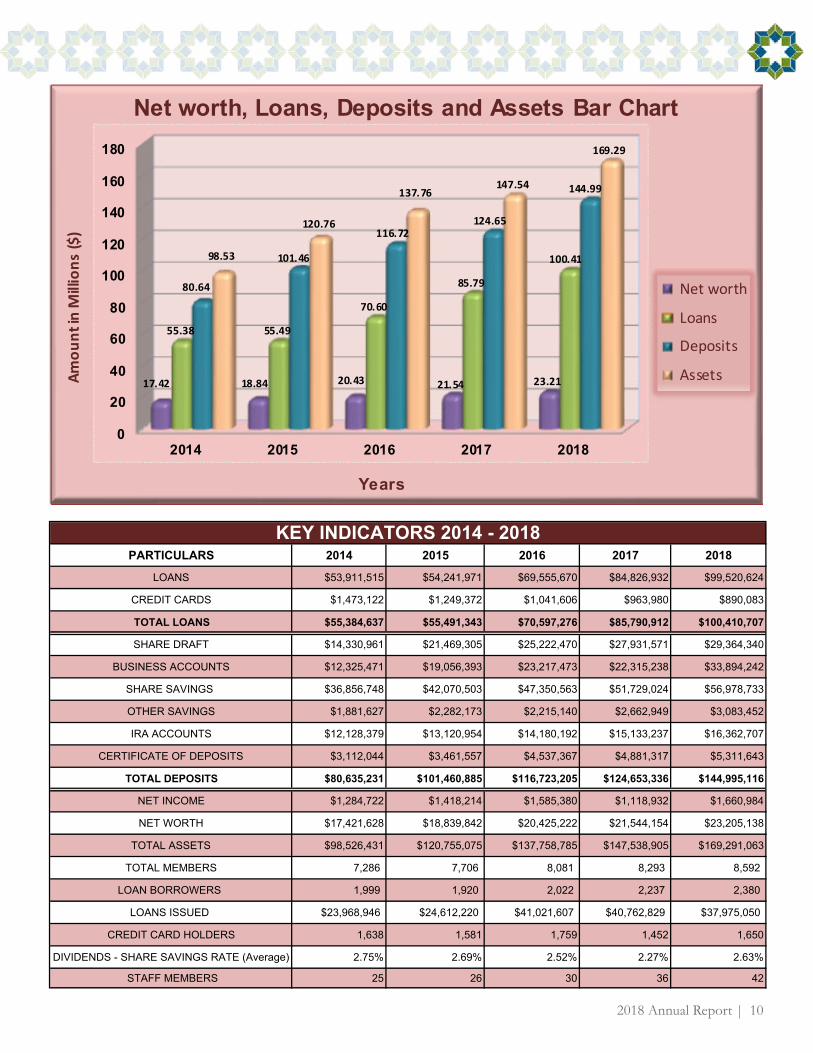
17.42 18.84 20.43 21.54 23.21
55.38 55.49
70.60
85.79
100.41
80.64
101.46
116.72124.65
144.99
98.53
120.76
137.76147.54
169.29
Amou
nt in M
illions ($
)
Years
Net worth, Loans, Deposits and Assets Bar Chart
Net worth
Loans
Deposits
Assets
PARTICULARS 2014 2015 2016 2017 2018
LOANS $53,911,515 $54,241,971 $69,555,670 $84,826,932 $99,520,624
CREDIT CARDS $1,473,122 $1,249,372 $1,041,606 $963,980 $890,083
TOTAL LOANS $55,384,637 $55,491,343 $70,597,276 $85,790,912 $100,410,707
SHARE DRAFT $14,330,961 $21,469,305 $25,222,470 $27,931,571 $29,364,340
BUSINESS ACCOUNTS $12,325,471 $19,056,393 $23,217,473 $22,315,238 $33,894,242
SHARE SAVINGS $36,856,748 $42,070,503 $47,350,563 $51,729,024 $56,978,733
OTHER SAVINGS $1,881,627 $2,282,173 $2,215,140 $2,662,949 $3,083,452
IRA ACCOUNTS $12,128,379 $13,120,954 $14,180,192 $15,133,237 $16,362,707
CERTIFICATE OF DEPOSITS $3,112,044 $3,461,557 $4,537,367 $4,881,317 $5,311,643
TOTAL DEPOSITS $80,635,231 $101,460,885 $116,723,205 $124,653,336 $144,995,116
NET INCOME $1,284,722 $1,418,214 $1,585,380 $1,118,932 $1,660,984
NET WORTH $17,421,628 $18,839,842 $20,425,222 $21,544,154 $23,205,138
TOTAL ASSETS $98,526,431 $120,755,075 $137,758,785 $147,538,905 $169,291,063
TOTAL MEMBERS 7,286 7,706 8,081 8,293 8,592
LOAN BORROWERS 1,999 1,920 2,022 2,237 2,380
LOANS ISSUED $23,968,946 $24,612,220 $41,021,607 $40,762,829 $37,975,050
CREDIT CARD HOLDERS 1,638 1,581 1,759 1,452 1,650
DIVIDENDS - SHARE SAVINGS RATE (Average) 2.75% 2.69% 2.52% 2.27% 2.63%
STAFF MEMBERS 25 26 30 36 42
KEY INDICATORS 2014 - 2018
10
| 2018 Annual Report 11
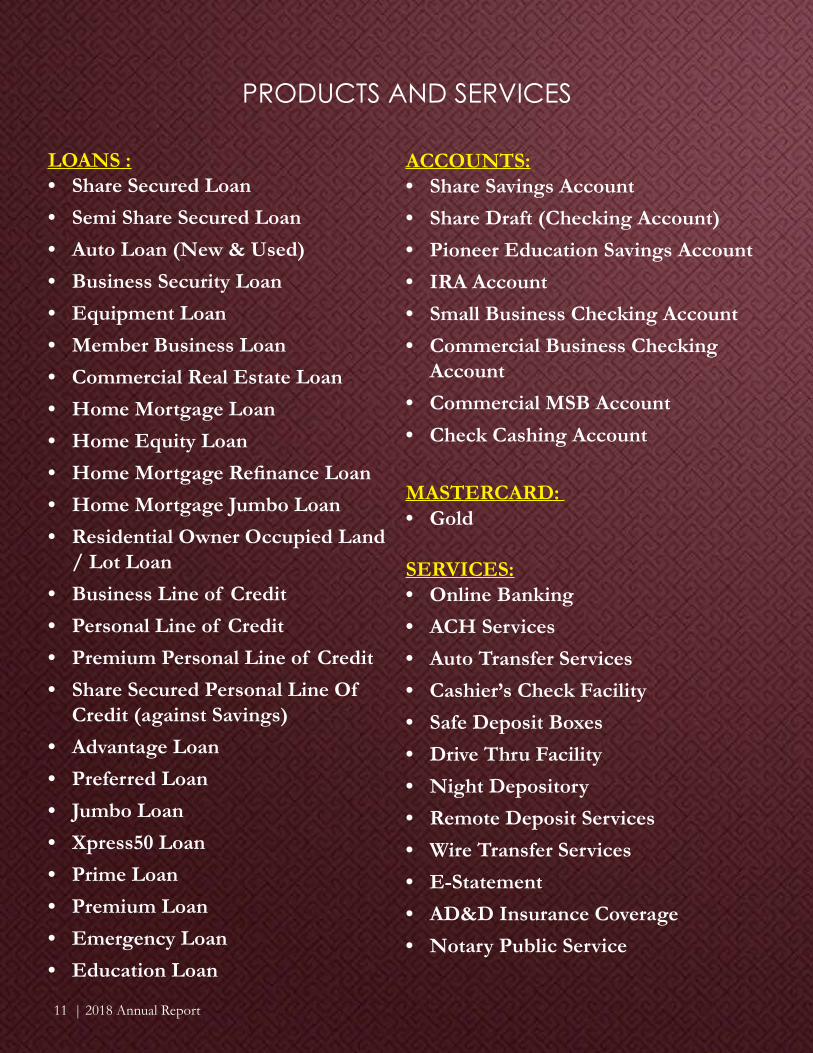
LOANS :• Share Secured Loan• Semi Share Secured Loan• Auto Loan (New & Used)• Business Security Loan• Equipment Loan• Member Business Loan• Commercial Real Estate Loan• Home Mortgage Loan• Home Equity Loan• Home Mortgage Refinance Loan• Home Mortgage Jumbo Loan• Residential Owner Occupied Land
/ Lot Loan• Business Line of Credit• Personal Line of Credit• Premium Personal Line of Credit• Share Secured Personal Line Of
Credit (against Savings)• Advantage Loan• Preferred Loan• Jumbo Loan• Xpress50 Loan• Prime Loan• Premium Loan• Emergency Loan• Education Loan
ACCOUNTS:• Share Savings Account• Share Draft (Checking Account)• Pioneer Education Savings Account• IRA Account• Small Business Checking Account• Commercial Business Checking
Account• Commercial MSB Account• Check Cashing Account
MASTERCARD: • Gold
SERVICES:• Online Banking• ACH Services• Auto Transfer Services• Cashier’s Check Facility• Safe Deposit Boxes• Drive Thru Facility• Night Depository• Remote Deposit Services• Wire Transfer Services• E-Statement• AD&D Insurance Coverage• Notary Public Service
PRODUCTS AND SERVICES
| 2018 Annual Report

Nooruddin MominAccounting Manager
Sanif KarowaliyaFinancial Compliance
Officer
Swati PatelOperations Manager
Faiza AliBusiness & Mortgage
Loan Manager
Afrojaben DhukaCredit Analyst
Shama MominHead Teller & Supervisor
Alvin MominOperationsOfficer
Austin Branch
Naeema AliBranch Manager
Austin Branch
Shabira MominOperations Manager North Houston Branch
Farhana MominComplianceOfficer
OfficeStaff
Zahra MaknojiaLoanOfficer
Wafee AliBSAComplianceOfficer
Sonia MominHR & Administrative
Officer
Nimrusha AliTeller I
Austin Branch
Alvina AliMember ServiceRepresentative II
Huma MominCollection Assistant
Aroshna SherwaOperations Assistant II
Noreen MarediaTeller II
Austin Branch
Firuza BuribekovaOperations Assistant I
Shahina ManknojiaTeller I
Akhtar NoorwaniAudit Manager
Anum K AliAccountingOfficer
KamarinBahen Maknojiya
Teller Supervisor
Munija KadiwalaCompliance Assistant
Aqeel AliOperations Assistant
Munisha PraslaMember ServiceRepresentativeAustin Branch
Sonika MaknojiaOperations Assistant
Nabil MaknojiyaLoanOfficer
Sajjad AliCompliance Associate II
Alzaib MaknojiaTeller
Mahera MominSenior BSA Compliance
Officer
Shamina DholasaniyaTeller I
North Houston Branch
Rashmin AliTeller
North Houston Branch
Rifaa DhukaAdministrative Assistant
Sobia AliTeller
Austin Branch
Sanam AliTeller
Mubarak AliManager
Nayeem ParasalaITOfficer
Suman KarovadiyaMember ServiceRepresentative
North Houston Branch
Anum JafferTeller
Austin Branch
Annual Report 2018
1521 Lake Pointe Parkway, Sugar Land, Texas 77478Phone: 281-566-8000 Fax: 281-566-8001
www.pioneeronline.org
8801 Research Blvd, Suite 105, Austin, TX 78758Phone: (512) 467-PMCU (7628) Fax: (512) 467-PFAX (7329)
SUGAR LAND OFFICE
AUSTIN BRANCH
8643 W Rayford Road, Spring TX 77389Phone: 281-566-8071 Fax: 281-566-8072
NORTH HOUSTON BRANCH
Members Helping Members


![[WMD 2015] Branch Metrics, Alex Austin >> "Mobile-izing The Masses: Case Studies On How To Build, Release & Grow B2C Apps"](https://img.pdfslide.us/doc/110x75/55a56f421a28ab00388b4626/wmd-2015-branch-metrics-alex-austin-mobile-izing-the-masses-case-studies-on-how-to-build-release-grow-b2c-apps.jpg)