Embed Size (px)
Citation preview

NATURE CHEMISTRY | www.nature.com/naturechemistry 1
SUPPLEMENTARY INFORMATIONDOI: 10.1038/NCHEM.2108
1
Covalent functionalization of monolayered transition metal dichalcogenides by phase
engineering
Damien Voiry1, Anandarup Goswami2,3, Rajesh Kappera1, Cecilia de Carvalho Castro e Silva1,
Daniel Kaplan4, Takeshi Fujita5,6, Mingwei Chen5, Tewodros Asefa2,3, and Manish Chhowalla1,*
1 Materials Science and Engineering, Rutgers University, 607 Taylor Road, Piscataway, New
Jersey 08854, USA.
2 Department of Chemistry and Chemical Biology, Rutgers University, 610 Taylor Road,
Piscataway, New Jersey 08854, USA.
3 Department of Chemical and Biochemical Engineering, Rutgers University, 98 Brett Road,
Piscataway, New Jersey 08854, USA.
4 U.S. Army RDECOM-ARDEC, Acoustics and Networked Sensors Division, Picatinny Arsenal,
New Jersey 07806, USA.
5 WPI Advanced Institute for Materials Research, Tohoku University, Sendai 980-8577, Japan. 6 JST, PRESTO, 4-1-8 Honcho Kawaguchi, Saitama 332-0012, Japan.
Supplementary Information
© 2014 Macmillan Publishers Limited. All rights reserved.
NATURE CHEMISTRY | www.nature.com/naturechemistry 2
SUPPLEMENTARY INFORMATIONDOI: 10.1038/NCHEM.2108
2
Table of Contents
Section Title Pages
Materials and Methods 3-6
Zeta Potential Measurement 6
Photoluminescence of Chemically Exfoliated TMDs 7
High Angle Annular Dark Field Scanning Transmission Electron Microscope (HAADF STEM)
8
XPS Spectroscopy 9-12
Thermogravimetric Analysis (TGA) 13-14
Solubilization of functionalized TMDs in organic solvent 15-16
Raman and FTIR Spectroscopy 16-18
Solid-state 13C Nuclear Magnetic Resonance Spectroscopy 19-21
Importance of iodine as leaving group 21-22
ATR-FTIR spectroscopy of 300°C-annealed TMDs 22-23
Restoration of the trigonal prismatic structure (2H phase) 23-29
Raman spectroscopy of functionalized 2H MoS2 29
X-ray Diffraction 30-31
Functionalization with 4-Bromobenzenediazonium tetrafluoroborate 31-33
© 2014 Macmillan Publishers Limited. All rights reserved.

NATURE CHEMISTRY | www.nature.com/naturechemistry 3
SUPPLEMENTARY INFORMATIONDOI: 10.1038/NCHEM.2108
3
Structures of the functionalized 1T TMDs 33-34
Field Effect Transistors 34-35
References 35-37
Materials and Methods:
All functionalized TMDs presented in the Supplementary Information are functionalized with
acetamide unless otherwise specified.
Chemicals and Reagents:
Bulk powders of TMDs were purchased from Alfa Aesar. Iodomethane, 2-iodoacetamide,
acetamide, n-butyllithium (1.6 M in hexane), iodine (>99.8%) were obtained from Sigma
Aldrich. Organic solvents were purchased from either Sigma Aldrich or Alfa Aesar and used as
received. Hydrochloric acid (36.5%) was received from Fischer Scientific.
Reaction of exfoliated nanosheets with iodomethane:
The intercalated powder was exfoliated in water at 1mg/mL, sonicated for 1 h to facilitate
the exfoliation and centrifuged to remove lithium compounds as well as the non-exfoliated
materials. The solution of chemically exfoliated TMDs was then diluted with 2-propanol to get a
final ratio water:2-propanol equal to 2:1. Iodomethane was then added to the TMDs solution
with a 10-fold excess. We noticed that the reaction goes faster than in the case of 2-
© 2014 Macmillan Publishers Limited. All rights reserved.

NATURE CHEMISTRY | www.nature.com/naturechemistry 4
SUPPLEMENTARY INFORMATIONDOI: 10.1038/NCHEM.2108
4
iodoacetamide. After 12 hours, the functionalized nanosheets were washed with 2-propanol (3 x
50 mL), ethanol (3 x 50 mL) and water (3 x 50 mL).
Reaction of 2H nanosheets with 2-Iodoacetamide:
As-exfoliated nanosheets were dried and annealed at 300°C for 15 min to restore the 2H
phase following the protocol reported in Ref 10. The 2H nanosheets were dispersed in water and
sonicated for 10 minutes. The nanosheets suspended in water were then treated with a 10-fold
excess of 2-iodoacetamide for 5 days and washed with isopropanol (3 x 50 mL), ethanol (3 x 50
mL) and water (3 x 50 mL).
Annealing of Functionalized TMDs:
Functionalized TMDs were placed in a quartz tube and vacuum was applied for 20 min to
remove any trace of oxygen. The tube was then refilled with Ar and annealing was performed
under a flow of Argon at 80 sccm for 15 min. Non-functionalized TMDs were annealed
following the same protocol.
Quantification of the functionalization:
The extents of functionalization reported in the manuscript correspond to the ratio the of
the atomic percentage of nitrogen N1s peak at ~ 400 eV attributed to the nitrogen from the amide
groups and the atomic percentage of the transition metal measured by X-ray Photoelectron
Spectroscopy (XPS)1,2.
© 2014 Macmillan Publishers Limited. All rights reserved.

NATURE CHEMISTRY | www.nature.com/naturechemistry 5
SUPPLEMENTARY INFORMATIONDOI: 10.1038/NCHEM.2108
5
Chemical Vapor Deposition of electronic grade single layer MoS2 nanosheets:
Single layer MoS2 nanosheets were grown by chemical vapor deposition (CVD) using
MoO3 and sulfur powder as precursors. MoO3 powder (50 mg) was placed in an alumina boat in
the center of the heating zone of the furnace. Pieces of silicon wafer capped with 300 nm oxide
layer wafers and 0.75 g of sulfur were placed next the boat containing the MoO3 powder and at
the entrance of the furnace, respectively. Vacuum was performed for 15 minutes and the furnace
tube was then refilled with Ar. The furnace was heated under a constant Ar flow of 50 sccm.
After 15 minutes at 800°C, the furnace was cooled down to room temperature and samples were
removed from the furnace. Triangular MoS2 nanosheets grown on SiO2 were further observed by
optical microscope with dimensions ranging from 20 m to 100 m.
Functionalization of single –layer MoS2 crystals:
Single-layer MoS2 flakes grown by CVD on Si/SiO2 were first converted to the 1T phase.
In a glove box, butyllithium (1.6 M in hexane) was dropped on the wafer. After 24 hours of
reaction, the wafer was washed with hexane (4x 2 mL) and dried. 0.1 M of 2-iodoacetamide in
dimethylsulfoxide was then added on the MoS2 flakes and the reaction was carried out for 48
hours. Finally the excess of the 2-iodoacetamide solution was removed and the wafer was
washed with DMSO (3 x 5 mL), THF (3 x 5 mL), isopropanol (3 x 5 mL), ethanol (3 x 5 mL)
and water (3 x 5 mL).
© 2014 Macmillan Publishers Limited. All rights reserved.

NATURE CHEMISTRY | www.nature.com/naturechemistry 6
SUPPLEMENTARY INFORMATIONDOI: 10.1038/NCHEM.2108
6
Fabrication of MoS2 field-effect transistors (FET):
Field effect transistors were fabricated using poly(methyl metacrylate) (PMMA)
patterning and e-beam evaporation to deposit gold sources/drain electrodes. The PMMA was
removed by washing with large amount of HPLC grade acetone. Gold (50 nm) was deposited on
the MoS2 flake at 0.5 Å/s and the source-drain length and width were 15 µm and 10µm
respectively.
Zeta Potential Measurement:
Zeta-potentials of exfoliated MoS2, iodine-treated MoS2 and functionalized MoS2 were
measured using Malvern Instrument Zetasizer Nano-ZS90 at pH ≈ 7.4 (using phosphate buffer
saline buffer). The samples were prepared as followed: The representative solid sample (1mg)
was first dispersed in DI water (1 mL), 1 mL of PBS buffer was added to it and sonicated for 30
mins. 1 mL of that solution was taken out and put into the zeta-potential cell for measurement of
zeta-potential. The values are reported as an average of three measurements.
Entry Zeta-potential (, mV)
Exfoliated MoS2 -40.8
Iodine-treated-MoS2 -27.1
Functionalized-MoS2 -20.2
© 2014 Macmillan Publishers Limited. All rights reserved.

NATURE CHEMISTRY | www.nature.com/naturechemistry 7
SUPPLEMENTARY INFORMATIONDOI: 10.1038/NCHEM.2108
7
Supplementary Table 1. Zeta-potential values of exfoliated MoS2, iodine-treated MoS2 and
functionalized MoS2 at pH ≈ 7.4.
Photoluminescence of Chemically Exfoliated TMDs:
MoS2, WS2 and MoSe2 are known to undergo an indirect-to-direct band gap transition
when in the form of single layers. Thin film of TMDs has been prepared by vacuum filtration
and transferred on SiO2 following the same methods as reported earlier (Ref 10). After annealing
at 300°C under inert atmosphere to restore the semiconducting structure to the nanosheets, we
detected photoluminescence signals from each material confirming the single-layer nature of the
exfoliated materials prepared for this work (Supplementary Fig. 1).
Supplementary Figure 1. Photoluminescence spectra of chemically exfoliated TMDs for an
excitation wavelength of 514 nm (2.41 eV).
600 700 800
Inte
nsity
(a.u
.)
Wavelength (nm)
MoS2
WS2
MoSe2
2 1.8 1.6
Energy (eV)
© 2014 Macmillan Publishers Limited. All rights reserved.

NATURE CHEMISTRY | www.nature.com/naturechemistry 8
SUPPLEMENTARY INFORMATIONDOI: 10.1038/NCHEM.2108
8
High Angle Annular Dark Field Scanning Transmission Electron Microscope (HAADF
STEM):
HAADF STEM images were obtained using JOEL JEM-2100F TEM/STEM with double
spherical aberration (Cs) correctors (CEOS GmbH, Heidelberg, Germany) and a collecting angle
between 100 and 267 mrad. The acceleration voltage was set to 120 kV.
Our HAADF-STEM study of functionalized single-layer MoS2 nanosheets revealed no
noticeable changes in the 1T structure between the bare and the functionalized MoS2 nanosheets.
This indicates that the functionalization do not lead to a profound change in the atomic structure
of the TMDs nanosheets. In 2H phase, the S atoms from the upper and lower layer of MoS2 are
in top of each of other. In the case of the 1T phase, due to the octahedral coordination of the
metal atoms, the Sulfur atom S atoms in the upper and lower planes are offset from each other
and their intensity is significantly decreases (Supplementary Fig. 2)3.
(b)(a)
© 2014 Macmillan Publishers Limited. All rights reserved.

NATURE CHEMISTRY | www.nature.com/naturechemistry 9
SUPPLEMENTARY INFORMATIONDOI: 10.1038/NCHEM.2108
9
Supplementary Figure 2. High annular angle dark field STEM images of the (a) chemically
exfoliated and (b) functionalized single-layer MoS2 nanosheets. The positions of the atoms are
shown in blue and yellow for Mo and S respectively. Scale bar: 0.5 nm.
XPS Spectroscopy:
X-ray photoelectron spectroscopy (XPS) measurements were performed with a Thermo
Scientific K-Alpha spectrometer with a detection limit of 0.1 at.%. All spectra were taken using a
Al-Kα microfocused monochromatized source (1486.7 eV) with a resolution of 0.6 eV and a spot
size of 400 µm.
Supplementary Fig. 3 shows the survey spectra for iodine treated and acetamide-
functionalized MoS2, WS2 and MoSe2. No signals from I3d5/2 expected at ~ 620 eV can be
indentified confirming the absence of pristine reagents.
© 2014 Macmillan Publishers Limited. All rights reserved.

NATURE CHEMISTRY | www.nature.com/naturechemistry 10
SUPPLEMENTARY INFORMATIONDOI: 10.1038/NCHEM.2108
10
Supplementary Figure 3. XPS survey spectra of acetamide-functionalized TMDs compared to
their iodine-treated counterpart.
1200 1000 800 600 400 200 0
WS2
Inte
nsity
(a. u
.)
Binding energy (eV)
Fct-WS2
1200 1000 800 600 400 200 0
MoSe2
Inte
nsity
(a. u
.)
Binding energy (eV)
Fct-MoSe2
1200 1000 800 600 400 200 0
Fct-MoS2
Inte
nsity
(a. u
.)
Binding energy (eV)
MoS2
(a)
(b)
(c)
© 2014 Macmillan Publishers Limited. All rights reserved.

NATURE CHEMISTRY | www.nature.com/naturechemistry 11
SUPPLEMENTARY INFORMATIONDOI: 10.1038/NCHEM.2108
11
When compared with iodine treated samples, the C1s region of XPS spectra for
functionalized TMDs showed peak at 288.4 eV associated with carbonyl peak coming from the
amide group on the surface of the nanosheets (Supplementary Fig. 4).
Supplementary Figure 4. C1s high-resolution spectra for (a) Fct-MoS2, (b) Fct-WS2 and (c)
Fct-MoSe2 compared to their iodine-treated equivalent. The band at ~ 288.4 eV is attributed to
the amide groups grafted on the TMDs nanosheets.
At the respective metal regions, the spectra from the functionalized transition metals
didn’t show significant difference compared to the iodine treated TMDs indicating that the
environment of the metal atoms is not significantly affected by the grafting of functional groups
and thus the metal atoms are not attached to the amide group (Supplementary Fig. 5).
292 288 284 280
Inte
nsity
(a. u
.)
Binding energy (eV)
Fct-MoS2
MoS2
292 288 284 280
Inte
nsity
(a. u
.)
Binding energy (eV)
Fct-MoSe2
MoSe2
292 288 284 280
Inte
nsity
(a. u
.)
Binding energy (eV)
WS2
Fct-WS2
(a) (b) (c)
© 2014 Macmillan Publishers Limited. All rights reserved.

NATURE CHEMISTRY | www.nature.com/naturechemistry 12
SUPPLEMENTARY INFORMATIONDOI: 10.1038/NCHEM.2108
12
Supplementary Figure 5. High-resolution spectra from Mo3d (a and c) and W4f (b) regions of
Fct-TMDs and iodine-treated samples.
40 35 30
WS2Inte
nsity
(a. u
.)
Binding energy (eV)
Fct.-WS2
236 232 228 224
MoSe2
Inte
nsity
(a. u
.)
Binding energy (eV)
Fct-MoSe2
236 232 228 224
MoS2Inte
nsity
(a. u
.)
Binding energy (eV)
Fct-MoS2
(a)
(b)
(c)
© 2014 Macmillan Publishers Limited. All rights reserved.

NATURE CHEMISTRY | www.nature.com/naturechemistry 13
SUPPLEMENTARY INFORMATIONDOI: 10.1038/NCHEM.2108
13
Thermogravimetric Analysis (TGA):
TGA was performed using Perkin Elmer TGA 7 Thermogravimetric Analyzer equipped
with Thermal Analysis Controller. Measurements were done under nitrogen from 50 °C up to
600 °C with a ramp of 10 °C/min after purging the system for 15 min at 50 °C (Supplementary
Fig. 6). The traces of the first derivatives of the TGA traces show that the decompositions of the
functional groups occurs at 257°C, 242°C and 262°C for respectively MoS2, WS2 and MoSe2
with an onset decomposition temperature of ~ 200°C. The degree of functionalization has been
calculated by measuring the weight loss at 400 °C and assuming that the difference of weight
loss between functionalized TMDs and their iodine treated equivalents is solely due to the
degradation of the functional groups.
© 2014 Macmillan Publishers Limited. All rights reserved.

NATURE CHEMISTRY | www.nature.com/naturechemistry 14
SUPPLEMENTARY INFORMATIONDOI: 10.1038/NCHEM.2108
14
Supplementary Figure 6. Thermogravimetric traces of bulk, iodine-treated and acetamide-
functionalized TMDs from 50 °C to 500 °C with ramp of 10 °C /min under nitrogen. First
derivative of the TGA traces are displayed in dashed lines.
100 200 300 400 50070
80
90
100
Wei
gth
(%)
Temperature (oC)
Bulk WS2
As-exfol. WS2
Fct-WS2
0.00
-0.05
-0.10
Derivative w
eight (%. oC
-1)
100 200 300 400 50070
80
90
100
Wei
ght (
%)
Temperature (oC)
Bulk MoSe2
MoSe2 _ iodine
Fct-MoSe2
0.0
-0.1
-0.2
-0.3
Derivative w
eight (%. oC
-1)
100 200 300 400 50070
80
90
100
Wei
ght (
%)
Temperature (oC)
Bulk MoS2
As-exfol. MoS2
Fct-MoS2
0.0
-0.1
-0.2
-0.3
Derivative w
eight (%. oC
-1)
(a)
(b)
(c)
© 2014 Macmillan Publishers Limited. All rights reserved.

NATURE CHEMISTRY | www.nature.com/naturechemistry 15
SUPPLEMENTARY INFORMATIONDOI: 10.1038/NCHEM.2108
15
Solubilization of functionalized TMDs in organic solvent:
Functionalized MoS2 and WS2 were dissolved in isopropanol at 1-2mg/mL and were
gently sonicated for 30 min using regular bath sonicator. The colored solution was then
centrifuged at 1500 rpm (~ 500 g) for 10 minutes to remove the aggregates. The solution thus
obtained from 1T and 2H functionalized XS2 (X= Mo or W) are found highly stable and no
sedimentation is observed after several days. Interestingly the different phase can be identified
easily by the color. The solutions from 1T TMDs have a grey-reddish color, whereas the
solutions of 2H phase are yellow-greenish (Supplementary Fig. 7).
Supplementary Figure 7. Digital pictures of the functionalized 1T and 2H XS2 solutions in
isopropanol. From left to right: Fct-1T MoS2, Fct-2H MoS2, Fct-1T WS2 and Fct-2H WS2.
The concentration of the solution has been estimated by using the Beer-Lambert law
(Supplementary Table 2). We have measured the extinction coefficient for the 1T phase of MoS2
© 2014 Macmillan Publishers Limited. All rights reserved.

NATURE CHEMISTRY | www.nature.com/naturechemistry 16
SUPPLEMENTARY INFORMATIONDOI: 10.1038/NCHEM.2108
16
and WS2 by combining UV-vis spectroscopy and dried-extract of the solutions. We found at 500
nm, 1T MoS2 = 27.4 L.g-1.cm-1 and 1T WS2 = 35.6 L.g-1.cm-1. For the 2H phase, we have used
previous values from the literature4.
Fct-MoS2 Fct-2H MoS2 Fct-WS2 Fct-2H WS2
Concentration (mg/mL) 0.09 0.04 0.06 0.03
Supplementary Table 2. Concentration of functionalized TMDs solution in IPA.
ATR-FTIR Spectroscopy of acetamide functionalized TMDs:
We performed ATR-FTIR spectroscopy on the acetamide-functionalized TMDs. 2-
iodoacetamide has intense signals at 1610 and 1655 cm-1 attributed to N-H bond and –C=O
respectively. After functionalization, the similar peaks are detected from Fct-TMDs confirming
the presence of the functional group (Supplementary Fig. 8). The presence of the band at 1223
cm-1 attributed to -CH2 wagging from S-CH2 in Fct-MoS2 and Fct-WS2 indicates the formation
of the S-CH2 bond consecutive to the covalent functionalization on the sulfur atoms of MoS2 5,6.
© 2014 Macmillan Publishers Limited. All rights reserved.

NATURE CHEMISTRY | www.nature.com/naturechemistry 17
SUPPLEMENTARY INFORMATIONDOI: 10.1038/NCHEM.2108
17
Supplementary Figure 8. ATR-FTIR spectra of 2-iodoacetamide (blue), iodine-treated WS2
(black), iodine-treated MoS2 (grey) and MoS2 (green) and WS2 (red) functionalized with
acetamide.
Raman Spectroscopy:
Raman spectra were obtained using a Renishaw 1000 system operating at 514 nm (2.41
eV). TMDs have two main Raman modes, the in-plane mode: 12GE and the out-of-plane mode:
A1G. After the chemical intercalation, additional Raman signals appear in the spectra of the
different TMDs, attributed to the 1T structure presumably because of the conversion of 2H phase
to 1T 7. The Raman signals of the 1T MoX2 and WX2 (X= S or Se) are still largely unexplored.
In the case of MoS2, new signals named J1, J2 and J3 have been reported in the early studies of
Li-intercalated MoS2. Recently Calandra has proposed different vibration modes for the J1, J2
600 1200 3000 4000
WS2-iodine
Fct-MoS2
Fct-WS2
2-iodoacetamide
Inte
nsity
(a. u
.)
Wavenumber (cm-1)
MoS2-iodine
600 1200 3000 4000
© 2014 Macmillan Publishers Limited. All rights reserved.

NATURE CHEMISTRY | www.nature.com/naturechemistry 18
SUPPLEMENTARY INFORMATIONDOI: 10.1038/NCHEM.2108
18
and J3 modes as well as for the other peaks at 147 cm-1, 223 cm-1 and 286 cm-1 8. The Raman
signals from the 1T phase are not affected by the iodine treatment indicating that the 1T phase is
preserved. On the other hand, strong bands rise up after the functionalization, which are
attributed to the covalent grafting of molecule on the nanosheets (Supplementary Fig. 9).
Notably, the A1G bands of the different TMDs split into 2 signals after functionalization most
likely due the presence of functional groups bonded to the S or Se atoms, which perturb the out-
of-plane vibrations (Supplementary Fig. 9). The J1 signals of MoS2 slits into 2 bands with a new
peak at 167 cm-1. The J2 and the J3 peaks at ~ 226 cm-1 and 328 cm-1 get significantly stronger
and downshifted to 208 cm-1 and 323 cm-1 respectively. According to the work of Calandra, the
J1, J2 and J3 peaks involve mainly the vibrations from the sulfur atoms. Thus these changes
suggest the perturbation of the 1T vibration modes and in particular the vibration from the sulfur
atoms caused by the anchorage of the functional groups.
Supplementary Figure 9. Raman spectra of functionalized TMDs compared to their iodine-
treated counterparts.
200 400
WS2
Inte
nsity
(a. u
.)
Wavenumber (cm-1)
Fct-WS2
E12G
A1G
200 400
MoSe2
Inte
nsity
(a. u
.)
Wavenumber (cm-1)
Fct-MoSe2
A1GE1
2G
200 300 400
A1GE12G
MoS2
Inte
nsity
(a. u
.)
Wavenumber (cm-1)
Fct-MoS2
J2
J1
J3
(a) (b) (c)
© 2014 Macmillan Publishers Limited. All rights reserved.
NATURE CHEMISTRY | www.nature.com/naturechemistry 19
SUPPLEMENTARY INFORMATIONDOI: 10.1038/NCHEM.2108
19
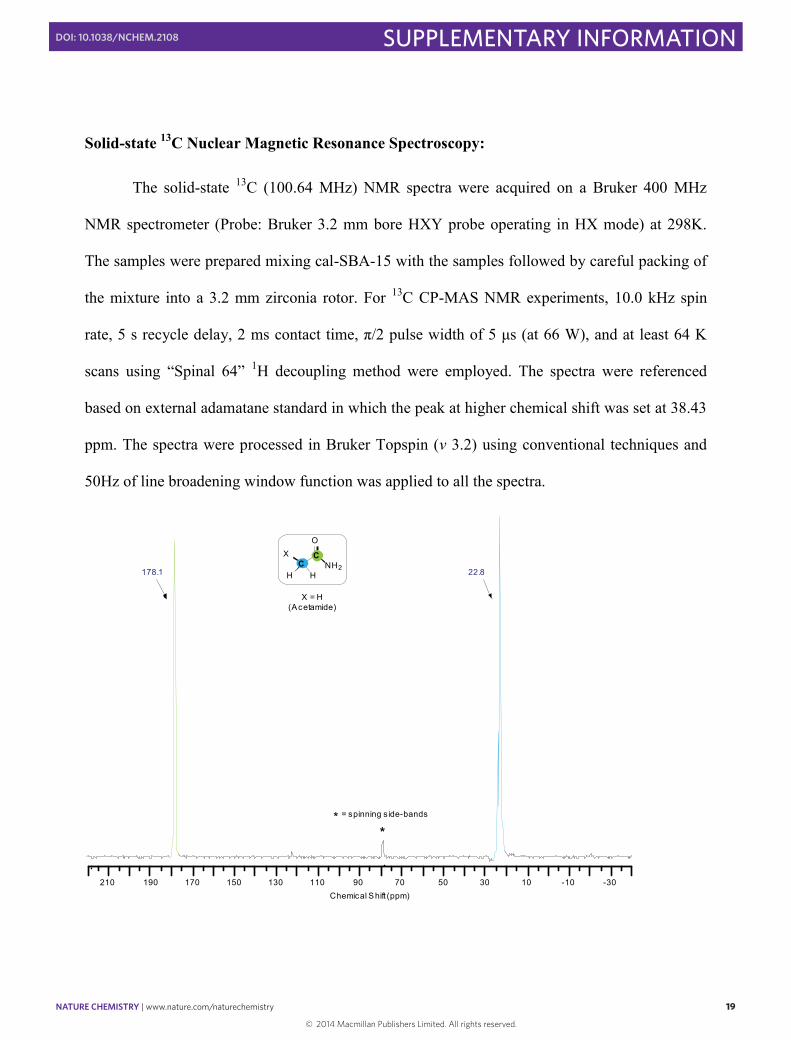
Solid-state 13C Nuclear Magnetic Resonance Spectroscopy:
The solid-state 13C (100.64 MHz) NMR spectra were acquired on a Bruker 400 MHz
NMR spectrometer (Probe: Bruker 3.2 mm bore HXY probe operating in HX mode) at 298K.
The samples were prepared mixing cal-SBA-15 with the samples followed by careful packing of
the mixture into a 3.2 mm zirconia rotor. For 13C CP-MAS NMR experiments, 10.0 kHz spin
rate, 5 s recycle delay, 2 ms contact time, π/2 pulse width of 5 μs (at 66 W), and at least 64 K
scans using “Spinal 64” 1H decoupling method were employed. The spectra were referenced
based on external adamatane standard in which the peak at higher chemical shift was set at 38.43
ppm. The spectra were processed in Bruker Topspin (v 3.2) using conventional techniques and
50Hz of line broadening window function was applied to all the spectra.
210 190 170 150 130 110 90 70 50 30 10 -10 -30
Chemical Shift (ppm)
* = spinning s ide-bands
178.1 22.8
*
XNH2
O
H HC
C
X = H(Acetamide)
© 2014 Macmillan Publishers Limited. All rights reserved.

NATURE CHEMISTRY | www.nature.com/naturechemistry 20
SUPPLEMENTARY INFORMATIONDOI: 10.1038/NCHEM.2108
20
Supplementary Figure 10. 13C CP-MAS spectrum of acetamide. The green peak designates the
carbon signal corresponding to carbonyl group and blue one shows aliphatic carbon signal.
Proton solution nuclear magnetic resonance (1H-NMR) spectroscopy
Proton solution nuclear magnetic resonance spectra (1H-NMR) were recorded using
Varian VNMRS-500 MHz instrument using solvent as an internal standard (DMSO-d6 at 2.50
ppm). For “PRESAT” mode, the water signal at 3.32 was saturated in order to suppress the peak
as best as can be done. The spectra were processed using MNOVA (version 8) using standard
processing parameters and reported in ppm. The sample was prepared by adding freshly opened
DMSO-d6 to the respective sample and sonicating them for 5 mins at room temperature.
Supplementary Fig. 11 shows the extended region of 1H liquid NMR spectra of (a)
iodoacetamide, (b) MoS2-bulk, (c) Fct-MoS2-1T and (d) Fct-MoS2-1T (under water-suppressed
PRESAT mode) using DMSO-d6 as solvent. In case of pure iodoacetamide (Supplementary Fig.
11a), dissolved in DMSO-d6, the 1H signal corresponding to methylene protons showed up at
3.57 ppm. This peak was expectedly absent in case of MoS2-bulk due to absence of such protons
(Supplementary Fig. 11b). In case of Fct-MoS2-1T the peak at 3.51 ppm (both in normal and
PRESAT mode, Supplementary Fig. 11c-d) clearly established the presence of methylene groups
that could only stem from functionalization. The trend in 1H NMR chemical shift values from
iodoacetamide to Fct-MoS2-1T can be explained by 1) smaller electronegativity of the sulfur
than iodine, and 2) the introduction of relatively more negative charge to the methylene protons
upon functionalization, both of which allow better shielding and presumably make methylene
peak to be more upfield than iodoacetamide.
© 2014 Macmillan Publishers Limited. All rights reserved.

NATURE CHEMISTRY | www.nature.com/naturechemistry 21
SUPPLEMENTARY INFORMATIONDOI: 10.1038/NCHEM.2108
21
Supplementary Figure 11. Extended region of 1H liquid NMR spectra of (a) iodoacetamide, (b)
MoS2-bulk, (c) Fct-MoS2-1T and (d) Fct-MoS2-1T (under water-suppressed PRESAT mode)
using DMSO-d6 as solvent.
Importance of iodine as leaving group:
In order to get better understanding of the process, we replaced 2-iodoacetamide with
acetamide in the functionalization reaction. No evidence of functionalization was observed by
XPS spectroscopy as shown in Supplementary Fig. 12. This result confirms the key role of
iodide presumably as leaving group in the mechanism of the reaction.
Chemical Shift (ppm)
3.57
3.51
(under water-suppressed PRESAT mode)
(a)
(c)
(d)
(b)
3.6 3.5 3.4 3.3
© 2014 Macmillan Publishers Limited. All rights reserved.

NATURE CHEMISTRY | www.nature.com/naturechemistry 22
SUPPLEMENTARY INFORMATIONDOI: 10.1038/NCHEM.2108
22
Supplementary Figure 12. XPS high-resolution spectra of N1s region for 1T MoS2 treated with
2-iodoacetamide (red) and acetamide (black).
ATR-FTIR spectroscopy of 300°C-annealed TMDs:
ATR-FTIR spectroscopy was performed on methyl-functionalized TMDs after annealing
at 300°C for 15 min (see methods above). The ATR-FTIR spectra confirm the presence of
methyl groups covalently attached to the surface of MoS2 and WS2 (Supplementary Fig. 13). The
S-CH3 peaks can be clearly identified at 1288 cm-1 and 943 cm-1 in the case of 2H MoS2 and
1289 cm-1 and 950 cm-1 in the case of 2H WS2. These peaks appear to be slightly shifted
compare to their position for functionalized 1T TMDs possibly due to the change of the crystal
structure. The ATR-FTIR spectra of 2H MoS2 and WS2 confirm the presence of covalently
attached functional groups on the 2H TMD nanosheets after annealing.
404 400 396 392
Mo3p
Inte
nsity
(a. u
.)
Binding energy (eV)
N1s
acetamide
2-iodoacetamide
© 2014 Macmillan Publishers Limited. All rights reserved.

NATURE CHEMISTRY | www.nature.com/naturechemistry 23
SUPPLEMENTARY INFORMATIONDOI: 10.1038/NCHEM.2108
23
Supplementary Figure 13: FTIR spectra of methyl-functionalized 1T MoS2 (black), 2H MoS2
(red), 1T WS2 (blue) and 2H WS2 (green).
Restoration of the trigonal prismatic structure (2H phase) upon thermal annealing:
The 2H phase was restored in the TMDs nanosheets by thermal annealing (see Methods
above). We used Raman and XPS spectroscopy to follow both the evolution of the extent of
functionalization upon annealing and the restoration of the trigonal prismatic 2H phase
(Supplementary Fig. 14).
3000 1500 1250 1000 750
2H WS2-CH
3
1T WS2-CH
3
2H MoS2-CH
3
1T MoS2-CH
3
Tran
smitt
ance
(%)
Wavenumber (cm-1)
r(CH3)d(CH3) n(S-C)
© 2014 Macmillan Publishers Limited. All rights reserved.

NATURE CHEMISTRY | www.nature.com/naturechemistry 24
SUPPLEMENTARY INFORMATIONDOI: 10.1038/NCHEM.2108
24
Supplementary Figure 14. Restoration of the 2H phase in the acetamide-functionalized MoS2
nanosheets. (a) Evolution of the Raman spectra of Fct-MoS2 with increasing temperature
compare to the spectrum of chemically exfoliated 2H MoS2. Spectra are normalized to the A1G
404 402 400 398 396 394 392
250oC
200oC
300oC
Inte
nsity
(a. u
.)
Binding energy (eV)
As-Fct.
100 200 300 400 500
2H MoS2
300oC
250oC
200oC
Inte
nsity
(a. u
.)
Wavenumber (cm-1)
As-Fct.
(b)
(a)
0 50 100 150 200 250 3000
10
20
30
40
Fct-MoS2
Fct-WS2Nitr
ogen
per
met
al (%
)
Temperature (oC)
(c)
© 2014 Macmillan Publishers Limited. All rights reserved.

NATURE CHEMISTRY | www.nature.com/naturechemistry 25
SUPPLEMENTARY INFORMATIONDOI: 10.1038/NCHEM.2108
25
peak at ~ 405 cm-1. (b) XPS spectra of the N1s region for Fct-MoS2 as-prepared and annealed at
200 °C, 250 °C and 300 °C. Signals from the Mo3p peaks and its satellite peaks are shown in
blue and red for the 1T and 2H phase respectively. Spectra are normalized to the Mo3p peak. (c)
Evolution of functionalization degree as function of the annealing temperature.
The change in the 2H ratio was tracked by XPS spectroscopy. It appears that the
restoration kinetics is significantly slower for Fct-MoS2 and Fct-WS2 that their bare counterparts
(Supplementary Fig. 15) are in good agreement with the Raman spectra (Supplementary Fig. 16).
Supplementary Figure 15. Evolution of the 2H phase as function of the annealing temperature
for non-functionalized exfoliated and functionalized MoS2 (a) and WS2 (b).
The restoration of the 2H phase of MoS2 is accompanied with a rise of the Raman modes:
12GE and A1G. At 200 °C in the case of as-exfoliated MoS2, the two modes have high intensities
indicating that the trigonal prismatic structure is virtually completely restored. At the opposite,
0 50 200 250 3000
20
40
60
80
100
Fct-MoS2
MoS2
2H p
hase
(%)
Temperature (oC)
0 50 200 250 300
0
25
50
75
Fct-WS2
WS2
2H p
hase
(%)
Temperature (oC)
(a) (b)
© 2014 Macmillan Publishers Limited. All rights reserved.

NATURE CHEMISTRY | www.nature.com/naturechemistry 26
SUPPLEMENTARY INFORMATIONDOI: 10.1038/NCHEM.2108
26
Fct-MoS2 exhibits still strong 1T signatures with the J1, J2 and J2 modes at ~ 160 cm-1, ~ 230 cm-
1 and ~ 330 cm-1 respectively (Supplementary Fig. 16) 7. The evolution of the 1T phase
monitored by XPS and Raman spectroscopy suggests that the 1T phase could be stabilized by the
covalent attachment of the functional groups, which would also agree the slight increase of the
1T concentration in the as-functionalized samples (Supplementary Fig. 5).
Supplementary Figure 16. Raman spectra of as-exfoliated, iodine-treated and Fct-MoS2 after
annealing at 200°C for 15 min. Spectra are normalized to the A1G peak.
Up to 200 °C virtually no change of the functionalization extent can be detected
confirming the TGA results which show that the loss of the grafted group starts at temperatures
higher than 200 °C (Supplementary Figs 14 and 17a). When increasing the annealing
temperature, the density of functional groups decreases and the extent reaches ~30, ~ 15 and ~ 12
at.% at respectively 200 °C, 250 °C, and 300 °C in the case of MoS2 (Supplementary Fig. 14c).
100 200 300 400 500
Inte
nsity
(a. u
.)
Wavenumber (cm-1)
Fct-MoS2
Iodine-treated
As-exfoliated
© 2014 Macmillan Publishers Limited. All rights reserved.

NATURE CHEMISTRY | www.nature.com/naturechemistry 27
SUPPLEMENTARY INFORMATIONDOI: 10.1038/NCHEM.2108
27
Similar trend can be observed in the case of WS2 although the restoration of the 2H is not
complete at 300°C (Supplementary Figs 14, 15 and 17b). Supplementary Fig. 17c shows the
evolution of the C1s region when increasing the annealing temperature. The peak for the amide
groups at ~ 288.4 eV decreases relative to the α-C peak at ~ 285 eV suggesting that the amide
function is more susceptible to decompose during annealing than the α-C directly bonded to
MoS2.
© 2014 Macmillan Publishers Limited. All rights reserved.

NATURE CHEMISTRY | www.nature.com/naturechemistry 28
SUPPLEMENTARY INFORMATIONDOI: 10.1038/NCHEM.2108
28
Supplementary Figure 17. Combined plots of the N1s regions from Fct-MoS2 (a) and Fct-WS2
(b) at increasing temperature up to 300°C. Peaks of the Supplementary Figs 15a and 15b are
normalized to the Mo3p peak and the total amount of tungsten detected by XPS respectively.
406 404 402 400 398 396 394
Inte
nsity
(a. u
.)
Binding energy (eV)
250oC
200oC
300oC
As-Fct.
294 291 288 285 282
Inte
nsity
(a. u
.)
Bindin energy (a. u.)
As-Fct. 200oC 300oC
404 402 400 398 396 394 392
Inte
nsity
(a. u
.)
Binding energy (eV)
As-Exfol. As-Fct.
200oC 250oC 300oC
(a)
(b)
(c)
© 2014 Macmillan Publishers Limited. All rights reserved.

NATURE CHEMISTRY | www.nature.com/naturechemistry 29
SUPPLEMENTARY INFORMATIONDOI: 10.1038/NCHEM.2108
29
Evolution of the C1s regions for annealed Fct-MoS2 (c). The carbon peaks are normalized to the
total percentage of carbon detected in the samples.
Raman spectroscopy of functionalized 2H MoS2:
12GE and A1G are the two main Raman signatures of the trigonal prismatic (2H phase)
structure of MoS2. The strong signals: 12GE at ~ 384 cm-1 and A1G at ~ 405 cm-1 from Fct-2H
MoS2 indicate that the crystallinity of the phase is largely preserved after annealing. Minimal
increase in the FWHM and the absence of significant shift of the 12GE and A1G bands suggests
that disorder induced by the covalent grafting is moderate (Supplementary Table 3). A slight
blue shift of the 12GE peak coupled with an increase of the FWHM of the 2 modes can be noticed
in the case of Fct-2H MoS2 (Supplementary Table 3).
Peak position (cm-1) FWHM (cm-1)
12GE A1G 1
2GE A1G
Fct-2H MoS2 382.5 ± 0.2 405.4 ± 0.5 10.1 ± 0.2 10.4 ± 0.5
2H MoS2 383.6 ± 0.2 405.5 ± 0.5 9.23 ± 0.6 9.4 ± 0.5
Supplementary Table 3. Summary the peak positions and the width of the 12GE and A1G modes
of 2H MoS2 and functionalized 2H MoS2.
© 2014 Macmillan Publishers Limited. All rights reserved.

NATURE CHEMISTRY | www.nature.com/naturechemistry 30
SUPPLEMENTARY INFORMATIONDOI: 10.1038/NCHEM.2108
30
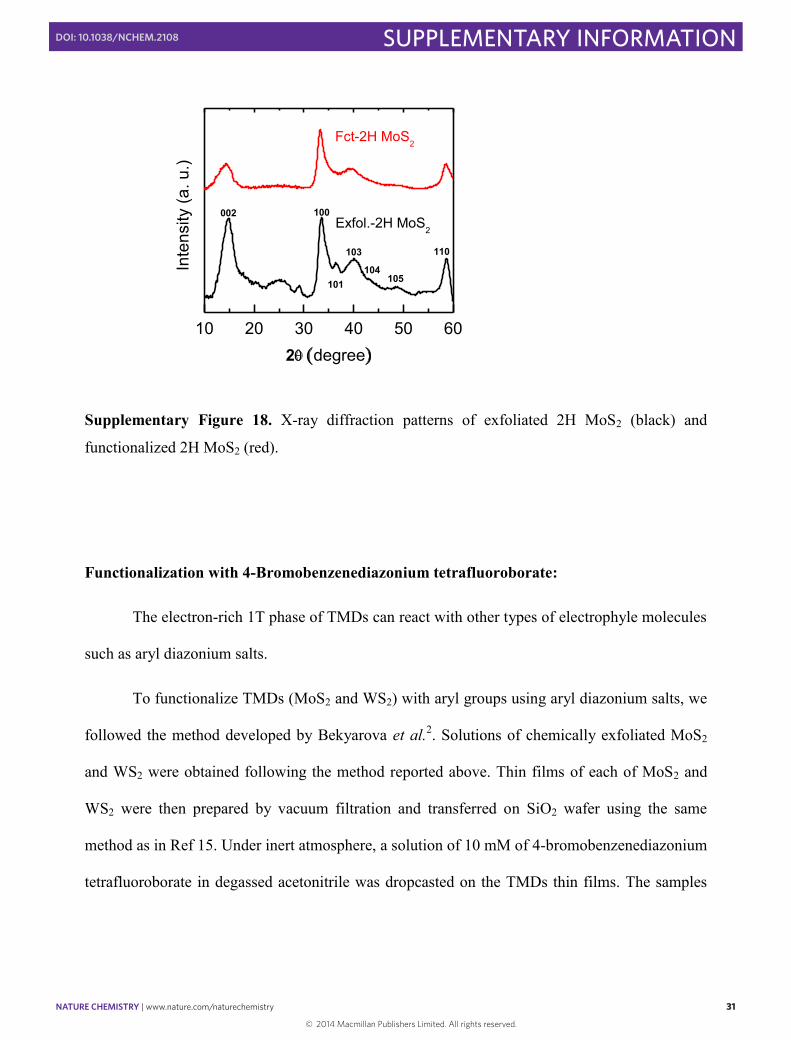
X-ray Diffraction:
The wide-angle x-ray diffraction (XRD) patterns of MoS2 containing samples were
obtained by use of a Bruker HiStar area detector and an Enraf-Nonius FR571 rotating anode x-
ray generator equipped with a graphite monochromator (Cu K; = 1.5418 Å) operating at 40
kV and 63 mA. The beam was monochromatized by use of a Rigaku osmic mirror in parallel
mode. All of the data were collected at room temperature (ca. 21 ºC) over a period of about 5
minutes. The sample to detector distance was (9.00 cm and the standard spatial calibration was
performed at that distance. Scans were 2 degree wide for the sample stage axis () while rotating
the spindle axis at 2 deg min-1 and having fixed detector, or Bragg, angle (2) of 35 deg, and
fixed horizontal tilt angle of 45 deg. In all cases, the count rate for the area detector did not
exceed 100,000 cps. The samples were prepared by coating the tip of a 0.5 mm glass capillary
with paraffin oil and placing grains of the powder on it. The center of the capillary was centered
on the instrument.
The XRD data were analyzed by use of programs Bruker GADDS (data collection and
chi integration and MDI Jade7 (background fitting and IUCR Powder Diffraction File, PDF,
matching). The 2H phase of MoS2 has been indexed following PDF numbered as 77-1716. The
X-ray diffraction peaks from Fct-MoS2 nanosheets annealed at 300 °C match very well to the 2H
MoS2 structure, confirming that the crystallinity of the Fct-2H MoS2 is largely preserved
(Supplementary Fig. 18).
© 2014 Macmillan Publishers Limited. All rights reserved.
NATURE CHEMISTRY | www.nature.com/naturechemistry 31
SUPPLEMENTARY INFORMATIONDOI: 10.1038/NCHEM.2108
31
Supplementary Figure 18. X-ray diffraction patterns of exfoliated 2H MoS2 (black) and
functionalized 2H MoS2 (red).
Functionalization with 4-Bromobenzenediazonium tetrafluoroborate:
The electron-rich 1T phase of TMDs can react with other types of electrophyle molecules
such as aryl diazonium salts.
To functionalize TMDs (MoS2 and WS2) with aryl groups using aryl diazonium salts, we
followed the method developed by Bekyarova et al.2. Solutions of chemically exfoliated MoS2
and WS2 were obtained following the method reported above. Thin films of each of MoS2 and
WS2 were then prepared by vacuum filtration and transferred on SiO2 wafer using the same
method as in Ref 15. Under inert atmosphere, a solution of 10 mM of 4-bromobenzenediazonium
tetrafluoroborate in degassed acetonitrile was dropcasted on the TMDs thin films. The samples
10 20 30 40 50 60
Fct-2H MoS2
Exfol.-2H MoS2
110
105104
103
101
100
Inte
nsity
(a. u
.)
2degree
002
© 2014 Macmillan Publishers Limited. All rights reserved.

NATURE CHEMISTRY | www.nature.com/naturechemistry 32
SUPPLEMENTARY INFORMATIONDOI: 10.1038/NCHEM.2108
32
were protected from light and left 24 hours to react. Finally the films were washed with
acetonotrile (2 x 10 mL), isoproanol (2 x 10 mL), ethanol (2 x 10 mL) and water (2 x 10 mL).
The functionalized MoS2 and WS2 films have been characterized by XPS (Supplementary
Fig. 19). Bromine was found in both cases whereas no fluorine from the tetrafluorobarate was
detected confirming the successful attachment of the bromophenyl functions. No changes in the
Mo3d or W4f regions were visible indicating that they are not affected by the reaction similarly
to the results obtained with 2-iodoacetamide. At the opposite the S2p spectra are found
significantly changed compare to the iodine-treated samples (Fig. 2) suggesting the covalent
attachment of the aryl functions. The ratios Br/Mo and Br/W reach 0.9 and 0.75 respectively.
Such high ratio can be attributed to the formation of aryl oligomers as observed previously in the
case of graphene9. Traces of nitrogen also suggest that the attachment could be achieved without
the release of nitrogen molecules10,11.
165 162 74 72 70 68
Br3d
Inte
nsity
(a. u
.)
Binding energy (eV)
1T 2H C-S
Br3d
© 2014 Macmillan Publishers Limited. All rights reserved.

NATURE CHEMISTRY | www.nature.com/naturechemistry 33
SUPPLEMENTARY INFORMATIONDOI: 10.1038/NCHEM.2108
33
Supplementary Figure 19. X-ray photoelectron spectra of the S2p (160-167 eV) and Br3d (68-
75 eV) regions of as-exfoliated MoS2 (bottom) and WS2 (top) functionalized with 4-
bromophenyl.
Structures of the functionalized 1T TMDs:
We have performed first-principles calculations using the SIESTA density-functional
theory software package 12. For this study we have utilized the Perdew-Burke-Ernzerhof (PBE)
exchange correlation functional along with Norm conserving Troullier-Martin pseudopotentials
and split-valence double-zeta basis sets with polarization functions and a plane wave cutoff of
300 Ry 13,14. A uniform k-grid consisting of 225 points (a 15 x 15 x 1 Monkhorst-Pack grid) for
Brillouin zone integration was sufficient to converge the total energy to less than 1 meV. We
have used 90 Å of vacuum spacing in order to eliminate all spurious interactions between
repeating images of the system. All pseudopotentials were tested and resulted in calculated
parameters which were in good agreement with previously reported results. All structures were
allowed to relax until forces were less than 0.04 eV/Å. Electronic convergence was accelerated
by Pulay mixing of the density matrix without loss of accuracy in calculated energies.
The structure of the functionalized 1T TMDs have been calculated with a 2x2x1 supercell
considering methyl (-CH3) as functional groups and a degree of functionalization of 25%
(C/Metal = 25%). The results of the DFT calculations show that the structure of functionalized
1T TMDs corresponds to a structure analogue to the distorted 1T phase with a zig-zag pattern
formed by the metal atoms (Supplementary Fig. 20).
© 2014 Macmillan Publishers Limited. All rights reserved.

NATURE CHEMISTRY | www.nature.com/naturechemistry 34
SUPPLEMENTARY INFORMATIONDOI: 10.1038/NCHEM.2108
34
Supplementary Figure 20: Top (a) and side (b) view of the calculated structure of single layer
methyl-functionalized 1T MoS2. The 2x2x1 supercell used for the calculations can be identified
with the black lines.
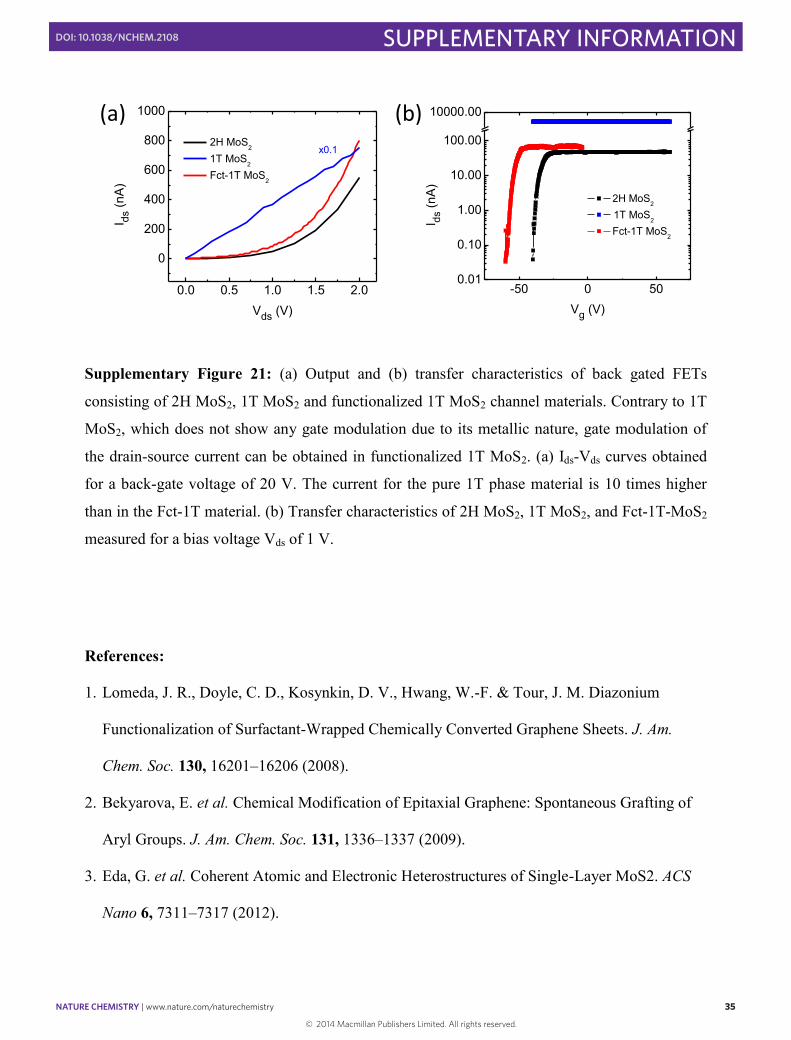
Field Effect Transistors:
The output (left plot) and transfer characteristics (right plot) of the back gated FETs are shown
below in Supplementary Fig. 21. It can be seen that the non-functionalized 1T phase cannot be
gate modulated due to its metallic character. After functionalization, however, gate modulation is
clearly visible. The FET results reveal that the functionalized 1T phase is less conducting than
the pure 1T phase, which is expected since covalent bonding of functional groups decreases the
concentration of free electrons. This localization of electrons due to their participation in
covalent bonds with functional groups is also responsible for the semiconducting properties of
the functionalized 1T phase. These results clearly demonstrate that it is possible to dramatically
alter the optoelectronic properties of TMDs by functionalization.
(a) (b)
© 2014 Macmillan Publishers Limited. All rights reserved.
NATURE CHEMISTRY | www.nature.com/naturechemistry 35
SUPPLEMENTARY INFORMATIONDOI: 10.1038/NCHEM.2108
35
Supplementary Figure 21: (a) Output and (b) transfer characteristics of back gated FETs
consisting of 2H MoS2, 1T MoS2 and functionalized 1T MoS2 channel materials. Contrary to 1T
MoS2, which does not show any gate modulation due to its metallic nature, gate modulation of
the drain-source current can be obtained in functionalized 1T MoS2. (a) Ids-Vds curves obtained
for a back-gate voltage of 20 V. The current for the pure 1T phase material is 10 times higher
than in the Fct-1T material. (b) Transfer characteristics of 2H MoS2, 1T MoS2, and Fct-1T-MoS2
measured for a bias voltage Vds of 1 V.
References:
1. Lomeda, J. R., Doyle, C. D., Kosynkin, D. V., Hwang, W.-F. & Tour, J. M. Diazonium
Functionalization of Surfactant-Wrapped Chemically Converted Graphene Sheets. J. Am.
Chem. Soc. 130, 16201–16206 (2008).
2. Bekyarova, E. et al. Chemical Modification of Epitaxial Graphene: Spontaneous Grafting of
Aryl Groups. J. Am. Chem. Soc. 131, 1336–1337 (2009).
3. Eda, G. et al. Coherent Atomic and Electronic Heterostructures of Single-Layer MoS2. ACS
Nano 6, 7311–7317 (2012).
0.0 0.5 1.0 1.5 2.0
0
200
400
600
800
1000I ds
(nA
)
Vds (V)
2H MoS2
1T MoS2
Fct-1T MoS2
x0.1
-50 0 500.01
0.10
1.00
10.00
100.00
10000.00
2H MoS2
1T MoS2
Fct-1T MoS2
I ds (n
A)
Vg (V)
(a) (b)
© 2014 Macmillan Publishers Limited. All rights reserved.

NATURE CHEMISTRY | www.nature.com/naturechemistry 36
SUPPLEMENTARY INFORMATIONDOI: 10.1038/NCHEM.2108
36
4. Coleman, J. N. et al. Two-Dimensional Nanosheets Produced by Liquid Exfoliation of
Layered Materials. Science 331, 568–571 (2011).
5. Socrates, G. Infrared and Raman Characteristic Group Frequencies: Tables and Charts.
(John Wiley & Sons, 2001).
6. Vorontsov, A. V., Lion, C., Savinov, E. N. & Smirniotis, P. G. Pathways of photocatalytic gas
phase destruction of HD simulant 2-chloroethyl ethyl sulfide. J. Catal. 220, 414–423 (2003).
7. Jiménez Sandoval, S., Yang, D., Frindt, R. & Irwin, J. Raman study and lattice dynamics of
single molecular layers of MoS2. Phys. Rev. B 44, 3955–3962 (1991).
8. Calandra, M. Chemically exfoliated single-layer MoS2: Stability, lattice dynamics, and
catalytic adsorption from first principles. Phys. Rev. B 88, 245428 (2013).
9. Hossain, M. Z., Walsh, M. A. & Hersam, M. C. Scanning Tunneling Microscopy,
Spectroscopy, and Nanolithography of Epitaxial Graphene Chemically Modified with Aryl
Moieties. J. Am. Chem. Soc. 132, 15399–15403 (2010).
10. Laforgue, A., Addou, T. & Bélanger, D. Characterization of the Deposition of Organic
Molecules at the Surface of Gold by the Electrochemical Reduction of Aryldiazonium
Cations. Langmuir 21, 6855–6865 (2005).
11. Agnès, C. et al. XPS study of ruthenium tris-bipyridine electrografted from diazonium
salt derivative on microcrystalline boron doped diamond. Phys. Chem. Chem. Phys. 11,
11647–11654 (2009).
12. Soler, J. M. et al. The SIESTA method for ab initio order-N materials simulation. J. Phys.
Condens. Matter 14, 2745 (2002).
13. Perdew, Burke & Ernzerhof. Generalized Gradient Approximation Made Simple. Phys.
Rev. Lett. 77, 3865–3868 (1996).
© 2014 Macmillan Publishers Limited. All rights reserved.

NATURE CHEMISTRY | www.nature.com/naturechemistry 37
SUPPLEMENTARY INFORMATIONDOI: 10.1038/NCHEM.2108
37
14. Troullier, N. & Martins, J. L. Efficient pseudopotentials for plane-wave calculations.
Phys. Rev. B 43, 1993–2006 (1991).
© 2014 Macmillan Publishers Limited. All rights reserved.